With regard to their operation, there are a number of differences between the prototype WIBS-4 and commercially available WIBS-4A. The prototype WIBS-4 draws in ambient air at a rate of 2.4 L min
−1. Approximately 2.2 L min
−1 of the initial aerosol flow is filtered and reintroduced as a sheath flow to confine the remaining 0.2 L min
−1 sample [
108]. With the commercially available WIBS-4A instruments, the analyte particles are pumped into the main optical chamber at a rate of 2.5 L min
−1. Part of this flow, ~0.3 L min
−1, is then directed as sample flow. The remaining 2.2 L min
−1 of the air flow is filtered before forming a sheath flow to constrain the sample flow as a vertical column, which sequentially aligns the incoming particles [
109]. Both WIBS models use a combination of the sheath flow and a small bleed flow to constantly purge the optical chamber of any extraneous particles. The initial detection of the particle uses a continuous-wave red diode laser at 635 nm that illuminates the particles flowing into the optical chamber. Scattering of the laser light is used for both the sizing of particles (based on Mie theory) and to determine a basic particle “shape” using a so-called asymmetry factor (AF). As with most optical particle counters, the WIBS-4 and WIBS-4A apply a particle size calibration that is based on a theoretical curve, which assumes that the particles are spherical and of a specified refractive index. Both prototype and commercial WIBS use a calibration curve that is calculated using standard monodispersed polystyrene latex (PSL) microsphere aerosols. These spheres have a quoted refractive index of 1.58 ± 0.2 [
109]. As the calibration curve is based on PSL spheres, the size data that is produced should be treated as an estimate, especially when measuring spherical particles of disparate refractive index or non-spherical solid particles. The WIBS-4 prototype contains a size selection utility allowing for the user to select one size fraction of the ambient air sample to perform data analysis on. In practice, this is controlled via a sensitive dual gain function with two switchable settings: High Gain (HG) and Low Gain (LG). Smaller size particles that are in the range between 0.5 and 12 μm are monitored in HG, whereas larger sized (more highly fluorescent) particles in the range between 3 and 31 μm are detected in LG. The commercially available models (WIBS-4A) have a single gain setting, which evaluates particles between 0.5–20 μm. Use of the gain settings affect WIBS particle sizing range, however, it should be noted that this is an instrumental limit rather than a fundamental limit with regard to light scatter sizing. Particle shape is assessed through the azimuthal distribution of the forward scattered light. The forward scattered light falls on a quadrant PMT detector where the scattering pattern of the particle is sampled at four angular offsets. For each of the scatter intensities that are recorded by the quadrants, the root-mean-square variation around the mean value outputs produces a numerical value between 0–100 AF units, with 0 being a perfect sphere and 100 denoting long rod-like fibrous particles. The fluorescence characteristics of the individual particles are then interrogated using two xenon flash lamps (Xe
1, Xe
2). They are tuned to excite at the maxima absorption wavelengths of the biofluorophores tryptophan (280 nm) and NAD(P)H (370 nm), by delivering two sequential ultraviolet pulses at 280 nm and 370 nm. Fluorescence emission following these excitation pulses is detected in two detector bands: 310–400 nm (Band I) and 420–650 nm (Band II). Thus, once a particle has been detected by the laser (after ~10 μs), the first xenon light source (280 nm) is triggered which induces fluorescence that is detected in two bands. Following this sequence, the second xenon flash lamp (370 nm) is triggered (after a further 10 μs) resulting in another excitation of the particle. Subsequent measurement in both the first and second detector bands follows, however the wavelength data from the first band (310–400nm) is discarded due to interference from the excitation pulse (370 nm) [
110]. Hence, for individual particles, three fluorescence measurements are recorded: (a) Excitation at 280 nm, emission in Band I (termed FL1); (b) Excitation at 280 nm, emission in Band II (termed FL2); and, (c) Excitation at 370 nm, emission in Band II (termed FL3).
While the flash lamps are tuned to excite at the maxima of the biofluorophores tryptophan and NAD(P)H, it should be emphasized that a host of other PBAP fluorophores, such as cellulose and light harvesting pigments, like the chlorophylls, can also contribute to the luminescence signals (vide supra). Humic-like Substances (HULIS), Secondary Organic Aerosols (SOA), Polycyclic Aromatic Hydrocarbons (PAH), and other important atmospheric chemicals can also fluoresce in the spectral regions relevant to WIBS technology, but often with much smaller quantum yields than the biologicals. However, the possibility remains that they may still contribute to the overall WIBS data-sets and related FAP numbers. Where results are suspected to have large quantities of these potentially interfering non-biological materials present, the data analyst must take extra attention when interpreting the WIBS measurements.
There are also several differences in the instrumental configurations of the early prototype WIBS-3 and the WIBS-4. The WIBS-4 included several upgrades from the WIBS-3, such as improvements to its optical configuration, optical filters, UV delivery, and sample inlet system [
110,
111,
112]. However, the most significant difference was made in the separation of two detection bands. The WIBS-3 has two detection bands that overlap (FL1 = 320–600 nm; FL2/FL3 = 410–600 nm), whereas, within the WIBS-4 and WIBS-4A, this overlap does not occur. This constrains the bands in which a particle fluoresces, allowing for the FL2 channel to more completely differentiate information from the FL1 channel. WIBS data-sets also contain particle numbers, size and “shape” parameters, along with the three individual fluorescence intensity characteristics. Perring et al. [
113] conducted a dual campaign using a WIBS-4 in Florida and California and subsequently developed a new annotation system. They categorized particle fluorescence into one of seven types, depending on the three forms of fluorescence signals detected by the WIBS [
113]. These categories consider each channel individually (FL1, FL2, and FL3), but also includes all possible combinations, as shown in
Table 3. Such cataloguing nomenclature allows for a greater degree of individual particle classification since the particle fluorescence intensities could previously only be placed into one or more of the FL channels, depending on their fluorescence. Thus, the designations used in
Table 3 allow for a more detailed understanding of ambient particles fluorescent characteristics.
The processing of the collected data is arguably the most challenging step in distinguishing between PBAP and interfering non-biological fluorescent compounds. This is in part due to the rather large data sets (>10,000,000 particles with each of the five variables), which can be routinely collected during a campaign. In an effort to simplify the subsequent analyses, the WIBS data is reduced into discrete concentration time-series. In an effort to extract useful data from these large sets, Robinson et al., 2013 have used hierarchical agglomerative cluster analysis [
114]. The technique was first applied to the measurement of various fluorescent and non-fluorescent polystyrene latex spheres (PSL). Excellent separation was achieved, with the cluster analysis successfully classifying the majority of the particles correctly [
114]. The methodology was then applied to two separate simultaneous ambient WIBS data sets that were recorded in a forest site in Colorado, USA [
114]. The authors suggested the following criteria as essential for WIBS single-particle data analysis: (i) Simplification procedures should not include any assumptions about the types of particles present in the dataset, since this would prevent the identification of PBAP, which have not been previously characterised using similar measurements; and, (ii) As several types of PBAP can be present in a wide range of concentrations, assumptions regarding relative group sizes should not be required. When the analysis method is applied and differences between the WIBS-3 and WIBS-4 are taken into consideration, the average measurement values of the clusters were qualitatively similar. Ambient cluster results were related to aerosol types by comparison of the cluster measurements averages and time-series to the available literature. By applying the cluster analysis to the collected ambient data sets, bacterial agglomerations, fungal smut spores, and other fungal spores were suggested as separate cluster identities. The approach was tested and verified on a controlled data set of PSL measurements, and were successfully applied to a subset of WIBS measurements, with the remaining measurements being accredited to the previously resolved clusters [
114].
2.2.1. Laboratory Studies
Many laboratory experiments have been performed to evaluate the counting efficiency of the WIBS. The particle counting efficiency of the WIBS-4 has been measured using polystyrene latex (PSL) microspheres in size ranges between 0.3 and 30 μm [
115]. The experiment compared the results of a WIBS-4 particle count to the results that were obtained using a commercially available reference instrument, the condensation particle counter (CPC, TSI, Model 3010, Minnesota, USA) [
115]. A parameter termed
D50 was used to define the diameter of particles with a number concentration ratio for WIBS-4/CPC experiments that is equal to 50% counting efficiency (i.e., WIBS counted 50% of that seen by the CPC). A
D100 was likewise defined as 100% counting efficiency (i.e., both instruments counted equal amounts at a given size value) [
115]. The lower-end counting efficiency curve was then defined in specific size regimes (
D50 ~0.489 μm and
D100 ~0.690 μm) [
115].
The WIBS-4 sensitivity that was surrounding the analysis and discrimination of biological and non-biological aerosols has also been the subject of many studies (
vide infra). However, in an effort to distinguish between major classes of airborne microbes and pollen, numerous studies have sought to measure the optical fluorescence signals, which would enable this distinction to be made. The sensitivity for PBAP discrimination using the WIBS-4 was investigated by Healy et al., 2012 [
110]. Fifteen samples from two separate taxonomic kingdoms,
Plantae (8) and
Fungi (7), along with two non-fluorescing chemical solids (common salt and chalk), were systematically introduced into the WIBS-4, and more than 2000 individual-particle measurements were then recorded for each sample type [
110]. The ability of the WIBS-4 to discriminate between chemical particles and the pollen and fungal spores was then explored through the classification of FAP signatures. Discrimination between the particles was made on the basis of five measurable characteristics (size, AF, FL1, FL2, and FL3) [
110]. The use of these variables demonstrated that some spore and pollen sample signals could be separated from each other, according to the normalised fluorescence data that was obtained in the FL1/FL3 axis. Most interestingly, grass pollen was shown to be separable from other pollen [
110]. Based on these results, it was suggested that using a combination of three-dimensional (3-D) plots of normalised fluorescence coupled with size measurements, may enable the instrument to be used as an early warning system for the presence of bio-aerosols [
110].
The sensitivity of a WIBS-4 for discriminating chemical and biological aerosols was evaluated using a series of environmental chamber experiments [
116]. The number-concentrations and size distribution of the aerosols in the chamber experiments were measured by an assortment of instruments, including the WIBS-4, an Aerodynamic Particle Sizer, and a CPC. The laboratory tests supported and clarified the accuracy of the previously defined fluorescence thresholds of the WIBS. The results further demonstrated the ability of the WIBS to discriminate between biological and non-biological aerosols, with the study concluding that some non-biological particles (polycyclic aromatic hydrocarbons, mineral dust, and ammonium sulfate) may cause interference for individual WIBS channel signals. However, it was found that using a combination of two fluorescent channels provided adequate discrimination between biological and non-biological aerosols [
116]. For example, the authors found that using a combination of FL1 and FL3 channels, an aerosolised ammonium sulfate-fungal spore mixture could be readily discriminated [
116].
Hernadez et al. [
117] has compiled an aerobiological reference catalogue of more than 50 pure cultures of common bioaerosols (bacteria, fungi, and pollen) using a WIBS-4A [
117]. The catalogue visualizes size, shape, and fluorescent channel emission intensities of the investigated samples, which allows for discrimination between the major classes of airborne microbes and pollen. The main discriminators used were: (i) The utilization of the ABC category nomenclature; (ii) The average fluorescence intensity within each of these categories; and, (iii) The average Equivalent Optical Diameter (EOD) [
117]. Based on the application of the discriminators, common fluorescence patterns for each of the bioaerosol classes were observed. For instance, most aerosolized bacterial cultures that accumulated with EOD < 1.5 μm displayed weak fluorescence intensities predominantly in the fluorescence type A category. However, a breakdown of this general trend was noted for
Bacillus subtilis, which dominated in the AB category. Fungal spores were noted to exhibit a higher EOD range (2–9 μm), but encompassed several fluorescence types: A, AB, BC, and ABC, with most giving rise to type A and AB. Although pollen grain signals overlapped with those of several fungal spores with respect to EOD ranges, the former largely exhibited higher fluorescence intensities because they contain more biofluorophores (due to their larger size). Type C fluorescence was more dominant with fungal spores when compared to pollen grains, which displayed only as BC and ABC types [
117]. Under defined conditions (i.e., relative humidity, temperature and culture conditions), it was suggested that key components of airborne samples could be distinguished by measuring optical diameters and fluorescence intensity [
117].
Using the same ABC categorization system as described above, a chamber-type experiment was performed, which used a WIBS-4A to evaluate the release of fluorescent particles that were associated with human shedding while walking [
118]. The monitoring was carried out in a small office room (39.5 m
3), with the only air-exchange occurring through air filtration [
118]. A mean emission rate of fluorescent particles in the range 1–10 μm was calculated to be 6.8–7.5 million particles/person/hour. This value is equivalent to ~0.3 mg/person/hour. Of the total fluorescent particles, 90% were associated with the categories ABC, AB, and A. Particles in the ABC channel were the highest contributors making up to 40% of the total number (particles > 1 µm) and ~70% of mass emission rates of fluorescent particles [
118]. The fluorescent particles demonstrated a lognormal distribution, with a mean geometric diameter within the 2.5–4 μm range. The ABC category showed a higher lognormal size distribution with a value of 4 μm for the mean diameter. This value was 1.5 μm greater than that observed for the A and AB categories. The AF (shape) parameter of the fluorescent particles also increased with size [
118]. Another component of this study sought to measure the influence of applied moisturiser (jojoba oil) on the frictional interactions between skin and clothing. The oil application resulted in a significant increase in emissions rates, with factors between 2–5× noted. However, the emissions that were related to the moisturiser were due to smaller particle sizes and the mass emissions rate was lower with moisturiser than without. Moisturiser use also increased the emissions of category A particles, which is a possible indication of abiotic interference that is associated with their use [
118].
The instrumental fluorescence detection limit is determined by measuring the fluorescence emission signal when no particles are present in the optical chamber. This is undertaken by putting the WIBS instrument into a setting known as “forced trigger” mode. This mode essentially causes the flash lamps within the WIBS to fire on empty space while the pump is off. Background fluorescent values from the forced trigger mode are then collected for each channel. In general, the average of these values plus 3× standard deviations of the mean fluorescence intensity in each channel (FL1, FL2, and FL3) are then used as the cut-off thresholds. In more recent times, alternate threshold strategies utilizing increased thresholds to aid in the detection, classification, and discrimination of ambient bio-particles from interfering particles have been suggested [
55]. Savage et al. [
55] systematically evaluated fluorescence thresholds for the WIBS-4A using sixty-nine types of aerosol material, which included size-resolved biological particles (i.e., bacteria, fungal spores and pollen), and chemical interferents (i.e., soot, smoke and HULIS) [
55]. A broad separation between the two classification types was observed using size and shape parameters in conjunction with the Perring (2015) [
113] particle classification system. Using these different classification systems, the role that particle size plays in controlling fluorescent properties was assessed. This was carried out with the inclusion of a new threshold calculation whereby the fluorescent threshold was raised from the usual forced trigger (FT) + 3σ to FT + 9σ. This results in weakly fluorescing aerobiologically insignificant particles under the previous threshold being reassigned as non-fluorescent under the new FT + 9σ criteria. The authors concluded that while it does not reduce the fraction of aerosol considered biological, it does significantly reduce fluorescence interference to almost zero for most particle types [
55].
Currently, no standard fluorescent calibration method exists for real-time, single-particle fluorescence instruments. However, Robinson et al., 2013 has proposed a method that uses size-selected particles containing a known mass of fluorophore to calibrate the fluorescence detection of a WIBS-4A [
119]. This approach was attempted using mixed tryptophan-ammonium sulfate particles to calibrate one detector (FL1) and pure quinine particles to calibrate the other (FL2). Based on the resulting fluorescence and mass relationship data, the tryptophan-ammonium sulfate particles displayed a linear relationship. The pure quinine particles gave non-linear signals, suggesting that only a portion of the quinine mass contributes to the observed fluorescence [
119]. Both of the materials produced a repeatable response between observed fluorescence and particle mass. This procedure should provide the data to: establish appropriate detector gains (absolute response); estimate limits of detection; improve the repeatability of instrument set-up; and, enable more meaningful instrument comparisons [
119].
2.2.2. Field Campaigns in Ambient Outdoor and Indoor Environments
All versions of the WIBS instrument (3, 4 and 4A) have been used in field campaigns within vastly contrasting settings. All of the studies focussed on the detection and quantification of PBAP concentrations in relation to the total particle load. Many of the studies used standard reference and/or other additional UV-light induced fluorescence (UV-LIF) techniques to assess the capabilities of the WIBS approach [
21,
98,
116,
120,
121,
122]. Some examples of these campaigns are shown in
Table 4. For example, the particle morphology and fluorescence signals (FL1, FL2, and FL3 channels) of aerosolized materials in the size ranges between 0.8–20 μm have been investigated in two dissimilar environments, an urban city center (Manchester, United Kingdom (UK), December 2009) and a remote, tropical forest (Borneo, Malaysia, June/July 2008) [
21]. The FL1, FL2, and FL3 channels represented 3%, 6%, and 11% of the total aerosol counts over the Manchester campaign, with two dominant size modes being recorded for the fluorescent material, one at 0.8–1.2 μm and a second at 2–4 μm [
21]. A large variation in the fluorescence and total aerosol concentration was evident throughout the day, with non-fluorescent particles peaking between 05:00–10:00 and 17:00–19:00, and the fluorescent particles concentrations peaking strongly at 09:00–10:00. Due to the concentrations of non-fluorescent and fluorescent particles peaking at a similar morning period, it was suggested that the release of SOA particles from traffic activity may have impacted on these results. Given the particle size profile and the fact that SOA can absorb and fluoresce at the same excitation/emission wavelengths that are associated with biological particles, they likely represent possible interferents in this study.
In the Borneo campaign, a clear diurnal pattern was observed under the rainforest canopy, with FAP concentrations being recorded at a minimum of 50–100 L
−1 in late morning. This period was followed by strong temporal fluctuations before reaching 4000 L
−1 in mid-afternoon. Stable concentrations spanning 1000–2500 L
−1 were measured between midnight and sunrise. Above the canopy, FAP ranged from 50–100 L
−1 during the day to 200–400 L
−1 at night. The transient fluctuations that were seen in the under-storey were not observed [
21]. FAP accounted for 55% of the total aerosol that was monitored beneath the canopy, and fell to 28% above it (for particles between 0.8–20 µm). Both sites exhibited a size mode at 2 μm <
Do < 4 μm, which consisted primarily of FAP. These accounted for 75% of the under-storey and 57% and above-canopy coarse particles (
Do ≥ 2.5 μm) [
21]. It was suggested that a potential link between FAP concentrations and relative humidity existed as the highest FAP concentrations were measured at RH ≥ 80%. This behavior appears to be consistent with fungal spore releases [
21].
A WIBS-3 instrument was also used in the determination of FAP in the 0.8–20 μm size range at Puy de Dôme, a high-altitude site in France during the summer of 2010. A mean total aerosol concentration of 270 L
−1, with a modal size of 2 μm, was observed [
120]. The mean fluorescent particle concentration determined in the FL1 channel was 12 L
−1, whilst those that were associated with the FL3 channel were found to be 95 L
−1. The FL1 channel concentrations did not vary much throughout the campaign, but the FL3 concentrations followed a strong diurnal cycle that peaked at night [
21,
120].
WIBS-3 and WIBS-4 instruments were also used to characterize bioaerosol emissions from a Colorado pine forest [
121]. Both sets of WIBS data were analysed using the previously discussed cluster analysis (
vide supra) [
114,
121]. Based on the collected data, all of the fluorescent clusters showed diurnal fluctuations along the forest floor, with minimum concentrations observed at midday (50–100 L
−1) and maximum concentrations at night (200–300 L
−1) [
121]. The cluster behaviours were then compared against those expected for bioaerosols. It was shown that one cluster exhibited the greatest enhancement and highest concentration during sustained wet periods. This behaviour is consistent with that previously reported for fungal spores [
22]. A separate cluster dominated the dry periods, which showed characteristics similar to that of bacterial spores [
121].
Other notable field measurements include a month long campaign, (August–September 2011) performed at Killarney National Park, Ireland. This work compared the use of two real-time fluorescence instruments, the WIBS-4 and a UV-APS. The results were compared with those obtained from a single-stage particle Hirst-type impactor and standard optical microscopic analysis [
98]. Both of the approaches were used to enumerate, categorise, and compare the captured particles/bioaerosols by examining the FAP data in relation to the optical microscopy results. The WIBS and UV-APS showed qualitatively comparable results, with elevated fluorescent bio-particle concentrations at night being noted when maximum RH values and minimum temperatures were measured [
98]. Both real-time instruments sampled through the same inlet throughout the campaign, with the mean coarse particle number-concentrations (
Do > 1 μm) measured at 32,800 L
−1 and 32,400 L
−1 for WIBS-4 and UV-APS respectively. This observation indicated that there was no significant sampling losses between the instruments [
98]. Quantitatively, the two instruments gave results that correlated well with
R2 = 0.90 for the mean total particle concentrations over the campaign [
98]. A correlation was clearly observed (integrated number concentrations) between the total biological fungal spore concentrations from the impaction techniques and the WIBS and UV-APS. The fluorescence values of both the instruments showed periodic high and low concentration fluctuations, with concomitant peaks and troughs being measured using optical microscopy occurring at similar time periods as the WIBS-4 FL2 and FL3 channels. However, it should be noted that the FL1 channels bore little temporal similarity [
98]. The FL1 channel was dominated by particles with
Do < 2 μm and fluorescent particle concentrations ~10
2 L
−1 [
98]. Such an observation is to be expected since optical microscopy counting is not accurate in this smaller size regime. When comparing the spore number concentrations with each WIBS channel showed
R2 values of 0.05, 0.29, and 0.38 for FL1, FL2, and FL3, respectively. Each of the comparisons suggests that the impaction/optical microscopy method undercounts the WIBS by factors of 3–14× [
98]. Finally, it was concluded that the results provided by the three WIBS fluorescence channels provide analytical advantages for bioaerosol classification when compared to the single channel detection approach offered by the UV-APS [
98].
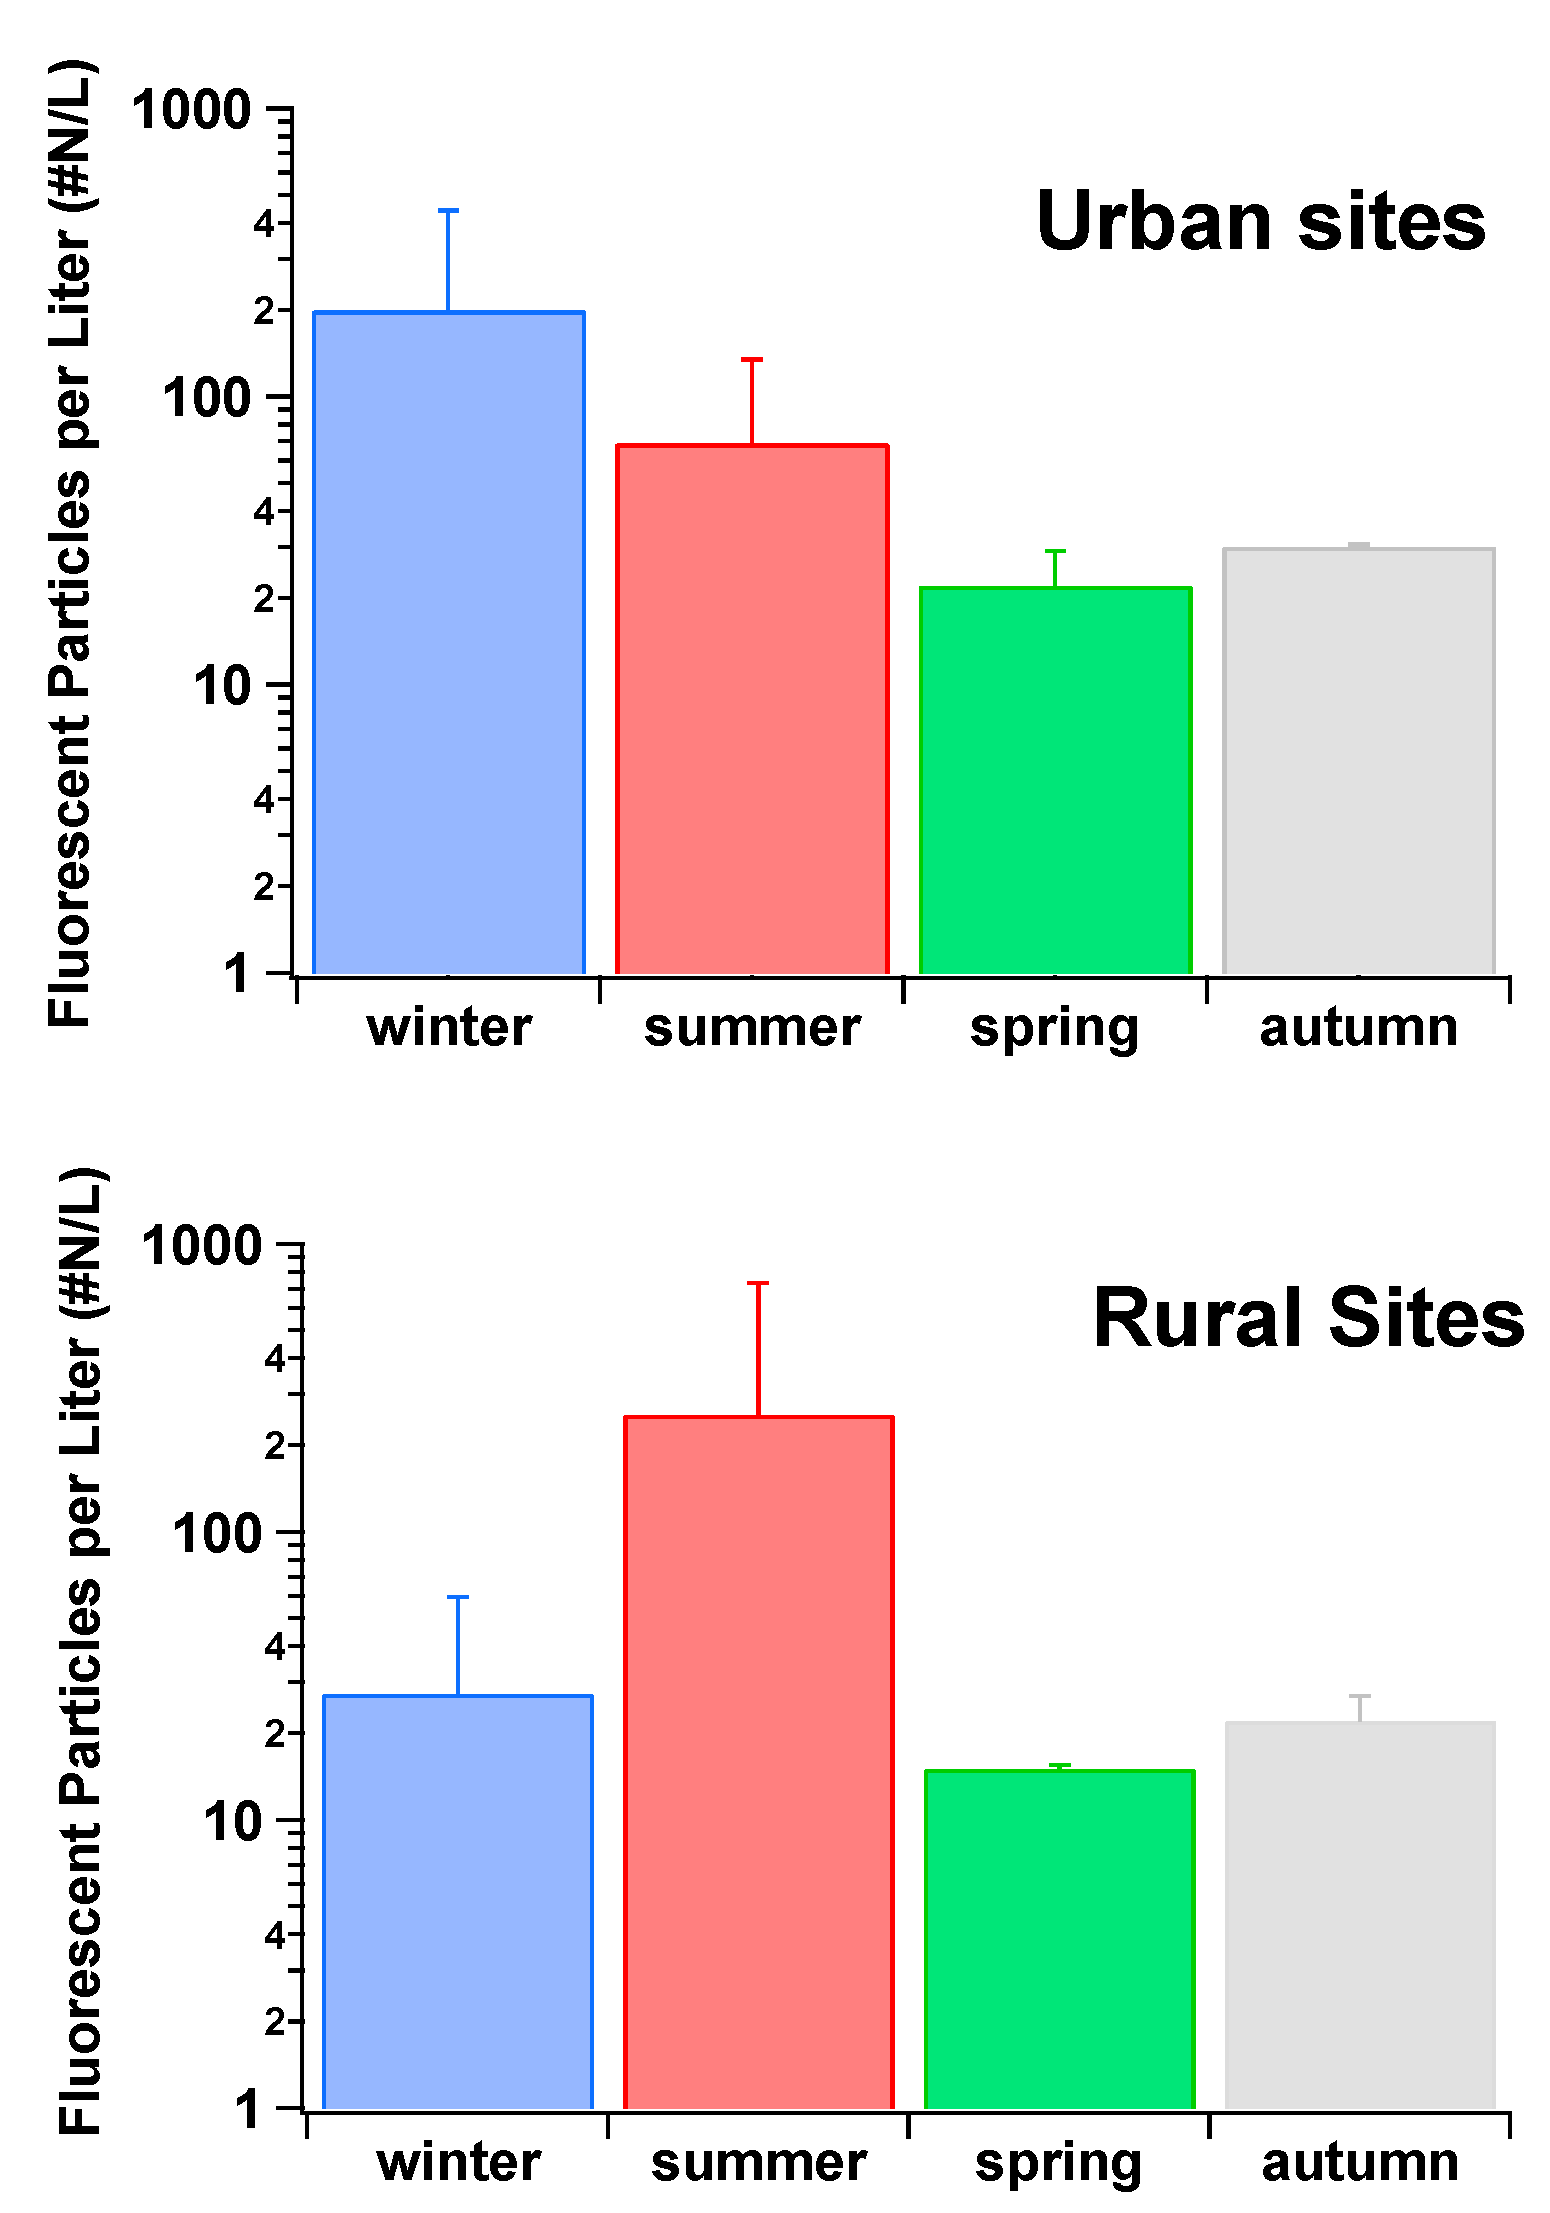
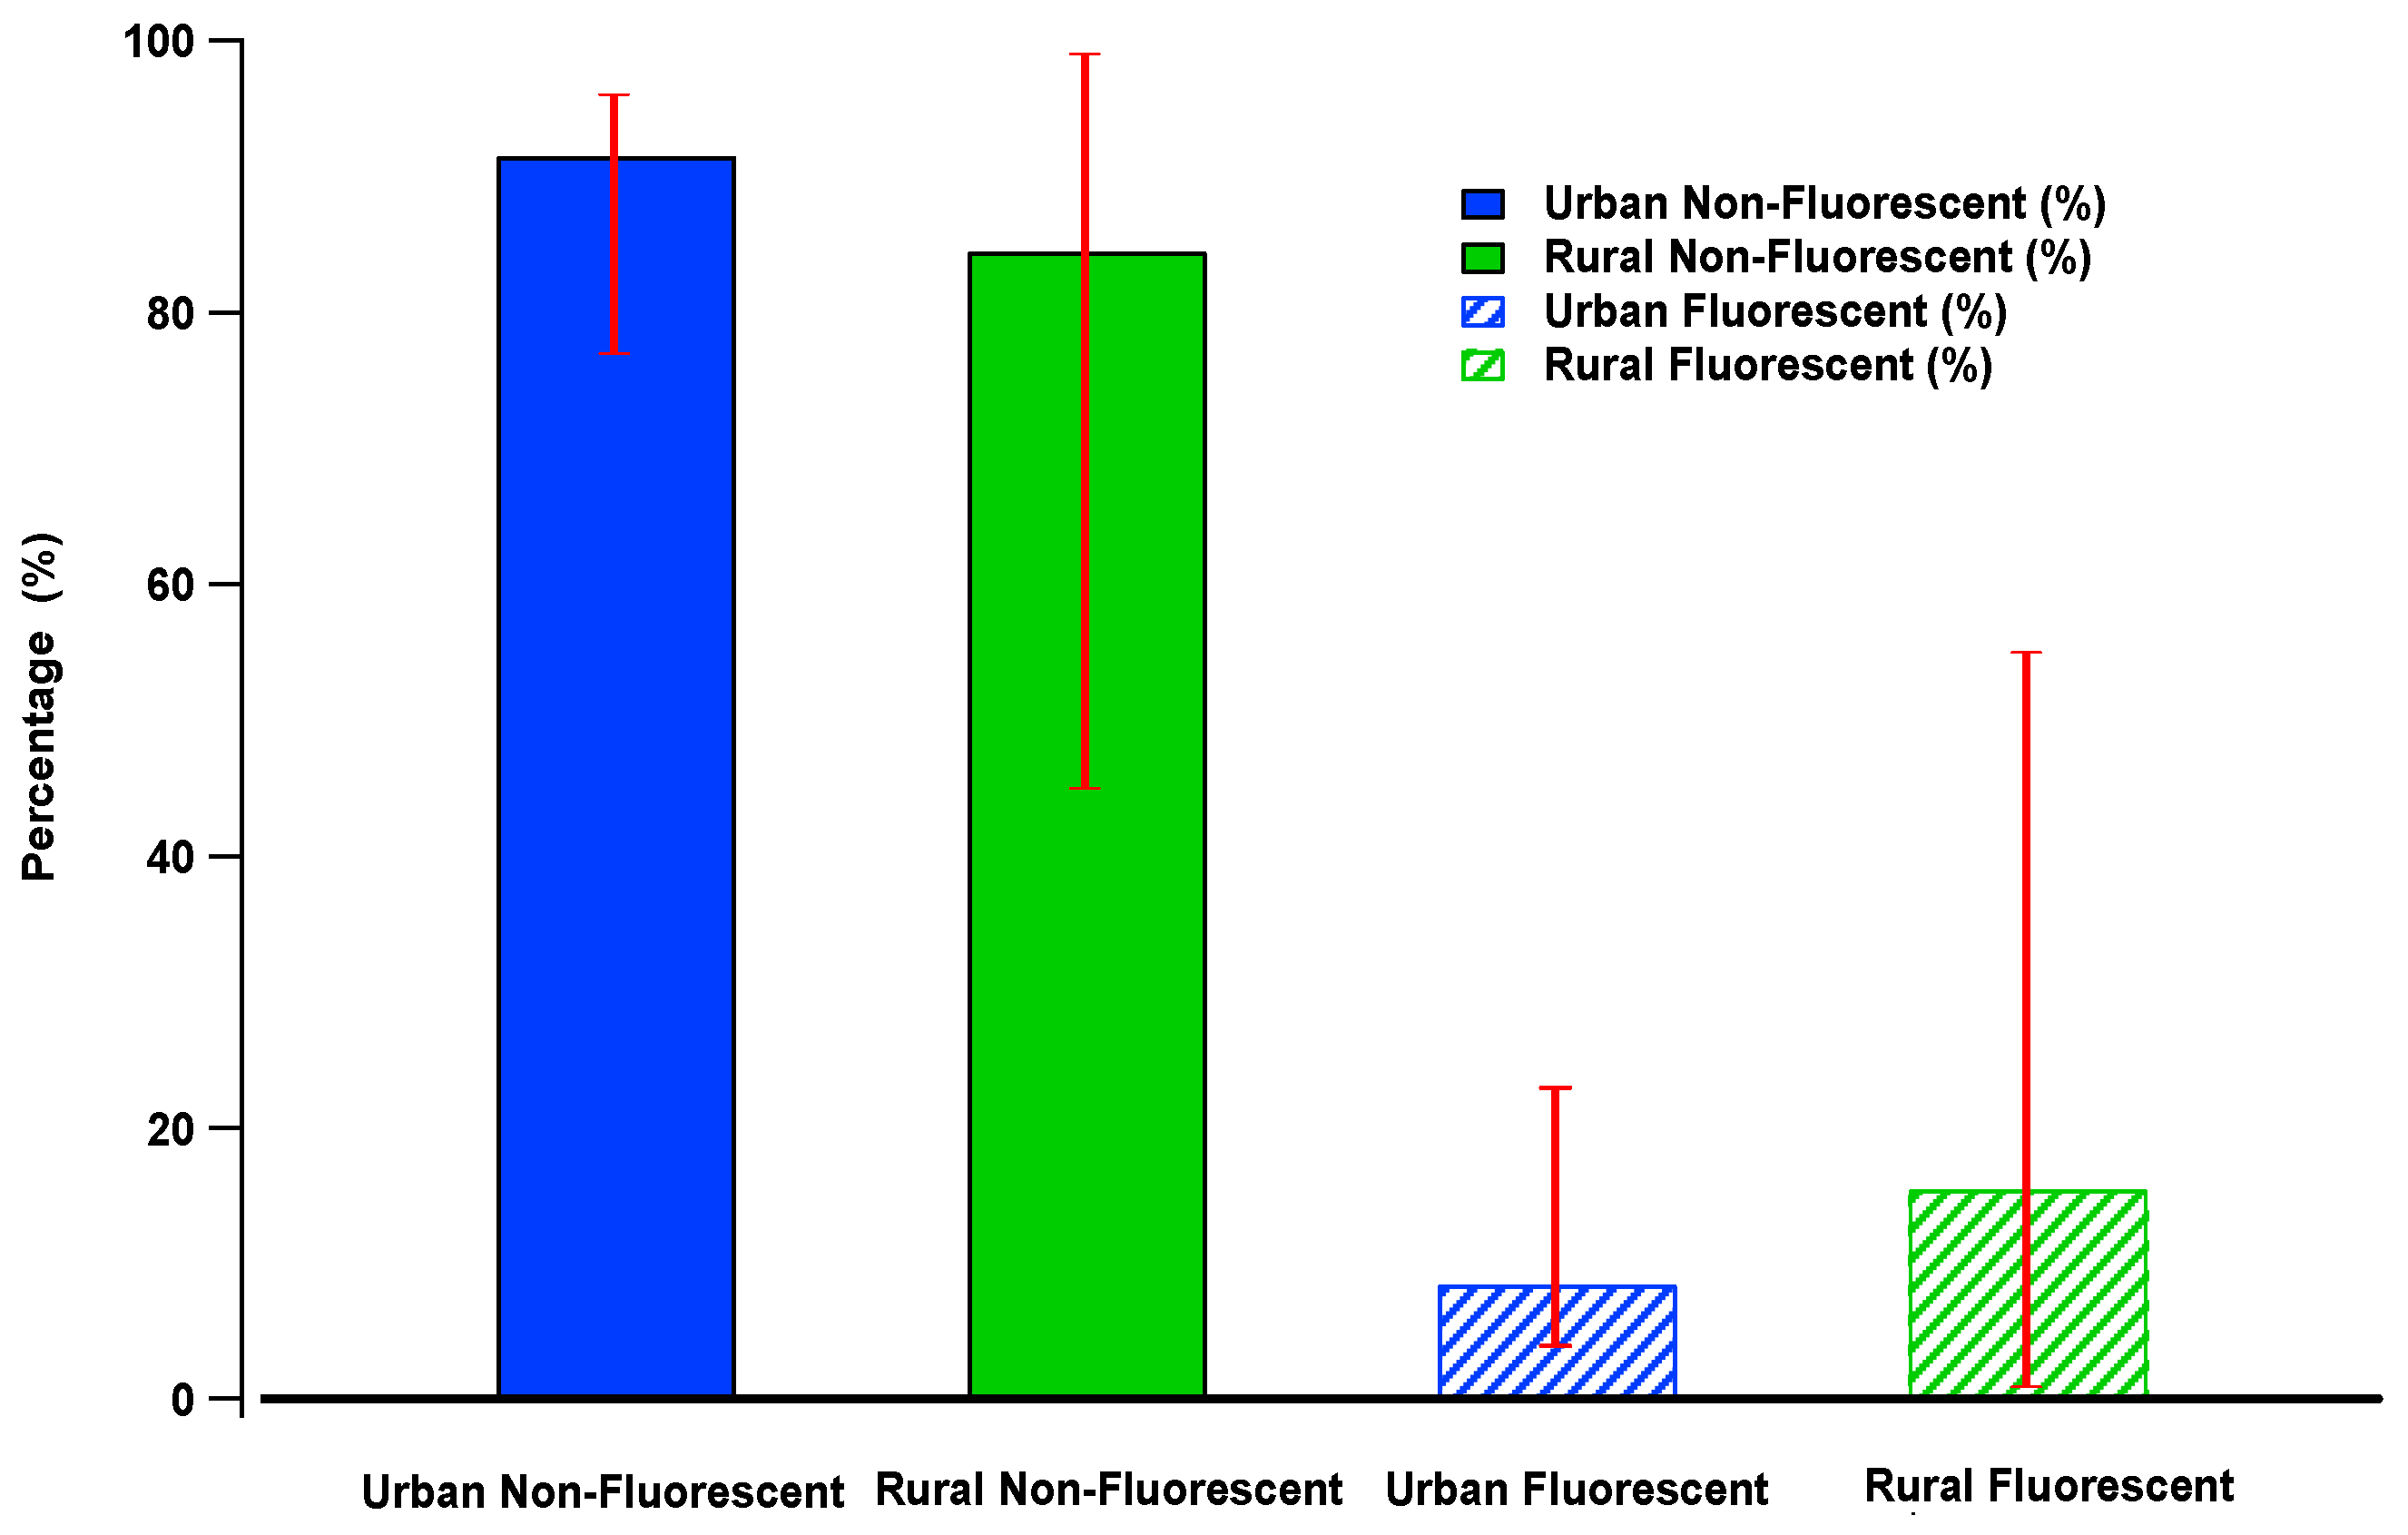
During another semi-rural field campaign located in Karlsruhe, Germany, the WIBS FAP concentration data were shown to exhibit seasonal and diurnal variations. Seasonal maximum mean FAP concentrations of 46 L
−1 were measured in the summer, with a decline in mean FAP concentration of 19 L
−1 towards winter. The mean FAP concentration over the year was 31 L
−1 [
116]. The contribution of FAP to the total aerosol concentrations again varied throughout the year, being highest in summer (10.6%) and lowest in Winter (3.87%), with a yearly mean of 7.34% (for particles between 0.8–16 µm) [
116]. Diurnal FAP concentrations increased after sunset, reaching their highest concentrations during late nights and early mornings. In contrast, total aerosol concentrations were normally highest during the daytime with a decrease noted towards the evening, followed by a sharp decrease after sunset [
116]. No correlation was found between FAP concentrations and temperature, precipitation, wind direction, or wind speed. Nevertheless, clear correlations (
R2 = 0.924 and
R2 = 0.911 for spring and summer respectively) were observed between RH and FAP concentrations. The FAP concentrations increased significantly for RH conditions in the 75–95% RH range. However, lower values for the correlation coefficients were observed during both the autumn (
R2 = 0.541) and winter months (
R2 = 0.652) [
116].
The varying concentrations of FAP, monitored as a function of altitude, have also been investigated. For example, sampling has been carried out near the surface and subsequently compared to measurements made at 1000 m above ground-level, for a wide range of longitudes across the U.S.A between Florida and California. In this study, a WIBS-4A was utilized to make measurements aboard the airship “Gondola” [
113]. FAP counting was recorded for the range between 1–10 μm, revealing particle concentrations, ranging from 2.1–8.7 × 10 particles L
−1. These figures are representative of ~24% of the total particle number [
113]. Diverse size distributions and distinctive fluorescent characteristics were apparent for these regions. For instance, FAP between 1–4 μm in diameter were observed in the Eastern States which is consistent with the presence of mold spores, whilst larger particles between 3–10 μm diameter were sampled in the Western States, where FAP contributions to the total particle concentration were much more variable [
113]. This campaign showed that FAP can contribute significantly to the overall particulates in arid as well as humid environments, and that there are significant sources of bioaerosols in each area, but they may well be of differing types [
113].
The fluorescence characteristics of aerosol particles in the polluted atmospheric area of Nanjing, Yangtze River Delta, China has also been investigated [
122]. Day-to-day and diurnal variations of FAP were observed and the concentrations were found to be dominated by the FL2 channel, with a mean of 3400 particles L
−1, followed by FL3 (2100 L
−1) and FL1 (600 L
−1). These values are much larger than those found in Amazon (93 L
−1), Borneo (150 L
−1), and Hyytiälä (23 L
−1) [
21,
57,
116], indicating that in the China study, the observed concentrations of FAP were ~1–2× greater. The work also suggests a size dependence for the fractions measured as well as a contribution by diverse FAP types. In the FL3 channel, the 1–2 μm range was reportedly dominated by combustion related particles, with the majority of FAP/biological particles apparent in the 2–5 μm range [
122]. A strong correlation (
R2 = 0.75) between FL1 and the M
BC/PM
0.8 (Mass concentration of black carbon/mass concentration of particles in the size range 0.006–0.8 μm) is suggestive of a large contribution from anthropogenic emissions [
122]. The high fluorescence values measured, whn combined with the strong correlation between FL1 and M
BC/PM
0.8, suggest that directly using the three fluorescent channels of the WIBS may not be appropriate for indexing PBAP in significantly polluted areas [
122].
The WIBS-4A was further used in a study that investigated indoor (office) versus outdoor size-resolved concentrations of fluorescent aerosols. The measurements were undertaken over a period of six continuous days (144 h) in an office located in the campus of Tsinghua University, Beijing, China. The office was 5.1 × 2.7 m
2 in area, 2.8 m high and void of any outside influence i.e., the only indoor source of air was from a filtration system [
123]. The WIBS was fitted with an automated control box (KLD2OS 2-way motorised ball valve; Tianjin Kailida Control Technology Development Co., Tianjin, China, allowing for both indoor and outdoor sampling) and a timer device, which permitted the WIBS-4A to switch between indoor and outdoor measurements every 5 min. The results showed that measurements in the FL1 channel for both indoor and outdoor FAP fitted a bimodal lognormal distribution, with the first peak ranging from 1.35–1.5 μm and the second occurring within the range, 2.1 and 2.25 μm. The
R2 values between indoors and outdoors was 0.938 for the smaller size range and 0.935 for the larger range [
123]. A lognormal distribution was also shown to fit the AF dataset, with values for all outdoor and all indoor aerosols peaking at 11–11.5, and a correlation coefficient of
R2 = 0.992 being noted between the outdoor and indoor AF values [
123]. Linear regression of indoor versus outdoor fluorescent bioaerosol concentrations showed that all of the size ranges from 0.5 to 2.5 μm exhibited very similar profiles with concentrations of indoor and outdoor FAP increasing linearly with respect to each other. However, as particle size increased, the slopes become less steep, possibly reflecting a higher loss rate for larger fluorescent bioaerosols as they enter the building envelope [
123]. The time series of the size resolved indoor versus outdoor bioaerosols were also determined using a mass balance equation to model their relationship. Periodic fluctuations throughout all of the size ranges in outdoor non-fluorescent versus fluorescent bioaerosols were also reflected in the indoor concentrations, albeit with a considerable reduction in concentrations, and also with a time lag. Mean concentrations of fluorescent particles made up less than 10% of all the aerosols, leading to similar variations in the non-fluorescent and fluorescent number-concentrations [
123].
2.2.3. Ice Nucleation (IN) and Rain Studies
The WIBS has been used for the analysis of PBAP/FAP that is associated with ice nucleating particles (INP) [
124,
125,
126]. Biologically-derived particles, such as bacteria, have been suggested as plausible sources of INP in certain temperature regimes.
For example, the WIBS-3 has been used to count airborne fungal spores in a semi-arid forest in the southern Rocky Mountains of Colorado. The aim of the study was to measure FAP during wet and dry periods to examine the influence of these spores on mixed-phase clouds, and to investigate the hydrological cycle [
91]. The WIBS-3 data, along with UV-APS data, was compared to culture-based spore samplers and off-line molecular tracers for airborne fungal spores. The estimated spore count from the WIBS was within ~13% of the spore count estimated by the tracer method (1.6 to 2.9 × 10 spores L
−1) [
91]. Similarities between the culture-based sampling and WIBS were also apparent when representative spore counts were measured during the differing ambient conditions. The FAP counts from WIBS showed that they comprised 17–23% of total particle mass during wet conditions, and 2–5% during dry conditions (particle size range 0.8–20 µm). A similar increase of 1.6× between wet and dry conditions was observed using the culture method [
91]. Correlations between the fungal molecular tracers mannitol and arabitol, and the WIBS FAP measurements were calculated to be good for both mannitol (
R2 = 0.8) and arabitol (
R2 = 0.82) during rainy periods [
91].
In order to further demonstrate that rain increases the concentrations of airborne FAP/PBAP, and that these closely correlate with ice nuclei (IN) formation in a North American forest, a combination of techniques, including a WIBS-4, was deployed [
25]. Statistical cluster analysis of the five particle characteristics that were recorded by the WIBS was then used to confirm that smaller FAP peaked during rainfall events. This behaviour was qualitatively different from that observed for the larger particles, which crested during rainfall, thereby suggesting various particle sources or physiological states [
25]. A strong initial enhancement of smaller bio-particles in the range 2–3 μm was observed at the onset of rain events. This period was followed by a less pronounced enhancement during continued rainfall. The behaviour is consistent with the release of bacteria or fungal spores from surrounding vegetation surfaces via mechanical agitation with rain drops [
25]. Larger bio-particles (4–6 μm in size) were shown to contribute to the local environment during the humid post-rain period. Again, this behaviour is consistent with the observed upward flux of fluorescent bio-particle emission after rainfall events (~50–500 m
−2 s
−1). It has been suggested that the enhanced WIBS signals coincide with freshly emitted bio-particles that were growing on wetted earthy surfaces near the measurement site [
25]. A large and closely correlated upsurge in bio-particles and IN was observed throughout the rain events. These rain-enhanced bio-particles and ice nucleating particles (INP) were active in what is considered the warmest regime of mixed-phase clouds (≥−15 °C), which is also a regime that is normally associated with biological particles [
25].
A WIBS-4A has been used to measure fluorescent bioaerosol particles at temperatures that are associated with the formation of mixed-phase and cirrus clouds by deployment on board the National Centre for Atmospheric Research (NCAR) Gulfstream V aircraft. The WIBS data collected was used to develop the lower (particles fluorescent in both A and C channel) and upper bounds (all categories of particles fluorescent in the A or C channel) of FBAP concentration, which was reliant on fluorescent response. A trend was observed, whereby the concentration of FAP in the size range between 0.8 and 12 μm in diameter decreased with altitude. Generally, the FAP concentrations were found to be between 10 and 100 L
−1 in the continental boundary layer, but always decreased significantly to 0–1 L
−1 at temperatures that were lower than 255 K in the free troposphere [
127]. The highest variability of the FAP was observed at temperatures where biological INP could influence mixed-phase cloud formation (255 K ≤ T ≤ 270 K). The 2–5 km altitude range coincides with temperatures where mineral dusts are less active as INP. These observations potentially indicate that INP of a biological origin are critical to mixed-phase cloud formation [
127]. Particle size was also measured and the mode size of the FAP was determined to be ~2–3 μm. This range is consistent with the previous studies discussed above [
25]. The mean percentage of particles in the range 0.8–12 μm that fluoresced in the lower bounds was 3%, and in the upper bounds was 11%, which, again, is consistent with other reports [
128].


