1. Introduction
With an estimated total climate forcing of +1.1 W·m
−2, black carbon (BC) is the second most important human emission in terms of its climate forcing in the present-day atmosphere, second to CO
2 [
1]. BC is produced during the combustion of carbon-based fuels when oxygen is insufficient for complete combustion, which occurs during biomass burning (BB) [
1,
2]. In biomass burning, flaming combustion is characterized by the production of BC, while smoldering combustion is dominated by the production of organic carbon (OC), including brown carbon (BrC). Soot or BC is a term used interchangeably by the Intergovernmental Panel on Climate Change (IPCC) and others [
1,
3,
4]. The uncertainty in the measurements of aerosol optical properties has made it difficult to quantify the global impact of aerosols on Earth's climate, and limits our ability to predict future climate changes [
1,
5].
The scattering and absorption of light by small particles has long been an important research subject across several disciplines, including atmospheric and oceanic science, astrophysics, bioscience, and medical science. The properties of scattering and absorption are determined by particle volume, shape, and refractive index (RI). However, there is a growing need for improved knowledge of scattering and absorption properties of BC and BC-containing aerosols for remote sensing applications and atmospheric radiation budget computations [
5,
6,
7,
8,
9,
10,
11,
12,
13,
14,
15,
16].
Owing to their very complex morphology, modeling the scattering and absorption properties of biomass aerosols is nontrivial, and several approximations have been employed with limited success. Electron microscope images of soot particles show that they are emitted as complex chain structures [
17], which tend to collapse upon humidification and/or as the particles age [
17,
18,
19,
20], thereby changing their optical properties. The extreme complexity of these morphologies can limit our ability to compute the scattering and absorption properties of realistic BC and BC-containing aerosol with requisite accuracy. Yet, the rapid growth of computational power, coupled with the availability of efficient numerically-exact computer solvers of the Maxwell equations [
21,
22,
23,
24], has led to advances in computational techniques. The scattering and absorption of light by fractal aggregates with soot-like refractive indices have been performed using various approximate and numerical techniques [
25,
26,
27,
28,
29]. The T-matrix method has been increasingly applied to the computation of electromagnetic scattering by multi-sphere clusters [
10,
23,
30,
31,
32,
33,
34,
35,
36,
37]. Recently, the Multiple Sphere T-matrix model [
33,
38,
39] has been used to calculate the radiative properties of these aerosols. In this work, we employ T-matrix methods to calculate the scattering and absorption properties of fresh fractal BB aerosol aggregates, and extract their refractive indices.
The collection of BB aerosols on filters or impactor plates allowed us to study the morphology of the BB particles. TEM images of individual carbonaceous BB aerosols show that they exist in the form of clusters of small, nearly spherical monomers (spherules), and the traditional Lorenz–Mie theory [
23] may not be applicable. The statistical scaling law may be more appropriate [
40,
41].
Equation (1) is used to represent the overall morphology of a dry BB aerosol as a fractal cluster [
40,
41]. In Equation (1),
a is the monomer mean radius,
k0 is the fractal pre-factor,
Df is the fractal dimension,
NS is the number of monomers in the cluster, and
Rg, called the radius of gyration, is a measure of the overall cluster radius. The radius of gyration is represented as:
where
Ri is the radius of the
ith primary particle,
i-CM is the separation distance of the
ith monomer from the center of the mass of the particle; and
Rg,i is the radius of the
ith primary particle (
= 0.6
) [
42]. The fractal dimension
Df is important for the quantitative characterization of the aggregate’s morphology. The other important structural coefficient,
k0 is also related to the state of compactness of a fractal particle. For a fixed
Df, the packing density tends to be smaller as
k0 decreases [
43]. Generally, BB aerosols formed in wildfires and emitted as aggregates have a fractal dimension
Df of ~1.8, but the presence of BB superaggregates (SAs) in the outflow from a major wildfire in India had a
Df of ~2.6 [
44].
.The refractive index is an important parameter in describing the radiative impacts of aerosols. The reported refractive indices for black carbon particles are quite diverse, and possibly depend on the fuel type, experimental approach and method of sample preparation/generation. Bond and Bergstrom [
2] recommended the wavelength-independent values of the refractive index in the visible wavelength at 0.55 μm, ranging from 1.75 + i0.63 to 1.95 + i0.79 for strongly-absorbing soot particles. However, these values are based on soot produced by burning kerosene, propane, toluene, a candle flame, and diesel fuel. A wavelength-dependent refractive index [
45] based on Equations (3) and (4) was also found [
45]:
which is valid for wavelengths from 0.4 to 30 microns, and for soot produced from a premixed propane-oxygen flame. It has also been shown that the refractive index of brown carbon has some degree of wavelength dependence, contrary to widely held assumptions of wavelength independence [
46].
One common method of retrieving the refractive index is based on the work by Raziq et al. [
47]. The values of efficiencies Q
abs, Q
scatt, and Q
ext are calculated using the Mie code for values of the real and imaginary parts of the index of refraction, and using experimental values of extinction and scattering cross-sections, a best fit is found by minimizing the error between the calculated and measured values [
48]. However, this assumes the particles are pure spheres, which is not the case for real BB aerosols. Other researchers used a combination of the Rayleigh-Debye Gans (RDG) theory, which treats particles as fractal-like aggregates of small spheres, and Mie theory, to study the optical properties of combustion particles from propane. However, this method produced single scattering albedo (SSA) values that were underestimated by 56% when compared with the experimental results [
46]. The imaginary part of the refractive index also showed a wavelength dependence, which decreased with increasing wavelength. BB aerosols were generally believed to be composed of carbon, with organic species accounting for the largest mass fraction, in most cases. During the Fire Laboratory at Missoula Experiments (FLAME), the real and imaginary refractive indices had ranges of 1.55–1.80 and 0.01–0.50, respectively, which were strongly dependent on the chemical composition and density of the aerosols [
49].
In this work, we applied the T-matrix method to extract the refractive index of BB aerosols from experimentally measured SSA, scattering, and extinction cross-section values obtained using a cavity ring-down spectrometer and a nephelometer. BB aerosols were produced by burning pine and collecting aerosols in two different ways using: (1) an open fire in a burn drum to burn pine, and collect BB aerosols in distilled water using an impinger, which was re-aerosolized after several days, and (2) a tube furnace in the lab to burn pine, after which the resulting BB aerosols were directly introduced into an indoor smog chamber, and BB aerosols were sampled directly from the chamber. In both cases, filter samples were also collected from both types of burning, and electron microscopy images were used to obtain morphology and size information to conduct T-matrix calculations.
2. Experimental Approach
Filter samples were collected and imaged to determine the shape and size of BB aerosols produced by burning white pine. White pine wood was air dried for several months before the burn, and was burned at an outdoor location, as well as inside the laboratory in a tube furnace. During the open fire burn, freshly emitted BB aerosol samples generated in a burn drum were collected using previously described methods [
50]. Briefly, wood was burned in a burn drum with adjustable vents and a lid with a chimney pipe. Smoke exiting through the chimney was sampled with a copper tube with an outer diameter of 0.5in, which served as a heat exchanger. A Teflon tube was connected to the copper tube, and particles were sampled by a cascade impactor, a liquid impinger, and a scanning mobility particle sizer (SMPS). Sampling time was <30 min at a flow rate of 12.5 L/min, and 30 mL of distilled water was used in the impinger. Residence time from combustion to sampling was on the order of tens of seconds. Flaming and smoldering burning stages were differentiated visually. For laboratory samples, BB aerosols were generated by combusting wood samples in a tube furnace. The furnace (Carbolite Gero, HST120300-120SN, Carbolite Gero, Hope, UK) holds a 86-mm OD quartz working tube, and has a heated region of 300 mm. Stainless steel mounts and insulation plugs on either end enable the introduction and sampling of gases. Air was introduced to the furnace at 10 sL/min from a calibrated mass flow controller (MFC, Sierra Instruments, Monterey, CA, USA), and was supplied by house compressed air that passed through a zero air generator (Aadco Instruments, 747-30, Cleves, OH, USA). The furnace was preheated to 500 °C, and blank measurements were taken at each particle size of whatever small concentrations of particles that were generated this way. Wood samples (white pine) were weighed to ~100 mg and placed in a quartz combustion boat (AdValue Technology, FQ-BT-03, Tucson, AZ, USA), which was in turn placed at the center of the furnace. The flaming stage was very short lived, and the smoldering stage was observed in the tube furnace. The smoke and gases produced from combustion were sent directly to the chamber via a heated (200 °C), 1/4 inch stainless steel transfer tube. Afterwards, the gases underwent cooling and dilution in a similar fashion to natural processes, as opposed to stepwise dilution and cooling, which introduces a hysteresis in the condensation of semi-volatile species. There was no chemical analysis done to observe the organics coating on the aerosols, but we believe that for the impinger samples, most of the organics dissolved in the water and left little or no coating when the samples were re-aerosolized. It was shown that most of the BB aerosol material (on average about 50%) seemed to be highly refractory organic material soluble in water [
51]. For aerosols produced in the tube furnace and sampled from the chamber, studies have shown [
52] that the chamber walls become a sink for condensable vapors, such as the organic compounds on the particles. The environmental chamber has a volume of 9.01 m
3 and is lined by FEP Teflon. While not used in this work, its two sides have two banks of ultraviolet lights (Sylvania, F30T8/350BL/ECO, 36’’, Wilmington, MA, USA) with a total of 64 lamps.
Pressure (Omega Instruments Part # PX309-015AI, Norwalk, CT, USA), relative humidity, and temperature (Traceable Products, model4085, Webster, TX, USA) were also monitored. CO and CO2 were measured with a non-dispersive IR spectrometer. Other available chemical measurements, such as O3, NOx, and organic compounds, were not directly used here, and will be discussed in forthcoming work.
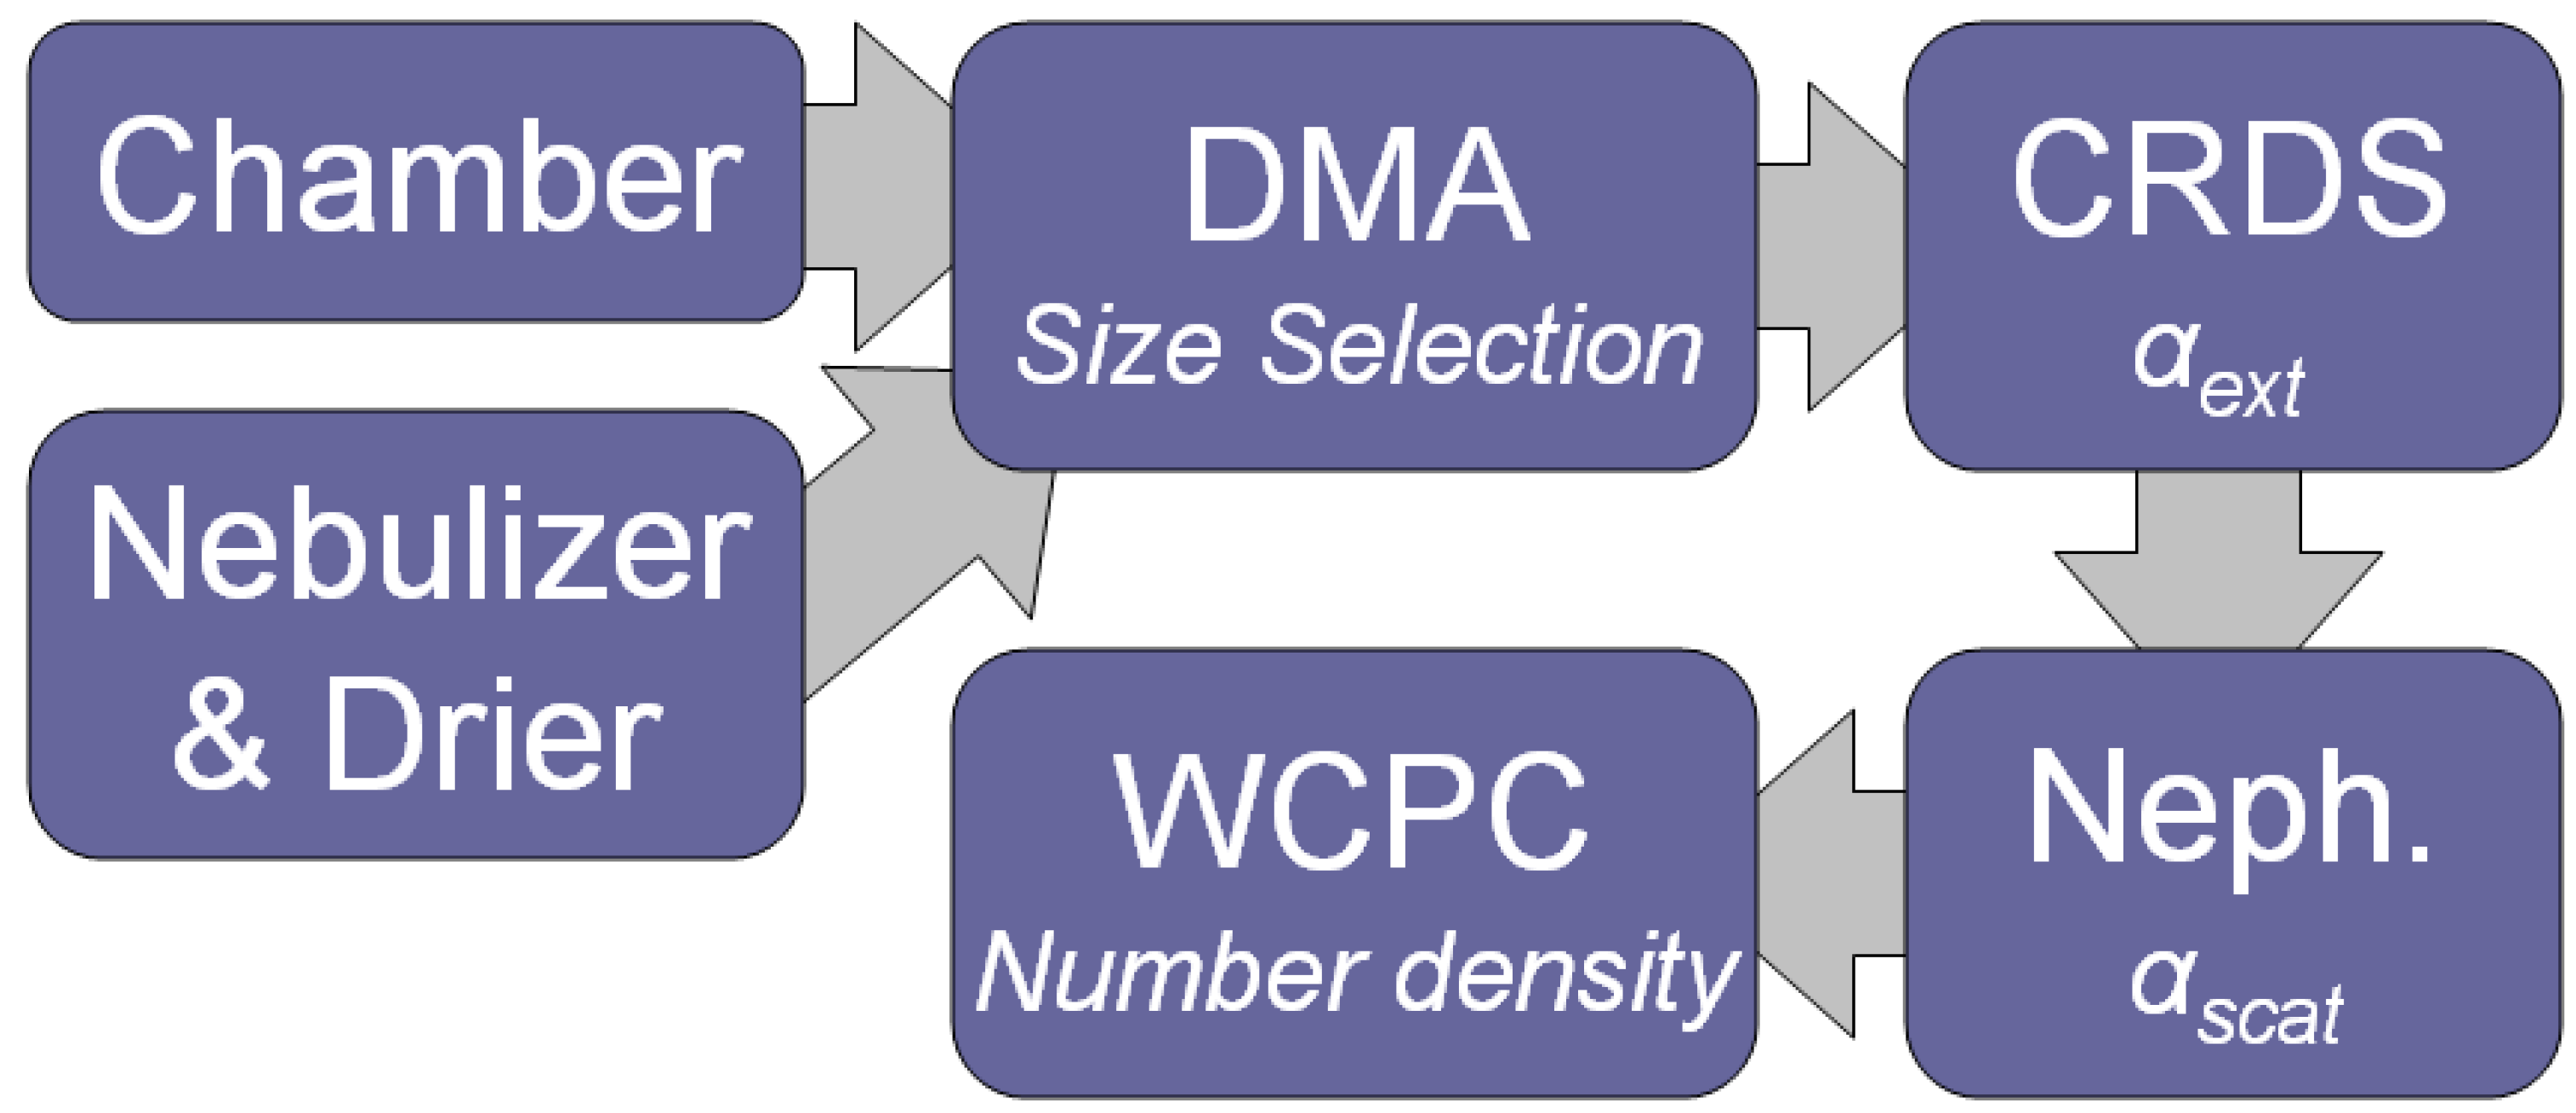
The details of the Cavity Ring Down Spectroscopy (CRDS)/nephelometry system was thoroughly described in our recent paper [
50]. Briefly, for impinger samples, a constant output nebulizer (TSI model 3076, Shoreview, MN, USA) in circulation mode was used in generating aerosols from an aqueous solution of suspended particles. This was followed by a diffusion dryer (TSI model 3062, Shoreview, MN, USA). Flow from either the dryer or the Teflon environmental chamber entered a 710-μm impactor inlet (3.8 μm diameter cut point) neutralizer (TSI model 3081, Shoreview, MN, USA), and a long differential mobility analyzer (DMA) (TSI model 3080, Shoreview, MN, USA) where particles can be size selected. A coupled differential mobility analyzer (DMA) and condensation particle counter (CPC) (TSI model 3788, Shoreview, MN, USA) (i.e., scanning mobility particle sizer (SMPS)) was used to determine the size distributions. Particles with mobility diameters between 200–500 nm were selected at 100 nm intervals with the DMA. We have determined the size distributions, specifically, the standard deviations while sampling from the chamber (sheath flow of 2.8 L/m) and impinger (sheath flow of 3.0 L/m), and showed no overlap. A pump within the CPC produces flow through the entire system (0.58 sL/min), and the DMA sheath flow was 6.0 L/min in single blower mode.
It has been shown that the presence of large, multiply charged particles passed by the DMA can artificially increase measured cross-sections, even if their number density is relatively small. We conducted a very detailed calibration and error analysis of the system used for performing optical properties measurements of soot [
53]. While this effect was recognized in our previous work, the contribution of larger particles was not quantified. For the smallest particles here and elsewhere, the observed fluctuations in absolute and relative extinction cross-sections (σ
ext) were much greater for small particles than for larger particles, and measured σ
ext are consistently and appreciably larger than theoretical predictions. We had recommended that the extinction-minus-scattering method utilizing CRDS and nephelometery be limited to particles with diameters ≥200 nm.
In our most recent work, we showed that SSA can be altered by less than 0.018 due to the effects of multiple charging, and alterations are typically less than this [
50]. This analysis has been performed for 200 nm particles; since there are direct measurements of SSA for 200 nm particles and 400 nm particles (i.e., those whose mobility in the +2 charge state would match the +1 charged, 200-nm particles). This was done by applying an in-software algorithm to the SMPS spectrum to derive the true size distribution. The fraction of 200 nm particles (relative to the sum of 200 nm and 400 nm particles) was found for each run, and averaged. The contribution of each size to the observed SSA (or cross-section) was found by assuming that the contribution of each was additive, and that 400 nm particles exhibited their “true” SSA or cross-section (i.e., they were not influenced by even larger particles). Each term is the product of the relative concentration, the charge probability (+1 for 200 nm particles and +2 for 400 nm particles), and their true SSA. This was rearranged to find the true SSA or cross-section for singly charged 200 nm particles. We have found that particles of this mobility are composed of 99.6% of +1 charged, 200 nm particles, with +2 charged, 400 nm particles making up the balance (+3 charged, 600 nm particles were not considered, since their SSA was unknown). The SSA was unaffected by this consideration, changing by less than ±0.07%.
However, extinction was somewhat more affected, as may be expected by the removal of larger, more highly charged particles. The extinction cross-section dropped by 1.3–2.7% (an average of 1.8%), which is (3.46–5.99) × 10−16 m2/particle. No correction due to multiple charges was made in the data reported here. Larger particles cannot be as thoroughly assessed, since their SSA and extinction cross-sections were not measured, but the effect of multiple charging is expected to be less, given the smaller number concentrations of larger particles.
Size-selected aerosols then entered a ring-down cavity, where the aerosol light extinction was measured over a range of wavelengths between 500–660 nm. The laser light was provided by an optical parametric oscillator (OPO) (Surelite OPO Continuum, San Jose, CA, USA) laser that was pumped by 355 nm of a Surelite I-20 Nd:YAG laser (Continuum, San Jose, CA, USA) running at 20 Hz. Spectra were recorded at 2-nm intervals, with 200 shots averaged at each wavelength. Typically, two to three spectra were recorded for each particle size. The entire system was flushed for 15−20 min when the size selection was changed. Scanning mobility particle spectra were recorded before and after each set of experiments. Two sets of mirrors were used in the previous work for samples collected from the open fire, and a single set was used for samples collected from the indoor furnace. The extinction coefficient αext (m−1) was measured by the CRDS, and the extinction cross-section σext (m2/particle) was found using αext and the number density of particles NCRD (particles/cm3) in the Cavity Ring Down (CRD) cavity. The average CPC number densities were 822 particles /cm3 for 200-nm particles, 201 particles/cm3 for 300-nm particles, and 56 particles/cm3 for 400-nm particles.
After the CRDS, aerosol light scattering coefficients were measured at 453 nm, 554 nm, and 698 nm using the integrating nephelometer (TSI, model 3563, Shoreview, MN, USA), and particle concentration was measured by the CPC. The absorption cross-section was derived from the difference between the scattering and extinction cross-sections. SSA was found by dividing the scattering cross-section by the extinction cross-section. These calculations and the propagation of their errors were discussed in previous work [
53]. Briefly, for extinction, the coefficients were measured several times for a specific size and wavelength. Several factors, including statistical fluctuations in particle counts or number densities measured by the CPC, including the error associated with measuring R
L (distance occupied by the sample relative to mirror-to-mirror distance), and the error associated with the blank cavity ring down time was used to calculate the average cross-section and average errors (one standard deviation). A similar process was used for scattering cross-sections by including the correction factor and associated error. Specifically, a broadband correction factor was used to reconcile scattering and extinction for purely scattering spheres, and the empirical absorption Ångstrom exponent-based correction of Anderson and Ogren was used to account for the truncation error. The SSA and its error were based on scattering and extinction coefficients, the relative standard deviations of these coefficients, and the relative number of densities in the cavity and nephelometer. At two standard deviations, the CRDS/nephelometer system can safely determine SSA values of ≤0.91, with ≤0.96 achievable on average [
53].
Figure 1 shows the schematics of the experimental process.
Particles were sampled with 47-mm Teflon filters (Tisch Environmental, SF18040, 2-μm pore diameter, Cleves, OH, USA). Samples were drawn at 6 L/min for 15 min. Filters were cut to size, mounted on sample holders, then gold coated using standard methods. Images were taken using a scanning electron microscope (SEM) (Auriga, ZESIS, Oberkochen, Germany) at the Joint School of Nanoscience and Nanoengineering (JSNN). The secondary electron secondary ion (SESI) and InLens detectors were used for taking images. Distinct images of polydisperse spheroidal BB aerosols were captured with appropriate magnification and saved in tiff format. For each filter sample, five to ten images were captured.
3. Theoretical Approach
With the continuous improvements and successful applications, the T-matrix method formulated by Watermann in 1965 [
54] has already become one of the most reliable theoretical techniques to treat electromagnetic as well as acoustic and elastodynamic scattering by single and aggregated scattering particles, multiple scattering in discrete random media, and scattering by gratings and periodically rough surfaces [
23]. The derivations and formalism outlined in this paper are based on the work by Mischenko, Travis, and Mackowski [
35].
For a plane, electromagnetic wave incidents in the direction of propagation of unit vector
n, or equivalently, a couple (
ϑ, ), is expressed as:
where
R is the radius vector with its origin at the origin of the coordinates system,
is the free space wave number for free space wavelength
,
ϑinc and
inc are the unit vectors in the
ϑ-direction and
-direction, respectively, and
ninc = (ϑinc ×
inc). In all of the equations for electromagnetic waves, the time dependent factor (exp(-iωt)) was not explicitly expressed. In the far field, the scattered wave becomes:
where
nsca =
R/
R, and is valid for k
R >> 1
The
ϑ and
components of the incident field can be transformed into the respective components of the scattered field using the amplitude scattering matrix
S [
23]:
S is a (2 × 2) amplitude scattering matrix. It linearly transforms the electric vector component of the incident wave into the electric vector component of the scattered wave. As the scattering amplitude matrix is the primary term that defines the scattering law, if it is known for a particle, then other scattering properties of the particle can also be determined [
35].
In the T-matrix approach, the primary step is to express the incident and scattered fields in terms of the vector spherical functions
Mmn and
Nmn [
22]:
where R > r
0, and r
0 is the radius of the circumscribing sphere of the scattering particle. Rg
Mmn and Rg
Nmn are obtained by replacing spherical Hankel functions
with spherical Bessel functions j
n in the equations describing
Mmn and
Nmn (Equations (7) and (8) of reference [
35]). Rg
Mmn and Rg
Nmn are regular at the origin, while the use of the outgoing functions
Mmn and
Nmn ensures that the scattered field satisfies the radiation condition at infinity.
The relation between the scattered field coefficients
pmn and
qmn and the incident field coefficients
amn and
bmn is linear because of the linearity of Maxwell’s equation and the boundary conditions. This is given by the transition matrix
T, as follows:
The above equation is the key for the T-matrix approach. As the expansion coefficients of the incident plane wave are calculated using closed-form analytical expressions [
55], one can calculate the scattered field, provided that components of the T-matrix are known.
One of the most important characteristics of the T-matrix approach is that it depends only on the physical and geometrical features such as refractive index, size, shape, and orientation, and does not show any dependence on the incident and scattered fields. The computed T-matrix can also be used for any non-spherical particle in an arbitrary orientation in the analytical computation of the scattering characteristics of randomly oriented particles [
55]. The extinction and scattering cross-sections averaged over the uniform orientation distribution of a non-spherical particle can be found using the following relations:
The superscript on the left of
T refers to the natural coordinate system of the scatterer, which can be arbitrary for irregularly shaped particles. The values of orientationally averaged extinction and scattering cross-sections are the same for any of the coordinate system used [
35].
Absorption cross-section and SSA, which is often represented as (
), are calculated as:
T-matrix codes based on the above described approach were developed for computing the optical properties of aerosols [
56], and were used in this work for BB aerosols. The codes were downloaded and installed on the CRAY XC30-ac (
athena.ncat.edu) at NCA&T. For the T-matrix scattering code, the CRAY Compiling Environment (CCE) was used for the FORTRAN codes.
The key input parameters for the calculation of monodispersed particles are the size (radius) of the particles, the wavelength of incident light, and the real and imaginary parts of the refractive index. The optical properties obtained from the T-matrix were averaged over the particles’ orientation [
35]. The wavelength used for this study was in the range of 500 nm to 660 nm, in order to compare the calculations with experimentally measured results. Monodispersed particles with diameters of 200 nm, 300 nm, 400 nm, and 500 nm were used in the T-matrix calculations to compare with experimental results. The standard deviation for each size selected was also considered to estimate the error due to polydispersity. There was no overlap in the size distributions. For the calculation of polydispersed particles observed in the filter images, we took into account the effective (area-weighted mean radius) radius [
57] as the input for calculations that used power law distributions. For log-normal distributions, the geometric mean radius was considered, as well as the square of the log of the geometric standard deviation. Images from filter samples were used to get size and shape information for the T-matrix calculations.
4. Results and Discussion
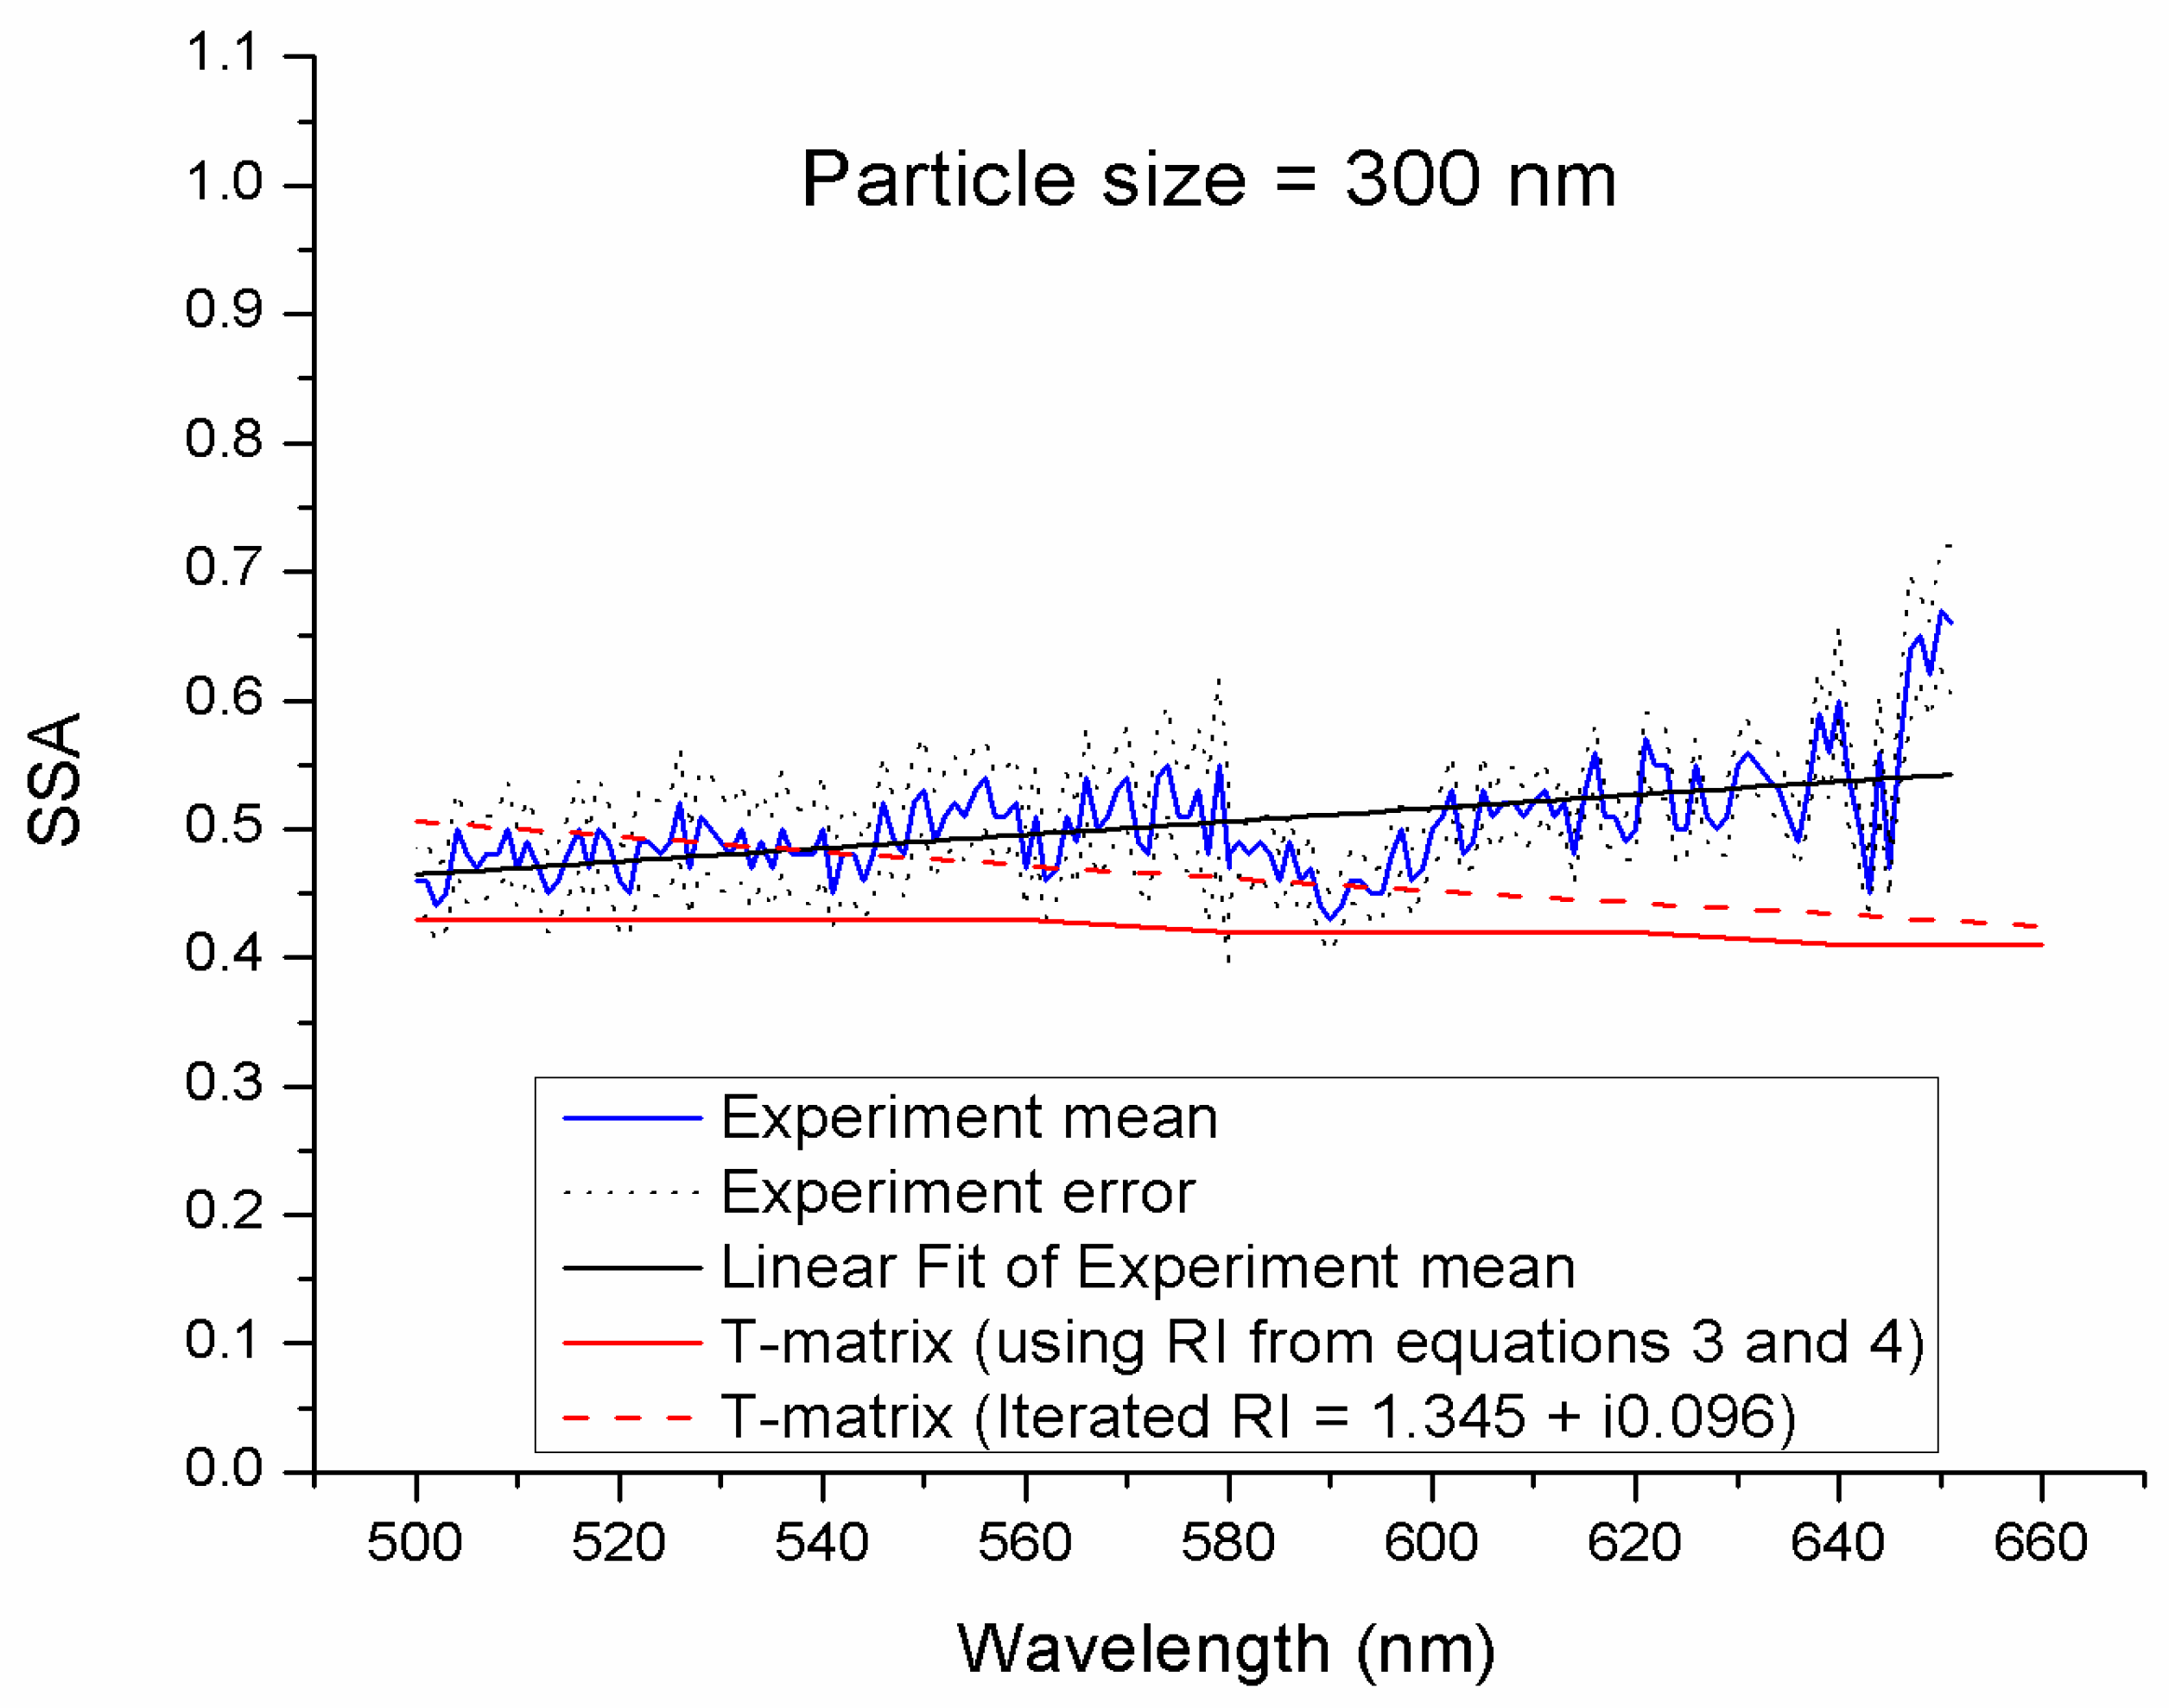
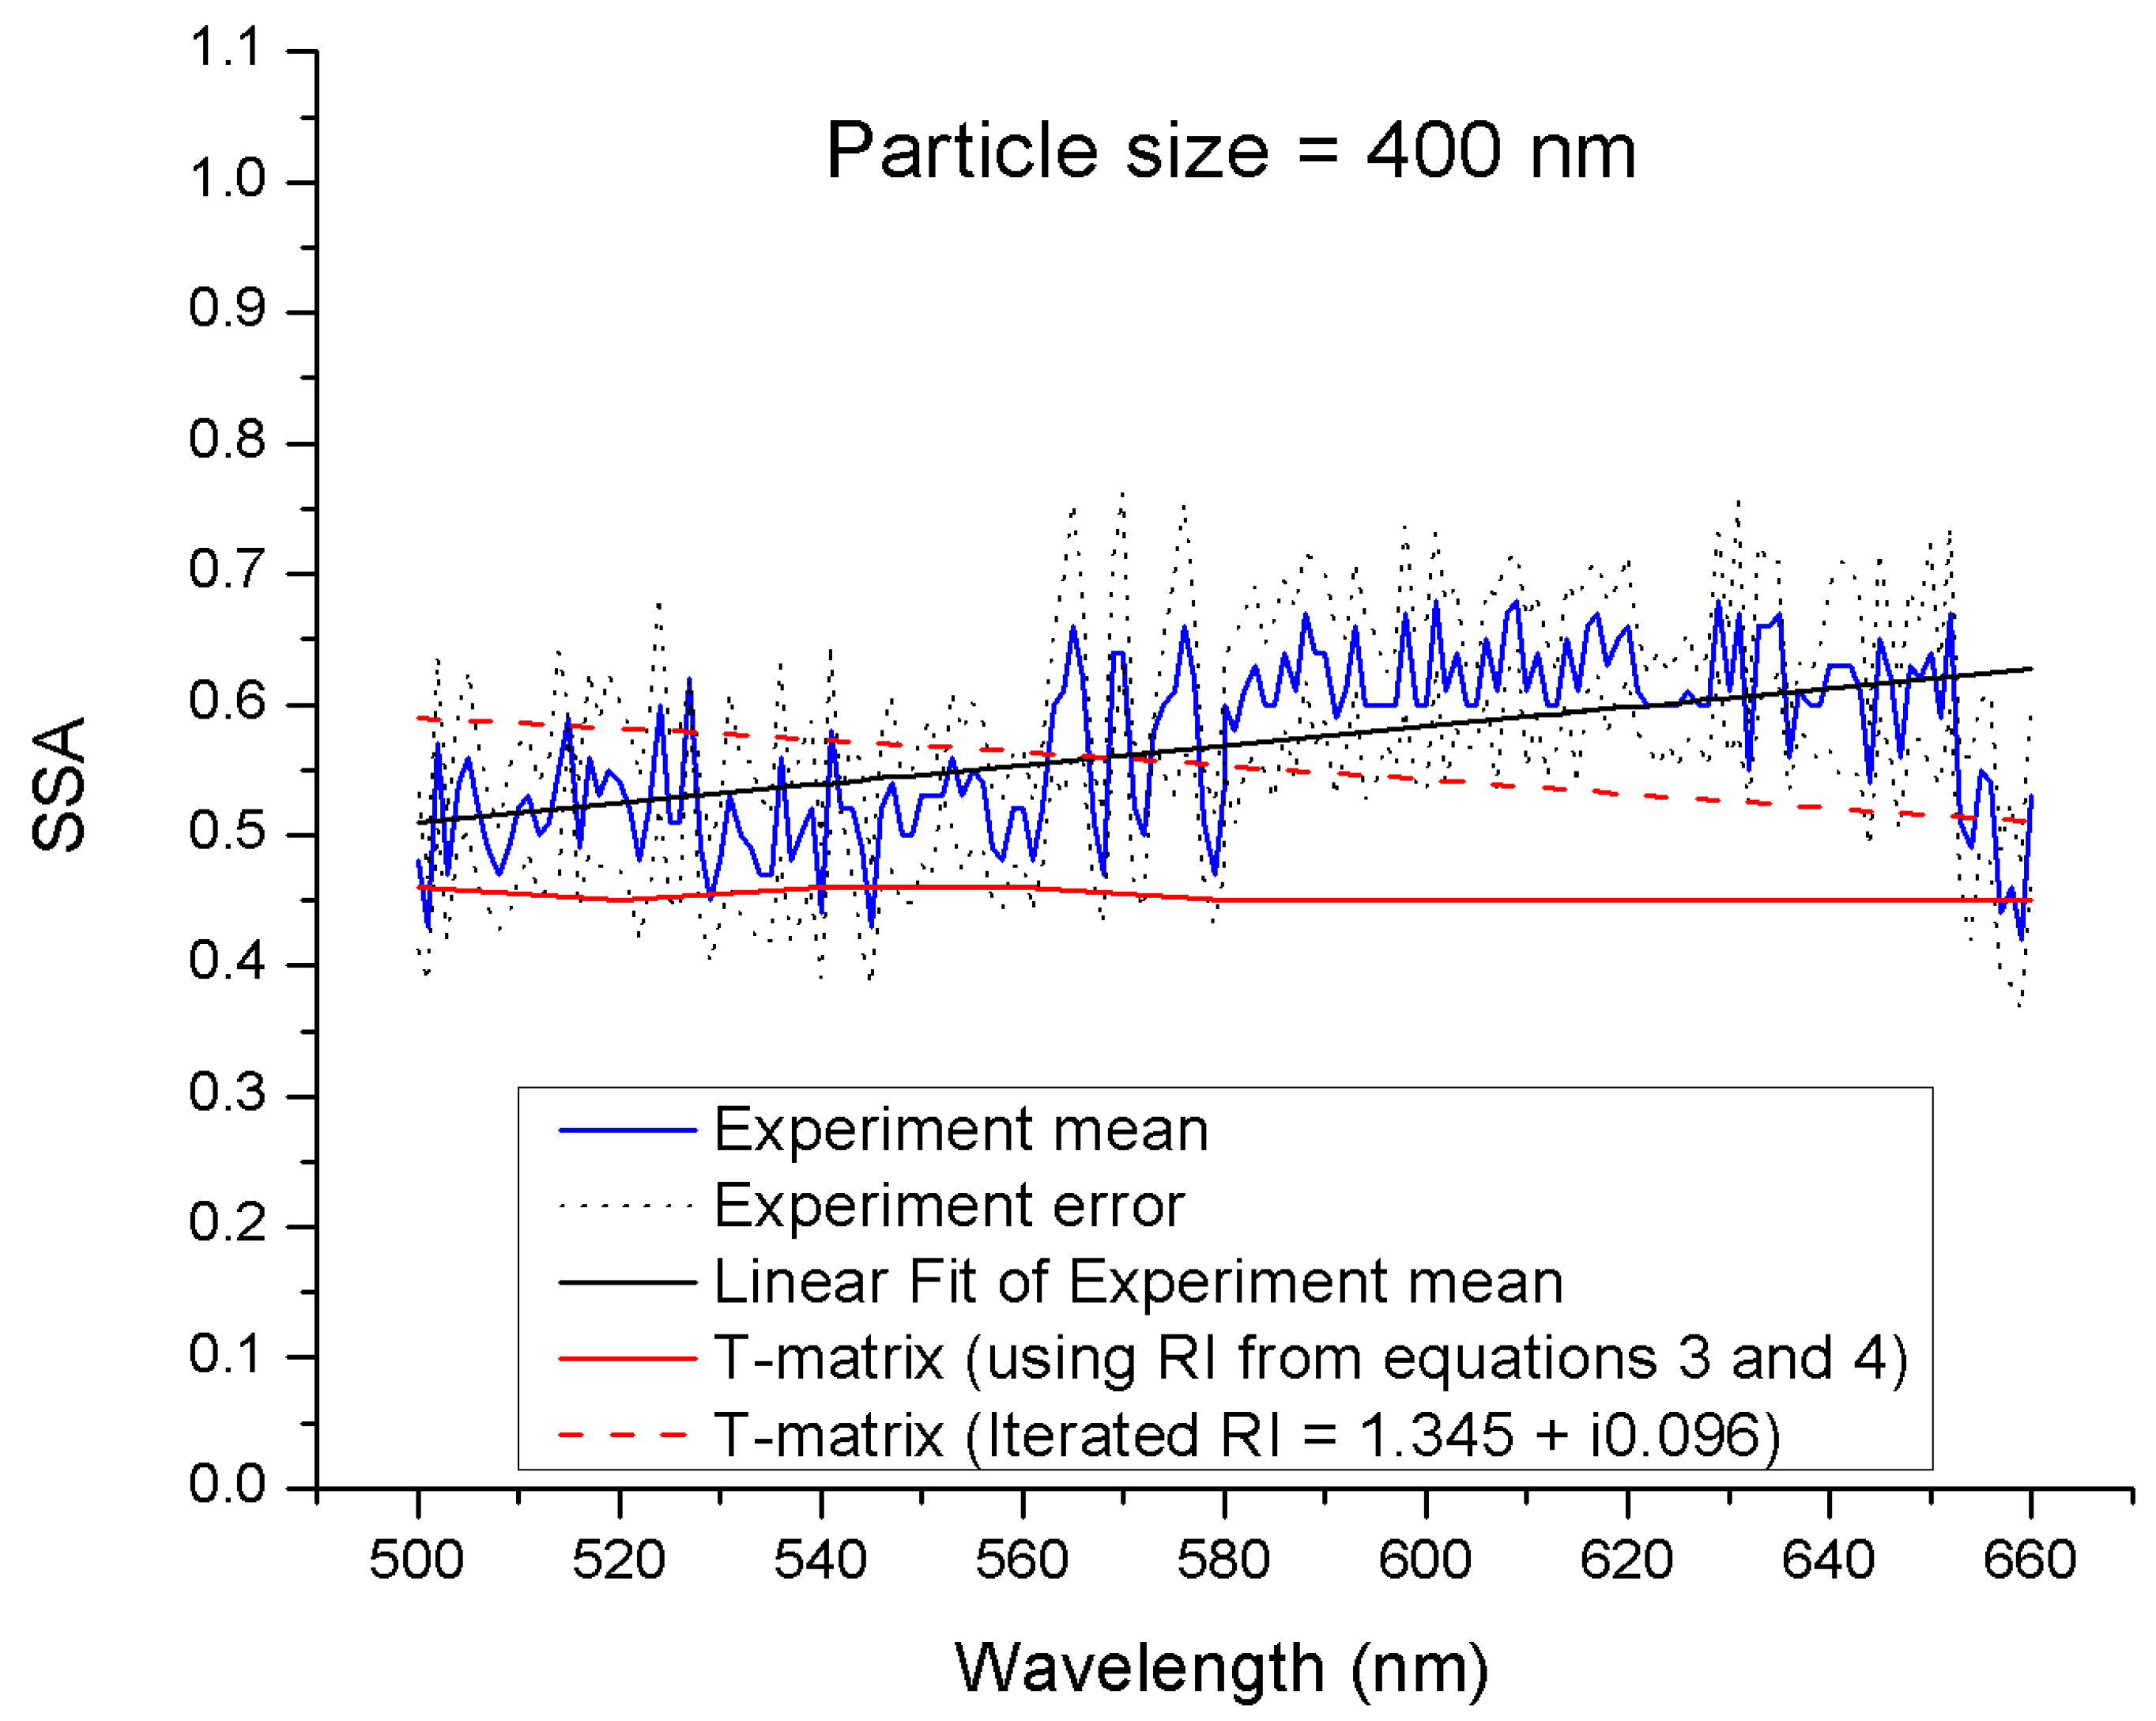
For the initial T-matrix calculations, we considered the BB aerosols obtained from our experiments to have higher concentrations of black carbon. Therefore, we used higher real and imaginary refractive index values following the approach of Wu et al. [
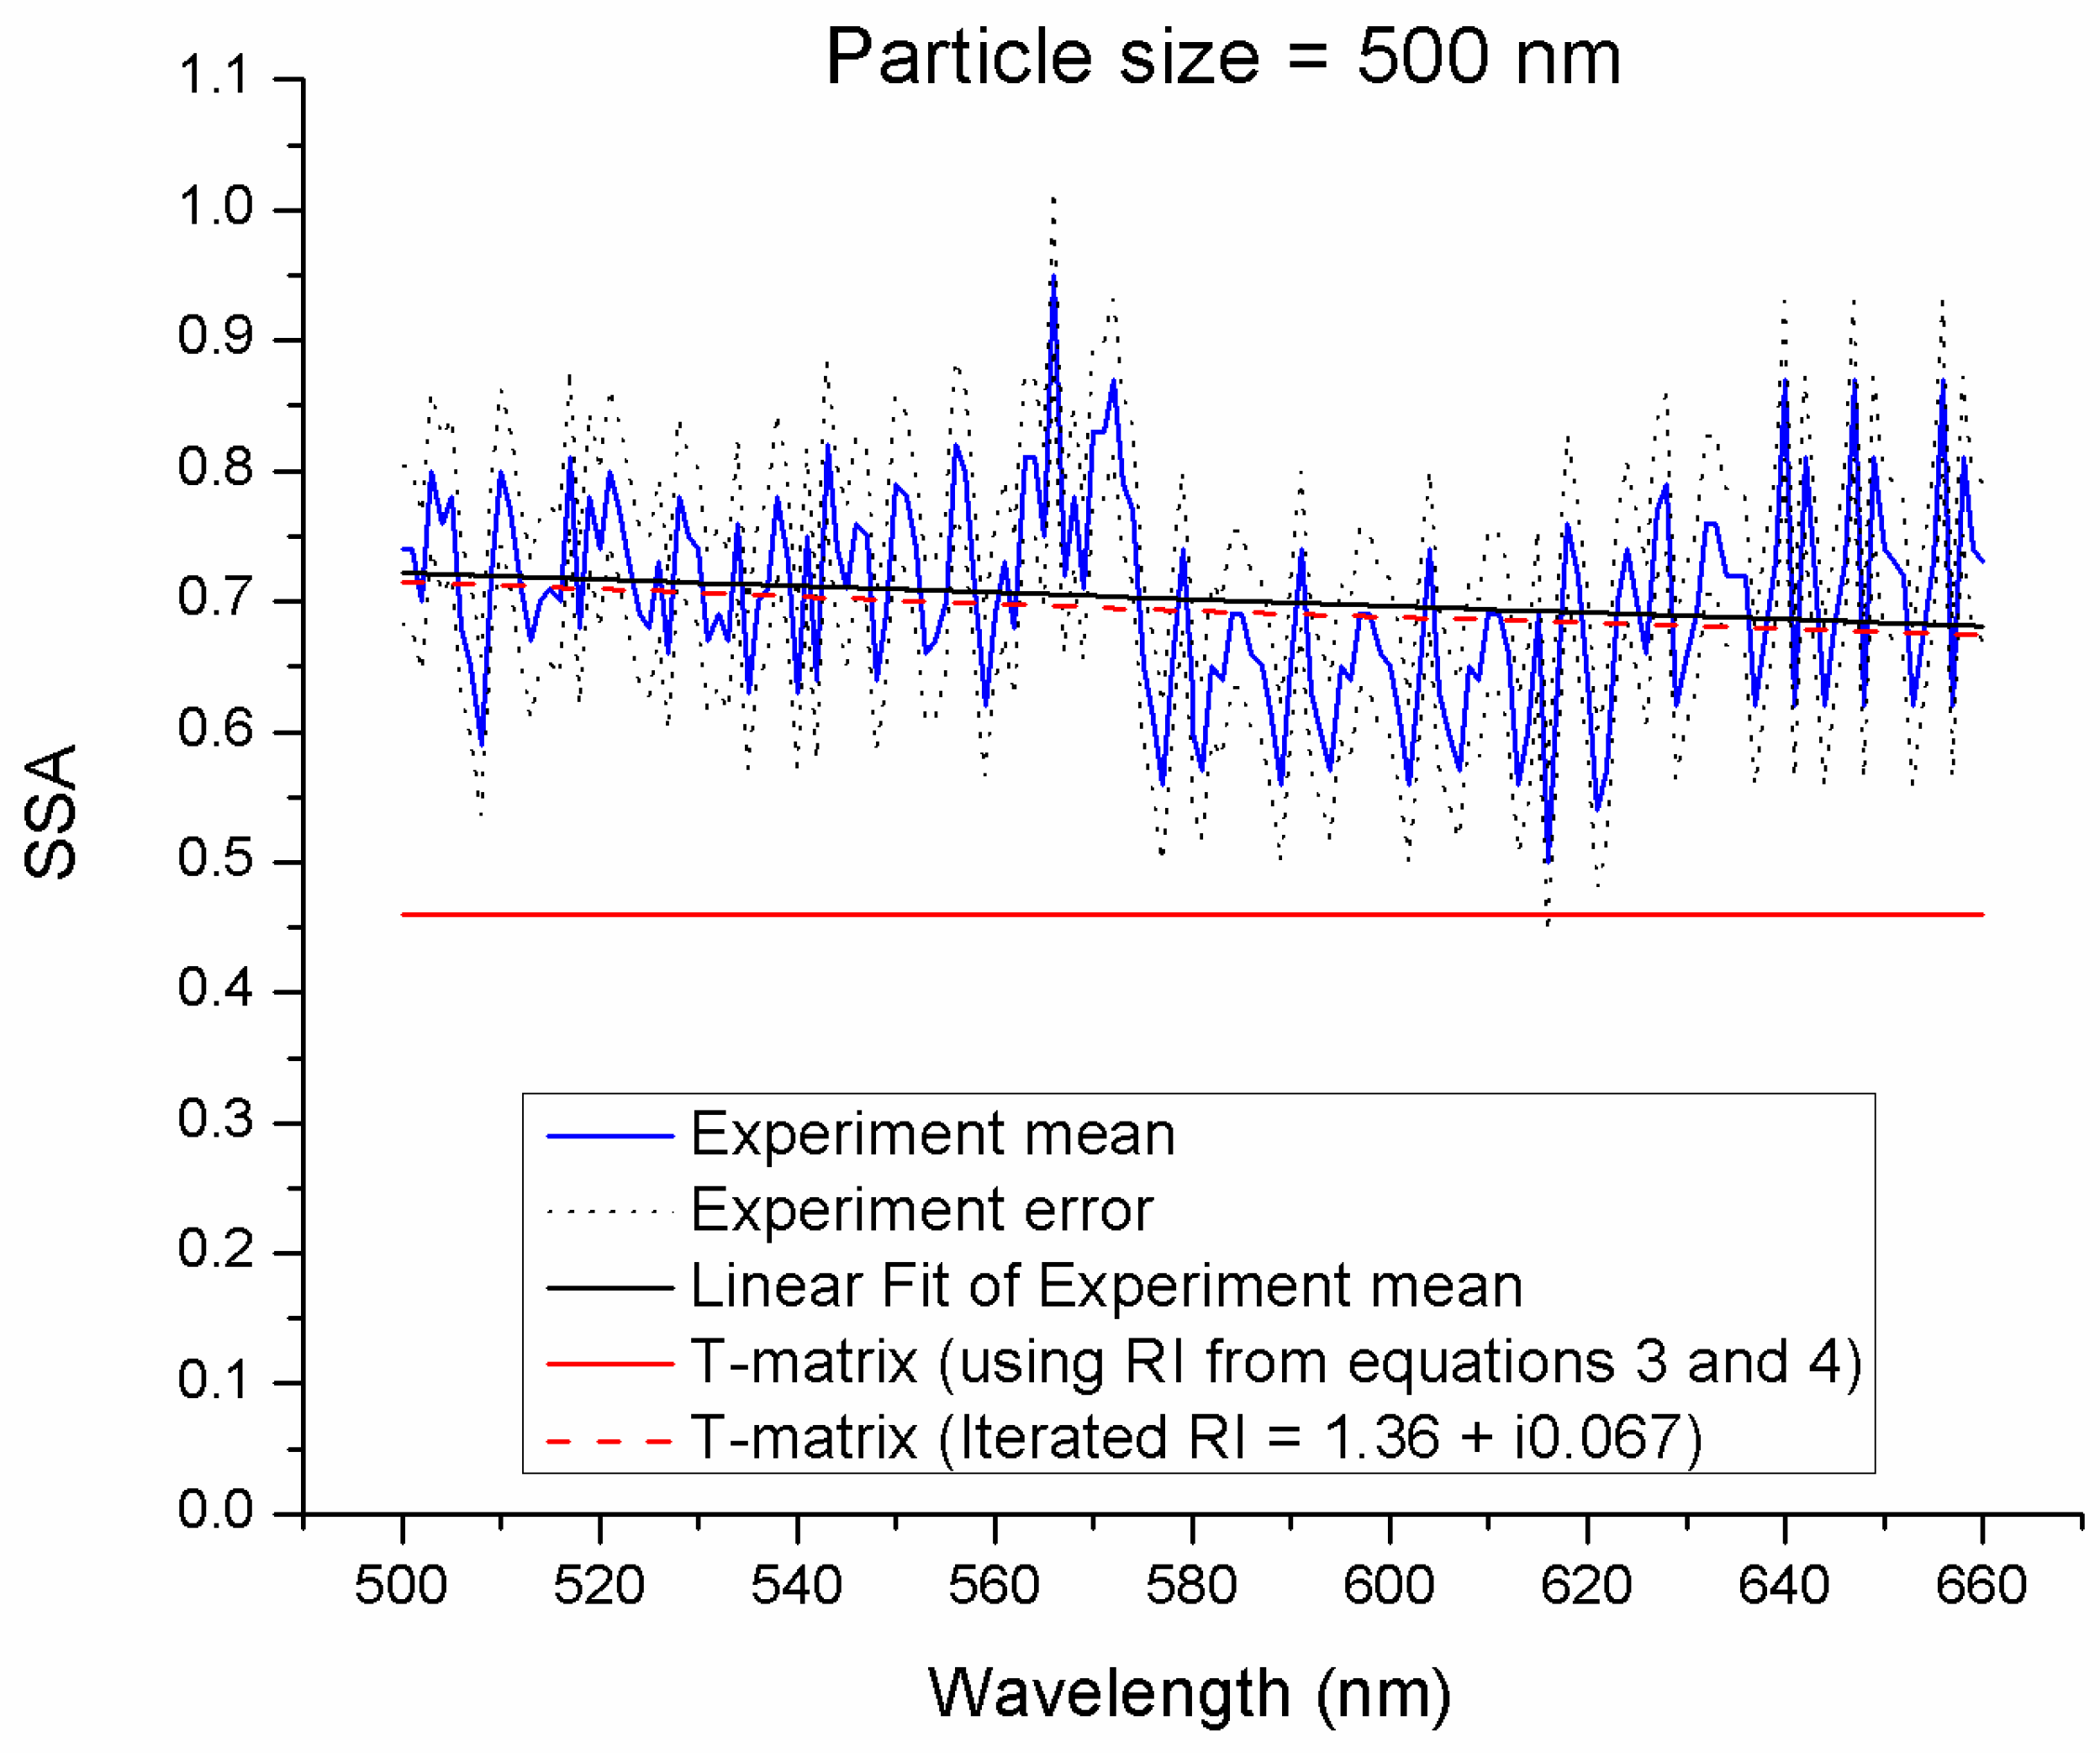
45], which used values obtained from Equations (3) and (4). Experimental average SSA values of BB aerosols from open fire burns and their standard deviations were 0.50 ± 0.03, 0.56 ± 0.05, and 0.70 ± 0.07, for 300-nm, 400-nm, and 500-nm particles, respectively, and show weak wavelength dependence. The SSA values from the T-matrix calculations of spherical single 300-nm, 400-nm, and 500-nm sized BB particles were 0.43, 0.45, and 0.46, respectively. These are shown in
Figure 2,
Figure 3 and
Figure 4. These values show very little wavelength dependence, which was similar to the observations. Similar disagreements between the T-matrix calculations and experiments were observed in soot produced by burning ethylene [
58] and propane [
46]. All of the modeled SSA values were less than the experimental values for lacey soot, fresh soot particles, (~41%), compact soot (~25%) [
58], and propane soot (56%). As such, the prescribed RI values for these types of particles were a poor match for the re-aerosolized BB particles examined in this work, suggesting they were chemically and/or morphologically dissimilar.
The refractive indices were iteratively varied to reproduce the experimental extinction, scattering cross-sections, and SSA values for the open fire samples. The best fit was obtained for a RI of 1.345 + i0.096 for 300-nm and 400-nm particles, and a RI of 1.365 + i0.067 for 500-nm particles. This is consistent with the findings of Boenko and Imre [
59], where they showed that the real part of the refractive index increased, and the imaginary part decreased, with increasing particle size. In these experiments, the particles were collected in an impinger in distilled water and re-aerosolized to measure their optical properties. We had initially assumed and reported that our measurements represented fresh BB aerosols; since the samples were kept in distilled water and not exposed to the environment, we did not expect photochemical changes to take place. The system would be too diluted for secondary organic aerosol (SOA) formation via acid chemistry. However, the particles may have absorbed water that caused hygroscopic mass growth that affected their refractive indices [
17,
31,
60,
61], and all of the semi-volatile soluble organics must have already dissolved in water, leaving a compact core with some water coating. It has been shown that most of the BB aerosol material (on average about 50%) seemed to be highly refractory organic material soluble in water [
51].
For the 300-nm and 400-nm particles, the SSA values that were found using the iterated RI method decreased with increasing wavelength, which was opposite to the trend shown by the linear fit to the experimental values. The R2 values for the linear fit were between 0.26 and 0.29, though R2 is a poor fit indicator when there is little or no observed trend. It was not possible to fit the SSA value using a single value of the RI. In fact, two sets of RIs are needed for the two wavelength ranges: 500–580 nm and 580–660 nm, suggesting a wavelength-dependent RI. Clearly, the calculated SSA using wavelength-dependent RI values based on Equations (3) and (4) provided a wavelength-independent SSA. However, the fit for the 500-nm particles was quite reasonable, suggesting the significance of the size dependence on the RI.
As described by Singh et al., in [
50], in the experiments, the data in the 580–660 nm range had poorer signal to noise ratio (S/N) than data in the 500–580 nm range due to poor mirror reflectivity. The cross-sections also showed a decrease at higher wavelengths for measurements taken several weeks apart (i.e., different wavelength ranges at different times), despite the consistent size distribution. This was also true at overlapping wavelengths, where there was an abrupt discontinuity at 580 nm (the boundary between the two sets of mirrors). For measurements done on the same day, the discontinuity was reduced for most runs. A constant derived from the difference in cross-sections at 580 nm was either added or subtracted from the cross-sections at 580–660 nm. It is also worth noting that the level of noise was not the same for different particle sizes, which was largely due to number density differences.
When using the refractive index 1.504 + i0.009 reported by Mack [
48] for longleaf pine burning smoke, the SSA values obtained were significantly higher than the open fire experimental values. The values were 0.946, 0.960, and 0.962 for 300-nm, 400-nm, and 500-nm particles, respectively. These SSA values and associated scattering and extinction cross-sections were much greater than our laboratory-measured results.
Chen et al. have suggested a wide range of SSA values for wood fuels such as dry Ponderosa pine and white pine needles [
62]. The SSA values changed from 0.32 to 0.6 as the burning stage changed from flaming to smoldering. They argued that the change is due to the decrease in the black carbon fraction resulting in a decrease in the imaginary part of the refractive index. Hence, a wide range of acceptable complex refractive indices would produce SSA values within this range. Our refractive index of 1.345 + i0.096 for 300-nm and 400-nm particles proves to be more consistent, since the experimental SSA values for 300-nm and 400-nm particles lie within their range (0.32–0.6) of SSA values of pine in open fire burning.
On the other hand, during the FLAME I and II measurements, Levin et al. found that combusting various wild land fuels produced BB particles with geometric mean diameters ranging from 200 nm to 570 nm, and estimated that their effective refractive indices ranged from 1.55 to 1.80 for the real part, and 0.01–0.50 for the imaginary part. These increased with increasing particle density, which ranged from 1.22–1.92 g·cm
−3 [
49]. The refractive indices also depend on the chemical composition of the aerosols. The refractive indices in our work for BB aerosols (1.345 + i0.096 and 1.365 + i0.067) have a lower real part, and an imaginary part that was within the range of refractive indices for different North American fuels compiled in the thesis by Mack [
48] and suggested by Levin [
49]. The imaginary part of the refractive index for fuel type in Mack’s work ranges from 0.009–0.028. This is lower than our results, which range from 0.065–0.096, and suggests that the impinged BB samples were more absorbing in this work [
48]. The literature values of imaginary refractive indices of biomass burning aerosols compiled by Mack were even lower than their own measurements. This is possible, because most of the literature values compiled by Mack are for the aged particles, which have higher SSA values than the fresh ones [
17]. Reid et al. compiled SSA values of fresh and aged biomass smoke in their review, which shows an average value for fresh smoke to be around 0.8, and aged smoke to exceed 0.9 [
63]. Furthermore, a study by Dubovik et al. has shown that SSA values vary significantly with the source and age of the BB aerosols, and that SSA values correlate with the fraction of black carbon [
64].
He et al. [
65,
66] showed that the two methods they used (Geometric-optics surface waves (GOS) and T-matrix) capture the measured optical properties, but with a 5–20% difference, and the highest difference being the calculations based on T-matrix. They attributed the discrepancy to the morphology, i.e., the greater dependence on the fractal dimension than on the size of the primary spherules. While our results are consistent with their results that the T-matrix calculations underestimated the SSA values, the discrepancy is even larger if we use the refractive index of 1.95 + 0.79i used by He et al. [
65,
66], which was suggested by Bond et al. [
2] for soot produced from the combustion of hydrocarbons and diesel. In fact, we have seen that the refractive index suggested by Bond, when used for biomass burning aerosols, further underestimated the SSA values. One could, therefore, argue that the discrepancy was dominated by fractal dimensions or by the choice of the refractive index. Answering this is beyond the scope the current work, though it is something worth exploring.
An accurate estimate of the BC radiative effects requires the incorporation of the aging process and coating structure [
65,
66] and consideration of particle mass [
67]. This current work was focused on freshly emitted biomass burning aerosols. Our lab is currently investigating how aging and chemical changes alter the optical properties of BB aerosols.
Considering the wide variability in the reported values of optical properties of biomass burning aerosols, we decided to run a different experiment where we measured the optical properties of fresh biomass burning aerosols using the laboratory tube furnace, as described in the experimental section. Measurements of optical properties of pinewood were done for particle mobility diameters of 200 nm, 300 nm, and 400 nm.
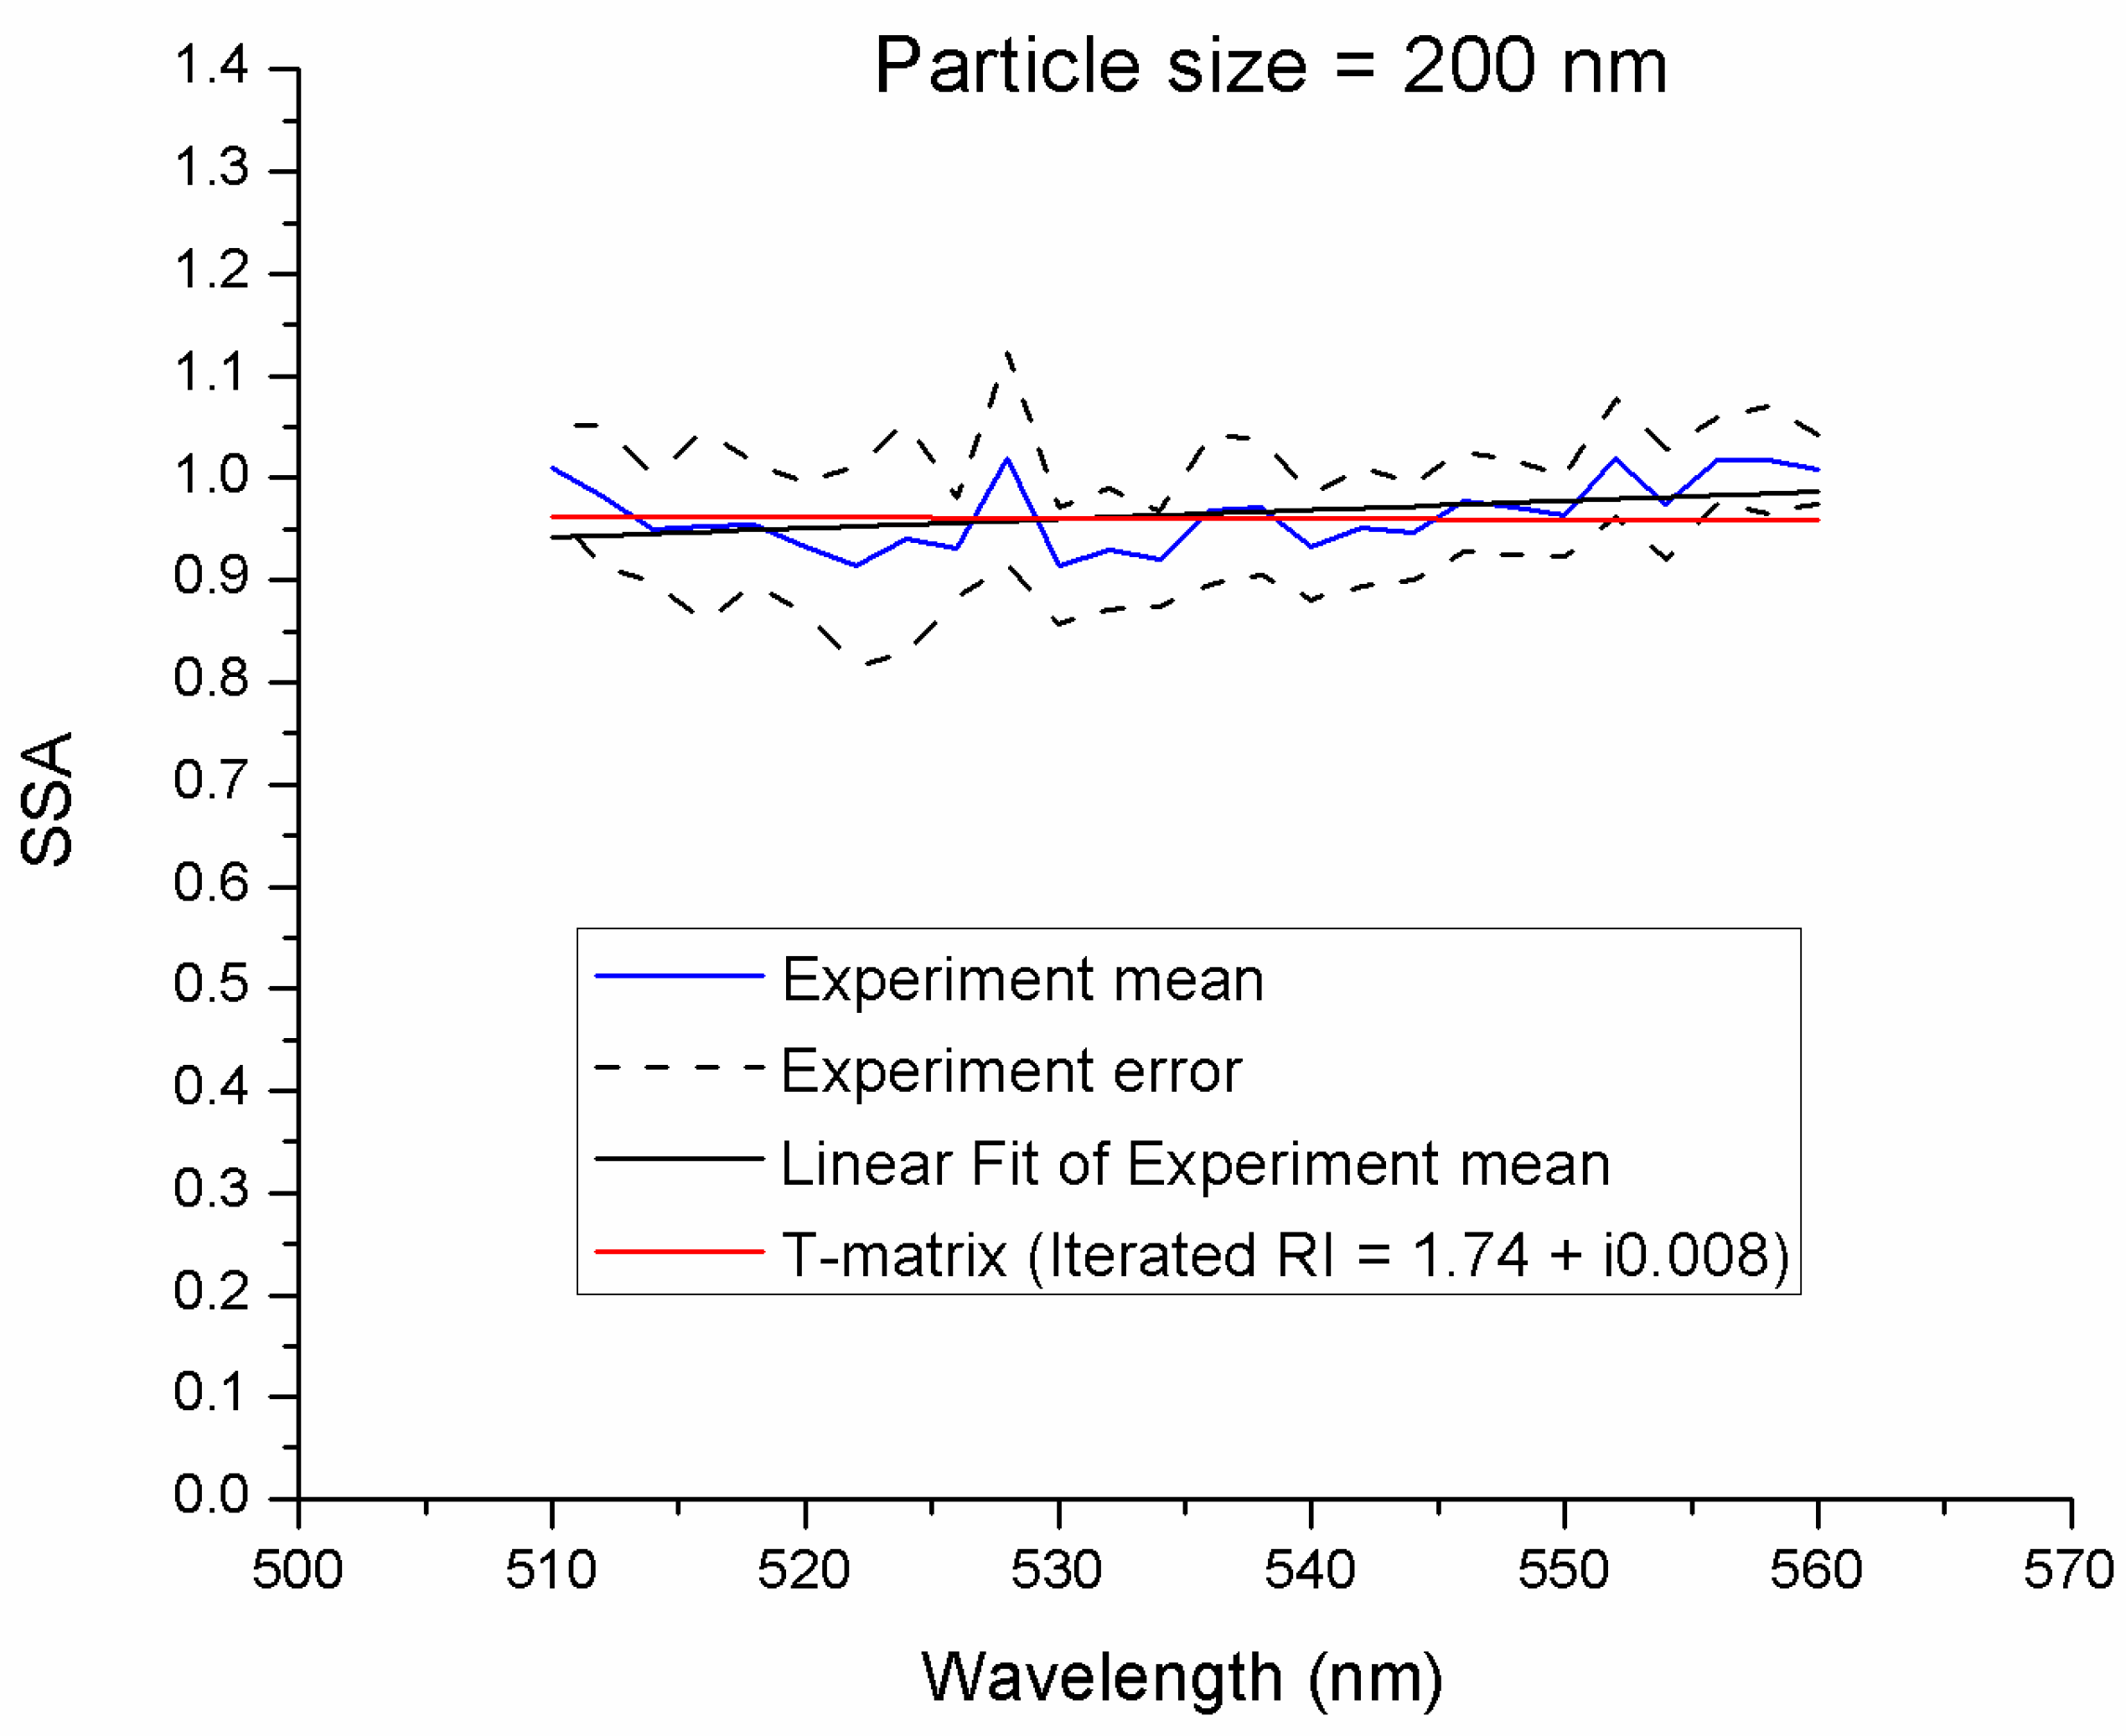
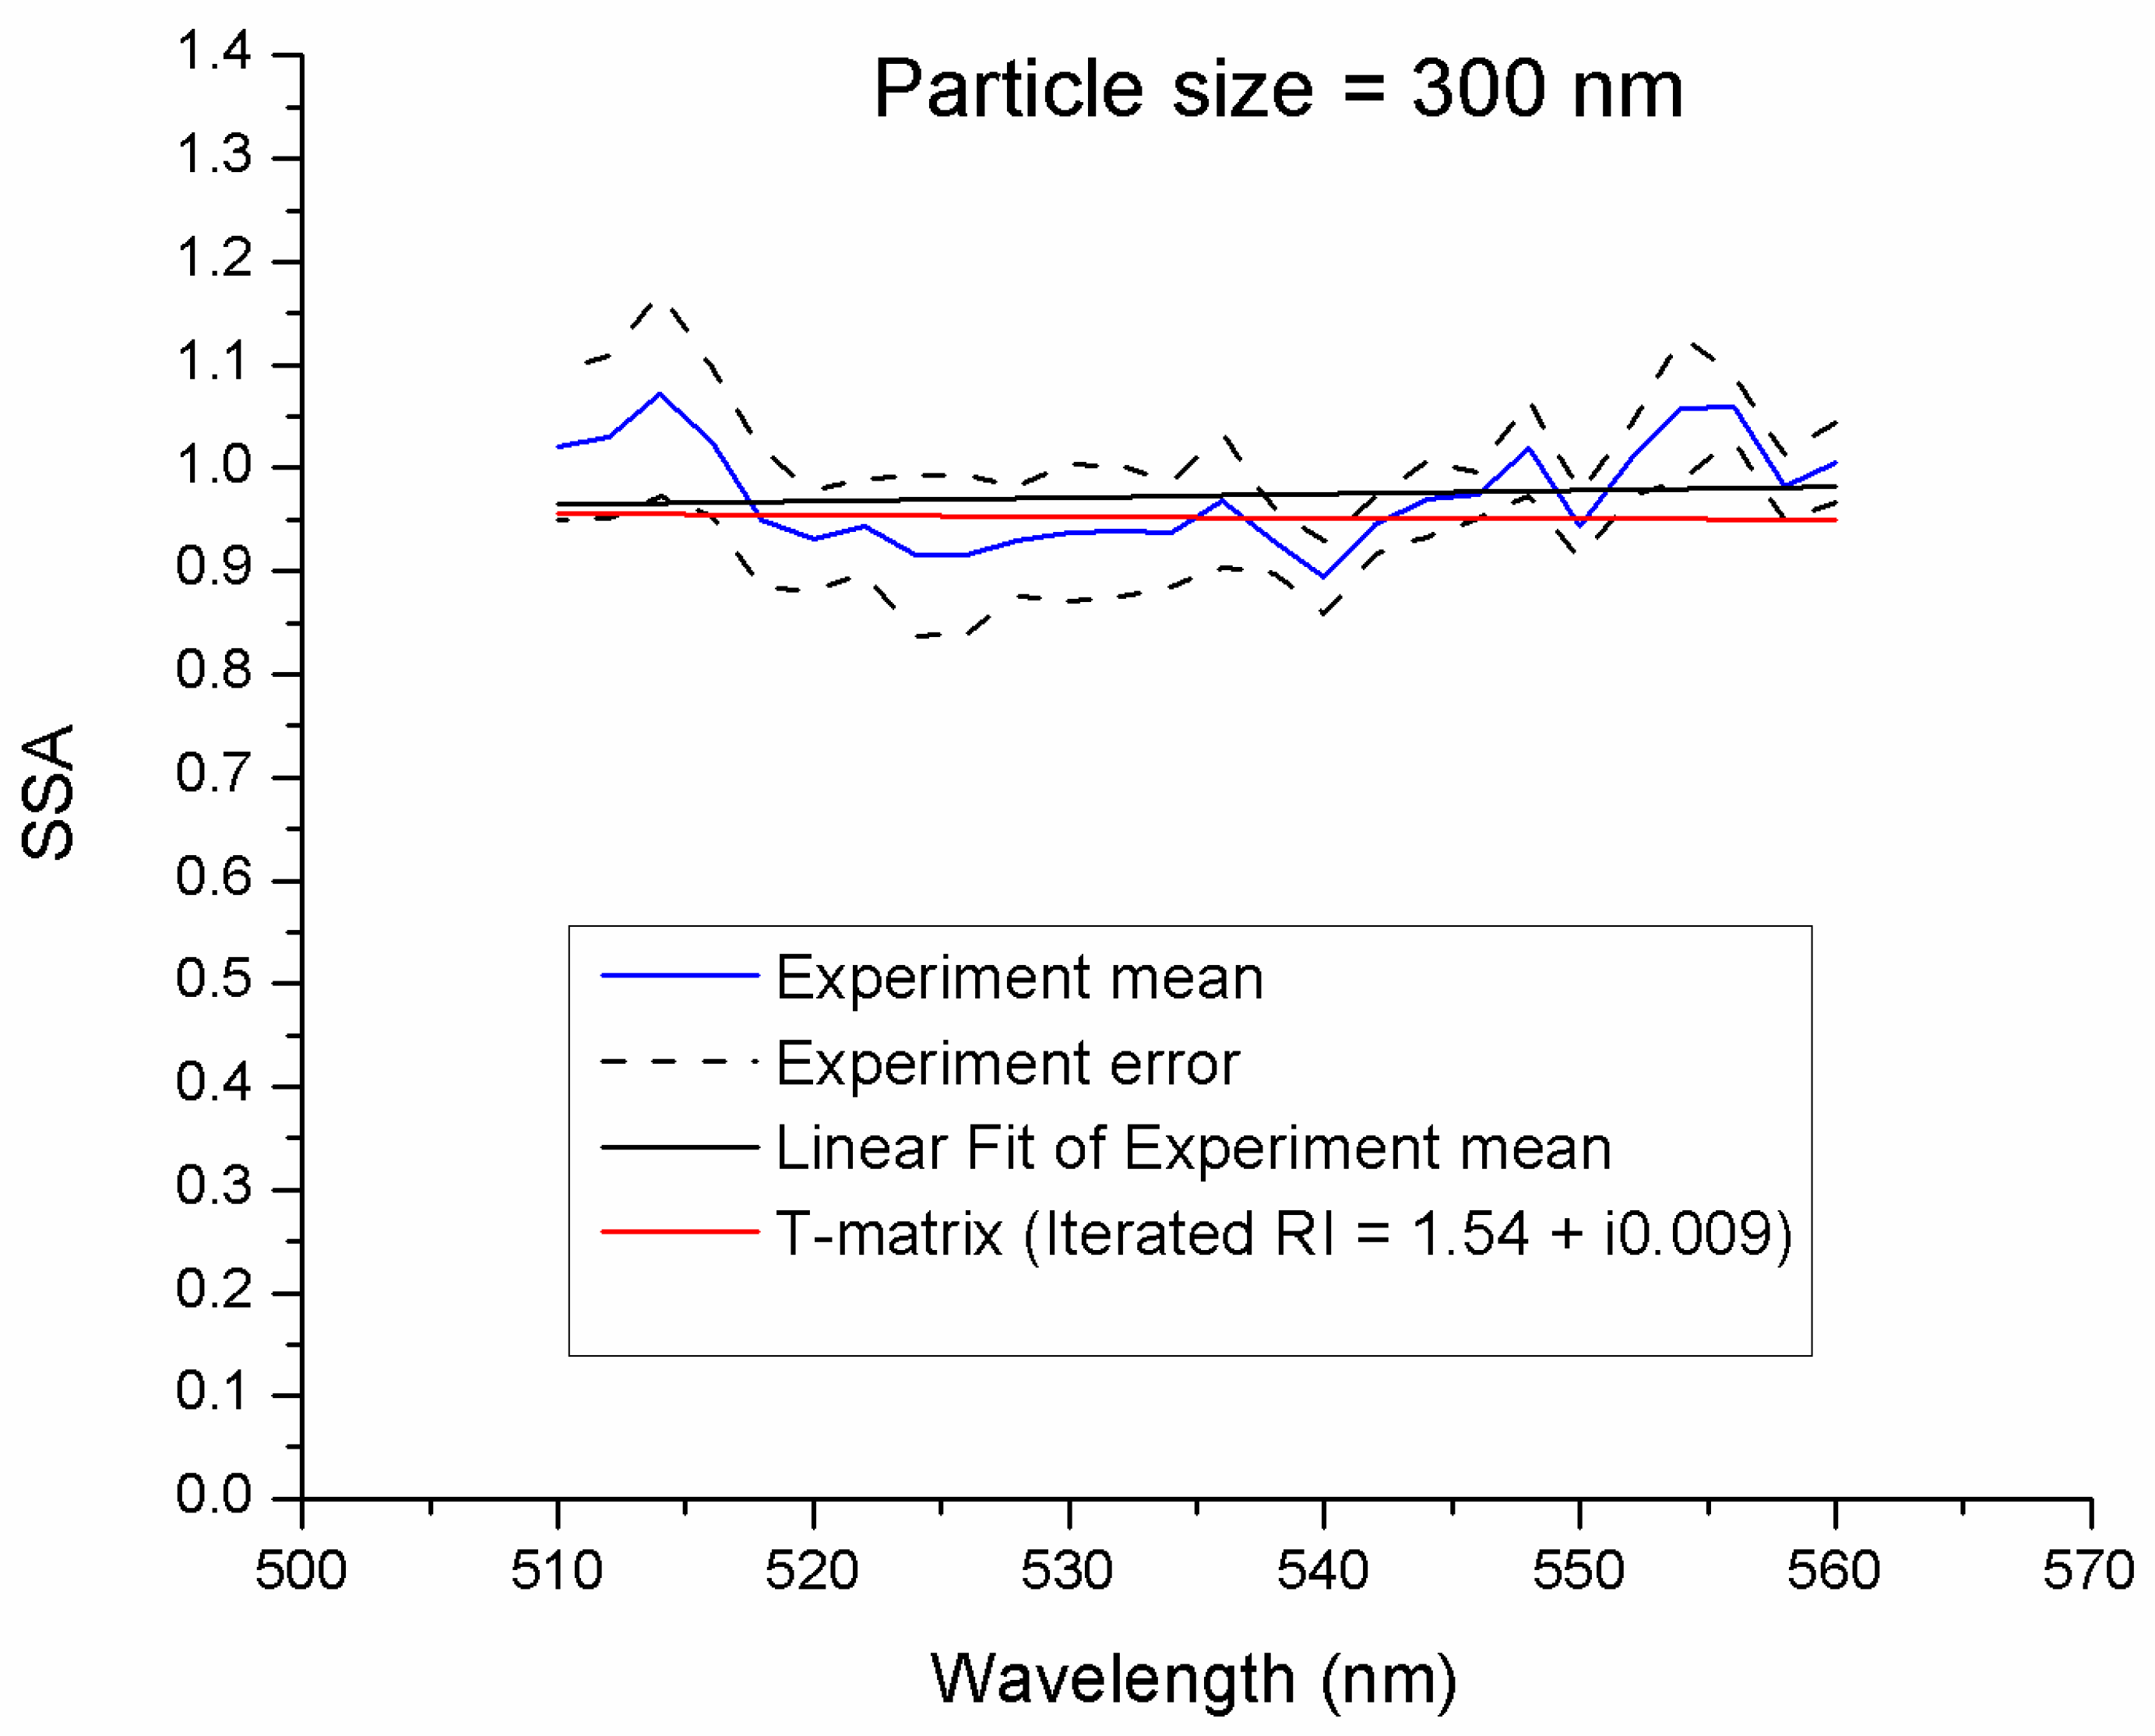
Figure 5,
Figure 6 and
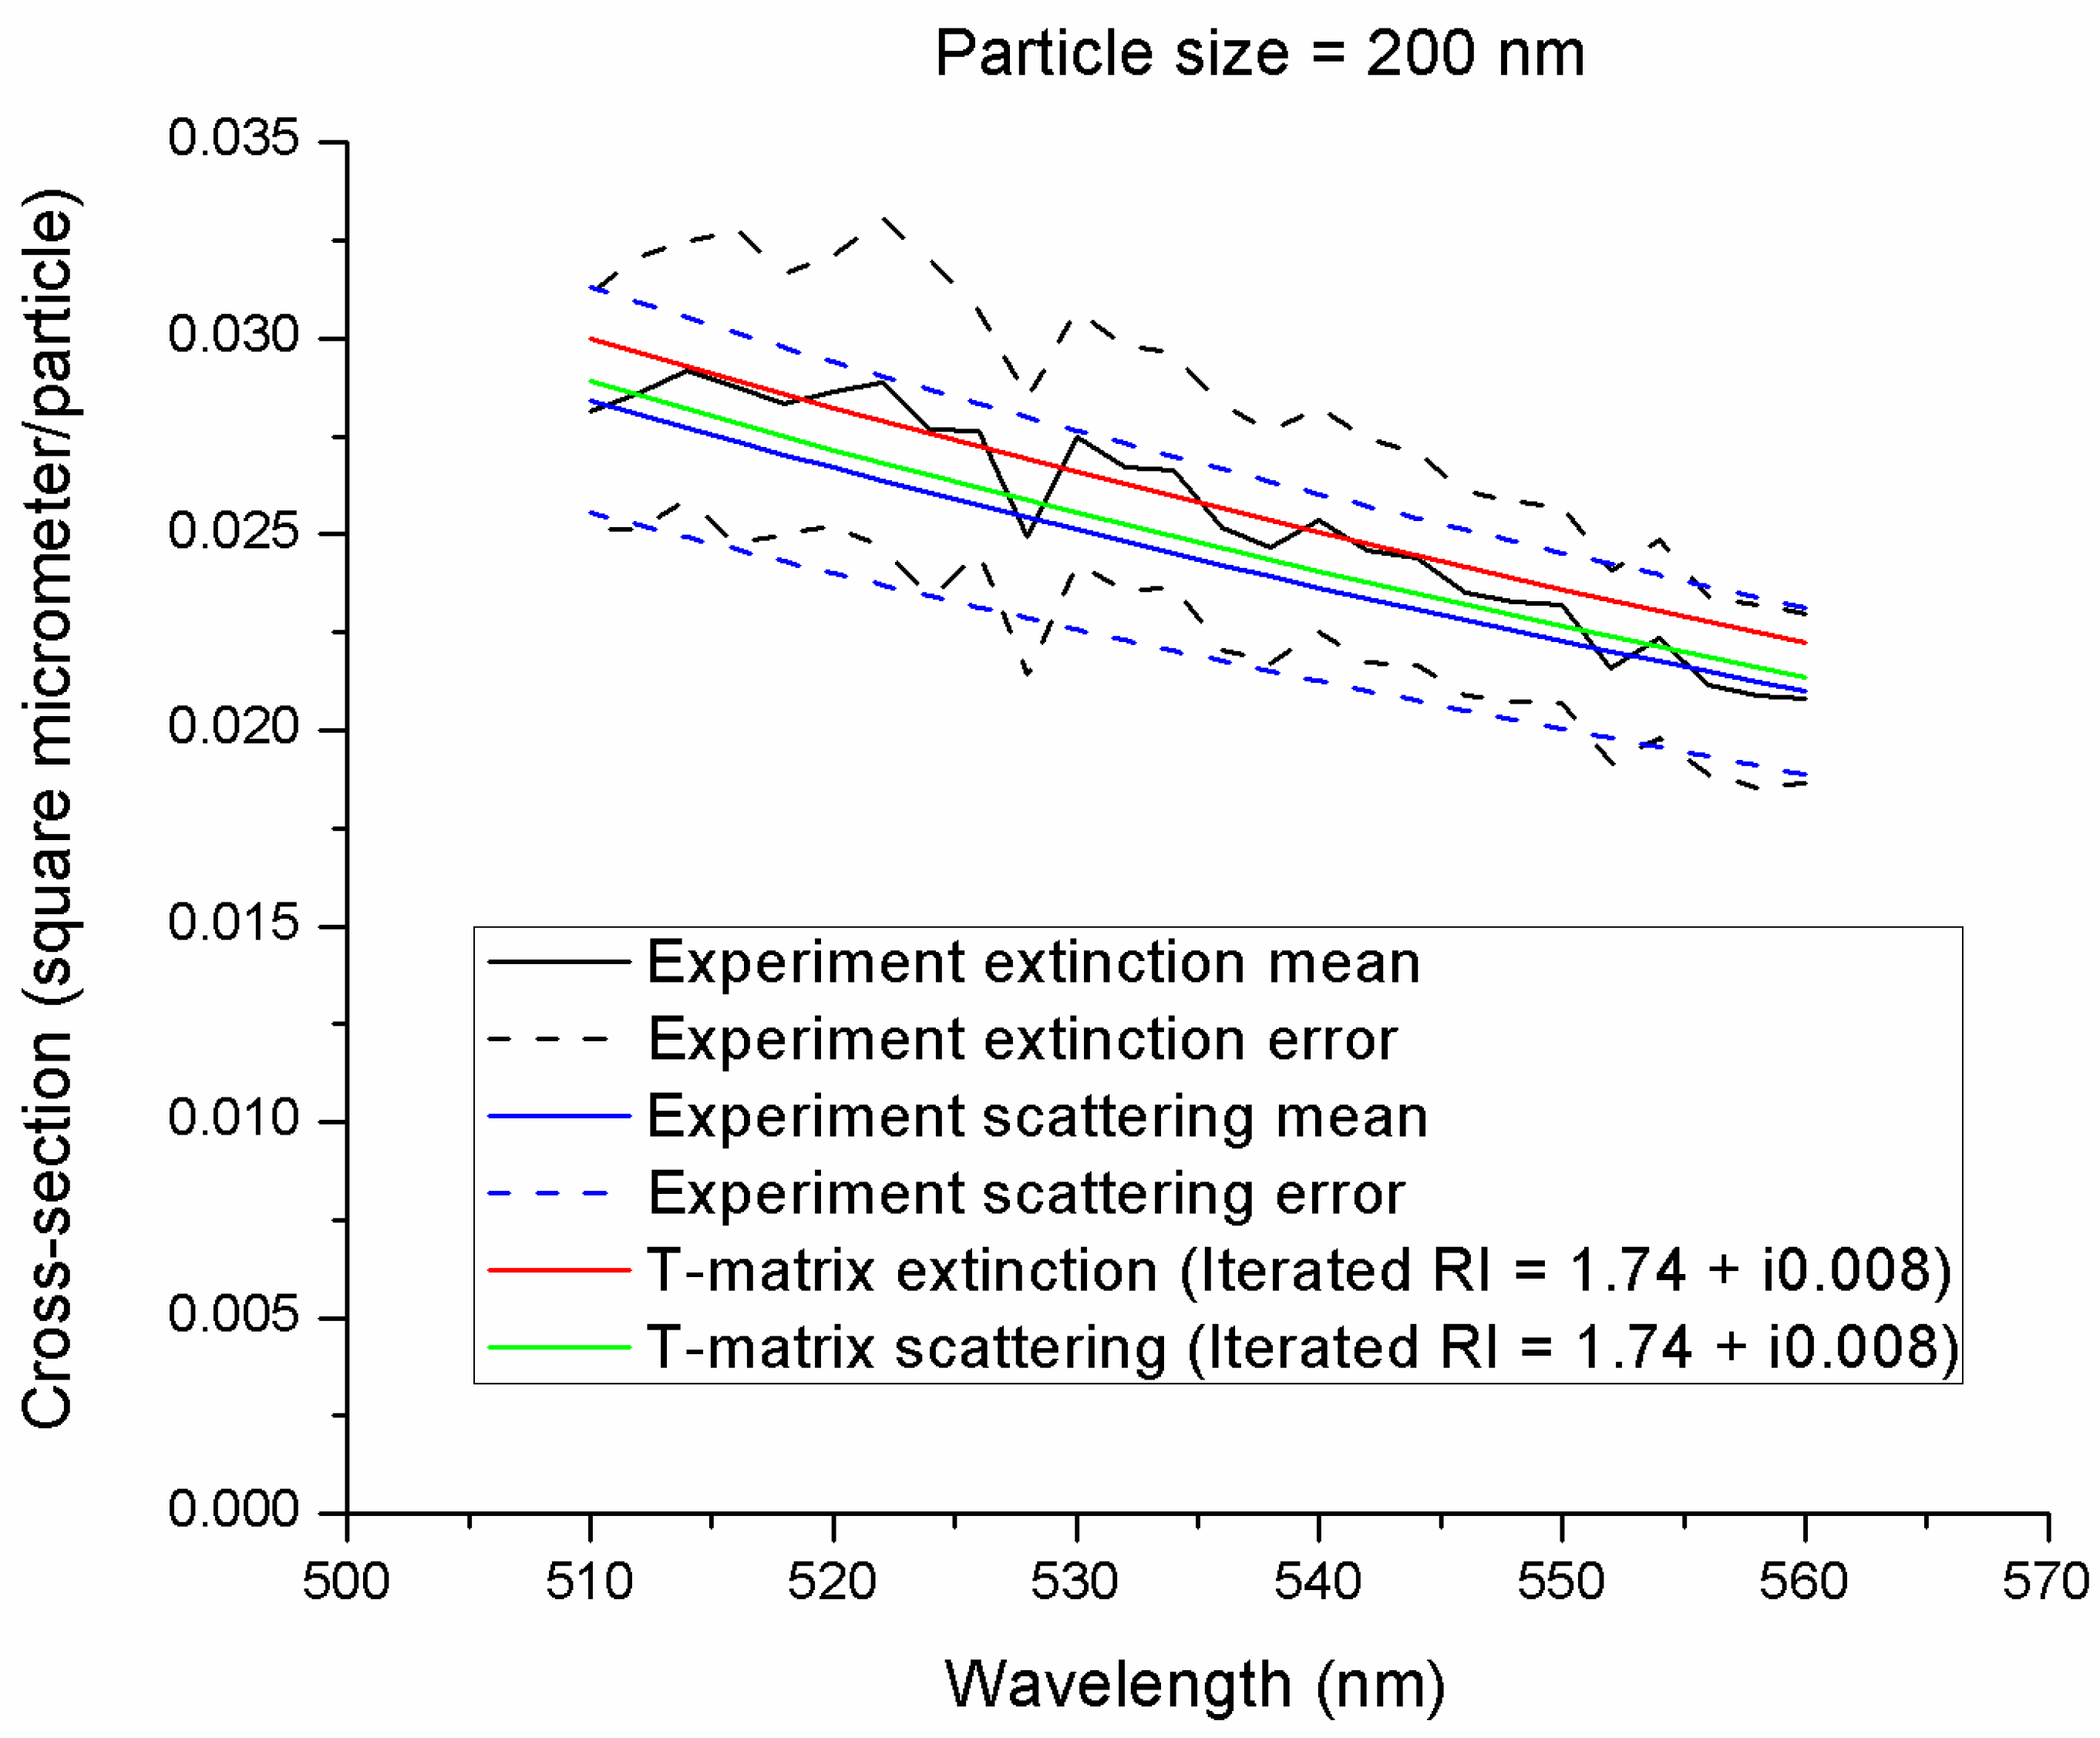
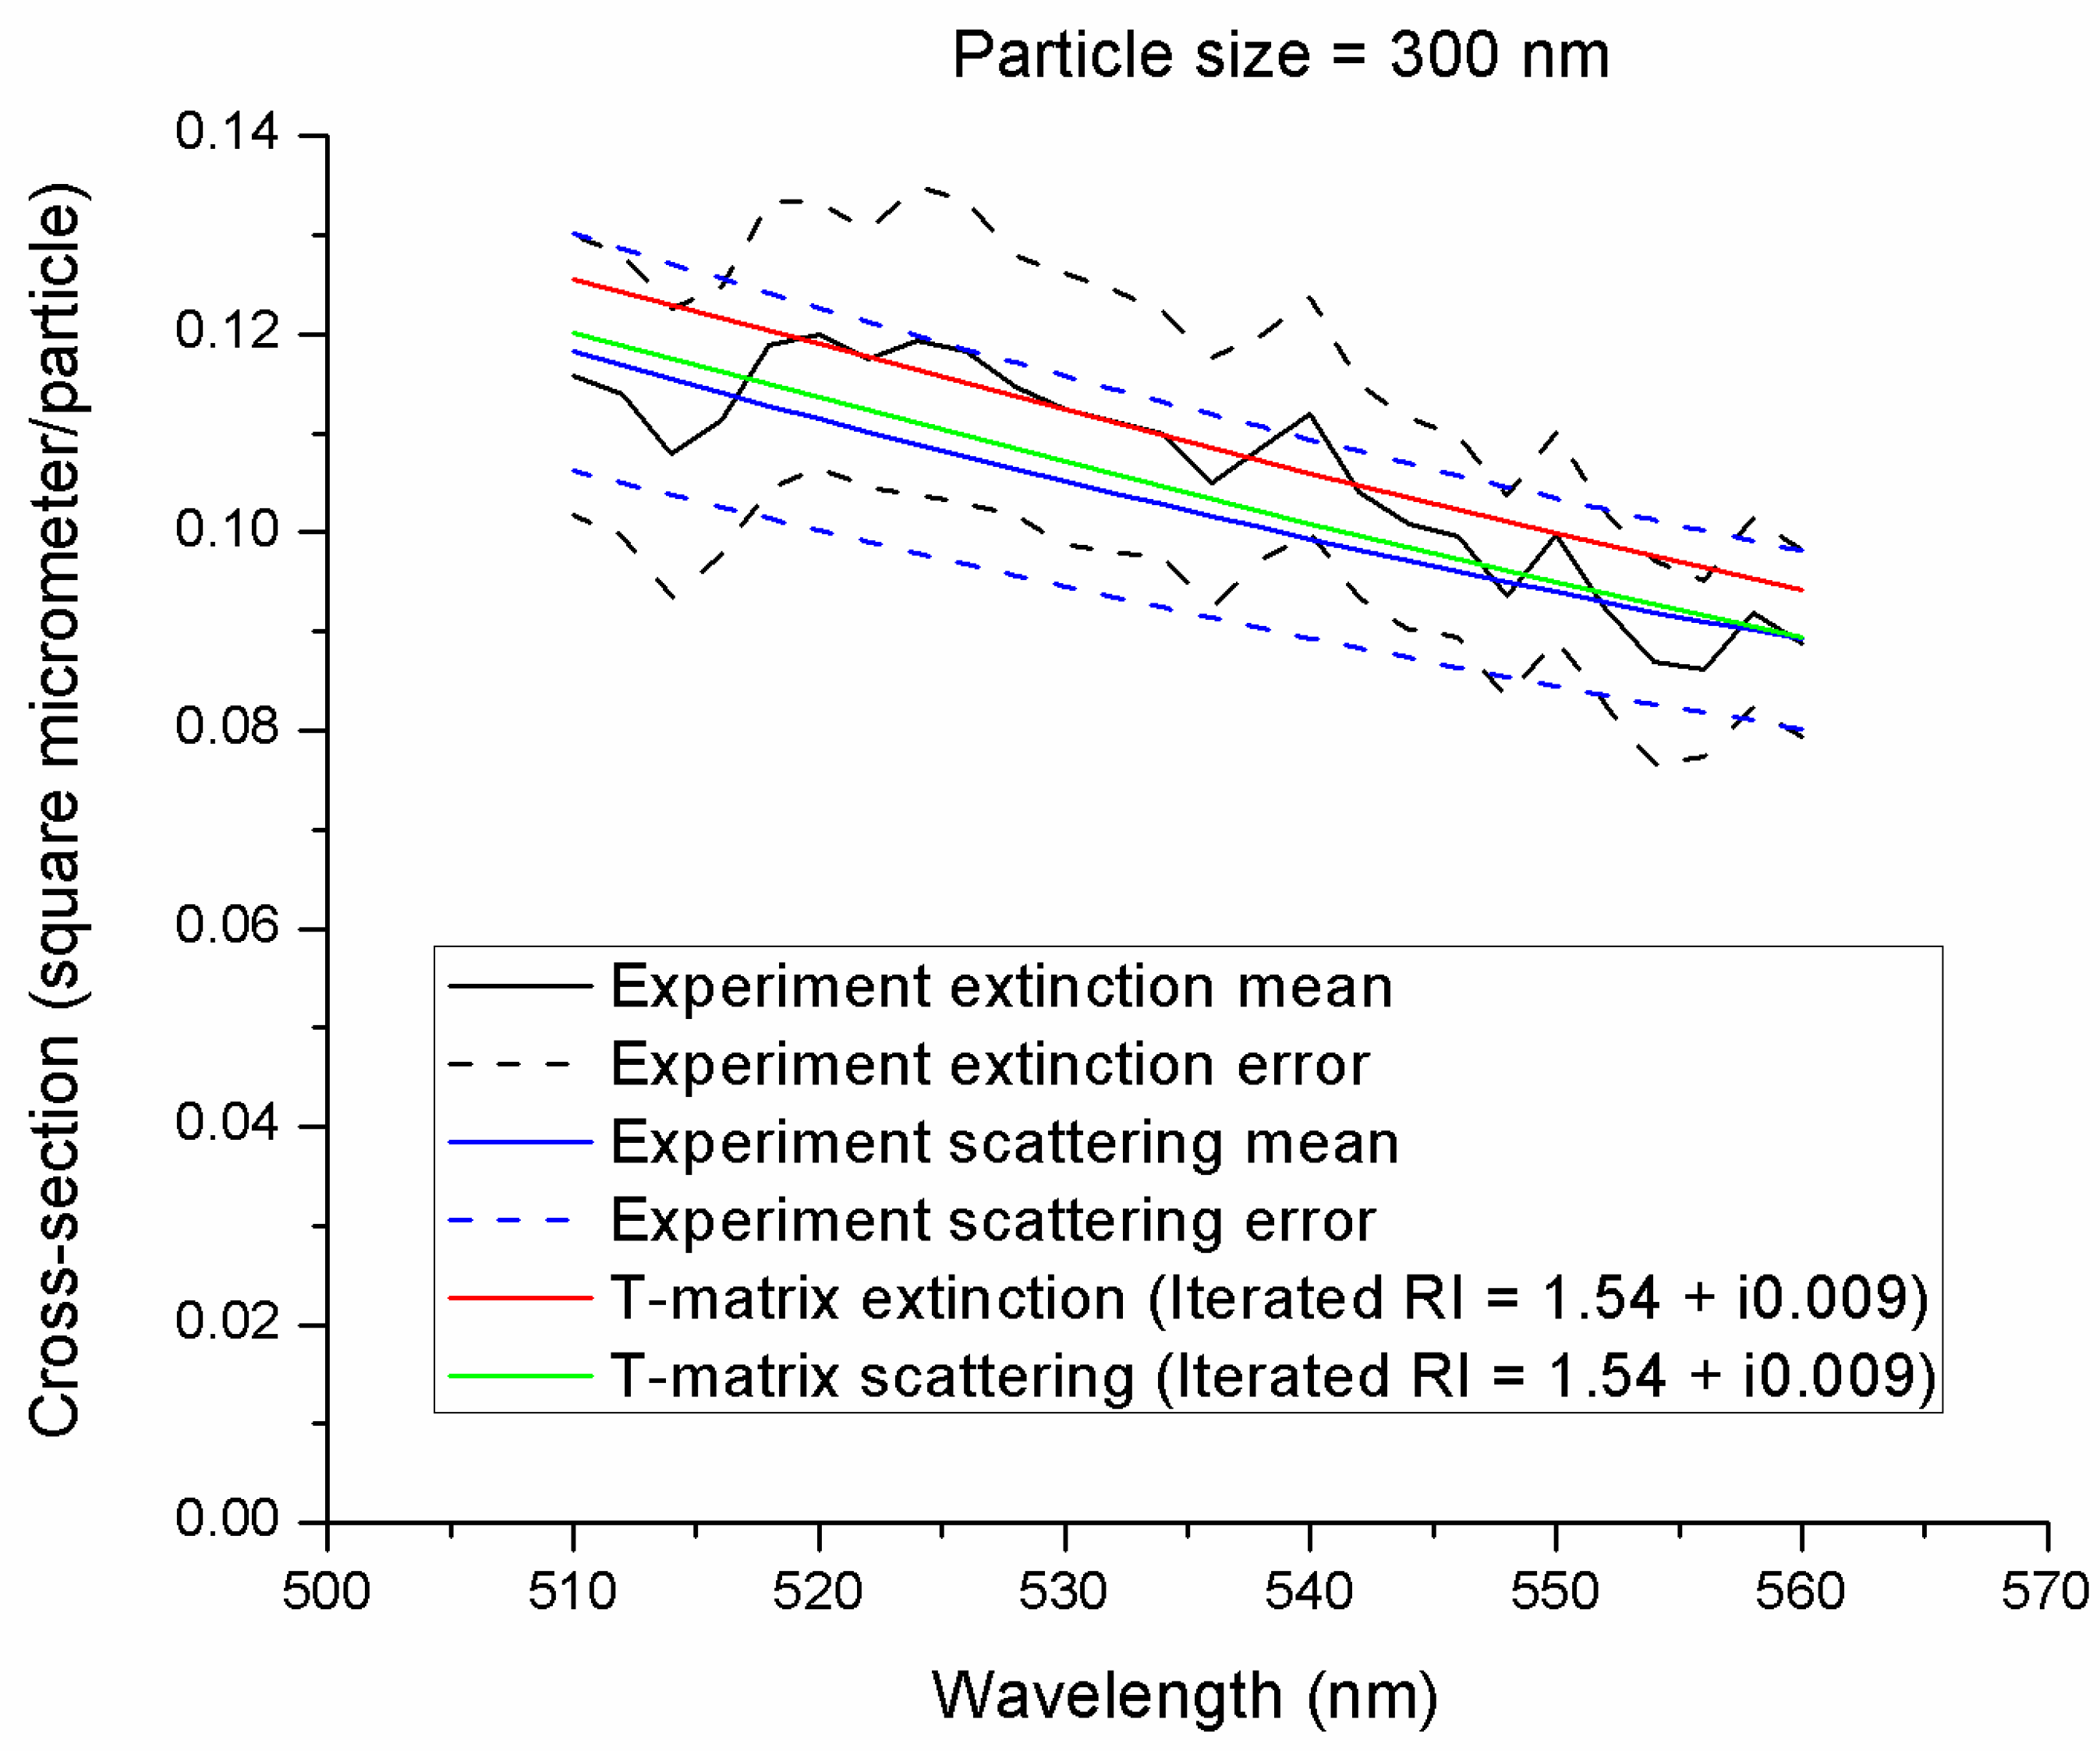
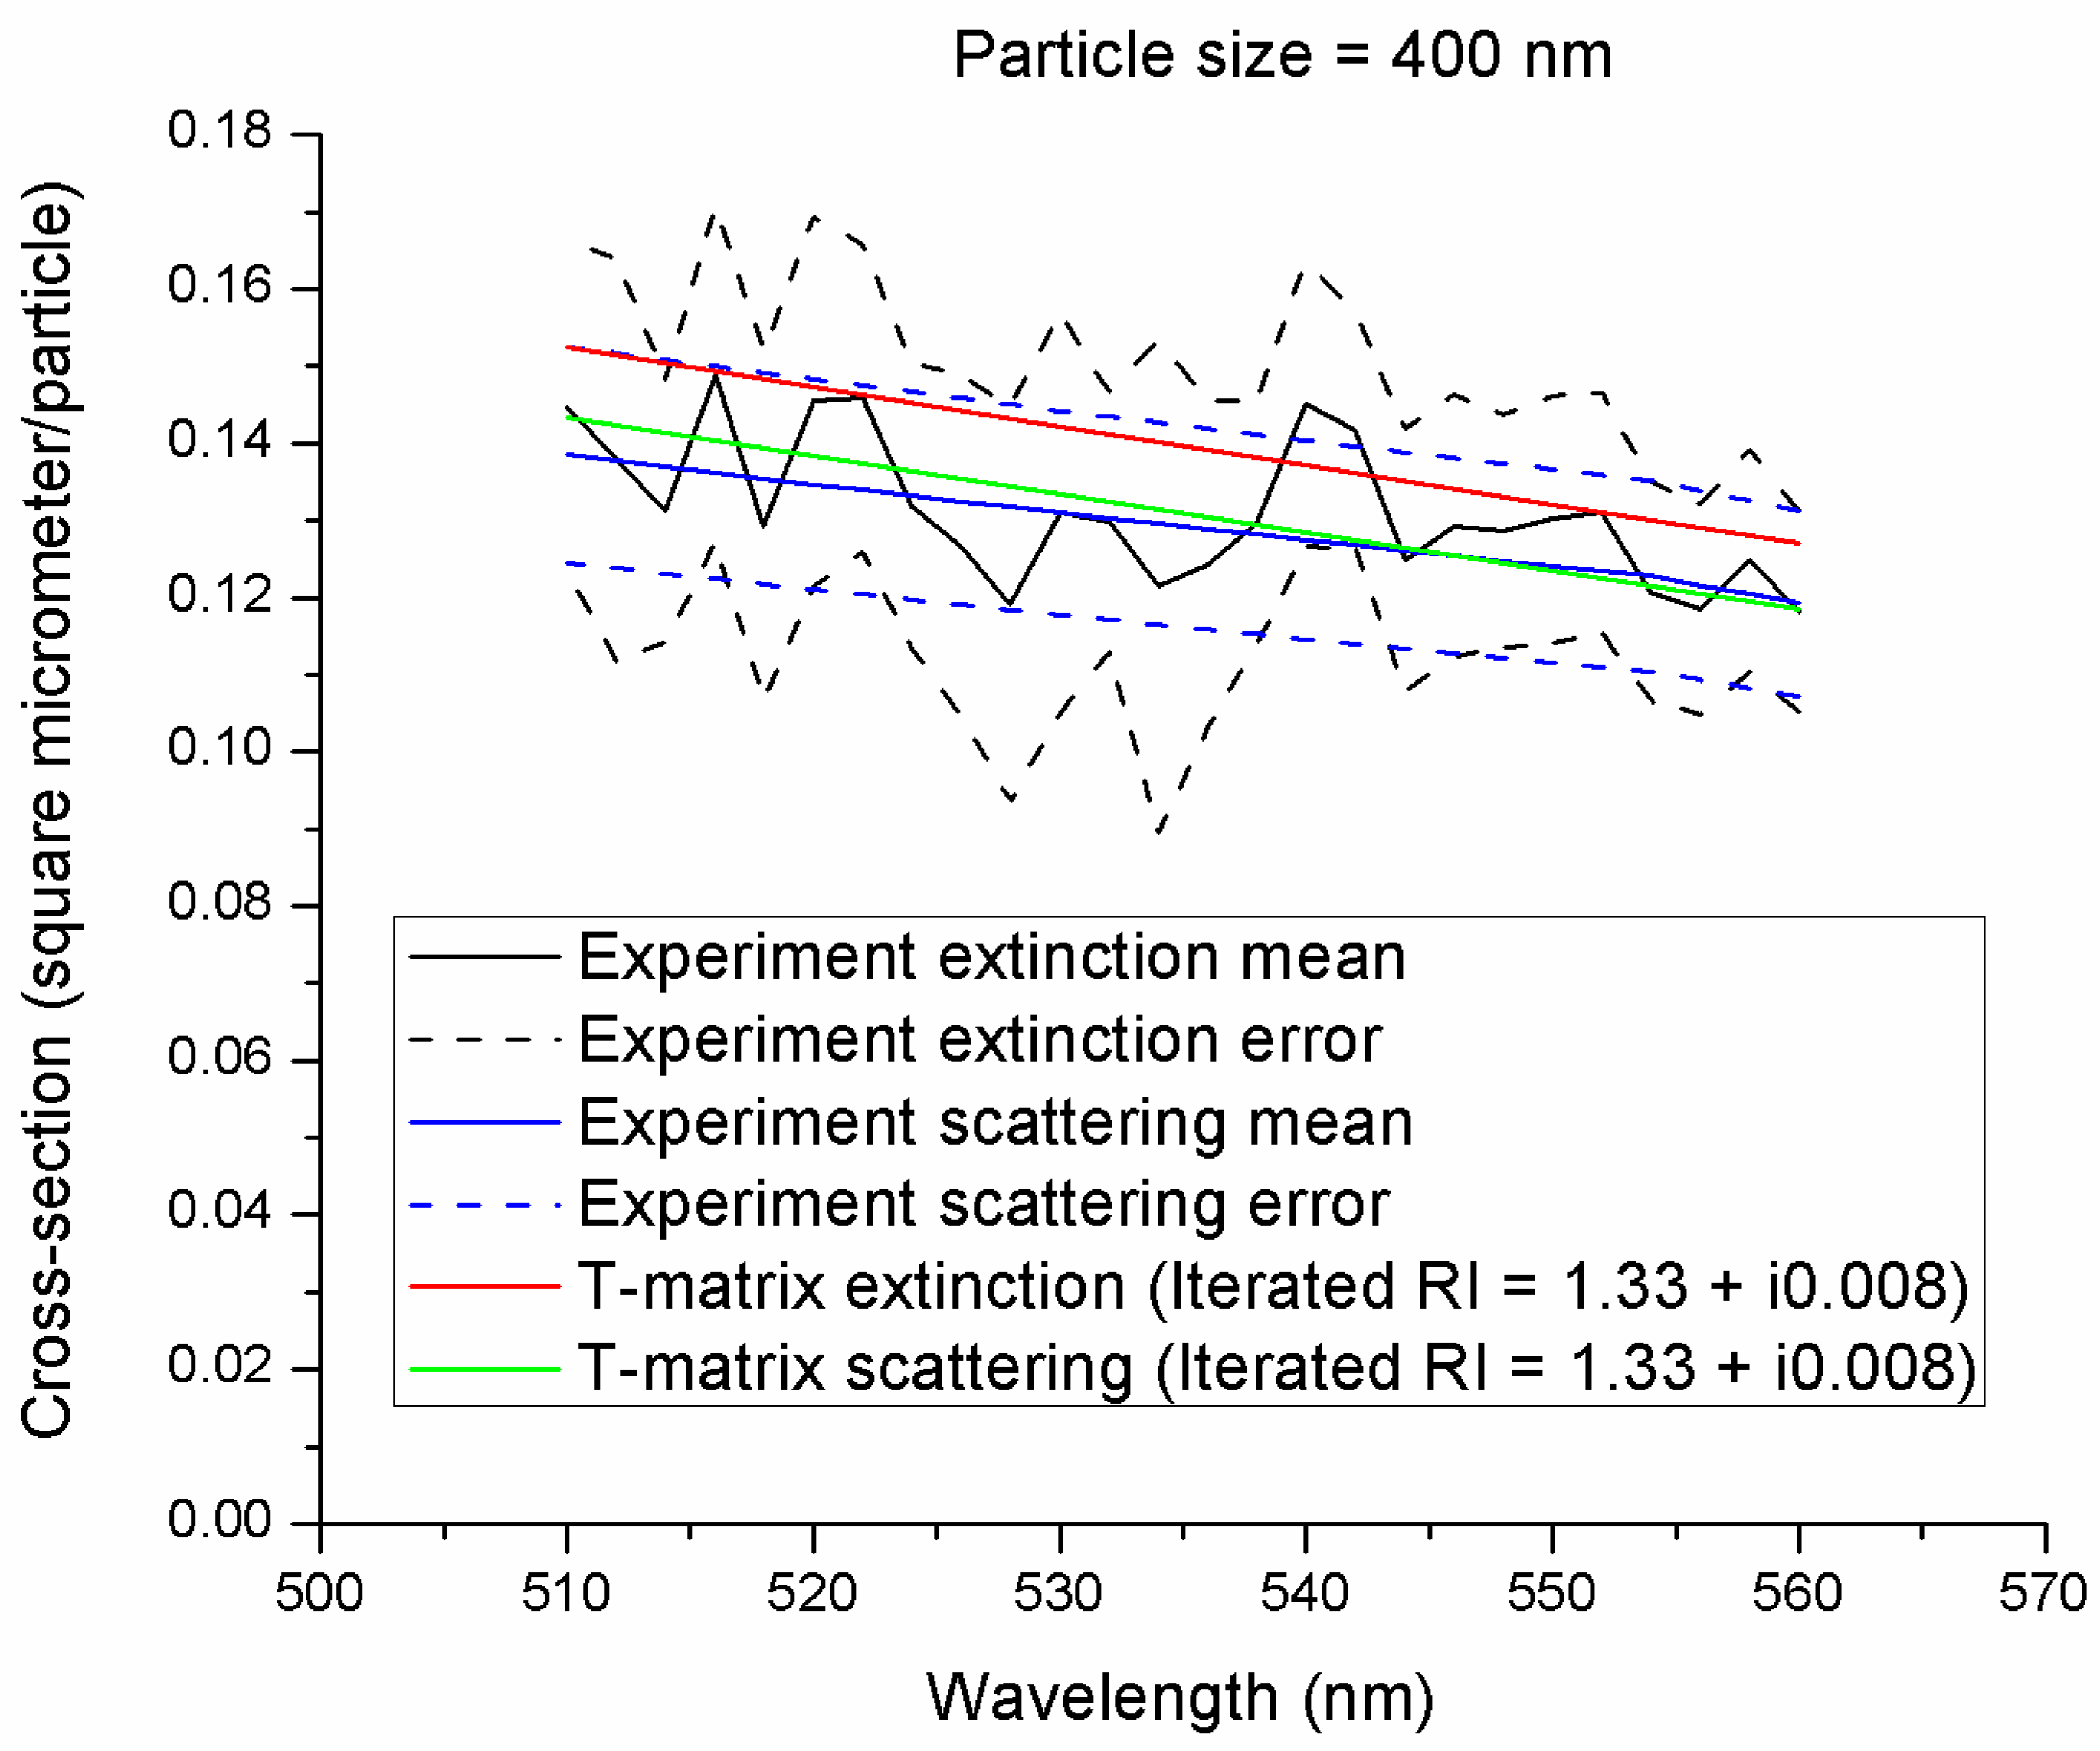
Figure 7 show the experimental results, the T-matrix calculations of SSA, and the refractive indices used to reproduce the experimental results. For 200-nm, 300-nm, and 400-nm particles, differences in the experimental average SSA and T-matrix modeled average SSA values for the wavelength range (510–560 nm) were 1%, 2%, and 5%, respectively. The T-matrix results were not only compared with the measured SSA values, but also with the extinction and scattering cross-sections, as shown in
Figure 8,
Figure 9 and
Figure 10, to ensure that the determined refractive indices used accurately reproduced all of the measured optical properties.
The tube furnace results are not consistent with the earlier findings of Benko [
59]. The real part of the RI decreased with increasing particle size. However, the imaginary part showed a very slight decrease with increasing particle size. In all cases, a RI that is independent of the wavelength was sufficient to represent SSA values over the range of wavelengths from 510–560 nm. The real part of the RI ranges from 1.33–1.74, while the imaginary portion hardly changes (i0.008–i0.009). Two of these real RI values are higher than the effective refractive index of 1.41 at λ = 565 nm that was previously determined for fresh smoke [
68]; only one was in the range of the real refractive index obtained by McMeeking [
69,
70] (1.56–1.59). All were slightly lower than other literature values of the imaginary part, which ranged from 0.0093–0.1 [
64,
71]. However, our values lie within the range of FLAME I and II observations. For particle diameters ranging from 200 nm to 570 nm, the RI was estimated to range from 1.55 to 1.80 for the real part, and 0.01–0.50 for the imaginary part, which increased with increasing density of the particles [
49].
While the SSA values seem to be constant and independent of the wavelength of light, the extinction and scattering cross-sections show wavelength dependence. Both quantities decrease with increasing wavelengths of light. In the calculations, the refractive indices were adjusted to reproduce the experimental values of extinction and scattering cross-sections. Reproducing the SSA alone will not lead to the correct refractive index.
We analyzed the monomer diameter size distributions, specifically the uncertainty while sampling from the chamber and impinger, to see the impact of polydispersity on the calculated cross-sections that assumed monodispersity. The uncertainty for both the impinger samples and chamber samples were nearly the same, and there was no size overlap between the selected sizes. When polydispersity was considered, the standard deviation in SSA values for impinger samples was about 6% for the 300-nm particles and 5% for the 400-nm particles. For the chamber samples, the standard deviation was even smaller, and it was less than 1% for all sizes.
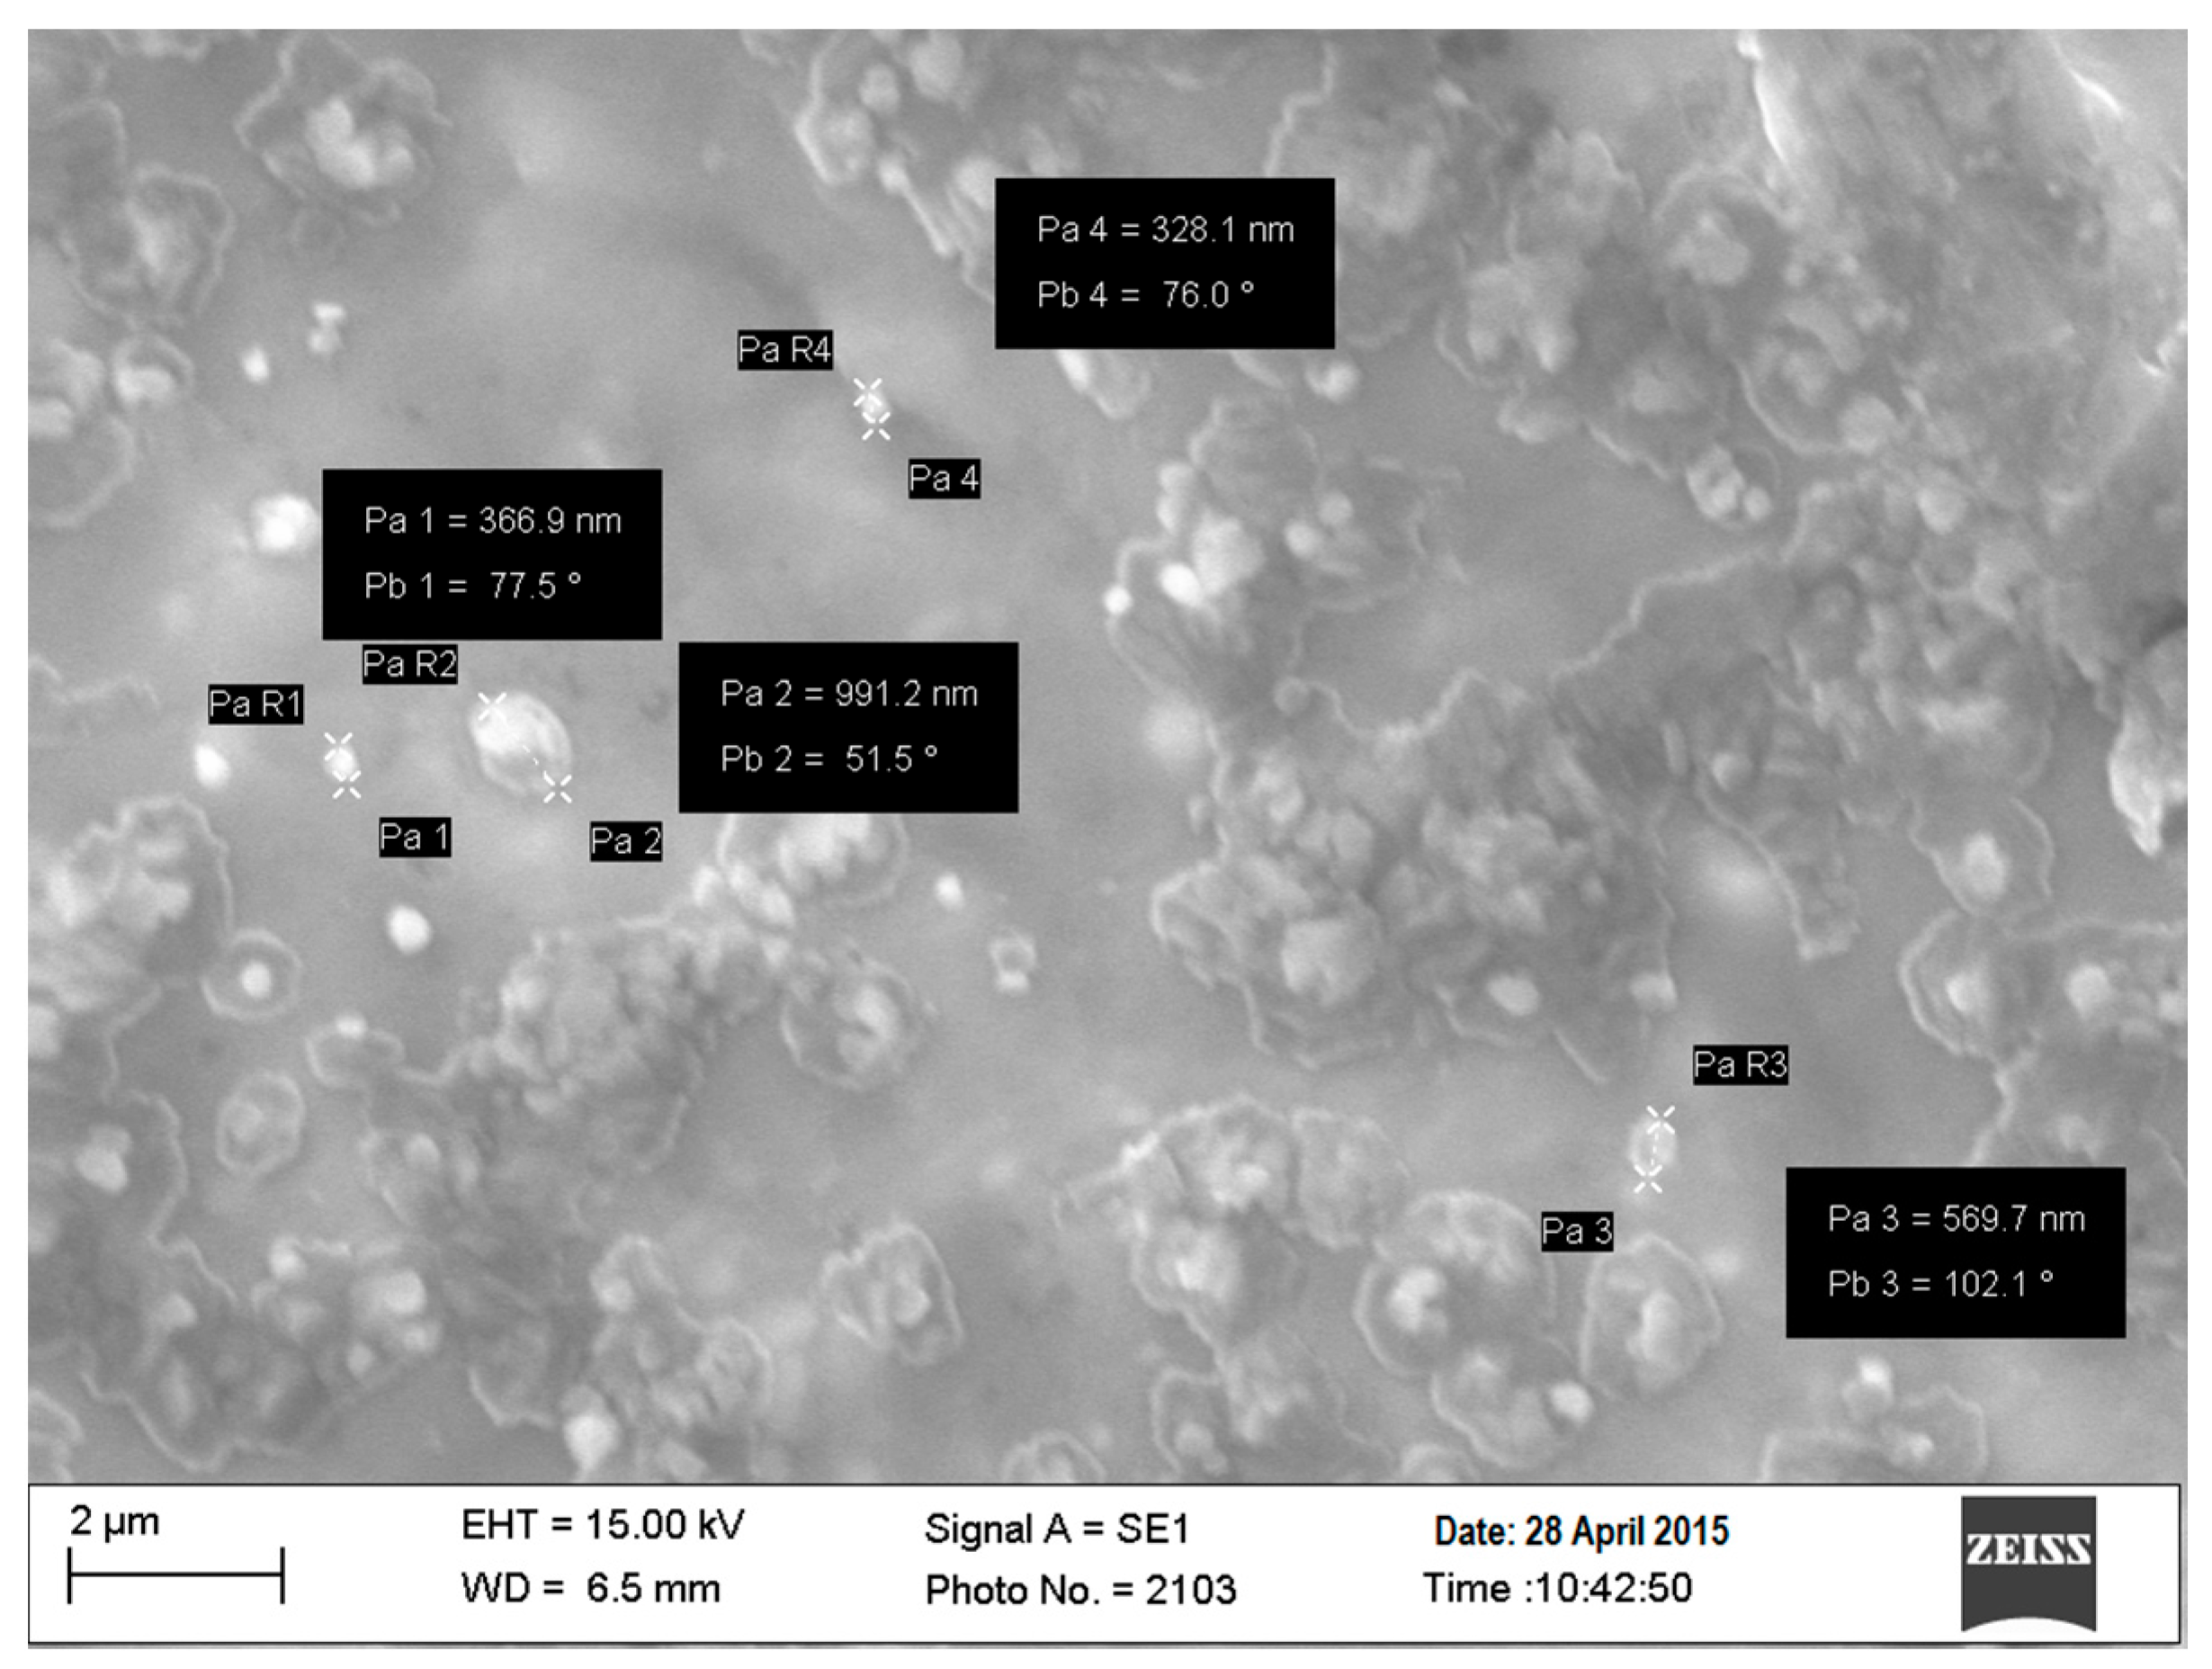
The scanning electron microscope images of the BB filter samples obtained from the open fire and tube furnace burning of pine are shown in
Figure 11 and
Figure 12, respectively. The images from filter samples were used to extract information for the T-matrix calculation. For each image used for the calculation, pixel resolution = 1024 (height) × 768 (width) and bits per pixel (or bit depth) = 8. Image magnification can be up to 10 nanometers (50 times less resolution than a TEM). The shapes of the particles were prolate spheroids. The lengths of the semi-major axis and semi-minor axis were measured using software ImageJ. Up to 5–10 images were taken, and the volume equivalent radius was calculated from
, where
a is the horizontal axis, and
b is the vertical axis (axis of rotation) of the prolate spheroid. The minimum volume equivalent radius was 53.6 nm ± 10.9, and the maximum volume equivalent radius was 105.49 nm ± 10.9 for filter samples from the indoor tube furnace. For the open fire burn, the maximum was 412 ± 81 nm, and the minimum was 126 nm ± 81. The aspect ratio used for the calculation was 0.7, which was the same for both the log-normal and the power-law distributions. The geometric mean of the obtained equivalent radii was then calculated. For the log-normal distribution, the geometric mean diameter was 68.3 nm, and the square of log of the geometric standard deviation (one of the input parameters for the calculation) was 0.048. For the power-law distribution, a minimum radius of 53.5 nm and a maximum radius of 105.49 nm were used for the calculation.
Table 1 and
Table 2 provide the input data derived from different images both for the open fire and tube furnace burns.
The effective radius of polydisperse particles collected during the open fire was approximately 245 nm, whereas the effective radius for the tube furnace burn was around 76 nm. The effective radius was obtained from the volume equivalent radii for the power-law (Equation (14)) and the log-normal (Equation (15)) distributions.
Here, r1 and r2 are the minimum and maximum radii of the size distribution, and rg and σg are the geometric mean and variance of the radii of the size distribution.
The filter samples for both the open fire and the indoor tube furnace burn were collected in the same manner, and the images were taken soon after the filter samples were collected. It is fair to assume that they both represent fresh BB samples. For the T-matrix calculations using the images, the power-law and log-normal distributions were used. To reproduce the SSA value of 0.958 for fresh BB in the laboratory, a RI of 1.88 + i0.008 was determined. The SSA values remained the same for log-normal as well as power-law size distributions, and for both open fire and tube furnace samples. When taking into account the size distribution, the real part of the RI increased compared with the results based on spheres. The small number of images used (5–10), and the limited resolution of SEM used here compared with transmission electron microscopy (TEM) can also contribute to the uncertainty in determining the volume equivalent radius of the filter samples. The assumption of the monodisperse mean (or volume-equivalent) diameter of the soot monomer may neglect the effect of monomer polydispersity on the optical properties of soot aggregates. Previous studies suggested that performing calculations using a monodisperse diameter may neglect the effect of multiple internal scattering on radiative properties of BB fractal aggregates [
72,
73]. Studies have shown that the light scattering of fresh BB aggregates were influenced by monomer polydispersity [
74].
5. Conclusions
The RI is an important parameter in describing the radiative impacts of aerosols. It is important to constrain the RI of aerosol components, since there is still significant uncertainty regarding the RI of biomass burning aerosols. A wide range of values has been reported in the literature, and the trends of the dependence of the RI on size are inconsistent. For example, the imaginary part of the RI for brown carbon at 350 nm was reported to be 0.0082 [
75] and 0.009 at 405 nm [
76]. A recent study, however, measured the RI of atmospheric BrC, originating from various emission sources and secondary processes, and found the imaginary part of the RI to be four times higher: 0.042 at 365 nm, and 0.037 at 405 nm [
77].
Several factors contribute to the calculated uncertainties. These factors include uncertainties in aerosol species mass concentration, unknown size distributions, the poorly characterized RI of materials, and chemical species making up the aerosols, particle morphology, burning conditions, and the age of the aerosols [
78]. We have observed fresh BB aerosols that are more scattering than previous observations, and would be represented by a lower imaginary portion of the RI than previously determined. The main results of this work can be summarized as follows:
The refractive index used for strongly absorbing BB aerosols produced from the combustion of hydrocarbons and diesel cannot be used for BB aerosols, as these calculations resulted in SSA values smaller than the experimentally measured values. The RI for these types of BB aerosols suggested in the literature should not be used for biomass burning aerosols.
Our results show that the refractive index exhibited wavelength dependence for the impinger samples, and was nearly independent of the wavelength of incident light used for tube furnace samples. This suggests that the RI depends more strongly on the particle size and structure rather than wavelength in the 500–580 nm region. There is no clear RI trend with burning conditions, as the real part of the refractive index increased with increasing particle size for the open fire burn and decreased with increasing particle size for the tube furnace burn. The imaginary part decreased slightly with increasing particle size. The scattering and extinction cross-sections showed wavelength dependence. Both decreased with increasing wavelength for both experimental and calculated results.
Our results also suggest that using the SSA alone will lead to an error in extracting the refractive index, since one can produce different combinations of the cross-sections from different real and imaginary RI, but produce the same SSA. Therefore, the refractive index should also reproduce all of the cross-sections. Burning conditions can affect the optical properties of biomass burning aerosols, as shown by the different results for outdoor burning and the tube furnace burning of white pine in our work. For BB particles collected in distilled water using an impinger, hygroscopic mass growth must have influenced the refractive index, and hence the extinction, scattering, and SSA values of the aerosol. Furthermore, the wavelength dependence of the RI index suggests a change in the chemical composition and structure while in solution or upon nebulization. Since the fidelity of particles collected with an impinger is quite poor, this method does not represent fresh BB aerosols as we previously claimed, and should not be used to access their optical properties.
We recommend more carefully designed laboratory experiments to measure scattering and absorption cross-sections, and the use of the T-matrix or more robust versions of the T-matrix model such as the Discrete-Dipole Scattering (DDSCAT) method to extract an accurate RI for each sample as a function of size, shape, chemical composition, mass, aging stage, burn stage, and burn conditions.


