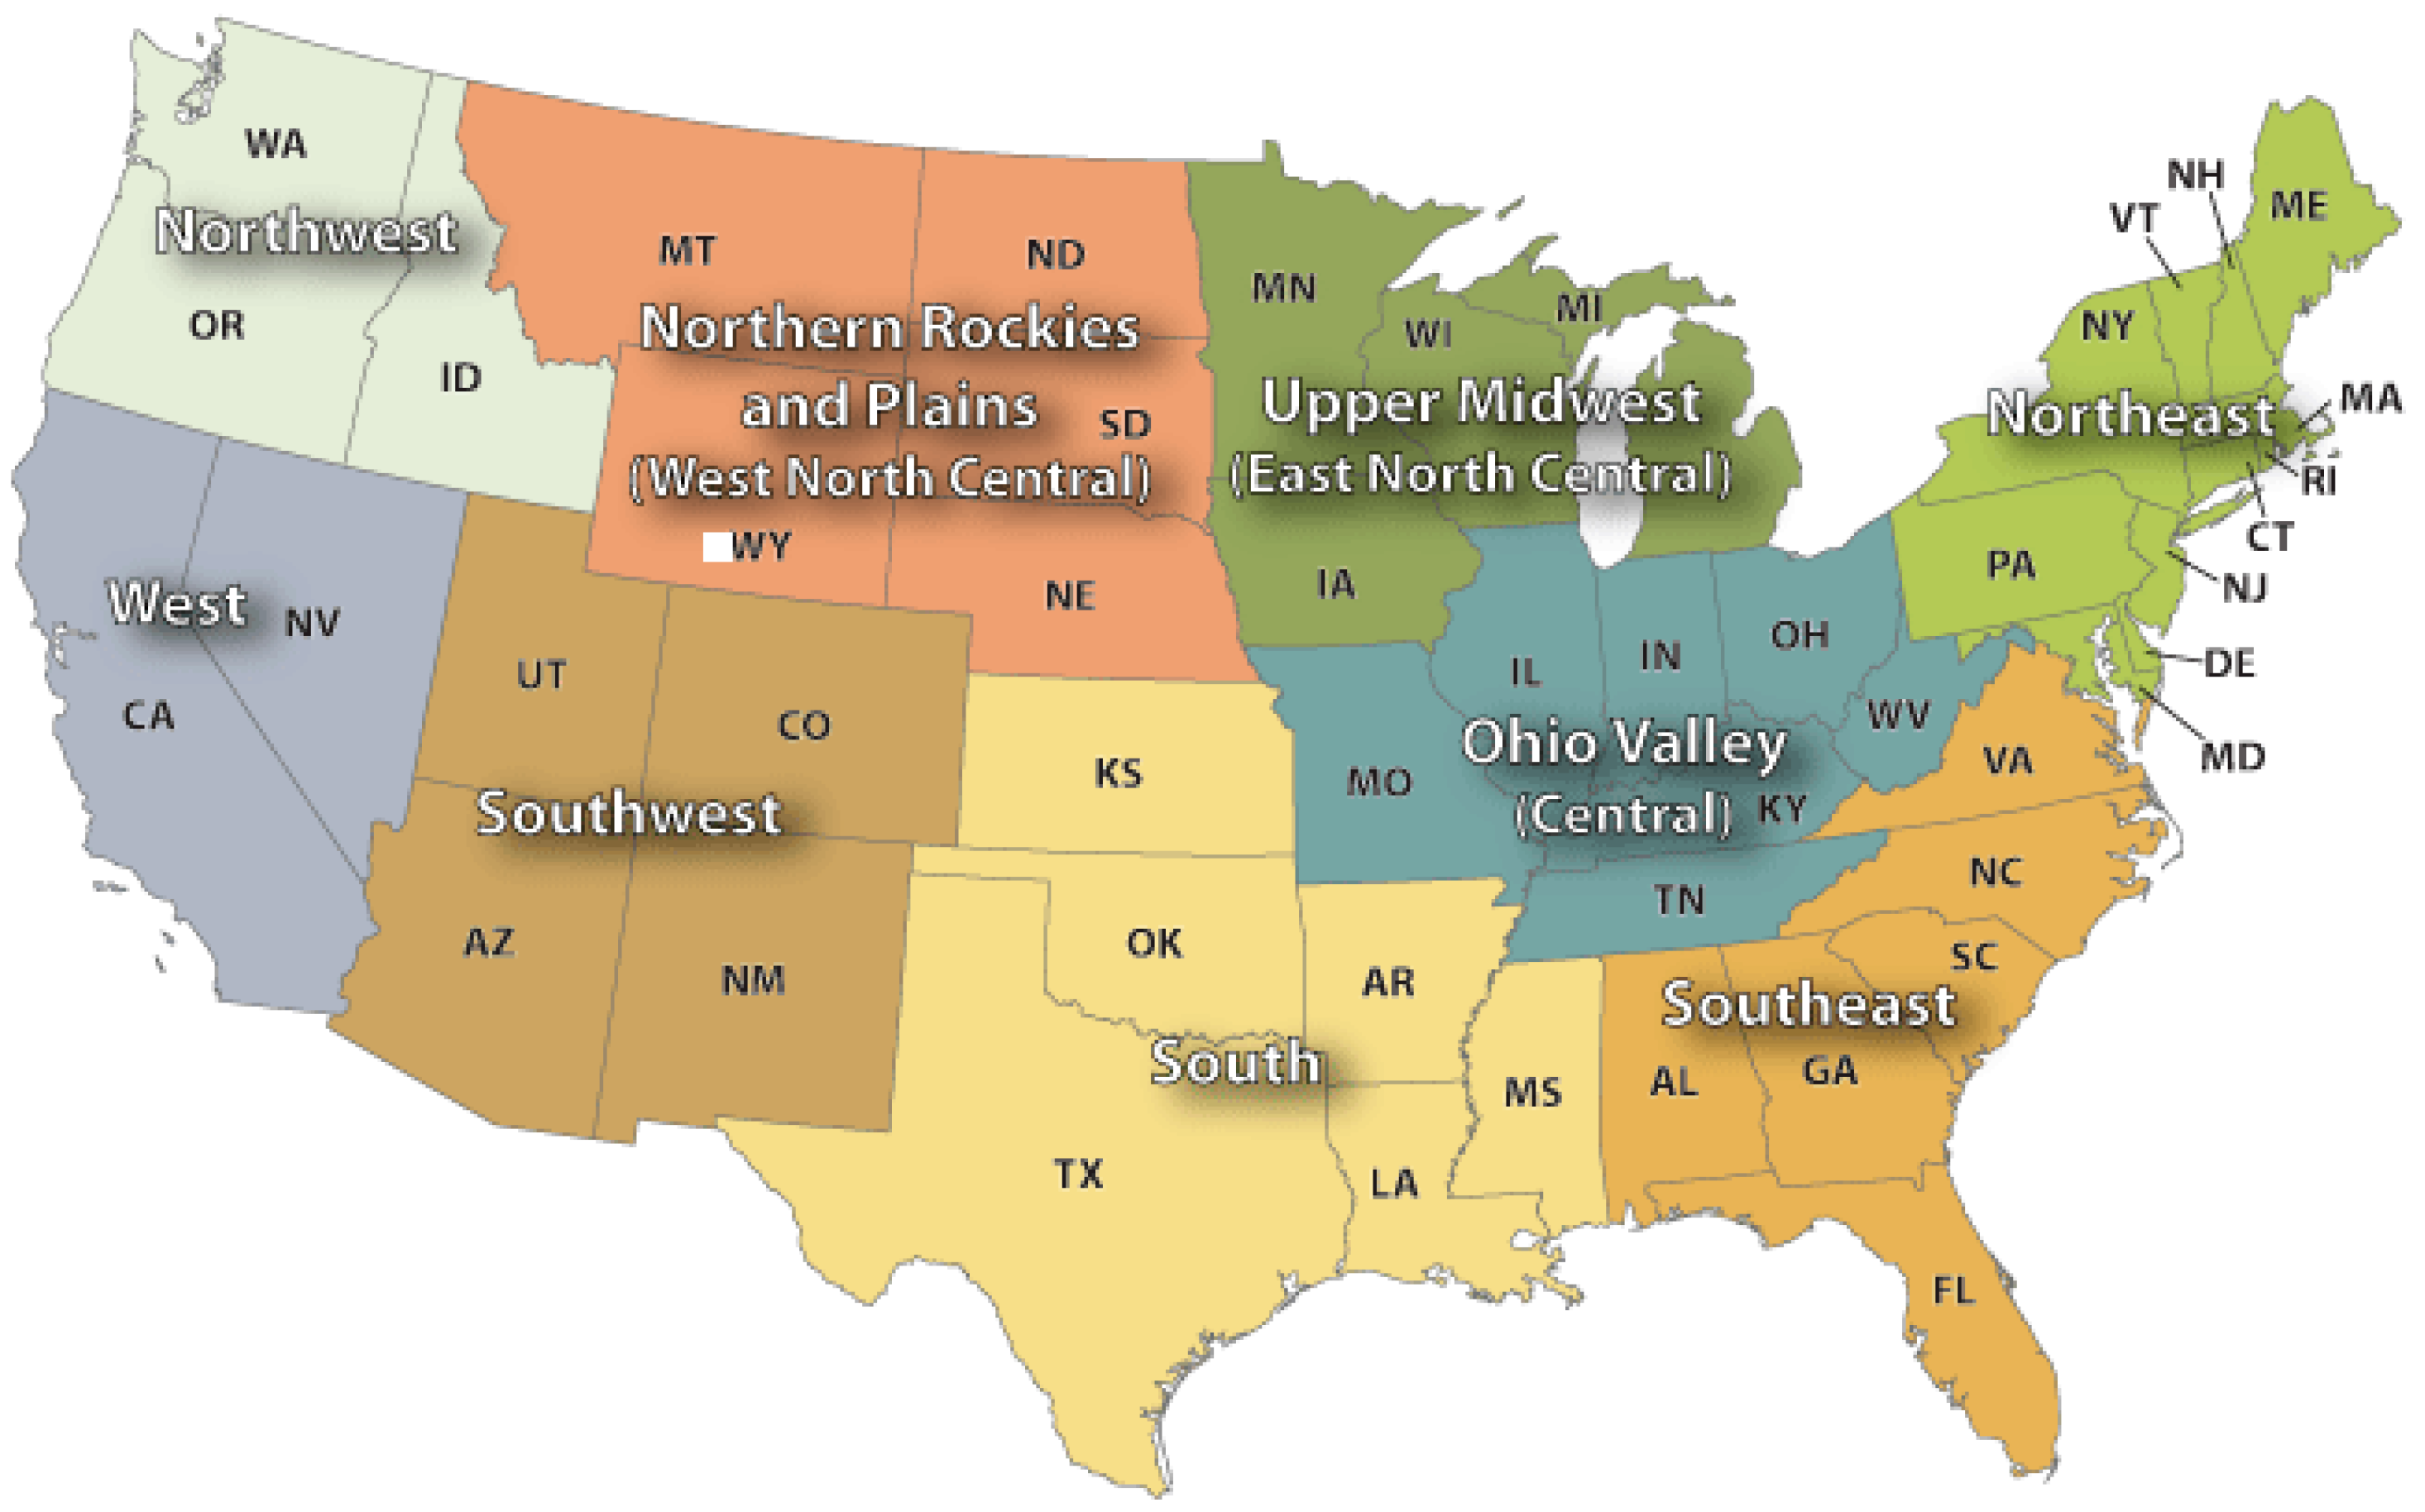
3.1. Observational Results 1900–2015 in Individual Climate Regions
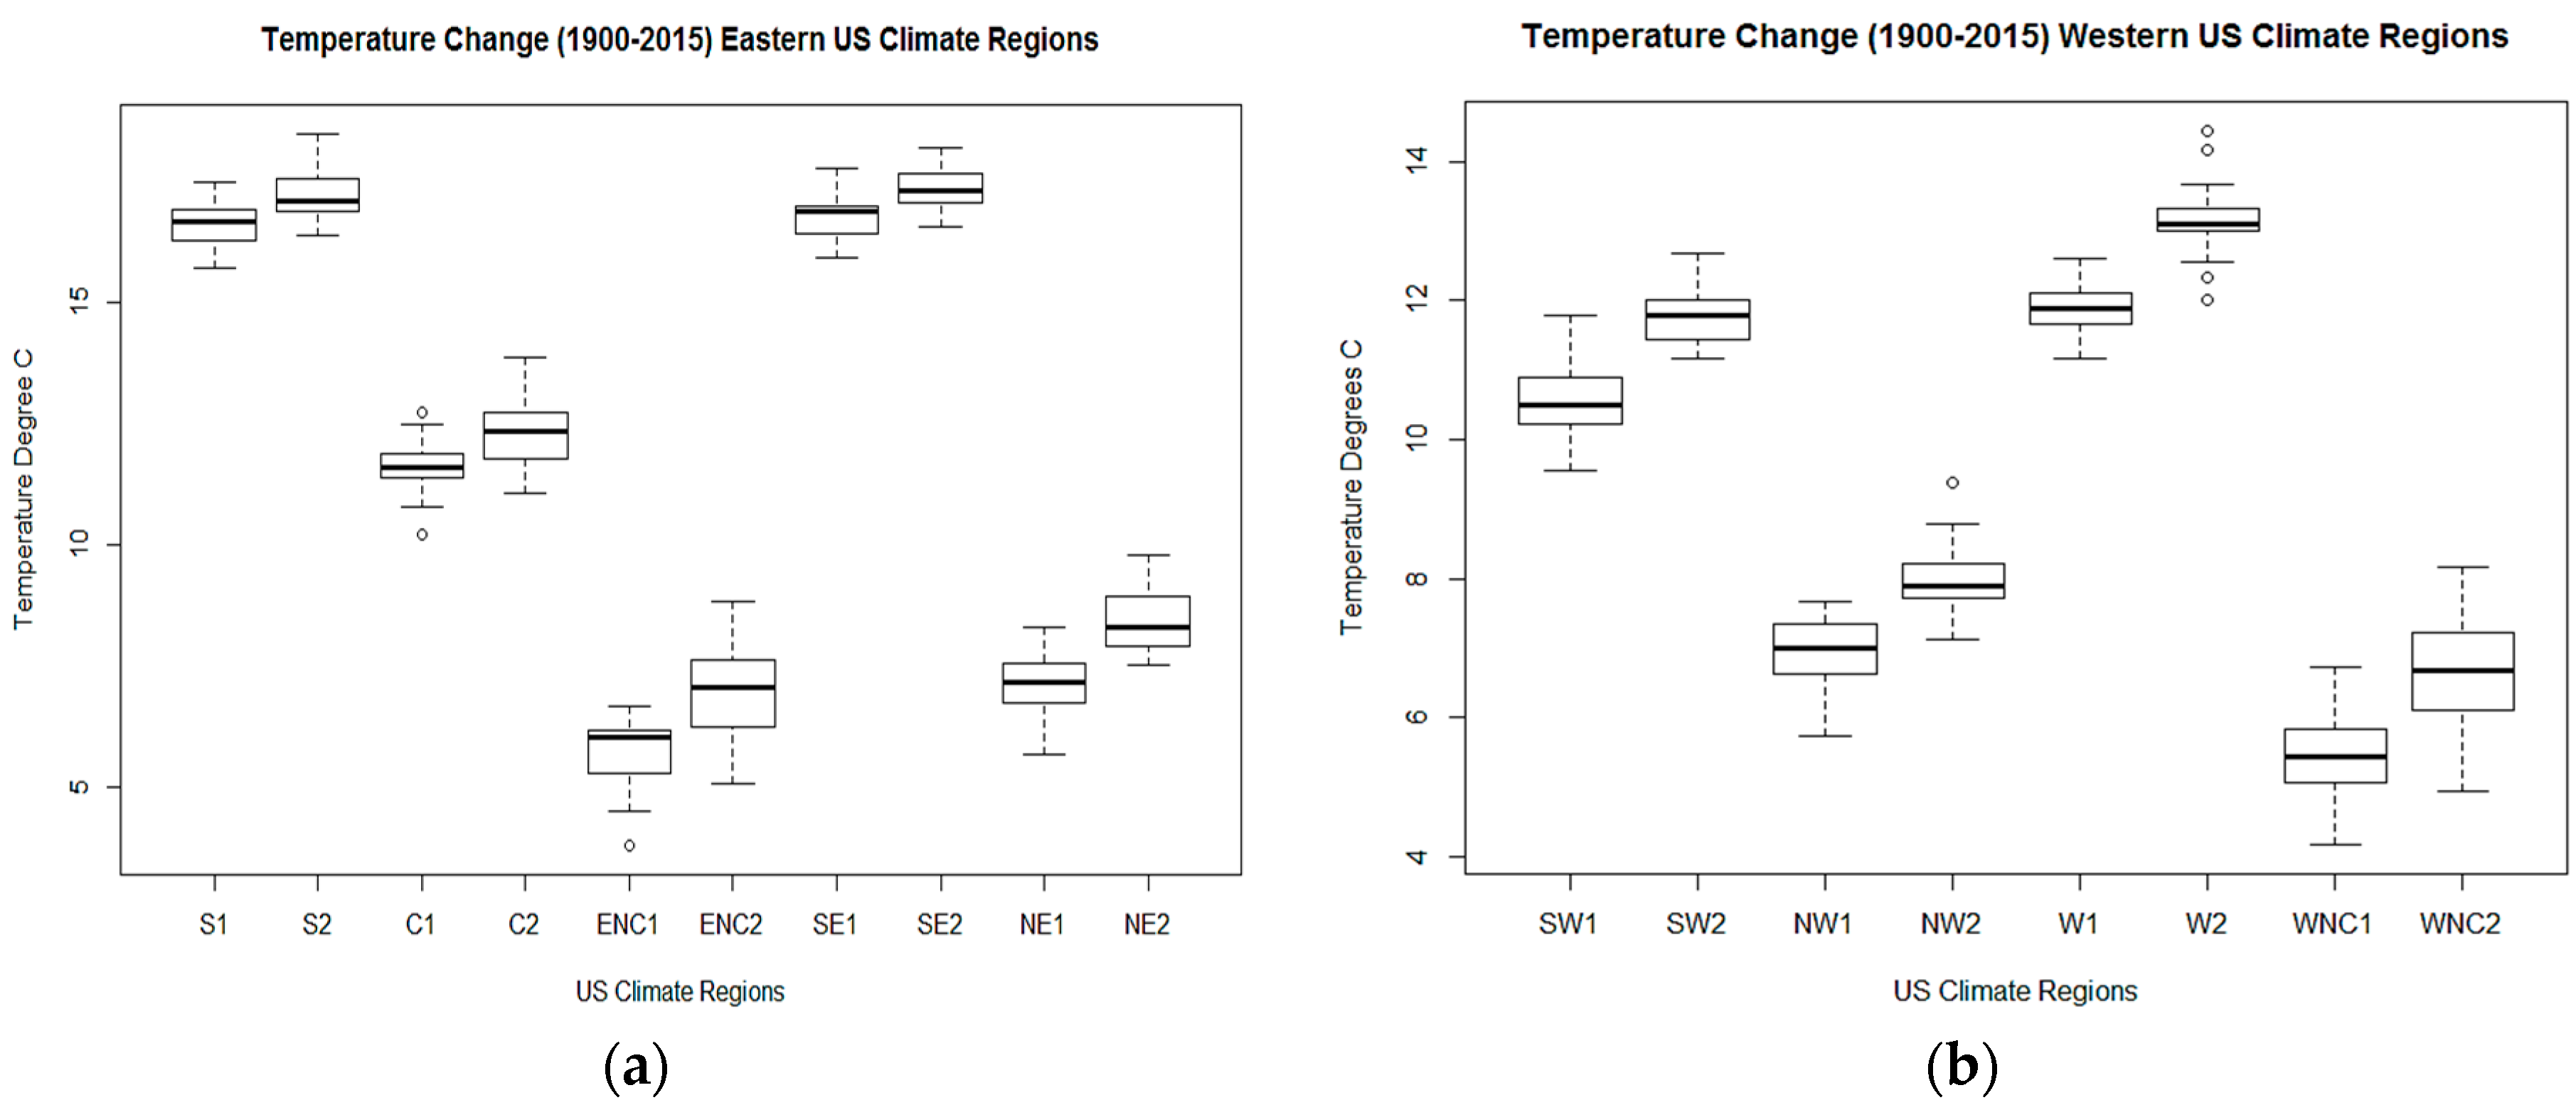
To investigate the temperature changes within the 20th century we compare the averages of annual temperatures within the 21 year segments of years 1900–1920 and 1995–2015 in the nine individual climate regions. For simplicity of notation we refer to the first mean by its initial year (1900) and to the second mean by its final year (2015). For each of the time series (sequence of twenty one years), we have tested the hypothesis of a zero autocorrelation. In all 36 cases (18 temperature and 18 precipitation time series), the
p-value against the null hypothesis was larger than 0.05. Thus the hypothesis of zero autocorrelation cannot be rejected and a simple statistics for equality of two means can be used. The results are summarized in the box diagrams (
Figure 2) and in
Table 1. The
p-values in
Table 1 are related to the hypothesis that the temperature means of 1900–1920 and 1995–2015 are the same (Welch two sample
t-test).
We recognize that the t-statistics may lead to improper p-values if the parent distribution is not Gaussian. To investigate the impact of the Gaussian assumption, we considered the Mann Whitney rank sum test to test the null hypothesis of equality of the parent distributions. That test is a nonparametric test. The resulting p-values and confidence intervals are similar to the results reported by the t-test.
The temperature increased between 1900 and 2015 in all nine US climate regions, and the increases were statistically significant, as demonstrated by the
p-values in
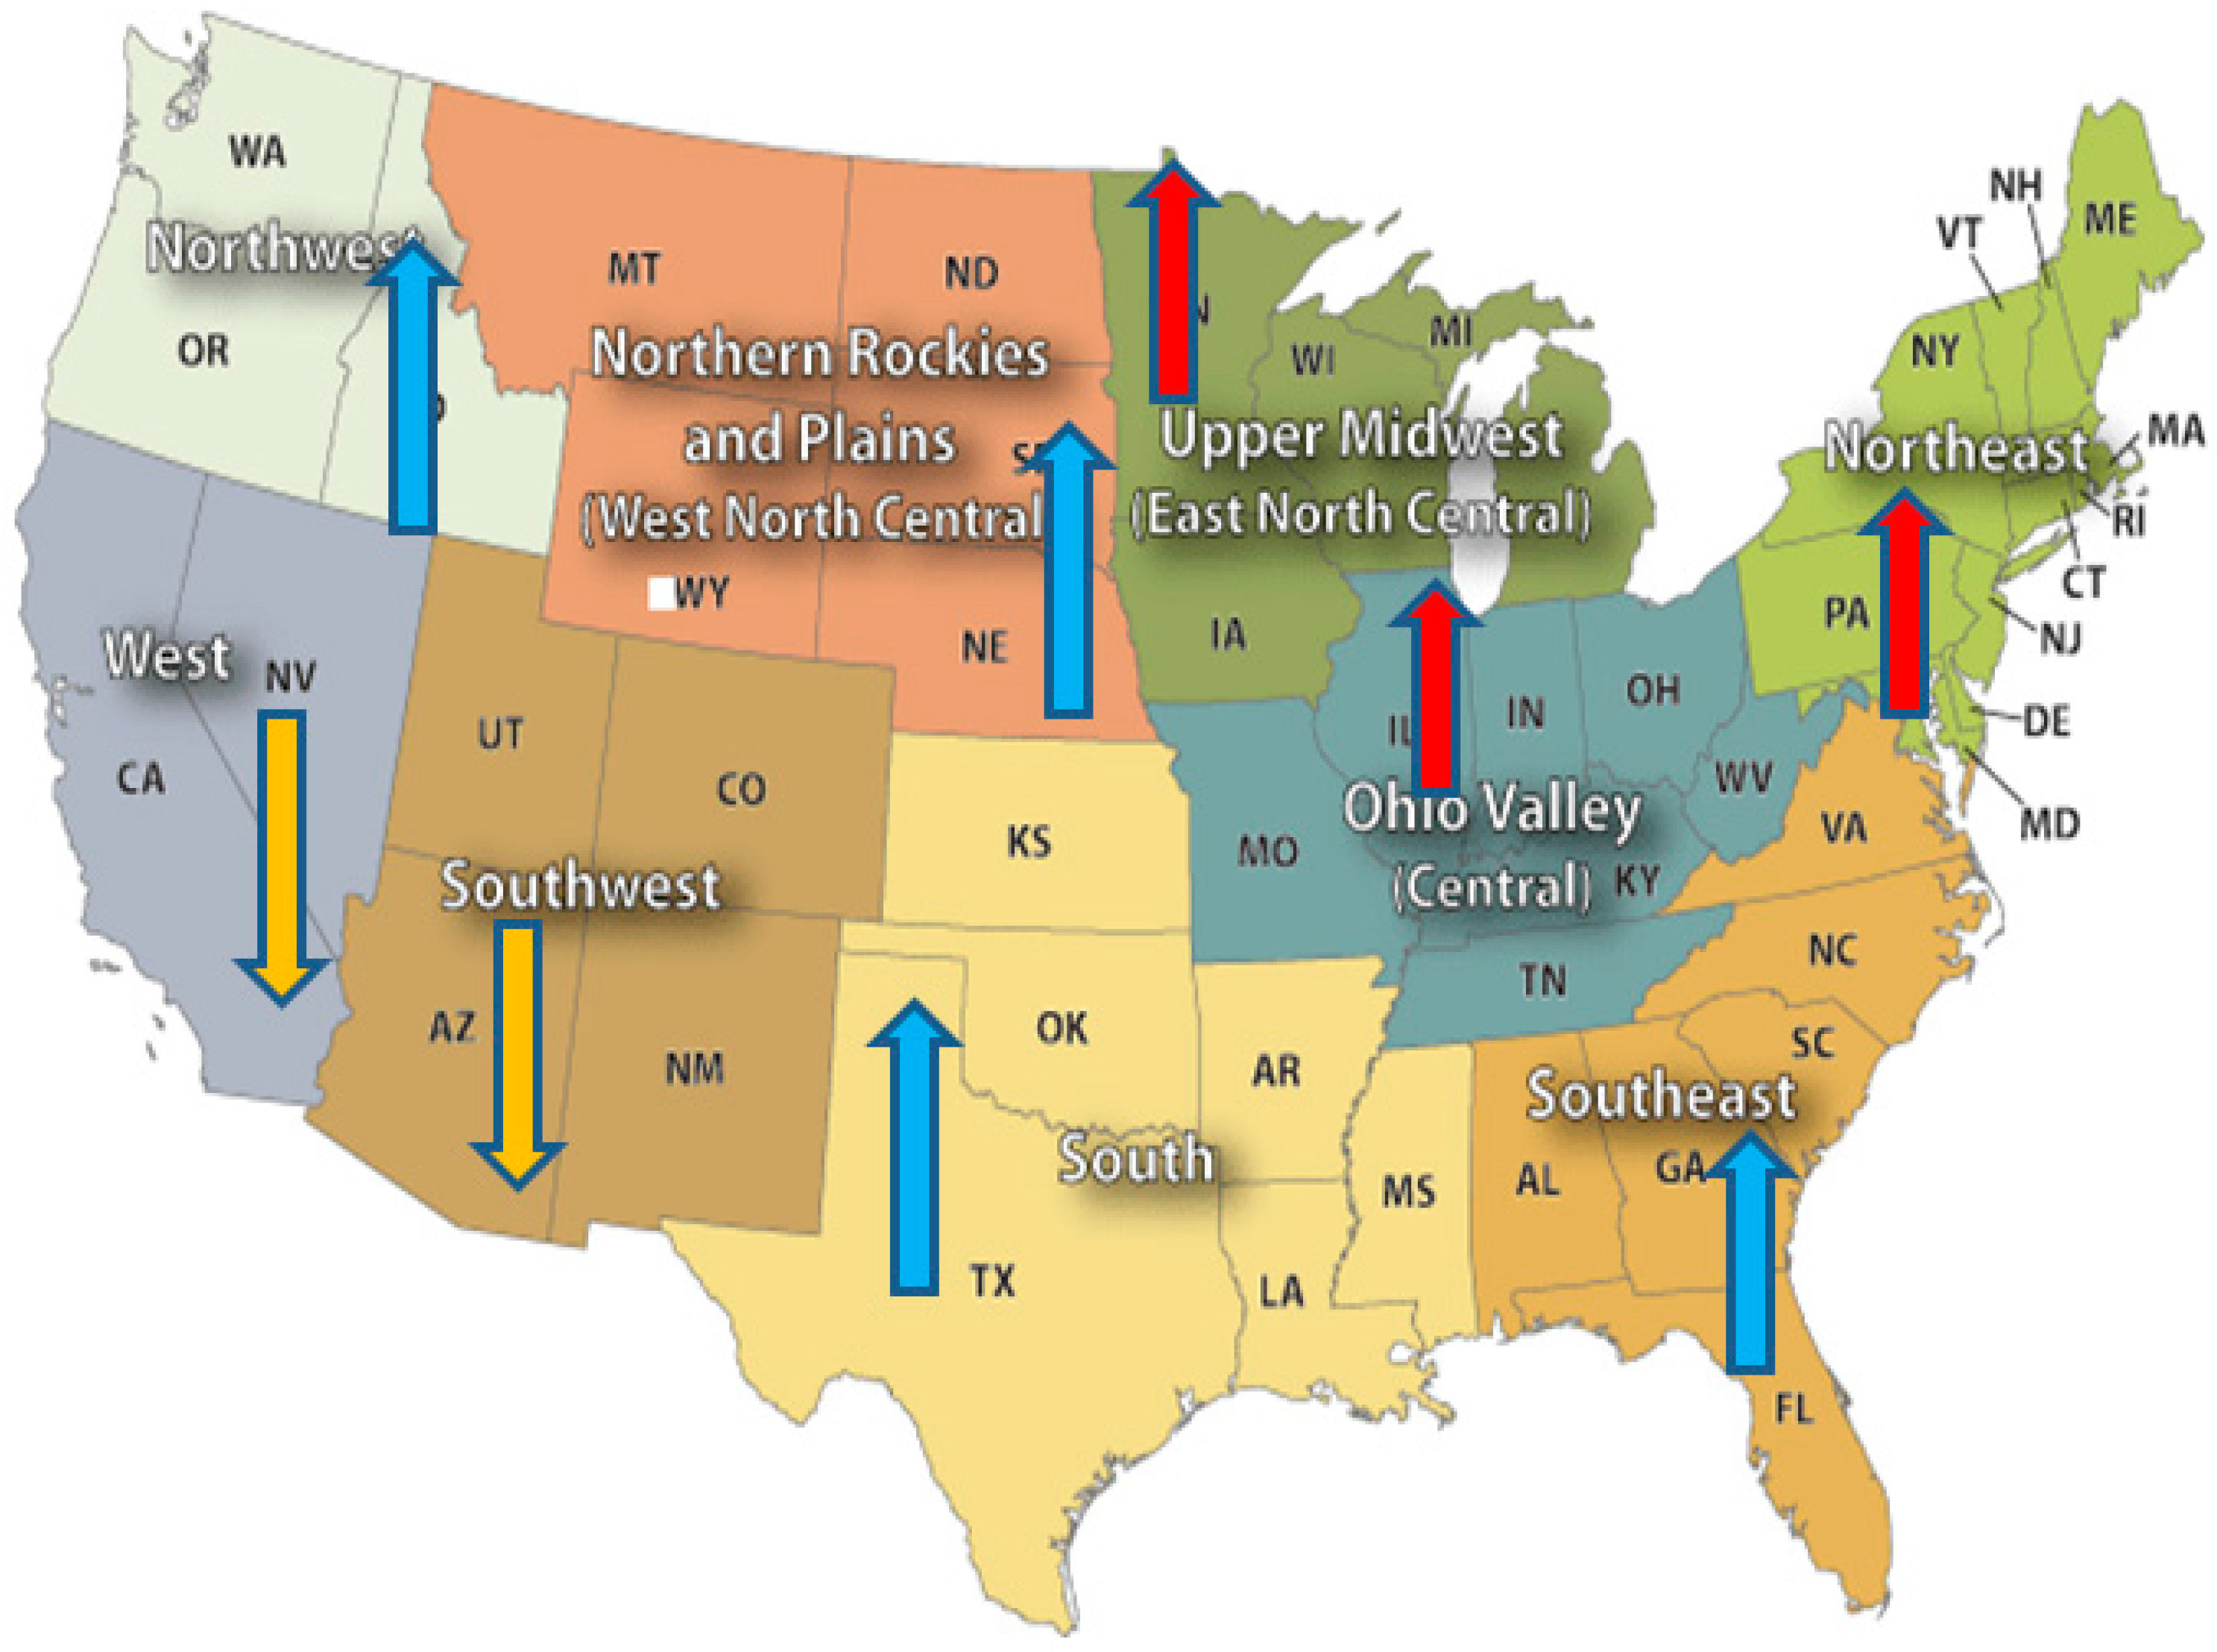
Table 1. The smallest temperature increase of 0.58 °C occurred in the Southeast region, which had the highest mean temperature in 1900 (16.78 °C). The largest temperature increase of 1.33 °C is observed in the Northeast.
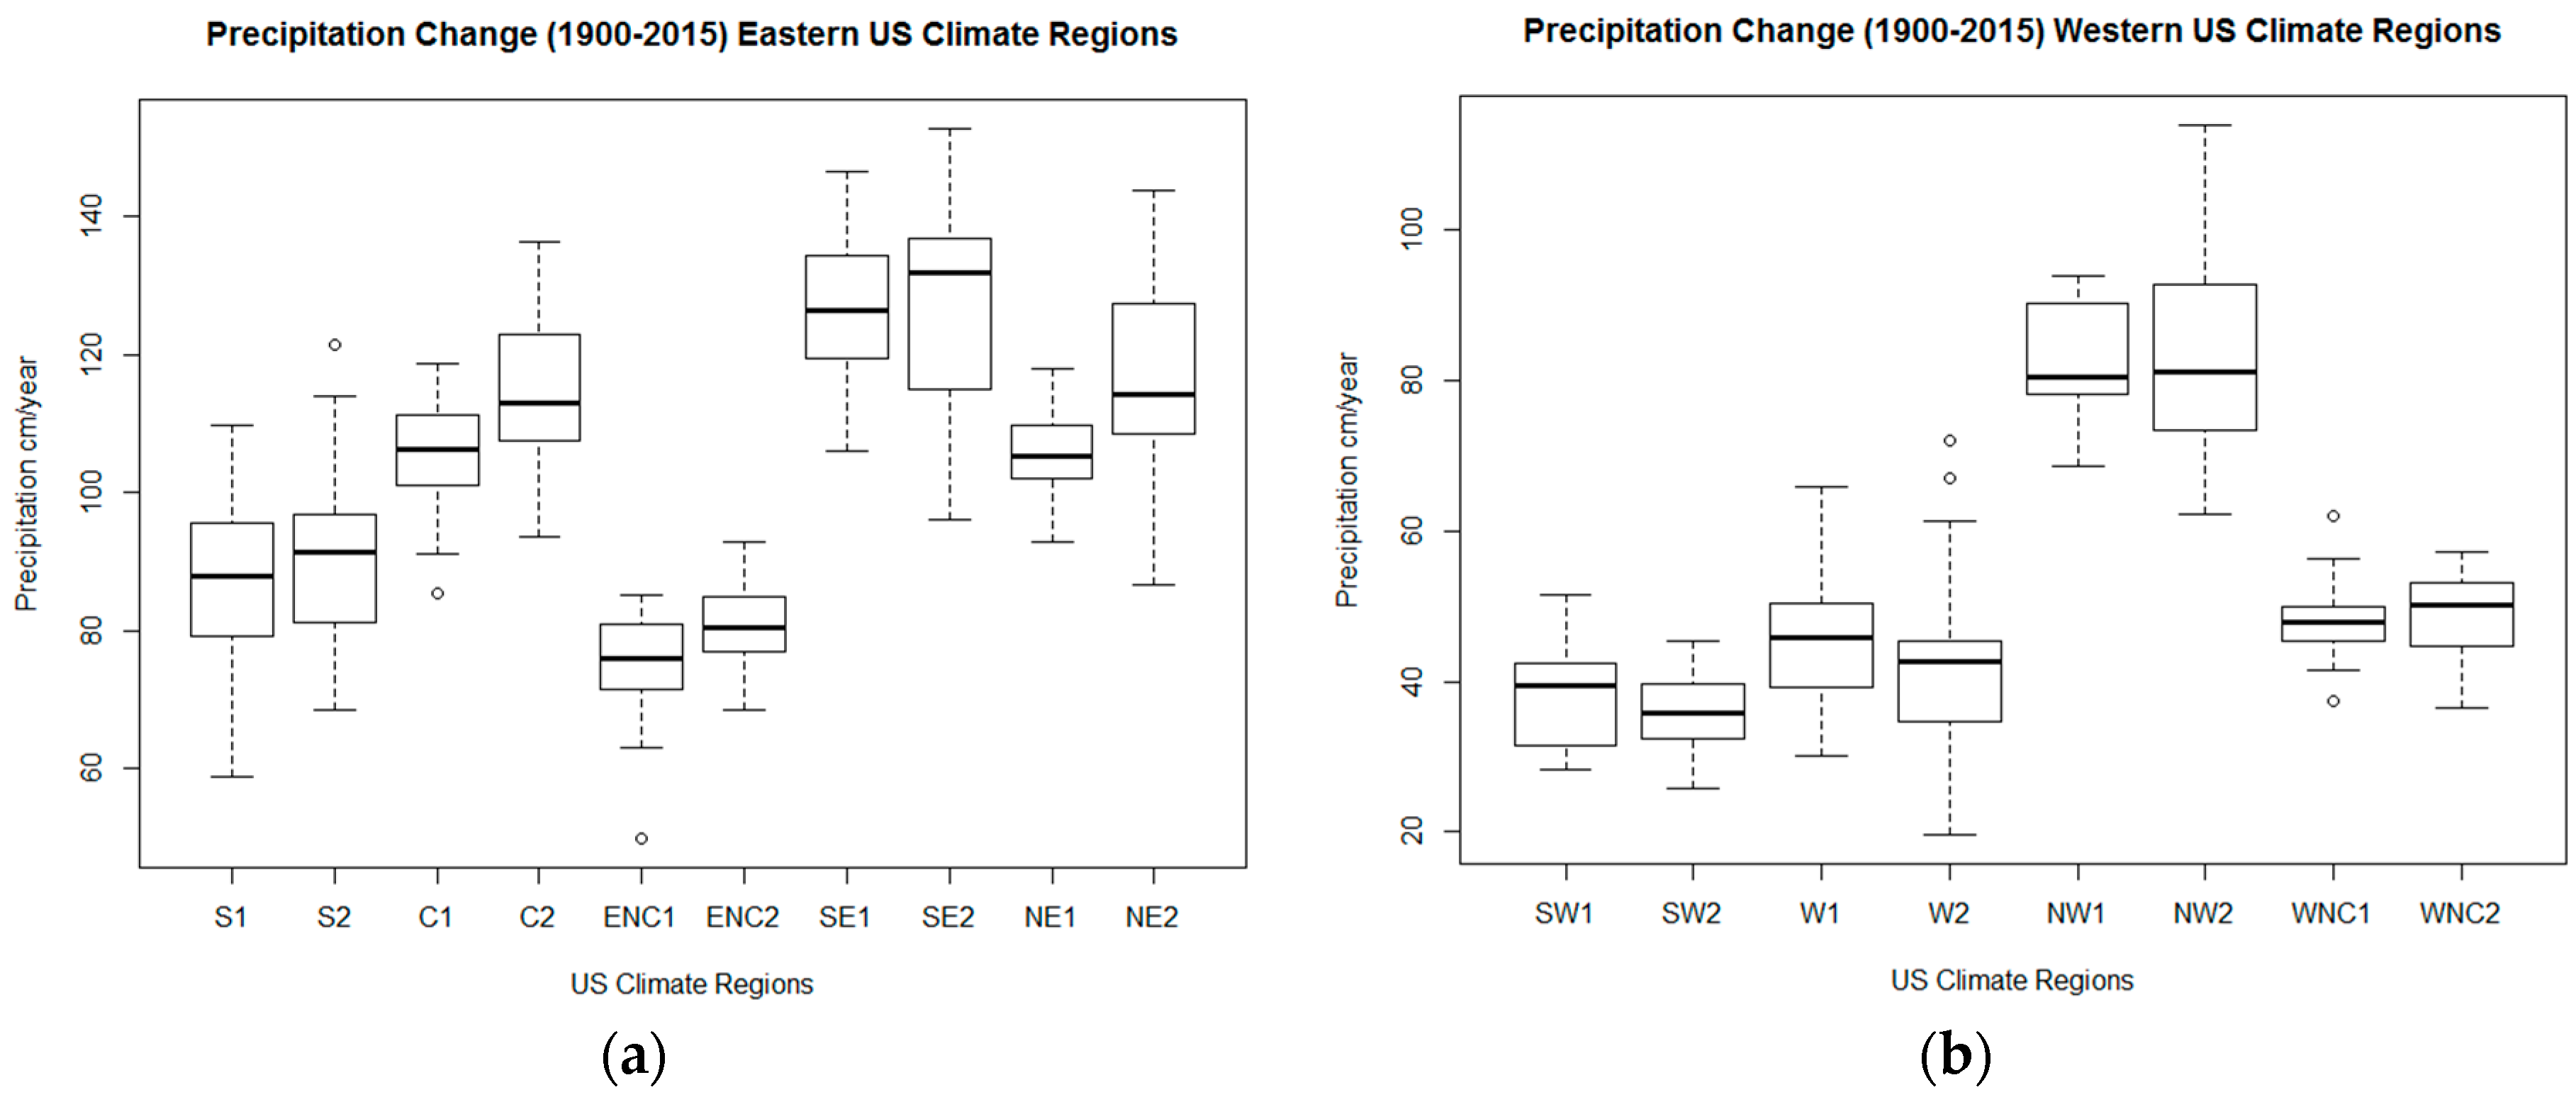
The results concerning precipitation in each of the climate regions are summarized in
Figure 3 and in
Table 2. The largest precipitation increase between 1900 and 2015 of 10.24 cm/year is observed in the Northeast, while the largest decrease (−2.05 cm/year) is in the Southwest region. The
p-values in
Table 2 are evaluations of the hypothesis that the precipitation means for 1900–1920 and 1995–2015 for annual precipitation are the same. We note that the precipitation increased in all regions, except in the Southwest and West regions (
Figure 4). However, the precipitation changes were not statistically significant (at the 95% confidence level), except in the Central, East-North-Central, and Northeast regions. This means that in all other regions the observed precipitation changes could have been caused by chance, while the 1900–1920 and 1995–2015 means of annual precipitation were really the same. Even in the Southwest region where the precipitation decrease is quite large (5.39%), there is a 27% (
p-value of 0.27) probability that this decrease is observed by chance while the means of 1900–1920 and 1995–2015 are in reality equal.
We also notice that the precipitation increases in the regions east of Rocky Mountains (eastern US) are always positive and, on average, considerably larger than increases in the western US. In addition, in five out of six eastern US climate regions, the precipitation increases per °C are close to or over the value of about 7%/°C given by the Clausius-Clapeyron equation [
18]. This theoretical estimate results from the hypothesis that fractional changes in precipitation should be proportional to fractional changes in equilibrium vapor pressure, which, according to the Clausius-Clapeyron equation, results in those fractional changes being also approximately proportional to the change in temperature [
19].
To summarize, we find that temperature increases between 1900 and 2015 are observed in all regions and the increases are statistically significant. Statistically significant precipitation (
Figure 4) increases are observed in three (Central, East-North-Central, and the Northeast) out of five eastern US regions. Precipitation increase is also observed in the South, Southeast, Northwest, and West-North-Central regions, but these increases are not statistically significant at the 95% confidence level. Finally, a precipitation decrease is observed in the Southwest and the West regions, with neither of them being statistically significant.
3.2. Observational Results for 1900–2015 in the Eastern and Western US
On a larger scale there is a significant difference in precipitation variability between the climate east of the Rocky Mountains (called here the eastern US) and west of the Rocky Mountains (herein the western US). Thus, we consider it useful to look at the averages of temperature and precipitation over the eastern and western US. The eastern US temperature and precipitation is obtained as an area weighted average of the S, C, ENC, SE, and NE regions. Similarly, the data for the western part of the US is obtained as an average of the SW, NW, W and WNC regions. The results are summarized in
Table 3.
The temperature increase in the western part was larger than in the eastern part of the USA (1.18 °C compared to 0.76 °C). A significant precipitation increase in the eastern part (5.07 cm/year) is contrasted with a slight (statistically not significant) decrease (−0.38 cm/year) in the western part of the USA.
The hydrological climate sensitivity, defined as the percentage change of precipitation per degree of warming, is close to 7% per 1 °C in the eastern part of the US (6.7%/°C), while it is far from that magnitude in the western part of the US (−0.6%/°C). We take this as an indication that, on average, systematically different processes leading to precipitation may occur in the eastern and the western parts of the US. Likely mechanisms are the role of the Pacific Ocean and the complex terrain in the western US. The average value of 3.5%/°C for the continental US does not mean an average response over all the continental US; rather, this is an average of two regions (western and eastern US) with vastly different responses.
3.3. CMIP5 Climate Models Simulations
For several decades, the physics-based climate models (General Circulation Models (GCM’s) or Earth System Models (ESM’s)) have provided one of the basic tools for use in our understanding of the past and current climate, as well as a tool for prediction (often called projection) of future climate changes. The current versions of climate models, the CMIP5 (the 5th phase of the Coupled Model Intercomparison Project) models, are quite successful in simulating the past global and continent-scale temperature patterns; however, the sub-continental temperature simulations are less reliable [
20].
The models’ simulation of global precipitation is generally less accurate than that of temperature [
21,
22]. At regional scales, the simulation of precipitation is even more problematic, very likely due to large uncertainties in the modeling of aerosol and cloud processes. The CMIP5 models’ simulations are often used for downscaling [
23,
24], wherein the GCM simulations are used as boundary conditions for regional models. The regional models, however, have no mechanism for correcting uncertainties and possible errors introduced by global models’ simulations.
In spite of current uncertainties, especially with respect to simulated and predicted precipitation, the models’ projections are being used for the estimation of different climate variables on global as well as regional scales [
25,
26].
In order to assess the accuracy of the CMIP5 models as applied to the continental US, in the following we compare the observed and CMIP5-simulated precipitation and temperature patterns over the eastern and western parts of the US.
The ensemble mean of all CMIP5 simulations was downloaded from the KMNI (the Royal Netherlands Meteorological Institute) Climate Explorer website at
http://climexp.knmi.nl/start.cgi and averaged over the eastern and the western part of the US using area weighted averaging. The 1900–2015 difference in precipitation is again defined as the difference between the annual averages of 1900–1920 and 1995–2015. The results are summarized in
Table 4 and
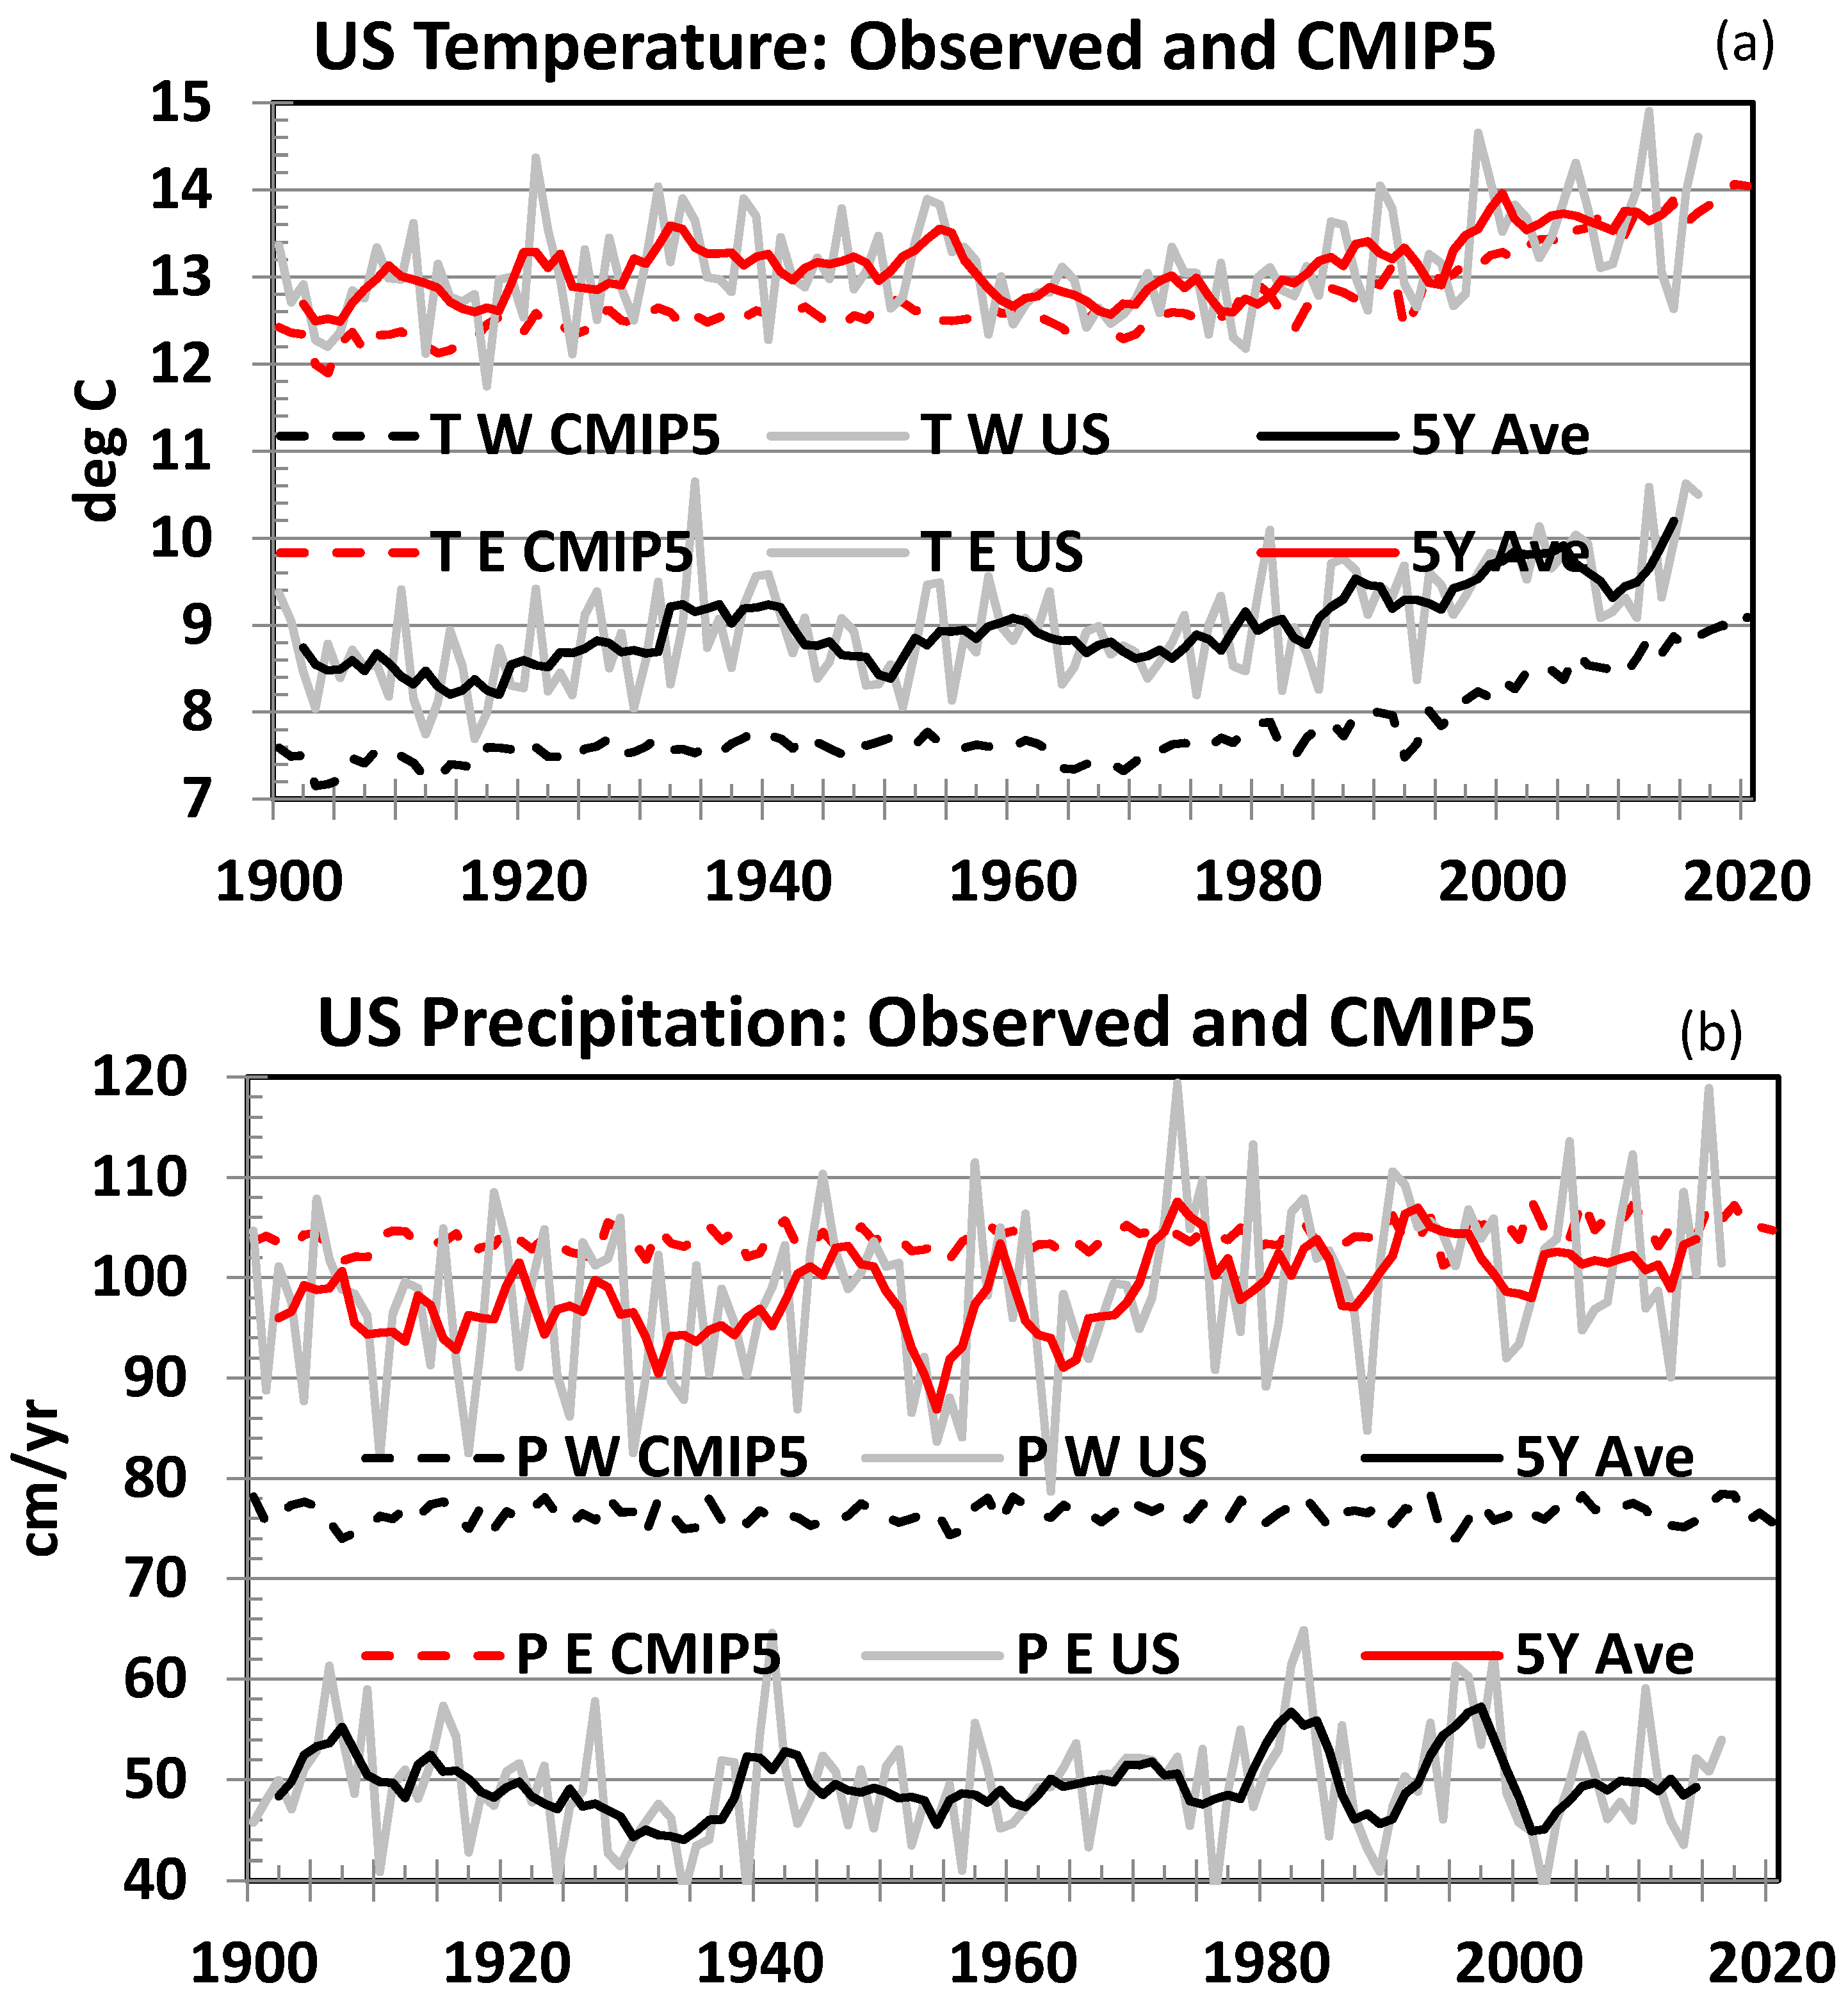
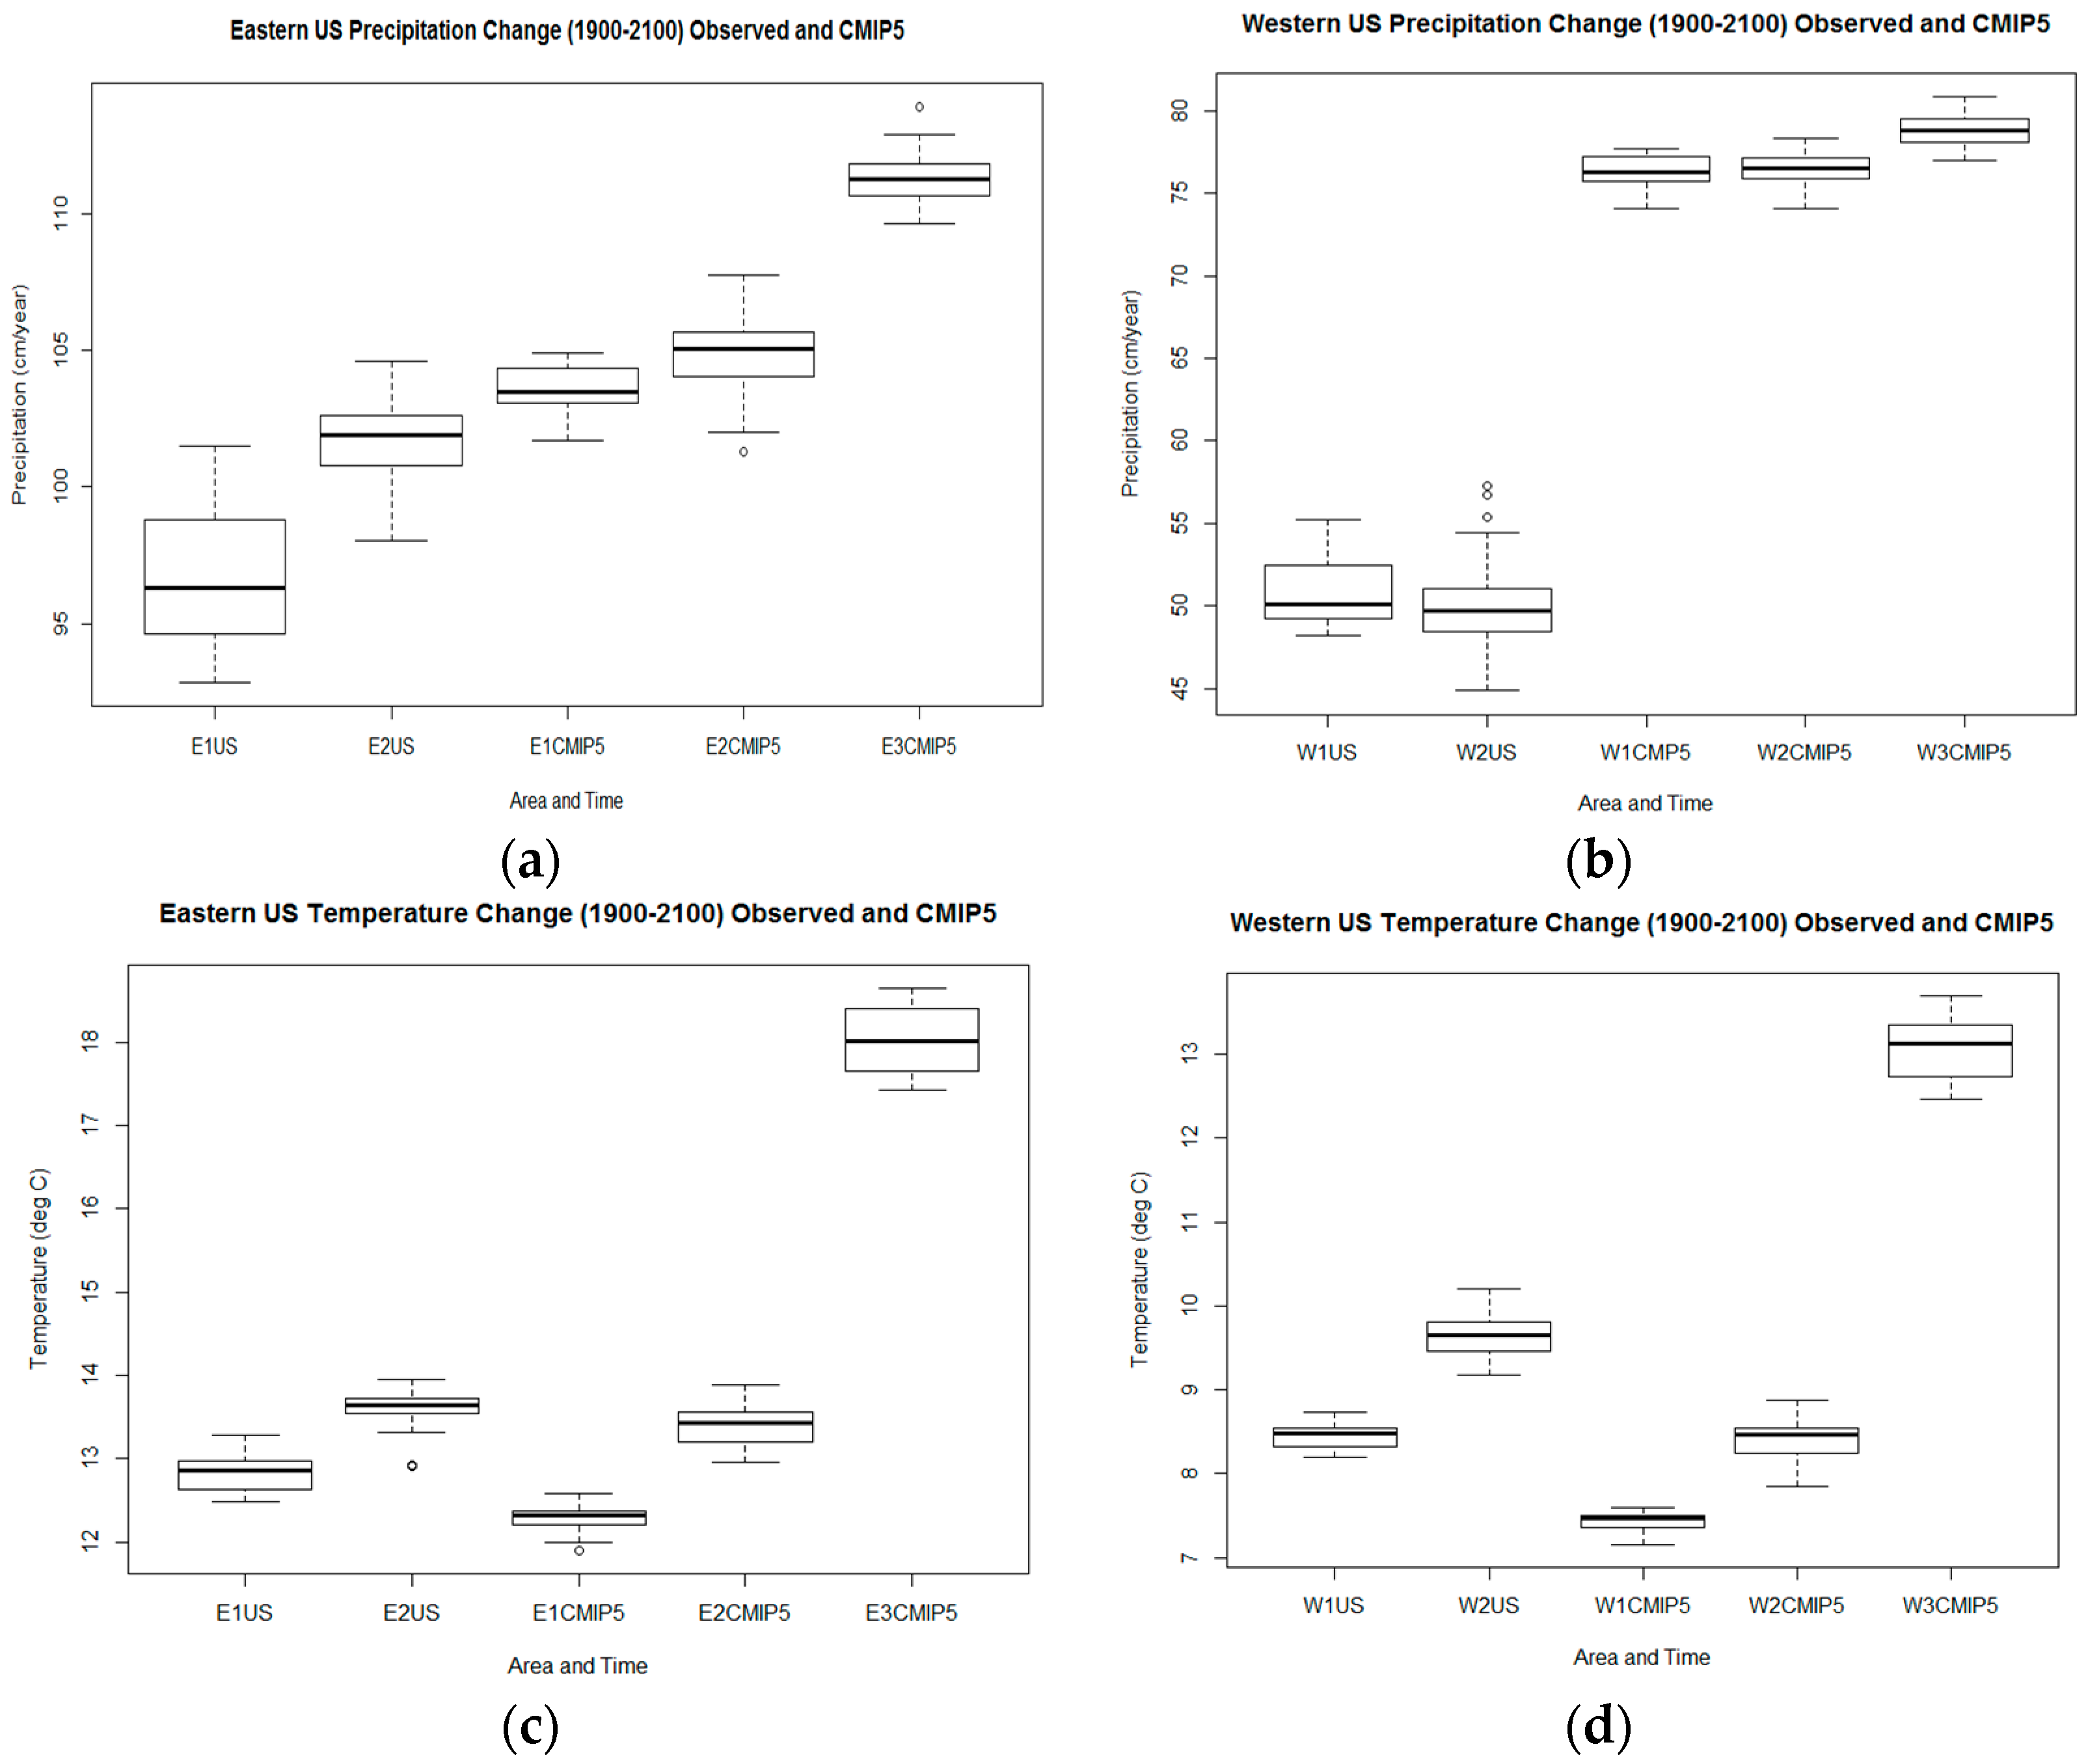
Figure 5. The ensemble mean of the CMIP5 model simulations reproduces reasonably well (within about 1 °C) the temperature variability of both the eastern and the western US temperature. However, the model simulations do not reproduce the observed precipitation values of the western part of the USA (models simulated about 76 cm/year comparted to observed 50 cm/year). The resulting hydrological climate sensitivity 1.41%/°C for the eastern part of the US is far from the observed values of 6.7%/°C, while the 0.03%/°C for the western US is consistent with observation indicating no significant change in precipitation with increasing temperature.
We conclude that the observed precipitation and the differences between the eastern and western parts of the US are not reproduced by the CMIP5 models (
Figure 5 and
Figure 6). The observed precipitation increase in the eastern US (
Figure 6a) is underestimated (1.46 cm/year compared to observed 4.91 cm/year) by about a factor of three. Consequently, past studies of precipitation, vegetation growth, aridity, tree mortality, and similar climate change consequences based on CMIP5 models simulations are questionable and should be re-evaluated. The CMIP5 models’ inability to capture the precipitation character of the eastern (observed precipitation increases are about three times faster than the CMIP5 simulation) and western US (CMIP5 average value of precipitation about 50% higher than the observed one) also has likely implications for future climate change projections and its environmental and agricultural consequences.
For the future (2015–2100) CMIP5 climate models projection we use the RCP8.5 future scenario. The CMIP5 model temperature and the precipitation in both parts of the USA follow a similar path, in both the past-simulated (
Figure 5) and future predicted time spans.
The CMIP5 models 2015–2100 predictions of the warming and precipitation are all statistically significant (
Table 5). The eastern and western part of the US are supposed, according to the CMIP5 models, to experience about the same rate of temperature increase, about 4.6 °C warming between 2015 and 2100, under the RCP8.5 scenario.
Although the CMIP5 models project a considerable increase of precipitation, in the western and eastern parts of the US, during the rest of the 21st century (2.47 cm/year and 6.39 cm/year, respectively), this precipitation increase leads to essentially no change in projected hydrological climate sensitivity, ∆P (%)/∆T (K) = 0.7%/K for the western US, and 1.3%/K for the eastern US (
Table 5). These low values of hydrological sensitivity are a consequence of the large increases in projected temperatures. To reconcile the eastern US to approach the past observed values (∆P (%)/∆T (K) = 6.7%/K in
Table 3, which is close to the Clausius-Clapeyron estimate of 7%/°C), we would need to increase significantly the projected precipitation, or significantly decrease the projected warming.
Concerning the temperature, the CMIP5 models reproduced the past temperature increases reasonably well. However, as is known, reproduction of the past is no guarantee of reasonable predictions in the future. Agreement with the past warming is only a necessary, but not a sufficient, condition for reliable future projections. Many models that reproduce the past regional temperature similarly produce very different future projections [
27,
28].
3.4. Statistical Regression Models
Statistical regression is a simple but powerful tool used in many branches of science. The two basic applications of the regression models are inference and prediction. Regression climate models have been used in the analysis of global temperature, Arctic climate change, US southwestern climate, and in the analysis of many other climate indicators to complement climate models’ simulations of the past and future projections.
Here we use regression models to infer the main driver of precipitation and temperature over the continental USA using the observed data. We use the usual set of predictors which include the radiative forcing due to anthropogenic greenhouse gases and aerosols (GHGA), solar irradiance variability (SOL), and radiative forcing of volcanic aerosols (VOLC); oceanic influences characterized by the Atlantic Multi-decadal Oscillation (AMO) and Pacific Decadal Oscillation (PDO); and El Nino-Southern Oscillation (ENSO) represented by the MEI (Multivariate ENSO Index), available at the NOAA website
https://www.esrl.noaa.gov/psd/enso/mei/. To identify statistically significant predictors we expand each climate region precipitation as a linear superposition of all the predictors, and we use a backward selection procedure [
29] to eliminate one by one each of the nonsignificant predictors. The information concerning the predictors used and details of the backward selection procedure can be found in our earlier publications [
6,
7]. The results indicating the statistically significant predictors (at 95% confidence level) are summarized in
Table 6.
Table 6 provides additional qualitative information concerning the US climate. Considering first the temperature in the eastern and western part of the US (
Table 6, the last two lines), we see that both the radiative forcing due to anthropogenic GHGA and AMO make a statistically significant contribution with a positive sign to the temperature. Thus, both the GHGA and the AMO contributed to the warming during the last few decades of a positive AMO index. Since the individual physics-based CMIP5 models do not reproduce the AMO with a proper time phase, in their ensemble mean the AMO-like contributions are averaged out. To reproduce the past temperature reasonably well, the warming caused by the AMO has to be picked up by another warming agent, in this case by the GHGA, resulting in an overestimate of the GHGA warming effect. Consequently, the future temperature projections that are dominated by GHGA will be likely too high, and hydrological climate sensitivity (% of precipitation increase per degree of warming) too low.
Considering the precipitation in the eastern part of the US (S, ENC, C, SE, NE, and Eastern US), the contribution of the GHGA is again positive; however, the AMO contribution appears with a negative sign. Since the AMO is not reproduced by an ensemble of model simulations, the decreasing precipitation effect of the AMO leads to a decreased precipitation efficiency of the GHGA. Consequently, the future projections of precipitation in the eastern US will be likely underestimated by the CMIP5 models. Thus, our regression model suggests that the ensemble mean of the CMIP5 model simulations will likely overestimate future temperatures over the USA and underestimate precipitation over the eastern US.
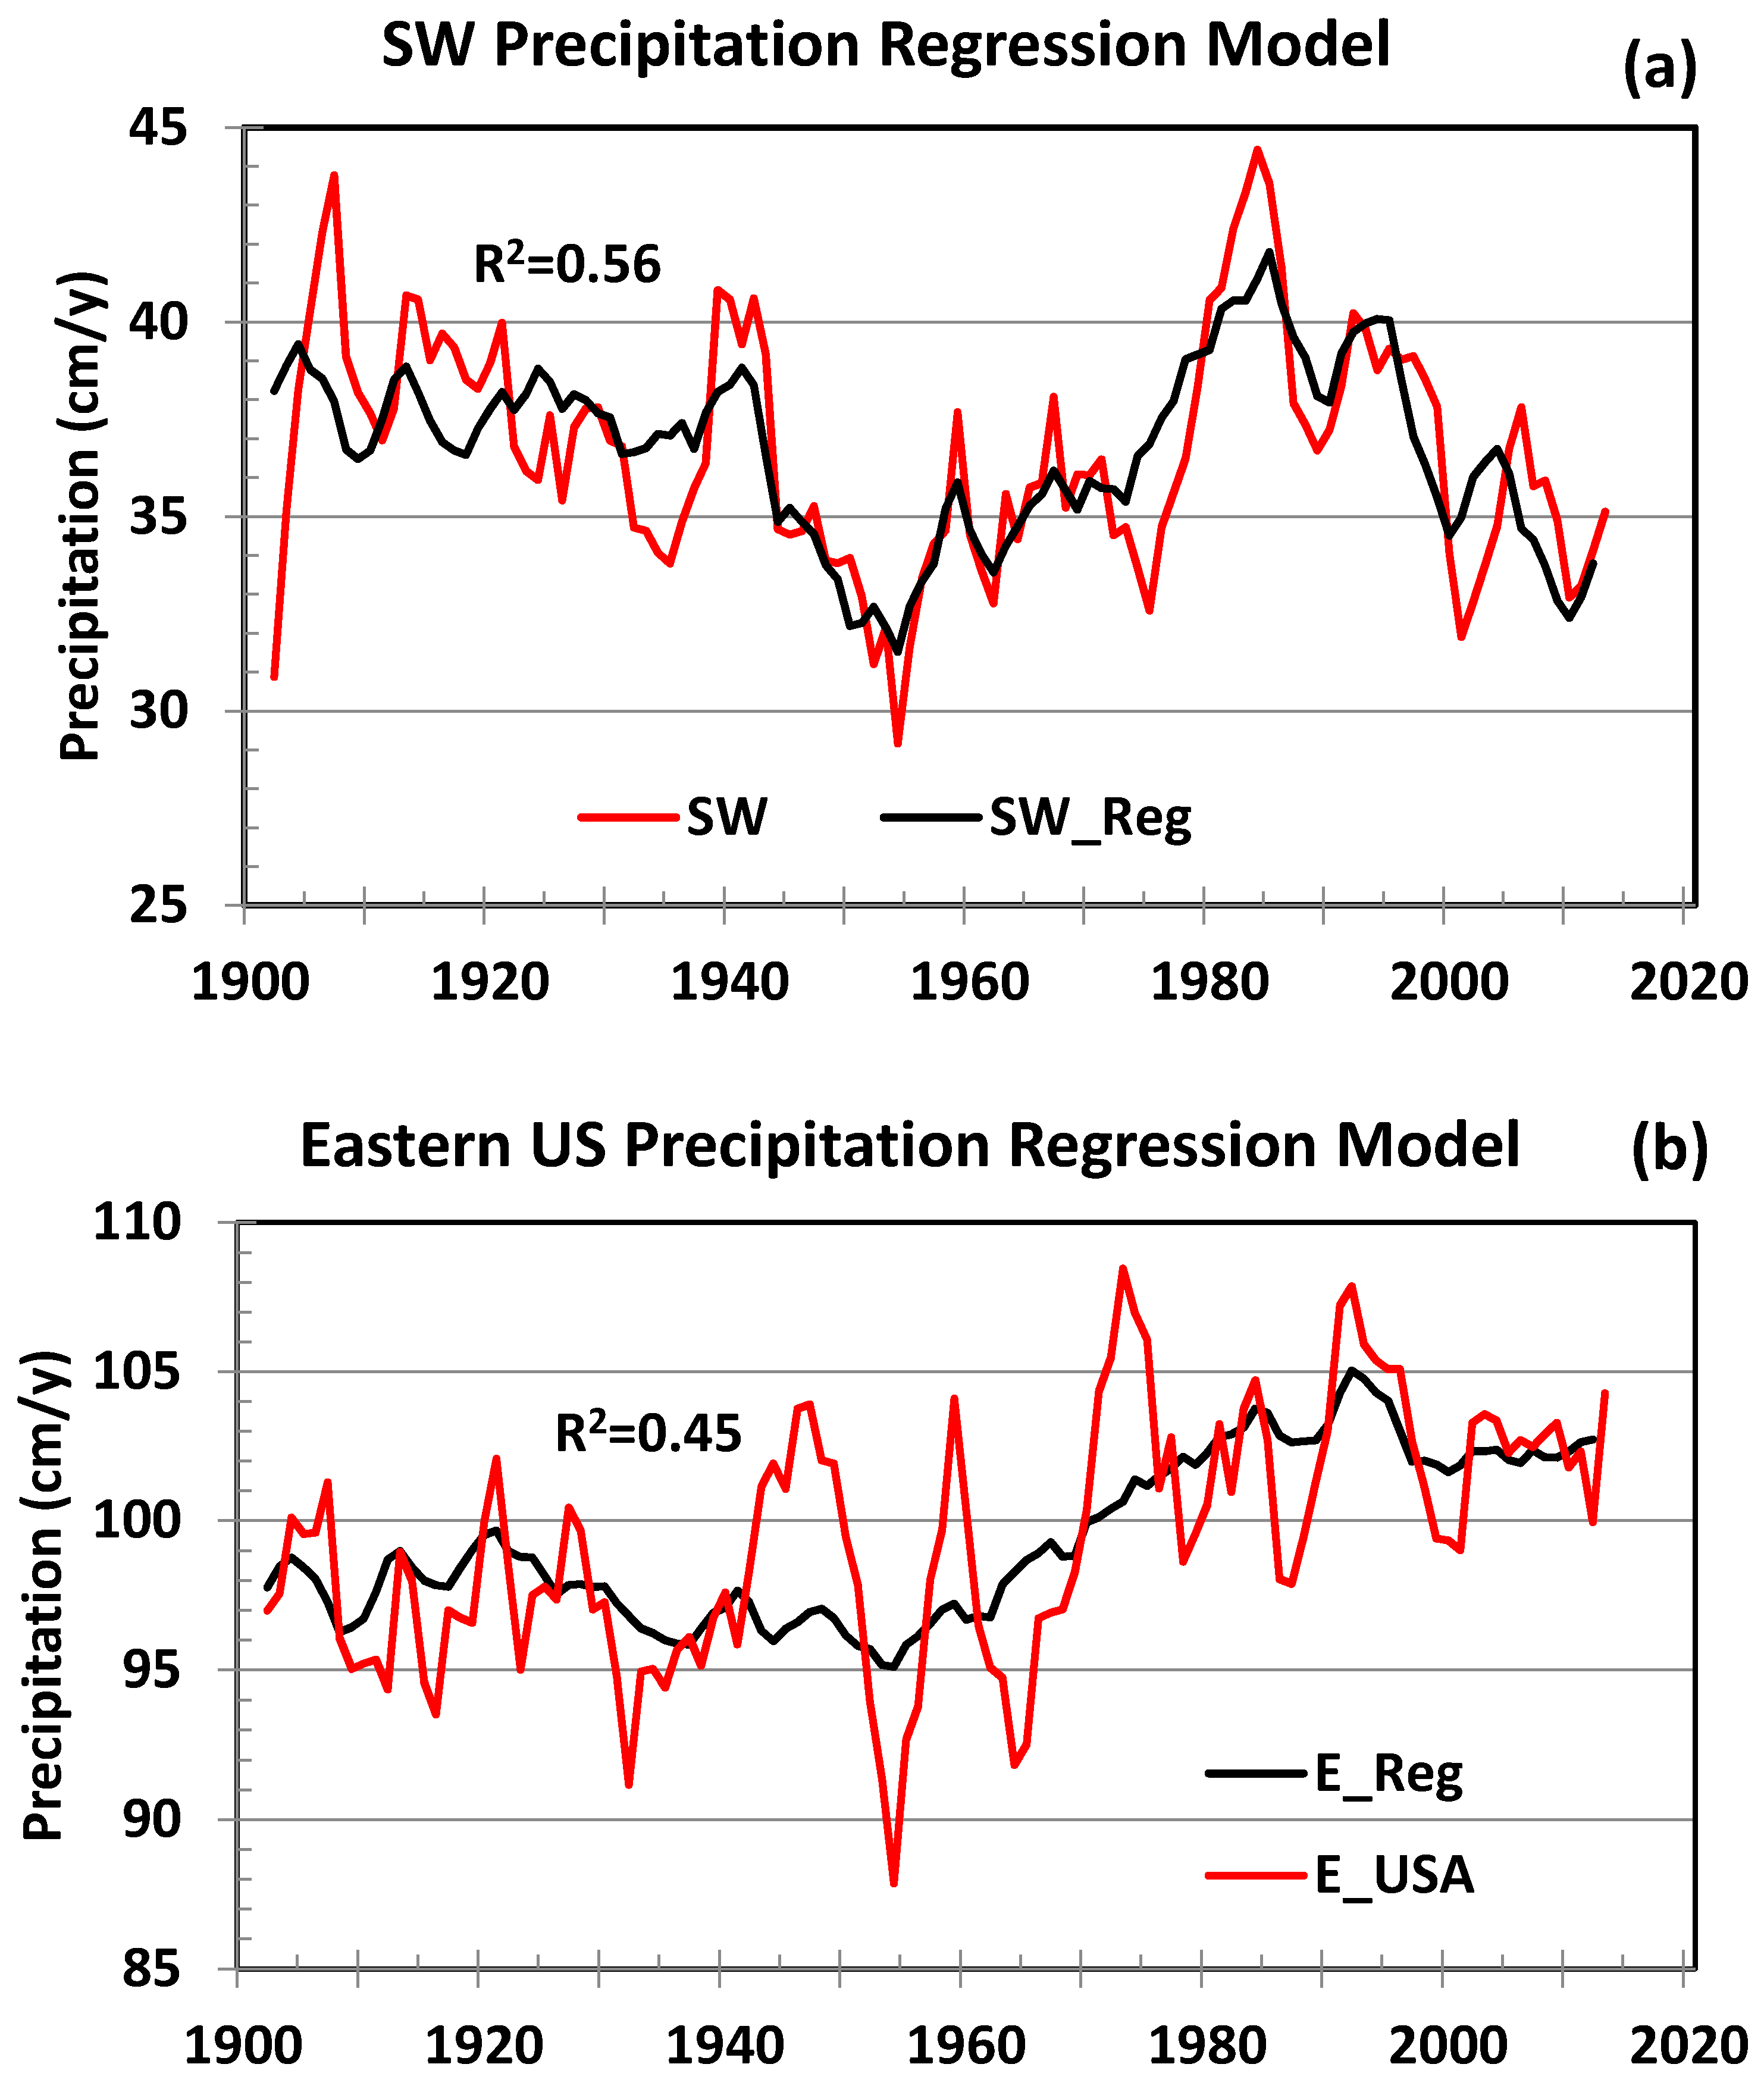
Examples of the regression model reconstruction of the precipitation in the Southwest climate region and the eastern US are shown in
Figure 7.
We find that the PDO is a statistically significant predictor of precipitation in three out of four western US regions. It also affects the whole western US. On the other hand, the PDO is not affecting the precipitation in any of the eastern US regions. The anthropogenic effects (GHGA) have some influence on the precipitation only in the WNC region, and they do not influence the precipitation of the whole western US.
In the eastern US, the GHGA and AMO affect precipitation in four out of five regions, as well as the Eastern US as a whole. As far as the temperature is concerned, the GHGA and AMO are statistically significant predictors for both the western and the eastern US.
We note that the anthropogenic GHGA contribution to the precipitation or the temperature is always positive. This means that the GHGA (which can be considered just a proxy for a rising temperature) contributes always to an increase of precipitation or temperature.
On the other hand, the AMO contribution to the temperature appears always with a positive sign, while its contribution to precipitation has a negative sign. This means that the AMO during its positive phase acts to increase the temperature and to decrease the precipitation. Considering the CMIP5 climate models, in the ensemble mean the AMO-like contribution will be averaged out, since the models do not capture the AMO in proper time and with proper amplitude. Consequently, the positive AMO contribution towards the temperature increase within the last three to four decades will have to be picked up by the GHGA, leading to an enhanced (overestimated) GHGA warming effect. This will result in an overestimate of the current and future GHGA-produced warming. Within the last few decades this may have contributed to climate models failing to predict the actual warming slowdown [
30,
31,
32,
33,
34]. Similarly, the absence of the AMO (negative) signal in the ensemble mean of the CMIP5 simulations of the eastern US precipitation will lead to a decreased GHGA precipitation influence in the eastern US, leading to an underestimate of the models’ projected precipitation over the eastern US.


