Article

Deposition of PM2.5 Sulfate in the Spring on Urban Forests in Beijing, China

1
College of Environmental Science and Engineering, Beijing Forestry University, 35 Tsinghua East Road, Beijing 100083, China
2
School of Soil and Water Conservation, Beijing Forestry University, 35 Tsinghua East Road, Beijing 100083, China
*
Authors to whom correspondence should be addressed.
Atmosphere 2017, 8(1), 3; https://doi.org/10.3390/atmos8010003
Submission received: 15 November 2016 / Revised: 25 December 2016 / Accepted: 27 December 2016 / Published: 5 January 2017

Abstract

:
Water-soluble ions such as sulfate may have great impacts on atmospheric pollution. To determine the deposition effect of PM2.5 sulfates, the major PM2.5 constituents, in the forest canopy in Beijing, China, an investigation was carried out in an urban forest, Olympic Forest Park, and a suburban forest, Jiufeng National Forest Park. We measured the vertical distributions of sulfate by using monitoring towers in the two forests at the same times in March and May 2013. Sulfate (SO42−) was predominant in all PM2.5 water-soluble inorganic ions, with a proportion >40%. The vertical concentration of SO42− increased with height, and the average sulfate concentration in Olympic Forest Park was higher than that in Jiufeng National Forest Park. Results also revealed that meteorological conditions had significant impacts on both the sulfate concentration and the deposition velocity. In winter, the deposition of SO42− through the canopy was not obvious in the two forest parks, which was quite the opposite in spring. The deposition velocity in the daytime was higher than that in the nighttime in both Olympic Forest Park (0.9 ± 1.0 cm/s vs. 0.4 ± 0.3 cm/s) and Jiufeng National Forest Park (1.3 ± 1.2 cm/s vs. 0.8 ± 0.8 cm/s). While Jiufeng National Forest Park turned out to have a higher average sulfate deposition velocity than Olympic Forest Park.

1. Introduction

PM2.5 includes all particulate matter that has an aerodynamic diameter of 2.5 microns or smaller. PM2.5 represents only a small percentage in the air, but is considered as one of main components in atmospheric pollution. It is the most important contributor to haze and results in damage to the surfaces of buildings. Moreover, PM2.5 can carry harmful substances such as carcinogens, and can combine into molecules which are much more dangerous than single composition substances; these substances can accumulate in the respiratory system and cause diseases. Therefore, PM2.5 has increasingly received attention in recent decades [1]. Water-soluble ions are important parts of PM2.5 and have a great influence on atmospheric pollution [2]. Of all the water-soluble ions, sulfate ion (SO42−) is present in the largest proportion [3]. To date, studies on PM2.5 sulfates have mainly focused on aspects related to concentrations, size distribution characteristics, source analysis, and seasonal and diurnal variations of PM2.5 [4,5,6]. However, there are few data from field investigations of SO42− deposition velocity in China.
The process of deposition is an important way to remove particulate matter from the air, and the crown canopy is an extremely important boundary between the atmospheric environment and the forest ecosystem. Leaves, branches, buds, and bark strongly adsorb atmospheric particulate matter, thereby influencing particulate matter depositions [7]. To date, studies of deposition of PM2.5 sulfate in forest systems have been mainly conducted in Europe and the United States [8,9,10,11,12,13,14], as well as some Asian countries other than China [15,16,17]. As the capital of China, which also happens to be deeply affected by haze, research on the deposition characteristics of PM2.5 sulfate on forest systems in Beijing is of great importance and will help to determine the effect of these ecosystems on PM2.5 sulfate removal in China.

2. Experimental Description and Methodology

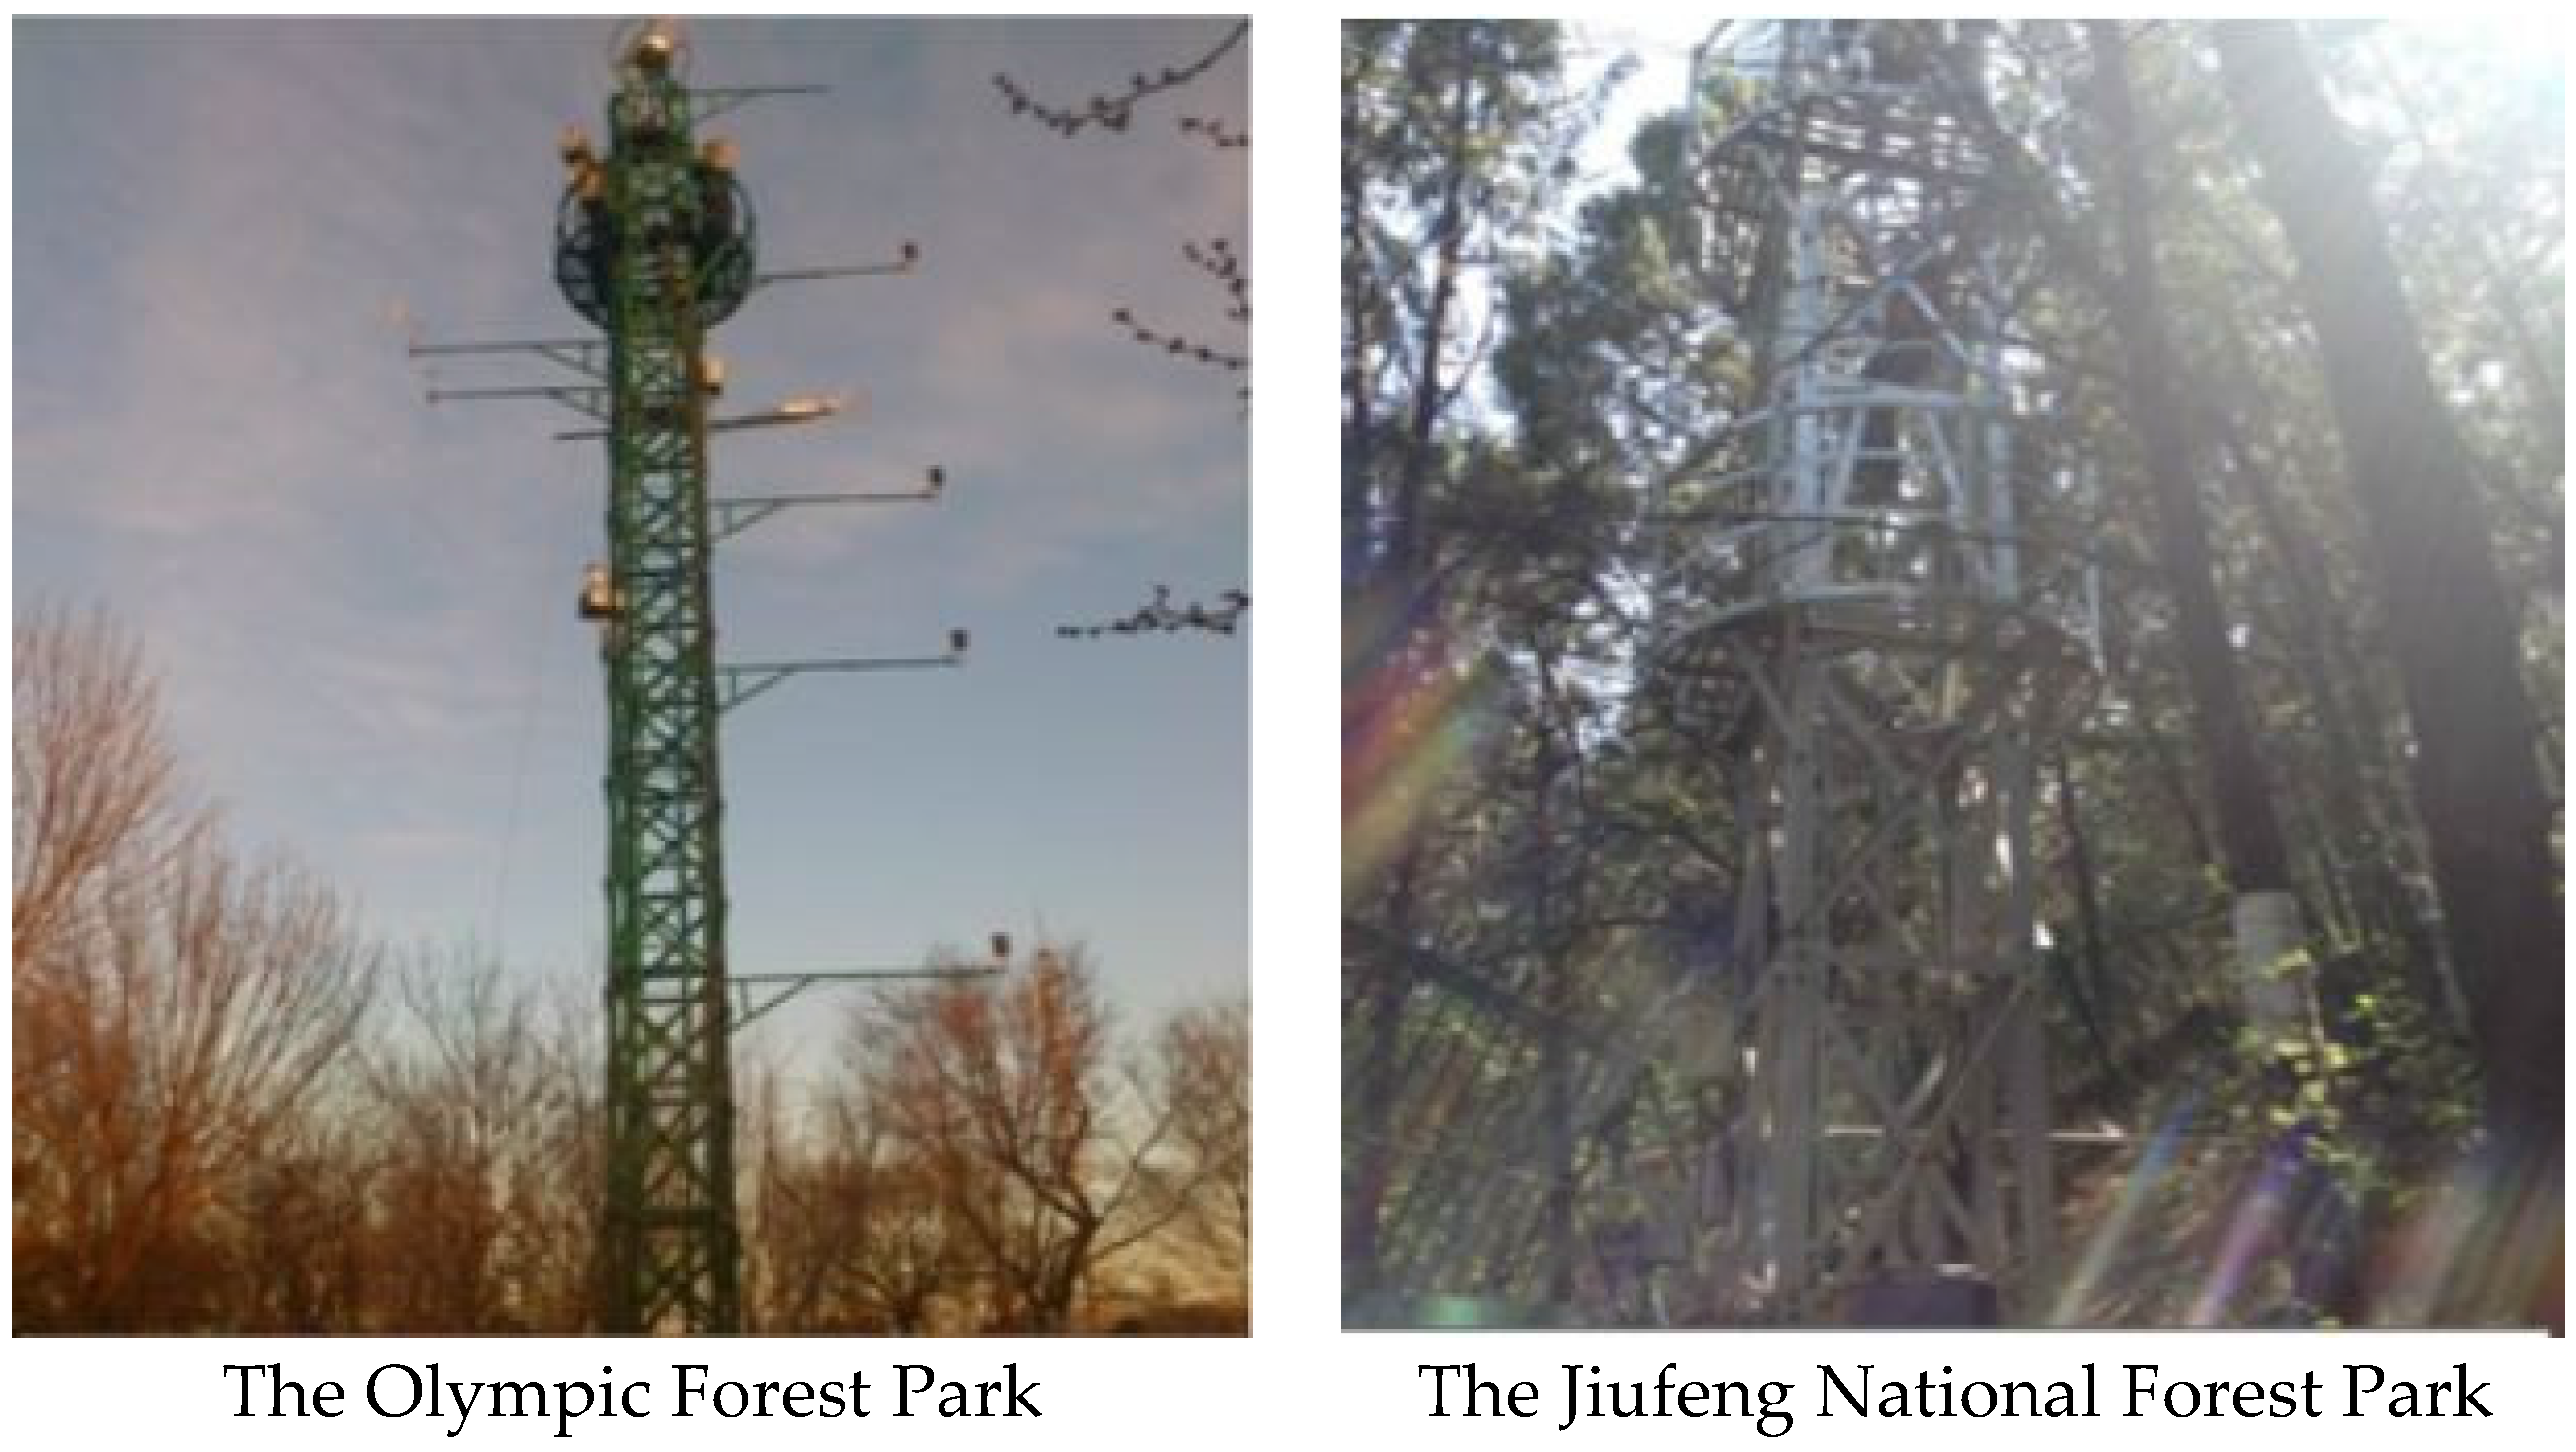
2.1. Experimental Description

Beijing is located in the northeastern margin of the North China Plain. We selected for investigation a representative urban forest, Olympic Forest Park (40.258° N, 116.39° E) and a suburban forest, Jiufeng National Forest Park (40.06° N, 116.09° E). A portion of forest was selected in each park. There is a tower that is approximately 15 m tall in Olympic Forest Park (Figure 1), which served as the location where we placed three samplers; we placed one sampler on the monitoring tower at 15 m (out of the canopy), one at 9 m (the up side of the canopy), and one at 1.5 m (height of human respiratory) above the ground. The main plant species was Populus tomentosa, and there were bushes on the ground. On a tower with a height of approximately 15 m in Jiufeng National Forest Park, we also established three sampling points, at 15 m, 9 m, and 1.5 m above the ground surface. Platycladus orientalis and Pinus massoniana Lamb were the main species.
The height of the trees was approximately 8 m around the tower in both sites. According to previous measurements at the site, the leaf area index (LAI) at the Jiufeng National Forest Park site was 3.8 in spring, and was 1.8 at the Olympic Forest Park site [18].

2.2. Sample Collection

Investigations were conducted between March and May in 2013. Samples was collected five times a day by 6:00 a.m.–10:00 a.m., 10:00 a.m.–2:00 p.m., 2:00 p.m.–6:00 p.m., 6:00 p.m.–10:00 p.m., and 10:00 p.m.–6:00 a.m.. Each collecting process lasted for 4 h except the last one, which lasted for 8 h. A TH-150 sampling instrument equipped with a PM2.5 cutter was used to collect the samples (TH-150A, Tianhong, Wuhan, China) with a flow rate of 100 L/min. The flow remained in stable condition during the sampling period. By comparing sampling filters, we decided to use quartz fiber filters (MK360, Munktell & Filtrak Gmbh, Falun, Sweden) with 90 mm diameter because of their low background of inorganic ions, large specific surface area, and resistance to high temperatures. The filters were weighed before and after particulate collection using a balance (BT125D, Sartorius Co., Ltd., Beijing, China) with an accuracy of 0.00001 g. Ion concentrations of three blank films were lower than 2% of the lowest concentrations in the actual sample.
The atmospheric pressure weather instrument recorded meteorological parameters, including humidity and temperature (HMP45C, Campbell Scientific Inc., Logan, UT, USA), and wind velocity and direction (014A/024A, Met One Instruments Inc., Grants Pass, OR, USA). An ultrasonic anemometer (Wind Master, Gill Instruments, Lymington, UK) was used to attain Monin-Obukhov length and friction velocity. Before the collecting process, some preparatory steps were needed. Aluminum foil parceling membranes were placed in a muffle furnace and burning for 2 h under 400 °C, and then were left for 24 h. After that, the original weight of the membrane filters were recorded before being put to use. The membrane filters still needed another 24 h after the collection process, and were placed in a cold environment with a temperature of −4 °C and 75% relative humidity before they were weighed again to collect the quality and volume of PM2.5.
The water-soluble inorganic ions were extracted with deionized water and analyzed with an ion chromatograph (ICS-3000 with an DIONEX Ionpac As11-HC anion column, Thermo Scientific, Sunnyvale, CA, USA).

2.3. Calculation of Deposition Velocity

In this experiment, we calculated the deposition rate of fine particles through the tree canopy. Equations (1)–(3) were used to determine the d and Z0.
U ( z ) = u * k l n Z d Z 0 ,
in which U(z) (m·s−1) is the average wind velocity; u* (m·s−1) is friction velocity which can be directly measured; k is the von Karman constant (0.41); d (m) is displacement height; Z0 is roughness length, which is used to model the horizontal mean wind speed near the ground and is equivalent to the height at which the wind speed theoretically becomes zero [19], according to Zhang et al. (2001) [20], Z0 was determined by considering different seasons and land use categories—in our study, Z0 was 0.75 at Olympic Forest Park and 0.8 at Jiufeng National Forest Park. The value of d can be calculated by iterative method [18] as:
f ( d ) = U ( z 1 ) U ( z 2 ) U ( z 1 ) U ( z 3 ) = l n ( Z 1 d ) l n ( Z 2 d ) l n ( Z 1 d ) l n ( Z 3 d ) ,
U(z1), U(z2) and U(z3) are the wind velocity at height Z1, Z2, and Z3, respectively. In this study, we used 1.5 m, 9 m, and 15 m.
g ( d ) = d f ( d ) f ( d ) ,
f(d) and g(d) are arbitrary functions used in the iterative process and f′(d) is the numerical derivative of f(d). This equation set is used iteratively. First, an original value for d is assumed. Then, the value of g(d) is updated and used to determine the new value of d, then the updated d is substituted into Equations (2) and (3) to get a new g(d). We assume the process has converged once the absolute value of the difference between the updated g(d) and the previous one is less than 0.001. The final value of d = g(d).
We used the flux-gradient technique to calculate the deposition flux of PM2.5 SO42−, F (μg·m−2·s−1) [8,16,21]. In Gradient method, the flux is derived from measurements of air concentrations at several heights above the receptor surface and from meteorological variables. F denotes deposition and was determined by Equation (4):
F = u * c * ,
where c* (μg·m−3) is the eddy concentration, expressed by the following equation:
c * = k Δ c ln ( Z 2 d Z 1 d ) Ψ h ( Z 2 d L ) + Ψ h ( Z 1 d L ) ,
where Z1 and Z2 are the heights of 1.5 and 9 m; ∆c is the concentration difference between heights of 1.5 m and 15 m, calculated by Equation (6); Ψh is the integrated stability correction function defined by Erisman and Draaijers (1997) [8], with its value obtained from Equations (7) and (8); L (m) is the Monin–Obukhov length;
Δ c = c ( z 3 ) c ( z 1 ) ,
Ψ h ( Z d L ) = 2 ln ( 1 + x 2 ) + ln ( 1 + x 2 2 ) 2 arctan ( x ) + π 2   ,
x = [ 1 16 ( Z d ) L ] 0.25 .
To sum up, F could be expressed as follows:
F = k u * [ c ( Z   ) c ( Z 1   ) ] l n ( Z 2 d Z 1 d ) Ψ h ( Z 2 d L ) + Ψ h ( Z 1 d L ) ,
u* was averaged every 15 min, L was the same as u*; F was averaged every 4 h. From Wesely and Hicks (1977) [22] we could obtain the deposition velocity, and Vd was determined using the following equation:
V d =   F / C ,
where C is the value of the concentration at 15 m height.

2.4. Empirical Models

In order to compare measured data, three empirical models were chosen, which were proposed by Wesley and Hicks (1977) [22], Wesley et al. (1985) [12], and Ruijgrok et al. (1997) [23]. Although these three models are not entirely suitable for the situation, they are the most immediately applicable on account of being public spaces empirical models which consider wide open spaces. The model by Wesely et al. (1985) [12] is a dry deposition model over grass, whereas the Ruijgrok et al. (1997) [23] model is a dry deposition model over forest canopy. The Wesely and Hicks (1977) [22] model is a dry deposition model over all canopies.
(1) Wesley and Hicks (1977) [22]
V d = 1 R a + R b + R c ,
R a = [ ln ( z d z 0 ) Ψ h ( z d L ) + Ψ h ( z 0 L ) ] k u * ,
R b = 2 ( S c P r ) 2 3 k u * ,
where the aerodynamic drag Ra is a value calculated by Garland (1978) [24], Rb is another atmospheric resistance reported by Hicks et al. (1987) [25], Pr is Prandtl number, and Sc is Schmidt number. Rc is forest canopy resistance and can be obtained based on theoretical considerations.
(2) Wesley et al. (1985) [12]
In this model, deposition velocities of the aerosol particles are expressed by the aerodynamic terms equation. Vds in following equation is the surface deposition velocity.
V d = 1 / ( R a + V d s 1 ) .
It was fit to a grassland ecosystem in North America by Wesely et al. (1985) [12], where Vd is the forest surface deposition velocity, which can be determined by the following equation when the atmosphere is neutral or stable (L ≥ 0),
V d = u * 500 ,
when atmospheric conditions are unstable (L < 0),
V d = u * 500 ( 1 + 300 ( L ) 2 / 3 ) + 1 .
(3) Ruijgrok et al. (1997) [23]
The third model was proposed by Ruijgrok which was fit to a European forest. The general form for Vd is:
V d = 1 1 V d s + R a + V g ,
where Vds is the surface deposition velocity, and Vg is the gravitational settling velocity. The Vds for PM2.5 can be parameterized by the Equation (18):
V d s = u * 2 u h E ,
in which uh is the wind speed at the canopy height (approximately 9 m), and E is the collection efficiency with which the canopy captures particles, as defined by Ruijgrok et al. (1997).
R H 80 ,   E = 0.05 u * 0.28 ,
R H > 80 ,   E = 0.05 u * 0.28 [ 1 + 0.18 E X P ( R H 80 20 ) ] ,
RH 80, Vg = 6.7 × 10⁻³,
R H > 80 ,   V g = 0.0067 E X P ( 0.0066 R H 1.058 R H ) .
In the above equations, RH is the relative humidity.

3. Results and Discussion

3.1. Meteorological Conditions

Meteorological conditions usually have significant effects on the diffusion and deposition of PM2.5 [26,27]. Beijing has a typical north temperate semi-humid continental monsoon climate (i.e., hot and rainy in summer, cold and dry in winter, with short spring and autumn with strong winds). Table 1 shows the average meteorological conditions in the sampling period. The general trends in the Olympic and Jiufeng parks with respect to weather conditions were very similar. The temperature in the daytime was higher than in the nighttime, and wind speeds showed a similar trend. The relative humidity was larger at night. Different meteorological conditions had different influences on the concentration and deposition rate of SO42−.

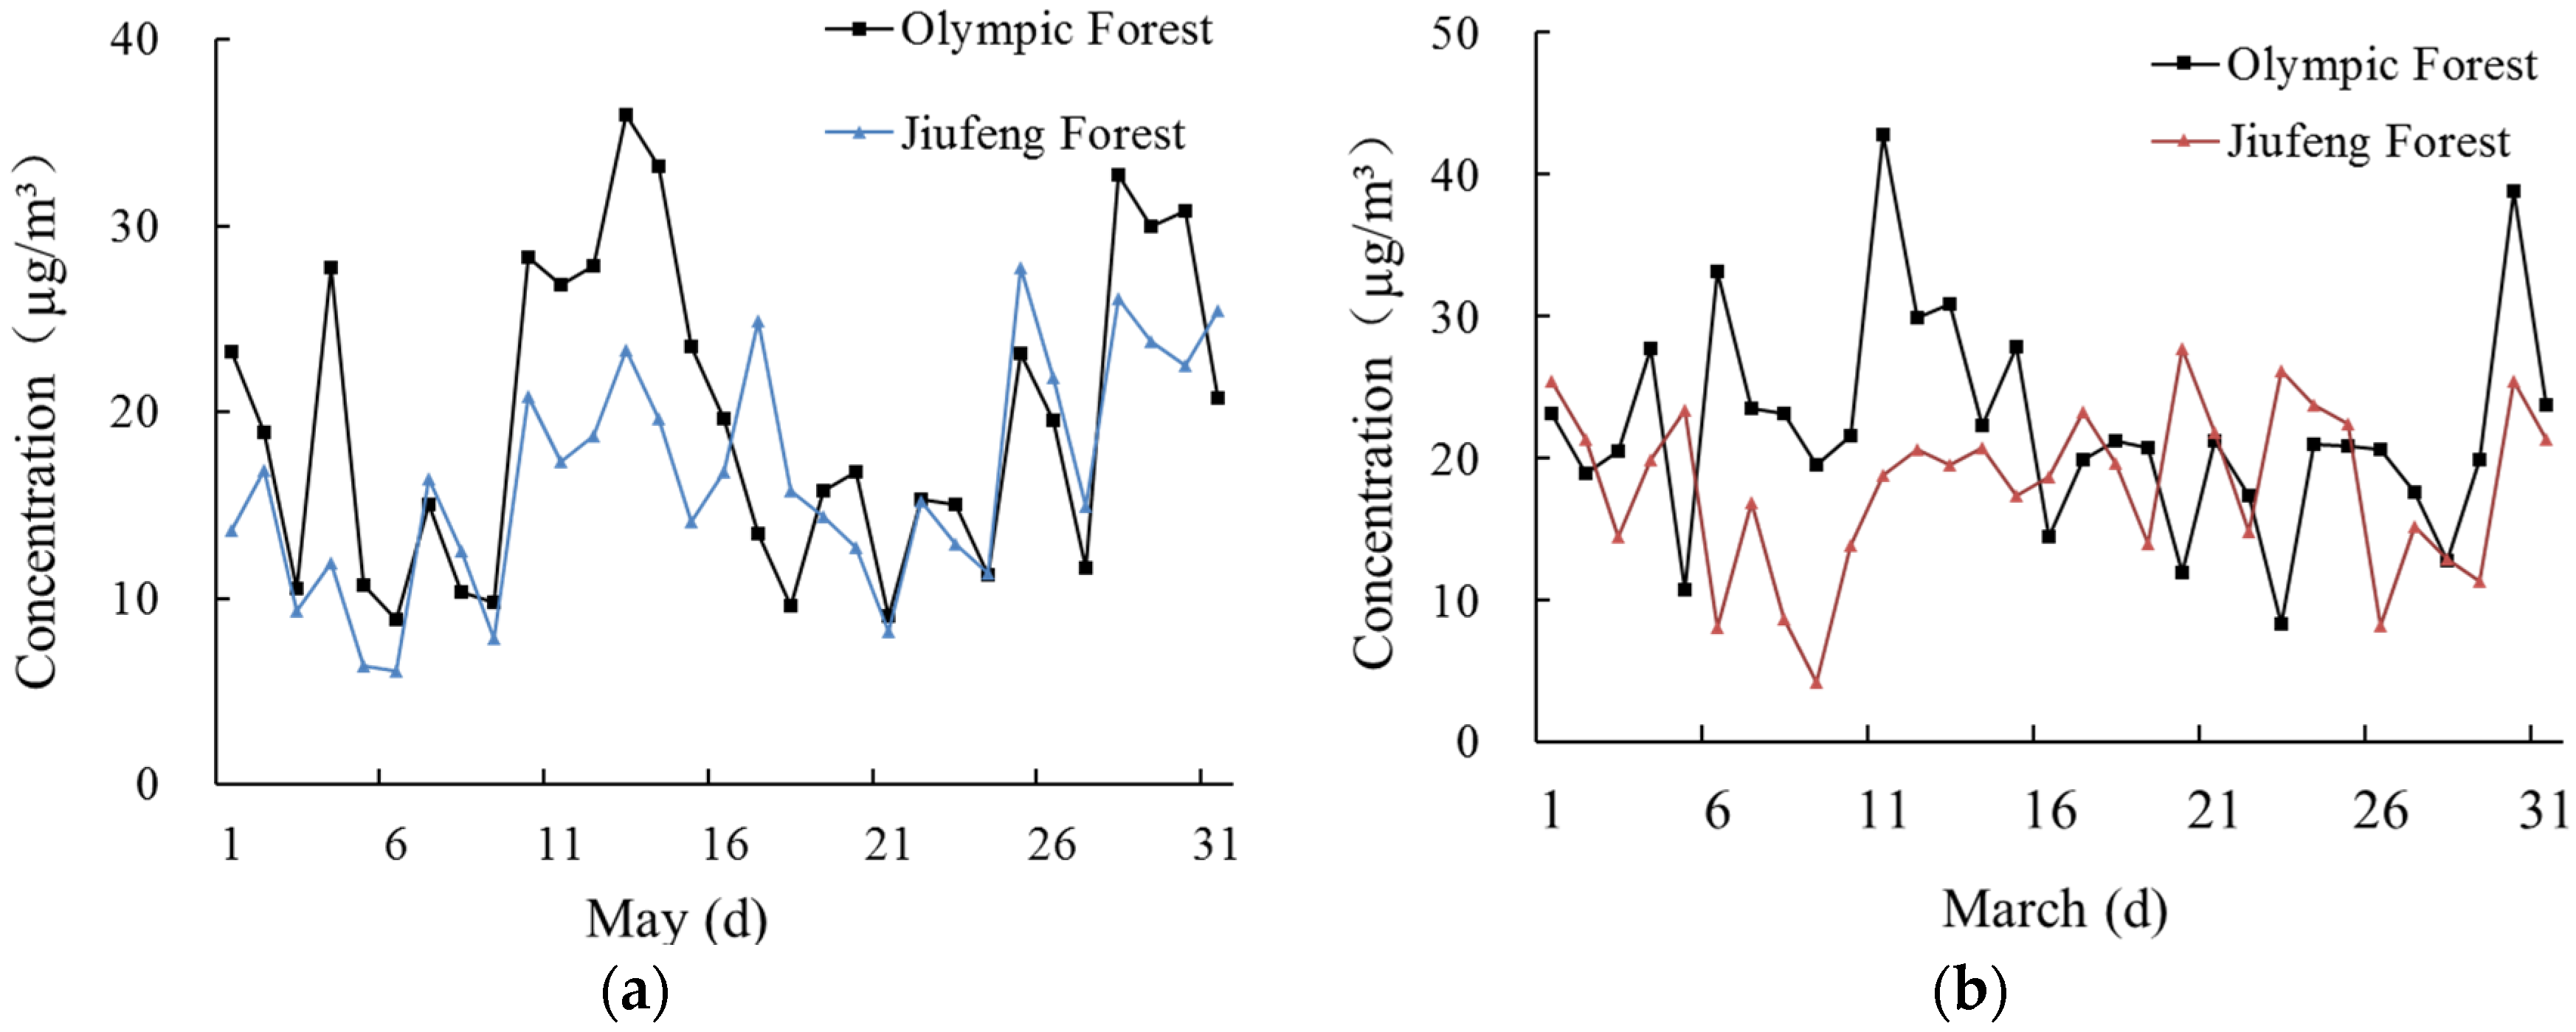
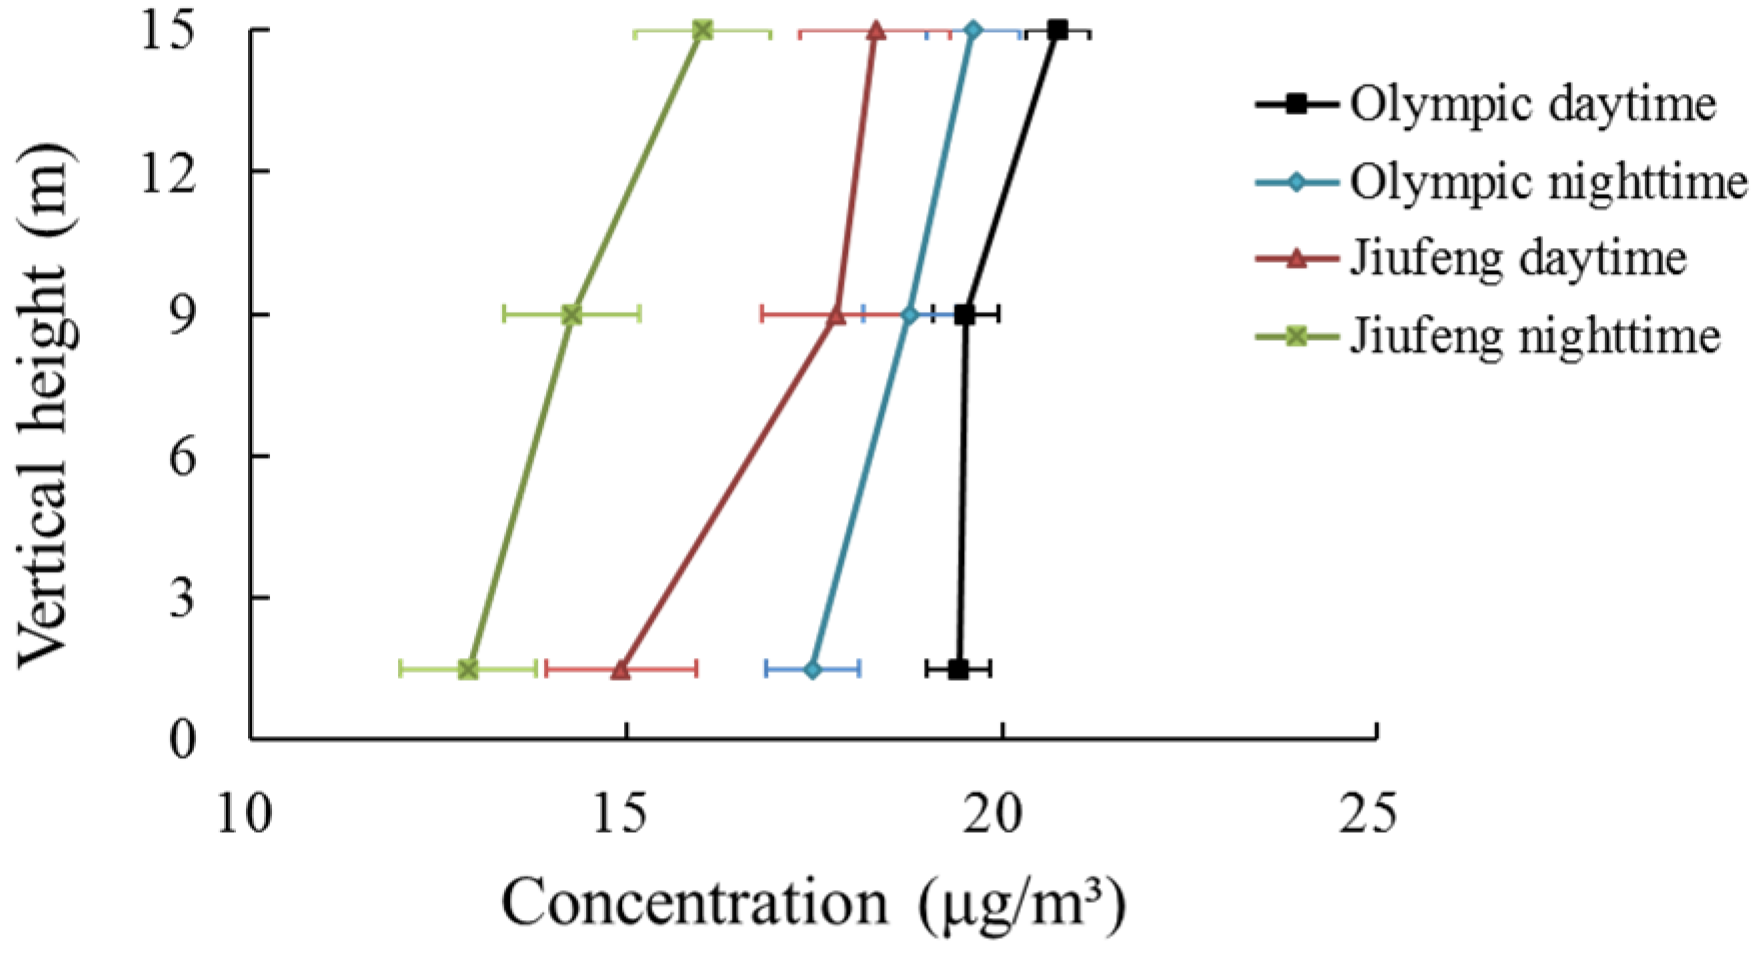
3.2. Sulfate Concentrations and Vertical Gradients

In March, the water-soluble total inorganic ion concentrations were 56.9 μg/m3 in Olympic Forest Park, with SO42− accounting for 39%; in comparison, ion concentration were 44.7 μg/m3 in Jiufeng National Forest Park, with the proportion of SO42− accounting for approximately 41%. While in May, these inorganic ions decreased to 46.7 μg/m3 in Olympic Forest Park and 35.8 μg/m3 in Jiufeng National Forest Park. SO42− accounted for 42% and 47% of the ion concentrations in the Olympic and Jiufeng parks, respectively. Therefore, SO42− was an important component of PM2.5 water-soluble inorganic ions. Figure 2 shows the concentration of SO42− in March and May at the two sampling sites. It can be seen that regardless of the season, the concentration of SO42− in the Olympic Park displayed more obvious fluctuations than that in Jiufeng Park. This phenomenon may be because Olympic Park is located in an urban area, whereas Jiufeng Park is located in a suburban area. The artificial disturbances in the urban area may cause the obvious fluctuations of PM2.5 SO42− concentrations in the Olympic Park.
In order to study the effect of young leaves on dry deposition of PM2.5 SO42− in Beijing, we selected the early spring (i.e., May) as an example. The average concentrations of SO42− measured at the various heights, sites, and times are shown in Figure 3. It can be seen that the concentration at 15 m was greater than that at 9 m, and concentrations of SO42− appeared to decrease with height. This observation indicated a downward flux of the particulate sulfate (top down), which can be explained by the potential high absorption ability of the forests. As demonstrated in Figure 3, the average concentrations of SO42− in Olympic Park in May were significantly higher than those in Jiufeng Park. This difference may be due to the geographical positions of the two sites. Olympic Park is located closer to the central city than Jiufeng Park, which is in the suburbs. The number of residents and pollution sources around Jiufeng Park were relatively low, and the forest density was higher; hence, the concentration of PM2.5 SO42− in atmosphere was lower than that in urban areas.
In addition, the concentrations of particulate sulfate were significantly higher in the daytime than in the nighttime at both experimental sites. This result was consistent with the experimental results of Matsuda et al. (2010) [16]. The gradient showed that SO42− deposition actually happened within the forests, which revealed that the canopy had an effect on the deposition of SO42−.

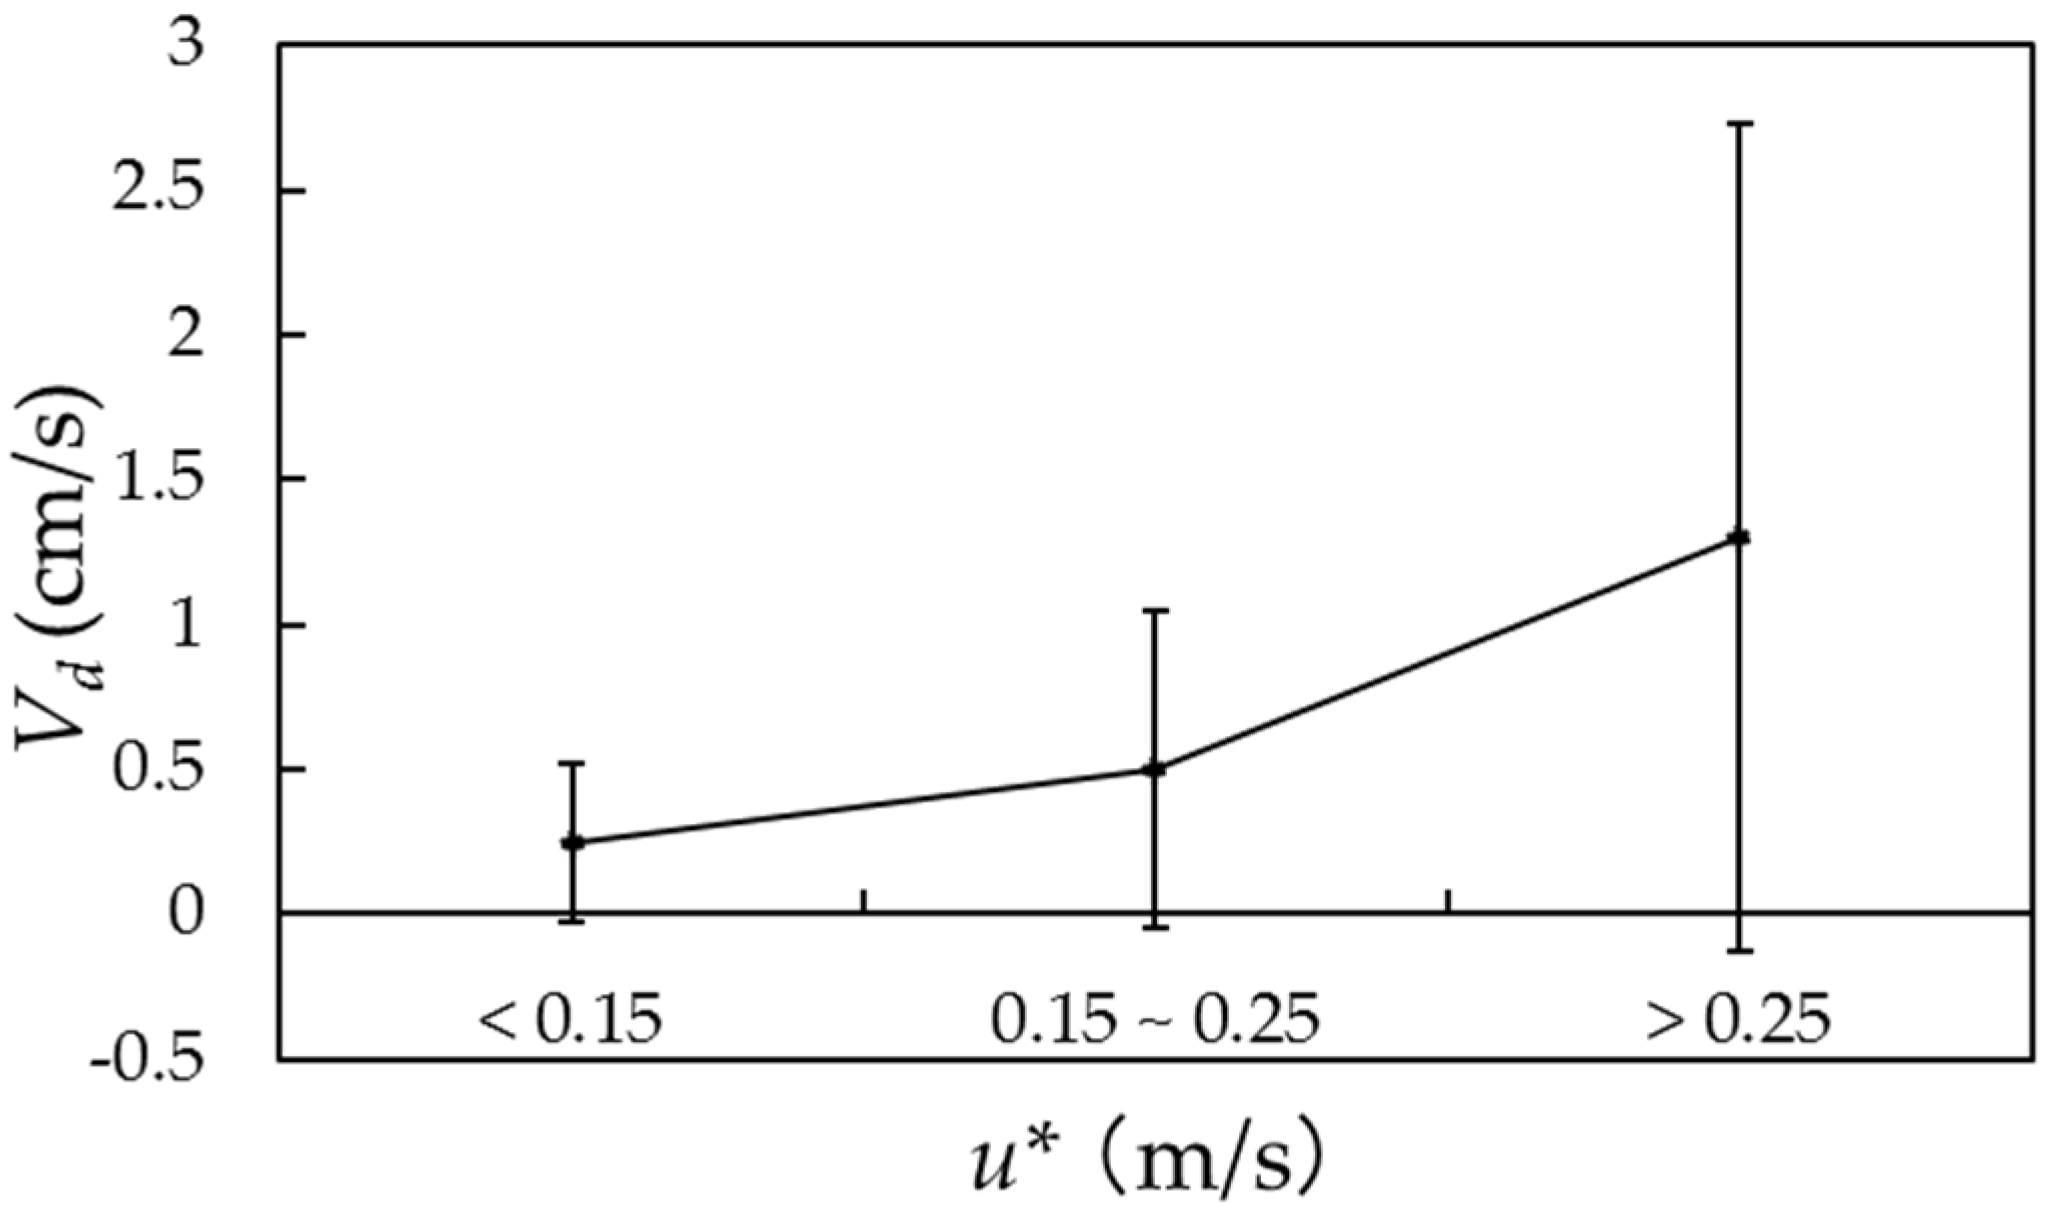
3.3. Deposition Velocity of PM2.5 Sulfate

We calculated the deposition velocities in May in Olympic Forest Park and Jiufeng National Forest Park, as shown in Table 2. Trees have no leaves in winter and therefore, had relatively small effects on particle deposition. PM2.5 concentrations in the vertical direction showed few differences, and the deposition velocities were close to zero or negative.
From Table 2 we can clearly see that deposition velocities were higher in Jiufeng Park than in Olympic Park. There may be three reasons: firstly, the LAI at the two sites were different. The LAI at Jiufeng Forest (3.8) was higher than that at Olympic Park (1.8). The greater the LAI, the more impaction and interception of fine particles may occur in the canopy. Secondly, different plant species have different effects on SO42− retention. The more complex the leaf structure, the more conducive the leaf is to adsorbing particles. If blade roughness is high and mucus abundant, leaves adsorb fine particles more easily. The main species in Olympic Park was Populus tomentosa. In Jiufeng National Forest Park, the main species were Platycladus orientalis and Pinus massoniana. Because the leaf structure of Platycladus orientalis is more complex than that of Populus tomentosa, greater deposition occurred in Jiufeng Park [18]. Thirdly, the influence of meteorological conditions on fine particles may also have had an effect on the sulfate deposition. The wind speed was higher in Jiufeng Park than in Olympic Park. The higher the wind speed, the greater was the diffusion and migration velocity of particles in Jiufeng Park. The humidity was greater in Jiufeng Park, and particulates adsorbed more water. When the particle volume increased, particulate matter fell more readily because of gravity. As solar radiation was the factor affecting the porosity of leaves, with intense radiation, the leaves removed more particles, so the deposition velocities were higher in the daytime than in the nighttime. This result was consistent with other results from previously established literature [16].
At both sites, the deposition rate increased during the day and was reduced at night. These results agreed with those of other studies [16,28]. The deposition of fine particles had a close relationship with aerodynamics. As shown in Figure 4, the deposition velocities (Vd) increased with increasing friction velocities. When impaction is the only mechanism responsible for passing the viscous sublayer, Vd should increase according to a strong linear relationship with u* [8]. The observed relationship suggests that a combination of deposition mechanisms are responsible for this dependency on u*. The friction velocities were also affected by atmospheric stability [12,23,29]. If the environment experienced unstable conditions, the deposition velocities would correspondingly increase. Therefore, in the daytime, the friction rates (u*) reached a maximum value throughout the day, and the atmosphere experienced unstable conditions in the daytime. The deposition velocities in the day were greater than those in the night.

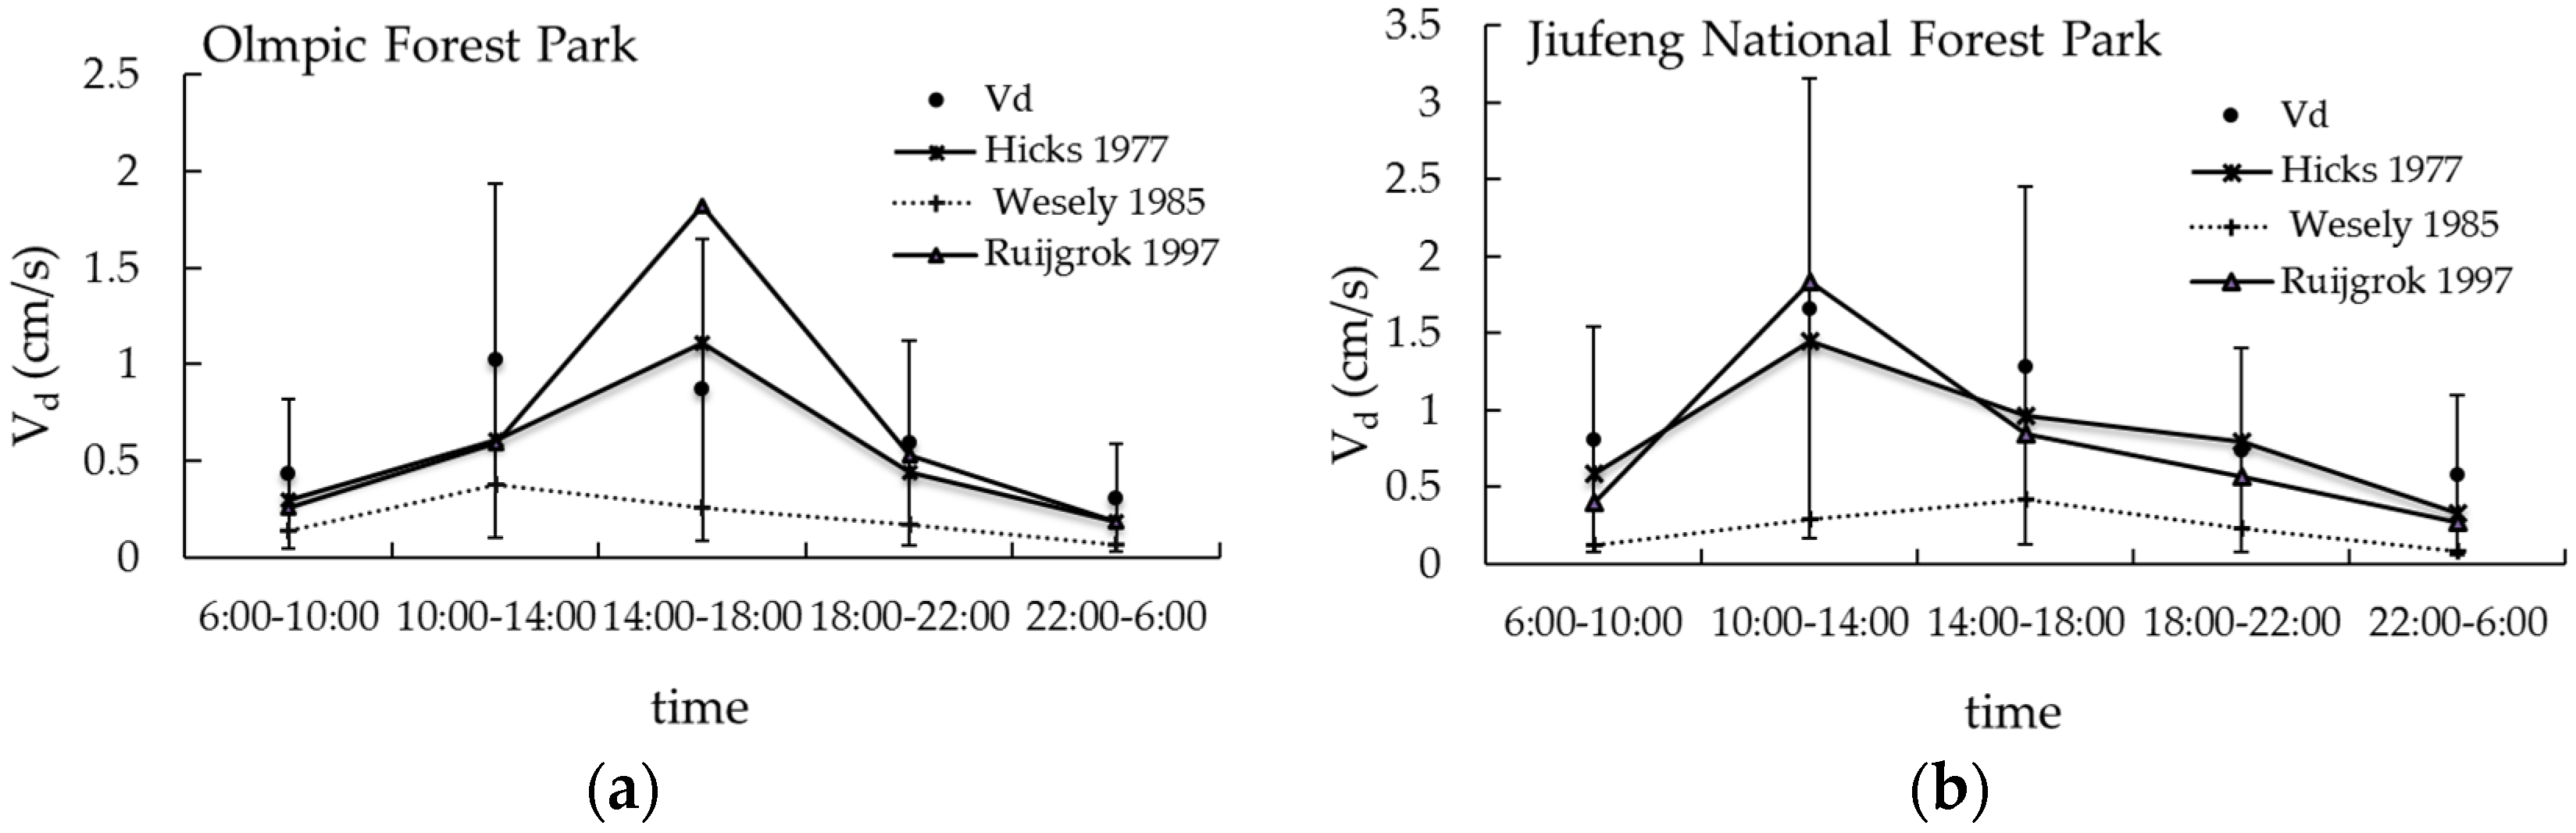
3.4. Comparison between Measured and Other Calculated Vd by Model

We also obtained Vd by model calculation, as shown in Table 3. A very limited number of experiments on PM2.5 sulfate deposition have been performed over forests. For the function of SO42− deposition in the forests, we computed Vd by the aerodynamic gradient method with a value higher than those in other reports.
For deciduous forests, the deposition velocities in Olympic Forest Park were close to the velocities measured by Matsuda et al. (2010) [16], with mean deposition velocity estimated to be 0.9 cm/s in the daytime and 0.3 cm/s in the nighttime. Hicks et al. (1989) [14] measured sulfate fluxes over a deciduous forest by eddy correlation, and they found that Vd peaked at 1.0 cm/s in the daytime and dropped to near 0.0 at night with a long-term average value of 0.6 cm/s.
For coniferous forests, Wyers et al. (1997) [8] measured dry deposition velocity of sulfate over a coniferous canopy using the aerodynamic gradient technique, and they found that Vd ranged from near-zero under stable atmospheric conditions to 4.0 cm/s under unstable conditions, the average Vd was 0.7 cm/s. Hicks et al. (1982) [13] reported measurements over a Coniferous forest using an eddy correlation method for measuring total sulfur; the measurements indicated deposition velocities for particulate sulfur that averaged about 0.7 cm/s in the daytime. Similar values were reported by Wesely et al. (1985) [12] for a pine forest: the deposition velocity ranges from 0.9 cm/s for moderately unstable conditions to 0.5 cm/s for a neutral atmosphere.

3.5. Comparison between Measured and Parameterized Vd

The comparison between the measured and three parameterized Vd is shown in Figure 5. The deposition velocities were calculated using the three models, and the error bars indicated the sampling errors in the experiment. It can be seen that the measured Vd was higher than the calculated values from the Ruijgrok et al. (1997) [23] model, the Wesely et al. (1985) [12] model, and the Hicks (1977) [22] model. The low deposition velocities in Olympic Park and the high deposition velocities in Jiufeng Park are consistent with the calculated results. However, the Hicks (1977) [22] model and the Ruijgrok et al. (1997) [23] model were more suitable for Beijing forests and could better reflect the influence of the forest on PM2.5 sulfate deposition. The calculated results from the Wesely et al. (1985) [12] model were lower than those of the measured values. Therefore, the parameterizations of the Wesely and Hicks (1977) [22] and the Ruijgrok (1997) [23] could be applied to the calculation in the forests in our study and in forests in Beijing.

4. Conclusions

The deposition of SO42− in PM2.5 above the forest was investigated in Beijing, China. In our study, the mean concentration of PM2.5 SO42− in May was 19.7 μg/m3 in Olympic Forest Park and 16.8 μg/m3 in Jiufeng National Forest Park. A comparison between the mean concentrations of SO42− in March and May at the two experimental sites showed that the concentration in Olympic Park was higher than that in Jiufeng Park, and daytime concentrations higher than nighttime concentrations at both sites. Furthermore, PM2.5 SO42− concentrations decreased with height.
For the canopy layer deposition of SO42−, deposition velocities in Jiufeng Forest Park were significantly higher than that in Olympic Park during the same time periods. This may be attributed to the greater friction velocity in Jiufeng National Forest Park. At both experimental sites, PM2.5 sulfate deposition velocities were significantly higher in the daytime than in the nighttime. In addition, our results suggest that the deposition velocities of PM2.5 sulfate were also influenced by the friction velocity (u*) (Figure 4), which was closely related to the aerodynamic conditions [12,23,29]. Thus, the deposition velocities of PM2.5 sulfate were also strongly affected by aerodynamic conditions.
The results of the comparisons between measured and parameterized Vd showed that the Wesely and Hicks (1977) and the Ruijgrok (1997) parameterizations could be applied to the forests in Beijing.

Acknowledgments

This work was supported by the grants from the Beijing Municipal Education Commission (CEFF-PXM2016_014207_000038). Beijing Education Commission scientific research and postgraduate training programs to build urban and rural ecological environment in Beijing laboratory project (2015BLUREE07). We would like to extend our sincere gratitude to Xiaoxiu Lun and Xinxiao Yu for their help in providing guidance and direction for the development of this study. We also thank Renna Li, Yingying Cao, and Fengbin Sun for their help with collecting samples. Furthermore, we would like to thank the Beijing Municipal Bureau of Landscape and Forestry and Beijing Forestry University for their help and for permitting our access to the park to conduct experiments.

Author Contributions

Renna Li, Yingying Cao, and Fengbin Sun did the samples collection, Renna Li and Yingying Cao did the laboratory work. Yingying Cao and Renna Li performed data analysis and wrote the manuscript. Renna Li and Xinxiao Yu provided guidance and direction for the development of this study.

Conflicts of Interest

The authors declare no conflict of interest.

References

  1. Yan, S.; Li, H. Harm and prevention of particulate matter 2.5. Sci. Technol. Inf. 2013, 15, 38–39. [Google Scholar]
  2. Yuet, L.L.; Sequeira, R. Water-soluble aerosol and visibility degradation in Hong Kong during autumn and early winter, 1998. Environ. Pollut. 2002, 116, 225–233. [Google Scholar]
  3. EANET. Second Periodic Report on the State of Acid Deposition in East Asia (Part III)—Executive Summary. Available online: http://www.eanet.asia/product/ (accessed on 29 December 2016).
  4. Yang, S.; Cao, J.; Shen, Z.; Liu, S.; Zhang, S.; Wang, Q.; Qiang, J.; Li, W. Variations of water-soluble ions in PM2.5 at Xi’an between summer and winter. Environ. Chem. 2012, 31, 1179–1188. [Google Scholar]
  5. Gu, J.; Wu, L.; Huo, G.; Bai, Z.; Du, S.; Liu, A.; Xie, Y. Pollution character and source of water-soluble inorganic ions in PM2.5 over tianjin. Environ. Monit. China 2013, 29, 30–34. [Google Scholar]
  6. Zhang, B.; Zhang, C.; Zhou, B.; Jiao, J.; Jiang, J.; Tao, L. Time series characteristics of atmospheric particulate pollution PM2.5 and its water-soluble inorganic ion during the heating period of Xi’an. Chin. J. Environ. Eng. 2012, 6, 1643–1646. [Google Scholar]
  7. Katul, G.G.; Gronholm, T.; Launiainen, S.; Vesala, T. The effects of the canopy medium on dry deposition velocities of aerosol particles in the canopy sub-layer above forested ecosystems. Atmos. Environ. 2011, 45, 1203–1212. [Google Scholar] [CrossRef]
  8. Wyers, G.P.; Duyzer, J.H. Micrometeorological measurement of the dry deposition flux of sulfate and nitrate aerosols to coniferous forest. Atmos. Environ. 1997, 31, 333–343. [Google Scholar] [CrossRef]
  9. Elshout, A.J.; Viljeen, J.W.; van Duuren, H. Sulphates and sulphuric acid in the atmosphere in the years 1971–1976 in The Netherlands. Atmos. Environ. 1978, 12, 785–790. [Google Scholar] [CrossRef]
  10. Gallagher, M.W.; Beswick, K.M.; Duyzer, J.; Westrate, H.; Choularton, T.W.; Hummelshoj, P. Measurements of aerosol fluxes to speulder forest using a micrometeorological technique. Atmos. Environ. 1997, 31, 359–373. [Google Scholar] [CrossRef]
  11. Vong, R.J.; Vong, I.J.; Vickers, D.; Covert, D.S. Size-dependent aerosol deposition velocities during bearpex’07. Atmos. Chem. Phys. 2010, 10, 5749–5758. [Google Scholar] [CrossRef]
  12. Wesely, M.L.; Cook, D.R.; Hart, R.L.; Speer, R.E. Measurement and parameterization of particulate sulfur dry deposition over grass. J. Geophys. Res. 1985, 90, 2131–2143. [Google Scholar] [CrossRef]
  13. Hicks, B.B.; Wesely, M.L.; Durham, J.L.; Brown, M.A. Some direct measurements of atmospheric sulfur fluxes over a pine plantation. Atmos. Environ. 1982, 16, 2899–2903. [Google Scholar] [CrossRef]
  14. Hicks, B.B.; Matt, D.R.; McMillan, R.T.; Womack, J.D.; Wesely, M.L.; Hart, R.L.; Cook, D.R.; Lindberg, S.E.; De Pena, R.G.; Thomsom, D.W. A field investigation of sulfate fluxes to a deciduous forest. J. Geophys. Res. 1989, 94, 13003–13011. [Google Scholar] [CrossRef]
  15. Tsai, J.H.; Chang, L.P.; Chiang, H.L. Size mass distribution of water-soluble ionic species and gas conversion to sulfate and nitrate in particulate matter in southern Taiwan. Environ. Sci. Pollut. Res. Int. 2013, 20, 4587–4602. [Google Scholar] [CrossRef] [PubMed]
  16. Matsuda, K.; Fujimura, Y.; Hayashi, K.; Takahashi, A.; Nakaya, K. Deposition velocity of PM2.5 sulfate in the summer above a deciduous forest in central Japan. Atmos. Environ. 2010, 44, 4582–4587. [Google Scholar] [CrossRef]
  17. Cheng, M.T.; Horng, C.L.; Lin, Y.C. Characteristics of atmospheric aerosol and acidic gases from urban and forest sites in central Taiwan. Bull. Environ. Contam. Toxicol. 2007, 79, 674–677. [Google Scholar] [CrossRef] [PubMed]
  18. Sun, F.; Yin, Z.; Lun, X.; Zhao, Y.; Li, R.; Shi, F.; Yu, X. Deposition velocity of PM2.5 in the winter and spring above deciduous and coniferous forests in Beijing, China. PLoS ONE 2014, 9, e97723. [Google Scholar] [CrossRef] [PubMed]
  19. Liu, J.; Zhu, L.; Wang, H.; Yang, Y.; Liu, J.; Qiu, D.; Ma, W.; Zhang, Z.; Liu, J. Dry deposition of particulate matter at an urban forest, wetland and lake surface in Beijing. Atmos. Environ. 2016, 125, 178–187. [Google Scholar] [CrossRef]
  20. Zhang, L.; Gong, S.; Padro, J.; Barrie, L. A size-segregated particle dry deposition scheme for an atmospheric aerosol module. Atmos. Environ. 2001, 35, 549–560. [Google Scholar] [CrossRef]
  21. Erisman, J.W.; Draaijers, G.P.J. Atmospheric Deposition in Relation to Acidification and Eutrophication; Elsevier Science: Amsterdam, Netherlands, 1995; Volume 63, p. 405. [Google Scholar]
  22. Wesely, M.L.; Hicks, B.B. Some factors that affect the deposition rates of sulfur dioxide and similar gases on vegetation. J. Air Pollut. Control Assoc. 1977, 27, 1110–1116. [Google Scholar] [CrossRef]
  23. Walter, R.; Hans, T.; Peter, E. The dry deposition of particles to a forest canopy: A comparison of model and experimental results. Atmos. Environ. 1997, 31, 399–415. [Google Scholar]
  24. Garland, J.A. Dry and wet removal of sulphur from the atmosphere. Atmos. Environ. 1978, 12, 349–362. [Google Scholar] [CrossRef]
  25. Hicks, B.B.; Baldocchi, D.D.; Meyers, T.P.; Hosker, R.P., Jr.; Matt, D.R. A preliminary multiple resistance routine for deriving dry deposition velocities from measured quantities. Water Air Soil Pollut. 1987, 36, 311–330. [Google Scholar] [CrossRef]
  26. Wang, L.-L.; Wang, Y.-S.; Wang, Y.-H.; Sun, Y.; Ji, D.-S.; Ren, Y.-F. Relationship between different synoptic weather patterns and concentration of NOX, O3 and PM2.5/10 in beijing during summer and autumn. China Environ. Sci. 2010, 30, 924–930. [Google Scholar]
  27. Yarnal, B. Synoptic climatology in environmental analysis, a primer. J. Prev. Med. Inf. 1993, 347, 170–180. [Google Scholar]
  28. Petroff, A.; Mailliat, A.; Amielh, M.; Anselmet, F. Aerosol dry deposition on vegetative canopies. Part I: Review of present knowledge. Atmos. Environ. 2008, 42, 3625–3653. [Google Scholar] [CrossRef]
  29. Slinn, W.G.N. Predictions for particle deposition to vegetative canopies. Atmos. Environ. 1982, 16, 1785–1794. [Google Scholar] [CrossRef]
  30. Xu, Y.; Gregory, R.C. Modeling the dry deposition velocity of sulfur dioxide and sulfate in Asia. Appl. Meteorol. 1998, 37, 1084–1099. [Google Scholar] [CrossRef]
Figure 1. The experimental towers of Olympic Forest Park and Jiufeng National Forest Park.
Atmosphere 08 00003 g001
Figure 2. The daily average concentrations of SO42− at the height of 9 m in March and May in two sampling sites. (a) March 2013; (b) May 2013.
Atmosphere 08 00003 g002
Figure 3. The average PM2.5 SO42− concentration at the various heights and sites. The average PM2.5 SO42− concentration at the heights of 1.5 m, 9 m, and 15 m during the day and night in May 2013 in Olympic Forest Park and Jiufeng National Forest Park. The error bars are the standard errors at the various heights.
Atmosphere 08 00003 g003
Figure 4. The relationship between deposition velocities Vd and friction velocities u*. Vd is the mean value based on different ranges of u* in May 2013 in both sites. The error bars are the standard errors of mean Vd values at each range of u*.
Atmosphere 08 00003 g004
Figure 5. The daily variation of measured Vd and calculated Vd by using different parameters. (a) Olympic Forest Park; (b) Jiufeng National Forest Park.
Atmosphere 08 00003 g005
Table 1. Meteorological conditions at two sampling sites during investigation period (mean ± standard deviation).
Olympic Forest ParkJiufeng National Forest Park
MarchMayMarchMay
DaytimeNighttimeDaytimeNighttimeDaytimeNighttimeDaytimeNighttime
Concentration of SO42− (μg/m3)29.815.026.815.022.514.721.313.7
Temperature (°C)4.16 ± 4.231.38 ± 2.7823.81 ± 5.2320.04 ± 4.574.58 ± 4.981.73 ± 2.9920.96 ± 4.9718.12 ± 4.23
Wind speed (m/s)1.12 ± 0.50.86 ± 0.431.06 ± 0.640.79 ± 0.490.97 ± 0.490.7 ± 0.381.28 ± 0.730.96 ± 0.51
Relative Humidity (%)44 ± 1750 ± 1953 ± 2059 ± 2242 ± 1847 ± 1856 ± 2162 ± 23
Solar radiation (w)221 ± 187−1.24 ± 1.3312 ± 2510.94 ± 1.6208 ± 199−1.63 ± 1.4343 ± 2311.21 ± 1.6
Table 2. Mean deposition velocities Vd, friction velocity u* and Monine-Obukhov length L in the daytime (6:00 a.m.–18:00 p.m.) and nighttime (18:00 p.m.–6:00 a.m., morrow) during the study period (May 2013). All of the values are the mean ± standard deviation.
Olympic Forest ParkJiufeng National Forest Park
DaytimeNighttimeDaytimeNighttime
u* (m/s)0.35 ± 0.220.19 ± 0.120.42 ± 0.250.31 ± 0.18
L (m)−0.18 ± 9.727.97 ± 14.3−4.37± 7.822.80 ± 6.4
Vd (cm/s)0.9 ± 1.00.4 ± 0.31.3 ± 1.20.8 ± 0.8
Table 3. Comparison between measured Vd and other calculation model values.
SurfaceSpeciesLAISampling TimeMethodVd (cm/s)LocationReference
Deciduous forestPM2.5 Sulfate1.8May 2013Gradient methodDaytime 0.9 ± 1.0, Nighttime 0.4 ± 0.3Beijing Olympic, ChinaThis work
Coniferous forest3.8May 2013Daytime 1.3 ± 1.2, Nighttime 0.8 ± 0.8Beijing Jiufeng, China
Deciduous forestPM2.5 Sulfate5–7Early summer (2 to 8 July) in 2009Gradient methodDaytime 0.9± 1.0, Nighttime 0.3 ± 0.3Mt. Asama, Japan[16]
Deciduous forestParticulate sulfate/May 1983Eddy correlationDaytime 1.0, Nighttime 0, Mean 0.6Oak Ridge, Tennessee[14]
Coniferous forestSulfate11April, June/July, September and November/December 1993Gradient methodStable ~0.0 Unstable < 4.0 Mean 0.7 ± 0.3The Netherlands[8]
Pine forestParticulate sulfur/June 1981Eddy correlationModerately unstable 0.90 ± 0.09 Neutral 0.48 ± 0.04America[12]
Coniferous/Deciduous ForestSulfate/May 1990Eddy correlationAll day mean 0.11Asia[30]
Coniferous forestParticulate sulfur/July 1977Eddy correlationDaytime 0.5 ± 1.0, Mean 0.7North Carolina[13]

