Article

A Case Study of a Heavy Rain over the Southeastern Tibetan Plateau

1
Plateau Atmospheric and Environment Laboratory of Sichuan Province, College of Atmospheric Science, Chengdu University of Information Technology, Chengdu 610225, China
2
School of Earth and Space Sciences, CAS Key Laboratory of Atmospheric Composition and Optical Radiation, University of Science and Technology of China, Hefei 230026, China
*
Author to whom correspondence should be addressed.
Atmosphere 2016, 7(9), 118; https://doi.org/10.3390/atmos7090118
Submission received: 4 August 2016 / Revised: 5 September 2016 / Accepted: 13 September 2016 / Published: 18 September 2016

Abstract

:
This research systematically studied heavy rain that occurred on 5 August 2014 over the southeastern Tibetan Plateau (31°N–35°N, 96°E–103°E) using orbital data from the Tropical Rainfall Measuring Mission (TRMM) precipitation radar (PR), the TRMM Multi-satellite Precipitation Analysis (TMPA) products, and the European Centre for Medium-range Weather Forecast (ECMWF) Re-Analysis Interim reanalysis data (ERA-Interim). The data studied included spatial and temporal distributions of the precipitation; horizontal distributions and vertical structures of the precipitation system; convective storm top altitudes and types of rain; mean rainfall profiles; the influence of water vapor content before and after the rainfall; and the atmospheric circulation background. The results suggest that most precipitation on the Tibetan Plateau occurs in the southeast, and that the maximum near-surface precipitation rate for this event was more than 100 mm·h−1. The convection was so powerful that the convective storm top altitude surpassed 16 km. Furthermore, the water vapor content caused obvious changes in the upper troposphere and lower stratosphere (UTLS) area. The mean rainfall profile can be roughly divided into four layers and showed that the maximum rainfall rate appeared at about 5.5 km. Deep weak precipitation provided the largest contribution to the total precipitation, while the highest average precipitation rate was from deep strong convective precipitation. The atmospheric circulation situation is conducive to the formation of strong convective weather, and the terrain is also an external factor affecting precipitation for this event.

1. Introduction

The Tibetan Plateau accounts for a quarter of China’s land area. Because of its high altitude and complex terrain, it is known as “the roof of the world” and the “third pole” of the earth. In the middle of the 20th century, Yeh [1,2] and Flohn [3,4] revealed the basic features of the Tibetan Plateau (it is a megarelief area, and a major generator of both heat and cold), and analyzed its critical impact on atmospheric circulation and weather. These studies laid the foundation for the Tibetan Plateau meteorology. Since then, the Tibetan Plateau has drawn a great deal of attention from meteorologists. By the end of the 20th century, China had carried out two scientific experiments on the Tibetan Plateau (QXPMEX, 1979 and TIPEX, 1979), which together greatly advanced the scientific knowledge of the area. They revealed, for example, that the Tibetan Plateau exerts a strong influence on the global climate and the East Asian atmospheric circulation, as well as the weather and environmental changes in China [5,6,7,8].
These two scientific experiments also led to a better understanding of precipitation properties and distribution in the plateau region, where data collection is difficult because of the complex terrain. Rainfall over the Tibetan Plateau occurs mainly in the summer, and shows an obvious diurnal variation: precipitation increases after noon [5,9,10]. It is also clear that precipitation over the Tibetan Plateau is influenced by terrain, as there is more rainfall on the windward slope than on the leeward slope [11,12,13]. With the development of remote sensing technology, radar and satellite observation data provide a convenient way to study the plateau rainfall characteristics and convective activity [14,15,16,17]. The satellite known as the Tropical Rainfall Measuring Mission (TRMM) was launched on 28 November 1997, and provides valuable information on the plateau’s vertical structure and convective activity characteristics, along with its precipitation type and distribution, with the satellite’s first on-board precipitation radar (PR) data. These data overcome not only the range limitations of ground radar observation, but also the low-resolution limitations of microwave detection, which cannot capture information in the vertical direction.
Because precipitation caused by latent heat release exerts a strong influence on the atmospheric circulation system, most of the earth’s precipitation occurs in the tropical regions. Consequently, a large number of research studies have been carried out in tropical and subtropical regions, including on the Tibetan Plateau, using TRMM PR to determine the distribution and types of precipitation [18,19,20,21,22,23,24]. Shimizu [25] used data from X-band Doppler radar and TRMM PR to research the mesoscale structure of the Tibetan Plateau stratiform precipitation, and found that the plateau experienced more convective clouds during the day and more stratiform precipitation at night. Yao et al. [26] used TRMM Microwave Imager (TMI) data to study precipitation on the Tibetan Plateau, and found a negative correlation between the brightness temperature in the vertical polarization at 85 GHz channel (TB85V) and the surface precipitation rate. However, over the Tibetan Plateau, very low values of TB85V may not correspond to very intense surface precipitation rates. Fujinami et al. [13] analyzed the characteristics of diurnal variations in convection and precipitation over the southern Tibetan Plateau during the summer, using TRMM PR data, and pointed out that the formation and development of convective clouds were strongly affected by terrain. Fu et al. [27,28,29] used TRMM data to study the characteristics of summer precipitation over the Tibetan Plateau, and showed that precipitation was concentrated mainly in the southeast Tibetan Plateau during the summer, but that there was strong diurnal variation, and that the top of a precipitating cloud was always 2 km–4 km above the surrounding terrain; in other words, the cloud formed a “tower” shape. They also noted that because the precipitation classification algorithm of TRMM PR software largely depends on the height of the frozen layer, and because the default height the software selects for the frozen layer is very close to the surface height of the Tibetan Plateau, TRMM PR regards the surface echo as the bright-band echo, and therefore may misclassify weak convective precipitation over the Tibetan Plateau as stratiform rains [30].
This default assumption, combined with the understanding of precipitating clouds gained from scientific experiments on the Tibetan Plateau, has resulted in the division of the precipitation over the plateau into three categories: deep strong convective precipitation, deep precipitation (or deep weak precipitation) and shallow precipitation [29]. Bai et al. [31] also pointed out that there is significant diurnal variation in the precipitation over the Tibetan Plateau in summer, especially convective precipitation in the central plateau. In addition, the higher amounts of night rain in the Sichuan Basin are likely related to the convective system from the Tibetan Plateau as it spreads eastward. Xu et al. [32] using 11 years of TRMM observation data, compared and analyzed the pre-mei-yu (during 1 April–11 May before the onset of the monsoon), mei-yu (during 15 May–25 June in the monsoon phase with significant steering winds) and midsummer (during 1 July–10 August when steering winds disappear) seasons, and investigated the diurnal cycles of precipitation features and deep convection over the eastern Tibetan Plateau. Li et al. [33] studied the characteristics of strong convective weather patterns in the Tibetan Plateau area, compared with other geographical areas, and concluded that the rainfall intensity is lower and significantly weaker there than on the plains. Wang et al. [34], using TRMM–3A12 data, analyzed the profiles of cloud water content and precipitation water in different regions and seasons over the Tibetan Plateau, and found interannual variability of hydrometeors over a period of about ten years (1998–2010); this showed a gradual decrease over the southeastern and northwestern Tibetan Plateau, but an increase in other regions.
Most of the above-mentioned studies focused on diurnal variation and interannual variability of precipitation over the Tibetan Plateau. Few studies, though, have focused specifically on the case study of the Tibetan Plateau precipitation. Building on this previous research, this study selected a heavy rain event that occurred on 5 August 2014 over the southeastern Tibetan Plateau as a research example. In early August 2014, the whole eastern Tibet was under rainy weather, triggering a mudslide in the local area, which caused property losses for the local farmers and herdsmen. The selected case was detected by TRMM PR during this period. Based on TRMM PR data, which can provide a three-dimensional structure of precipitation, the vertical structures of this heavy rain—including vertical cross-section, convective storm top altitude and mean rainfall profile, and the distribution and change of water vapor content before and after the heavy rain—were analyzed. According to the actual situation of the Tibetan Plateau, the precipitation was divided into three types: the deep strong convective precipitation, deep weak precipitation, and shallow precipitation. Statistical data for pixel number, percentage of total precipitation, and mean rainfall rate are discussed, for each of the three types, and the possible mechanisms for convective enhancement are analyzed.

2. Data and Methods

This study used the PR-2A25 [35,36] data of Version 7, the latest version of the standard products in the TRMM data center. Kirstetter et al. [37,38] compared 2A25 data from Versions 6 and 7, by quantifying the distribution of precipitation rate, system error and random error, and concluded that Version 7 is superior to Version 6 over land areas, and will likely be the final version for TRMM PR rainfall estimates.
2A25 consists of orbital data created through the inversion of echo signals measured by PR. Every scan contains 49 pixels: the horizontal resolution is 4.3 km (Nadir) (after 24 August 2001, the post-boost was changed to 5.0 km); vertical resolution is 0.25 km; and height is from the surface to 20 km altitude (80 layers) [39]. The data also provide the three-dimensional structure of the precipitation (including the critical vertical distribution) and the types of precipitation: stratiform precipitation (the echo of PR near the 0 °C layer appears as a bright band), convective precipitation (the echo of PR has no bright band, or bright band exists but the maximum reflectivity below the bright band is higher than 39 dBZ), and other types (not belonging to either of the other two categories) [40,41]. However, Fu et al. [30] pointed out that the surface of the Tibetan Plateau is higher than other studied areas—very close to the default height of the frozen layer, and since TRMM PR regards the surface echo as the bright-band echo, the TRMM precipitation classification algorithm cannot be applied to the plateau area. In order to overcome this limitation, the precipitation on the plateau was divided into a different set of three categories: the deep strong convective precipitation (storm top altitude above 7.5 km, and the maximum echo intensity of PR more than 39 dBZ), deep weak precipitation (storm top altitude above 7.5 km, and the maximum echo intensity of PR less than 39 dBZ), and shallow precipitation (storm top altitudes below 7.5 km) [29]. This study uses these categories to classify the types of precipitation.
This study used a minimum radar echo exceeding 20 dBZ from top to ground, and defined the top of the convective cell as the storm top altitude [42,43,44]. Because the 20-dBZ radar reflectivity can contain precipitation-sized ice in convective clouds, and because the sensitivity of TRMM PR was 16–18 dBZ before orbit boost [45] and 17.2–19.2 dBZ after the boost [46,47], the 20 dBZ threshold could reasonably be used on the entire TRMM dataset. More detailed information about the physical interpretation can be found in Kelley et al. [43].
The TRMM 3B42 (V7) product, covering the globe from 50°S to 50°N, is one of the TMPA (TRMM Multi-satellite Precipitation Analysis) products. The temporal resolution is 3 h (UTC 00, 03, 06, 09, 12, 15, 18, 21) and the spatial resolution is 0.25° × 0.25°. The daily aggregated precipitation is obtained by summing all 8 sets of 3-h precipitation totals for a given day. More detailed information about TRMM 3B42 can be found in Huffman et al. [48].
The European Centre for Medium-range Weather Forecast (ECMWF) Re-Analysis Interim reanalysis data (ERA-Interim) were used to determine the weather conditions and the variation of water vapor content during the heavy rain event. The ERA-Interim dataset has a horizontal spatial resolution of 0.125° × 0.125° and 6-h temporal resolution.
The heavy rain event chosen for this study occurred in the southeastern Tibetan Plateau region (31°N–35°N, 96°E–103°E). The time was 12:26 UTC (18:50 LST, the location 31.9812°N, 96.0117°E) on 5 August 2014, and the track number of the TRMM data is 95,240.

3. Results

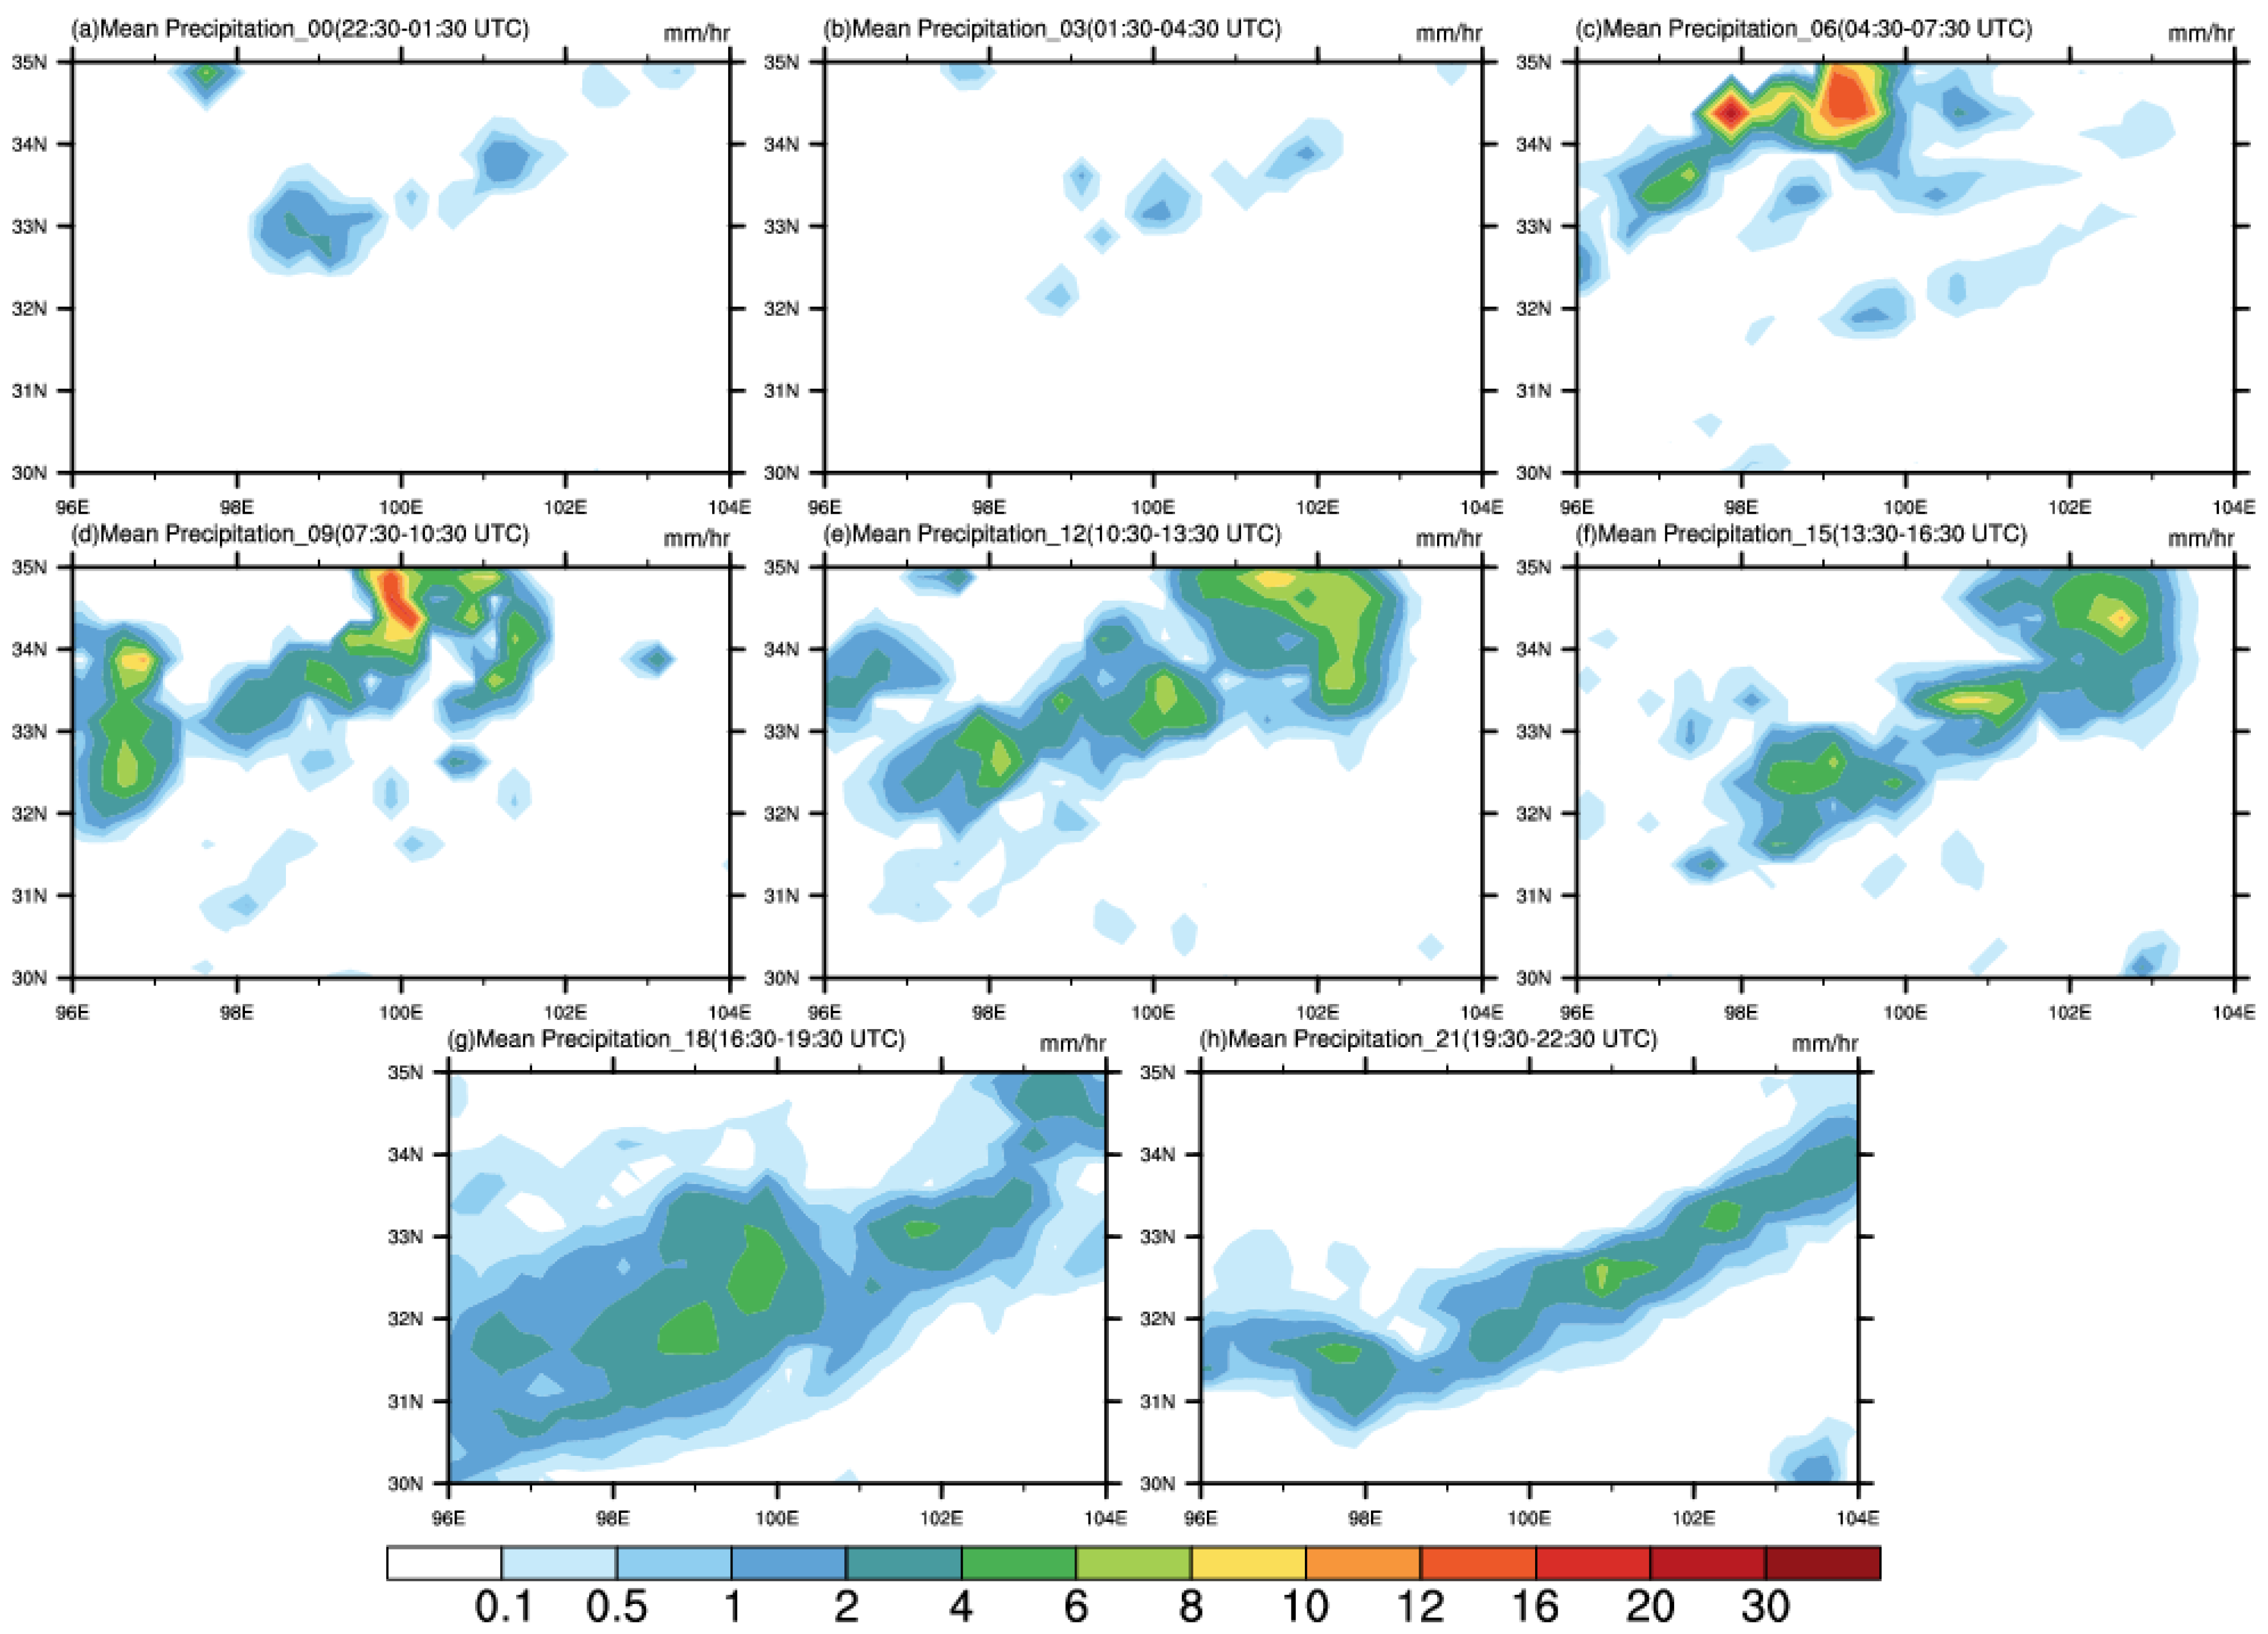
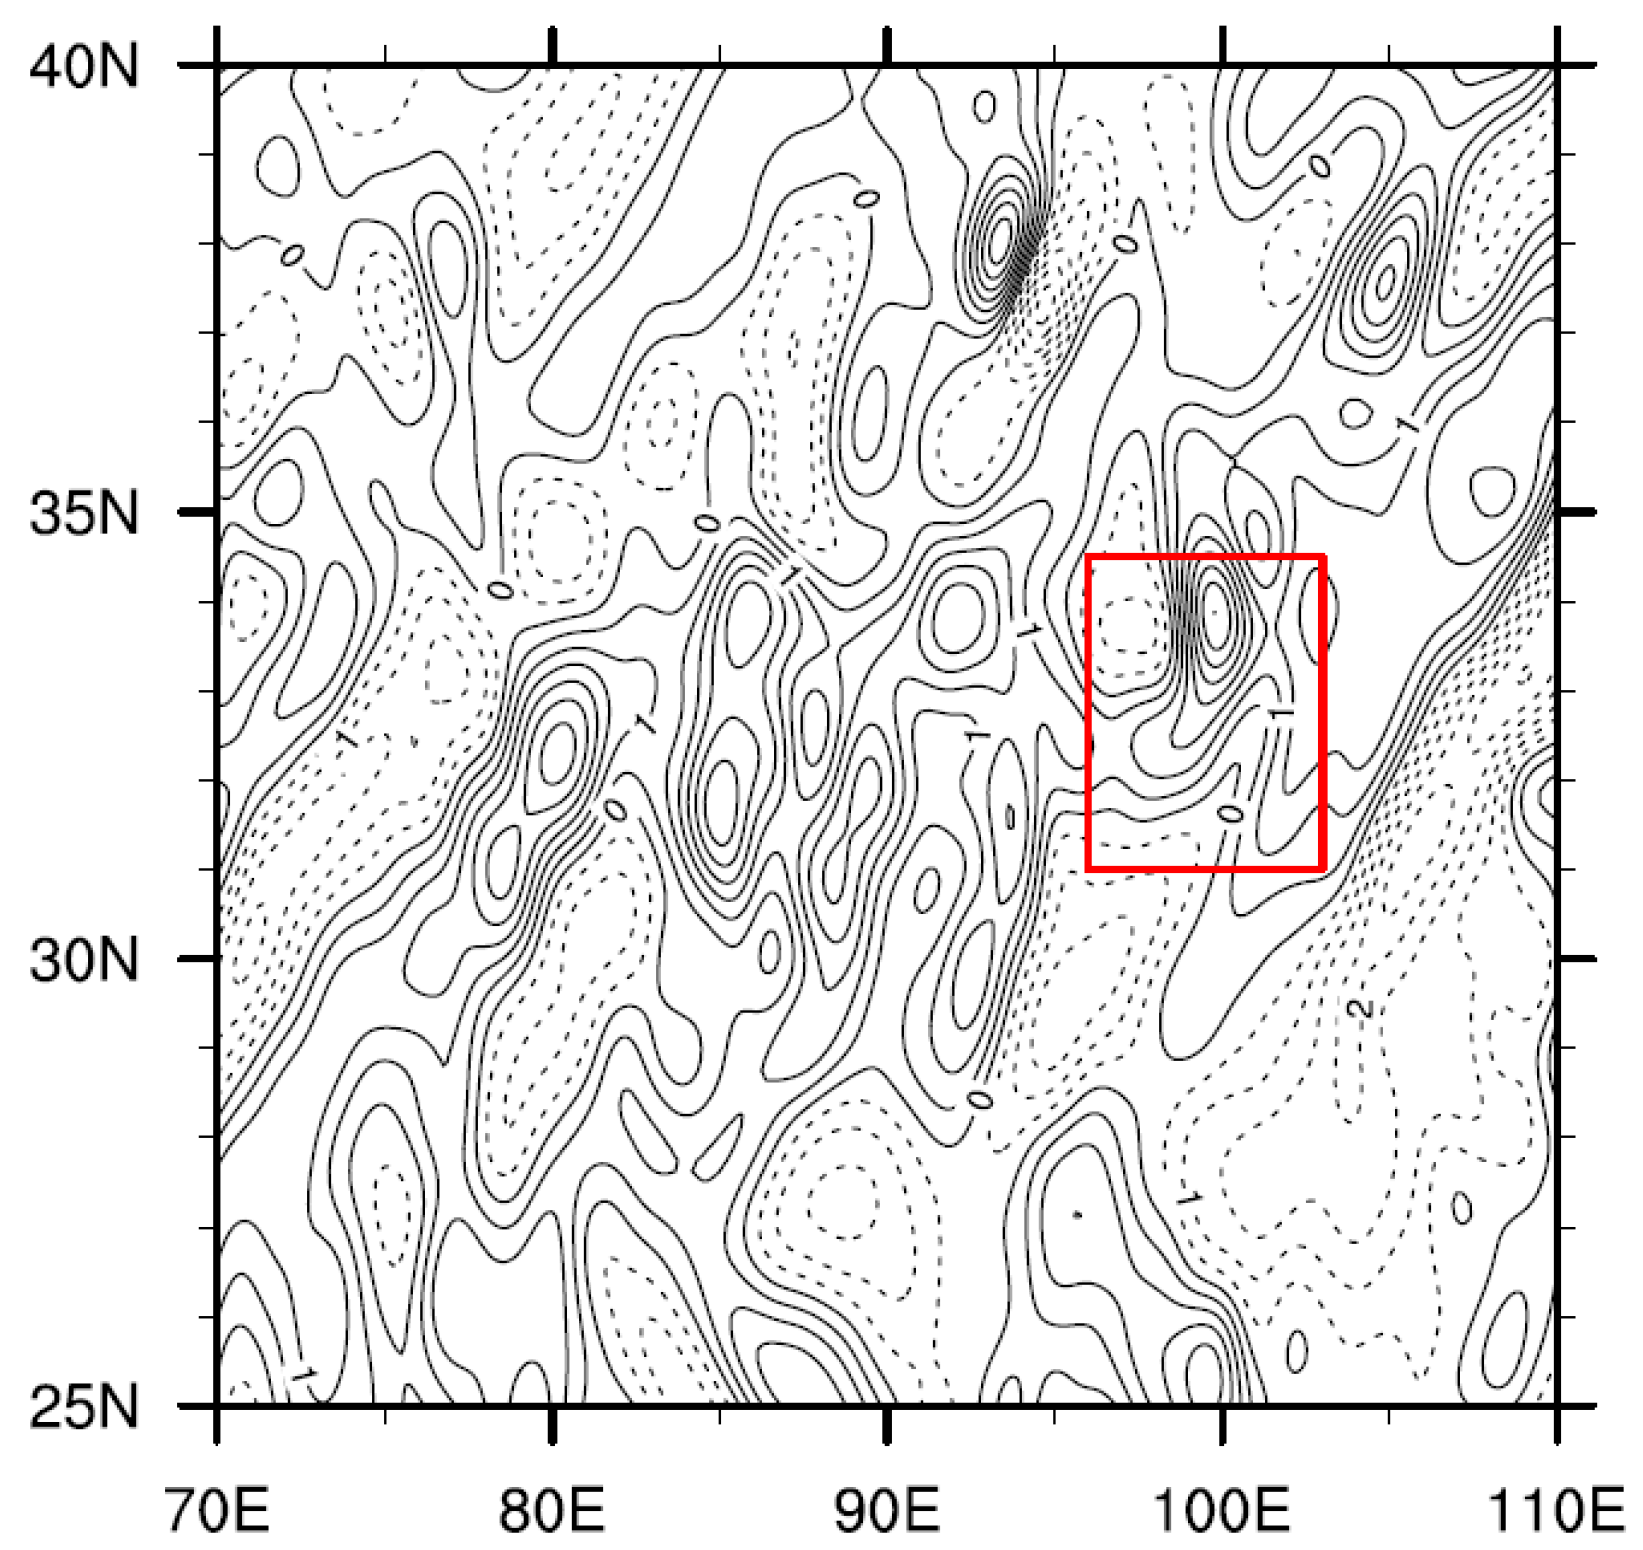
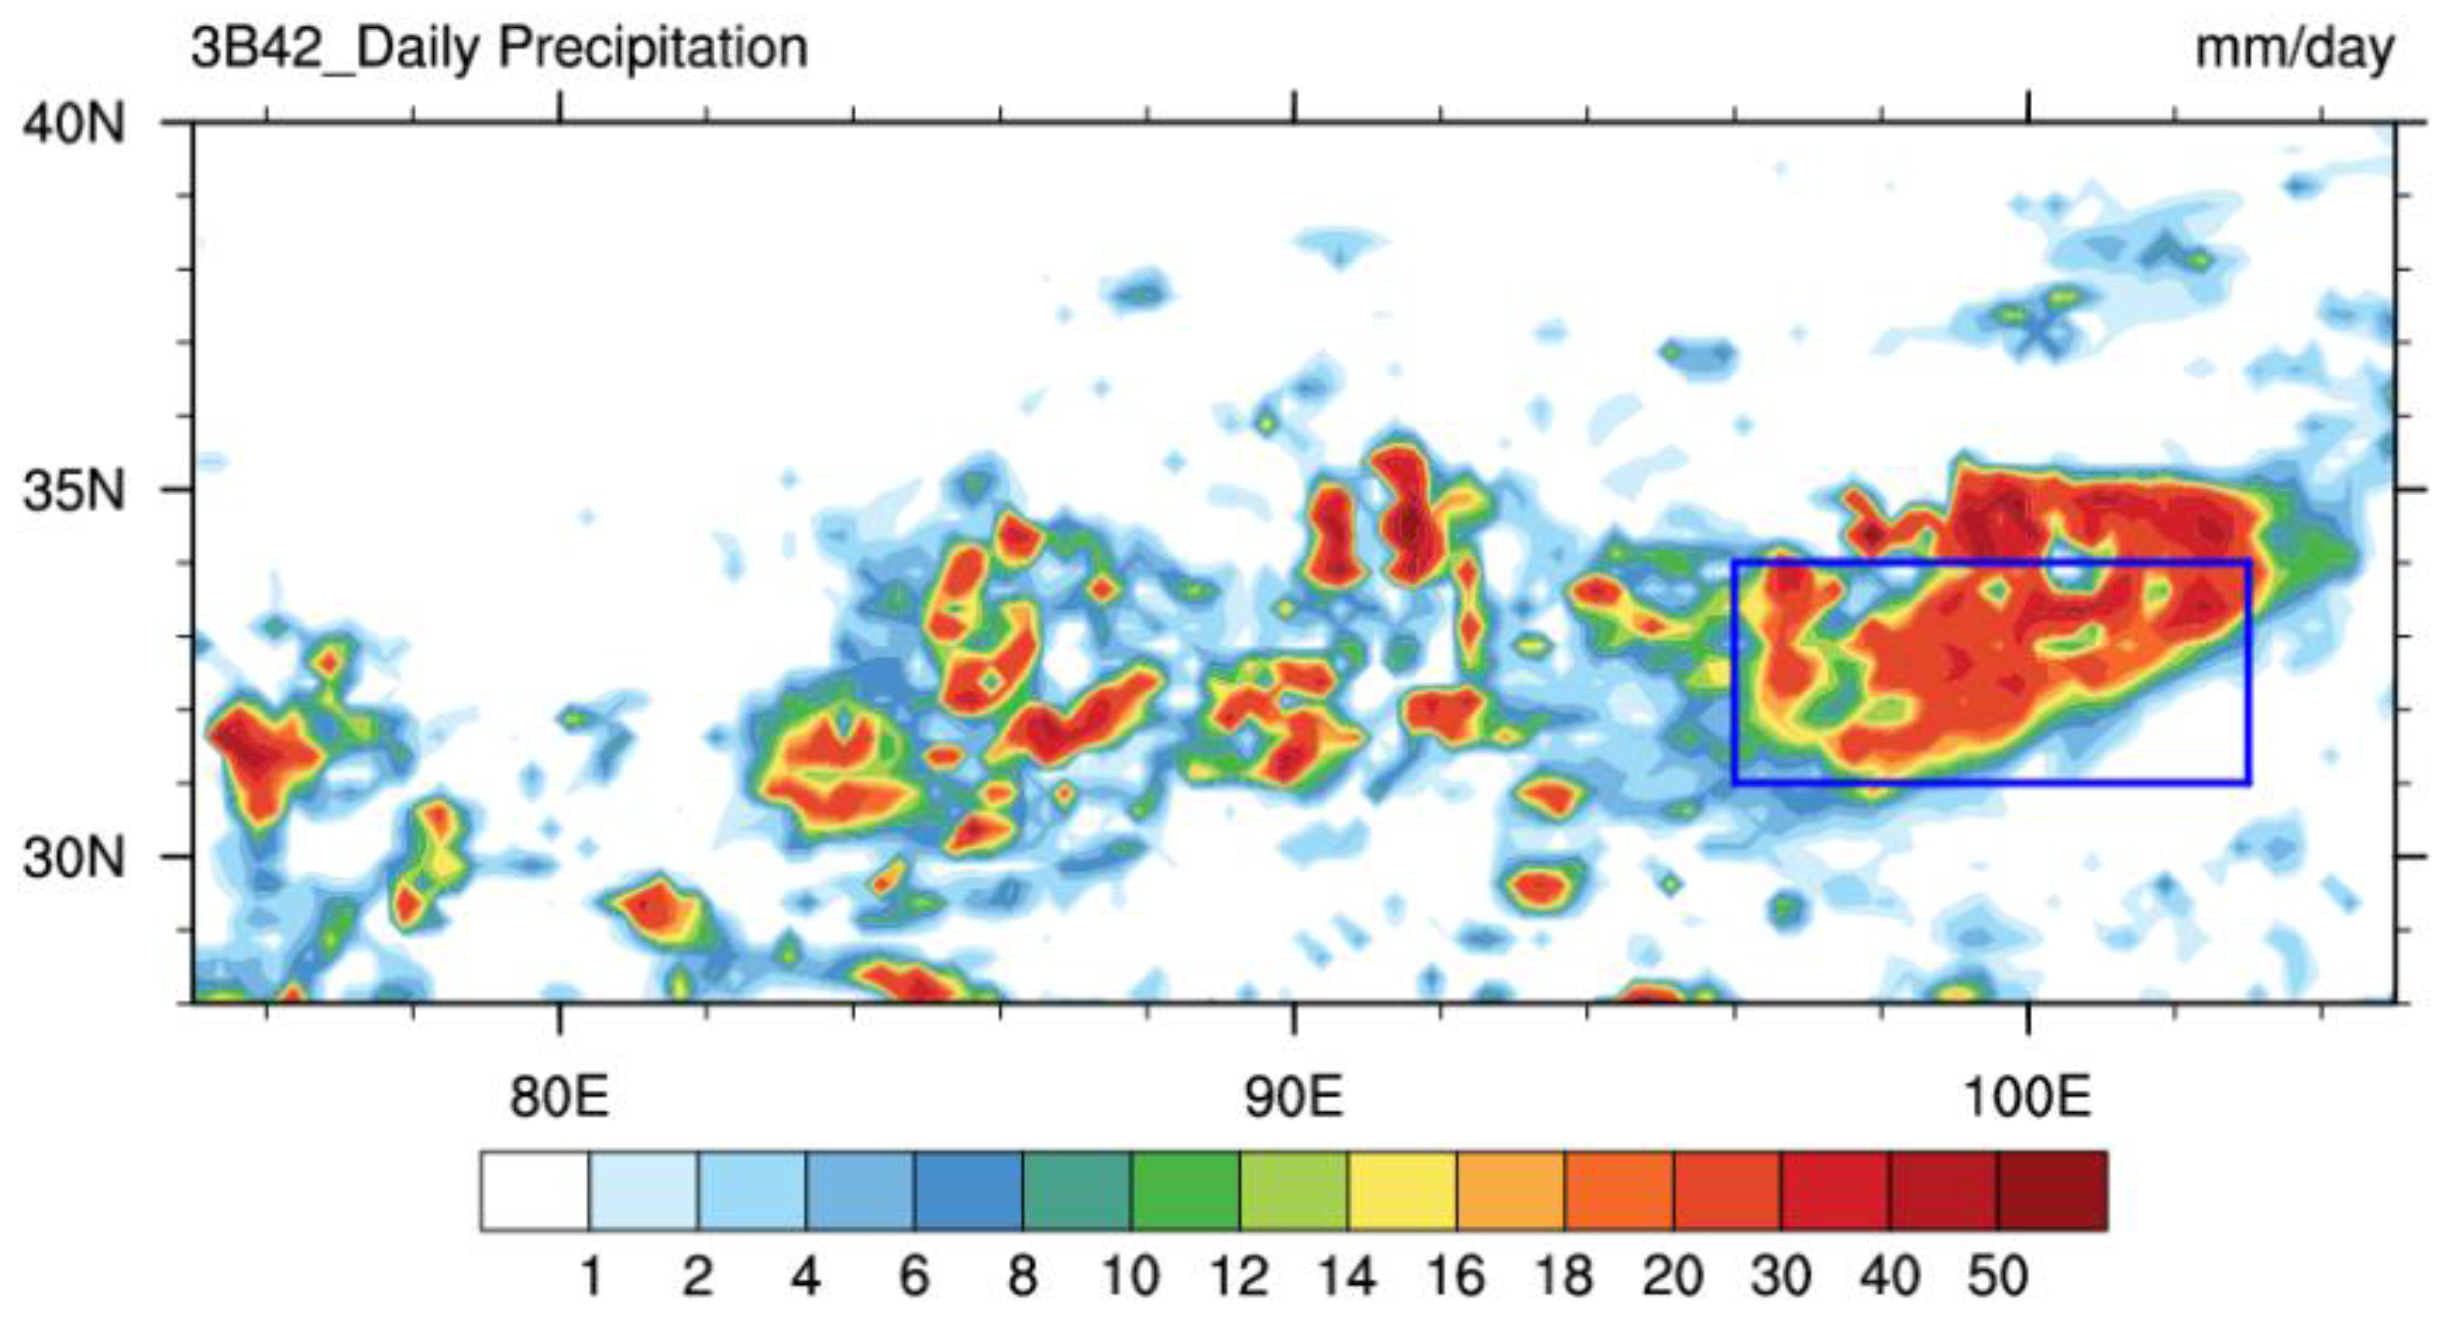
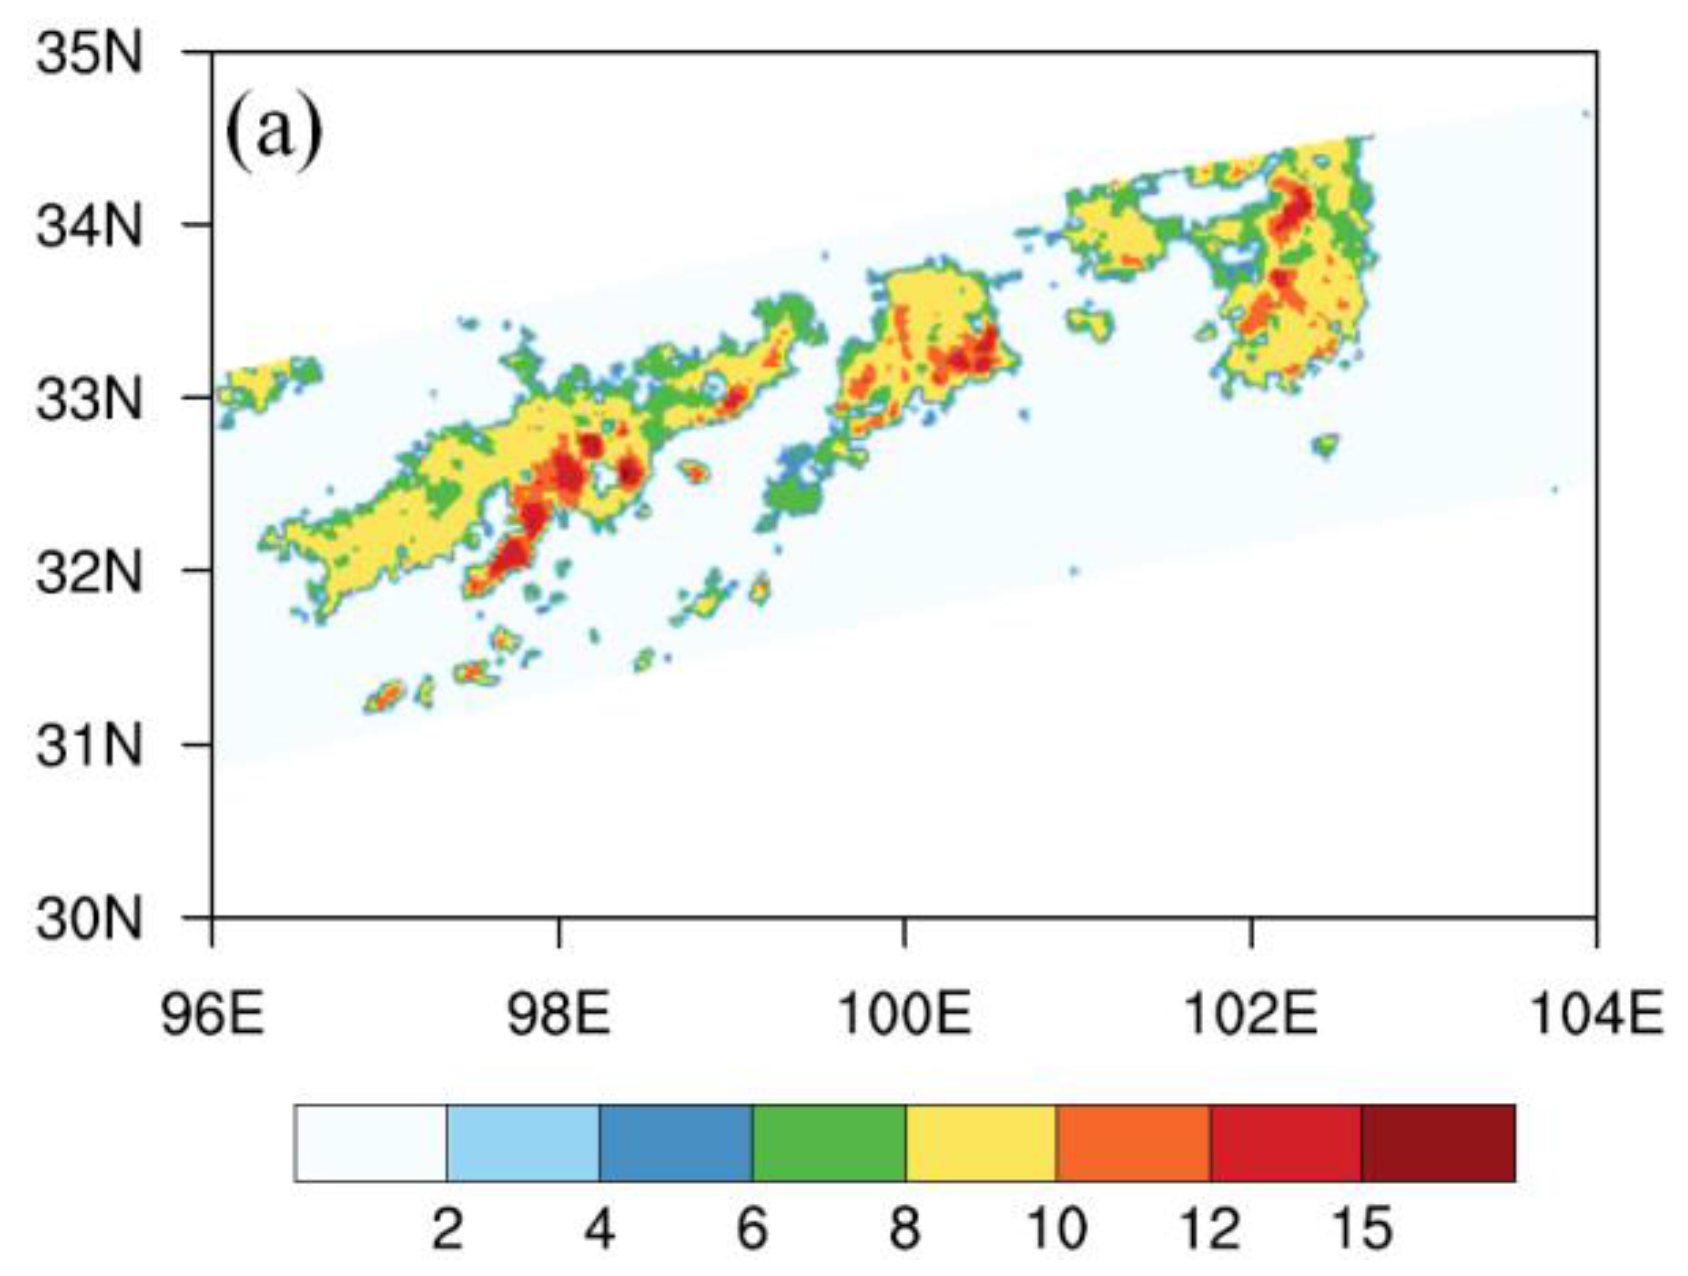
3.1. Characteristics of Horizontal Structure

The spatial distribution of the daily aggregated precipitation over the Tibetan Plateau (28°N–40°N, 75°E–105°E) on 5 August 2014 is shown in Figure 1. And Figure 2 shows the distribution of the mean 3-h precipitation rate over the southeastern Tibetan Plateau (30°N–35°N, 96°E–104°E) from 22:30 UTC on 4 August 2014 to 22:30 UTC on 5 August 2014. We can see that the precipitation mainly occurred south of 35°N (Figure 1), the largest area of rainfall detected by PR (blue band) being that shown in Figure 3a. As can be seen from Figure 2, the rain band was distributed from northeast to southwest, stretching across the Bayan Har Mountains. The maximum mean 3-h rain rate reached more than 20 mm·h−1 at 06 UTC. The precipitation area gradually increased starting at 00 UTC and reached its maximum at 18 UTC, then shrank into a thin belt. In order to conduct a comprehensive analysis of the convective structure of the precipitation, we selected one orbital precipitation event detected by PR on 5 August 2014, at 12:26 UTC, as shown in Figure 3a.
The heavy precipitation was located over the southeastern Tibetan Plateau (31°N–34°N, 96°E–103°E) where the mountains and the river valleys run east-west and southeast-northwest, respectively. Figure 3b shows the elevation map of the Tibetan Plateau. The altitudes of the precipitation area (blue box) are 3000–5500 m. The precipitation detected by PR occurred on 5 August 2014, at 12:26 UTC. From Figure 2, we can see that the precipitation (Figure 2e) was in the weakening stage at that time. The distribution of the near-surface precipitation rate is shown in Figure 3a, which shows that the heavy rain system crossed about 2°–3° longitude from east to west, and about 2°–3° latitude from north to south. It was composed of three main heavy rain belts, with a few precipitation clouds scattered around these belts. The maximum precipitation intensity in the major heavy rain belt was over 100 mm·h−1, located near 32.51°N, 98.05°E (near the maximum elevation of the precipitation area), while the precipitation cloud around it was much smaller, with a rainfall intensity of about 4 mm·h−1.

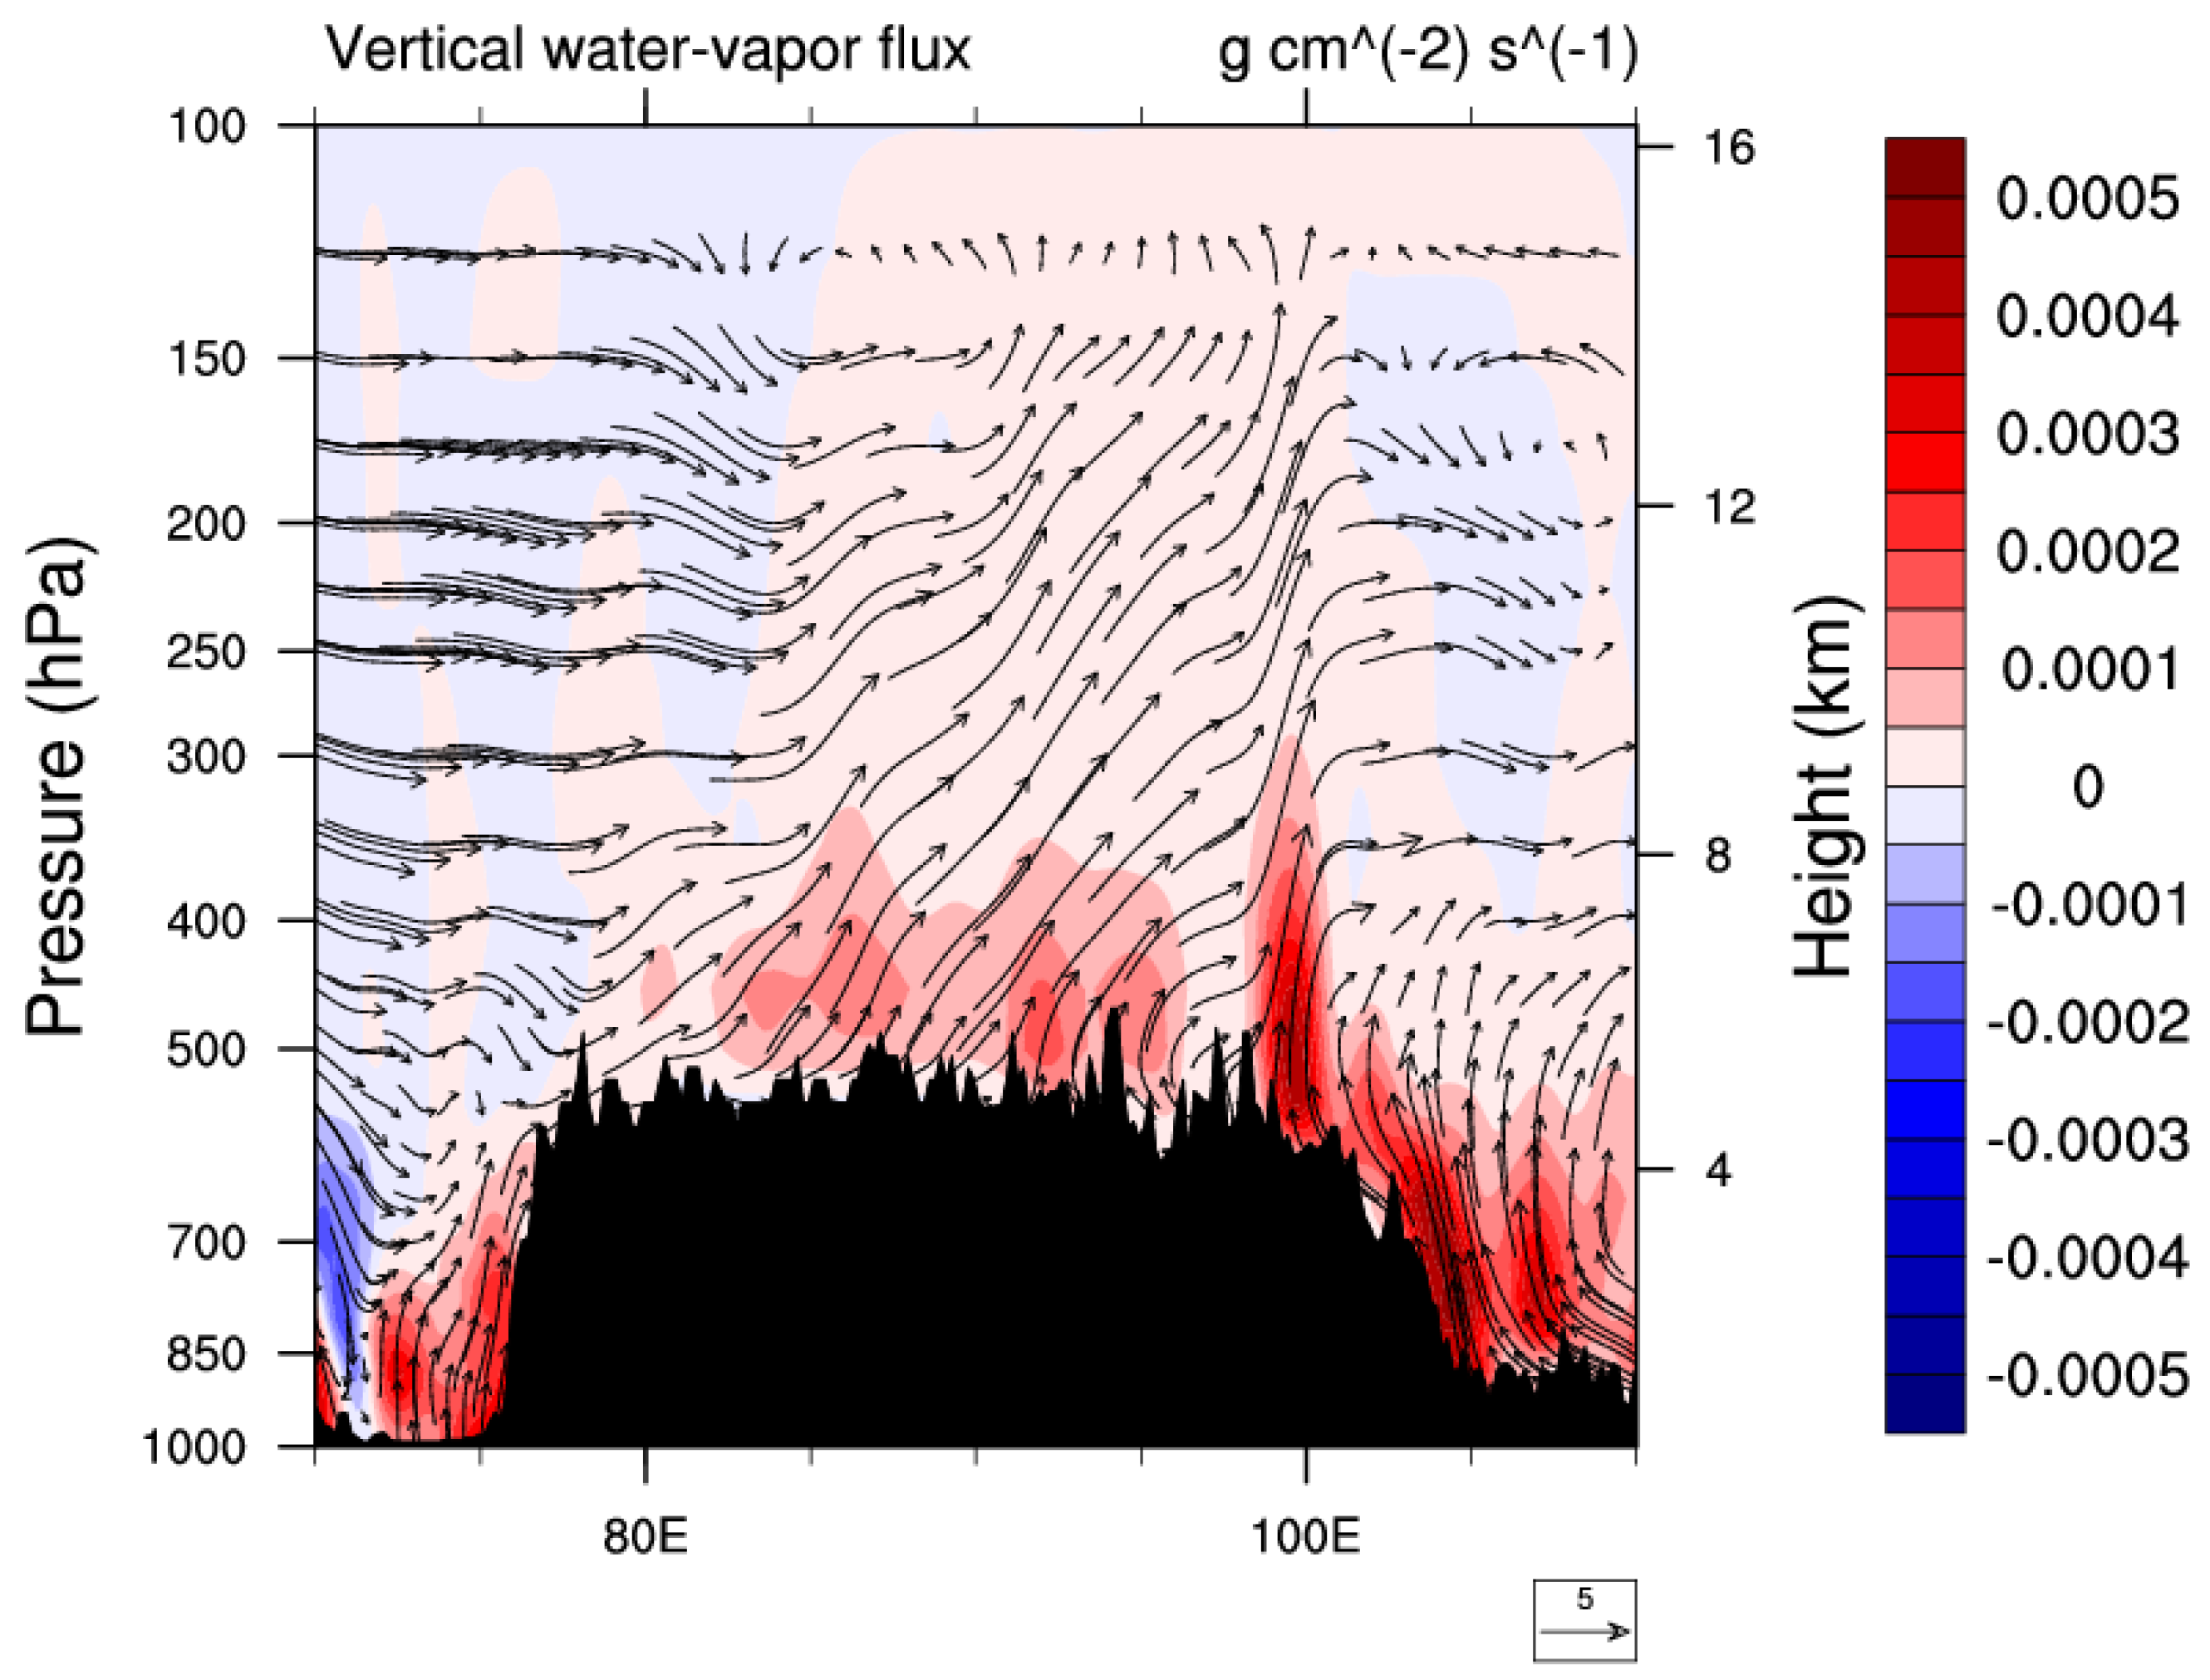
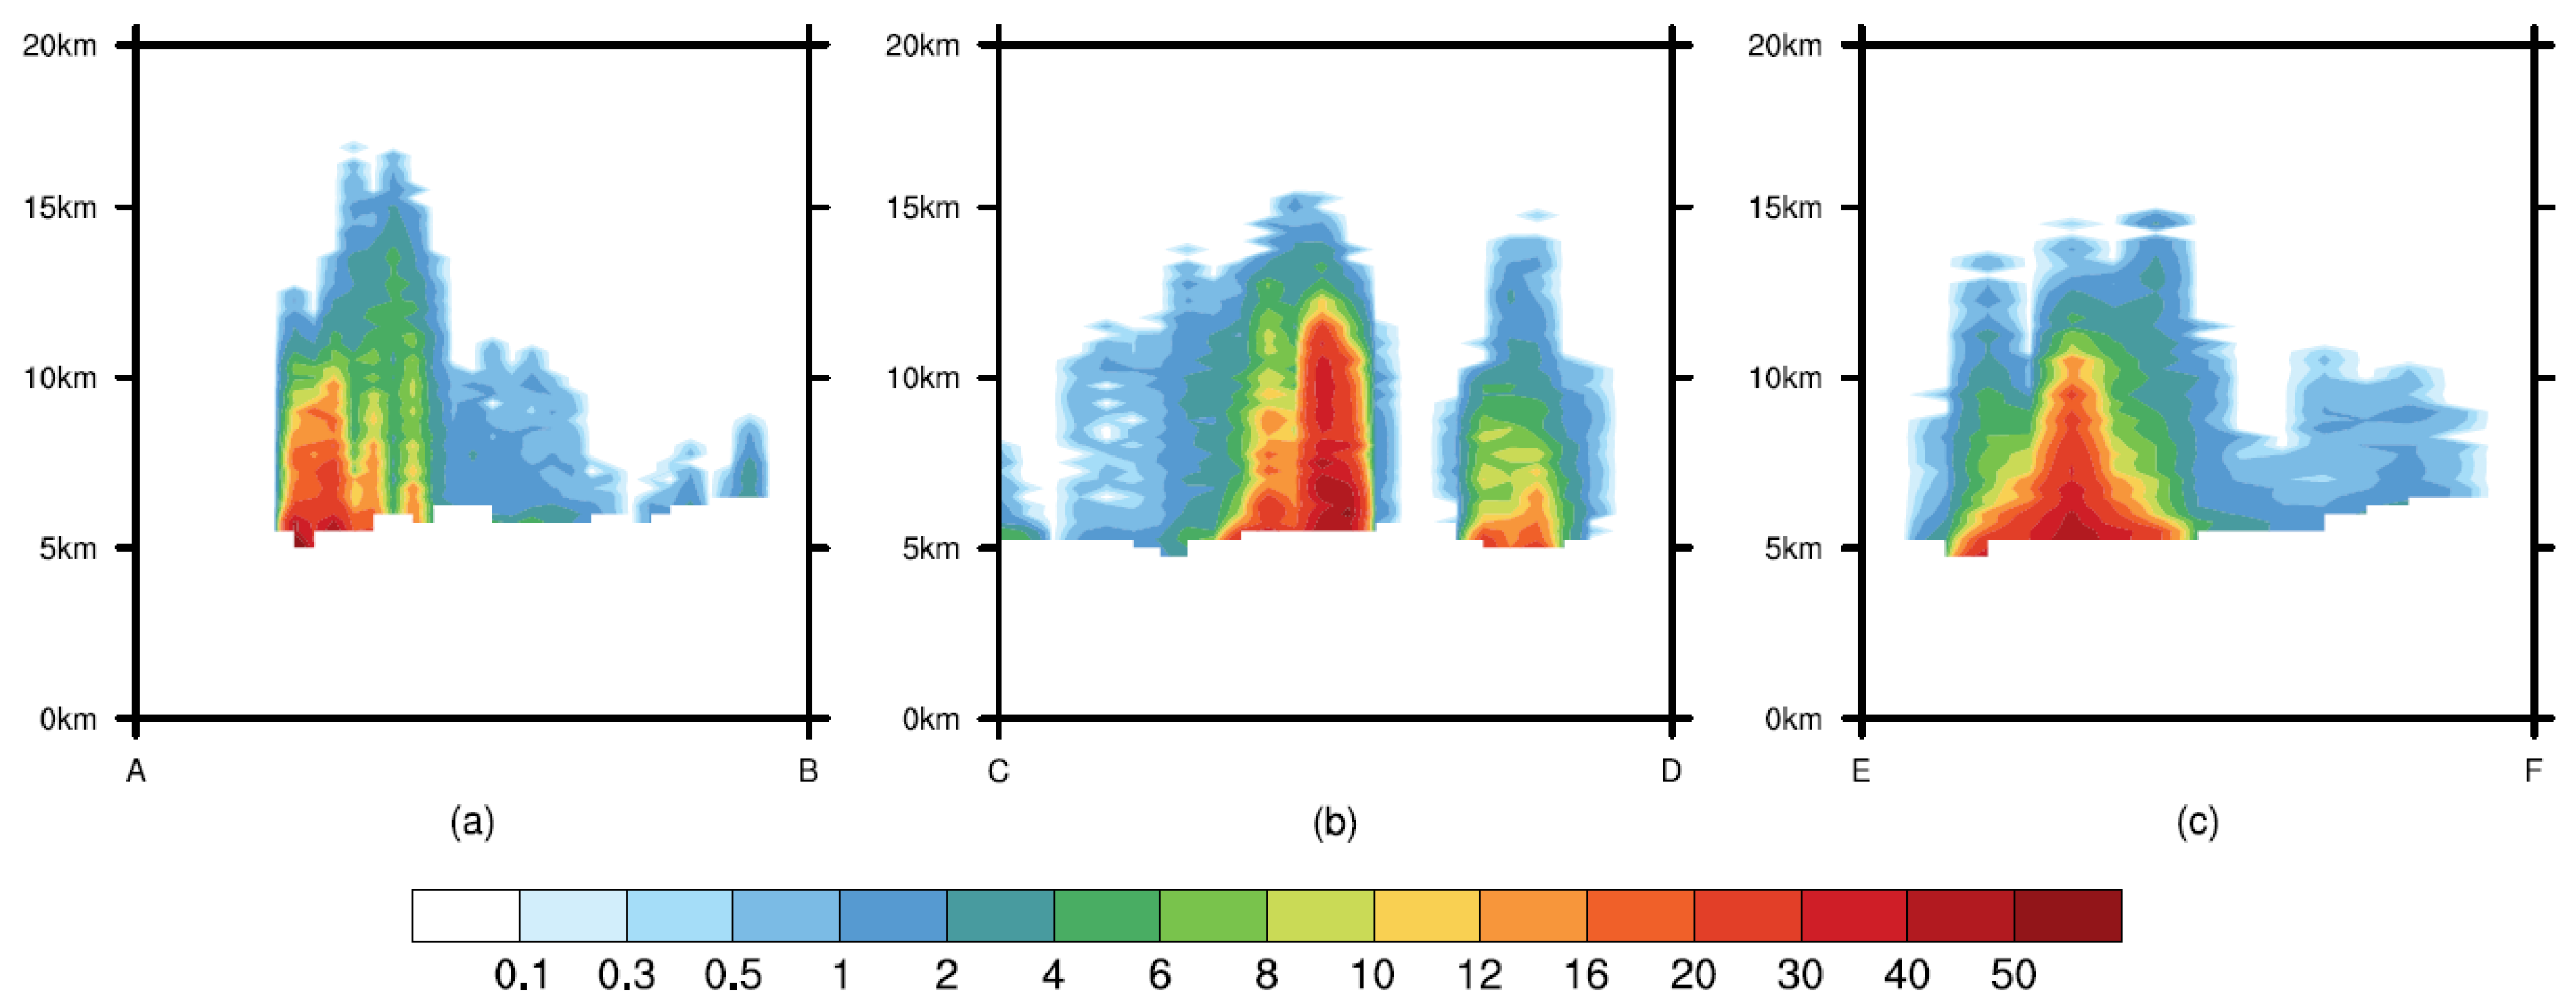
3.2. Characteristics of Vertical Structure

The vertical structure of the heavy rain center in the rain clouds was also analyzed. The vertical cross-sections along the A–B, C–D, and E–F paths in Figure 3a are shown in Figure 4. This shows that the top altitude of the strong convective precipitation system reached above 15 km (Figure 4a), which is slightly lower than the maximum that Fu et al. [27] found, in their study of the convective precipitation on the Tibetan Plateau during summer: more than 17 km. The convection of the heavy rain was very strong; its maximum precipitation intensity surpassed 50 mm·h−1, and the convective center was at a height of about 5 km above the ground surface. The strong convective precipitation clouds showed a columnar shape, whereas Fu et al. [27] found a “steamed-bun” shape in their study of the convective precipitation on the Tibetan Plateau during summer—a slight difference. The strongest clouds moving upward from the surface extended to about 12 km (Figure 4b), although the A–B (Figure 4a) and E–F (Figure 4c) paths extended only to about 10 km. We know that some parts of the convection can penetrate the tropopause during strong convective activity. This kind of convection plays an important role in regulating the balance of energy, water vapor, ozone and other trace gases in the upper troposphere and lower stratosphere (UTLS) area [49]. Further, some studies [20,42,50] have suggested that deep convection penetrates into the UTLS, the bottom of which is located at 14 km altitude. In Figure 4, the storm top altitudes obviously exceeded 14 km, showing that the convective activity of the heavy rain was powerful.

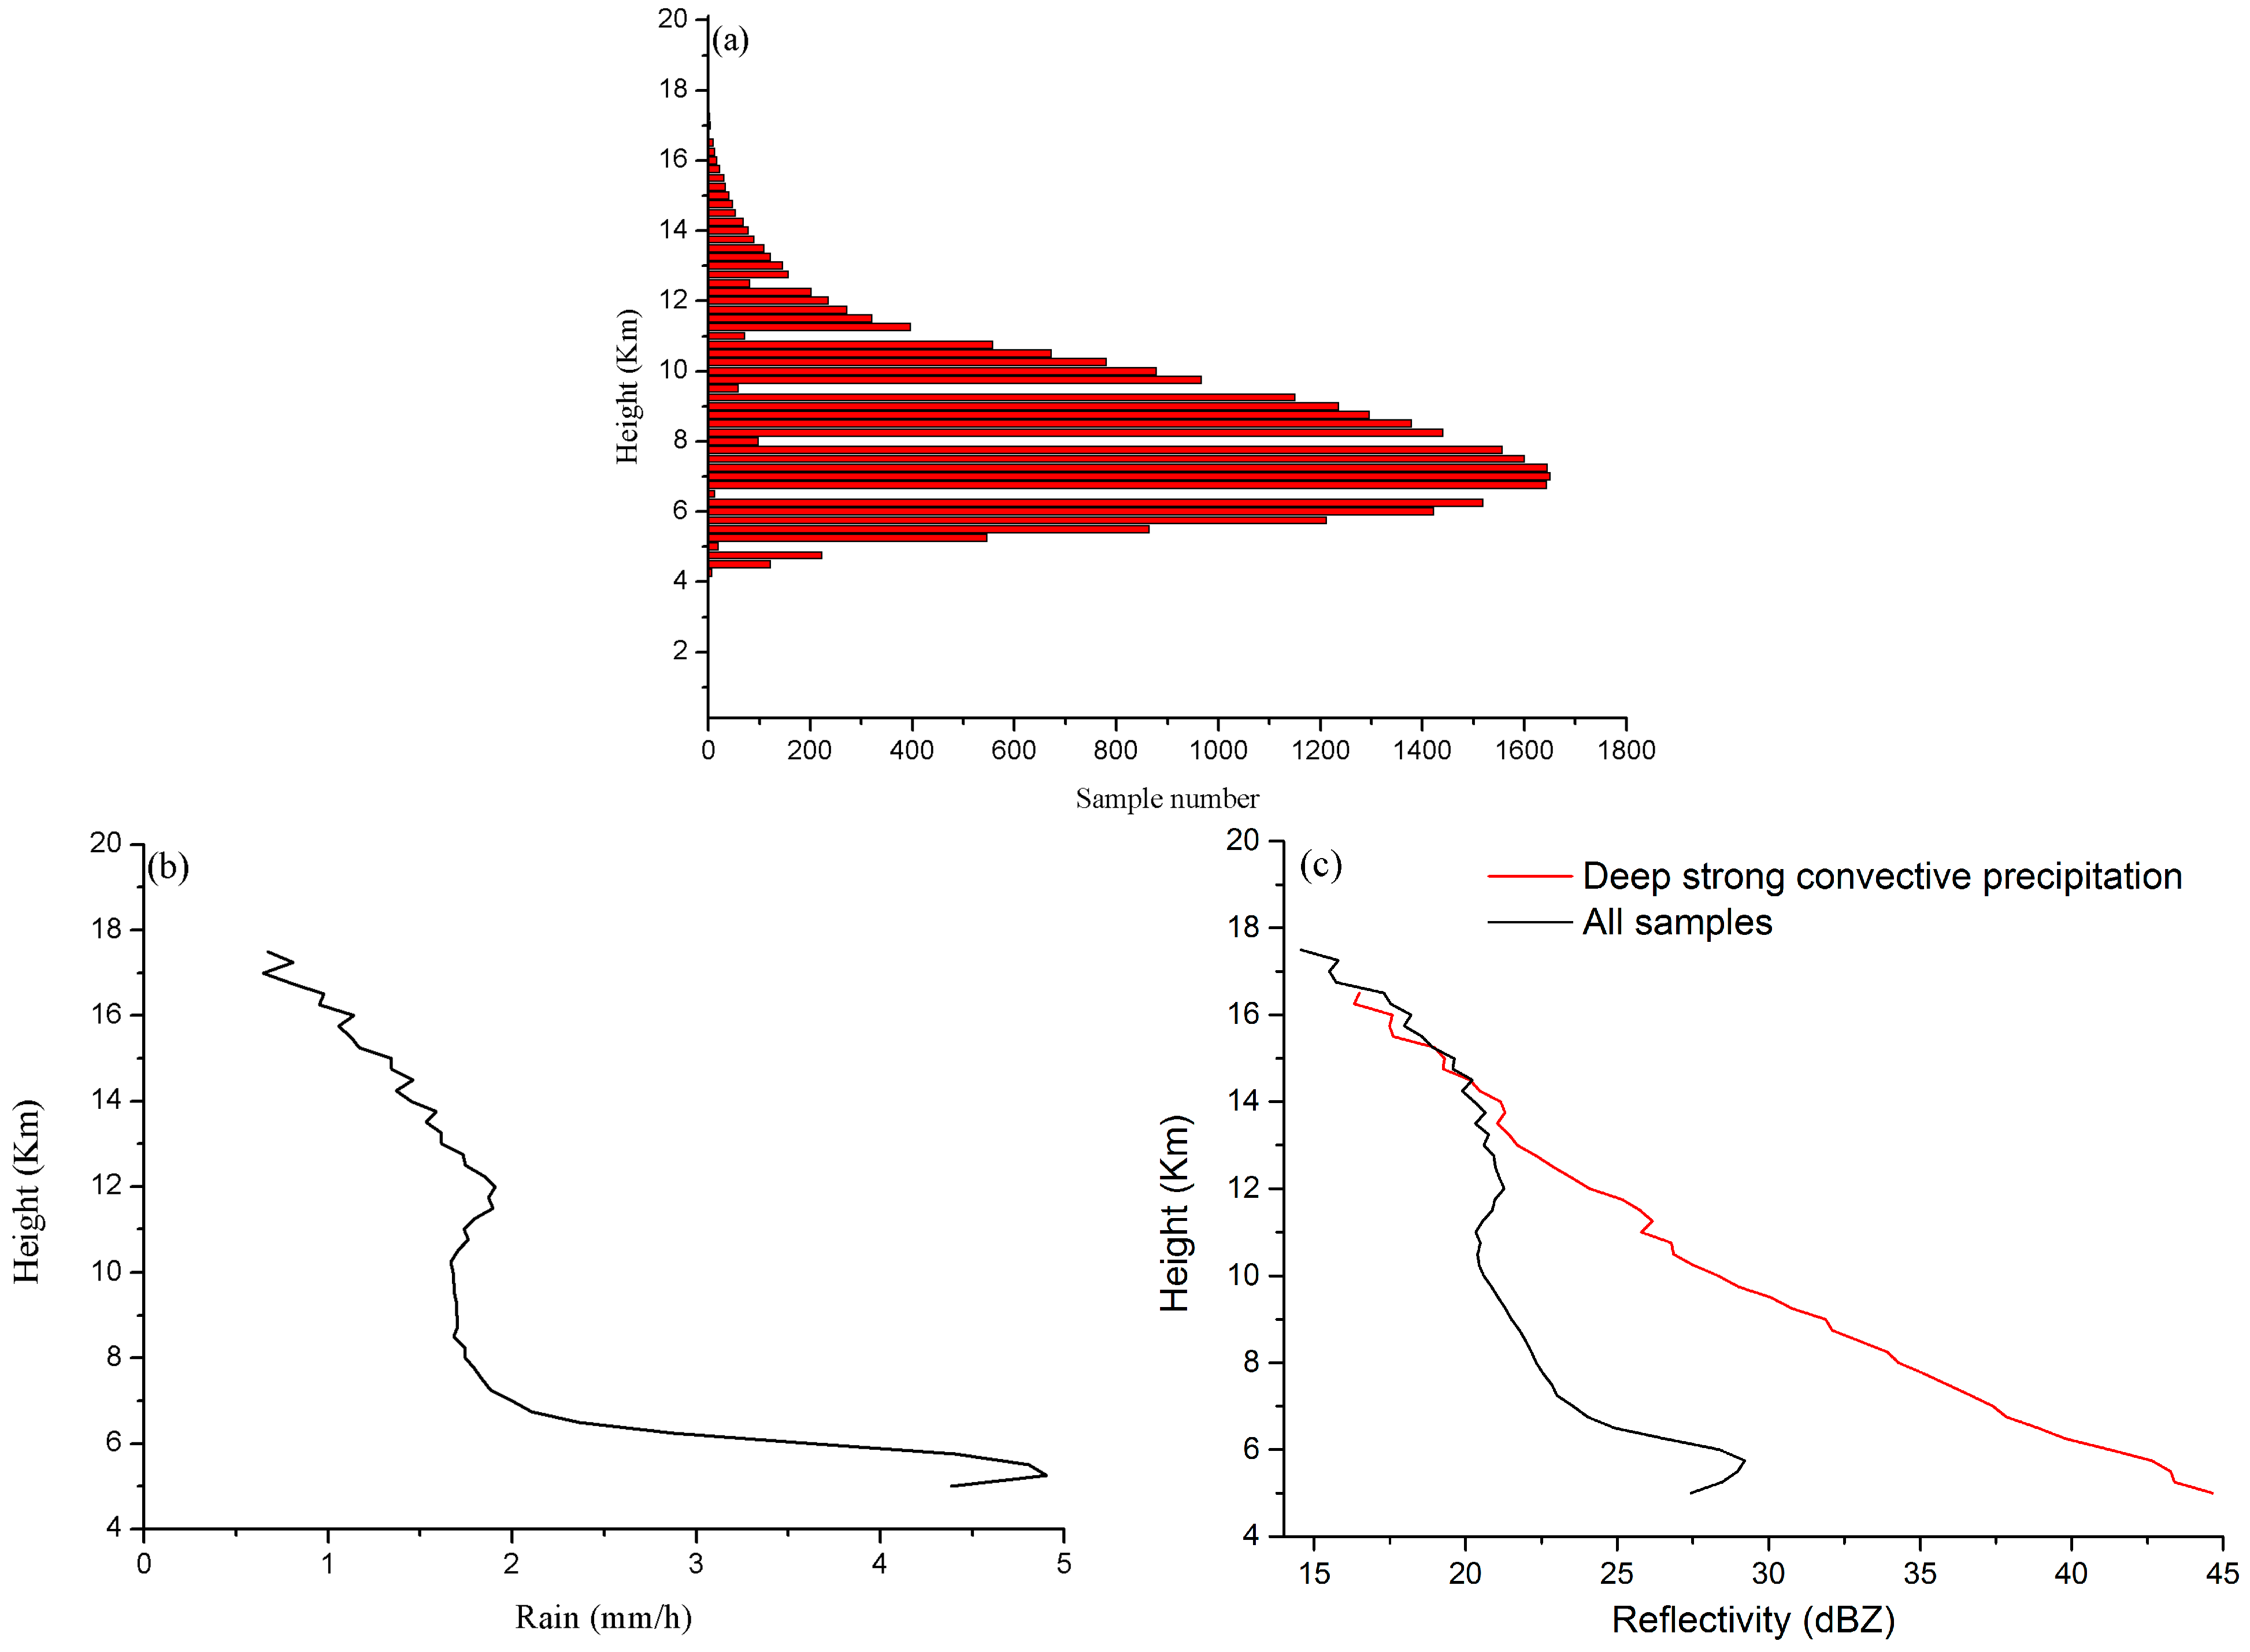
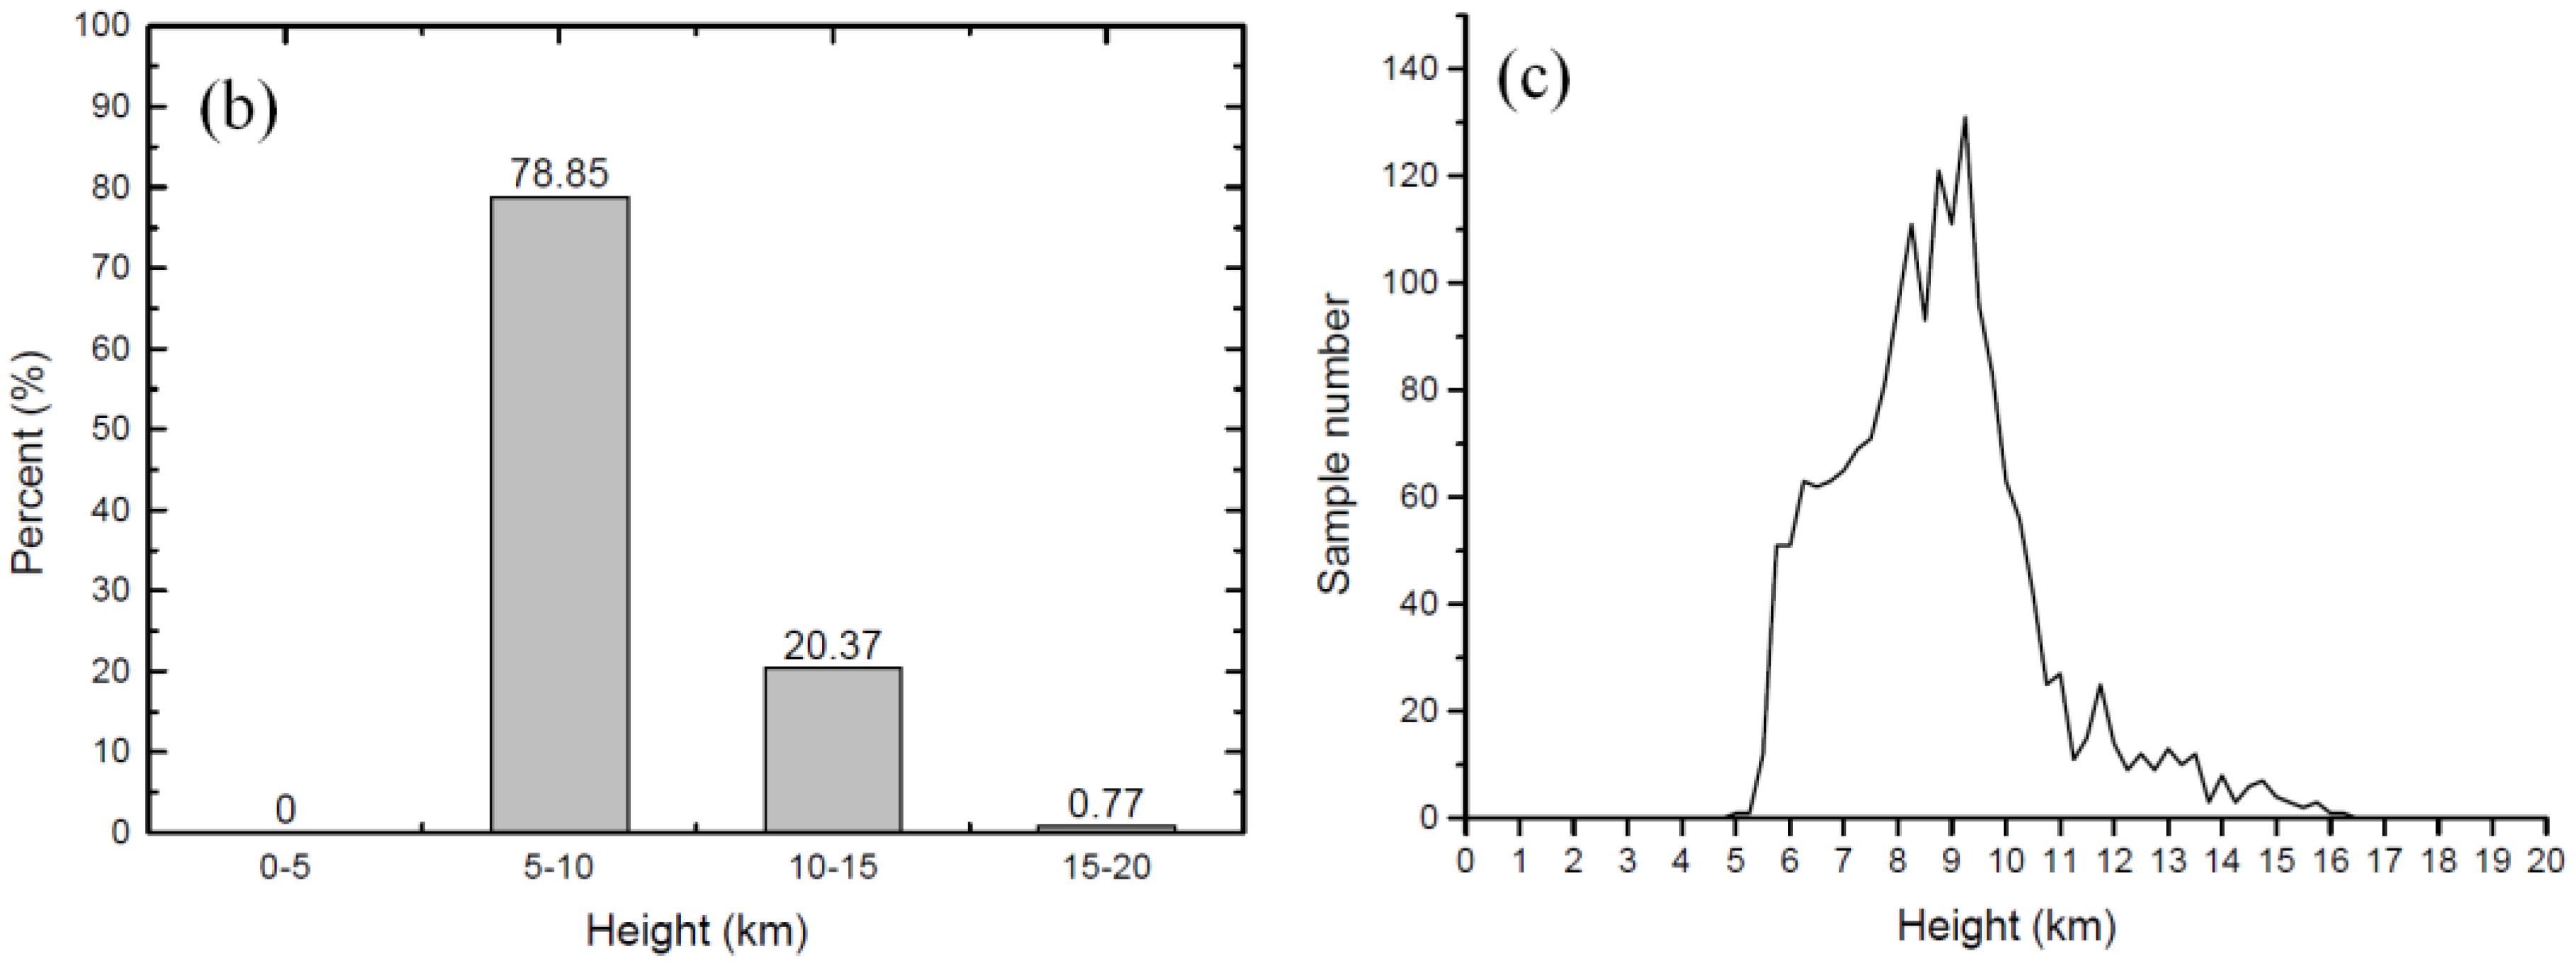
3.3. Convective Storm Top Altitudes

In the vertical cross-sections in Figure 4 we can only see some of the characteristics of the convective storm top altitudes, while in Figure 5a we can clearly see the horizontal distributions of the convective storm top altitudes of precipitation. Figure 5a shows that the storm top altitudes were largely distributed in the 8–10 km, and in a very few areas the storm top altitudes surpassed 15 km, while at the edge of the precipitation system, the top altitudes were largely distributed in the 4–8 km band. Comparing Figure 3a and Figure 5a, it can be seen that the high-value area of the convective storm top altitude distribution corresponded to the area of the greatest surface precipitation. Figure 5b shows the percentage of the different convective storm top altitudes. As can be observed visually, the proportion of the storm top altitudes within 5–10 km is the largest, accounting for nearly 80%, followed by 10–15 km, accounting for most of the remaining ~20%. The distribution of different convective storm samples’ top altitudes is shown in Figure 5c, which shows that the maximum number of samples is at about 9–10 km. Below 5 km, there was almost no rain because it was affected by the terrain, while the maximum height reached 16 km.

3.4. The Types of Rain

Based on the PR 2A25 data for the study sample, the different proportions of the total precipitation, and the corresponding average precipitation rate, of the three different types of heavy rain, are shown in Table 1. This shows that the deep weak precipitation samples contributed the most pixels, accounting for 71% of the total, similar to the conclusion that Li et al. [33] found when they studied the characteristics of strong convective weather in the Tibetan Plateau region. Moreover, the ratio of deep weak precipitation to total precipitation was about 57%, accounting for the maximum in this category as well. The number of pixels of deep strong convective precipitation was small, accounting for only about 5%, but this rainfall intensity was the highest, with an average precipitation rate of about 27 mm·h−1. The shallow precipitation samples, however, were below those from deep weak precipitation, but not the least—differing from Li et al. [33]’s conclusion that the shallow precipitation samples were the least. The ratio of shallow precipitation to the total rainfall, though, was the least, at about 9%, and the average precipitation rate of shallow precipitation was still the smallest, at only 1.45 mm·h−1. In short, this precipitation system appears to give priority to the deep weak precipitation. Although the average rain rate for this type is small, its contribution to the total precipitation is the largest, and the proportion of the deep strong convective precipitation accounts for the minimum number of pixels, even though the precipitation intensity is the largest.

3.5. Mean Rainfall Profiles

The rainfall profile is the vertical structure manifested intuitively, which is the inversion of the echo signal of PR, and the precipitation intensity varies with height. In fact, it reflects the dynamic and thermodynamic structure and the characteristics of the microphysical process of the precipitation cloud cluster [29]. Liu et al. [19], using TRMM PR data and the principal component analysis method for their study, pointed out that because the first mode of the average precipitation profiles and the specific precipitation profiles are very similar, the explained variance is the largest, so that the average precipitation profiles can be directly used to study the vertical structure characteristics of the precipitation. Yet, the high elevation of the Tibetan Plateau terrain may interfere with the PR echo, and from Figure 5c we can see that the precipitation below 5 km can be ignored, and we can choose the precipitation profiles above the height of 5 km for our analysis.
The vertical distribution of the number of samples is shown in Figure 6a. We can see the maximum sample number appears at the height of 7–8 km. Figure 6b shows that the average precipitation profiles can be roughly divided into four layers, and the maximum precipitation rate appears at the height of about 5–6 km; from this height, both upward and downward, the rainfall intensity is reduced. From the height of maximum precipitation rate down to the ground, the precipitation intensity decreases because evaporation and the radar echo attenuation effect may occur in the falling process of raindrops. From the height of the maximum precipitation rate up to about 7 km, the precipitation intensity decreases rapidly with the increase in height, which reflects the growth process of condensation in the falling process of raindrops. From the height of 7 km up to about 11–12 km is the ice-and-water mixed layer, and the precipitation intensity decreases slowly with the increase in height, which reflects the growth process of ice crystal condensation. There are small fluctuations between 11 and 12 km, and the precipitation intensity increase with the increase in height. From the ice-and-water mixed layer up, the rain intensity gradually reduces and has some small fluctuations.
In their performance evaluation of TRMM precipitation estimates, Islam et al. [51] pointed out that attenuation-corrected reflectivity from the TRMM PR agrees well with the measured reflectivity from ground-based radar, implying that the PR attenuation-correction procedure is reasonably accurate, but the conversion from attenuation-corrected reflectivity to rainfall rate may cause some problems. However, Figure 6b,c (black curve) show that the variation trends of the mean rainfall profiles and the average attenuation-corrected reflectivity profiles are similar. Therefore, the mean attenuation-corrected reflectivity profiles can also be roughly divided into four components. Here, we only discuss the change trends. In Figure 6c, the red curve shows the average attenuation-corrected reflectivity profiles of deep strong convective precipitation. Because the samples (We can see from Table 1) of deep strong convective precipitation are less, the change trend is not obvious.

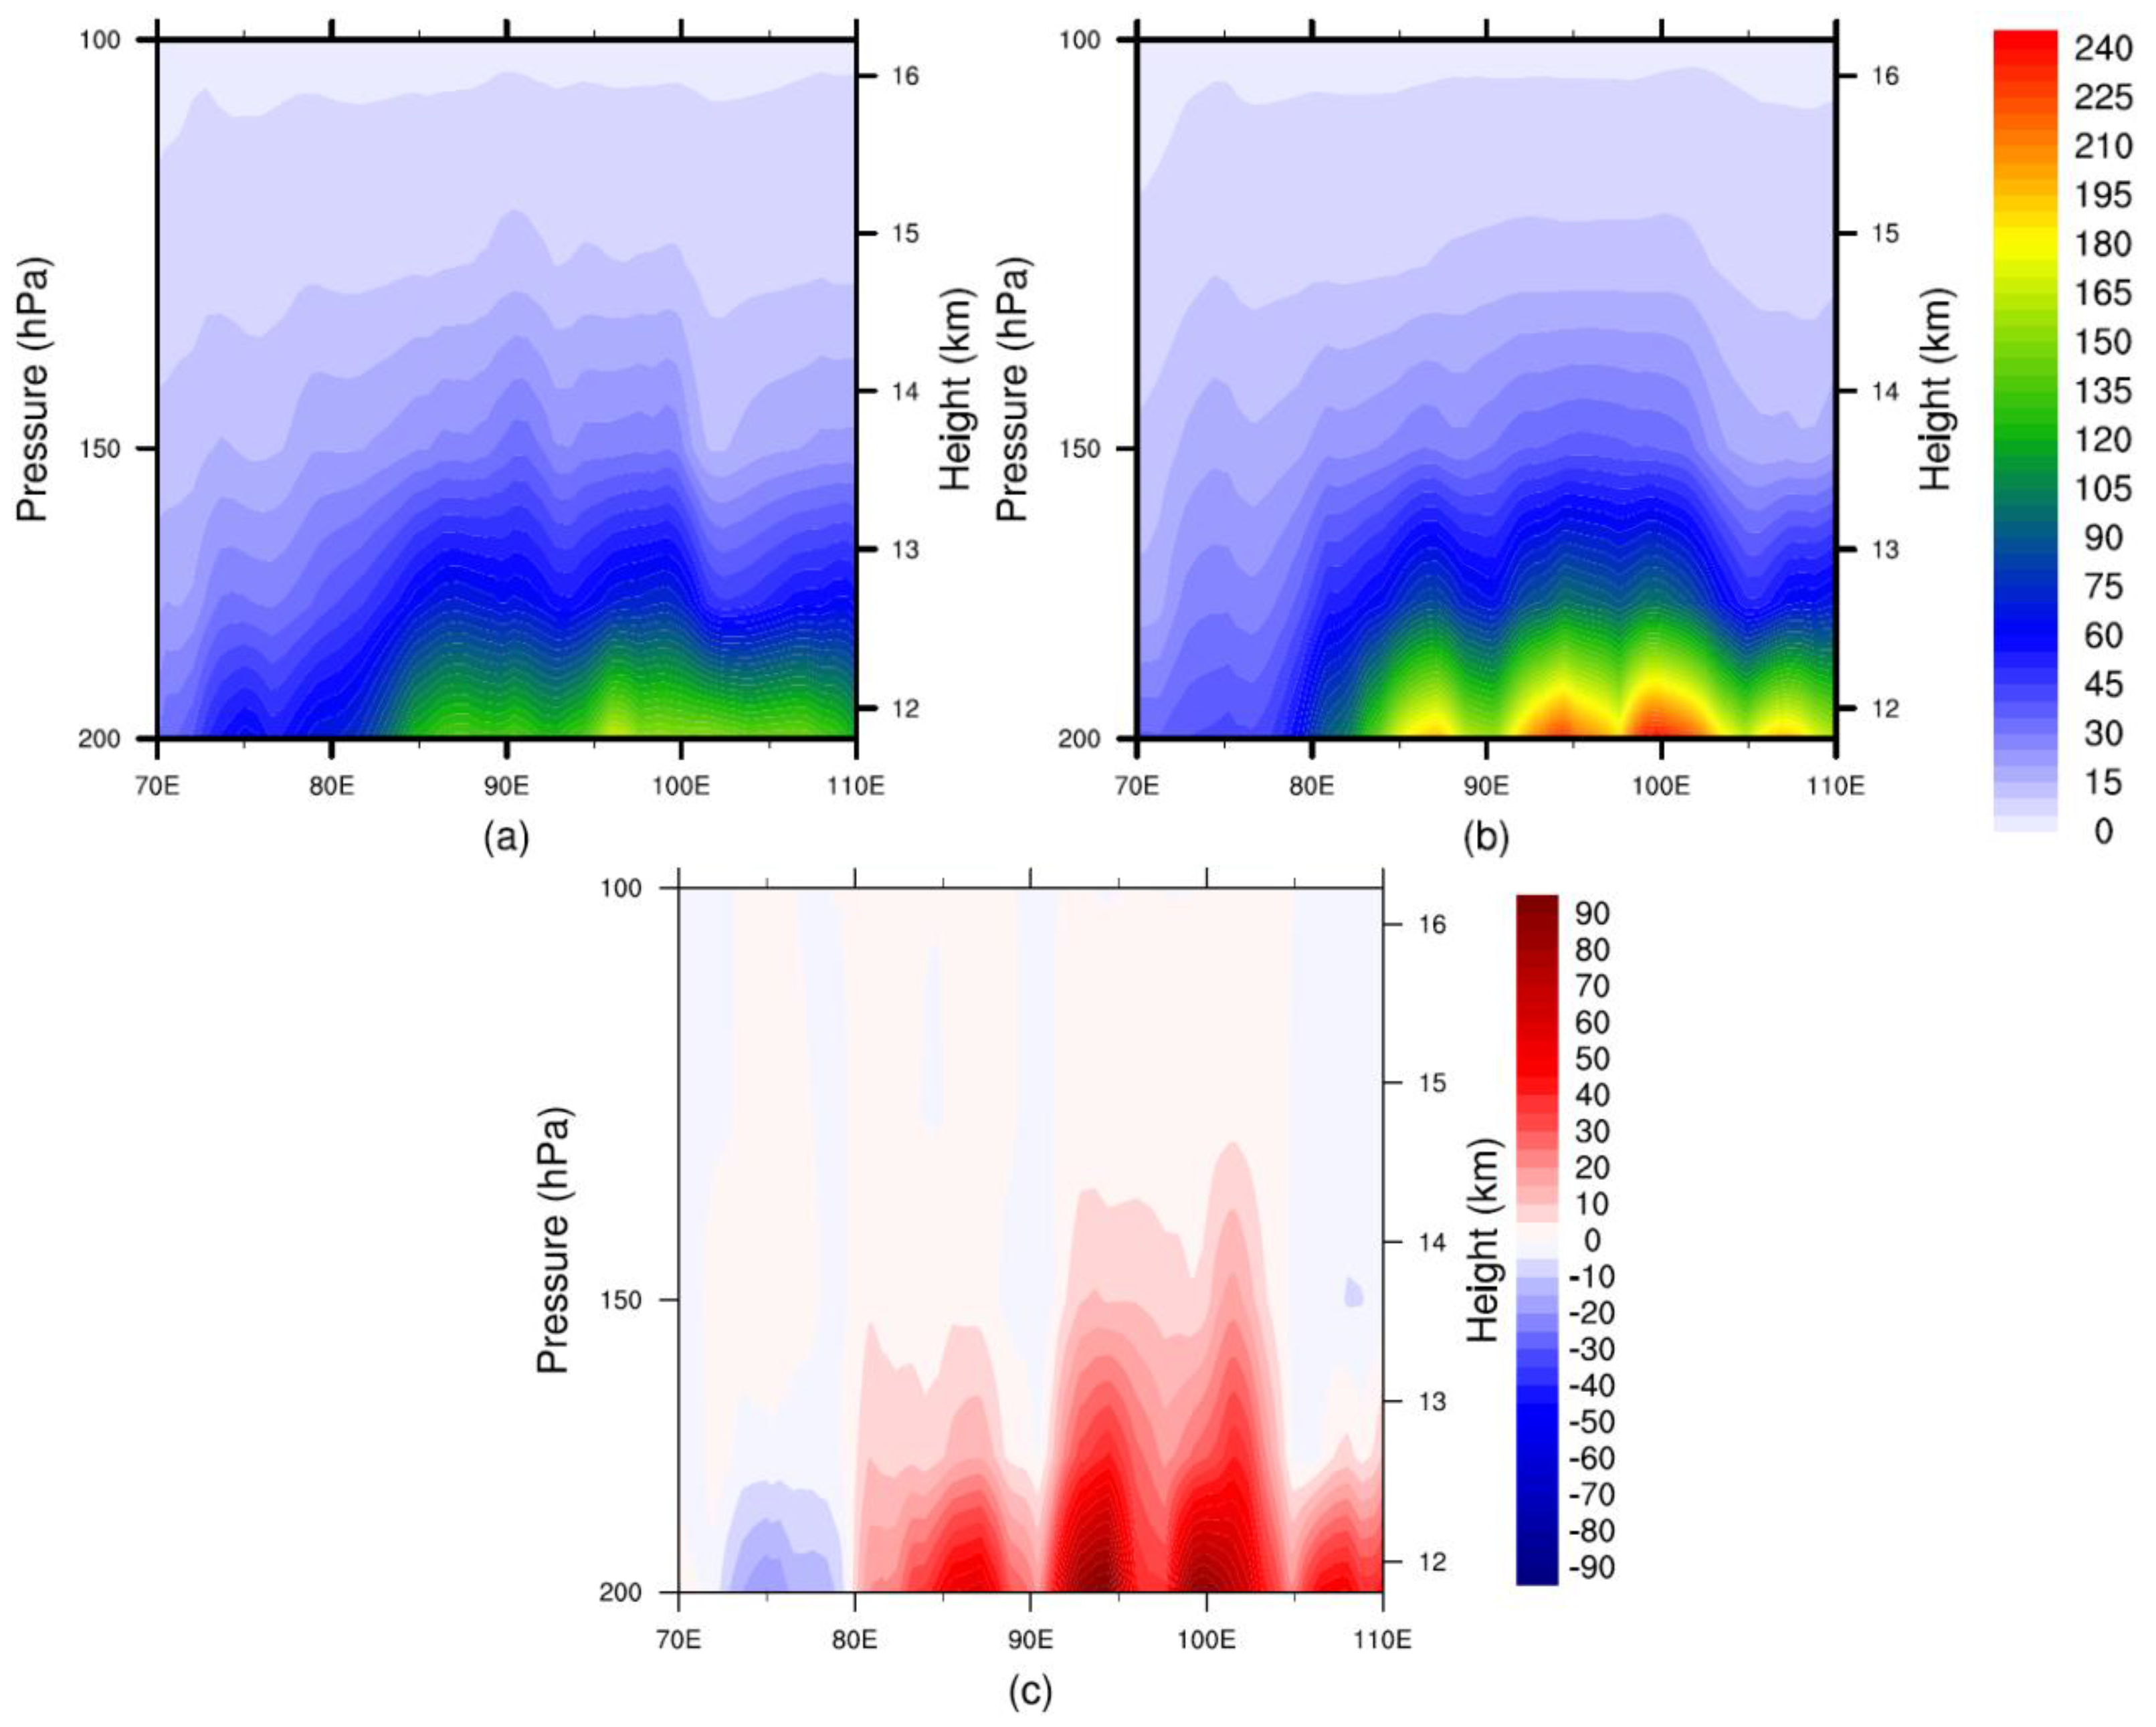
3.6. Vertical Distribution of Specific Humidity
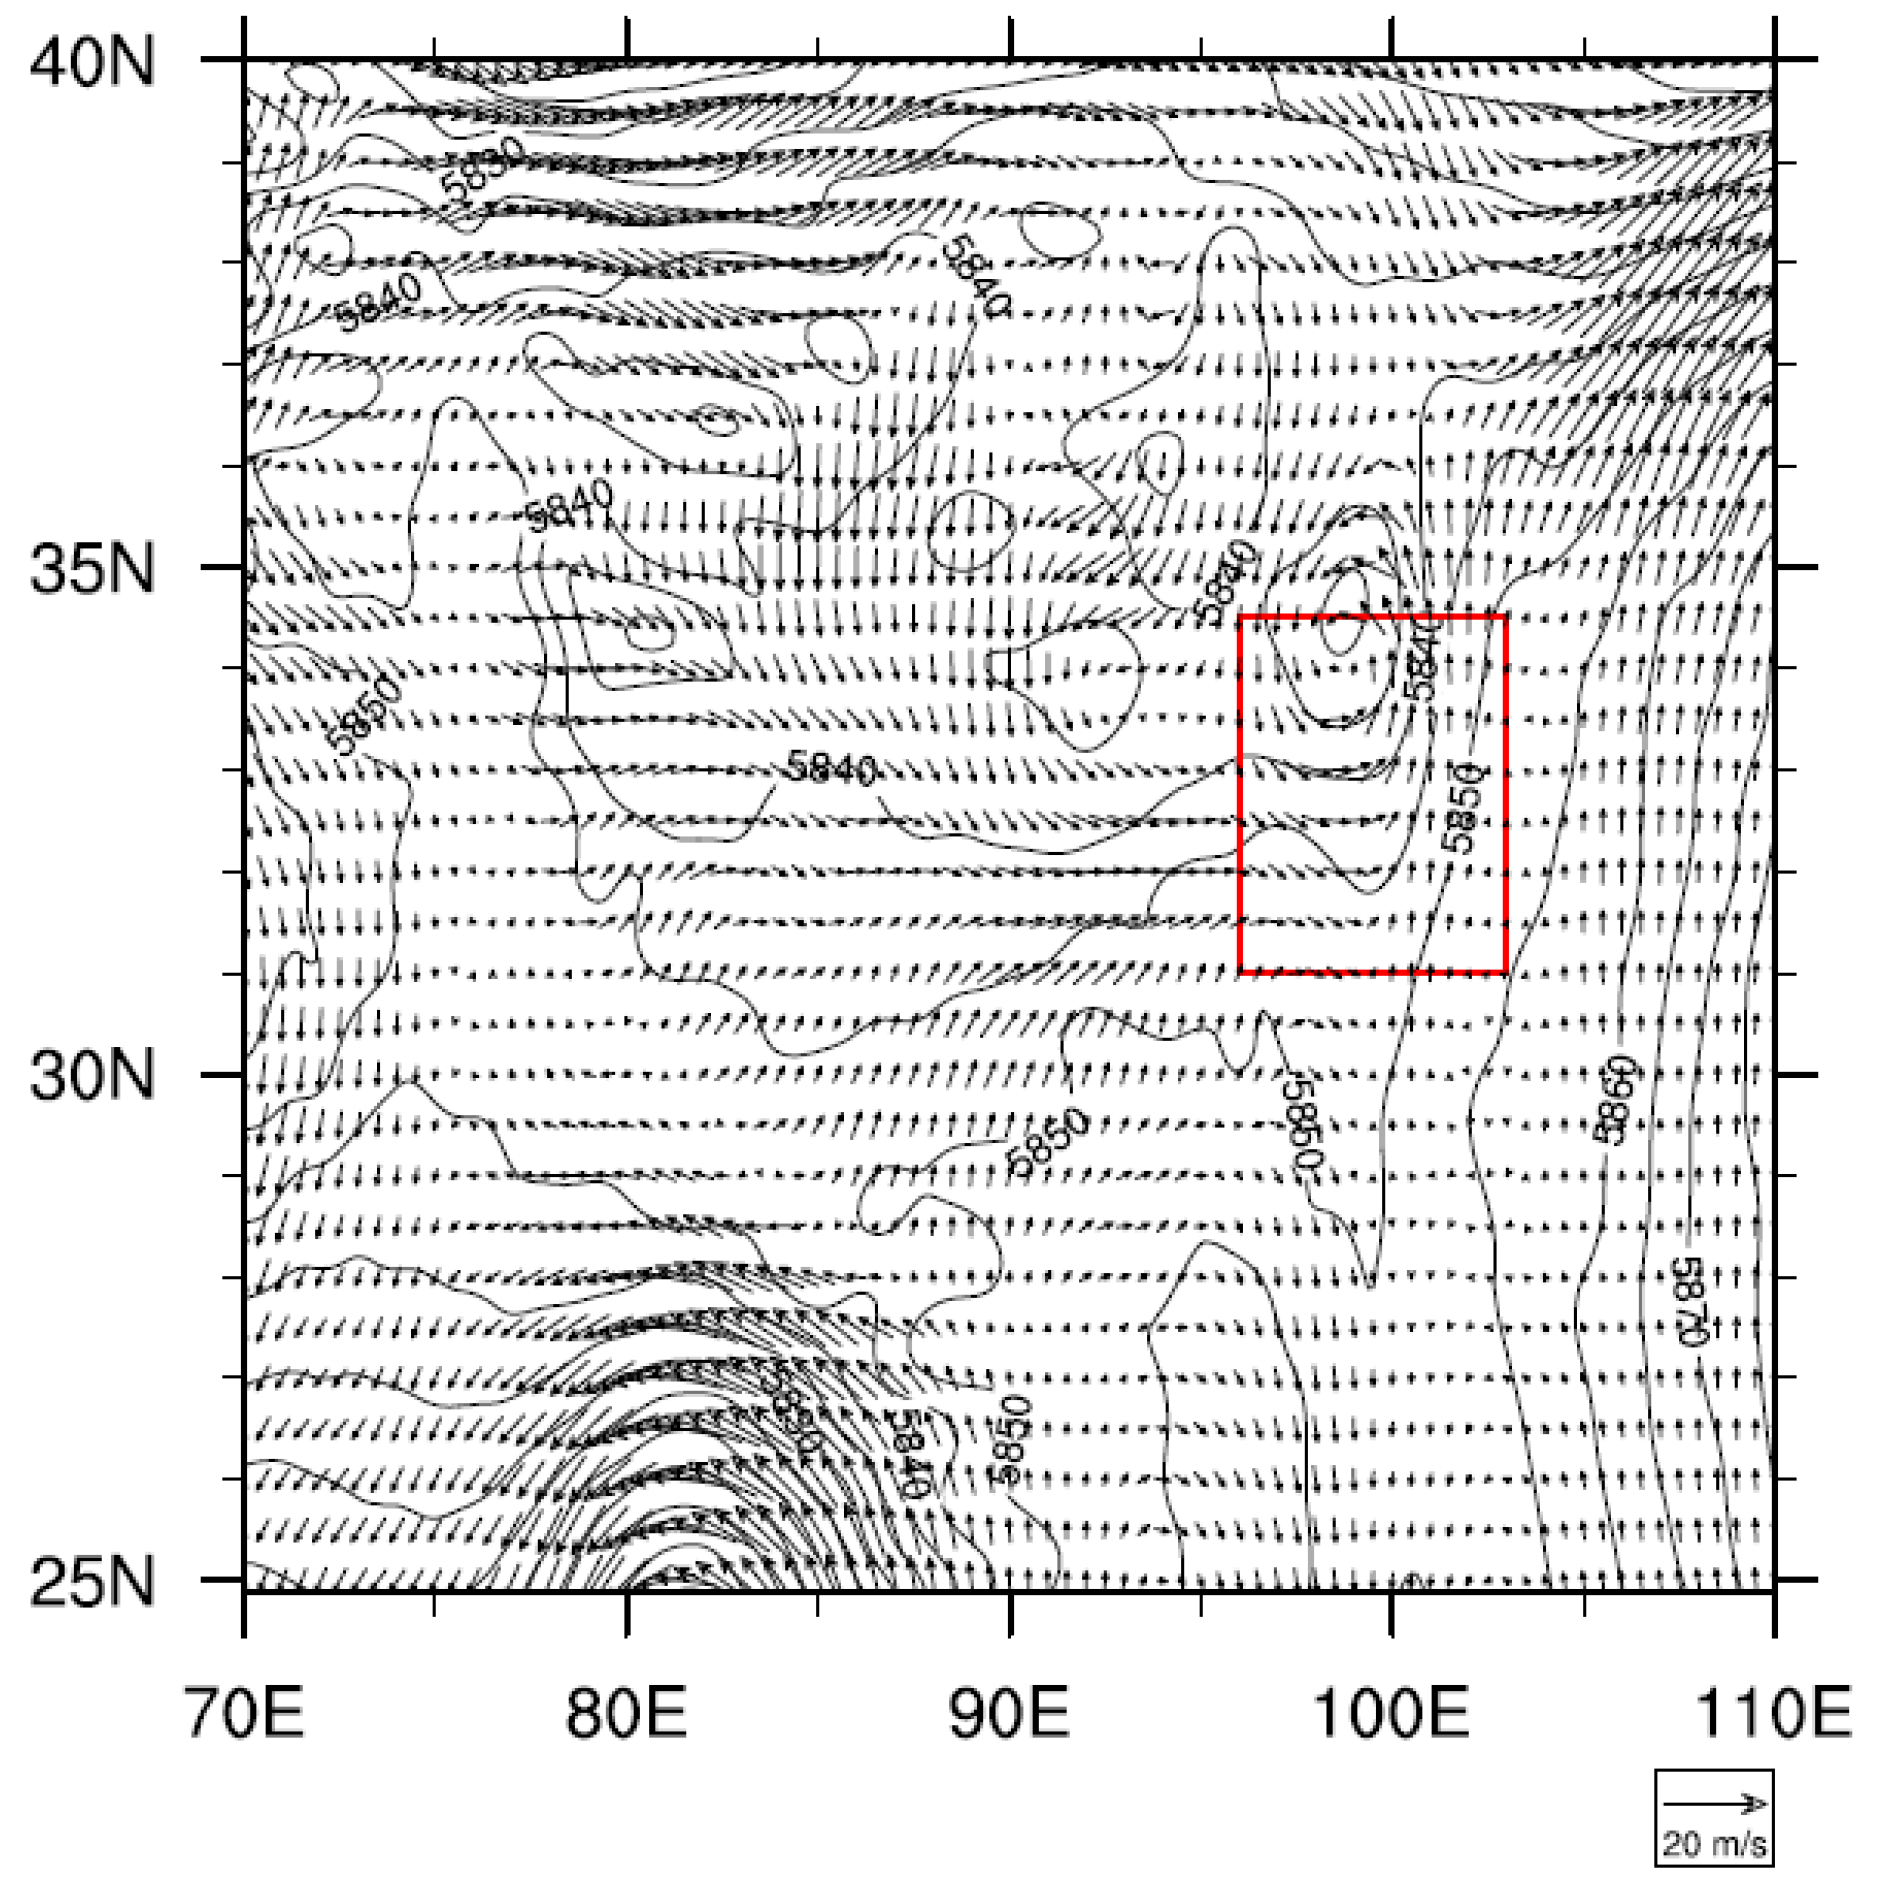
Deep convective activity is one of the ways of causing mass exchange between the troposphere and stratosphere. Related studies have shown that the vertical conveying action of strong convection can cause the water vapor content in the UTLS region to change sharply [52,53,54]. Water vapor is an important greenhouse gas that can affect the radiation balance in the UTLS area. To identify the effects of strong convection on water vapor, the vertical distributions of specific humidity—averaged between 31°N and 35°N above 200 hPa at 06 UTC (before the precipitation) and 18 UTC (after the precipitation)—are shown in Figure 7a,b. The variations in specific humidity before and after the rainfall are shown in Figure 7c.
In Figure 7a,b, the specific humidity decreases with the increase in height. Under 150 hPa, specific humidity is higher. The maximum specific humidity reached more than 2.4 × 10⁻⁴ kg/kg around 200 hPa at 18 UTC (Figure 7b). The disturbance is particularly noticeable between 90°E and 103°E. In Figure 7c, the differences in specific humidity were almost all positive; only a small part was negative, suggesting that the water vapor content significantly increased after precipitation in the UTLS area. Clearly, in the precipitation region, at 96°–103°E, the specific humidity changed greatly. In general, the changes in water vapor caused by strong convective activities of the precipitation system was higher in the UTLS region, while above 150 hPa the change was smaller, suggesting that with the increase in height, the frequency of deep convection decreased, and the delivery of water vapor caused by the convection was significantly reduced [55].

3.7. Discussion

The previous sections have shown the characteristics of the horizontal and vertical structures of strong convective precipitation, and the variation of water vapor content before and after the rainfall event. Here, we perform some simple analysis of physical conditions, to discuss the possible mechanisms for the observed convective enhancement. The comprehensive favorable conditions drive strong convective activity to start and endure in the Tibetan Plateau area. Uyeda et al. [15] showed that the atmospheric structure over the Tibetan Plateau allowed convection to reach the upper troposphere.
First, thermal action makes the afternoon convective activity develop intensively over the Tibetan Plateau in summer. The uneven heating on the ground causes the atmosphere to initiate local circulation. Afternoon convection over the mountain ranges shows convergence induced by local circulation [56]. Duan et al. showed that since the Tibetan Plateau is a huge elevated heater in summer, the thermal forcing results in convergence in the lower layer, forming cyclonic circulation [57]. Figure 8 shows the geopotential height fields and horizontal wind at 12 UTC (26 min before the precipitation) on 5 August 2014 at 500 hPa. In the figure, the rainfall region is located in the trough, and has an obvious wind shear with a cyclonic circulation in the precipitation area.
Dynamic lifting is necessary to initiate the convection. The atmospheric force lifting is therefore a direct mechanism of releasing the atmospheric instability energy and causing the strong convective weather. The divergence fields at 12 UTC (26 min before the precipitation) on 5 August 2014 at 200 hPa are shown in Figure 9. In the region of the precipitation (red box), the upper air at 200 hPa shows a divergence. In the corresponding Figure 8, the low airflow at 500 hPa suggests a cyclonic convergence. The low-level convergence zone and the upper air divergence area coincide, indicating that there is a significant vertical motion.
Lastly, the formation and development of the convection over the Tibetan Plateau are strongly influenced by the mountain-valley terrain [13]. Over the eastern Tibetan Plateau are mostly east-west mountain valleys and northwest-southeast river valleys. A thermally induced mountain-valley circulation helps regulate the active convection over the Tibetan Plateau in summer, and a thermally induced circulation over the complex terrain transports the water vapor from the valley area to the mountainous area [11], providing favorable moisture conditions for precipitation. Figure 10 presents a pressure-longitude cross-section of mean vertical water vapor flux and vertical circulation between 31° and 35°N at 12 UTC on 5 August 2014. In the rainfall area, 96°–103°E, there is a high-value area of the vertical water vapor flux, indicating that the strong vertical motion transports lots of moisture upward. Further, as we can see from the figure, the warm wet air climbs the slope, with a steep topographic forcing, which is the primary cause of the intense vertical movement. It is clear that this extreme terrain has a great effect on precipitation.

4. Conclusions

This study used data from TMPA 3B42, TRMM PR 2A25 and ERA-Interim to analyze a heavy rain occurrence on 5 August 2014 over the Tibetan Plateau, including the spatial and temporal distribution of the precipitation, and the horizontal and vertical structural characteristics of the precipitation system. The distribution of, and change in, the water vapor content before and after the precipitation over the Tibetan Plateau were analyzed, and the atmospheric circulation background causing the heavy rain was also discussed. Because of the complex terrain of the Tibetan Plateau, when using a large number of TRMM data to perform statistical analysis for the plateau rainfall characteristics, it is also necessary to conduct a detailed analysis for some specific rain cases, in order to reveal the structure of precipitation characteristics, which are difficult to determine using only conventional detection methods.
The research results show that the precipitation was concentrated in the south of the Tibetan Plateau, especially in the southeast, and that the maximum precipitation intensity appeared at 04:30–07:30 UTC. The near-surface precipitation detected by TRMM PR was in the weakening stage of the precipitation, and the maximum near-surface precipitation rate was over 100 mm·h−1. Analysis of the cross-section of the precipitation rate shows that the center of the strong convective precipitation was located at about 5 km height, while the maximum precipitation rate was located in the lower part of the strong convective precipitation cloud cluster. The convective storm top altitudes were mainly concentrated in the 5–11 km, with the highest number at about 10 km. The storm top altitude reached above 16 km, deep into the upper troposphere. The maximum sample sizes were those of the deep weak precipitation, and their contribution to the total precipitation was the largest. However, the average precipitation rate of the deep strong convective precipitation was the largest. The rainfall profile shows that the effect of terrain was to cause the highest ground rainfall rate at around 5–6 km height. In addition, the continuous coagulation and increase of the raindrops in the process of decline is the cause of the large precipitation rate on the ground. The strong convective activity deep in the upper troposphere exerted a great influence on the variation of the water vapor content in the UTLS area.
Because the climate of the Tibetan Plateau is complex and changes dramatically and the meteorological stations are sparse, our understanding of the rainfall over the Tibetan Plateau is still not complete. This research used the TRMM data to study the heavy rain over the Tibetan Plateau systematically and in detail, especially the vertical structure characteristics, which can accumulate the necessary observational facts for any further understanding of the precipitation characteristics over the special terrain, and theoretical research. It can also provide a basis for comparison in model simulation of this kind of precipitation. In Section 3.7, we perform simple analysis of physical conditions and discuss the possible mechanisms for the precipitation. The analysis of weather background indicated that the atmospheric circulation situation between the higher and lower air was conducive to the development of strong convective weather conditions. The terrain was also an important factor in the formation of the precipitation. However, a more detailed analysis of the main reasons causing the heavy rain still needs further research. This work, some of it in progress, will have to rely on numerical modeling to a considerable degree, which will help to test the interaction mechanisms for the heavy precipitation events.

Acknowledgments

The 2A25 and 3B42 products were obtained from the Goddard Earth Sciences Data and Information Services Center. The ERA-Interim data was obtained from the European Centre for Medium-range Weather Forecast (ECMWF). This work was supported by National Natural Science Foundation of China (41475037, 91537214) and the Sichuan Youth Fund (2014JQ0019).

Author Contributions

Qichao Long wrote the article; Quanliang Chen conceived the article; Qichao Long and Ke Gui analyzed the data and drew the pictures; Ying Zhang helped draw the pictures.

Conflicts of Interest

The authors declare no conflict of interest.

References

  1. Yeh, T.C. The circulation of the high troposphere over China in the winter of 1945–46. Tellus 1950, 2, 173–183. [Google Scholar] [CrossRef]
  2. Yeh, T.C.; Lo, S.W.; Chu, P.C. The wind structure and heat balance in the lower troposphere over Tibetan Plateau and its surrounding. Acta Meteorol. Sin. 1957, 28, 108–121. [Google Scholar]
  3. Flohn, H. Large-scale aspects of the “summer monsoon” in South and East Asia. J. Meteorol. Soc. Jpn. 1957, 75, 180–186. [Google Scholar]
  4. Flohn, H. Contributions to a Meteorology of the Tibetan Highlands. Available online: http://hdl.handle.net/10217/225 (accessed on 18 September 2016).
  5. Yanai, M.; Li, C.; Song, Z. Seasonal heating of the Tibetan Plateau and its effects on the evolution of the Asian summer monsoon. J. Meteorol. Soc. Jpn. 1992, 70, 319–351. [Google Scholar]
  6. Chen, L.; Wu, R. Interannual and decadal variations of snow cover over Qinghai-Xizang Plateau and their relationships to summer monsoon rainfall in China. Adv. Atmos. Sci. 2000, 17, 18–30. [Google Scholar]
  7. Wang, C.; Guo, Y. Precipitable water conversion rates over the Qinghai-Xizang (Tibet) Plateau: Changing characteristics with global warming. Hydrol. Process. 2012, 26, 1509–1516. [Google Scholar] [CrossRef]
  8. Duan, A.; Wang, M.; Lei, Y.; Cui, Y. Trends in summer rainfall over China associated with the Tibetan Plateau sensible heat source during 1980–2008. J. Clim. 2013, 26, 261–275. [Google Scholar] [CrossRef]
  9. Liu, L.; Feng, J.; Chu, R.; Zhou, Y.; Ueno, K. The diurnal variation of precipitation in monsoon season in the Tibetan Plateau. Adv. Atmos. Sci. 2002, 19, 365–378. [Google Scholar]
  10. Sasaki, T.; Wu, P.; Kimura, F.; Yoshikane, T.; Liu, J. Drastic evening increase in precipitable water vapor over the southeastern Tibetan Plateau. J. Meteorol. Soc. Jpn. 2003, 81, 1273–1281. [Google Scholar] [CrossRef]
  11. Kuwagata, T.; Numaguti, A.; Endo, N. Diurnal variation of water vapor over the central Tibetan Plateau during summer. J. Meteorol. Soc. Jpn. 2001, 79, 401–418. [Google Scholar] [CrossRef]
  12. Kurosaki, Y.; Kimura, F. Relationship between topography and daytime cloud activity around Tibetan Plateau. J. Meteorol. Soc. Jpn. 2002, 80, 1339–1355. [Google Scholar] [CrossRef]
  13. Fujinami, H.; Nomura, S.; Yasunari, T. Characteristics of diurnal variations in convection and precipitation over the southern Tibetan Plateau during summer. Sola 2005, 1, 49–52. [Google Scholar] [CrossRef]
  14. Murakami, M. Analysis of the deep convective activity over the western Pacific and Southeast Asia. Part I: Diurnal variation. J. Meteorol. Soc. Jpn. 1983, 61, 60–76. [Google Scholar]
  15. Uyeda, H.; Yamada, H.; Horikomi, J.; Shirooka, R.; Shimizu, S.; Liu, L.; Ueno, K.; Fujii, H.; Koike, T. Characteristics of convective clouds observed by a Doppler radar at Naqu on Tibetan Plateau during the GAME-Tibet IOP. J. Meteorol. Soc. Jpn. 2001, 79, 463–474. [Google Scholar] [CrossRef]
  16. Fujinami, H.; Yasunari, T. The seasonal and intraseasonal variability of diurnal cloud activity over the Tibetan Plateau. J. Meteorol. Soc. Jpn. 2001, 79, 1207–1227. [Google Scholar] [CrossRef]
  17. Wang, C.C.; Chen, G.T.J.; Carbone, R.E. A climatology of warm-season cloud patterns over East Asia based on GMS infrared brightness temperature observations. Mon. Weather Rev. 2004, 132, 1606–1629. [Google Scholar] [CrossRef]
  18. Nesbitt, S.W.; Zipser, E.J.; Cecil, D.J. A census of precipitation features in the tropics using TRMM: Radar, ice scattering, and lightning observations. J. Clim. 2000, 13, 4087–4106. [Google Scholar] [CrossRef]
  19. Liu, G.; Fu, Y. The characteristics of tropical precipitation profiles as inferred from satellite radar measurements. J. Meteorol. Soc. Jpn. 2001, 79, 131–143. [Google Scholar] [CrossRef]
  20. Alcala, C.M.; Dessler, A.E. Observations of deep convection in the tropics using the Tropical Rainfall Measuring Mission (TRMM) precipitation radar. J. Geophys. Res: Atmos. 2002. [Google Scholar] [CrossRef]
  21. Fu, Y.; Lin, Y.; Liu, G.; Wang, Q. Seasonal characteristics of precipitation in 1998 over East Asia as derived from TRMM PR. Adv. Atmos. Sci. 2003, 20, 511–529. [Google Scholar]
  22. Yu, R.; Yuan, W.; Li, J.; Fu, Y. Diurnal phase of late-night against late-afternoon of stratiform and convective precipitation in summer southern contiguous China. Clim. Dyn. 2010, 35, 567–576. [Google Scholar] [CrossRef]
  23. Liu, P.; Wang, Y.; Feng, S.; Li, C.Y.; Fu, Y.F. Climatological characteristics of overshooting convective precipitation in summer and winter over the tropical and subtropical regions. Chin. J. Atmos. Sci. 2012, 36, 579–589. [Google Scholar]
  24. Liu, P.; Li, C.Y.; Wang, Y.; Fu, Y.F. Climatic characteristics of convective and stratiform precipitation over the Tropical and Subtropical areas as derived from TRMM PR. Sci. China Earth Sci. 2013, 56, 375–385. [Google Scholar] [CrossRef]
  25. Shimizu, S. Mesoscale structures of stratiform precipitation on the Tibetan Plateau using an X-band Doppler radar and TRMM PR. In Proceedings of the SPIE Second International Asia-Pacific Symposium on Remote Sensing of the Atmosphere, Environment, and Space, Sendai, Japan, 9–12 October 2000.
  26. Yao, Z.; Li, W.; Zhu, Y.; Zhao, B.; Chen, Y. Remote sensing of precipitation on the Tibetan Plateau using the TRMM Microwave Imager. J. Appl. Meteorol. 2001, 40, 1381–1392. [Google Scholar] [CrossRef]
  27. Fu, Y.; Liu, G.; Wu, G.; Yu, R.; Xu, Y.; Wang, Y.; Li, R.; Liu, Q. Tower mast of precipitation over the central Tibetan Plateau summer. Geophys. Res. Lett. 2006, 33, 157–158. [Google Scholar] [CrossRef]
  28. Fu, Y.F.; Li, H.T.; Zi, Y. Case study of precipitation cloud structure viewed by TRMM satellite in a valley of the Tibetan Plateau. Plateau Meteorol. 2007, 26, 98–106. [Google Scholar]
  29. Fu, Y.; Liu, Q.; Zi, Y.; Feng, S.; Li, Y.; Liu, G. Summer Precipitation and Latent Heating over the Tibetan Plateau Based on TRMM Measurements. Plateau Mt. Meteorol. Res. 2008, 28, 8–18. [Google Scholar]
  30. Fu, Y.; Liu, G. Possible misidentification of rain type by TRMM PR over Tibetan Plateau. J. Appl. Meteorol. Climatol. 2007, 46, 667–672. [Google Scholar] [CrossRef]
  31. Bai, A.J.; Liu, C.H.; Liu, X.D. Diurnal Variation of Summer Rainfall over the Tibetan Plateau and Its Neighboring Regions Revealed by TRMM Multi-Satellite Precipitation Analysis. Chin. J. Geophys. 2008, 51, 518–529. [Google Scholar] [CrossRef]
  32. Xu, W.; Zipser, E.J. Diurnal variations of precipitation, deep convection, and lightning over and east of the eastern Tibetan Plateau. J. Clim. 2011, 24, 448–465. [Google Scholar] [CrossRef]
  33. Li, D.; Bai, A.; Huang, S. Characteristic analysis of a severe convective weather over Tibetan Plateau based on TRMM data. Plateau Meteorol. 2012, 31, 304–311. [Google Scholar]
  34. Wang, C.; Shi, H.; Hu, H.; Wang, Y.; Xi, B. Properties of cloud and precipitation over the Tibetan Plateau. Adv. Atmos. Sci. 2015, 32, 1504–1516. [Google Scholar] [CrossRef]
  35. Iguchi, T.; Kozu, T.; Meneghini, R.; Awaka, J.; Okamoto, K. Rain-Profiling Algorithm for the TRMM Precipitation Radar. J. Appl. Meteorol. 2000, 39, 2038–2052. [Google Scholar] [CrossRef]
  36. Iguchi, T.; Kozu, T.; Kwiatkowski, J.; Meneghini, R.; Awaka, J.; Okamoto, K. Uncertainties in the Rain Profiling Algorithm for the TRMM Precipitation Radar. J. Meteorol. Soc. Jpn. 2009, 87, 1–30. [Google Scholar] [CrossRef]
  37. Kirstetter, P.E.; Hong, Y.; Gourley, J.J.; Chen, S.; Flamig, Z.; Zhang, J.; Schwaller, M.; Petersen, W.; Amital, E. Toward a framework for systematic error modeling of spaceborne precipitation radar with NOAA/NSSL ground radar-based national mosaic QPE. J. Hydrometeorol. 2012, 13, 1285–1300. [Google Scholar] [CrossRef]
  38. Kirstetter, P.E.; Hong, Y.; Gourley, J.J.; Schwaller, M.; Petersen, W.; Zhang, J. Comparison of TRMM 2A25 products, version 6 and version 7, with NOAA/NSSL ground radar–based national mosaic QPE. J. Hydrometeorol. 2013, 14, 661–669. [Google Scholar] [CrossRef]
  39. Kummerow, C.; Barnes, W.; Kozu, T.; Shiue, J.; Simpson, J. The tropical rainfall measuring mission (TRMM) sensor package. J. Atmos. Ocean. Technol. 1998, 15, 809–817. [Google Scholar] [CrossRef]
  40. Steiner, M.; Houze, R.A.J.; Yuter, S.E. Climatological characterization of three-dimensional storm structure from operational radar and rain gauge data. J. Appl. Meteorol. 1995, 34, 1978–2007. [Google Scholar] [CrossRef]
  41. Awaka, J.; Iguchi, T.; Okamoto, K. Early results on rain type classification by the Tropical Rainfall Measuring Mission (TRMM) precipitation radar. In Proceedings of the 8th URSI Commission F Triennial Open Symposium, Aveiro, Portugal, 22–25 September 1998; pp. 143–146.
  42. Liu, C.; Zipser, E.J.; Nesbitt, S.W. Global distribution of tropical deep convection: Different perspectives from TRMM infrared and radar data. J. Clim. 2007, 20, 489–503. [Google Scholar] [CrossRef]
  43. Kelley, O.A.; Stout, J.; Summers, M.; Zipser, E.J. Do the tallest convective cells over the tropical ocean have slow updrafts? Mon. Weather Rev. 2010, 138, 1651–1672. [Google Scholar] [CrossRef]
  44. Chen, F.; Fu, Y.; Liu, P.; Yang, Y. Seasonal Variability of Storm Top Altitudes in the Tropics and Subtropics Observed by TRMM PR. Atmos. Res. 2016, 169, 113–126. [Google Scholar] [CrossRef]
  45. Kozu, T.; Kawanishi, T.; Kuroiwa, H.; Kojima, M.; Oikawa, K.; Kumagai, H.; Okamoto, K.; Okumura, M.; Nakatsuka, H.; Nishikawa, K. Development of precipitation radar onboard the Tropical Rainfall Measuring Mission (TRMM) satellite. IEEE Trans. Geosci. Remote Sens. 2001, 39, 102–116. [Google Scholar] [CrossRef]
  46. Shimizu, S.; Takahashi, N.; Iguchi, T.; Awaka, J.; Kozu, T.; Meneghini, R.; Okamoto, K. Validation analyses after the altitude change of TRMM. SPIE 2003. [Google Scholar] [CrossRef]
  47. Takahashi, N.; Iguchi, T. Estimation and correction of beam mismatch of the precipitation radar after an orbit boost of the Tropical Rainfall Measuring Mission satellite. IEEE Trans. Geosci. Remote Sens. 2004, 42, 2362–2369. [Google Scholar] [CrossRef]
  48. Huffman, G.J.; Bolvin, D.T.; Nelkin, E.J.; Wolff, D.B.; Adler, R.F.; Gu, G.; Hong, Y.; Bowman, K.P.; Stocker, E.F. The TRMM multisatellite precipitation analysis (TMPA): Quasi-global, multiyear, combined-sensor precipitation estimates at fine scales. J. Hydrometeorol. 2007, 8, 38–55. [Google Scholar] [CrossRef]
  49. Uma, K.N.; Das, S.K.; Das, S.S. A climatological perspective of water vapor at the UTLS region over different global monsoon regions: Observations inferred from the Aura-MLS and reanalysis data. Clim. Dyn. 2014, 43, 407–420. [Google Scholar] [CrossRef]
  50. Young, A.H.; Bates, J.J.; Curry, J.A. Complementary use of passive and active remote sensing for detection of penetrating convection from CloudSat, CALIPSO, and Aqua MODIS. J. Geophys. Res.: Atmos. 2012. [Google Scholar] [CrossRef]
  51. Islam, T.; Rico-Ramirez, M.A.; Han, D.; Srivastava, P.K.; Ishak, A.M. Performance evaluation of the TRMM precipitation estimation using ground-based radars from the GPM validation network. J. Atmos. Sol. Terr. Phys. 2012, 77, 194–208. [Google Scholar] [CrossRef]
  52. Grosvenor, D.P.; Choularton, T.W.; Coe, H.; Held, G. A study of the effect of overshooting deep convection on the water content of the TTL and lower stratosphere from Cloud Resolving Model simulations. Atmos. Chem. Phys. 2007, 7, 4977–5002. [Google Scholar] [CrossRef]
  53. Iwasaki, S.; Shibata, T.; Nakamoto, J.; Okamoto, H.; Ishimoto, H.; Kubota, H. Characteristics of deep convection measured by using the a-train constellation. J. Geophys. Res. Atmos. 2010. [Google Scholar] [CrossRef]
  54. Liu, X.M.; Rivière, E.D.; Marécal, V.; Durry, G.; Hamdouni, A.; Arteta, J.; Khaykin, S. Stratospheric water vapour budget and convection overshooting the tropopause: modelling study from SCOUT-AMMA. Atmos. Chem. Phys. 2010, 10, 8267–8286. [Google Scholar] [CrossRef] [Green Version]
  55. Park, M.; Randel, W.J.; Emmons, L.K.; Bernath, P.F.; Walker, K.A.; Boone, C.D. Chemical isolation in the Asian monsoon anticyclone observed in Atmospheric Chemistry Experiment (ACE-FTS) data. Atmos. Chem. Phys. 2008, 8, 757–764. [Google Scholar] [CrossRef]
  56. Kuwagata, T.; Kimura, F. Daytime boundary layer evolution in a deep valley. Part II: Numerical simulation of the cross-valley circulation. J. Appl. Meteorol. 1997, 36, 883–895. [Google Scholar] [CrossRef]
  57. Duan, A.M.; Wu, G.X. Role of the Tibetan Plateau thermal forcing in the summer climate patterns over subtropical Asia. Clim. Dyn. 2005, 24, 793–807. [Google Scholar] [CrossRef]
Figure 1. Spatial distribution of the daily aggregated precipitation (units: mm/day) over the Tibetan Plateau (28°N–40°N, 75°E–105°E) on 5 August 2014. The blue box is the precipitation area detected by TRMM PR.
Atmosphere 07 00118 g001
Figure 2. Spatial distribution of the mean 3-h precipitation rate (units: mm·h−1) over the southeastern Tibetan Plateau (30°N–35°N, 96°E–104°E) on 5 August 2014. (a) 22:30 (on 4 August 2014) –01:30 UTC; (b) 01:30–04:30 UTC; (c) 04:30–07:30 UTC; (d) 07:30–10:30 UTC; (e) 10:30–13:30 UTC; (f) 13:30–16:30 UTC; (g) 16:30–19:30 UTC; (h) 19:30–22:30 UTC.
Atmosphere 07 00118 g002
Figure 3. (a) Distribution of near-surface precipitation rate (units: mm·h−1) over the southeastern Tibetan Plateau on 5 August 2014 (12:26 UTC); (b) Elevation map (units: m) of the Tibetan Plateau. The blue box is the precipitation area detected by TRMM PR.
Atmosphere 07 00118 g003
Figure 4. Vertical cross-sections of the rainfall (units: mm·h−1). The (a), (b), and (c) graphs represent the A–B, C–D, and E–F paths, respectively, from Figure 3a.
Atmosphere 07 00118 g004
Figure 5. (a) Horizontal distributions of convective storm top altitudes (units: km); (b) Percentage of different convective storm top altitudes; (c) Distribution of convective storm top altitudes, among the samples.
Atmosphere 07 00118 g005aAtmosphere 07 00118 g005b
Figure 6. (a) Vertical distribution of the number of samples; (b) Mean rainfall profiles and (c) average attenuation-corrected reflectivity profiles (Black curve shows the mean value of all samples, corresponding to the mean rainfall profiles (b), and red curve shows the mean value of deep strong convective precipitation.) of the heavy rain event over the eastern Tibetan Plateau.
Atmosphere 07 00118 g006
Figure 7. Vertical distribution of specific humidity (units: 10−6 kg·kg−1), averaged between 31°N and 35°N at 06UTC (a) and 18UTC (b). (c) Variation in specific humidity (units: 10−6 kg·kg−1) from 18 UTC (after the precipitation) to 06 UTC (before the precipitation).
Atmosphere 07 00118 g007
Figure 8. Geopotential height fields (units: m) and horizontal wind (units: m·s−1) at 12 UTC on 5 August 2014 at 500 hPa. The red box is the precipitation area.
Atmosphere 07 00118 g008
Figure 9. Divergence fields (units: 10−5 s−1) at 12UTC 5 August 2014 at 200 hPa. The red box is the precipitation area.
Atmosphere 07 00118 g009
Figure 10. Longitude-pressure section of mean vertical water vapor flux (units: g·cm−2·s−1) and vertical circulation (vertical velocity and U component of wind) between 31° and 35°N, at 12 UTC on 5 August 2014.
Atmosphere 07 00118 g010
Table 1. Pixel number, percentage of total precipitation and mean rainfall rate of the three types of rain.
TypeNumber of Rain PixelsRatio of this Type of Precipitation to Total Precipitation (%)Mean Rainfall Rate (mm·h−1)
Deep strong convective precipitation9334.5227.03
Deep weak precipitation128556.773.22
Shallow precipitation4388.711.45

