1. Introduction
Ground clutter in weather radar observations causes degradation of data quality and can lead to misinterpretation of radar echoes. It is important to detect clutter and to mitigate clutter effects to obtain accurate weather measurements. Ground objects such as buildings, power line poles, and trees can cause severe clutter to be mixed with weather echoes when the radar beam points at low elevation angles. Since these objects are mostly stationary, a band-stop filter can be applied to remove clutter contaminations [
1,
2]. Although this traditional filtering is frequently used to remove clutter from weather signals, the power components of weather signals may fall into the stop band, causing the filter to also suppress its power components and bias the moment estimates, especially for narrow-band zero-velocity weather signals [
3,
4,
5]. Although the Gaussian Model Adaptive Processing (GMAP) algorithm [
3] is capable of recovering the weather power spectrum, it is time-consuming to apply GMAP at every gate. Thus, to avoid biases from the filtering and to be efficient, the ground clutter locations should first be accurately identified, before applying the filtering, to obtain high-quality weather data.
There are a number of clutter detection methods that have been developed and used in weather radar community. Historically, the clutter map method was used for clutter detection, in which radar measurements are made in clear-air conditions. It was also used for clutter-contaminated areas [
6]. However, a clutter map can change depending on weather conditions, e.g., abnormal propagations. Therefore, this method is not always reliable.
The clutter mitigation decision (CMD) algorithm was introduced in [
7,
8,
9], which utilizes differences in signal coherence and spatial texture between ground clutter and weather for clutter detection. The CMD algorithm is widely known in the weather radar community and combines clutter phase alignment (CPA), texture of reflectivity (TDBZ), and spatial variability of reflectivity field as three discriminant functions for clutter detection. However, the CMD is based on single polarization radar data, and we will show that the probability of detection for CMD is not acceptable, in comparison to other proposed algorithms. The Spectrum Clutter Identification (SCI) algorithm was developed in [
2,
5,
10,
11]. It was based on single polarization signal and combined four discriminants for clutter detection. Considering that radar signals from ground clutter have a much longer correlation time than that from weather, a scan-to-scan (dual scan: DS) method was proposed in [
12], and shown to be effective in clutter detection. Dual-scan data are available for most operational radars such as the weather surveillance radars (WSR-88D) at low elevation angles.
Furthermore, the WSR-88D radar network has been updated with dual-polarization capability [
5]. Dual-polarization (DP) data provide rich information for clutter detection. In [
5,
13], a simple Bayesian approach that utilizes dual-polarization data was developed to separate clutter from weather signals. Discriminant functions of cross correlation coefficients between dual-polarization signals, power ratio (PR), and differential reflectivity (Z
DR) are defined and combined for clutter detection with improved results.
In this paper, we combine dual-polarization and dual-scan (DPDS) methods to further improve detection accuracy. Since more information is used, the DPDS method provides a higher probability of detection and lower false alarm rate.
This paper is organized as follows: In
Section 2, three discriminants derived from DPDS measurements are introduced. In
Section 3, the implementation procedure of the DPDS algorithm is discussed. In
Section 4, the performance of the DPDS algorithm is evaluated using controlled data collected by KOUN polarimetric radar. Practical results demonstrate that DPDS algorithm improves the detection performance significantly. Conclusions are drawn in
Section 5.
2. Discriminant Functions
The Bayesian classifier is used to combine DPDS information for clutter detection, which includes estimation and aggregation of discriminants for decision making. In this section, three discriminant functions for clutter detection are defined and estimated based on the DPDS data. The DPDS discriminant functions are the differential reflectivity (ZDR), the cross-correlation coefficient between two scans (), and the copolar cross-correlation coefficient between dual-polarization (H and V-polarization) () signals.
Our training data were collected by the national KOUN (WSR-88D) radar on two different days—this data were used to find the probability density functions (PDFs) for the discriminant functions. The training weather data were collected at 13:08 UTC on 9 February 2011. The weather was mostly cloudy without any precipitation. The training clutter data were collected in clear weather conditions, at 00:46 UTC on 4 February 2011. It should be noted that we created a controlled training data set by matching and combining the almost pure clutter data at 00:46 UTC on 4 February 2011, and pure weather data at 13:08 UTC on 9 February 2011.
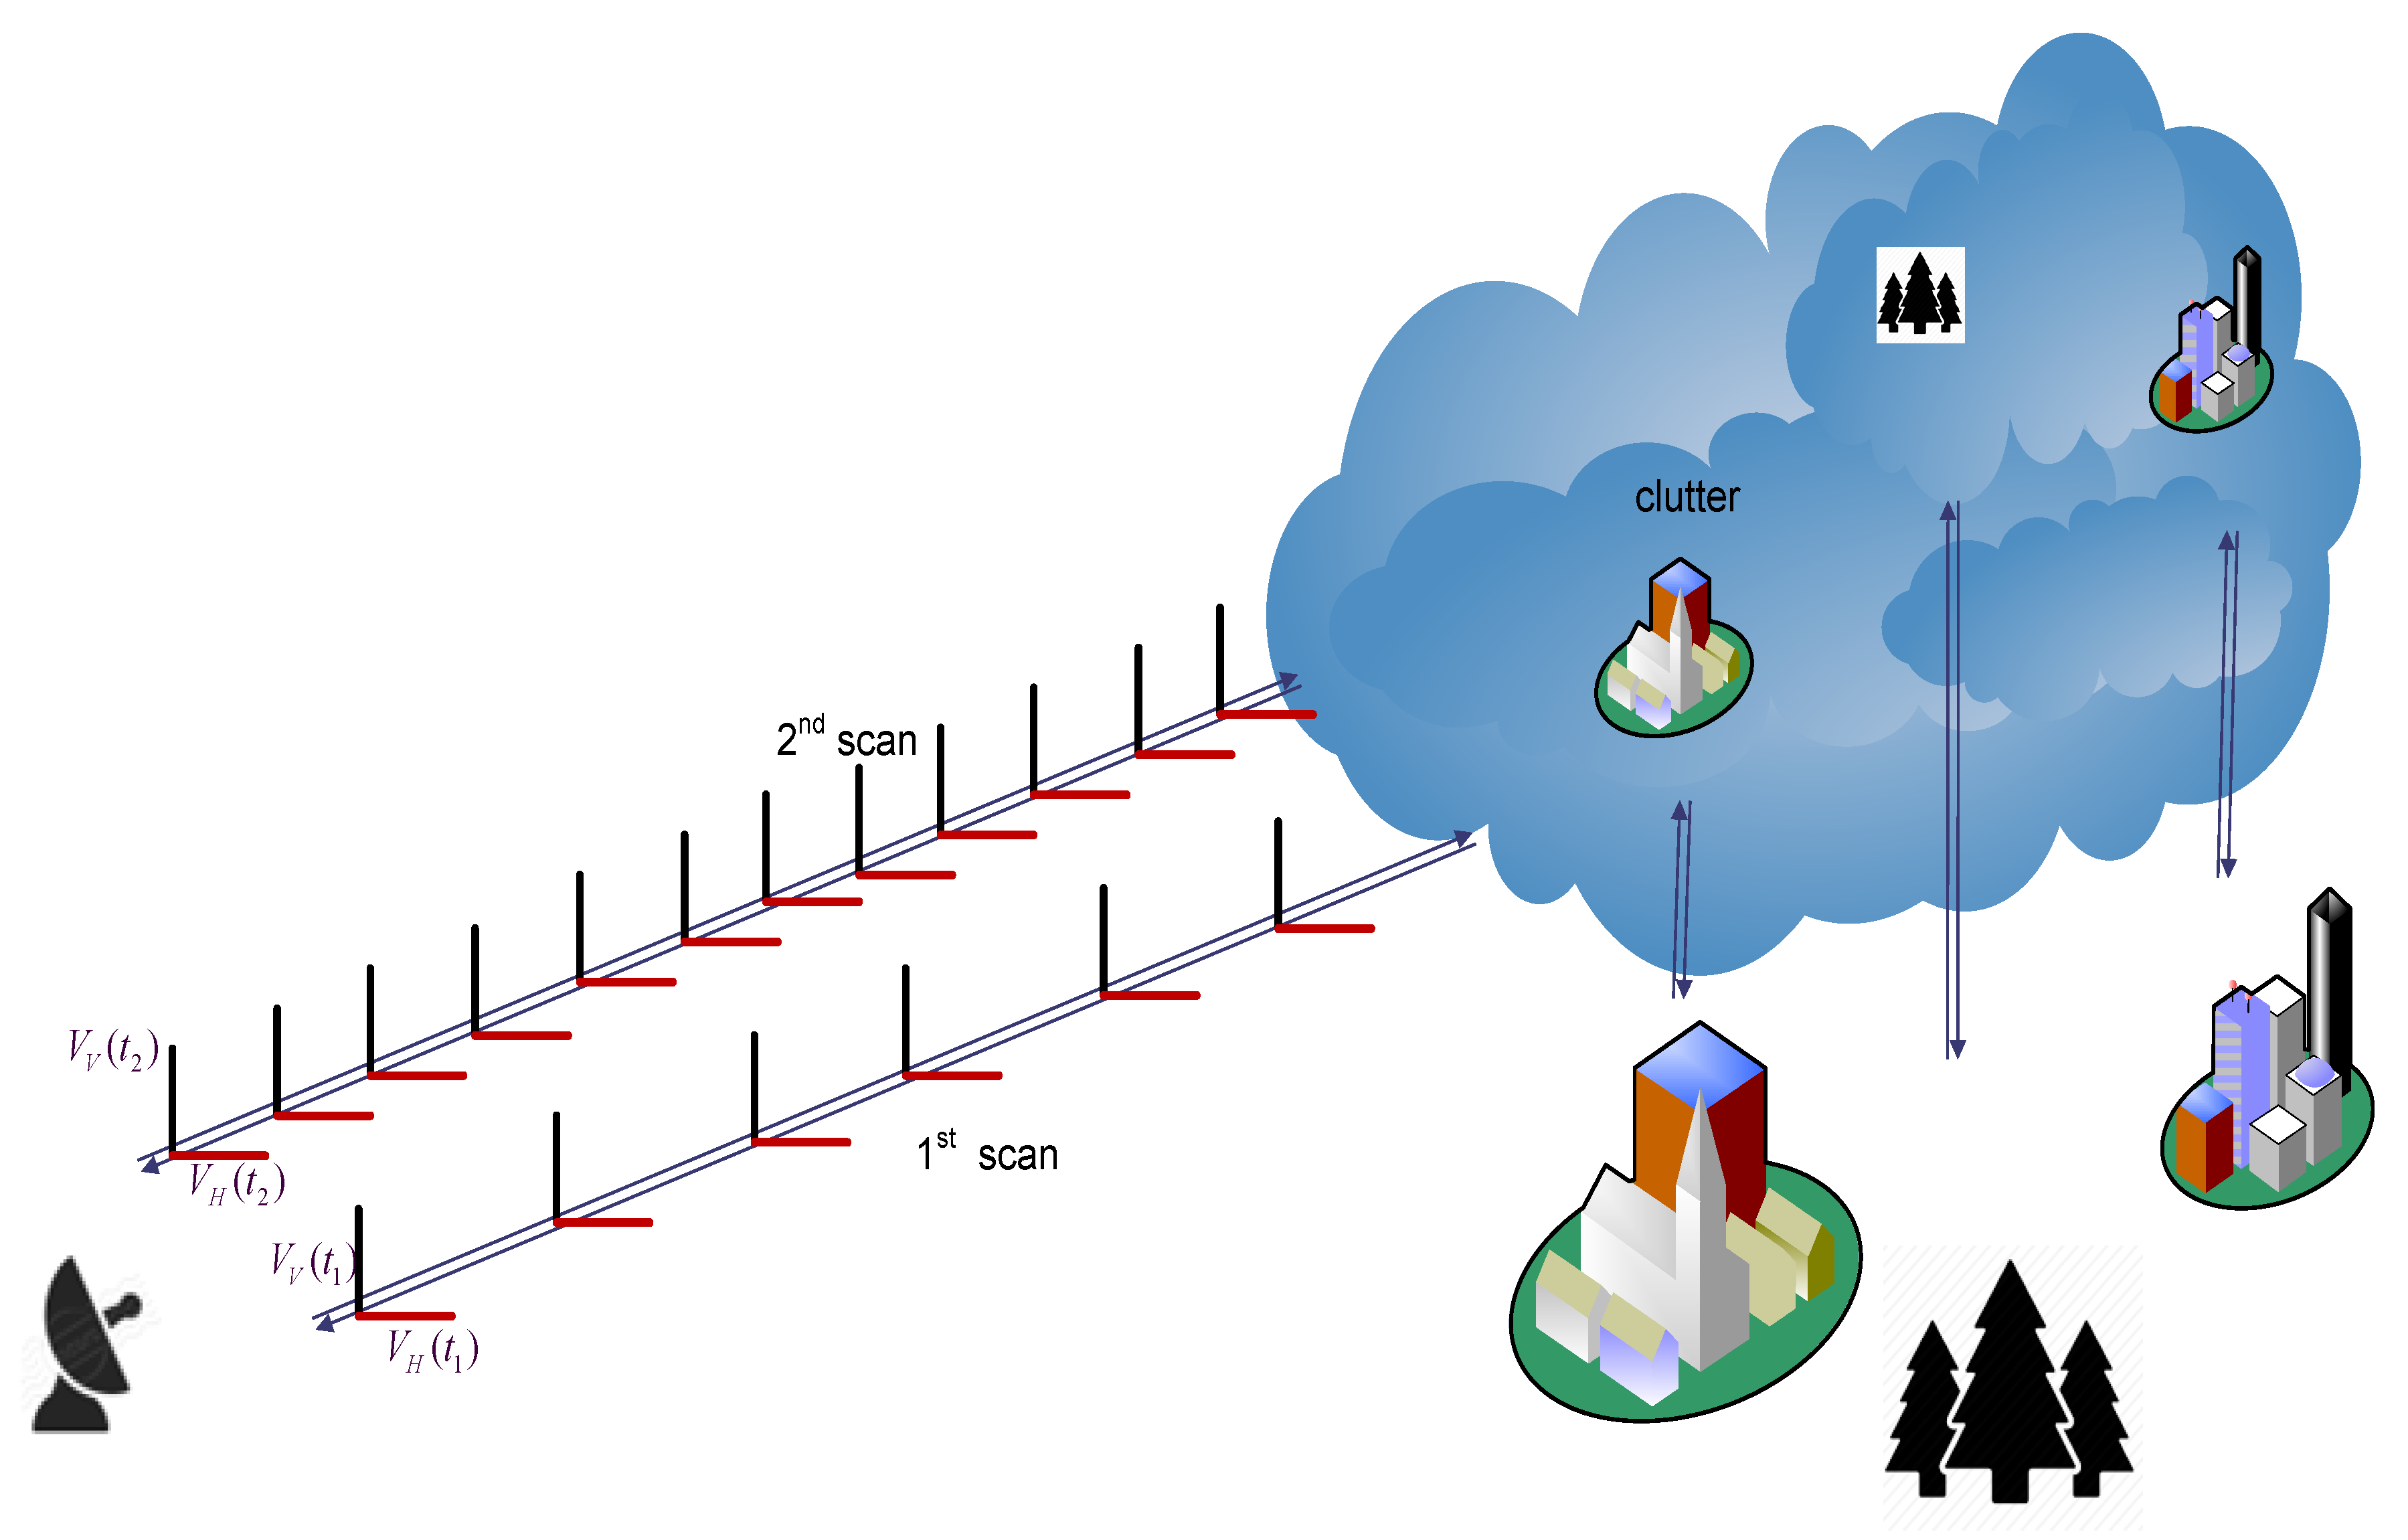
Two sequential azimuthal scans with different pulse repetition times (PRTs) are used in the volume coverage patterns (VCPs) of the WSR-88D to mitigate range–velocity ambiguities [
14]. The first azimuthal scan collects voltage samples data using long PRT (Ts1 = 3.10 ms); and the second scan at the same elevation angles uses a short PRT (Ts2 = 0.973 ms), as shown in
Figure 1. To implement the scan-to-scan method, the short PRT data are down-sampled in order to be matched with its corresponding long PRT data. Because the WSR-88D records the azimuth of each voltage sample, we were able to select those short PRT samples that are nearest in azimuth to the corresponding, long PRT samples.
Weather I/Q data were edited by excluding the resolution volumes showing SNR < 20 dB. The 20 dB SNR threshold is applied to produce data to mitigate/avoid noise effects. The weather data consist of two scans at the same elevation angle (i.e., 1.49°) separated by about 36 s. The clutter data were collected at 00:46 UTC on 4 February 2011 with two scans at the same elevation angle (0.5°) separated by about 76 s under clear air conditions. Ground clutter I/Q data were edited by deleting the resolution volumes showing mean Doppler velocities 1 m·s−1 and CNR (Clutter to Noise Ratio) < 3 dB. This deletion provided a clutter field not contaminated from moving objects on the ground or airborne (e.g., birds and aircraft).
The three discriminant functions for DPDS clutter detection are defined as:
A. Co-Polar Cross-Correlation Coefficient ()
Co-polar correlation coefficient between H and V, commonly known as dual-polarization correlation coefficient for H and V co-polar echoes, is a polarimetric parameter frequently used in the weather radar community, and it is defined as [
5,
13]:
where V represents the complex echo signal sample received from
h (
v) as the horizontally (vertically) polarized echo samples from the first or second scan; subscript
m signifies the echo sample number; and
M is the number of samples in a dwell time (
i.e., the time used to make estimates of polarimetric variables and spectral moments).
Reliable ground truth is an important issue to evaluate the performance of clutter detectors [
7,
8]. To obtain the class label of each resolution volume for obtaining the training data and discriminant PDFs, CMD has been used as suggested by [
9]. Although the performance of the CMD algorithm is entirely acceptable for our controlled training data, all PDFs were double-checked and modified by our DPDS algorithm.
The following are the three classes of echoes being considered:
Clutter (“C”) (narrow band zero Doppler velocity)
Narrow-Band Zero Velocity Weather (“W0”) (i.e., ≤ 2 m·s−1 and ≤ 2 m·s−1
Non-Zero Velocity Weather (“W”) (i.e., > 2 m·s−1 and > 2 m·s−1)
where
and
are the mean Doppler velocity and the spectrum width of weather, respectively [
4,
5,
8]. We considered W
0 as a separate weather class because their properties are mostly similar to clutter signals, and thus are the most challenging to distinguish. Weather signals W
0 are echoes from resolution volumes where the turbulence and the mean wind radial shear are weak, with a mean radial velocity close to zero; thus, these weather signals commonly have a longer correlation time
compared with the other weather signals (
i.e., W).
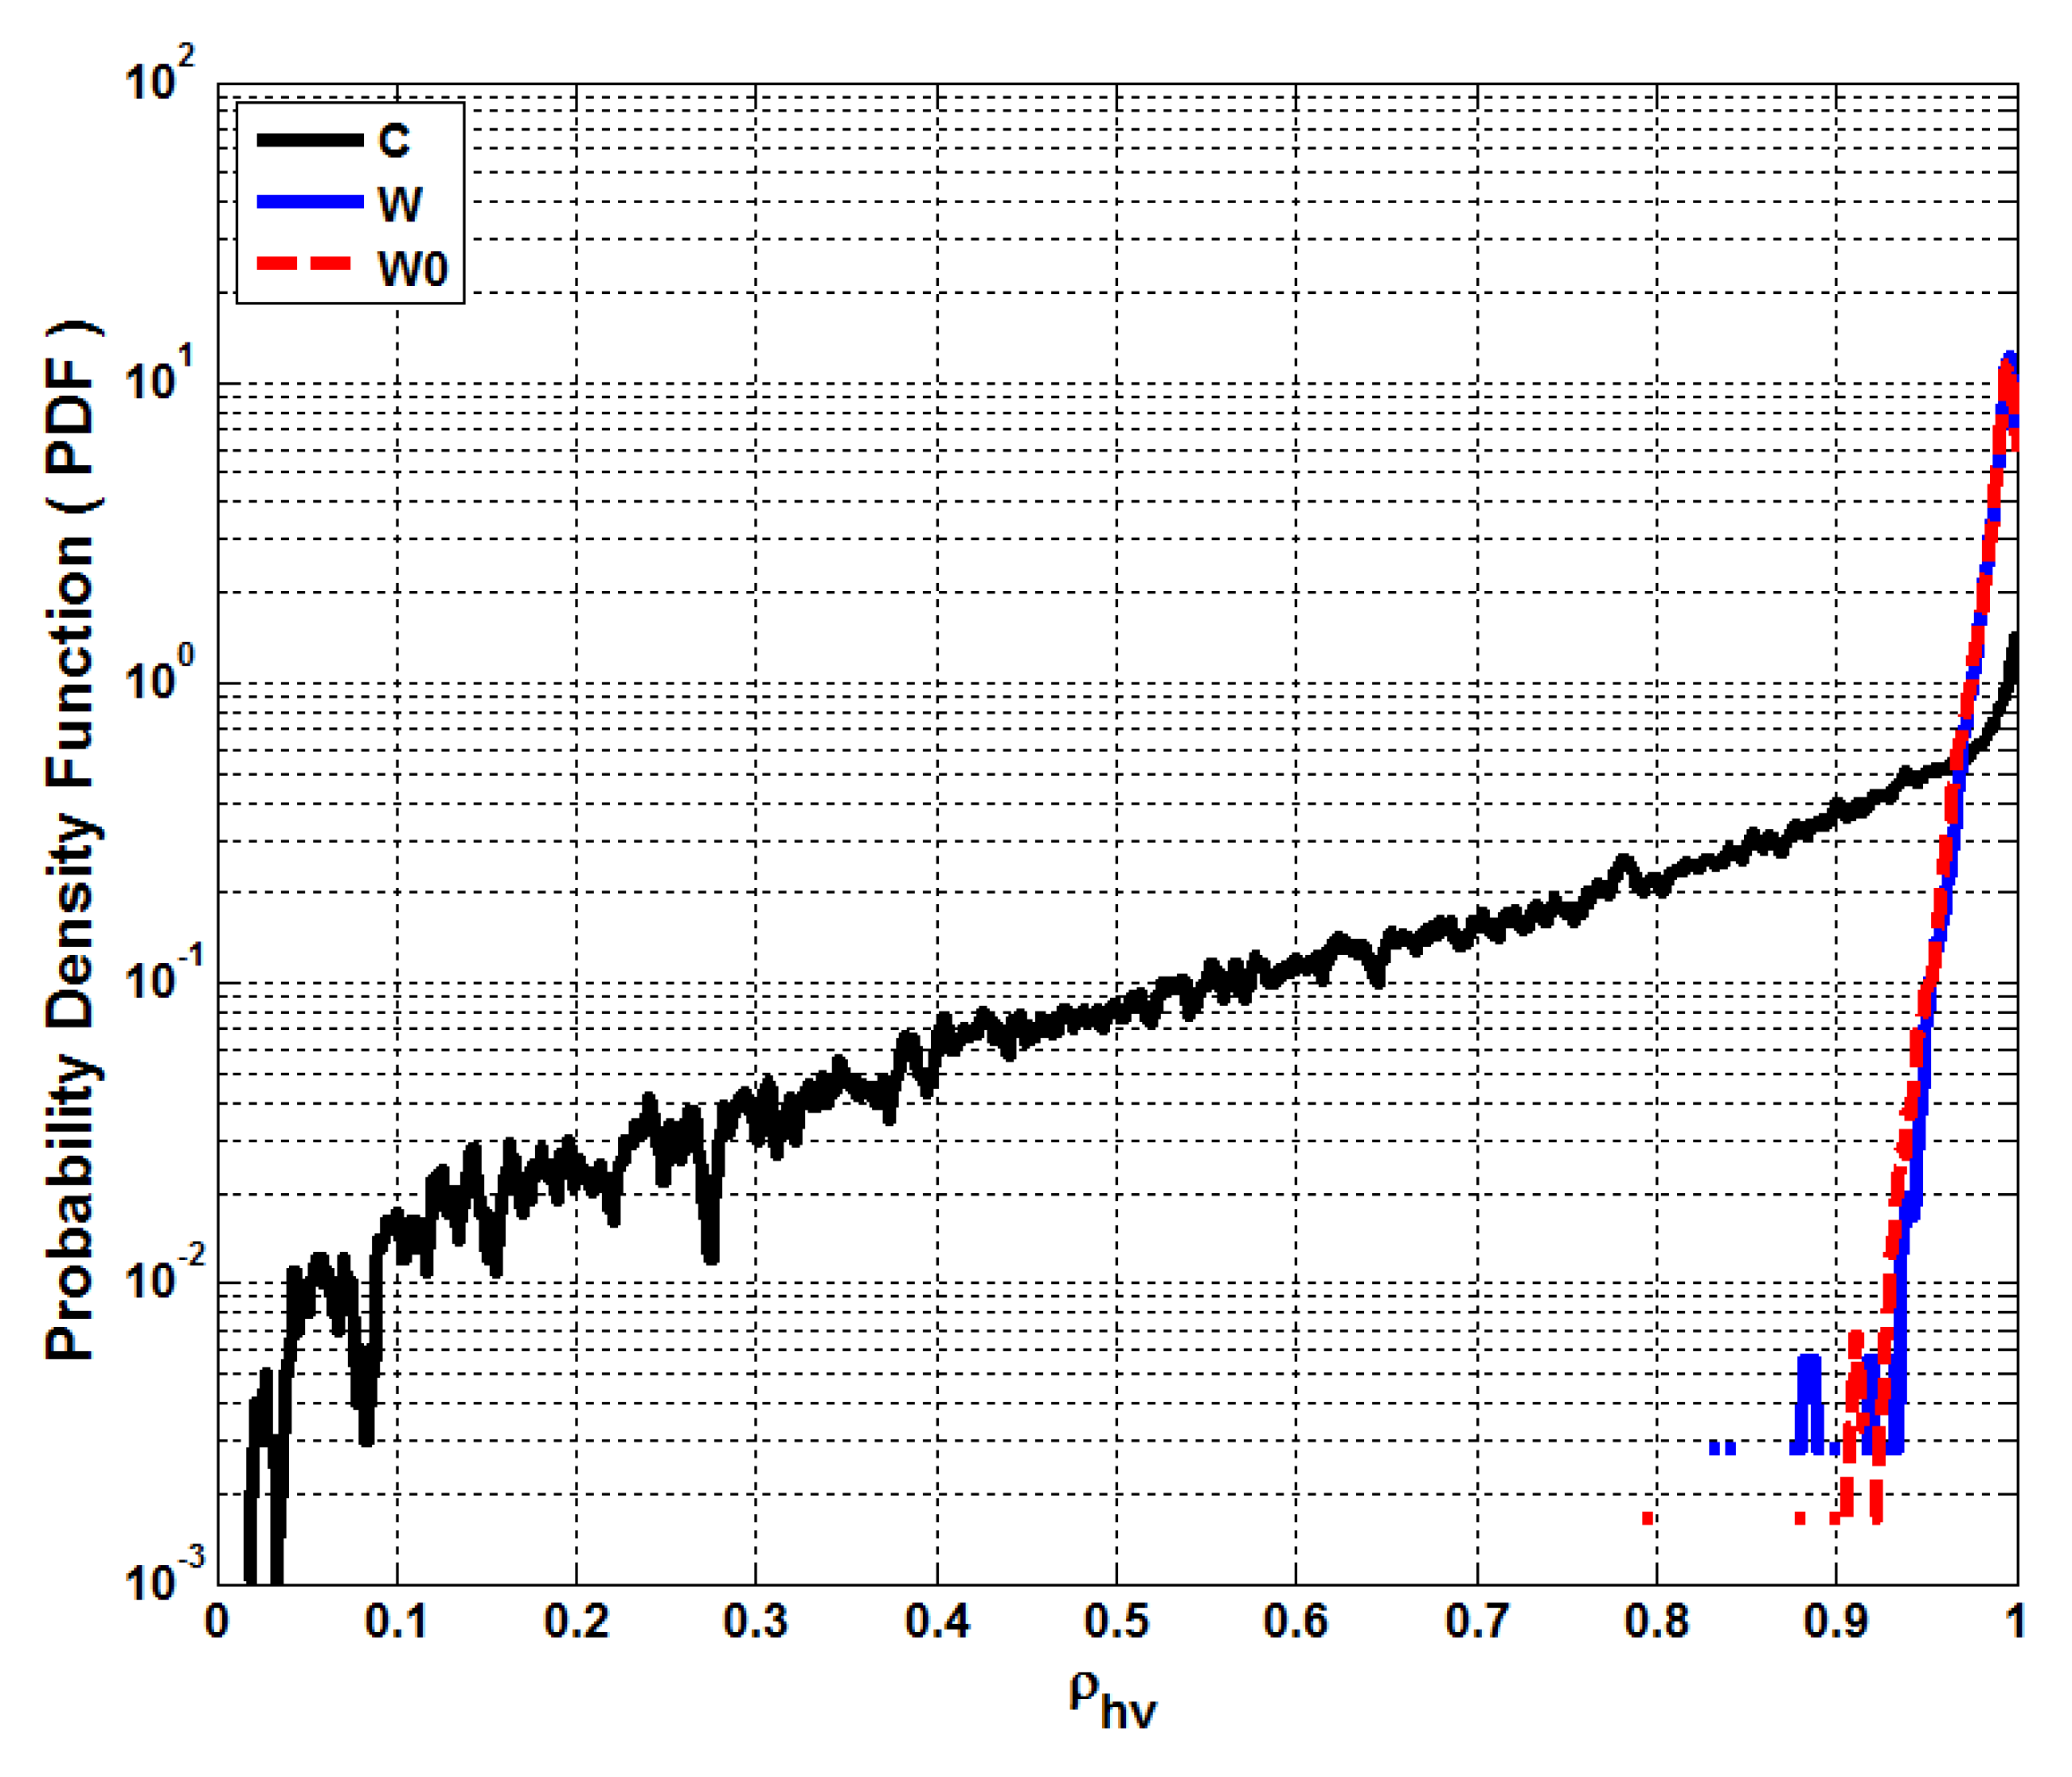
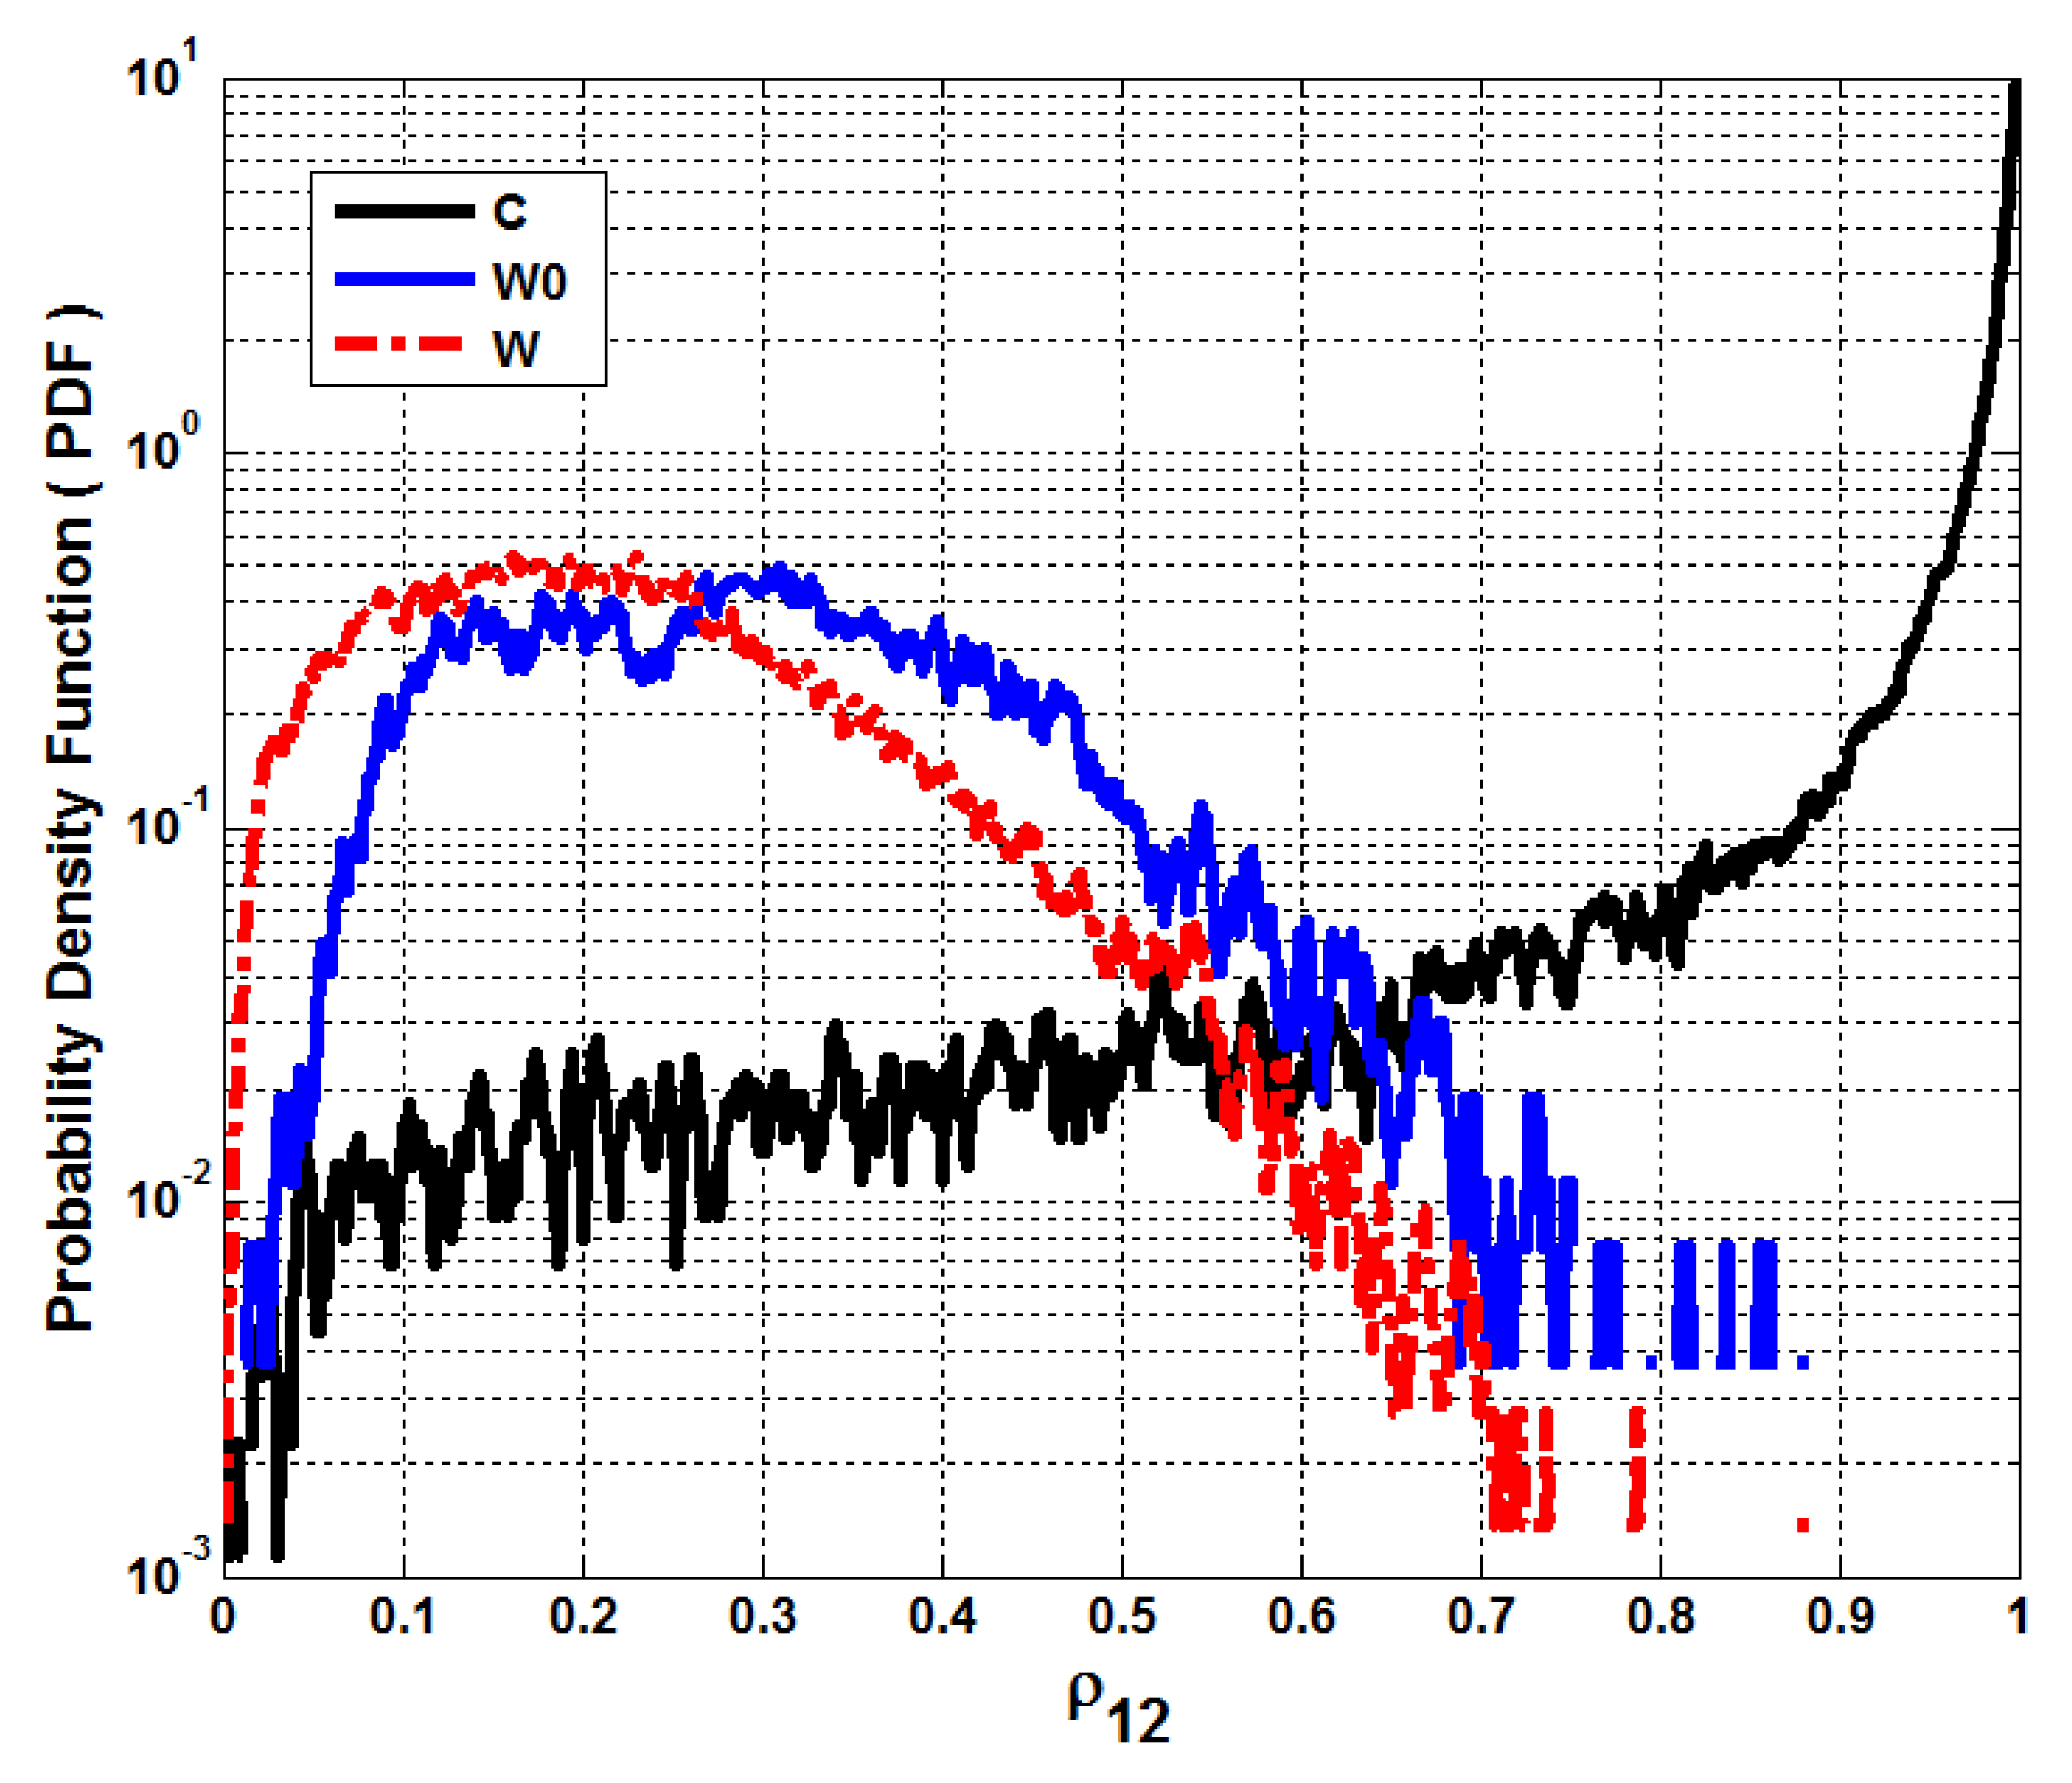
There are two correlation coefficient between H and V polarization, based on the two scans, i.e., and . We used as the average of and , because the PDFs are almost the same.
The pdf of
is shown in
Figure 2. It can be seen from this figure that
values for both clutter and weather signals are mostly close to one. However, the
for ground clutter has much larger spread values compared with weather signals. It should be noted that the clutter pdf of
depends on the characteristics of scatterers and antenna rotation, and can be easily updated, based on the weather condition, radar and antenna rotation.
B. Dual-Scan Cross-Correlation Coefficient
Dual-scan cross-correlation coefficient between two-time series from the same location but from consecutive scans is defined as [
5,
15,
16]:
This cross-correlation can be calculated for both h and v polarizations. Thus, there are two discriminants, and , and we used as the average of and , due to their having mostly the same PDFs.
It is expected that
should be larger for ground clutter than weather signals [
4,
5,
12], because ground clutter has a longer correlation time than weather signals, as shown in
Figure 3.
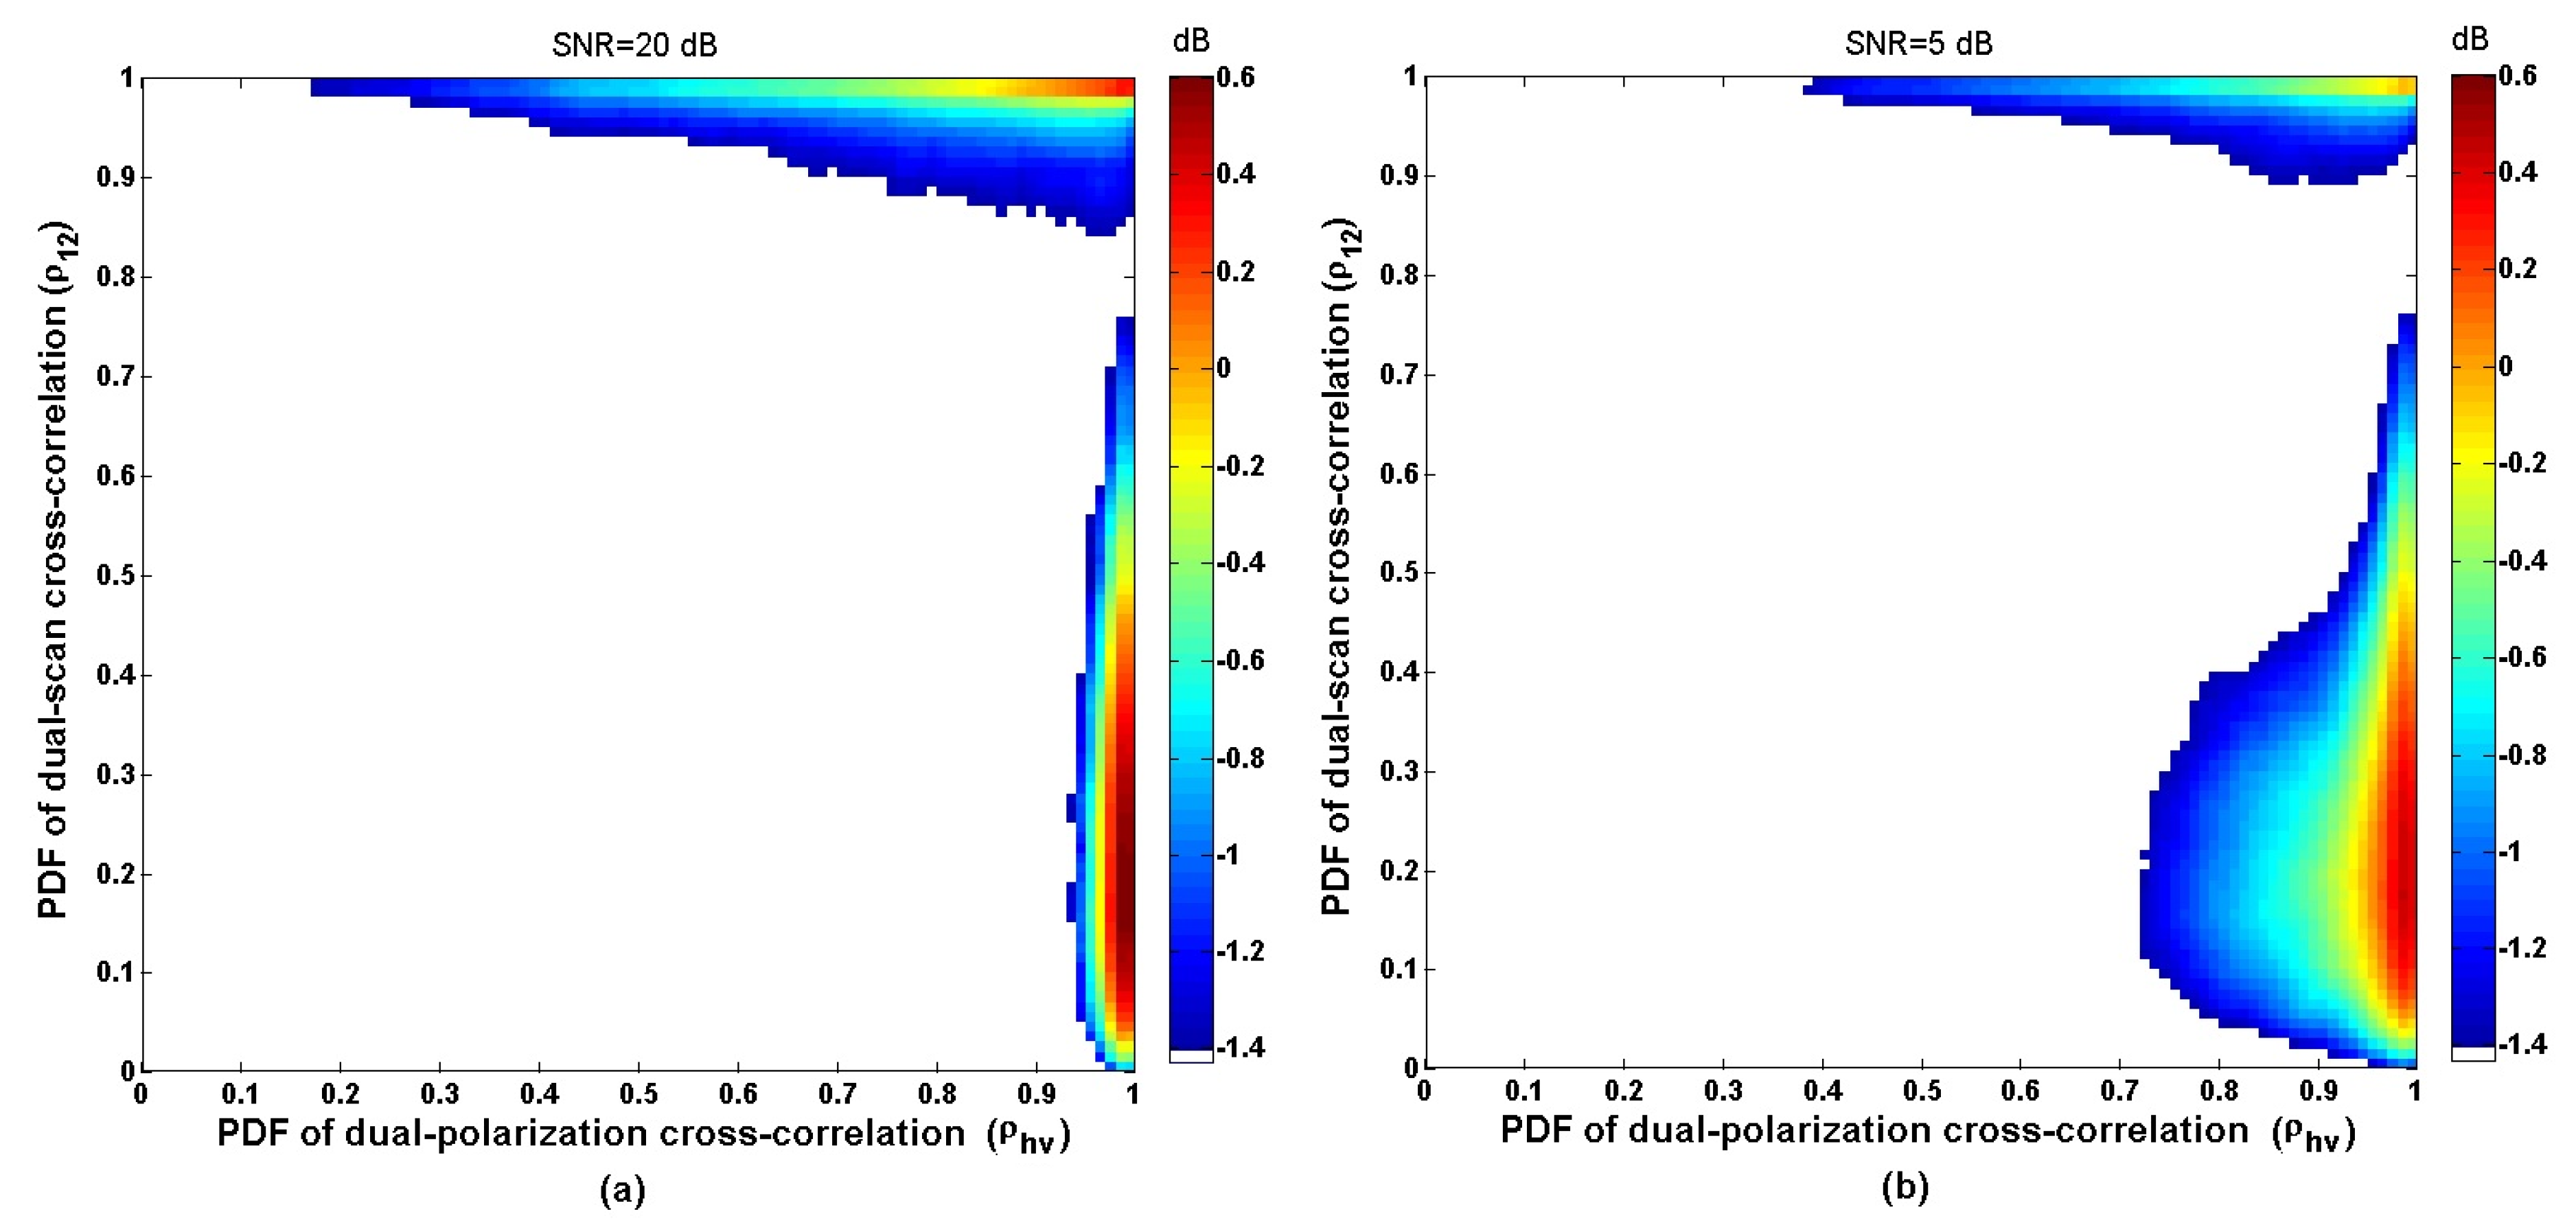
Figure 4 illustrates the joint pdf between dual-scan cross-correlation and dual-polarization cross-co-polar correlation, for two different SNR threshold values. As expected, the weather signals have larger
with smaller
. Additionally, the clutter has larger
values with a wide range of
. Thus, it can be clearly concluded that the joint pdf of clutter and weather signals are thoroughly separated in terms of this discriminant function. Therefore, this discriminant function can undoubtedly reduce the error detection and improve the probability of detection compared to previous common algorithms. As can be seen from this figure, the SNR threshold value may change the joint PDFs, but the performance of the DPDS algorithm is not sensitive to SNR, because the overlapped areas between clutter and weather do not change with SNR. Other discriminants can be considered for future works by using cross-correlation between multiple antennas and exploiting spatial diversity [
17,
18,
19].
C. Differential Reflectivity (ZDR)
Differential reflectivity is the power ratio of horizontal and vertical polarization signals [
20], and is defined as:
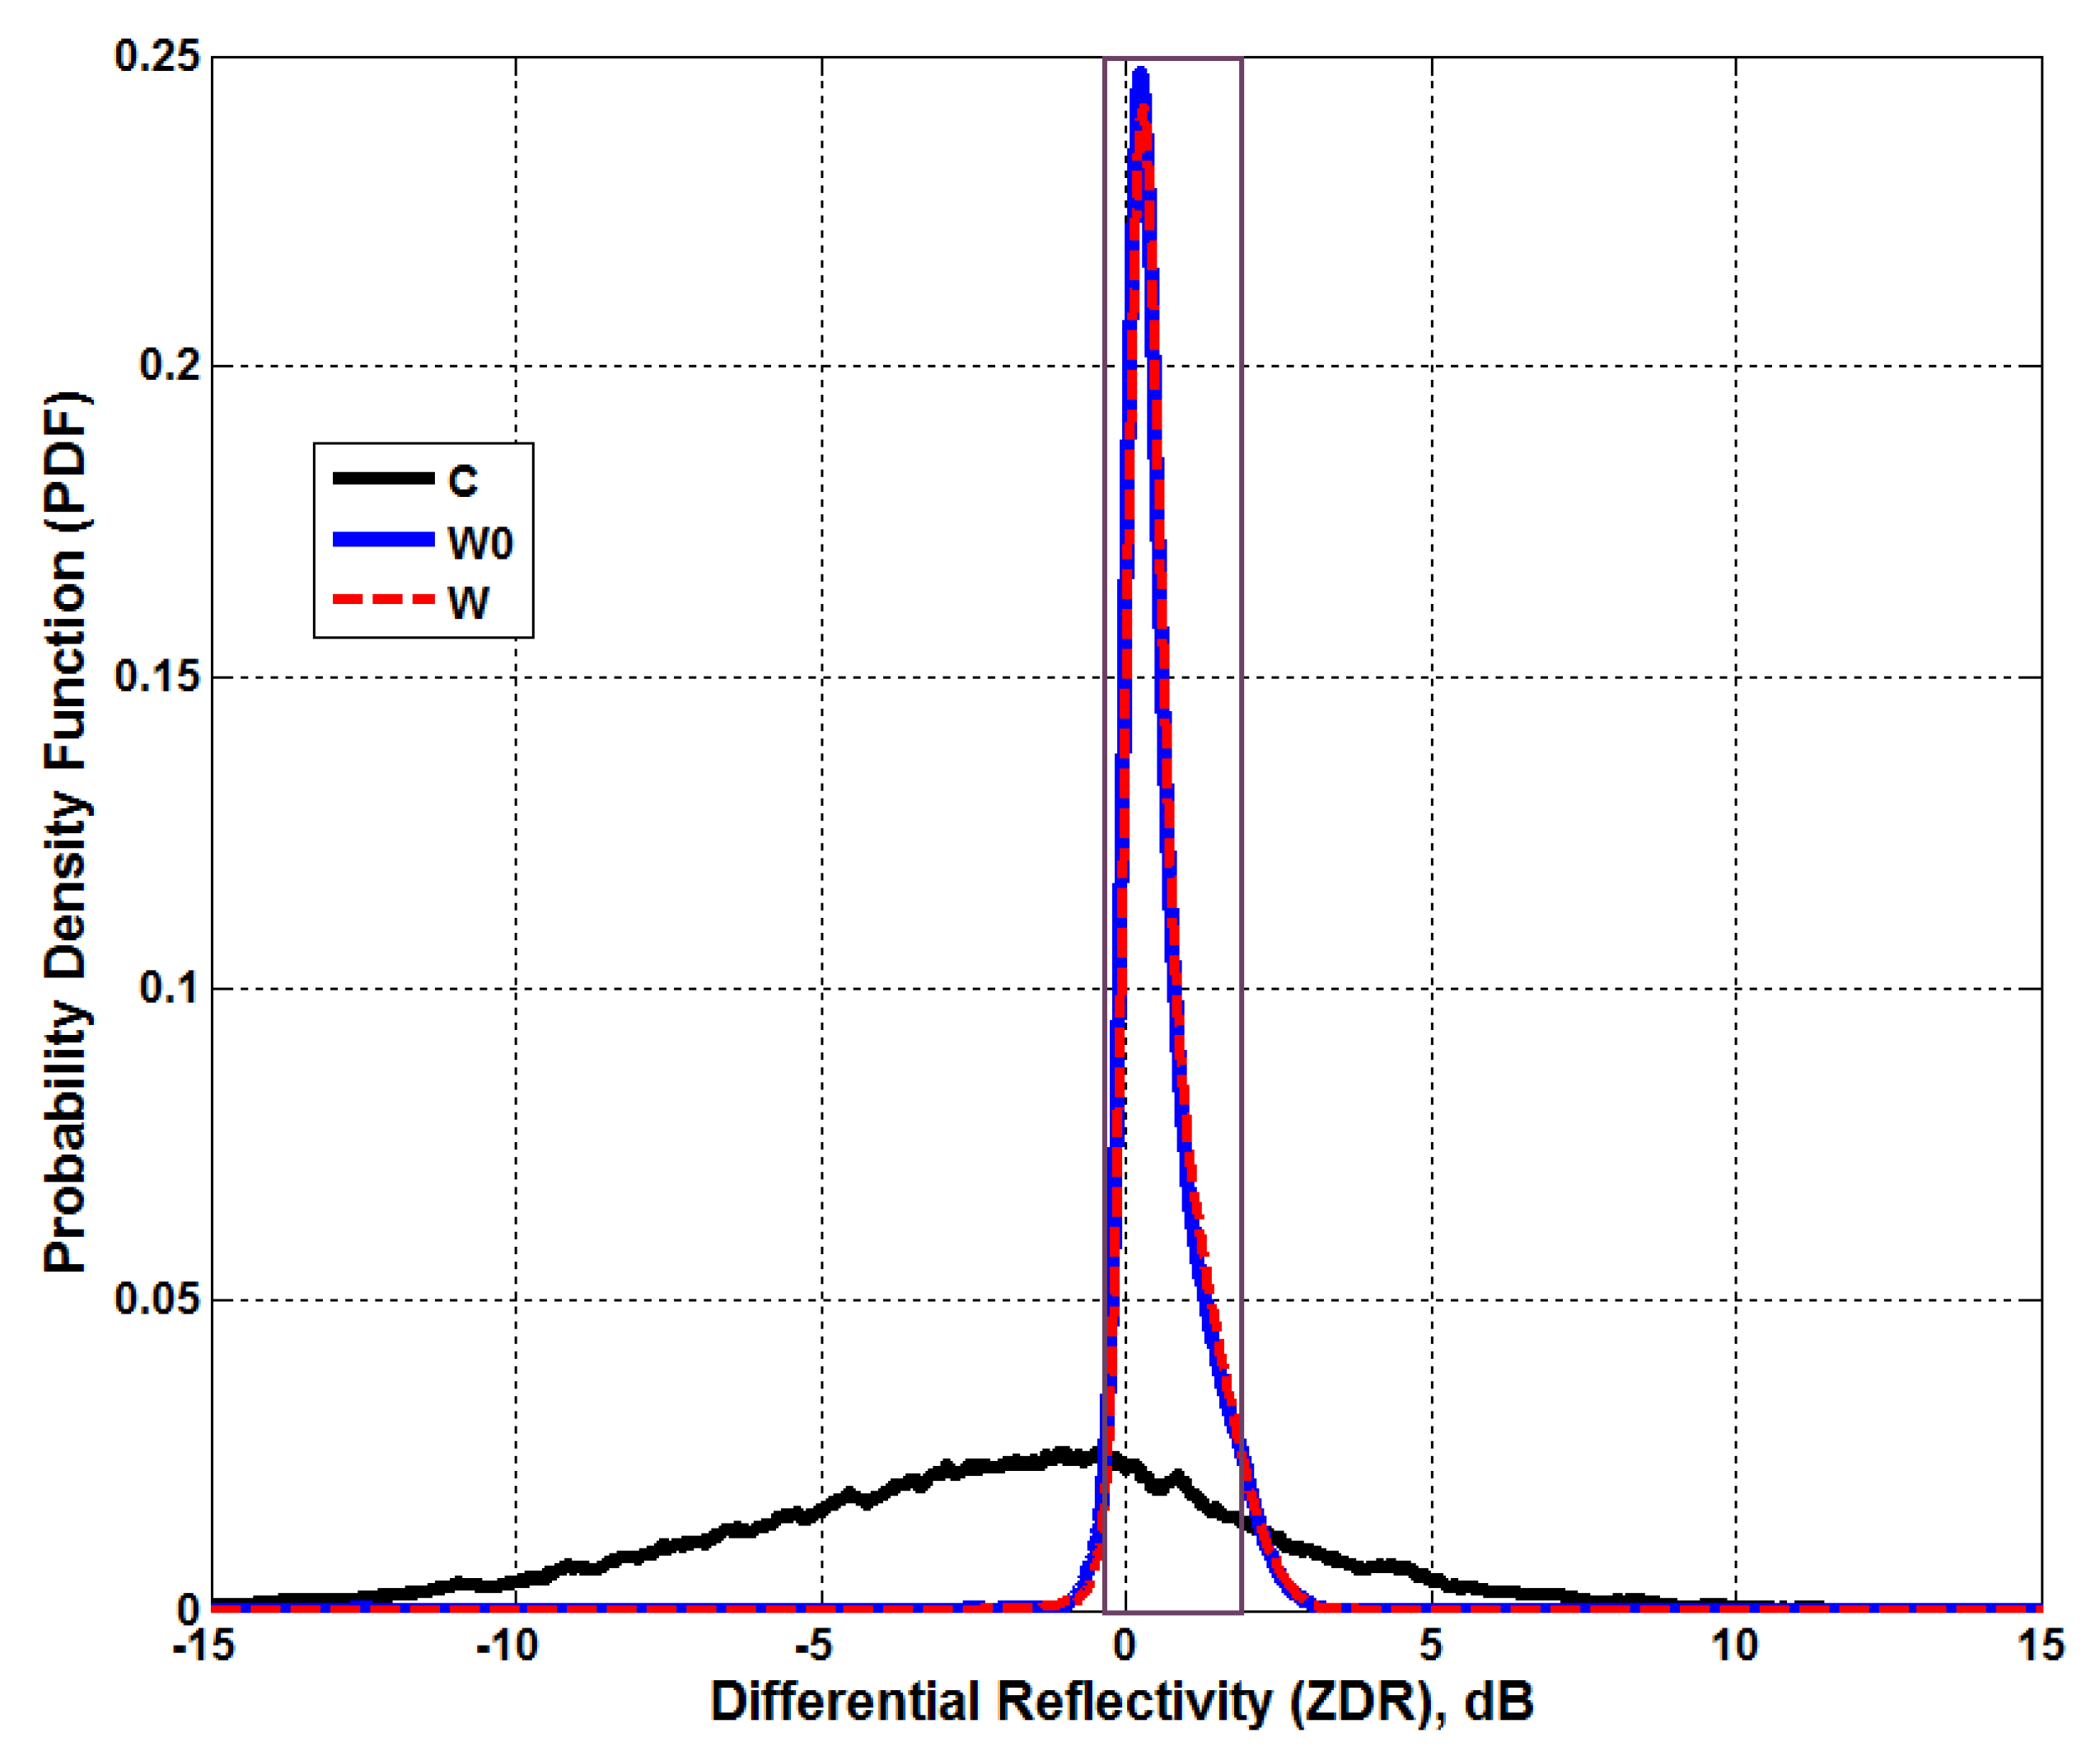
The PDFs of differential reflectivity based on the training data are shown in
Figure 5. As is normally expected, the Z
DR values for clutters have a wider range in comparison to weather signals [
4,
5]. Because we conducted two consecutive scans, there are two differential reflectivities (
i.e.,
and
); and both of them most likely have the same PDFs; thus, we used the averaged value for Z
DR. It can be seen from
Figure 5 that both PDFs center near zero, but that clutter has a wide distribution, whereas the PDF for weather signals is narrow. Because the PDF of Z
DR for weather is much larger than that of the clutter in the region near zero, it is clear that clutter with the near-zero Z
DR values would most likely be detected as weather instead of clutter. Therefore, in order to decrease the detection error rate, Z
DR in the interval within the pair of vertical lines is not considered for clutter detection. Z
DR does not contribute as much as the other discriminants. However, from our experience, there is around a 3%–5% performance improvement for
PD when we use ZDR as a discriminant.
3. Bayes Optimal Decision
After the PDFs are obtained from training data, they will be used as a reference for the optimal Bayesian classifier to make decisions on testing data. The PDFs and three types of radar echoes are shown in
Figure 4 and
Figure 5. The three discriminants of testing data are calculated from Equations (1)–(3) for each gate, to form the observational discriminant vector
X° = (
ZDR,
,
).
Given an observation of the discriminants (
X°), the classifier will identify that
X =
X° belongs to the class
, if and only if
p(
|
X°) >
p (
|
X°) for
i,
j [C, W
0, W],
j ≠ i. According to the Bayes rule, the probability of
class given the observed
X°, can be calculated as [
21]:
A priori probabilities are assumed to be equal for all classes,
i.e.,
. Furthermore, as
p(
X =
X°) is the same for all classes, Equation (4) can be rewritten as:
where
K is constant for all classes.
Therefore,
is proportional to the likelihood function of classes with respect to
X =
X°,
i.e.,
. The likelihood function can be obtained from training data for all classes by using the PDFs that are shown in
Figure 4 and
Figure 5. Thus we have:
Therefore,
is calculated for all classes, and the class corresponding to the maximum probability value will be selected as the classification decision. Thus, we can infer that Bayesian classifier assigns
X =
X° to “C” only if
The DPDS algorithm is summarized in the following steps:
Calculate SNR for current gate. If SNR < 20 dB, the current gate is considered not to have a significant weather signal and we compute SNR for the next range gate. Otherwise, go to step 2.
Compute the three observed discriminant functions for the current gate, and calculate , , and using Equation (6).
If and for the current gate, the data is clutter-contaminated. Otherwise, the data is not contaminated and we return to step 1) for the next gate.
4. Performance Evaluations of DPDS
In this section, the performance of the DPDS algorithm is evaluated using the testing control data sets collected by the KOUN (WSR-88D) radar at 13:07, 13:08 and 14:02 UTC on 9 February 2011, and 00:46 UTC on 4 February 2011 with two scans at the same elevation angle. The same procedure has been used to obtain the ground truth, from the combination of pure clutter and pure weather data for the controlled testing data sets. Therefore, the ground truth will be used as a reference for the clutter detection algorithms. The ground truth can also be used to find the clutter to noise ratio (CSR). By changing the CSR, we can compare the performances of detection algorithms.
We will compare the DPDS algorithm to previous clutter detection algorithms, such as DP, DS, CMD, presented in [
8,
12,
13].
Figure 6 shows the statistical characteristics of our testing data for DPDS.
To evaluate the performance of DPDS, the numbers of true positives (TP), false negatives (FN), false positives (FP), and true negatives (TN), as well as probability of detection
, and probability of false alarm
are calculated. “True” or “False” stand for truly or falsely detected by the algorithm, and “Positive” or “Negative” stand for the clutter decision made by the algorithm. The probability of detection and false alarm (
i.e.,
and
) are generally calculated as:
Figure 7 illustrates the probability of detection (
)
versus clutter to signal ratio for DPDS, DP, DS, and CMD algorithms. It is clear
rate should increase with increasing clutter power or CSR. All radars do not have ability to collect dual scan data. However, the same procedure can be implemented to detect clutter using other discriminants such as power ratio (PR—defined as the ratio between coherent and incoherent power). As shown in
Figure 7, there is still significant improvement in
using the proposed clutter detection procedure over that of CMD.
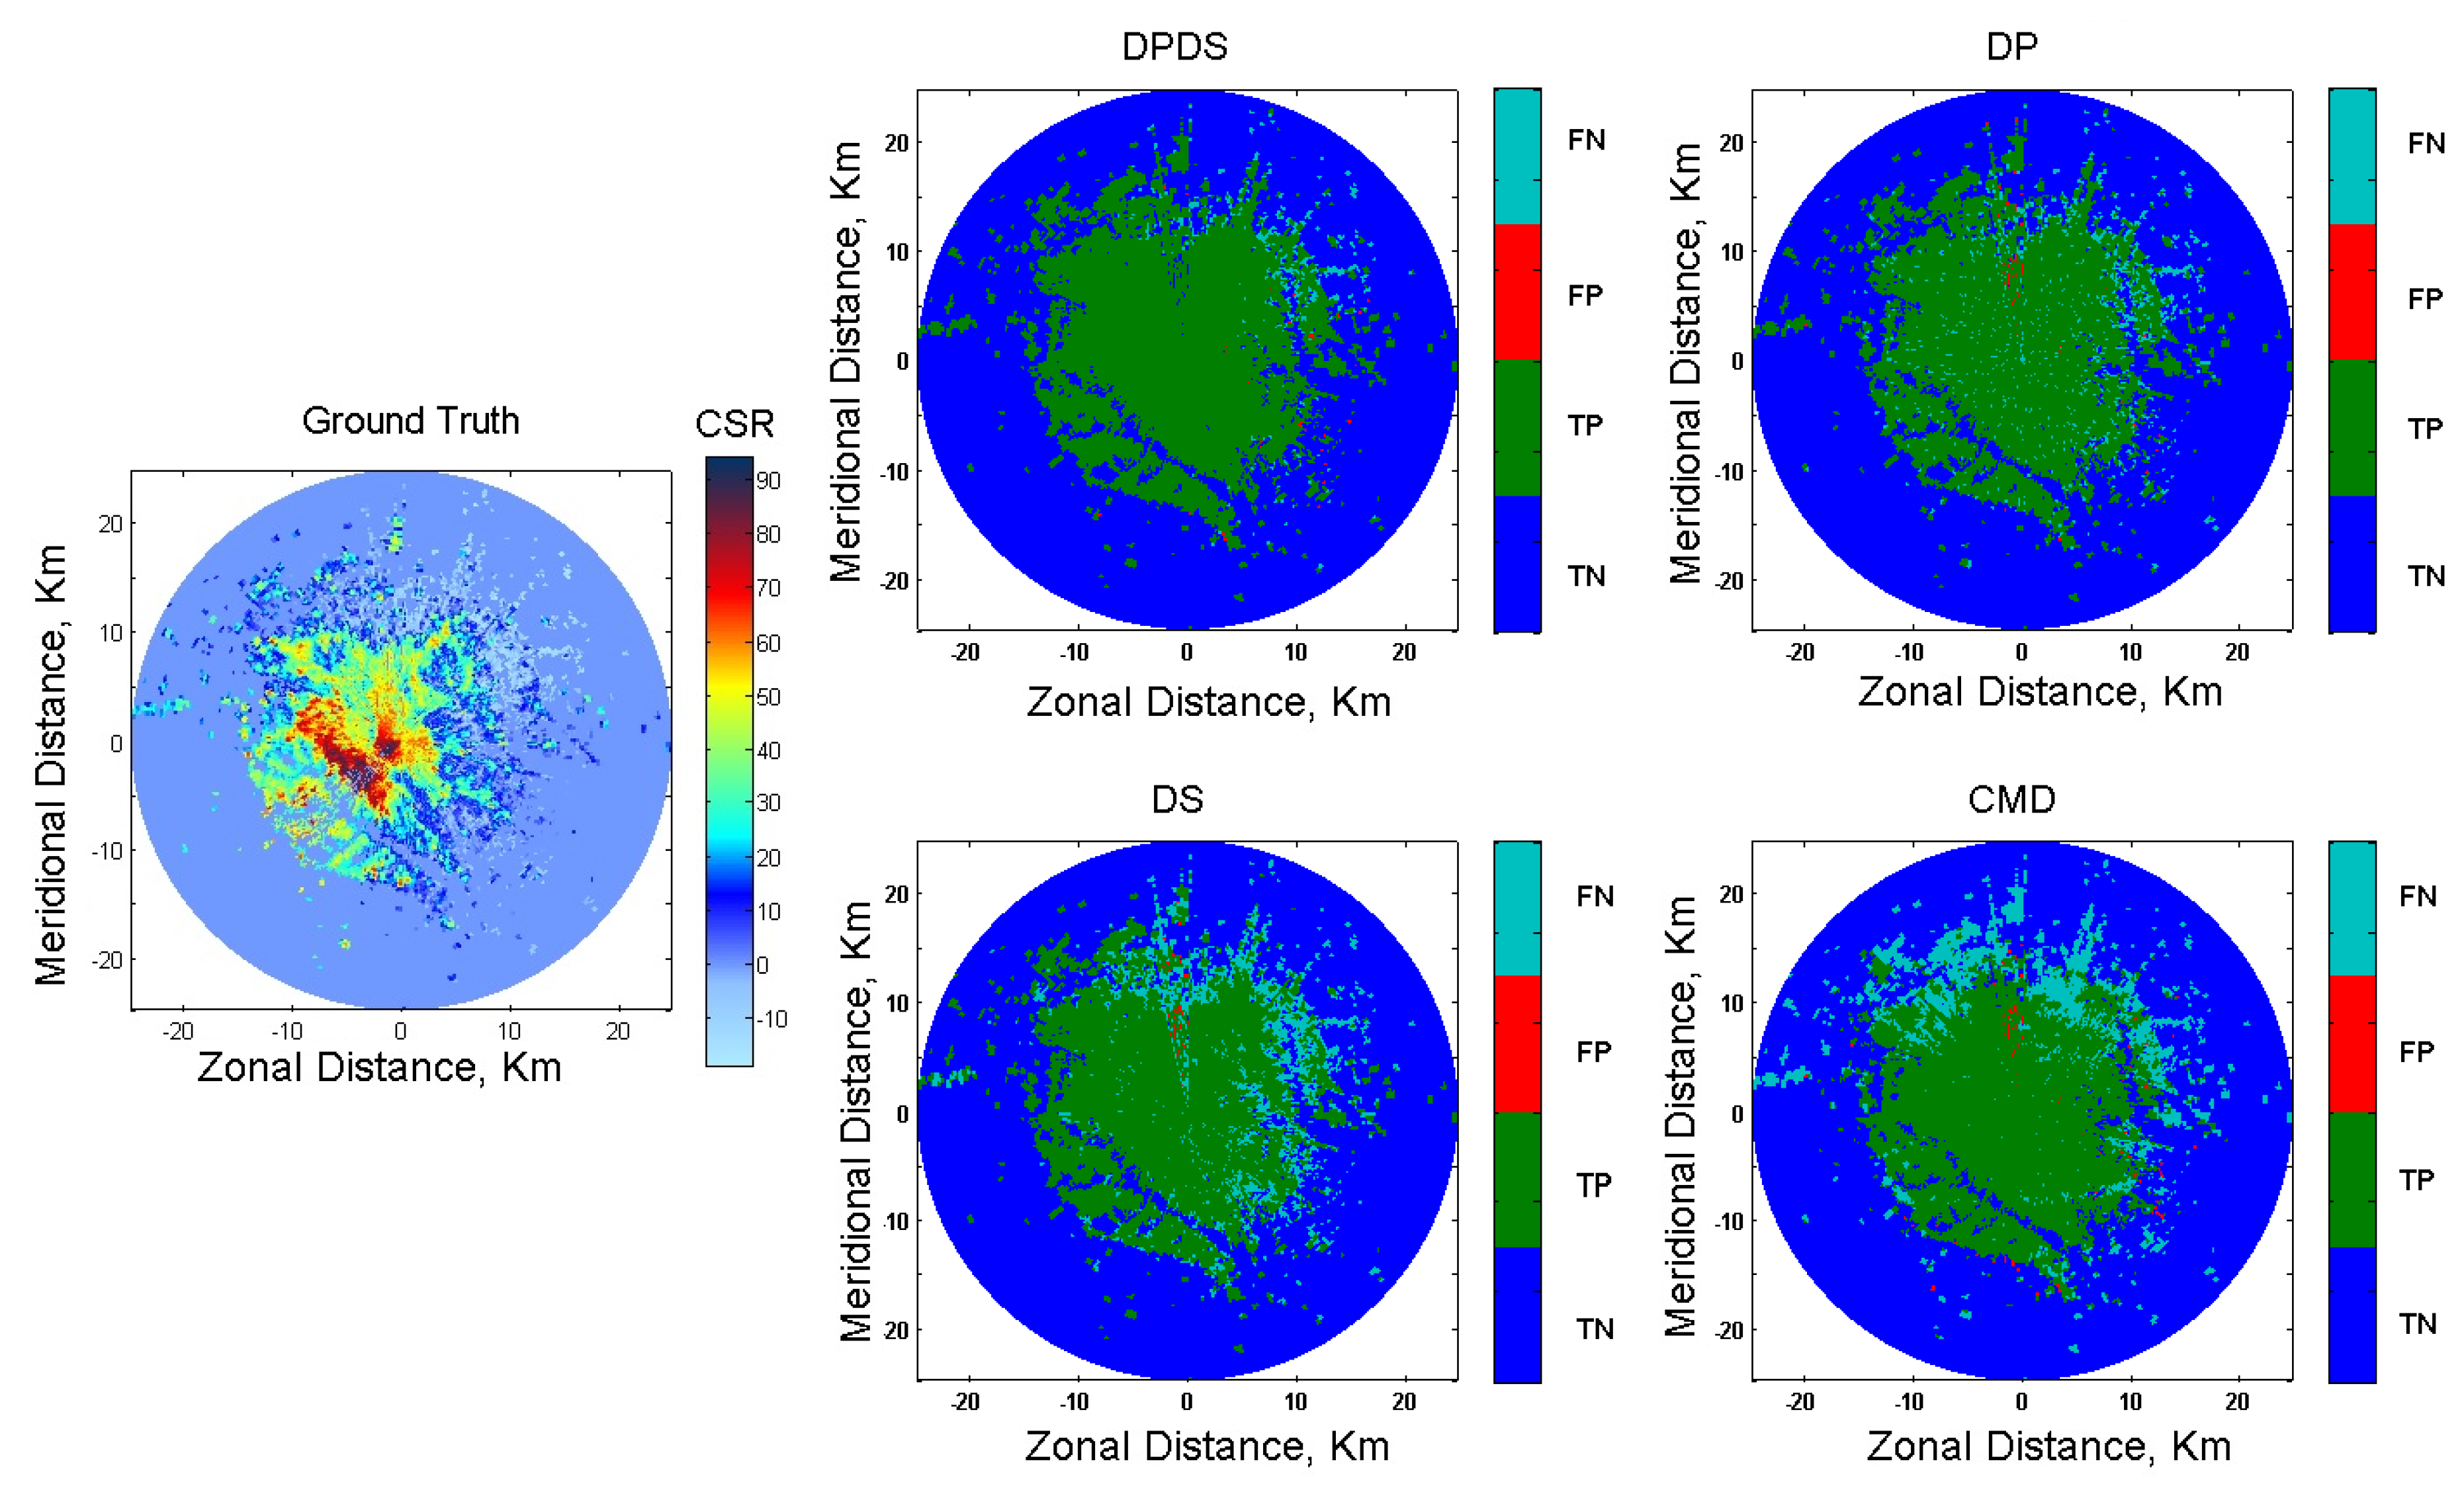
Figure 8, illustrates the clutter map of the ground truth along with CSR, and clutter maps of DPDS, DP, DS, and CMD algorithms. As can be seen from this figure, the DPDS is most similar to ground truth in comparison to other algorithms. Additionally, it was shown in
Figure 7 that the difference between
of DPDS and other detection algorithms increased with decreasing CSR. Therefore, the DPDS improvement gain is clearly observable in the resolution of the clutter map, in
Figure 8, especially for the low values of CSR. It also can be seen from
Figure 8 that for high CSR values, DPDS algorithm has better performance in comparison to DP, DS, and CMD algorithms, respectively.
In
Table 1, we list the probability of false alarm (
PFA) for the three controlled testing data sets, collected by KOUN at 13:07, 13:08 and 14:02 UTC on 9 February 2011.
From
Table 1, we can see that all four algorithms produce low
PFA, the reason is that there are too many weather signal pixels. This table shows that DPDS algorithm produces the lowest
PFA with the highest
PD.
5. Conclusions
In the proposed DPDS clutter detection algorithm, a dual-polarization and dual-scan (DPDS) weather radar improves detection of clutter from weather signals with minimum error rates. Cross-correlation and auto-correlation between two scans of dual-polarization radar signs have been jointly combined to form exceptional discriminant functions. The PDFs of discriminants may change and may need to be updated based on the weather, clutter, and antenna rotation, but the procedure of detecting clutter is the same. Proposing a thorough clutter detection method for various conditions and precipitations will still serve as a motivator for future works. A well-known Bayesian classifier has been defined to make an optimal decision for clutter detection, based on discriminant functions. Practical control data sets have verified the performance improvement of our proposed DPDS algorithm compared with DP, DS, and CMD algorithms. The statistical and physical characteristics obtained from dual-polarization weather radars can be generalized to detect other objects instead of just clutter.


