Article

Size-Dependent Characterization of Atmospheric Particles during Winter in Beijing

1
State Key Joint Laboratory of Environment Simulation and Pollution Control, School of Environment, Tsinghua University, Beijing 100084, China
2
State Environmental Protection Key Laboratory of Sources and Control of Air Pollution Complex, Tsinghua University, Beijing 100084, China
3
Kimoto Electric Co. Ltd., Funahashi-Cho, Tennouji-Ku Osaka 543-0024, Japan
*
Authors to whom correspondence should be addressed.
Atmosphere 2016, 7(3), 36; https://doi.org/10.3390/atmos7030036
Submission received: 27 December 2015 / Revised: 30 January 2016 / Accepted: 4 February 2016 / Published: 3 March 2016

Abstract

:
Two real-time instruments, NCSA (Nanoparticle Chemical Speciation Analyzer) and ACSA (Aerosol Chemical Speciation Analyzer), were both deployed in Beijing, China to explore the sized-dependent characterization of atmospheric particles. The mass concentrations of PM1, PM2.5, PM10, and sulfate and nitrate in the three size fractions were hourly measured in situ from 13 December 2013 to 7 January 2014. Generally, “sawtooth cycles” are common during winter in Beijing, with the PM concentrations increasing slowly over a few days, then falling to a low level abruptly in only a few hours. The secondary species, sulfate and nitrate, play important roles in haze formation and account for 10.5% and 11.1% of total PM1 mass on average. Based on the variation of PM1 mass concentrations, we classify the study periods into three categories, clean, slightly polluted, and polluted. The oxidation ratios of sulfur and nitrogen both increase from clean to polluted periods, indicating the significant contribution of secondary transformation to haze evolution. While the PM2.5/PM10 ratio shows high dependence on PM pollution level, the ratio of PM1/PM2.5 remains almost stable during the entire study, with an average of 0.90. With respect to the mass-size distribution of chemical components, both sulfate and nitrate show dominant contributions in PM1 size fraction, accounting for 80.7% and 60.3% of total sulfate and nitrate, respectively. Our results also reveal that the elevated sulfate in PM1, and the enhanced nitrate in PM1 and PM2.5–1 size fraction, prompt the formation of haze pollution.

1. Introduction

Particulate matter (PM) is a crucial air pollutant in urban environments. It is of great importance not only due to its direct and indirect radiative forcing on climate but also due to its significant adverse health effects. Epidemiological studies have suggested a strong correlation between health effects and ambient fine particle concentrations, especially the submicron fraction (particles with a diameter < 1 μm, PM1) that can penetrate into the alveolar region of the lungs [1,2,3]. Exposure to high concentrations of submicron particles has been found to result in more hospitalizations and higher mortality rates [4,5,6]. Additionally, health effects, light extinction caused by atmospheric aerosol particles is a serious aspect for visibility degradation. Highest particulate mass extinction efficiency lies in the size range of 0.1~1 μm [7].
Beijing, the capital city of China, has created global scientific interest for its heavy PM pollution in recent years. The quick development of a variety of industries, including power plants, industrial production, and transportation, has led to increased emissions of particulate matter. In January 2013, Beijing experienced one of the worst haze pollution events ever. The hourly fine particle (PM2.5) concentration reached up to ~900 μg·m−3, causing adverse health effects [8]. As a consequence, the government has to adopt various measures to improve air quality. The atmospheric “National Ten” is called the most stringent measure in history. By 2017, the annual average PM2.5 concentration in Beijing should be controlled at about 60 μg·m−3. Although a great deal of research has been taken to explore the characterization and sources of PM in Beijing, the complex physical/chemical transformations and non-linear interactions between the different sources are not completely understood and need investigation. In addition, due to the paucity of size-dependent measurement data, most previous studies mainly focus on a single size fraction of ambient particles. Thus, more size-dependent information is needed to help understanding the complexity of PM.
The distribution of ambient particles in different size modes is important in understanding PM formation mechanisms and sources [9,10,11]. Ariola et al. (2006) studied the elemental characterization of PM10, PM2.5, and PM1 in the town of Genoa, Italy using the sequential sampler PARTISOL [12]. However, the three PM fractions were not collected in the same period, and no direct comparison among the three size fractions was given. In terms of daily average values of PM10, PM2.5, and PM1, Vallius et al. (2000) found that PM10 and PM2.5 concentrations differed in pattern during re-suspended dust episodes, whereas PM1 concentrations followed PM2.5 fairly well throughout both spring and winter [13]. Using high-volume filter samples, Spindler et al. (2010) found that the mass concentration and chemical composition of PM10, PM2.5, and PM1 were largely influenced by meteorological parameters [14]. Research focused on different size fractions of PM has also been conducted in Beijing to characterize the severe haze pollution [15,16]. However, most previous studies are based on offline filter samples, which cannot provide high time resolution data and has a drawback due to the positive and negative artifacts.
This study presents hourly measurement data to understand size-dependent characterization of atmospheric particles during winter in Beijing, with two online instruments (NCSA and ACSA) deployed from 13 December 2013 to 7 January 2014. In addition to the mass concentrations of PM1, PM2.5, and PM10, the concentrations of sulfate and nitrate are also presented for the three size fractions. The objectives of our study are: (1) to characterize the PM evolution process, especially for heavy pollution periods; (2) to investigate the relationship between PM1, PM2.5, and PM10 in the Beijing area; and (3) to preliminarily explore the variations of sulfate and nitrate in different size fractions.

2. Experimental Methods

2.1. Sampling Site

Online ambient observation was conducted from 13 December 2013 to 7 January 2014 at the Tsinghua University campus (40°00′17′′N, 116°19′34′′E) in Beijing, which is located about 20 km northwest of the city center and about 1 km north of the Fourth Ring road. The sampling site is situated on the roof of a third-story building, approximately 10 m above ground. No major pollution sources are nearby. All the data are hourly unified and reported at ambient temperature and pressure conditions in Beijing Standard Time.

2.2. Instrumentation

Two online instruments, NCSA and ACSA, used in our study are developed by Kimoto Electric Co., Ltd. (Osaka, Japan). NCSA could measure not only the mass concentrations of PM1 and PM2.5, but also the concentrations of sulfate and nitrate in the two size fractions. ACSA could measure the mass concentrations of PM10 and the concentrations of sulfate and nitrate in PM10. The measurement principles of the two instruments are the same, with the only difference being the measured size range of PM.
The detailed description of the instrument operation has been given by Zheng et al. (2015) [17]. Briefly, mass concentrations of PM1, PM2.5, and PM10 particles are measured based on the β-ray absorption method. The hourly nitrate concentrations in the three size fractions are measured using an ultraviolet spectrophotometric method. Concentrations of sulfate are monitored by the BaSO4-based turbidimetric method with the addition of BaCl2 in the polyvinyl pyrrolidone solution [17,18]. Since ammonium is not directly detected in our study, its concentration in the PM1 size fraction is predicted under the assumption that particles are neutral and ammonium exists as NH4NO3 and (NH4)2SO4 [19,20]. Thus, the predicted ammonium given here should be regarded as an upper limit [17].
Meteorological parameters, such as temperature, relative humidity, wind speed, and wind direction, are observed by an automatic meteorological observation instrument (Milos520, VAISALA Inc., Helsinki, Finland). CO, O3, SO2, and NO2 concentrations are acquired from the Atmospheric Environment Monitoring Network [21,22].

3. Results

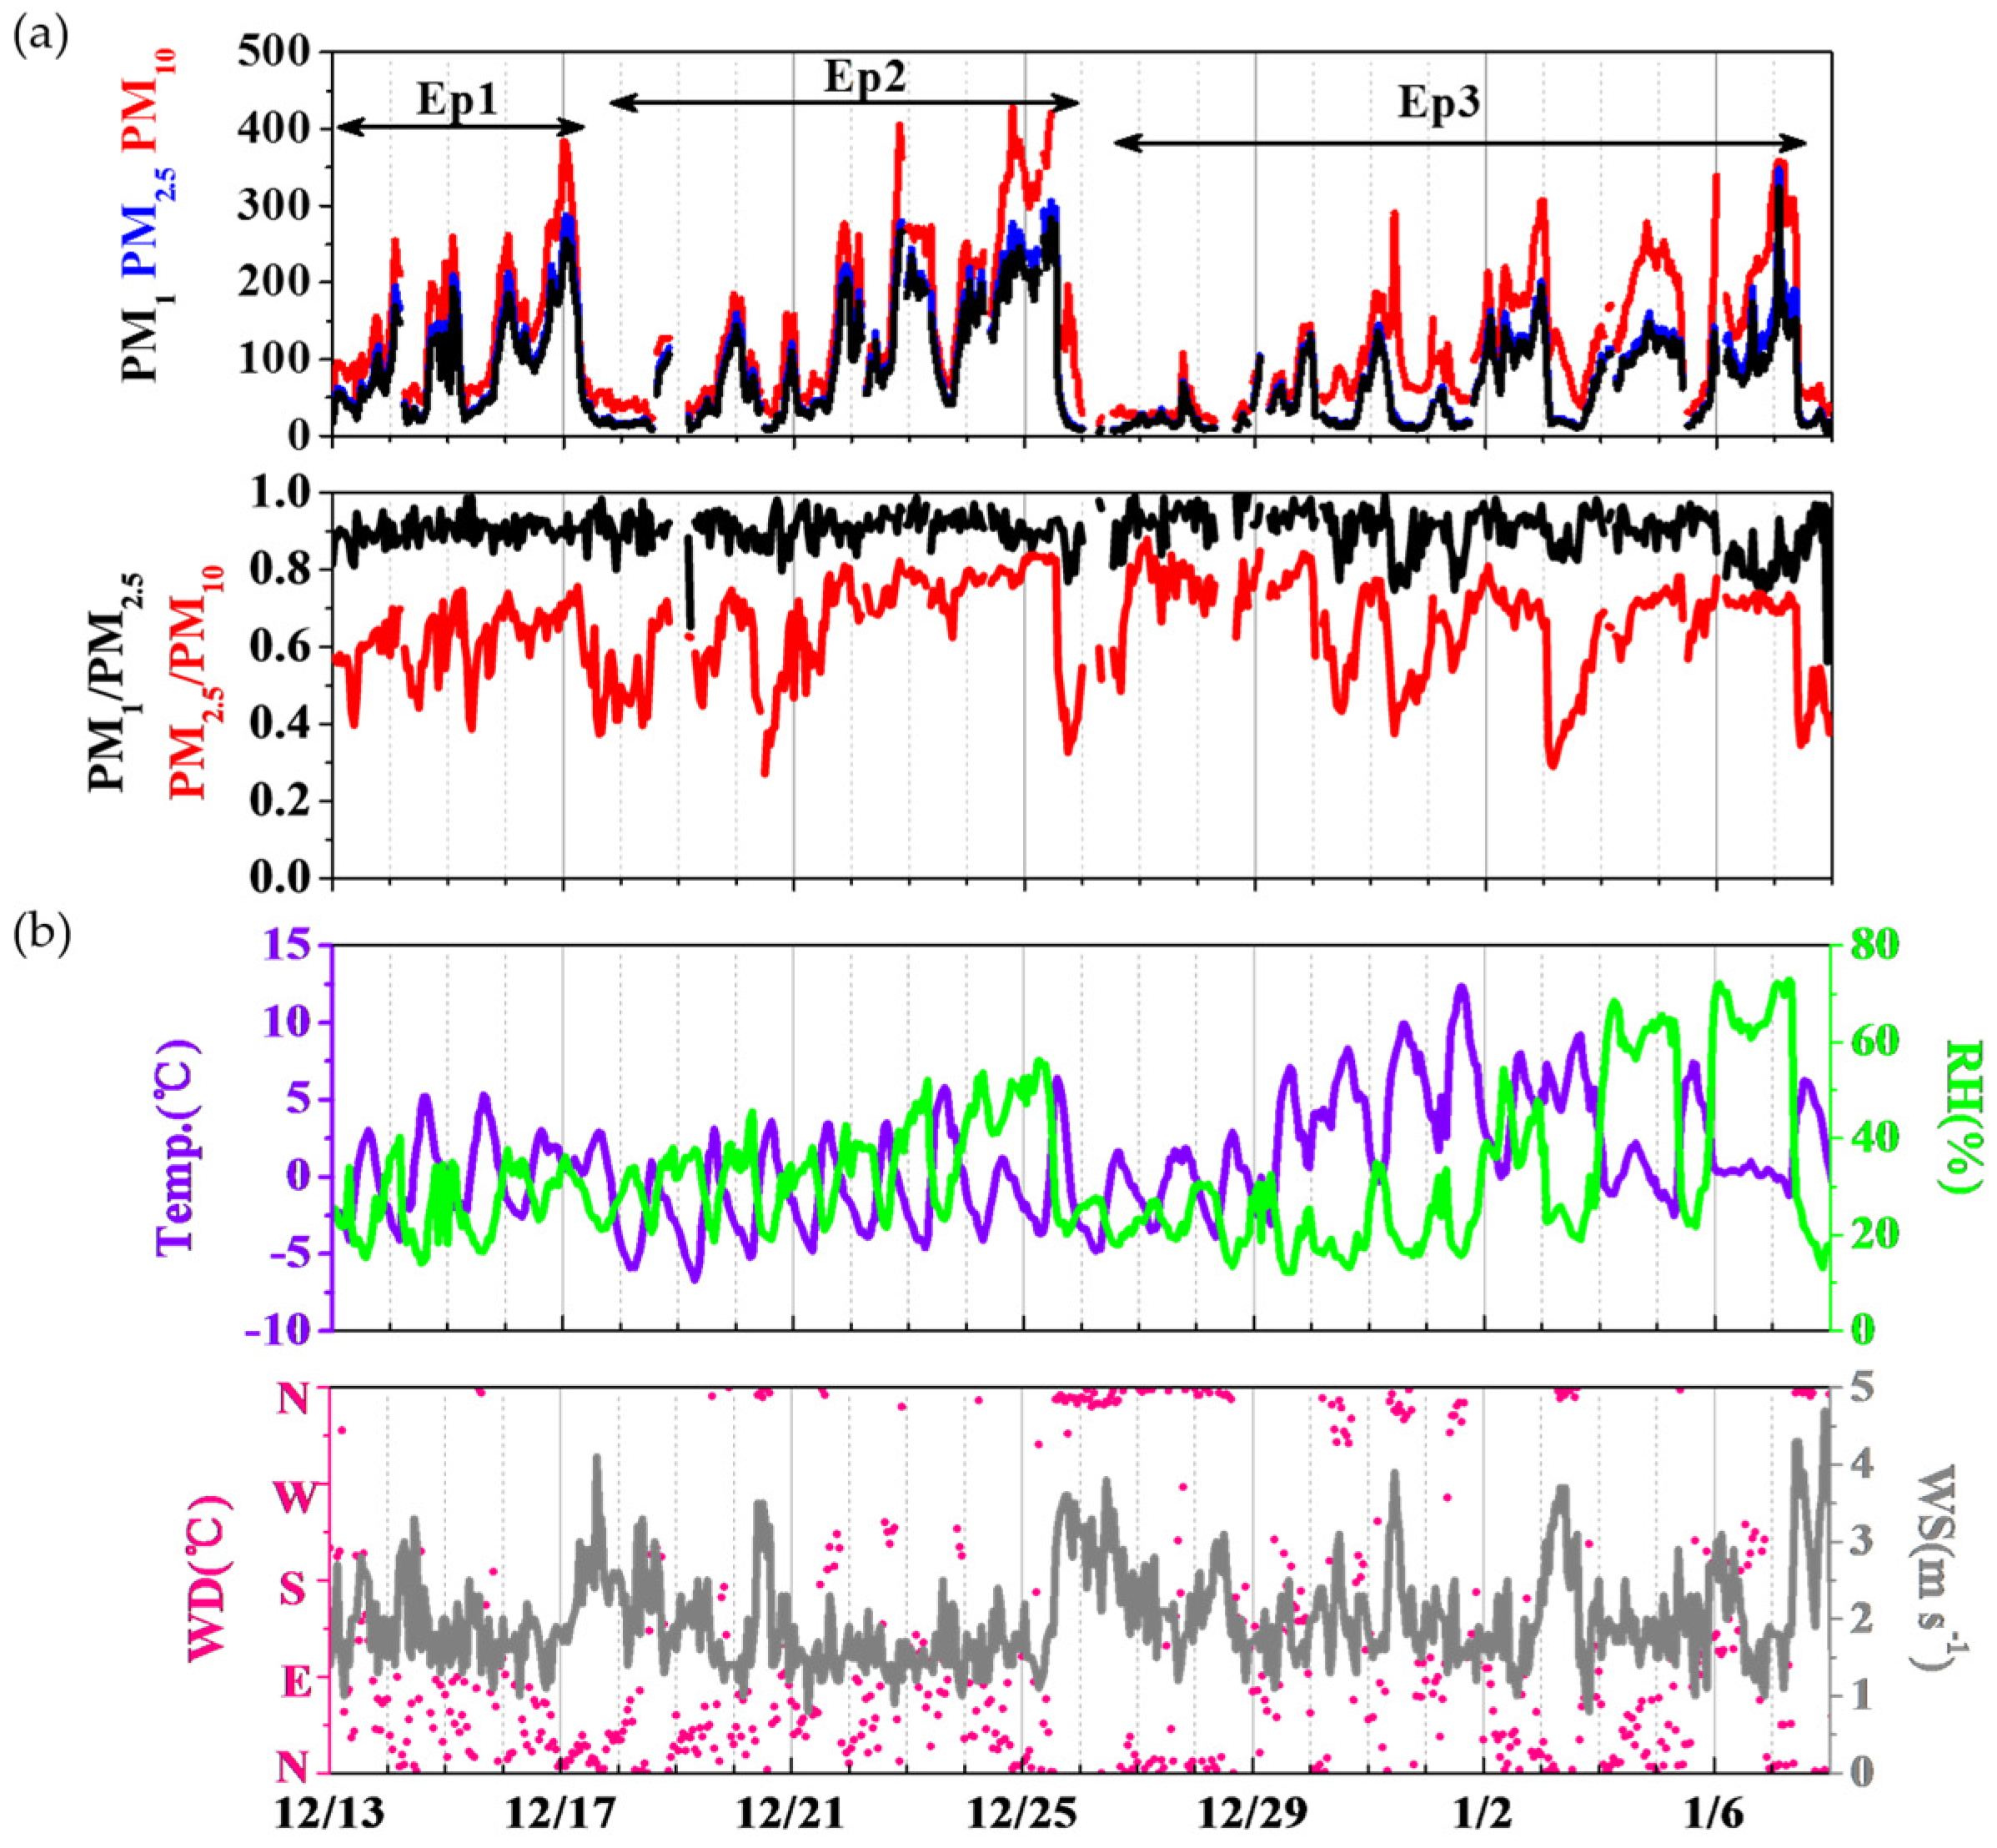
3.1. General Description of the PM1 Evolution

The severe PM pollution lasts almost the whole observation time from 13 December 2013 to 7 January 2014, characterized by frequent and long-lasting pollution episodes (Figure 1). Overall, the PM1 concentration varies from 2.7 μg·m−3 to 323.8 μg·m−3, with an average of 76.2 (±63.8) μg·m−3. According to Sun et al. (2014), the average mass concentration of NR-PM1 is 83 (±80) μg·m−3 during the severe haze of Beijing in January 2013 [23]. Comparatively speaking, the pollution level in our study is only a bit lower than that. In addition, we can tell from Figure 1 that temperature and relative humidity both follow their own diurnal variation. However, high PM concentrations are usually characterized by high RH and lower wind speed.
According to the variation of PM1 concentration, we divide the observation period into three episodes, named as Ep1, Ep2, and Ep3 in Figure 1. These three episodes are characterized with similar pollution evolution, which are described as “sawtooth cycles” by Jia et al. (2008) [24]. Briefly, the sawtooths are asymmetric, with the PM concentrations increasing slowly over a few days but falling to a low level abruptly only in a few hours. It is usual to see the existence of temporary interruptions during the rising process of longer sawtooths. This is due to the weak cold front that precedes a stronger cold front according to Jia et al. (2008) [24]. In our study, Ep1, Ep2, and Ep3 are typical sawtooth cycles. A summary of the average meteorological parameters, mass concentrations of PM species of these three periods is listed in Table 1. As the pollution processes of Ep1 and Ep3 are similar to that of Ep2, we only take Ep2 as an example to detailed explore the evolution characteristics of “sawtooth cycles” here.
During Ep2, PM1 begins with one day of low concentration (10–20 μg·m−3), and then increases nearly linearly over the next 5–6 days. During 24–25 December, PM1 concentration stays high (with a maximum of 283.1 μg·m−3) and fluctuates in a certain range. At the end of 25 December, the concentration plummets to the original baseline over only several hours. Compared with previous studies, more brief and intense interruptions are observed in the rising phase of sawtooth. We explore reasons for this through the back trajectories as shown in Figure 2. The sideways number directly corresponds to the day of month.
On the first several days (17–20 December), the back trajectories to Beijing originating from the north are descending and relatively clean. At the end of 21 December, the flow direction of the last six hours has rotated from northwest to west and is essentially horizontal. Especially on 24 December, the air masses hover over Langfang and Baoding, two heavily polluted cities in Hebei province, and then arrive in Beijing. Finally the trajectory shifts sharply to north on 25 December and the haze abruptly disappears.

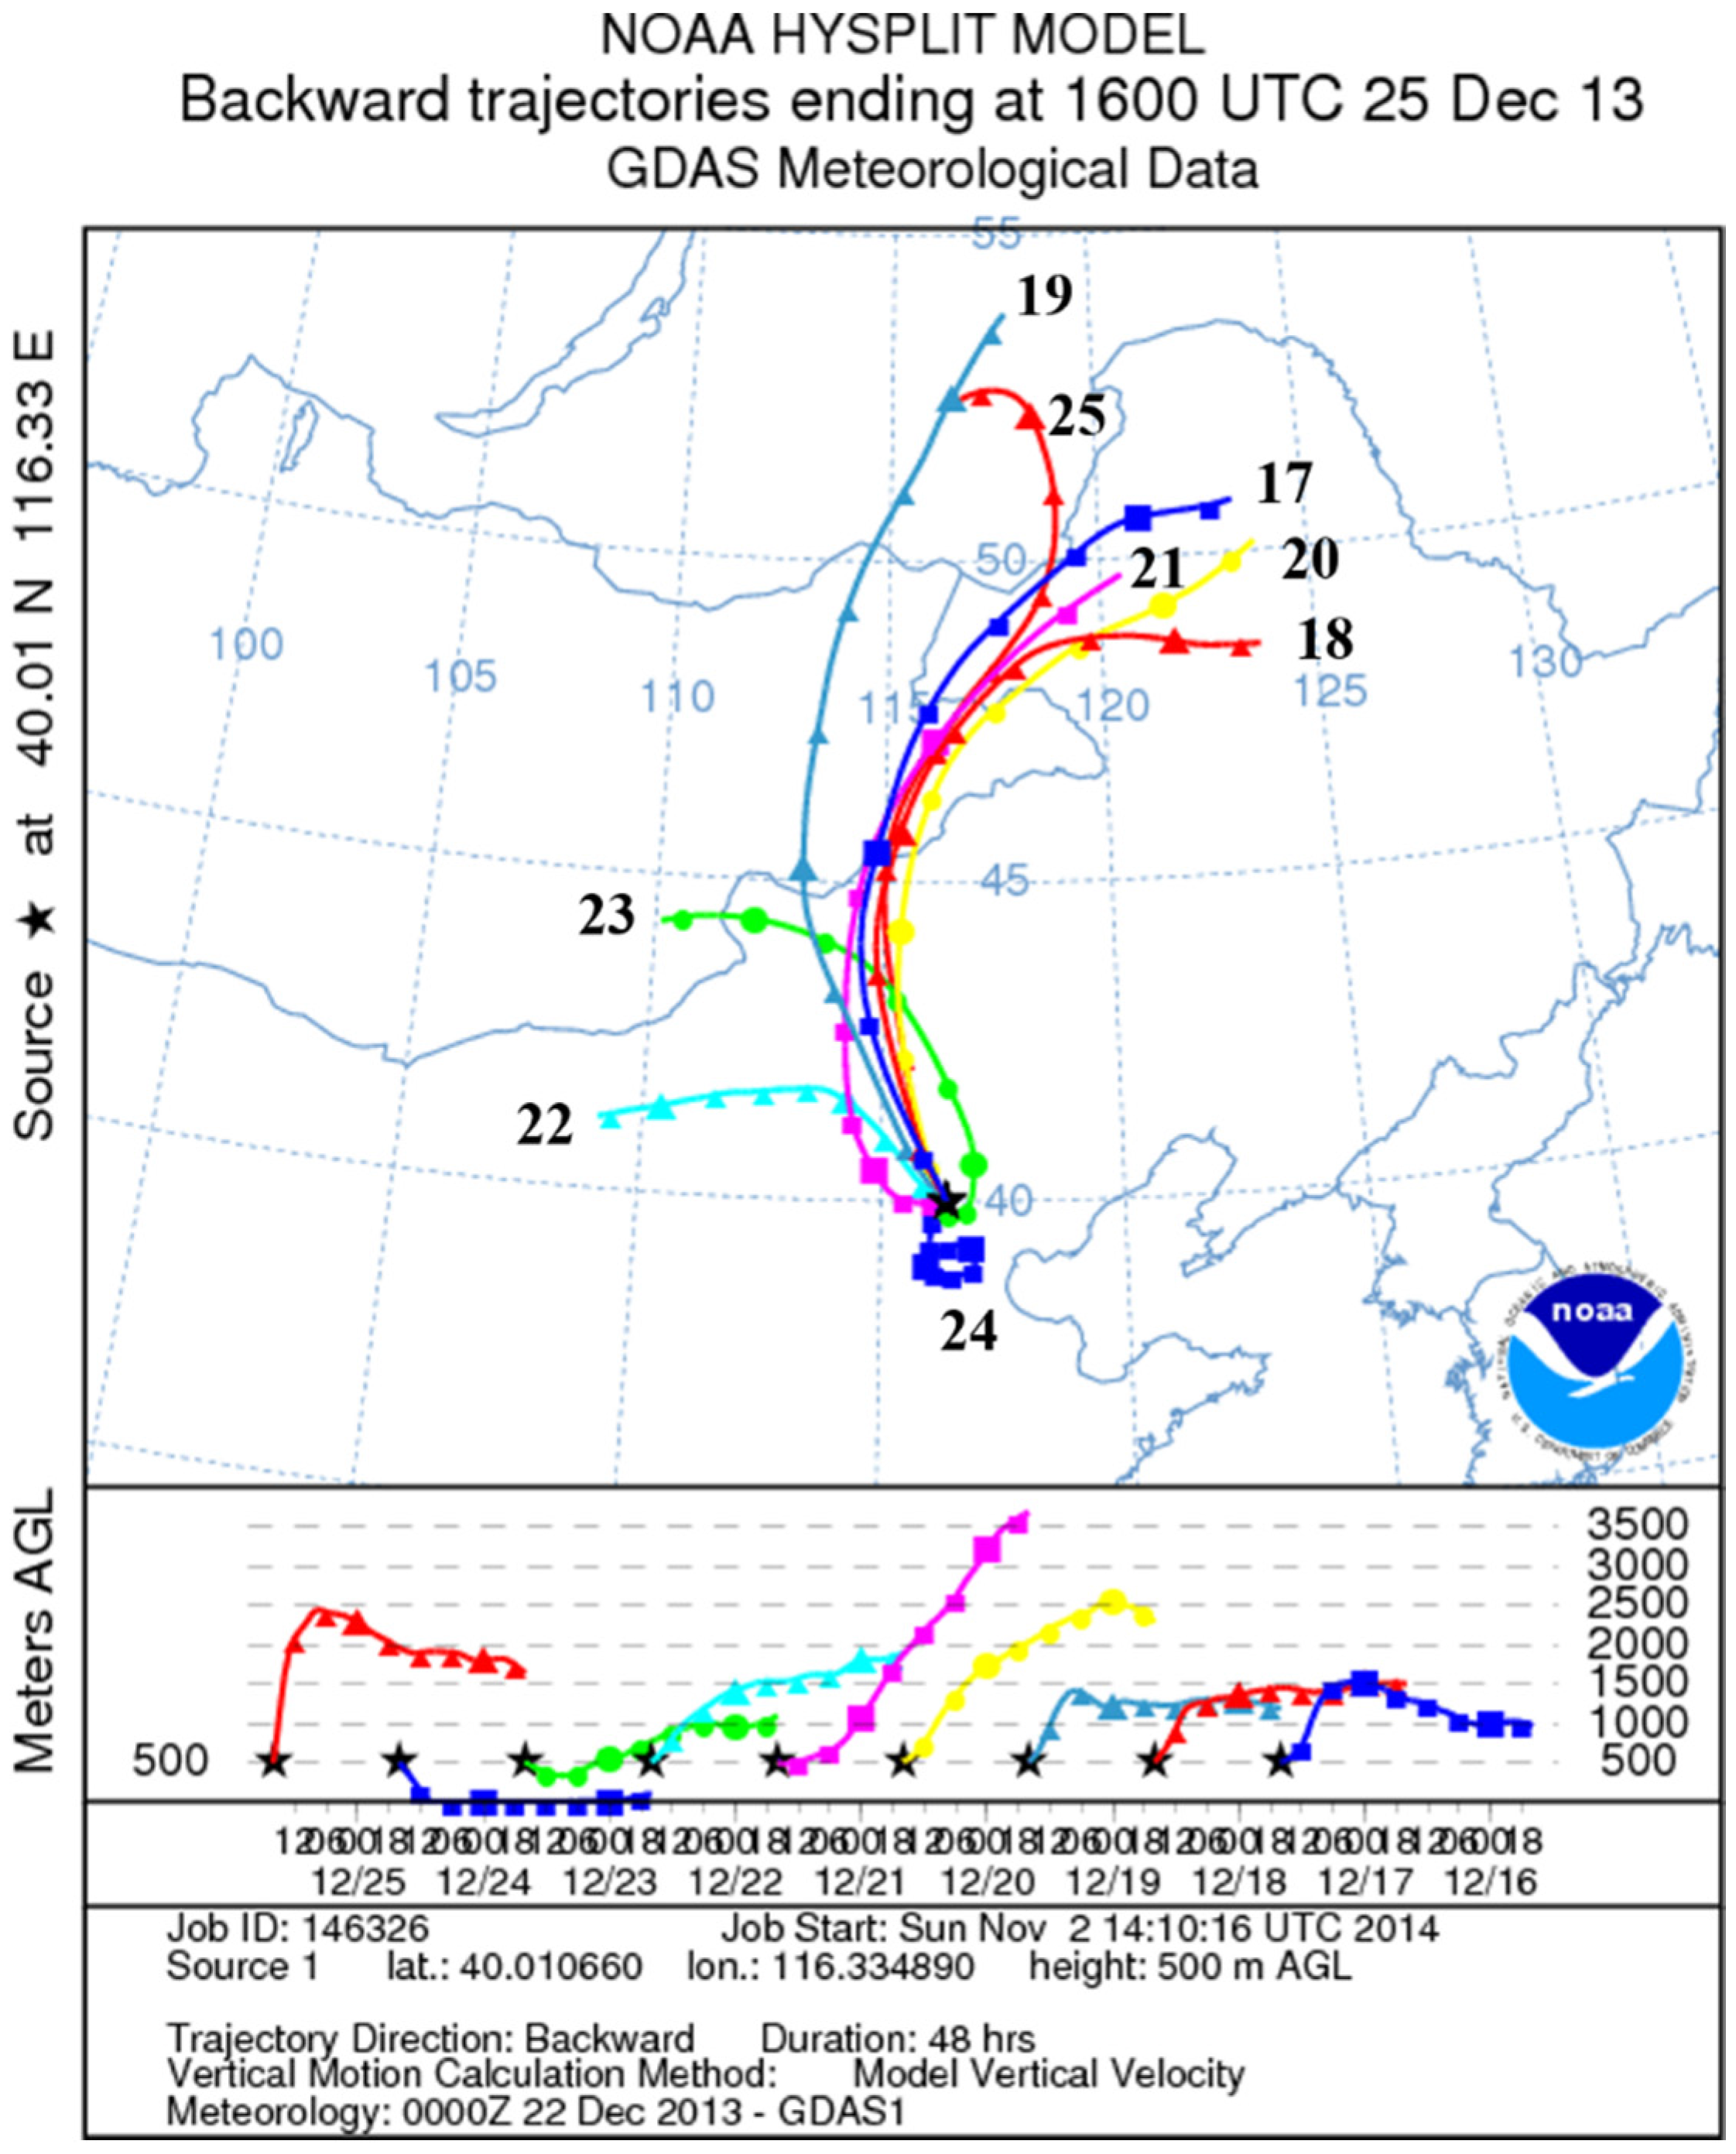
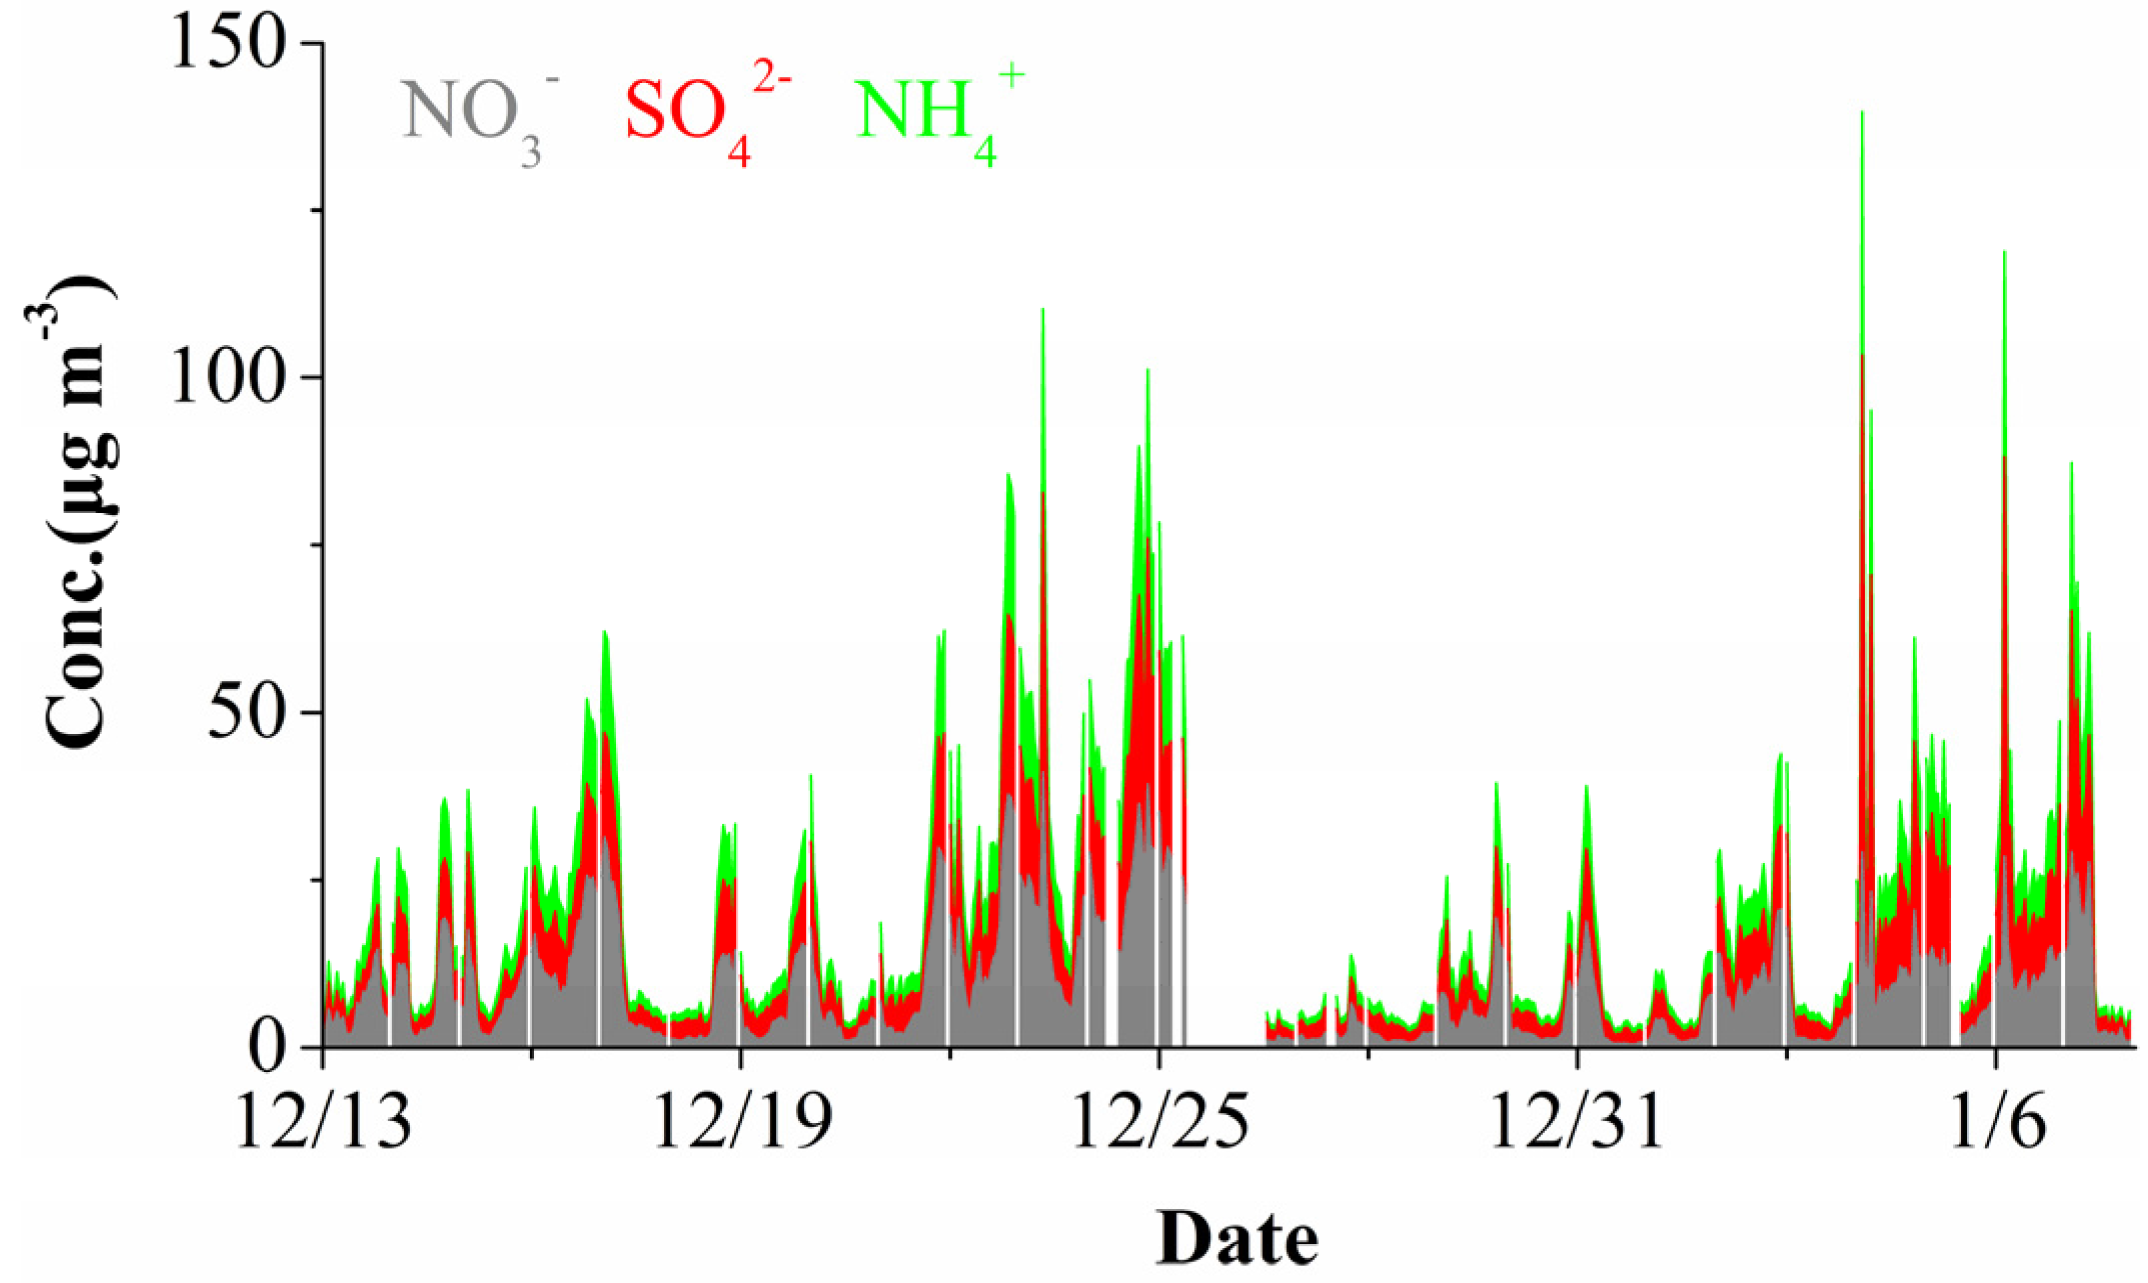
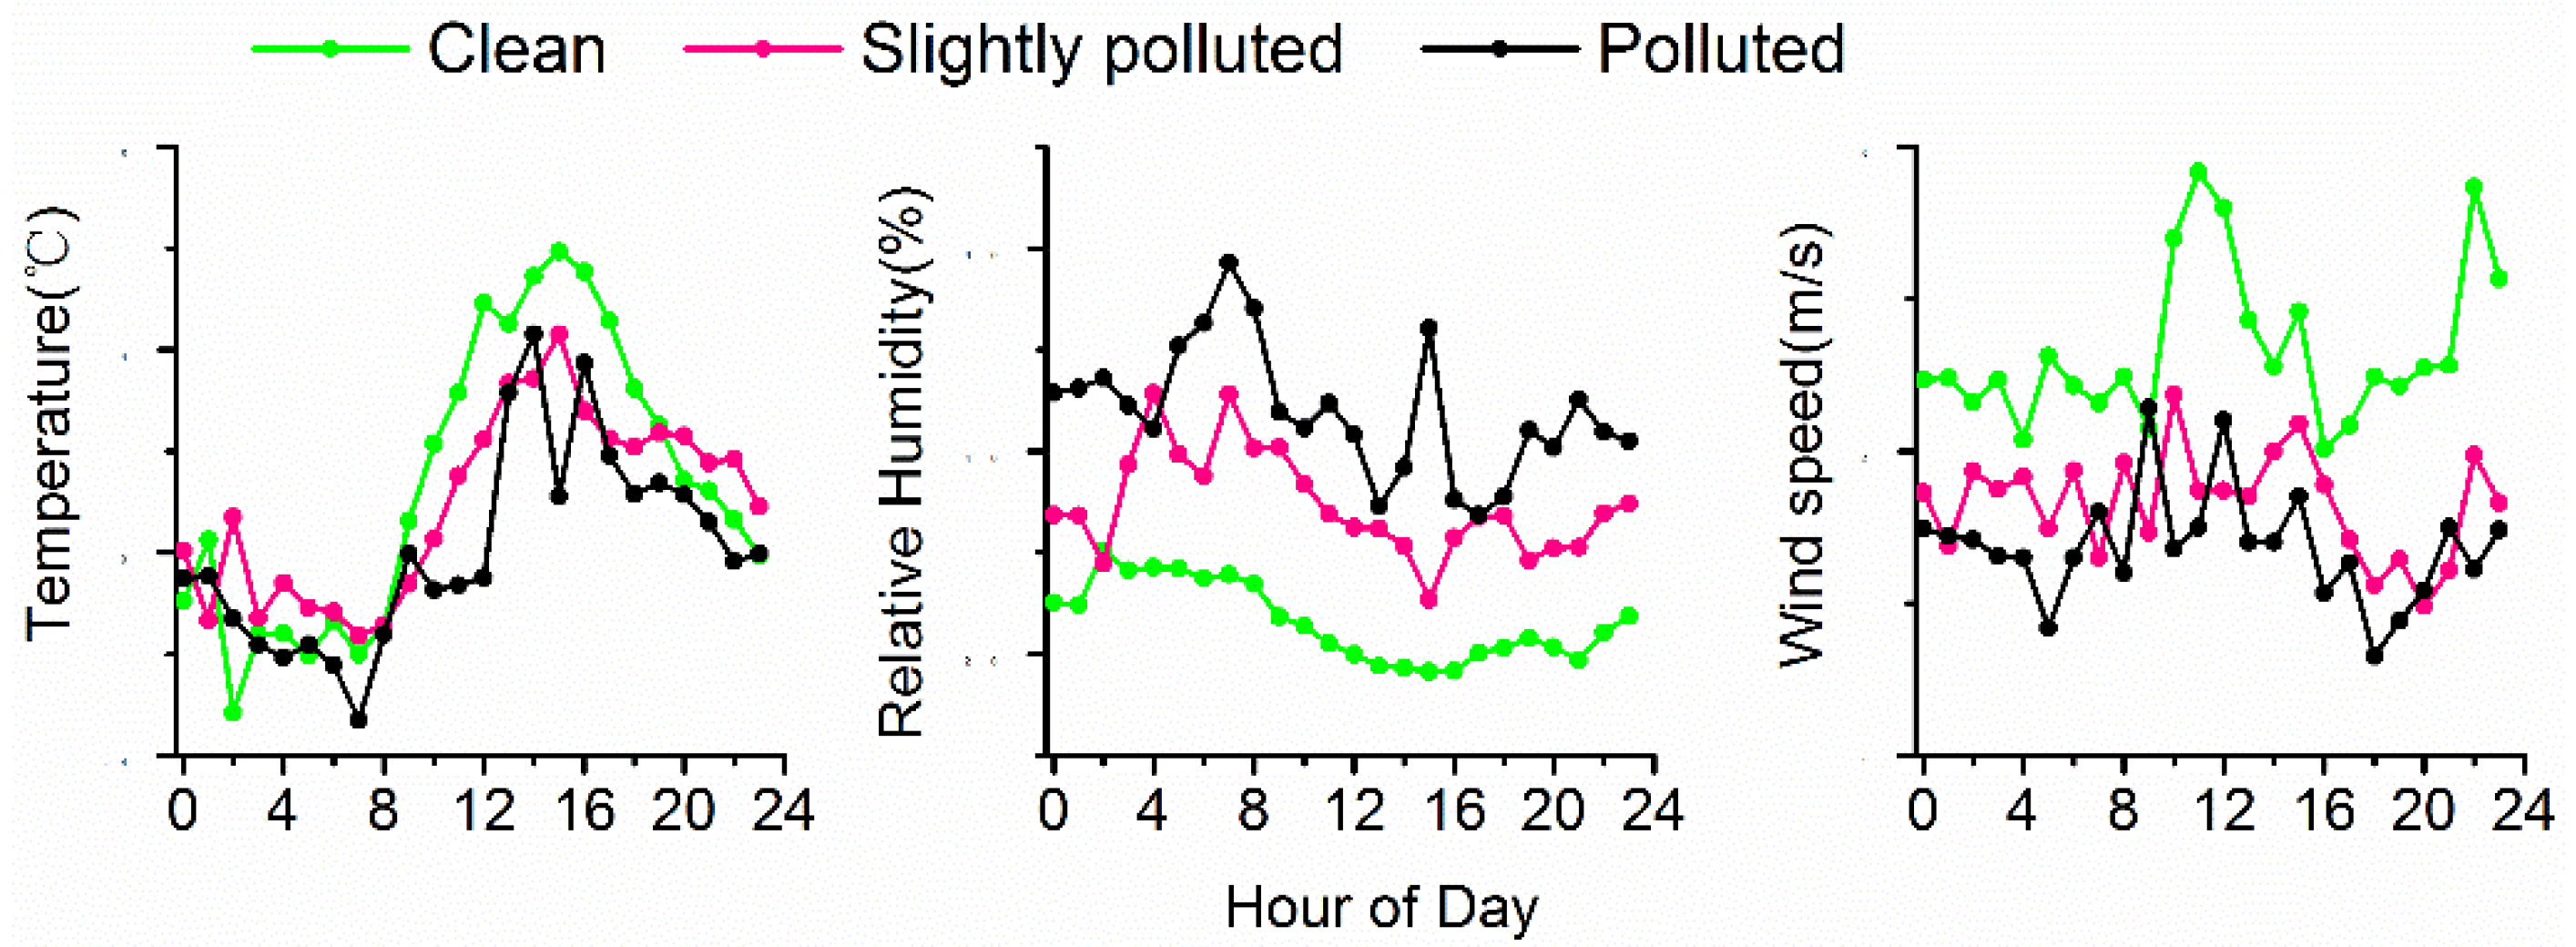
3.2. Chemical Composition of PM1 and the Influence of Meteorology

Figure 3 shows the time series of mass concentrations of sulfate, nitrate, and ammonium in PM1 for the entire study. Generally speaking, all of these species present dynamic variations, which may be affected by meteorological conditions, local and regional emissions, and atmospheric chemical reactions. The average concentrations of sulfate and nitrate are 6.8 and 8.7 μg·m−3, respectively. They separately account for 10.5% and 11.1% of the total PM1 mass. It should be noted that nitrate contributes more to pollution than sulfate. A similar result has also been observed by Sun et al. (2012) during a summer study, when the evaporative loss of nitrate is more serious [25]. The large reduction of sulfate is likely due to the decrease of SO2 emissions, but the mass concentration of nitrate rebounds back in 2011 after the 2008 Olympic Games, due to the increase of NOx in recent years. With the addition of the predicted ammonium, SNA (sulfate, nitrate, and ammonium) makes up 28.8% of PM1.
In urban atmosphere, sulfate and nitrate are considered to be secondary species because they are mainly formed through the oxidation of their gaseous precursors [26]. In this part, we primarily focus on the characterization of sulfate and nitrate and their influence on the PM1 evolution. In order to explore the variation of sulfate and nitrate with PM1 pollution level, we classify the entire study into three categories according to the Air Quality Index [27], where the clean period is defined as the concentration of PM1 ≤ 35 μg·m−3, the slightly polluted period with 35 μg·m−3 < PM1 ≤ 115 μg·m−3, and the polluted period with PM1 > 115 μg·m−3. Since the boundary layer itself could significantly influence the pollution, the concentrations of sulfate and nitrate are normalized by CO to offset the effect of boundary layer. As shown in Figure 4, both SO42−/CO and NO3/CO increase from clean periods to polluted periods, indicating the important role of enhanced chemical production to haze formation. In addition, the increasing trend of NO3/CO ratio is more apparent than that of SO42−/CO, which is further supported by the significant increase of NOR with pollution level. The SOR and NOR here is the oxidation ratio of sulfur (SOR = n SO42−/n SO42− + nSO2) and nitrogen (NOR = n NO3/n NO3 + nNO2), where n refers to the molar concentration. They are often used as indicators of secondary transformation [17,28]. The higher values of SOR and NOR in polluted periods than those in clean periods further demonstrate elevated secondary transformation during haze days.
The potential sources of sulfate and nitrate are also evaluated in our study. Mass ratios of NO3/SO42− are extensively used to assess the relative importance of mobile versus stationary pollution sources of sulfur and nitrogen in the atmosphere [29,30]. For all datasets in our study, Ep1, Ep2, and Ep3, an increasing trend of mass ratios of NO3/SO42− is found from clean periods (0.8) to polluted periods (1.5), indicating the enhanced contribution of vehicle emissions to haze formation. For the entire study, the average mass ratio of NO3/SO42− is 1.28, much higher than that observed in other regions of China [26,30]. In addition, the NO3/SO42− mass ratios monitored in the same sampling site as this study in 2000 and 2002 are 0.58 and 0.78, respectively [31,32]. The significant increase of NO3/SO42− mass ratio in Beijing from 2000 to 2013 reveals that the relative importance of motor vehicles to PM pollution may rise largely during the past years.
Meteorological conditions have a strong impact on pollution level. Compared to clean periods, polluted periods are characterized with lower temperature, higher relative humidity, and lower wind speed (Figure 5). The relatively low temperature and wind speed would favor the accumulation of chemical pollutants. The high relative humidity in polluted episodes would accelerate the formation of sulfate and nitrate through the oxidation of SO2 and NO2 in aqueous phase. This is further proved by the strong correlation of sulfate and nitrate with relative humidity (r = 0.65 and 0.56 respectively).

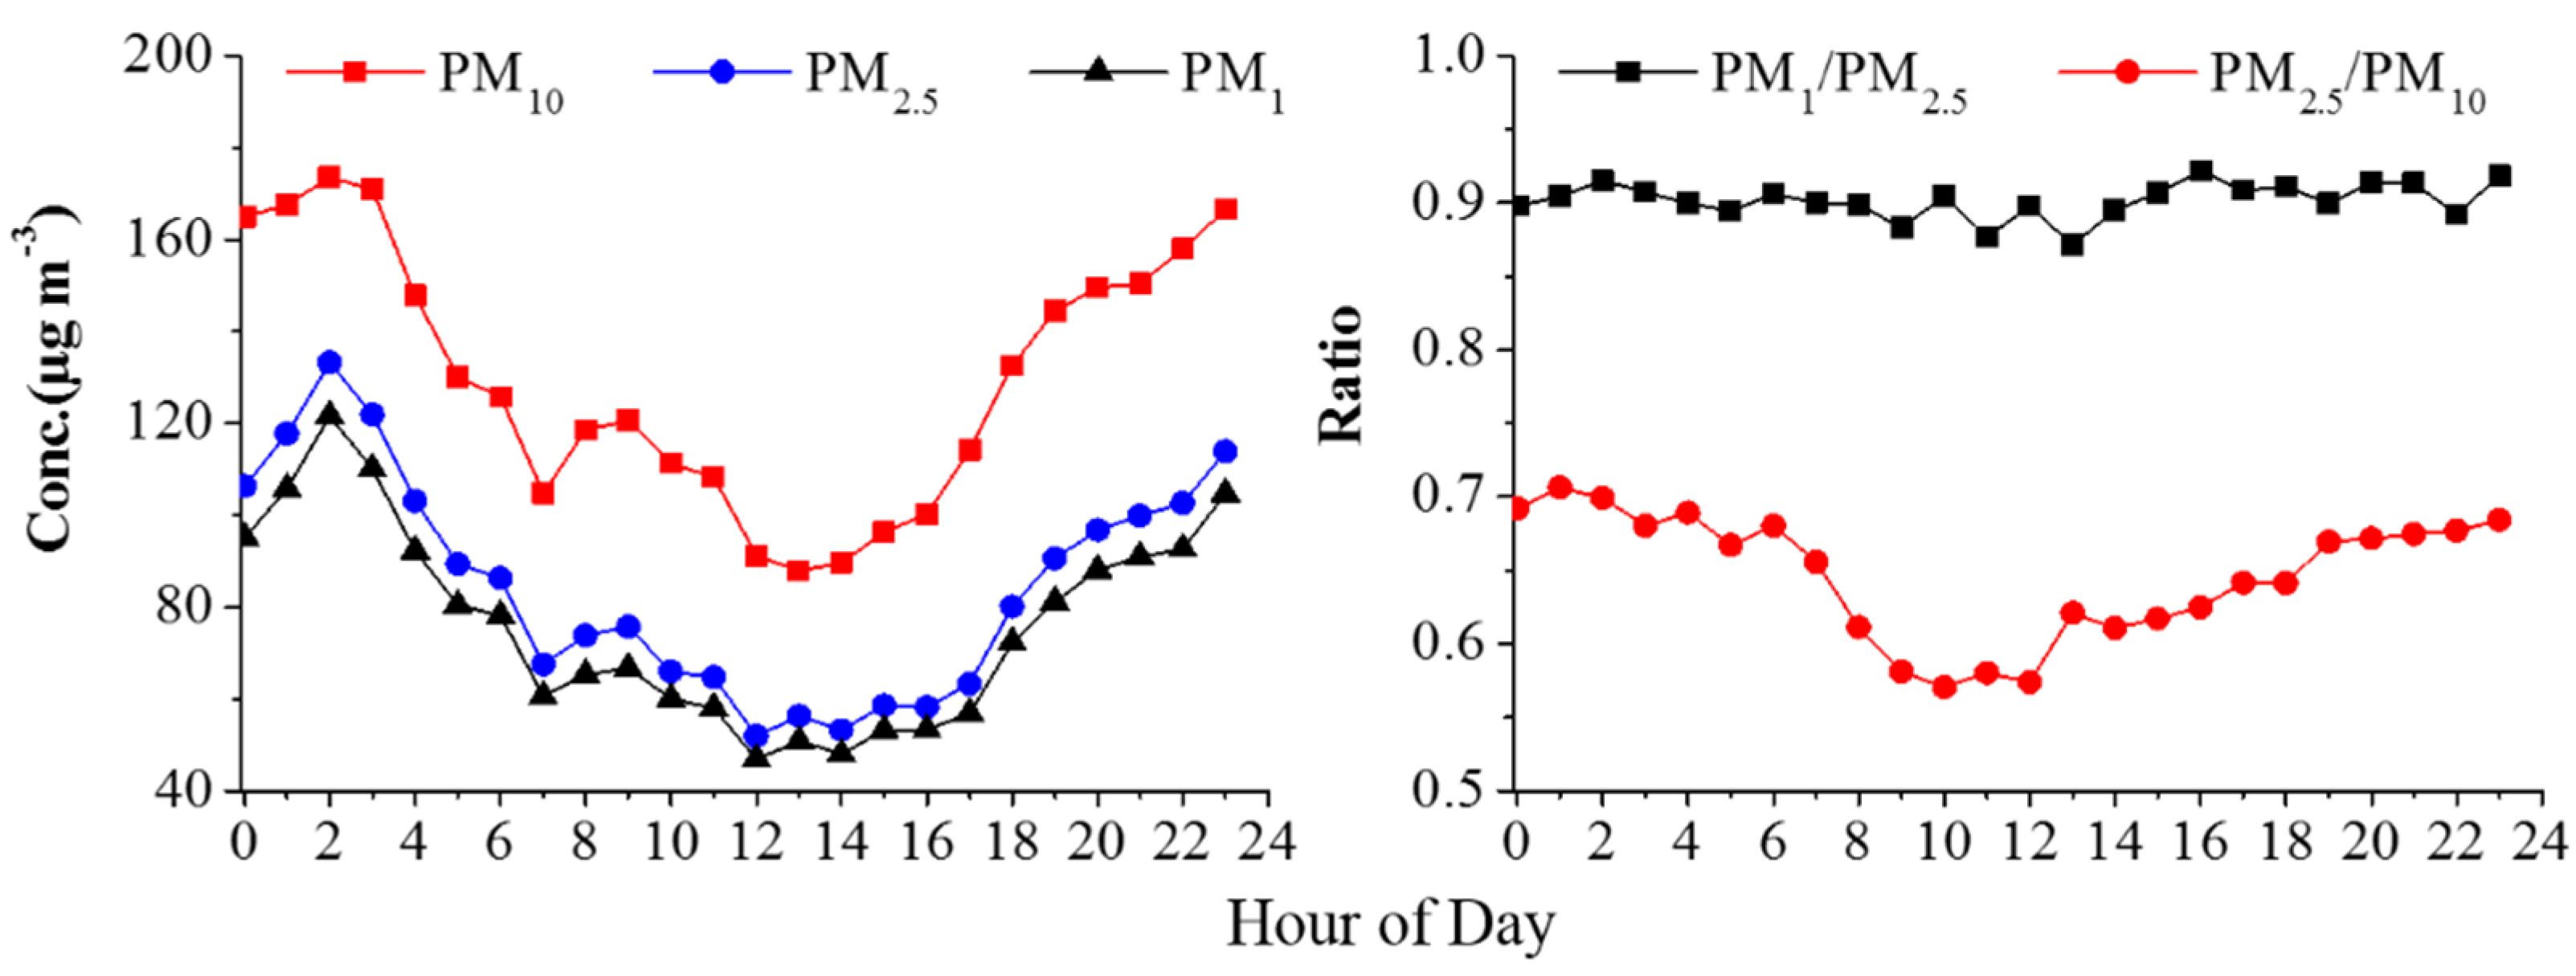
3.3. Relationship of PM1, PM2.5 and PM10

The variation trends of PM2.5, PM10, and the ratio of PM1/PM2.5, PM2.5/PM10 are also shown in Figure 1. PM2.5 constitutes on average 65% of PM10, similar to that observed during the severe haze in January 2013 [17]. The PM2.5/PM10 ratio ranges from 0.27 to 0.88, and depends greatly on PM concentrations. When PM pollution becomes worse, PM2.5/PM10 ratio increases apparently. This indicates the important contribution of PM2.5 to the haze. However, the ratio of PM1/PM2.5 is not the case.
The PM1 concentration follows the PM2.5 concentration fairly well throughout the entire study period. On average, the ratio of PM1/PM2.5 is 0.90 ± 0.05 in our study. It reveals that fine particle mass variability is heavily controlled by submicron particle sources and processes. Overall, the variation of the ratio does not show an apparent correlation with the PM mass concentrations, but lower ratio values (generally <0.80) appear only when the pollution level is usually low. Our result of PM1/PM2.5 ratio is slightly higher compared with Sun et al. (2013), in which the concentrations of NR-PM1 and PM2.5 are measured separately by ACSM and TEOM [33]. With the vaporizer temperature of ~600 °C, ACSM does not detect refractory materials, e.g., mineral dust and black carbon. Another potential reason is that previous PM2.5 concentrations and reconstructed PM1 values are based on different instruments. This may introduce greater uncertainties. In our study, both PM1 and PM2.5 are measured by NCSA based on the β-ray absorption method.
The hourly variation trends of PM1 and PM2.5 remain almost the same. This is consistent with the diurnal profile of PM1/PM2.5. On the whole, the PM concentrations present a pronounced diurnal cycle with high concentrations occurring at night (Figure 6). The highest concentration occurs at 2:00. This may be the synergic consequence of lower PBL during nighttime and enhanced aqueous phase reactions due to higher RH. Then PM pollution decreases gradually during daytime and reaches its minimum value between 12:00 and 14:00.
The ratio of PM1/PM2.5 does not show obvious hourly variations during the entire study. The values remain high (~0.90) the whole day. However, the ratio of PM2.5/PM10 shows apparent low values in the morning (8:00~12:00). This may be a consequence of the re-suspension of coarse road dust and construction fugitive dust. Enhanced human activities would contribute lots of coarse particles (aerodynamic diameter from 2.5 μm to 10 μm) during daytime. However, after noon, intense photochemical reactions would promote the secondary formation of fine particles.

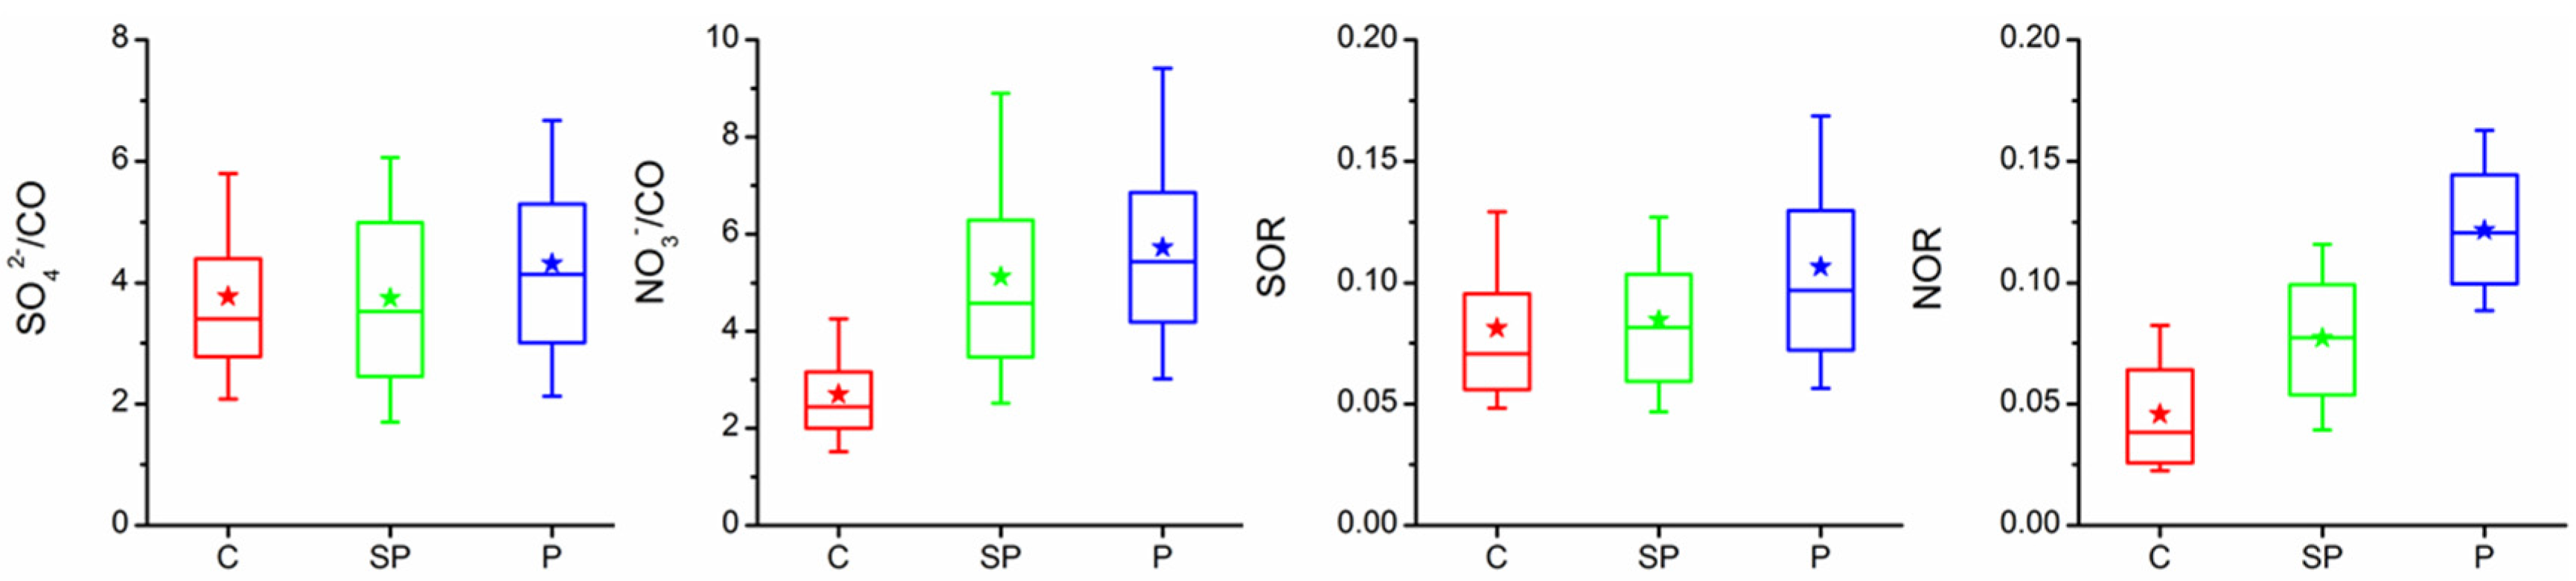
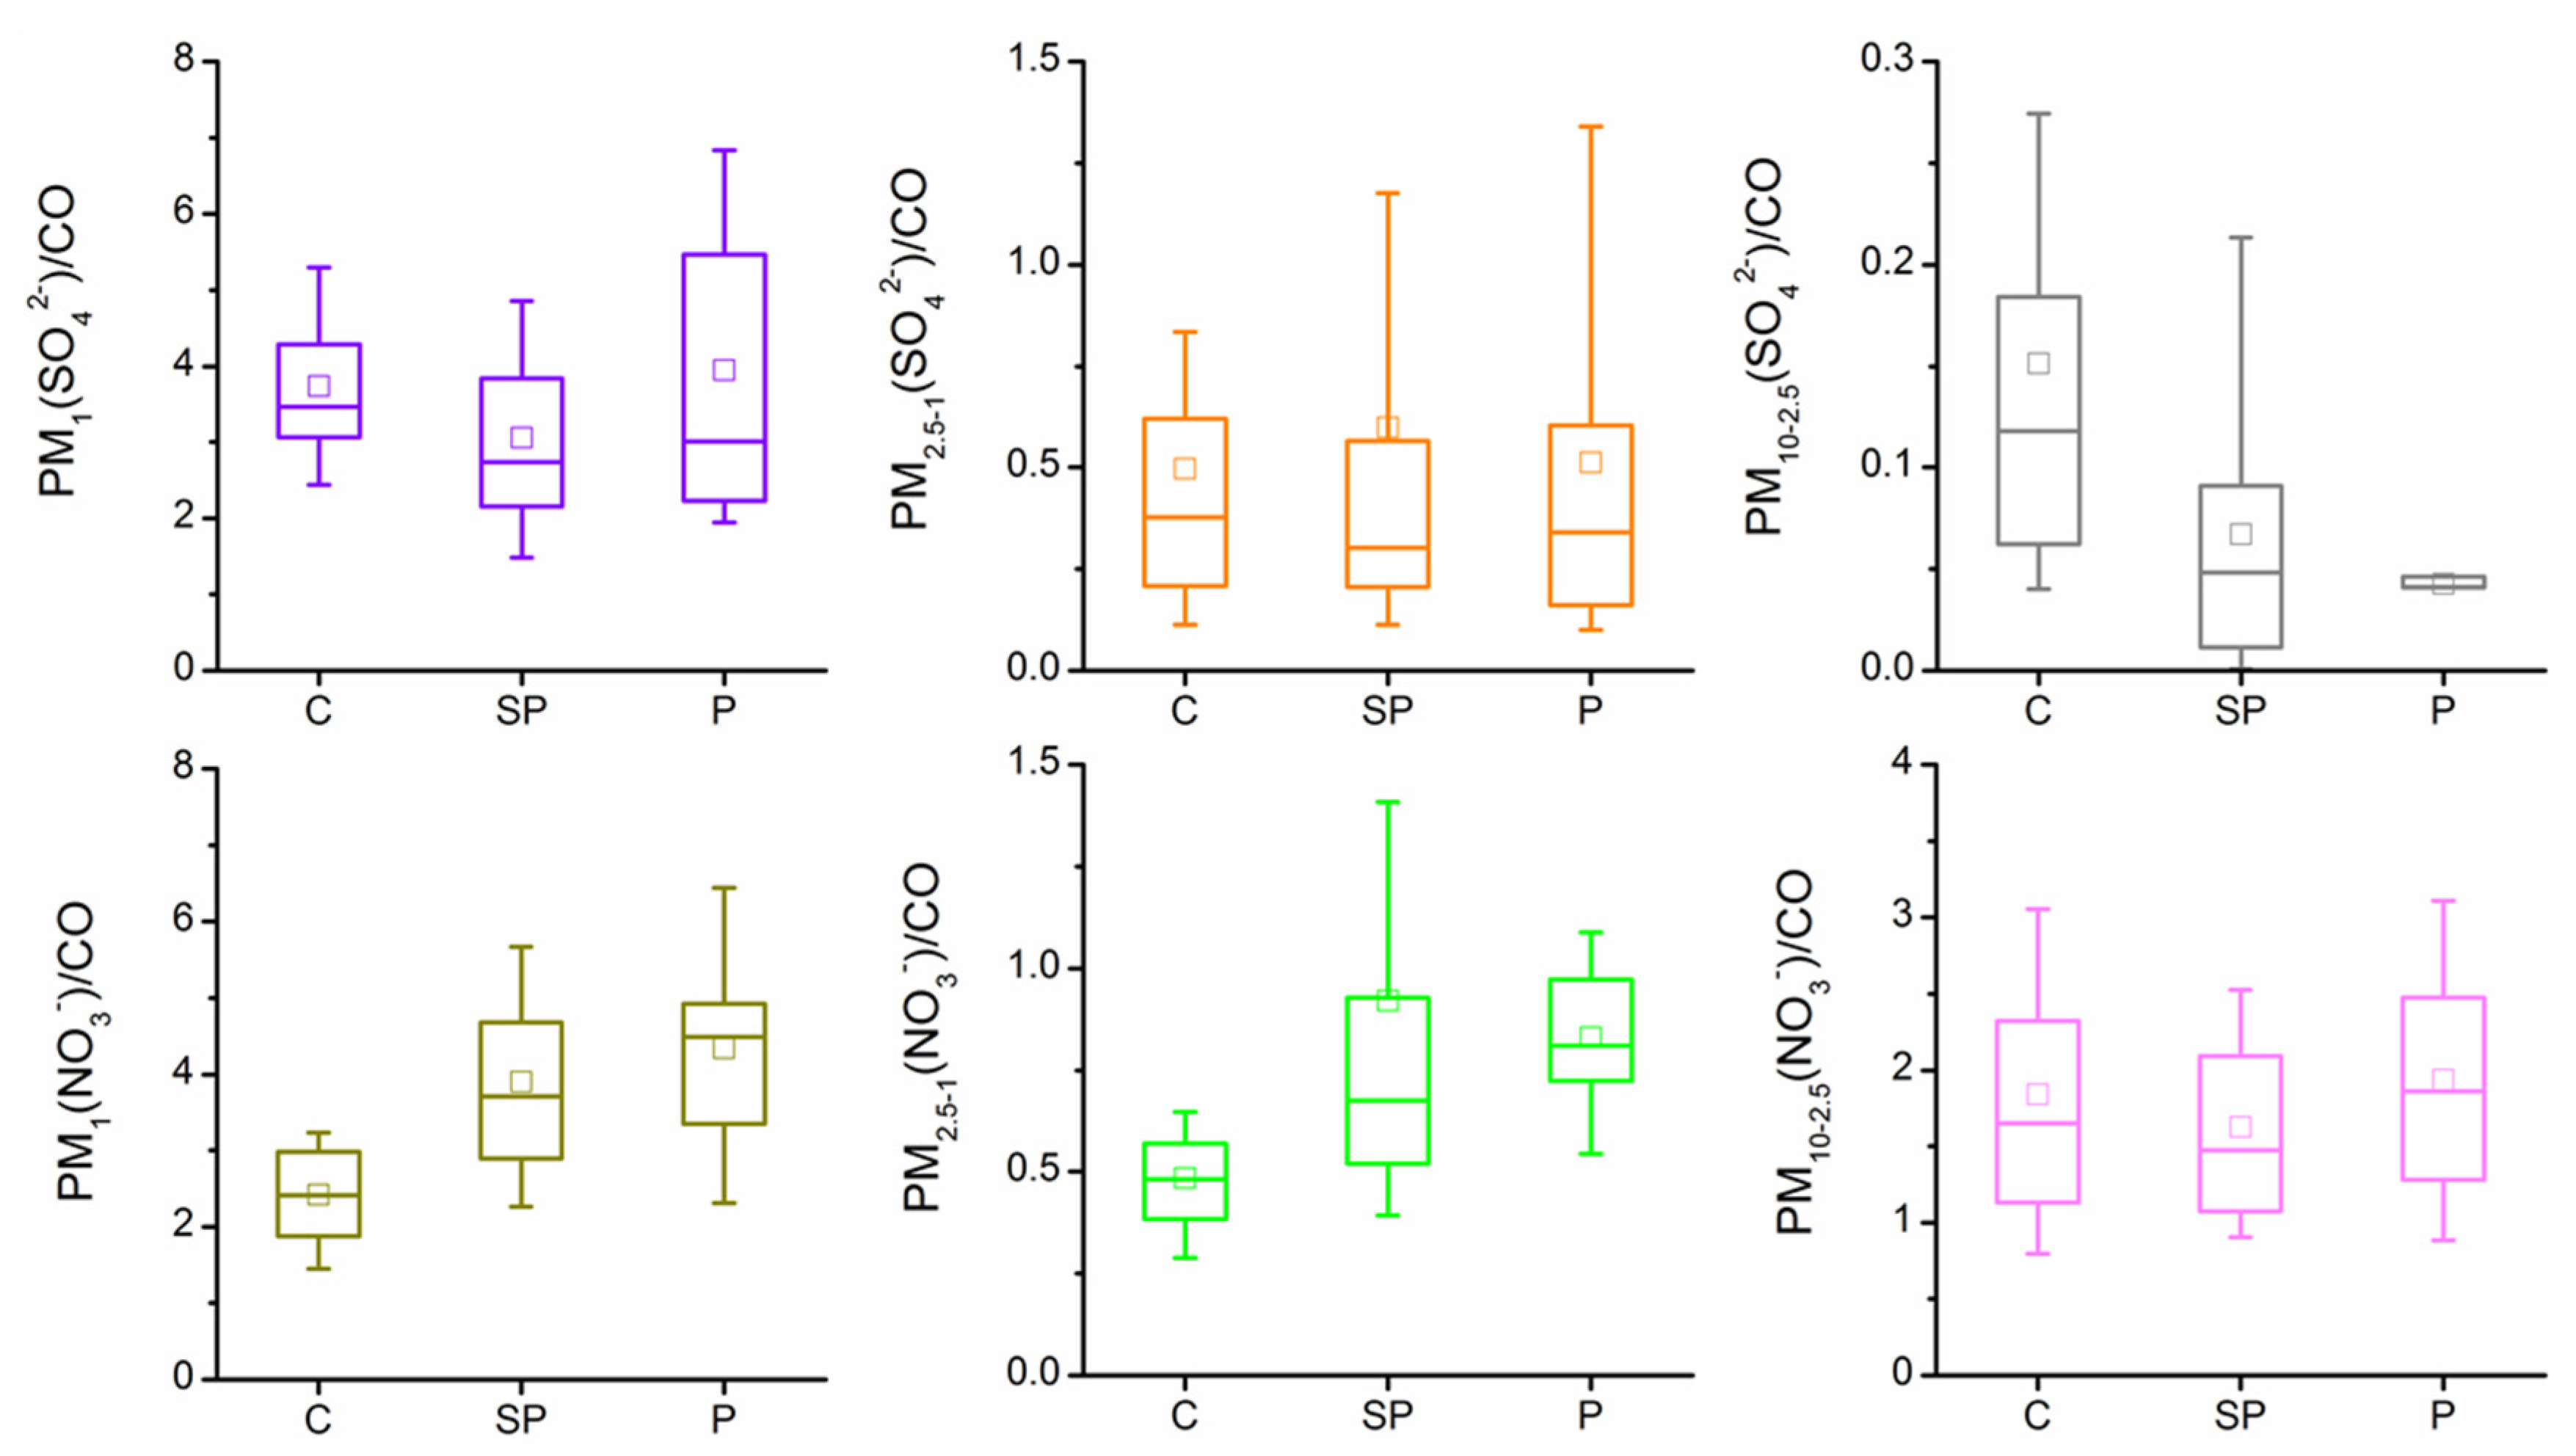
3.4. Mass-Size Distribution of Sulfate and Nitrate

Mass concentrations of sulfate and nitrate in PM2.5–1 and PM10–2.5 fractions are also measured in our study. Size-dependent chemical properties are the major determining factors in affecting the atmospheric behaviors of aerosols [34]. In addition, the contributions of anthropogenic and natural sources are quite different in different size ranges [35]. Thus, it is important to compare aerosol compositions in different size range. In this section, the mass-size distribution of sulfate and nitrate in PM1, PM2.5–1, and PM10–2.5 is discussed.
On average, the concentrations of sulfate in PM1, PM2.5–1, and PM10–2.5 contribute 80.7%, 17.4%, and 1.8% to total sulfate concentrations in PM10, respectively. Our result is consistent with previous studies focused on the size-distribution of sulfate in particles, which show that the peak of sulfate appears in 0.5~1 μm size fraction [16]. With the purpose of further identifying the relative importance of these three size fractions to sulfate formation during haze pollution, the variation of sulfate concentrations in PM1, PM2.5–1 and PM10–2.5 with pollution level is explored. The whole study period is divided into three periods (clean, slightly polluted, and polluted) as Section 3.2 according to PM1 concentration. Again, we use the ratio of sulfate concentration to CO to counteract the boundary layer effect. As presented in Figure 7, the ratio of sulfate in PM1 to CO increases slightly from clean to polluted period, indicating the elevated formation of sulfate in PM1 during haze days. For the PM2.5–1 size fraction, the mass ratio of sulfate to CO remains almost stable. Although the mass concentration of sulfate in PM10–2.5 is so minor to be ignored, its ratio to CO decreases largely with increased pollution.
Similar to the mass-size distribution of sulfate, total nitrate concentration in PM10 is also dominated by that in PM1 size fraction, with an average contribution of 60.3%. However, what is different is that the contribution of nitrate in PM10–2.5 size range is much higher compared to that of sulfate. Previous researches also demonstrate that in addition to the dominated distribution in 0.56~1 μm size fraction, nitrate also shows a high peak in coarse mode [15]. As the pollution increases, the ratio of nitrate concentration to CO in both PM1 and PM2.5–1 size fraction rises significantly. Therefore, the enhanced nitrate in PM1 and PM2.5–1 size fraction prompts the formation of haze pollution. However, the mass ratio of nitrate to CO in PM10–2.5 remains almost stable during the whole period.

4. Conclusions

The analysis of size-dependent characterization of ambient particles in Beijing from 13 December 2013 to 7 January 2014 was presented in this work, based on two real-time instruments, NCSA and ACSA. The severe pollution period in this study could be divided into three similar episodes, all characterized with “sawtooth cycles” evolution. The PM concentration increases slowly over a few days and then diminishes abruptly, usually in only a few hours. Reasons are explored through the back trajectory analysis, revealing the significant influence of regional transport on haze formation. Sulfate and nitrate are two important secondary species during the haze formation, contributing 10.5% and 11.1% to total PM1 mass, respectively. According to the variation of PM1 pollution level, the whole study period is classified into three types: clean, slightly polluted and polluted. The oxidation ratios of sulfur and nitrogen both show increasing trends from clean to polluted periods, demonstrating the elevated formation of secondary species. The PM2.5/PM10 ratio depends greatly on PM concentrations. When PM pollution becomes worse, this ratio increases apparently, indicating the important contribution of PM2.5 to the haze. However, the ratio of PM1/PM2.5 remains relatively stable, with an average of 0.90. As revealed in our study, both sulfate and nitrate are mainly distributed in PM1 size fraction.
Our findings indicate that submicron particles contribute significantly to the haze, and more studies need to be carried out to explore the size-dependent chemical characterization of ambient particles.

Acknowledgments

This work was supported by the National Science and Technology Support Program of China (2014BAC22B01), by National Natural Science Foundation of China (21107061, 21190054), by the Fund of Japan International Cooperation Agency (JICA). Authors also thank to Energy Saving and Pollution control Association of East Asia (ESPA), for their helps to the management of the field observation program.

Author Contributions

Haiyan Li analyzed the data and wrote the article. Kebin He and Fengkui Duan designed the study and edited the text body. Yongliang Ma helped with the data analysis. Takashi Kimoto and Tao Huang assisted with the field measurements and instrumentation maintenance.

Conflicts of Interest

The authors declare no conflict of interest.

References

  1. Schwartz, J.; Dockery, D.W.; Neas, L.M. Is daily mortality associated specifically with fine particles? J. Air Waste Manag. Assoc. 1996, 46, 927–939. [Google Scholar] [CrossRef] [PubMed]
  2. Wilson, W.E.; Suh, H.H. Fine particles and coarse particles: Concentration relationships relevant to epidemiologic studies. J. Air Waste Manag. Assoc. 1997, 47, 1238–1249. [Google Scholar] [CrossRef] [PubMed]
  3. Pope, C.A., III. Review: Epidemiological basis for particulate air pollution health standards. Aerosol Sci. Technol. 2000, 32, 4–14. [Google Scholar] [CrossRef]
  4. Michaels, R.A.; Kleinman, M.T. Incidence and apparent health significance of brief airborne particle excursions. Aerosol Sci. Technol. 2000, 32, 93–105. [Google Scholar] [CrossRef]
  5. Dockery, D.W. Epidemiologic evidence of cardiovascular effects of particulate air pollution. Environ. Health Perspect. 2001, 109, 483–486. [Google Scholar] [CrossRef] [PubMed]
  6. Schwartz, J.; Laden, F.; Zanobetti, A. The concentration-response relation between PM2.5 and daily deaths. Environ. Health Perspect. 2002, 110, 1025–1029. [Google Scholar] [CrossRef] [PubMed]
  7. Seinfeld, J.H.; Pandis, S.N. Atmospheric Chemistry and Physics: From Air Pollution to Climate Change; John Wiley & Sons: Hoboken, NJ, USA, 2012. [Google Scholar]
  8. Peplow, M. Beijing smog contains witches’ brew of microbes. Nature 2014. [Google Scholar] [CrossRef]
  9. Lestari, P.; Oskouie, A.K.; Noll, K.E. Size distribution and dry deposition of particulate mass, sulfate and nitrate in an urban area. Atmos. Environ. 2003, 37, 2507–2516. [Google Scholar] [CrossRef]
  10. Gong, Z.H.; Lan, Z.J.; Xue, L.; Zeng, L.W.; He, L.Y.; Huang, X.F. Characterization of submicron aerosols in the urban outflow of the central Pearl River Delta region of China. Front. Environ. Sci. Eng. 2012, 6, 725–733. [Google Scholar] [CrossRef]
  11. Wang, X.F.; Wang, W.X.; Xue, L.K.; Gao, X.M.; Nie, W.; Yu, Y.C.; Zhou, Y.; Yang, L.X.; Zhang, Q.Z.; Wang, T. Size-resolved aerosol ionic composition and secondary formation at Mount Heng in South Central China. Front. Environ. Sci. Eng. 2013, 7, 815–826. [Google Scholar] [CrossRef]
  12. Ariola, V.; D’Alessandro, A.; Lucarelli, F.; Marcazzan, G.; Mazzei, F.; Nava, S.; Garcia-Orellana, I.; Prati, P.; Valli, G.; Vecchi, R.; et al. Elemental characterization of PM10, PM2.5 and PM1 in the town of Genoa (Italy). Chemosphere 2006, 62, 226–232. [Google Scholar] [CrossRef] [PubMed]
  13. Vallius, M.J.; Ruuskanen, J.; Mirme, A.; Pekkanen, J. Concentrations and estimated soot content of PM1, PM2.5, and PM10 in a subarctic urban atmosphere. Environ. Sci. Technol. 2000, 34, 1919–1925. [Google Scholar] [CrossRef]
  14. Spindler, G.; Bruggemann, E.; Gnauk, T.; Gruner, A.; Muller, K.; Herrmann, H. A four-year size-segregated characterization study of particles PM10, PM2.5 and PM1 depending on air mass origin at Melpitz. Atmos. Environ. 2010, 44, 164–173. [Google Scholar] [CrossRef]
  15. Guo, S.; Hu, M.; Wang, Z.B.; Slanina, J.; Zhao, Y.L. Size-resolved aerosol water-soluble ionic compositions in the summer of Beijing: Implication of regional secondary formation. Atmos. Chem. Phys. 2010, 10, 947–959. [Google Scholar] [CrossRef]
  16. Song, S.; Wu, Y.; Jiang, J.; Yang, L.; Cheng, Y.; Hao, J. Chemical characteristics of size-resolved PM2.5 at a roadside environment in Beijing, China. Environ. Pollut. 2012, 161, 215–221. [Google Scholar] [CrossRef] [PubMed]
  17. Zheng, G.J.; Duan, F.K.; Su, H.; Ma, Y.L.; Cheng, Y.; Zheng, B.; Zhang, Q.; Huang, T.; Kimoto, T.; Chang, D.; et al. Exploring the severe winter haze in Beijing: The impact of synoptic weather, regional transport and heterogeneous reactions. Atmos. Chem. Phys. 2015, 15, 2969–2983. [Google Scholar] [CrossRef]
  18. Kimoto, H.; Ueda, A.; Tsujimoto, K.; Mitani, Y.; Toyazaki, Y.; Kimoto, T. Development of a Continuous Dichotomous Aerosol Chemical Speciation Analyzer. Clean Technol. 2013, 23, 49–52. [Google Scholar]
  19. He, K.; Zhao, Q.; Ma, Y.; Duan, F.; Yang, F.; Shi, Z.; Chen, G. Spatial and seasonal variability of PM2.5 acidity at two Chinese megacities: Insights into the formation of secondary inorganic aerosols. Atmos. Chem. Phys. 2012, 12, 1377–1395. [Google Scholar] [CrossRef]
  20. Ziemba, L.D.; Fischer, E.; Griffin, R.J.; Talbot, R.W. Aerosol acidity in rural New England: Temporal trends and source region analysis. J. Geophys. Res. Atmos. 2007, 112, D10S22. [Google Scholar] [CrossRef]
  21. Atmospheric Environment Monitoring Network. Available online: http://113.108.142.147:20035/emcpublish/ (accessed on 13 December 2013).
  22. Tang, G.; Wang, Y.; Li, X.; Ji, D.; Hsu, S.; Gao, X. Spatial-temporal variations in surface ozone in Northern China as observed during 2009–2010 and possible implications for future air quality control strategies. Atmos. Chem. Phys. 2012, 12, 2757–2776. [Google Scholar] [CrossRef]
  23. Sun, Y.; Jiang, Q.; Wang, Z.; Fu, P.; Li, J.; Yang, T.; Yin, Y. Investigation of the sources and evolution processes of severe haze pollution in Beijing in January 2013. J. Geophys. Res. Atmos. 2014, 119, 4380–4398. [Google Scholar] [CrossRef]
  24. Jia, Y.; Rahn, K.A.; He, K.; Wen, T.; Wang, Y. A novel technique for quantifying the regional component of urban aerosol solely from its sawtooth cycles. J. Geophys. Res. Atmos. 2008, 113, 21309. [Google Scholar] [CrossRef]
  25. Sun, Y.; Wang, Z.; Dong, H.; Yang, T.; Li, J.; Pan, X.; Chen, P.; Jayne, J.T. Characterization of summer organic and inorganic aerosols in Beijing, China with an Aerosol Chemical Speciation Monitor. Atmos. Environ. 2012, 51, 250–259. [Google Scholar] [CrossRef]
  26. Shen, Z.; Arimoto, R.; Cao, J.; Zhang, R.; Li, X.; Du, N.; Okuda, T.; Nakao, S.; Tanaka, S. Seasonal variations and evidence for the effectiveness of pollution controls on water-soluble inorganic species in total suspended particulates and fine particulate matter from Xi’an, China. J. Air Waste Manag. Assoc. 2008, 58, 1560–1570. [Google Scholar] [PubMed]
  27. Air Quality Index. Available online: http://kjs.mep.gov.cn/hjbhbz/bzwb/dqhjbh/jcgfffbz/201203/t20120302_224166.htm?COLLCC=2906016564& (accessed on 6 September 2014).
  28. Sun, Y.; Zhuang, G.; Tang, A.; Wang, Y.; An, Z. Chemical characteristics of PM2.5 and PM10 in haze-fog episodes in Beijing. Environ. Sci. Technol. 2006, 40, 3148–3155. [Google Scholar] [CrossRef] [PubMed]
  29. Arimoto, R.; Duce, R.A.; Savoie, D.L.; Prospero, J.M.; Talbot, R.; Cullen, J.D.; Tomza, U.; Lewis, N.F.; Ray, B.J. Relationships among aerosol constituents from Asia and the North Pacific during PEM-West A. J. Geophys. Res. Atmos. 1996, 101, 2011–2023. [Google Scholar] [CrossRef]
  30. Yao, X.; Chan, C.K.; Fang, M.; Candle, S.; Chan, T.; Mulawa, P.; He, K.; Ye, B. The water-soluble ionic composition of PM2.5 in Shanghai and Beijing, China. Atmos. Environ. 2002, 36, 4223–4234. [Google Scholar] [CrossRef]
  31. He, K.; Yang, F.; Ma, Y.; Zhang, Q.; Yao, X.; Chan, C.K.; Cadle, S.; Chan, T.; Mulawa, P. The characteristics of PM2.5 in Beijing, China. Atmos. Environ. 2001, 35, 4959–4970. [Google Scholar] [CrossRef]
  32. Yu, X.; He, K.; Ma, Y.; Duan, F.; Yang, F.; Cadle, S.H.; Chan, T.; Mulawa, P.A. Water-soluble anionic species of PM2.5 in Beijing, China. In Proceedings of the 225th American Chemical Society (ACS) National Meeting, New Orleans, LA, USA, 23–27 March 2003; Volume 43, pp. 880–885.
  33. Sun, Y.L.; Wang, Z.F.; Fu, P.Q.; Yang, T.; Jiang, Q.; Dong, H.B.; Li, J.; Jia, J.J. Aerosol composition, sources and processes during wintertime in Beijing, China. Atmos. Chem. Phys. 2013, 13, 4577–4592. [Google Scholar] [CrossRef]
  34. McMurry, P.H.; Zhang, X.Q. Size distributions of ambient organic and elemental carbon. Aerosol Sci. Technol. 1989, 10, 430–437. [Google Scholar] [CrossRef]
  35. Contini, D.; Cesari, D.; Genga, A.; Siciliano, M.; Ielpo, P.; Guascito, M.; Conte, M. Source apportionment of size-segregated atmospheric particles based on the major water-soluble components in Lecce (Italy). Sci. Total Environ. 2014, 472, 248–261. [Google Scholar] [CrossRef] [PubMed]
Figure 1. Time series of (a) mass concentration of PM1, PM2.5, PM10, and the ratio of PM1/PM2.5, PM2.5/PM10; (b) meteorological variables (wind direction, wind speed, relative humidity, and temperature).
Atmosphere 07 00036 g001
Figure 2. Back trajectories for the sawtooth of 17–25 December 2013. Numbers denote date of arrival of the air at Beijing. Calculations begin at 500 m above ground and continue for 48 h.
Atmosphere 07 00036 g002
Figure 3. Time series of PM1 components (sulfate, nitrate, and ammonium).
Atmosphere 07 00036 g003
Figure 4. Variation of SO42−/CO, NO3/CO, SOR, and NOR with pollution level. The “C”, “SP”, and “P” in the figure refer to “clean”, “slightly polluted”, and “polluted” respectively. The mean (pentagram), median (horizontal line), 25th and 75th percentiles (lower and upper box), and 10th and 90th percentiles (lower and upper whiskers) are shown for each bin.
Atmosphere 07 00036 g004
Figure 5. Diurnal variation of meteorological parameters for different pollution levels.
Atmosphere 07 00036 g005
Figure 6. Diurnal profiles of PM1, PM2.5, PM10, and the ratio of PM1/PM2.5 and PM2.5/PM10 for the entire study.
Atmosphere 07 00036 g006
Figure 7. Variation of sulfate and nitrate concentrations in PM1, PM2.5–1 and PM10–2.5 with pollution level. The mean (square), median (horizontal line), 25th and 75th percentiles (lower and upper box), and 10th and 90th percentiles (lower and upper whiskers) are shown for each bin.
Atmosphere 07 00036 g007
Table 1. A summary of the average meteorological parameters, mass concentrations of PM species, major components and gaseous species for the entire study and the three episodes (Ep1, Ep2, and Ep3) marked in Figure 1.
Entire StudyEp1Ep2Ep3
Meteorological Parameters
WS(m·s−1)2.01.91.92.1
Temp(°C)0.940.26−1.12.5
RH(%)32.226.034.332.9
PM Data (μg·m−3)
PM176.291.294.958.1
PM2.584.4101.3104.264.9
PM10130.1141.9146.4114.8
PM1/PM2.50.900.900.910.90
PM2.5/PM100.650.620.650.66
Aerosol Composition (μg·m−3)
PM1(NO3)8.79.811.86.3
PM1(SO4)6.85.58.66.3
Gas Data (μg·m−3)
CO (mg·m−3)1.91.42.71.5
NO269.154.286.959.5
O327.715.020.531.9
SO249.131.963.241.4

