Review

The Teleconnection of the Tropical Atlantic to Indo-Pacific Sea Surface Temperatures on Inter-Annual to Centennial Time Scales: A Review of Recent Findings

1
Earth System Physics Section, Abdus Salam International Centre for Theoretical Physics, Strada Costiera 11, Trieste 34151, Italy
2
Center of Excellence for Climate Change Research/Department of Meteorology, King Abdulaziz University, Jeddah 21589, Saudi Arabia
3
Facultad de CC. Fisicas, Universidad Complutense de Madrid (UCM), Avd. Complutense, Madrid 28040, Spain
4
Department of Meteorology, University of Reading, Reading RG6 6BB, UK
5
Department of Atmospheric and Oceanic Sciences, University of California, Los Angeles, CA 90095-1565, USA
*
Author to whom correspondence should be addressed.
These authors contributed equally to this work.
Atmosphere 2016, 7(2), 29; https://doi.org/10.3390/atmos7020029
Submission received: 31 December 2015 / Revised: 27 January 2016 / Accepted: 4 February 2016 / Published: 17 February 2016
(This article belongs to the Special Issue El Niño Southern Oscillation)

Abstract

:
In this paper, the teleconnections from the tropical Atlantic to the Indo-Pacific region from inter-annual to centennial time scales will be reviewed. Identified teleconnections and hypotheses on mechanisms at work are reviewed and further explored in a century-long pacemaker coupled ocean-atmosphere simulation ensemble. There is a substantial impact of the tropical Atlantic on the Pacific region at inter-annual time scales. An Atlantic Niño (Niña) event leads to rising (sinking) motion in the Atlantic region, which is compensated by sinking (rising) motion in the central-western Pacific. The sinking (rising) motion in the central-western Pacific induces easterly (westerly) surface wind anomalies just to the west, which alter the thermocline. These perturbations propagate eastward as upwelling (downwelling) Kelvin-waves, where they increase the probability for a La Niña (El Niño) event. Moreover, tropical North Atlantic sea surface temperature anomalies are also able to lead La Niña/El Niño development. At multidecadal time scales, a positive (negative) Atlantic Multidecadal Oscillation leads to a cooling (warming) of the eastern Pacific and a warming (cooling) of the western Pacific and Indian Ocean regions. The physical mechanism for this impact is similar to that at inter-annual time scales. At centennial time scales, the Atlantic warming induces a substantial reduction of the eastern Pacific warming even under CO2 increase and to a strong subsurface cooling.

Graphical Abstract

1. Introduction

El Niño and the Southern Oscillation (ENSO) is the most important climate variability event at the inter-annual time scale, leading to the seasonal predictability in many regions around the globe (e.g., [1]). The predictability of ENSO itself is limited to about 8–12 months and is particularly reduced by the so-called boreal spring barrier (e.g., [2,3]). Teleconnection mechanisms that can influence ENSO are potentially useful to extend and improve ENSO prediction and thus seasonal climate predictablity. The recently documented teleconnection between the climate variability in the tropical Atlantic and Pacific at inter-annual time scales, with the former leading the latter [4,5,6,7,8,9,10,11,12,13,14,15,16,17] provides additional predictability to the ENSO phenomenon in boreal spring/summer, when its predictability is typically low. Keenlyside et al. [13] showed that the major 1982/1983 and 1997/1998 El Niño events were not predicted at longer lead times as strong events in their forecasting system when they excluded the forcing from the tropical Atlantic. The forcing from the tropical Atlantic may come either from the Atlantic Niño (Niña) ([4,6,7,8,9,10,13,16]) or from the tropical North Atlantic as identified by [14,15]. A positive (negative) Atlantic Niño favors an eastern Pacific La Niña (El Niño) development 6–12 months later, and a warming (cooling) in the tropical North Atlantic precedes the development of a central Pacific La Niña (El Niño) several months later. The physical mechanism for the Atlantic Niño (Niña) teleconnection to the Pacific is a modification of the Walker circulation that leads to anomalous subsidence (ascent) and surface wind anomalies in the central-western Pacific region. These anomalous winds trigger equatorial Kelvin waves which propagate eastward, activating the oceanic feedbacks required for ENSO development ([4,6,9,11]). On the other hand, anomalous sea surface temperatures (SSTs) in the tropical North Atlantic produce an atmospheric Rossby-wave response in the subtropical North Pacific that could initiate the ENSO development through the wind-evaporation feedback [14,15].
At longer time scales, the Atlantic SSTs also influence the Pacific and the Indian Oceans. Previous studies have documented the impact of the Atlantic Multidecadal Oscillation (AMO) on the Pacific and ENSO variability [18,19,20,21]. Recently, [22] have demonstrated that the AMO influences particularly the tropical Indo-Pacific region and could partially contribute to the so-called Pacific climate shift events, which are relatively abrupt changes of climate mean state properties that are related to multidecadal variability [23,24]. The most famous of such events are the mid-70s climate shift and the recent shift towards a cooler equatorial eastern Pacific in the beginning of the 21st century ([23,25,26]). The recent event has also been connected with the hiatus in global warming (e.g., [27,28,29]). The physical mechanism for this decadal teleconnection is similar to that outlined at inter-annual time scales from the Atlantic Niño: a positive (negative) AMO induces an overall warming (cooling) of the tropical Atlantic, which, in turn modifies the Walker circulation, setting up the oceanic conditions required to cool (warm) the tropical eastern Pacific. Kang et al. [30] demonstrated that such multidecadal changes in the Pacific SST background state could modify ENSO amplitude and position and could also explain why weaker, central Pacific ENSO events were more frequent in the beginning of the 21st century, compared to stronger and more eastern Pacific ENSO events in the previous decades. Furthermore,McGregor et al. [31] also demonstrated that the recent climate shift in the Pacific region could have been enhanced by the strong Atlantic warming. Li et al. [32] showed that the recent Atlantic warming induces a pan-tropical SST response in the Indo-Pacific region. The above findings suggest that AMO could force trans-basin variability. In this sense, [33,34] showed that a realistic ocean state initialization leads indeed to trans-basin climate variability and predictability up to three years ahead. On the other hand, [35,36] highlighted the importance of internal Pacific dynamics in the decadal variations of tropical Pacific SSTs, and emphasized the role of extra-tropical wind variations and their influence on sub-tropical cell variability.
An interesting feature that has been recently found is the modulation of the Atlantic influence on ENSO by the multidecadal variability. The Atlantic-Pacific relation found in [4] was only present from the 1970s motivating the works of [10,11,12] in which the connection was found to be significant just for AMO negative phases.The observed non-stationary behavior of the teleconnection opens additional opportunities to enhance ENSO prediction using the tropical Atlantic SSTs during the previous boreal summer [12]. Although recent studies have already put forward the importance of the inclusion of tropical Atlantic SSTs in the prediction of the ENSO phenomenon [7,8,12,13] have demonstrated that the Atlantic contribution is only effective during certain decades.
Finally, at centennial time scales, the warming of the Atlantic Ocean could have reduced the concomitant warming in the eastern Pacific and induced a cooling there [16,37], even in the presence of greenhouse gas warming. This result allows for a new interpretation to the ocean thermostat mechanism [38], which has been proposed to explain the observed reduced eastern Pacific warming compared to the western Pacific one. Kucharski1 et al. [37] suggest that such a thermostat in the eastern Pacific exists, but it has to be activated by an external forcing. Some of the above teleconnections have been also documented in the World Climate Reasearch Programme (WCRP) Climate Model Intercomparision project, phase 5 (CMIP5). However, the CMIP5 models greatly vary regarding the reproduction of the teleconnections from the Atlantic to the Pacific, and only very few models show teleconnections comparable in magnitude to observations or the idealized experiments conducted to support the observed findings [16].
The aim of this paper is to review, confirm and further investigate some of the teleconnections discussed above in an ensemble of century-long Atlantic pacemaker experiments. This paper is therefore structured as follows: In Section 2, the observational data, model and experimental set-up as well as methodology are presented. In Section 3, the results for the various time scales of the Atlantic influence on the Pacific region are presented and discussed within the framework of previously published results, whereas, in Section 4, the discussion and conclusions are presented.

2. Observational Data, Model, and Experimental Set-Up and Methodology

As observational SST, we use the HadISST data from the Hadley Center (1870 to present; [39]), for Sea Level Pressure and low-level winds we use the NOAA-CIRES 20th Century Reanalysis version 2 (1900 to present; [40]). For ocean fields, we use SODA data (1871 to 2010; [41,42]).
The model used is the International Centre for Theoretical Physics AGCM (ICTPAGCM, version 41; [43]), coupled to the Nucleus for European Modelling of the Ocean (NEMO) model ([44]) using the OASIS3 coupler ([45]). NEMO also includes a dynamic sea-ice component (LIM; [46]) which is activated in the simulations for the current study. This model will be referred to as ICTPCGCM. A more detailed description of this model can be found in [22]. A few salient features are that the resolution of the AGCM is relatively coarse with eight vertical levels and a spectral resolution of T30, whereas the ocean component has a tripolar ORCA2 configuration with a horizontal resolution of 2 degrees and a tropical refinement to 1/2 degrees. The ocean model has 31 vertical levels.
The model uses a flux-correction described in [47]. The ICTPCGCM runs fully coupled in the Indo-Pacific region, but observed monthly varying SST from the HadISST are prescribed in the Atlantic region (Atlantic Pacemaker experiment). The model integrations start in 1872 and run through 2013. An ensemble of 10 members is generated by restarting the ICTPCGCM from a previous 300-year long run and using small initial perturbations. The first 29 years of all simulations are considered as spin-up and the analysis is performed on the remaining period from 1900–2013. This experiment is referred to as ATL_VAR. We also performed a 10-member ensemble with climatologically monthly varying, but inter-annually constant Atlantic SSTs, in order to better identify the role of Atlantic SSTs in forcing Indo-Pacific variability. This experiment is referred to as ATL_CLIM. In addition, an AGCM stand alone pacemaker experiment with climatological SSTs in the Indo-Pacific region is performed in order to investigate the direct atmospheric impacts of the Atlantic forcings on the Indo-Pacific region without inclusion of the feedback from the ocean. An ensemble of five members is performed and this experiment is referred to as ATL_VARAGCM. Idealized Atlantic forcing experiments are also performed using a constant SST anomaly pattern, and a thermodynamic mixed-layer ocean elsewhere (with depth varying from 40 m in tropics to 60 m in the extra-tropics). This experiment is referred to as ATL_VARMIX. Results will be presented from the ensemble mean of the ensembles.
In all simulations, the CO 2 concentration is fixed at mid-20th century values. Since, in reality, the CO 2 concentration has been increasing in the 20th century, all data is de-trended for the inter-annual and decadal analysis, to be able to compare the simulations better with observations.
For the centennial analysis, the trend is analyzed, keeping in mind that in the model only the impact of the Atlantic SSTs on the Pacific can be reproduced, but not the direct effect of the CO 2 forcing in the Indo-Pacific region. Based on the data availability, the common time for analysis chosen is 1901 to 2010.
The analysis shown in this paper is based on linear regression maps that are derived from the co-variance of a normalized index with a field of interest; therefore, the units of all regression maps will be that of the field. The statistical significance of the presented results is tested using a two-tailed t-test based on inter-annual variability for observations and using intra-ensemble variability for the model results. A more detailed description of the model and a validation of some basic features of model performance are found in [22].

3. Results

In this section, we will revisit the teleconnection from the Atlantic to the Indo-Pacific region at several time scales that have been discussed in the introduction, using the Atlantic Pacemaker experiments previously described. We start with the teleconnection at the inter-annual time scale.

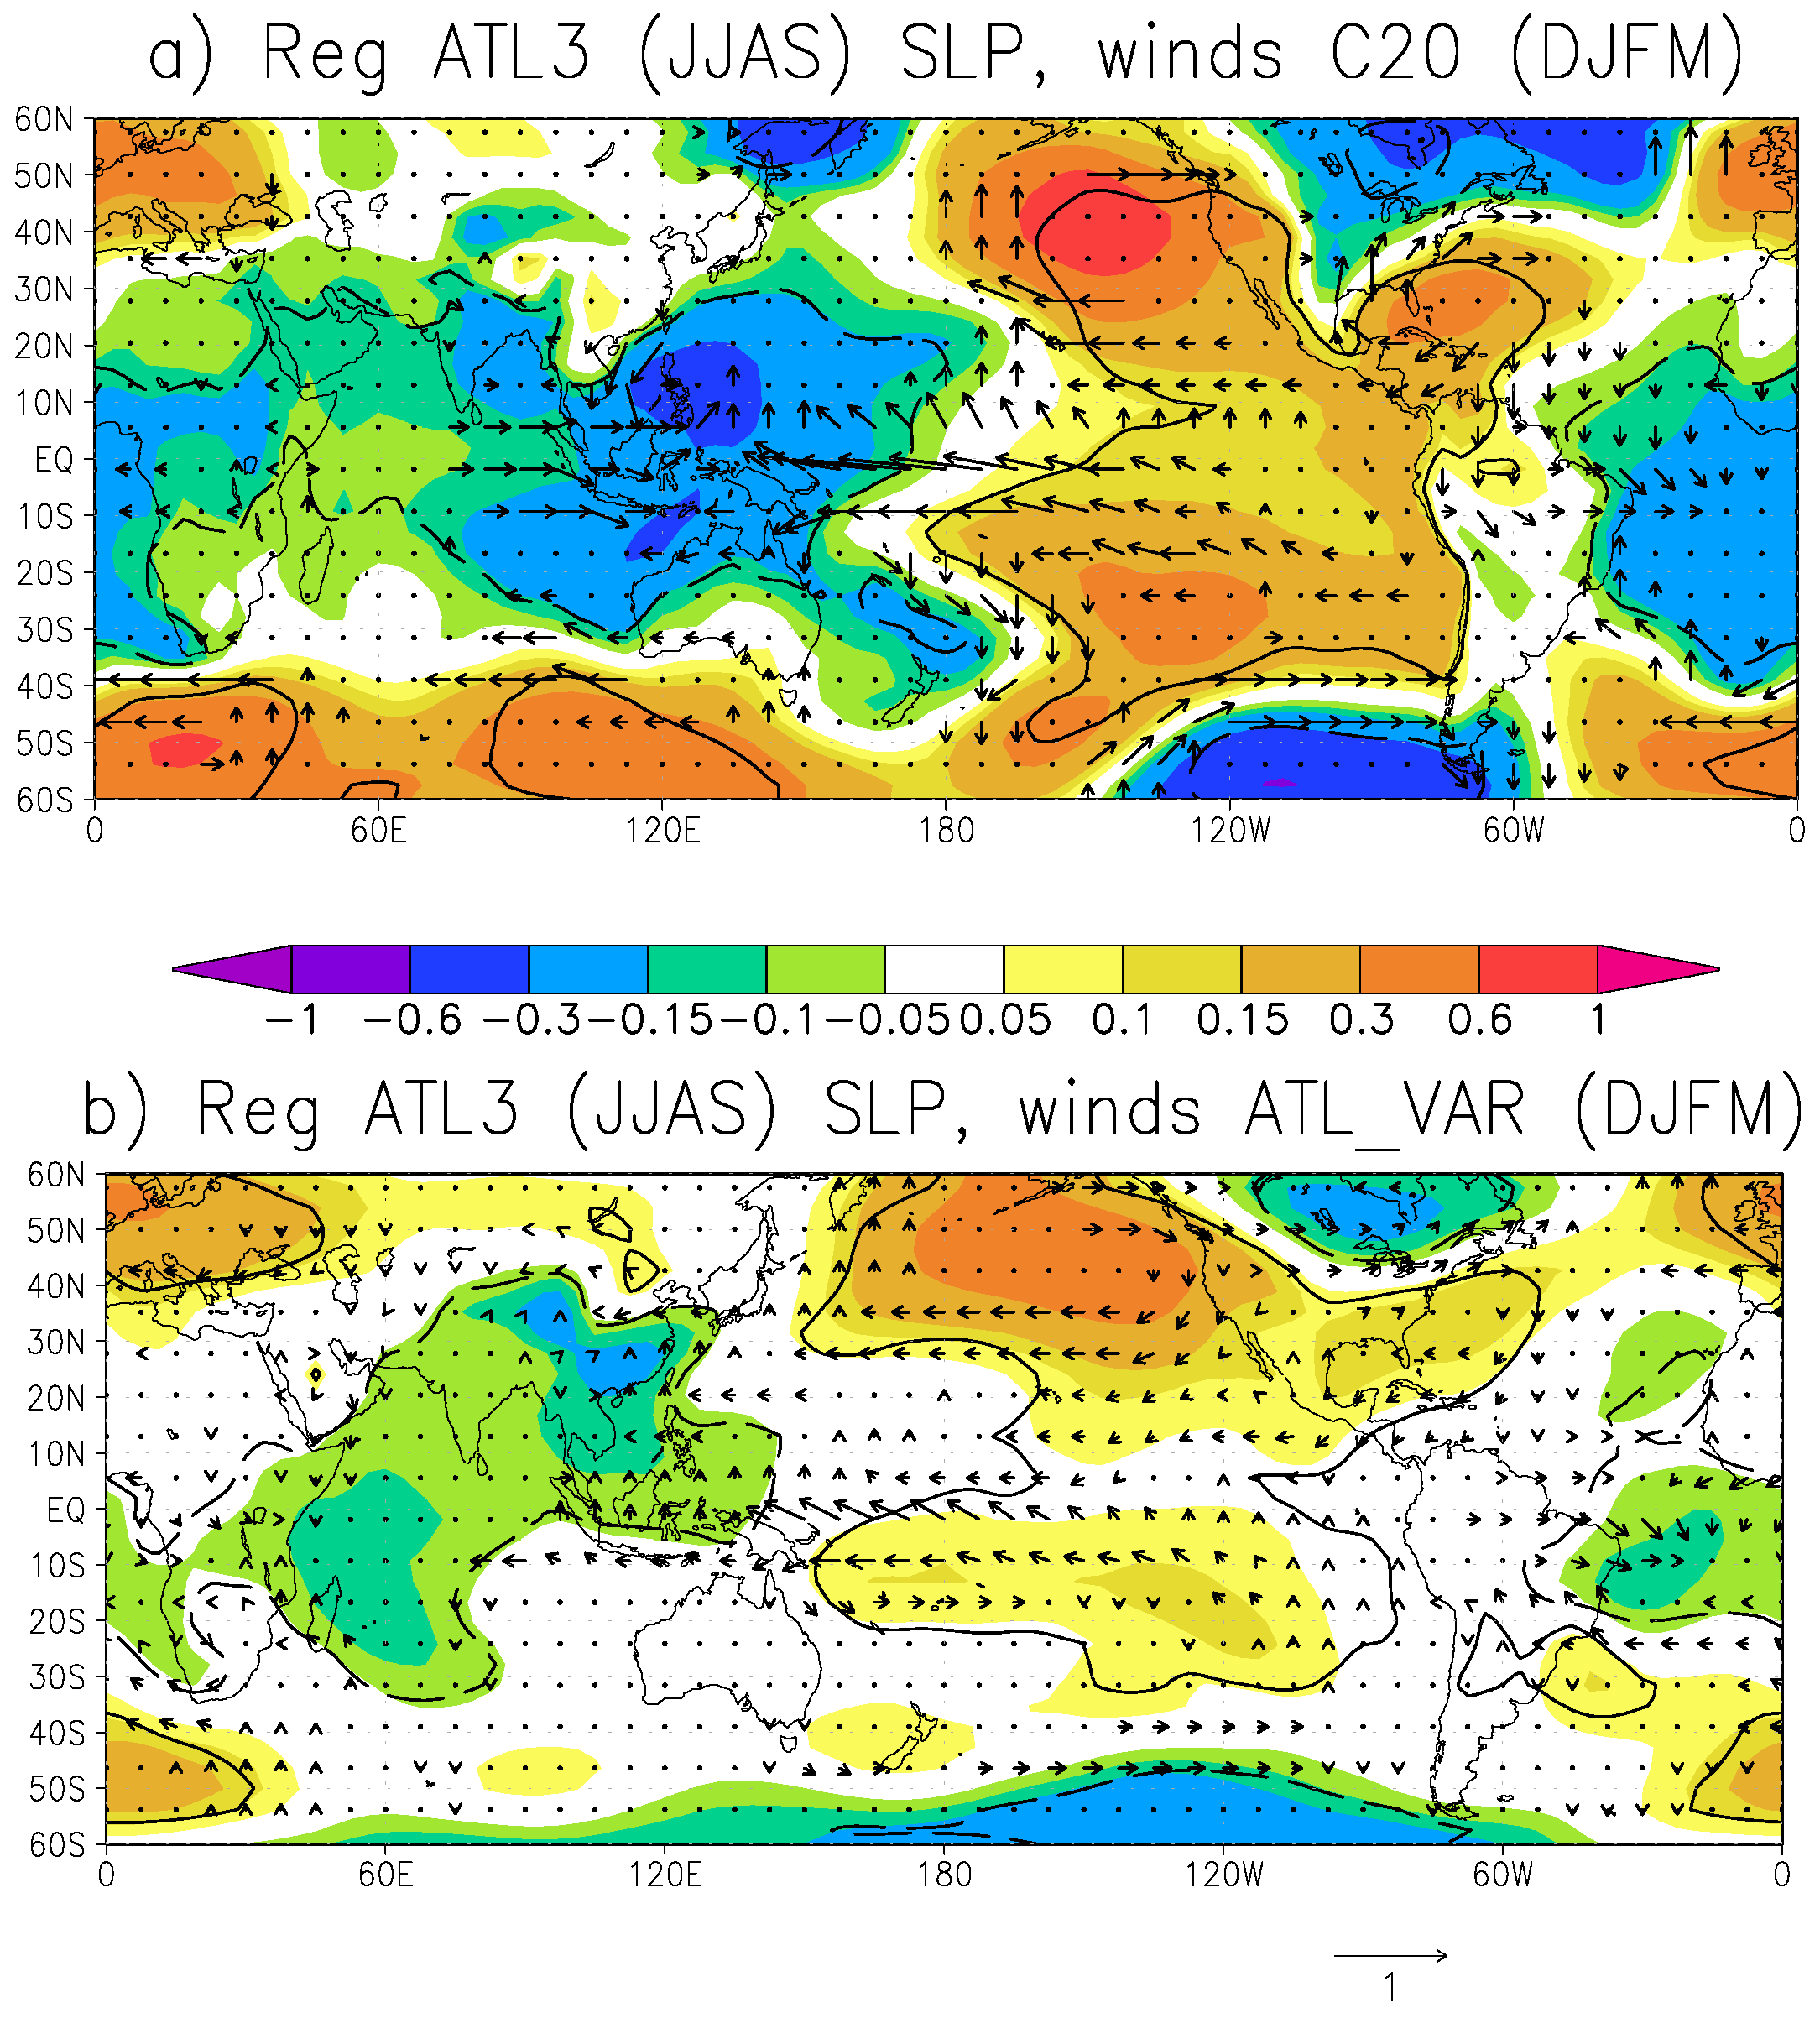
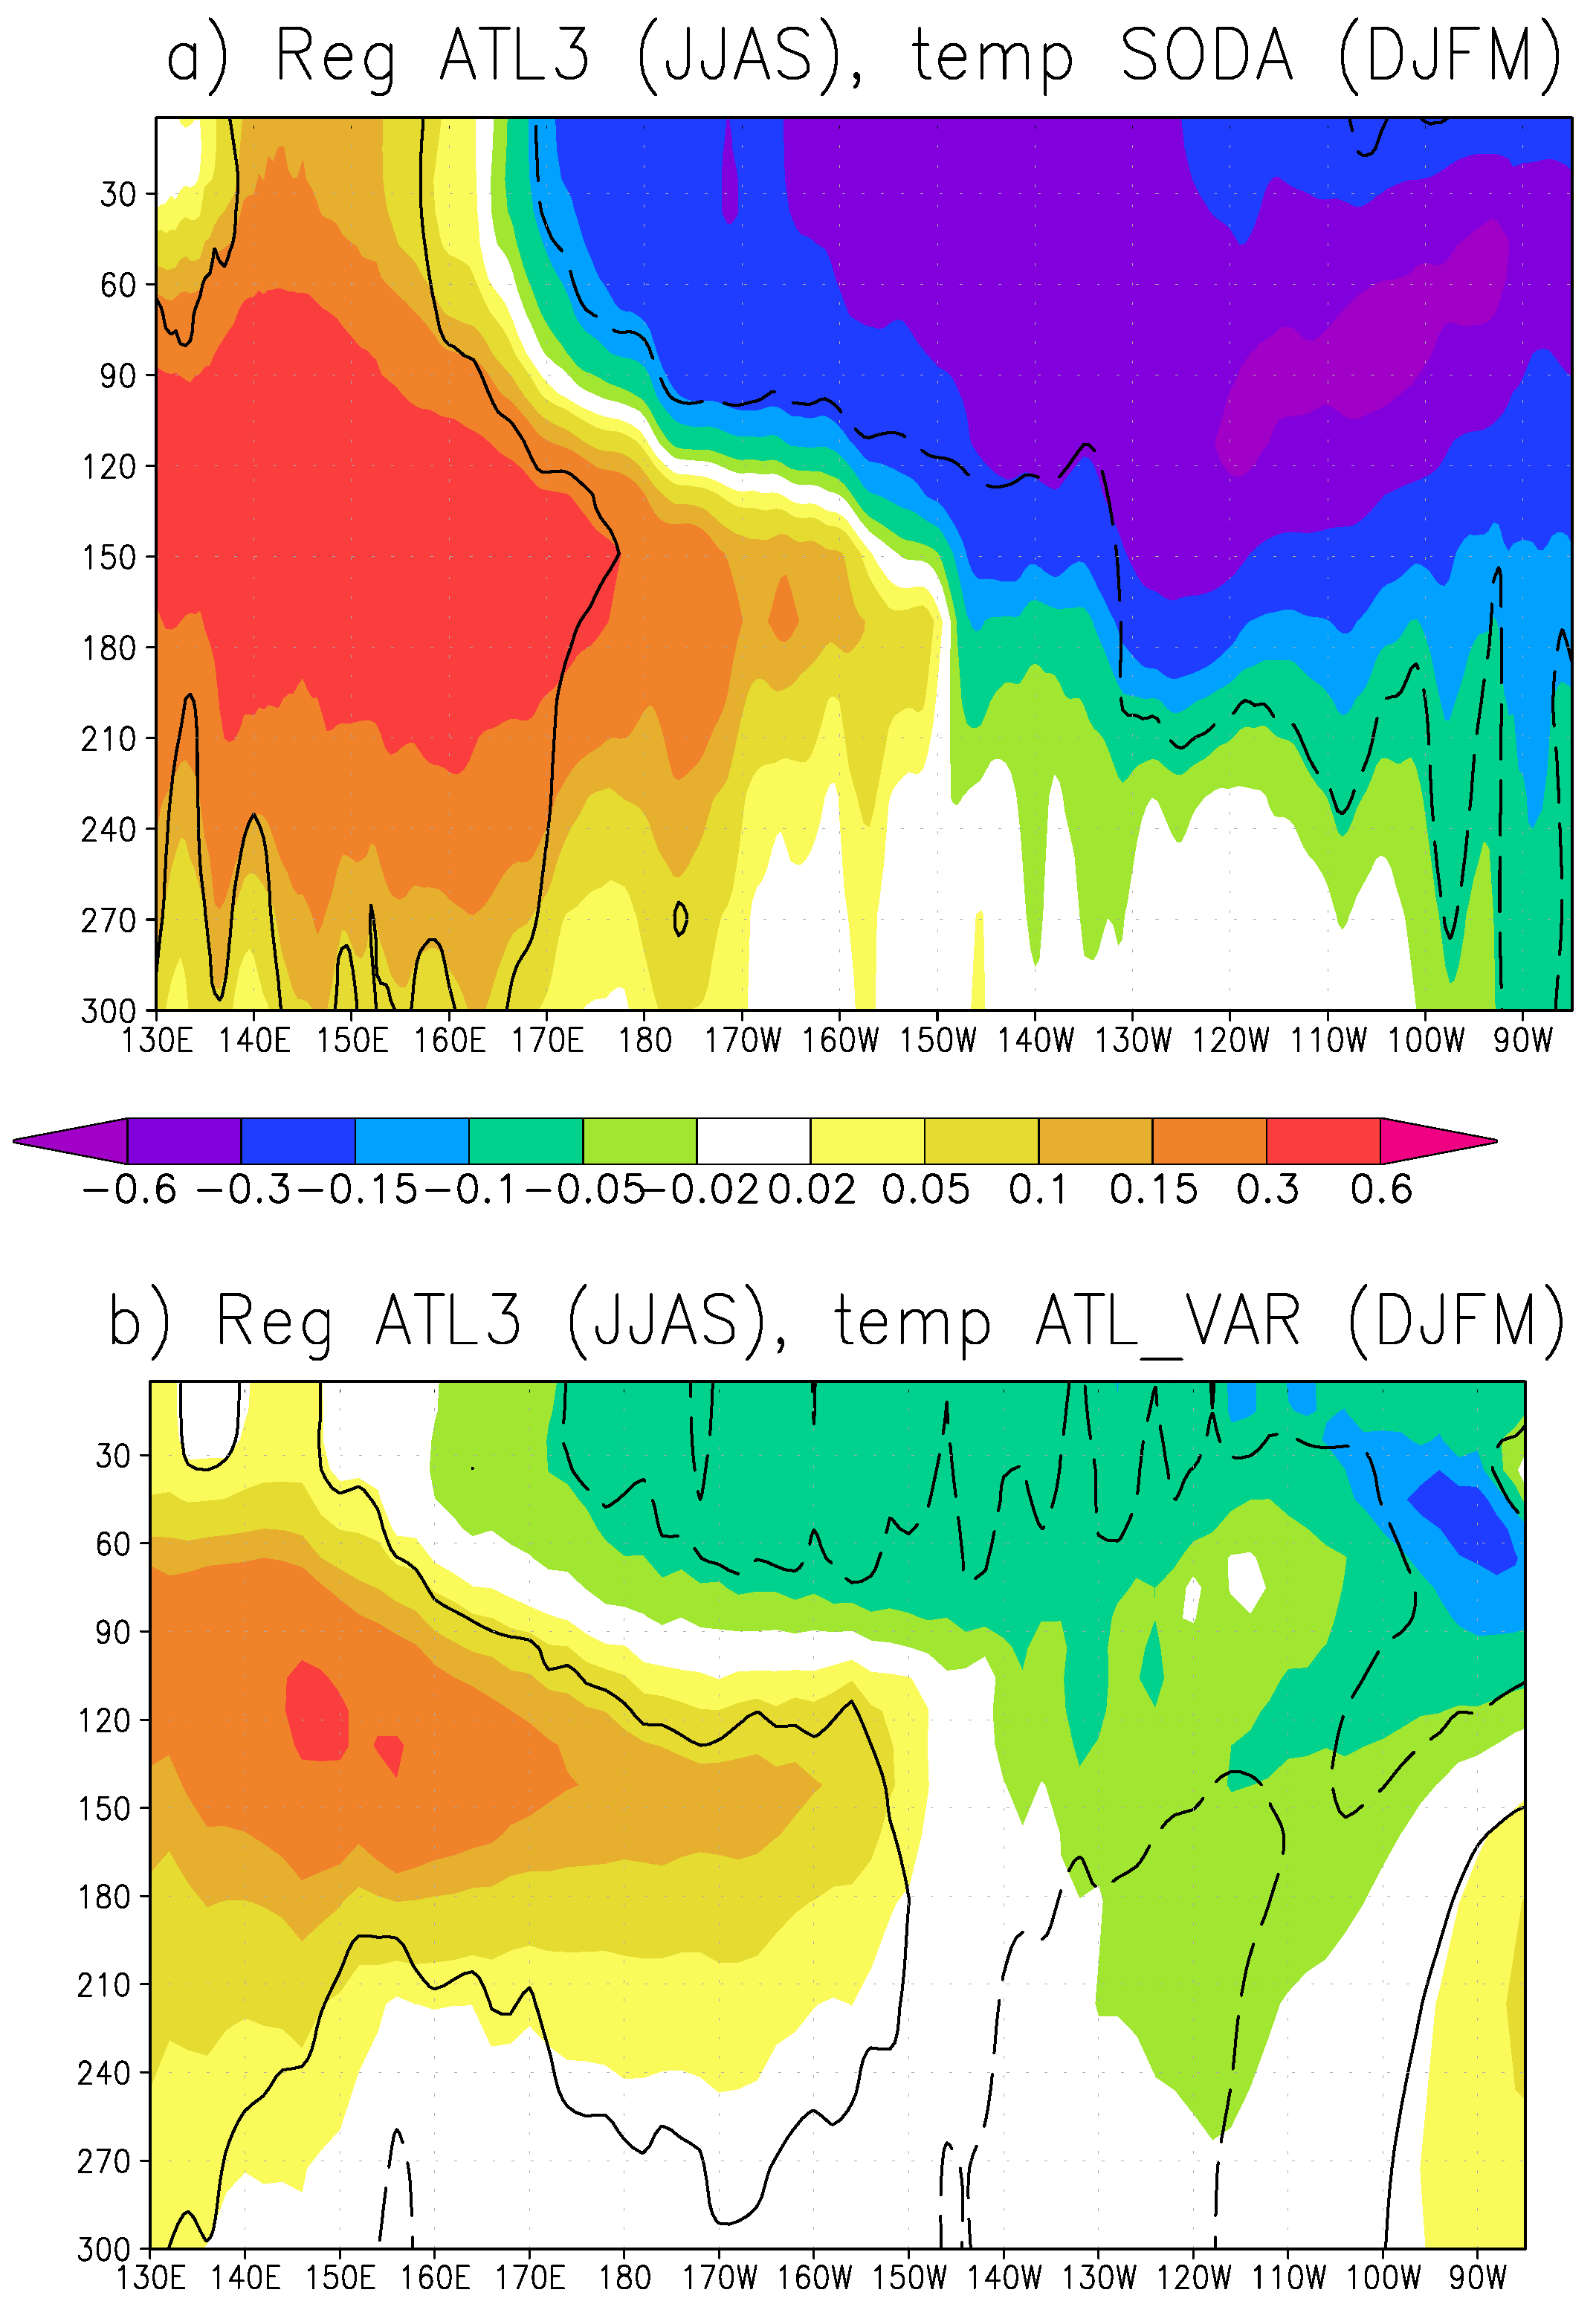
3.1. Interannual Tropical Atlantic-Pacific Teleconnection

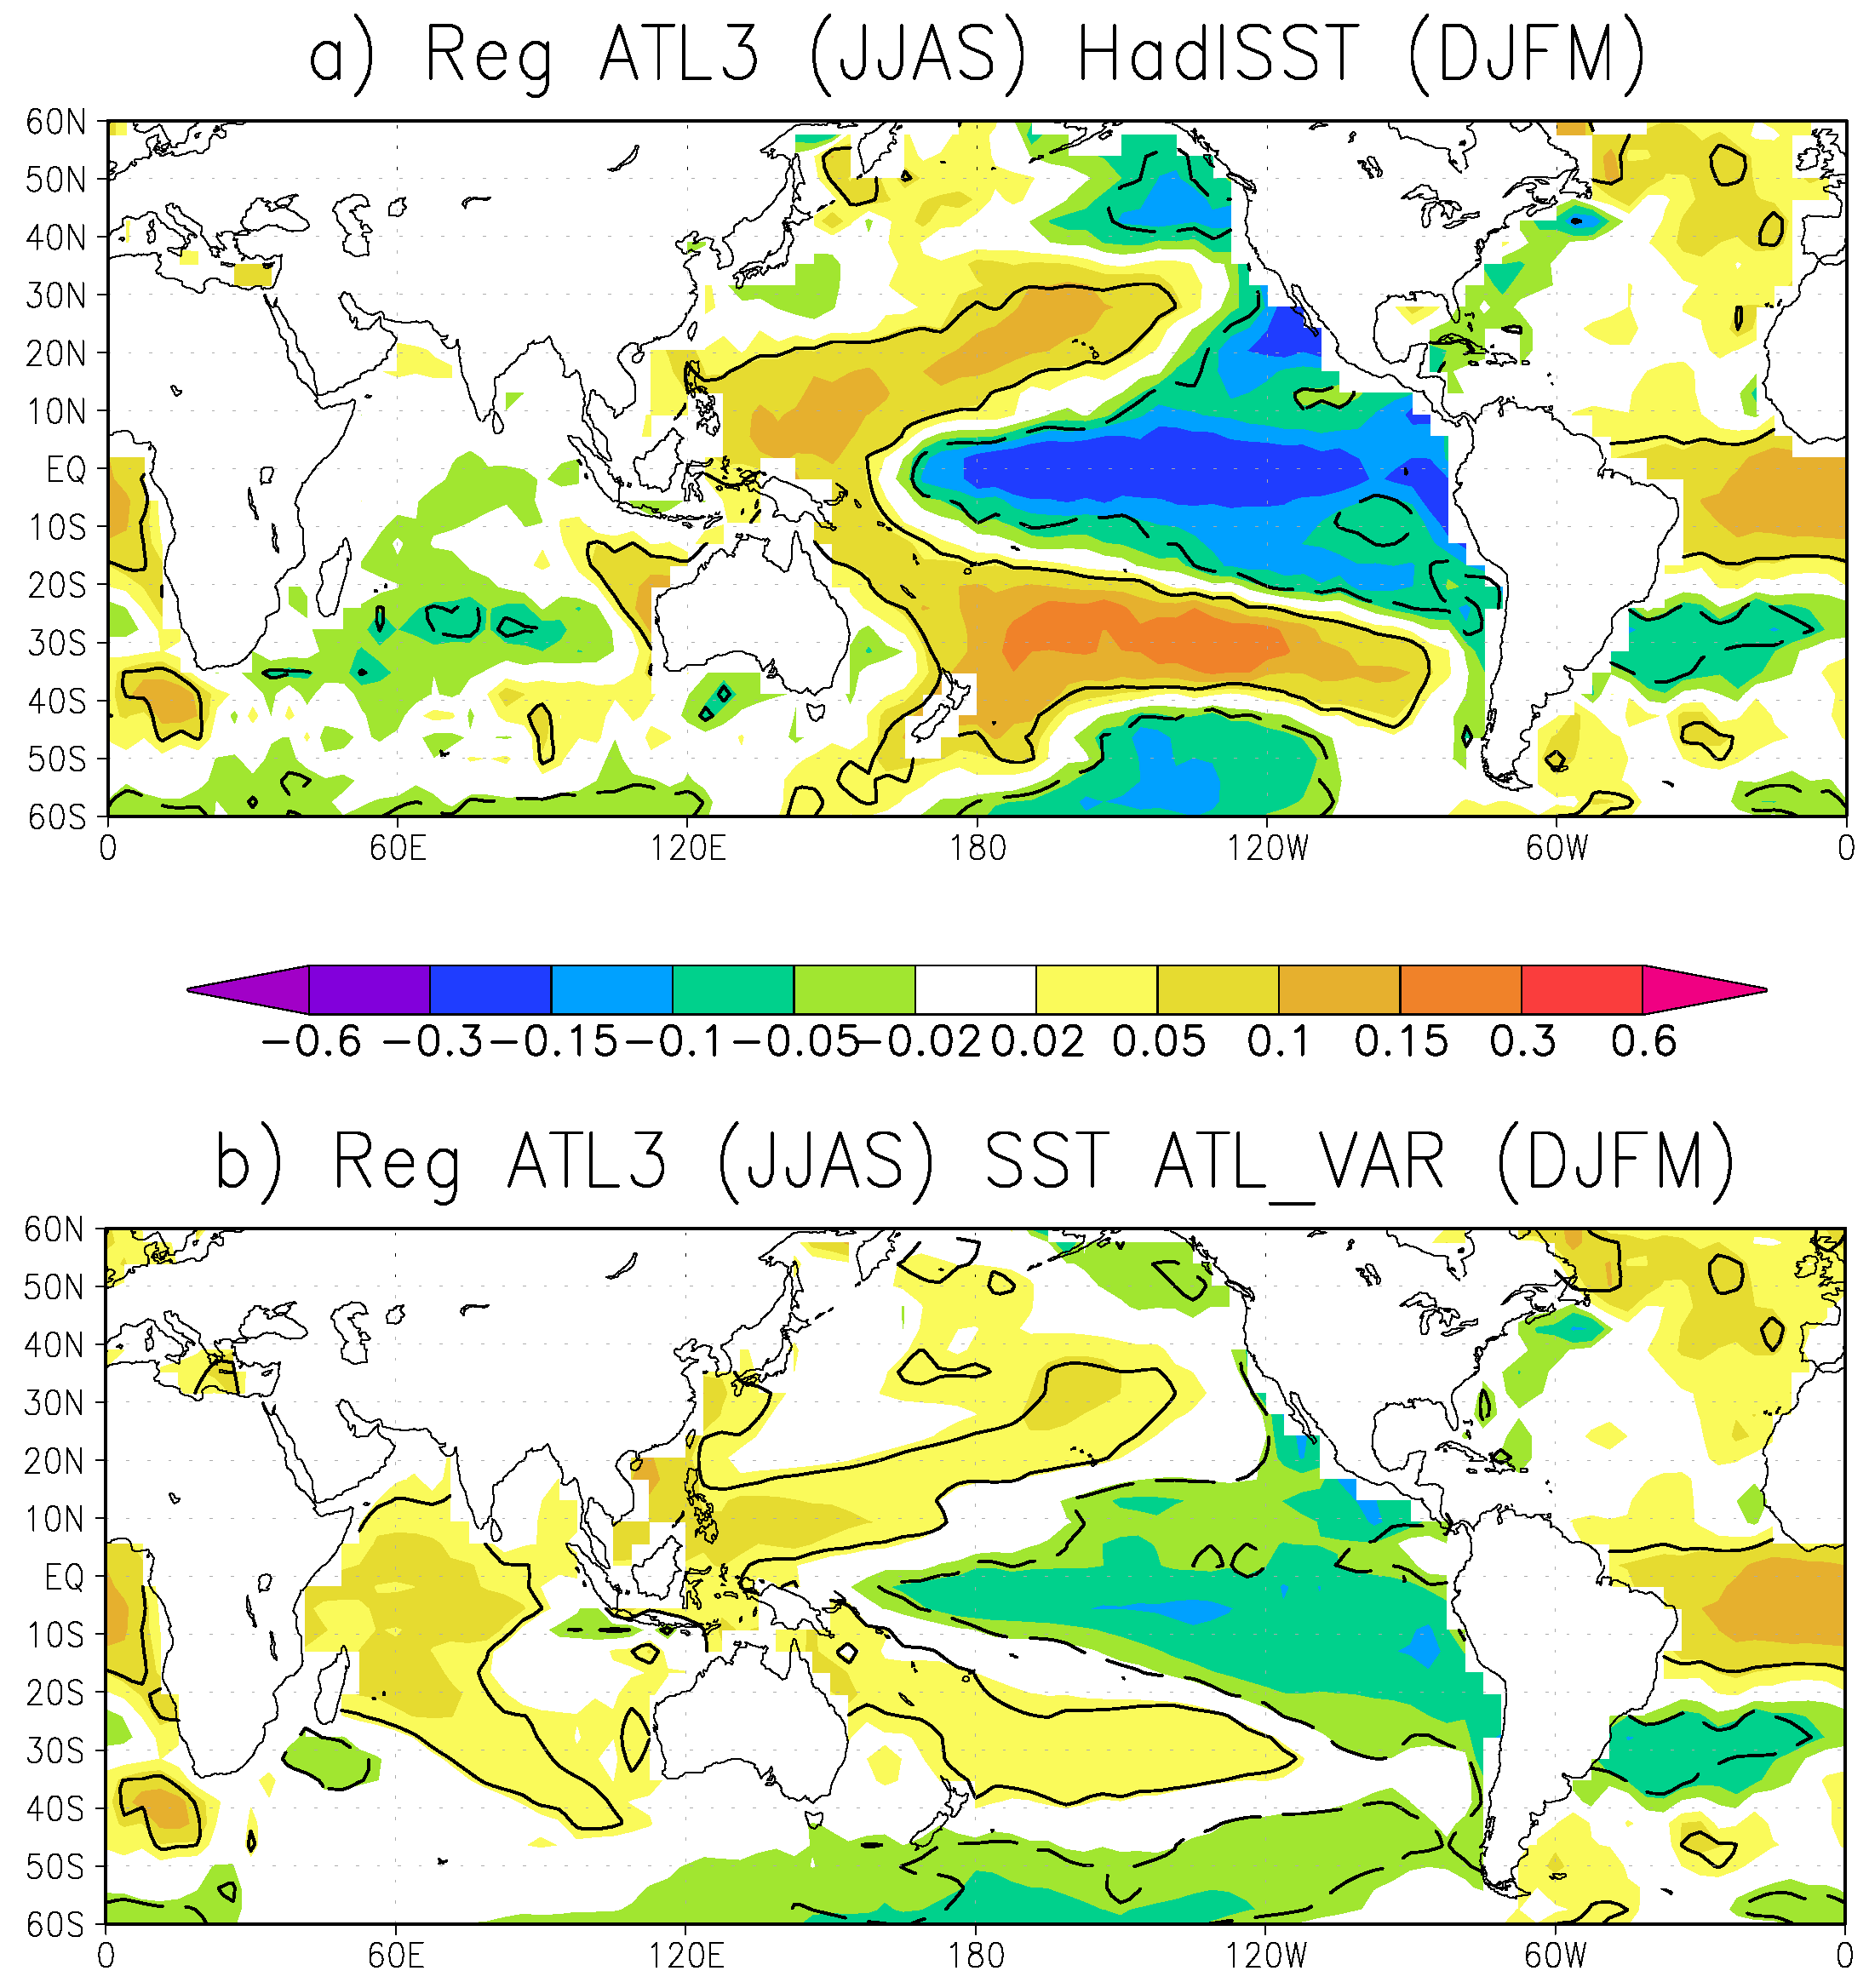
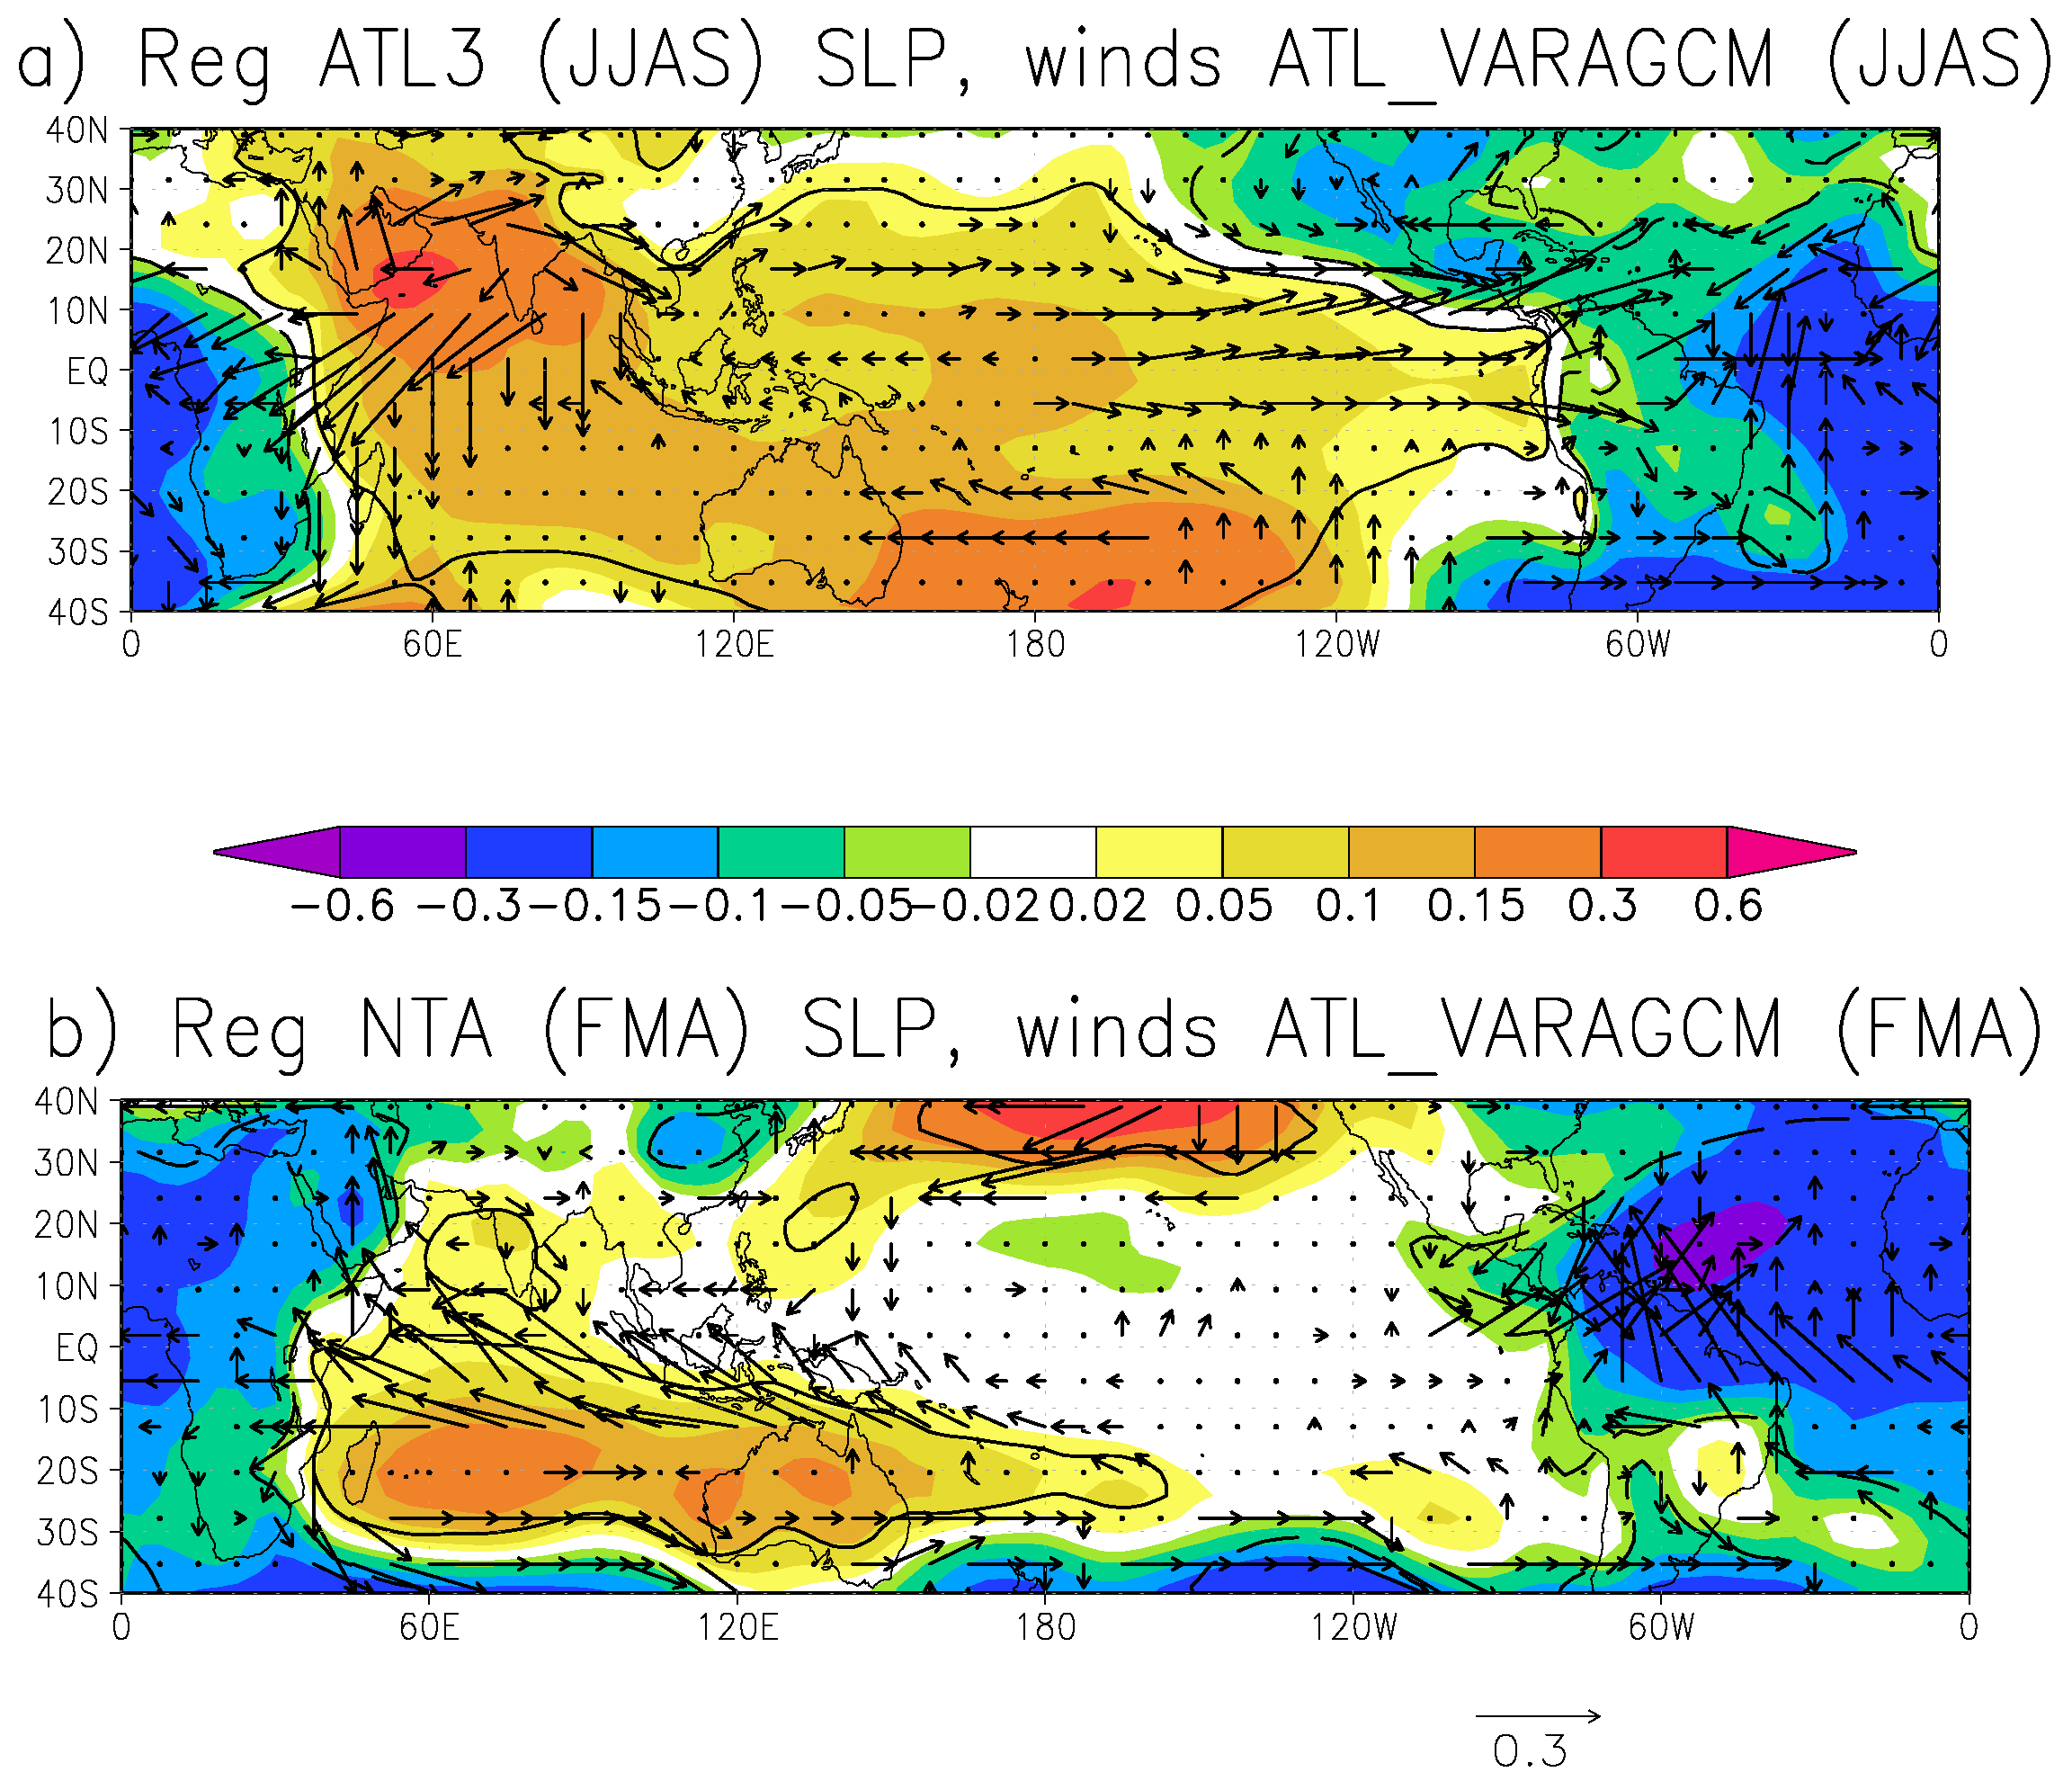
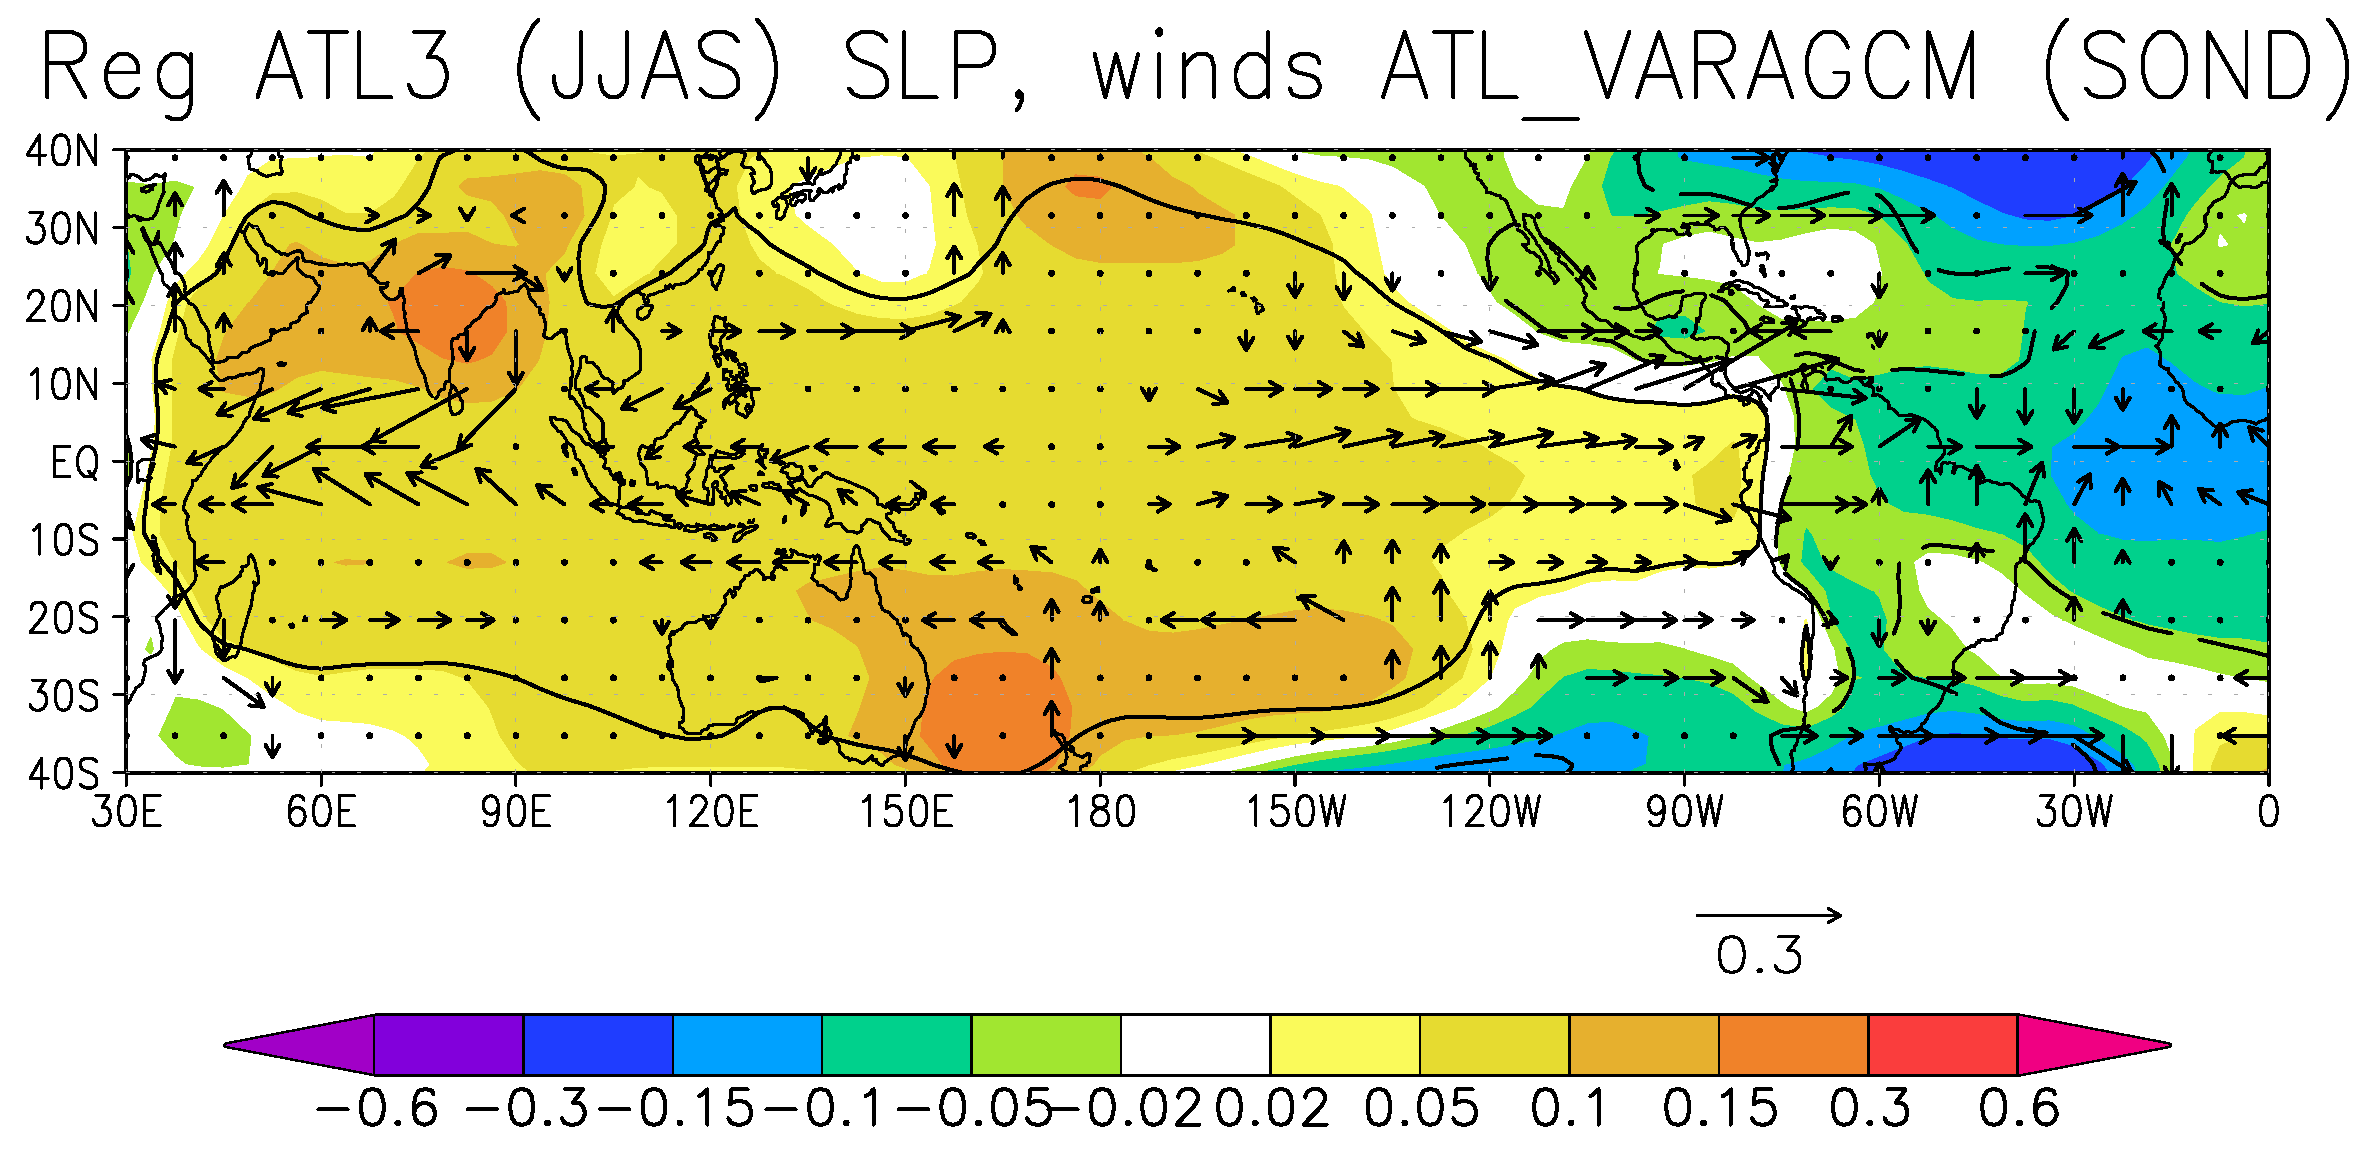
3.1.1. Atlantic Niño

The pioneering work of [4] and also [6,7,8] demonstrated that an Atlantic Niño (Niña) increases the probability for a Pacific La Niña (El Niño) event several months later. This inter-basin teleconnection is also verified in the ATL_VAR experiment.
Figure 1 presents the regression of the June-to-September (JJAS) ATL3 index (defined as the SST anomalies averaged in the region (340 E to 360 E , 3 S to 3 N) onto the observed and ATL_VAR following December-to-March (DJFM) SST anomalies. An eastern Pacific equatorial cooling surrounded by a horse-shoe pattern of warmer SSTs in western tropical Pacific are associated with an equatorial Atlantic warming in both, the observational and modelled data (although with half of the magnitude in the model). Nevertheless, there is no agreement between observed and modeled anomalies in the Indian Ocean region.
The Atlantic-Pacific connection is established through an air-sea coupled mechanism. For a boreal summer Atlantic Niño (Niña), the Walker circulation is altered with ascending (sinking) motions over the Atlantic basin and anomalous subsidence (ascent) in the central Pacific ([4,6,48]). This strengthened (weakened) Walker circulation is reproduced in both the observations and the model (although with weaker amplitude in the model), associated with higher (lower) pressure values in the eastern Pacific and lower (higher) pressure values in the western Pacific and Indian Ocean region at surface levels (Figure 2). Low-level easterly (westerly) wind anomalies in the central Pacific are also present in response to an Atlantic Niño (Niña) in both, observations and model. In addition, the circulation anomalies in the extratropical northern hemisphere are well reproduced, and indicate an extratropical response to a La Niña (El Niño)-type forcing. A region where the ATL_VAR experiment does not reproduce the observed signal very well is in the tropical Atlantic region, where the low-pressure response to the decaying Atlantic Niño is weaker than observed. This is likely a model bias, but also the ensemble averaging could play a role. On the other hand, the equatorial Atlantic wind responses are closer to the observations. It cannot be ruled out that this is part of the reason for the weaker-than-observed teleconnection in ATL_VAR from the Atlantic Niño to the Pacific region. These results are consistent with what has been reported in [16].
The descending (ascending) motions in the central Pacific lead to anomalous easterlies (westerlies) in the central-western Pacific that trigger an upwelling (downwelling) oceanic Kelvin wave propagating eastward during the following months ([9,10]). As the Kelvin wave propagates, the eastern Pacific becomes cooler (warmer) through the activation of the thermocline feedbacks and the establishment of the Bjerknes feedback ([9]).
Regarding the oceanic changes in the Tropical Pacific associated with a positive Atlantic forcing, Figure 3 reveals that there is a substantial subsurface signature, characterized by a cooling in the central-eastern Pacific and a warming in the western side of the basin. Notice that maximum values are located near the thermocline. The surface and subsurface Pacific responses to an Atlantic Niño (Niña) resemble a La Niña (El Niño)-like signal (e.g., [47]).

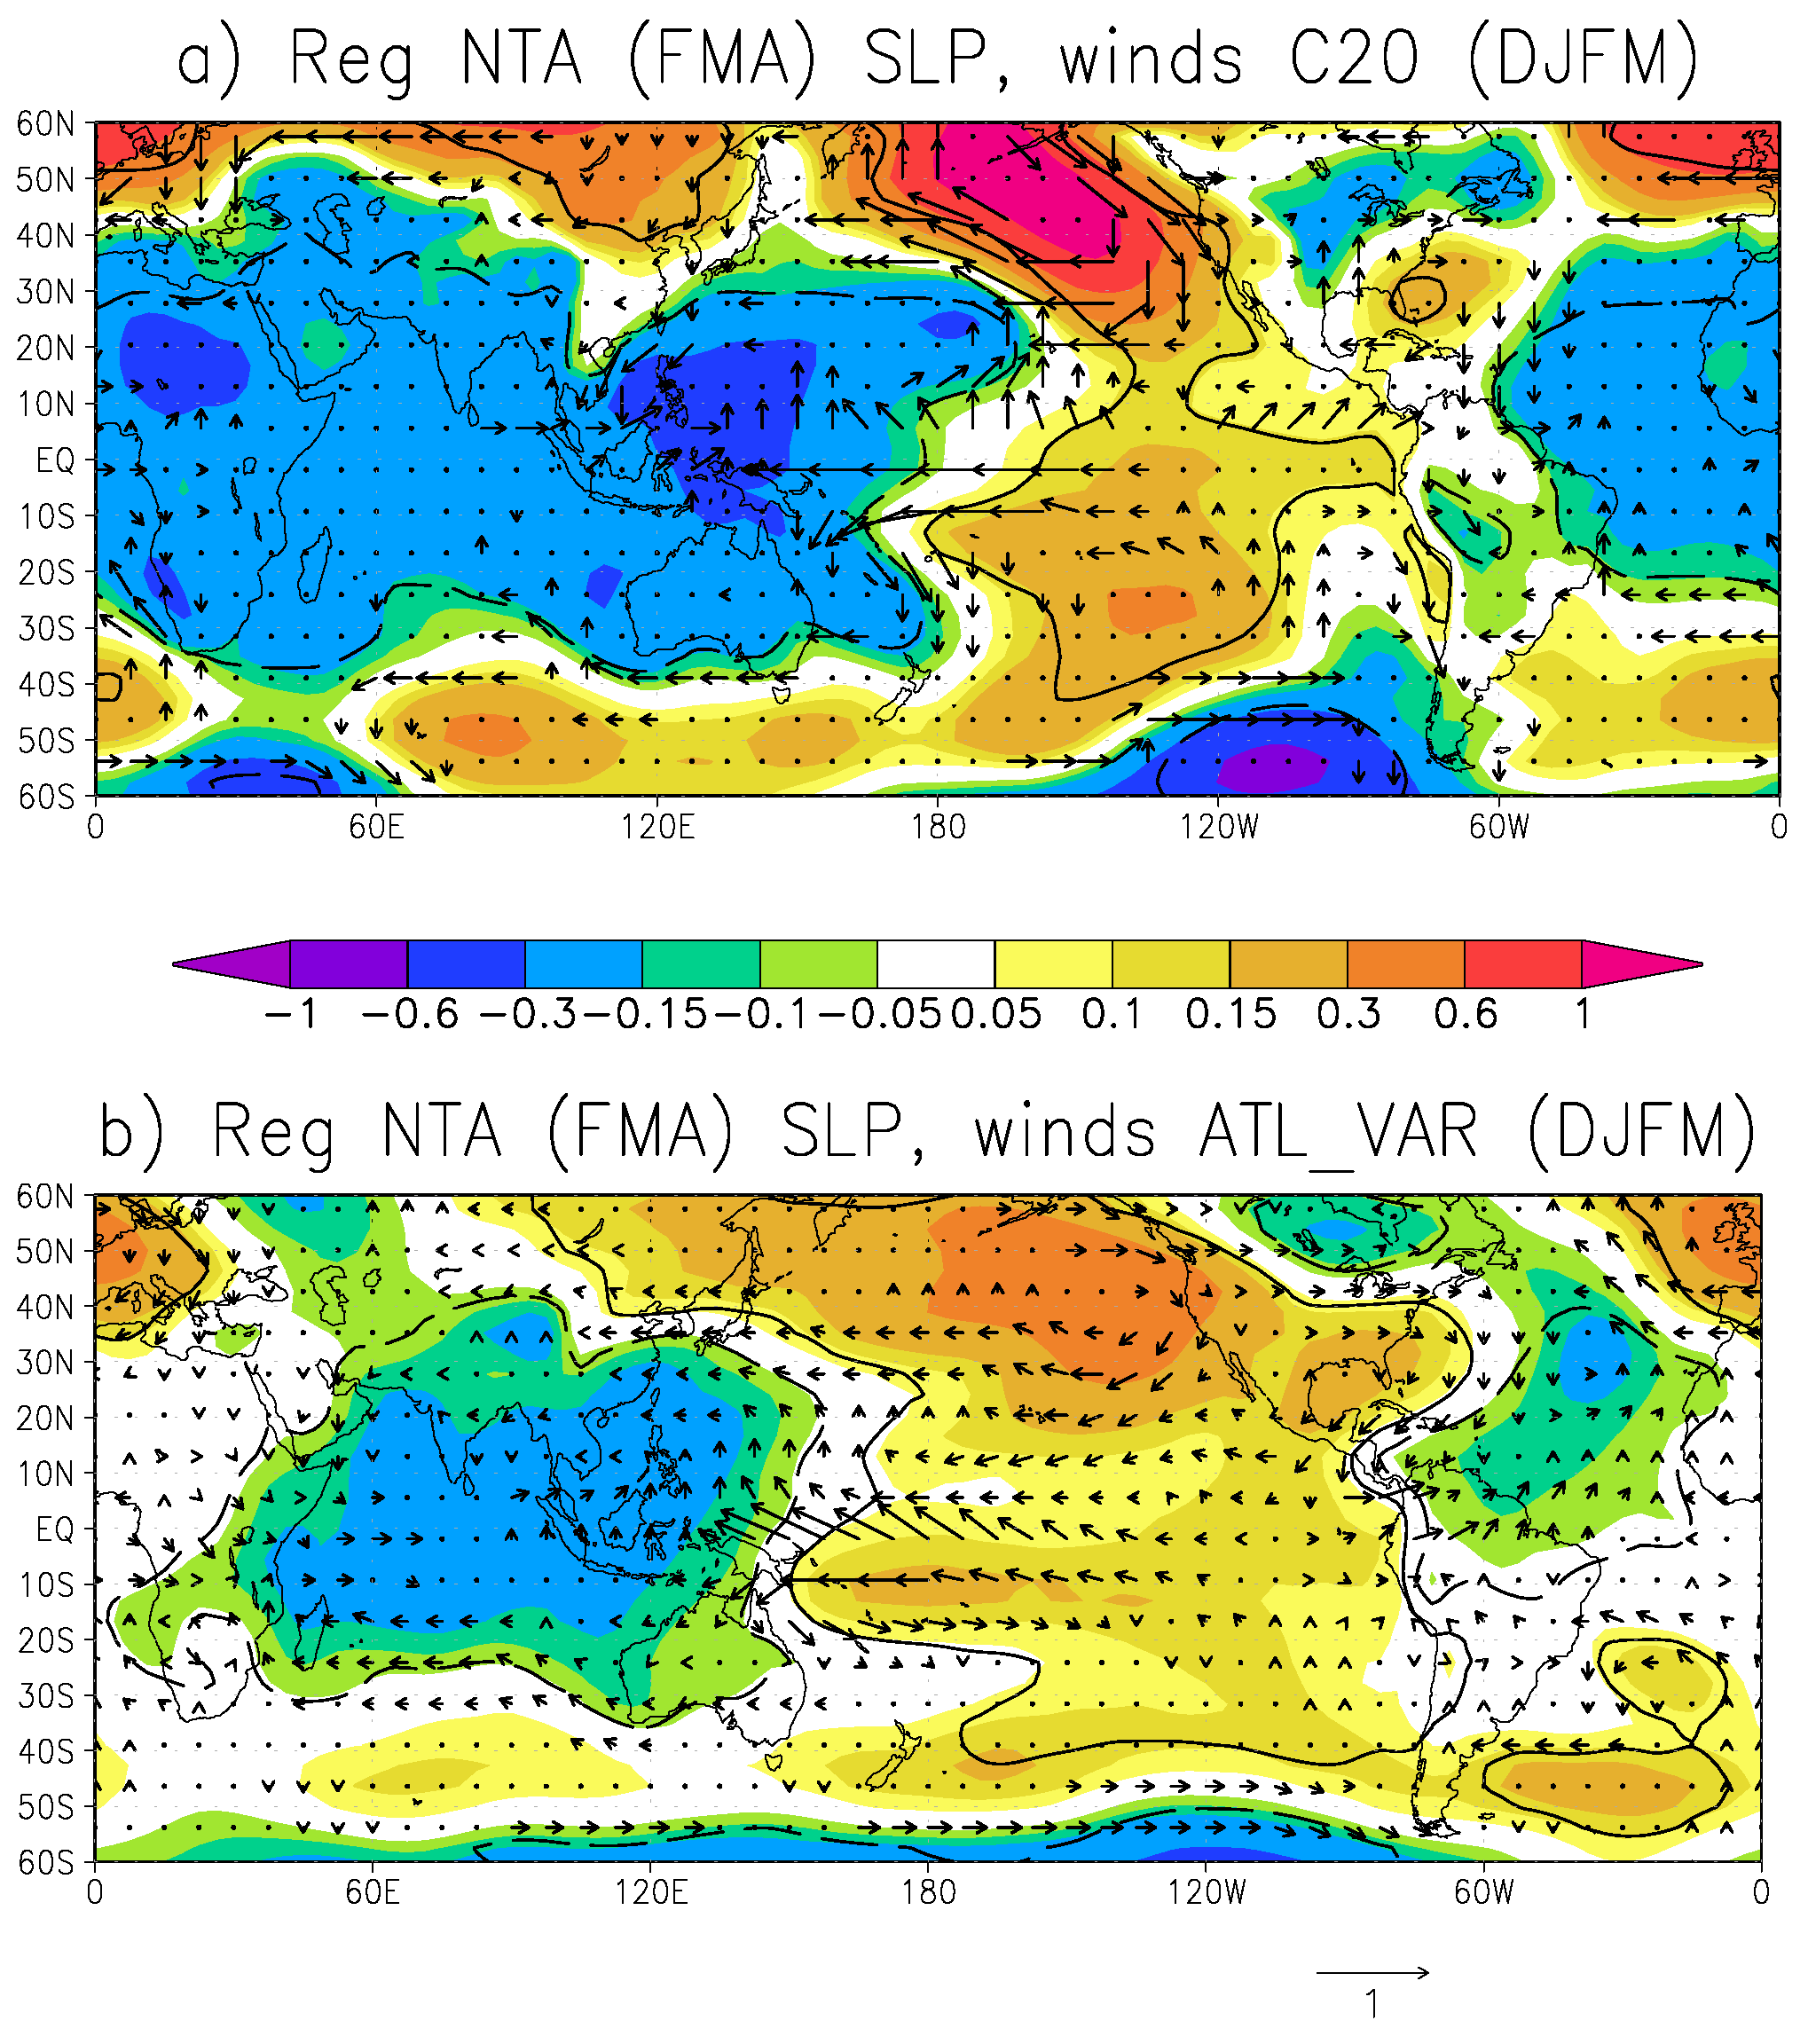
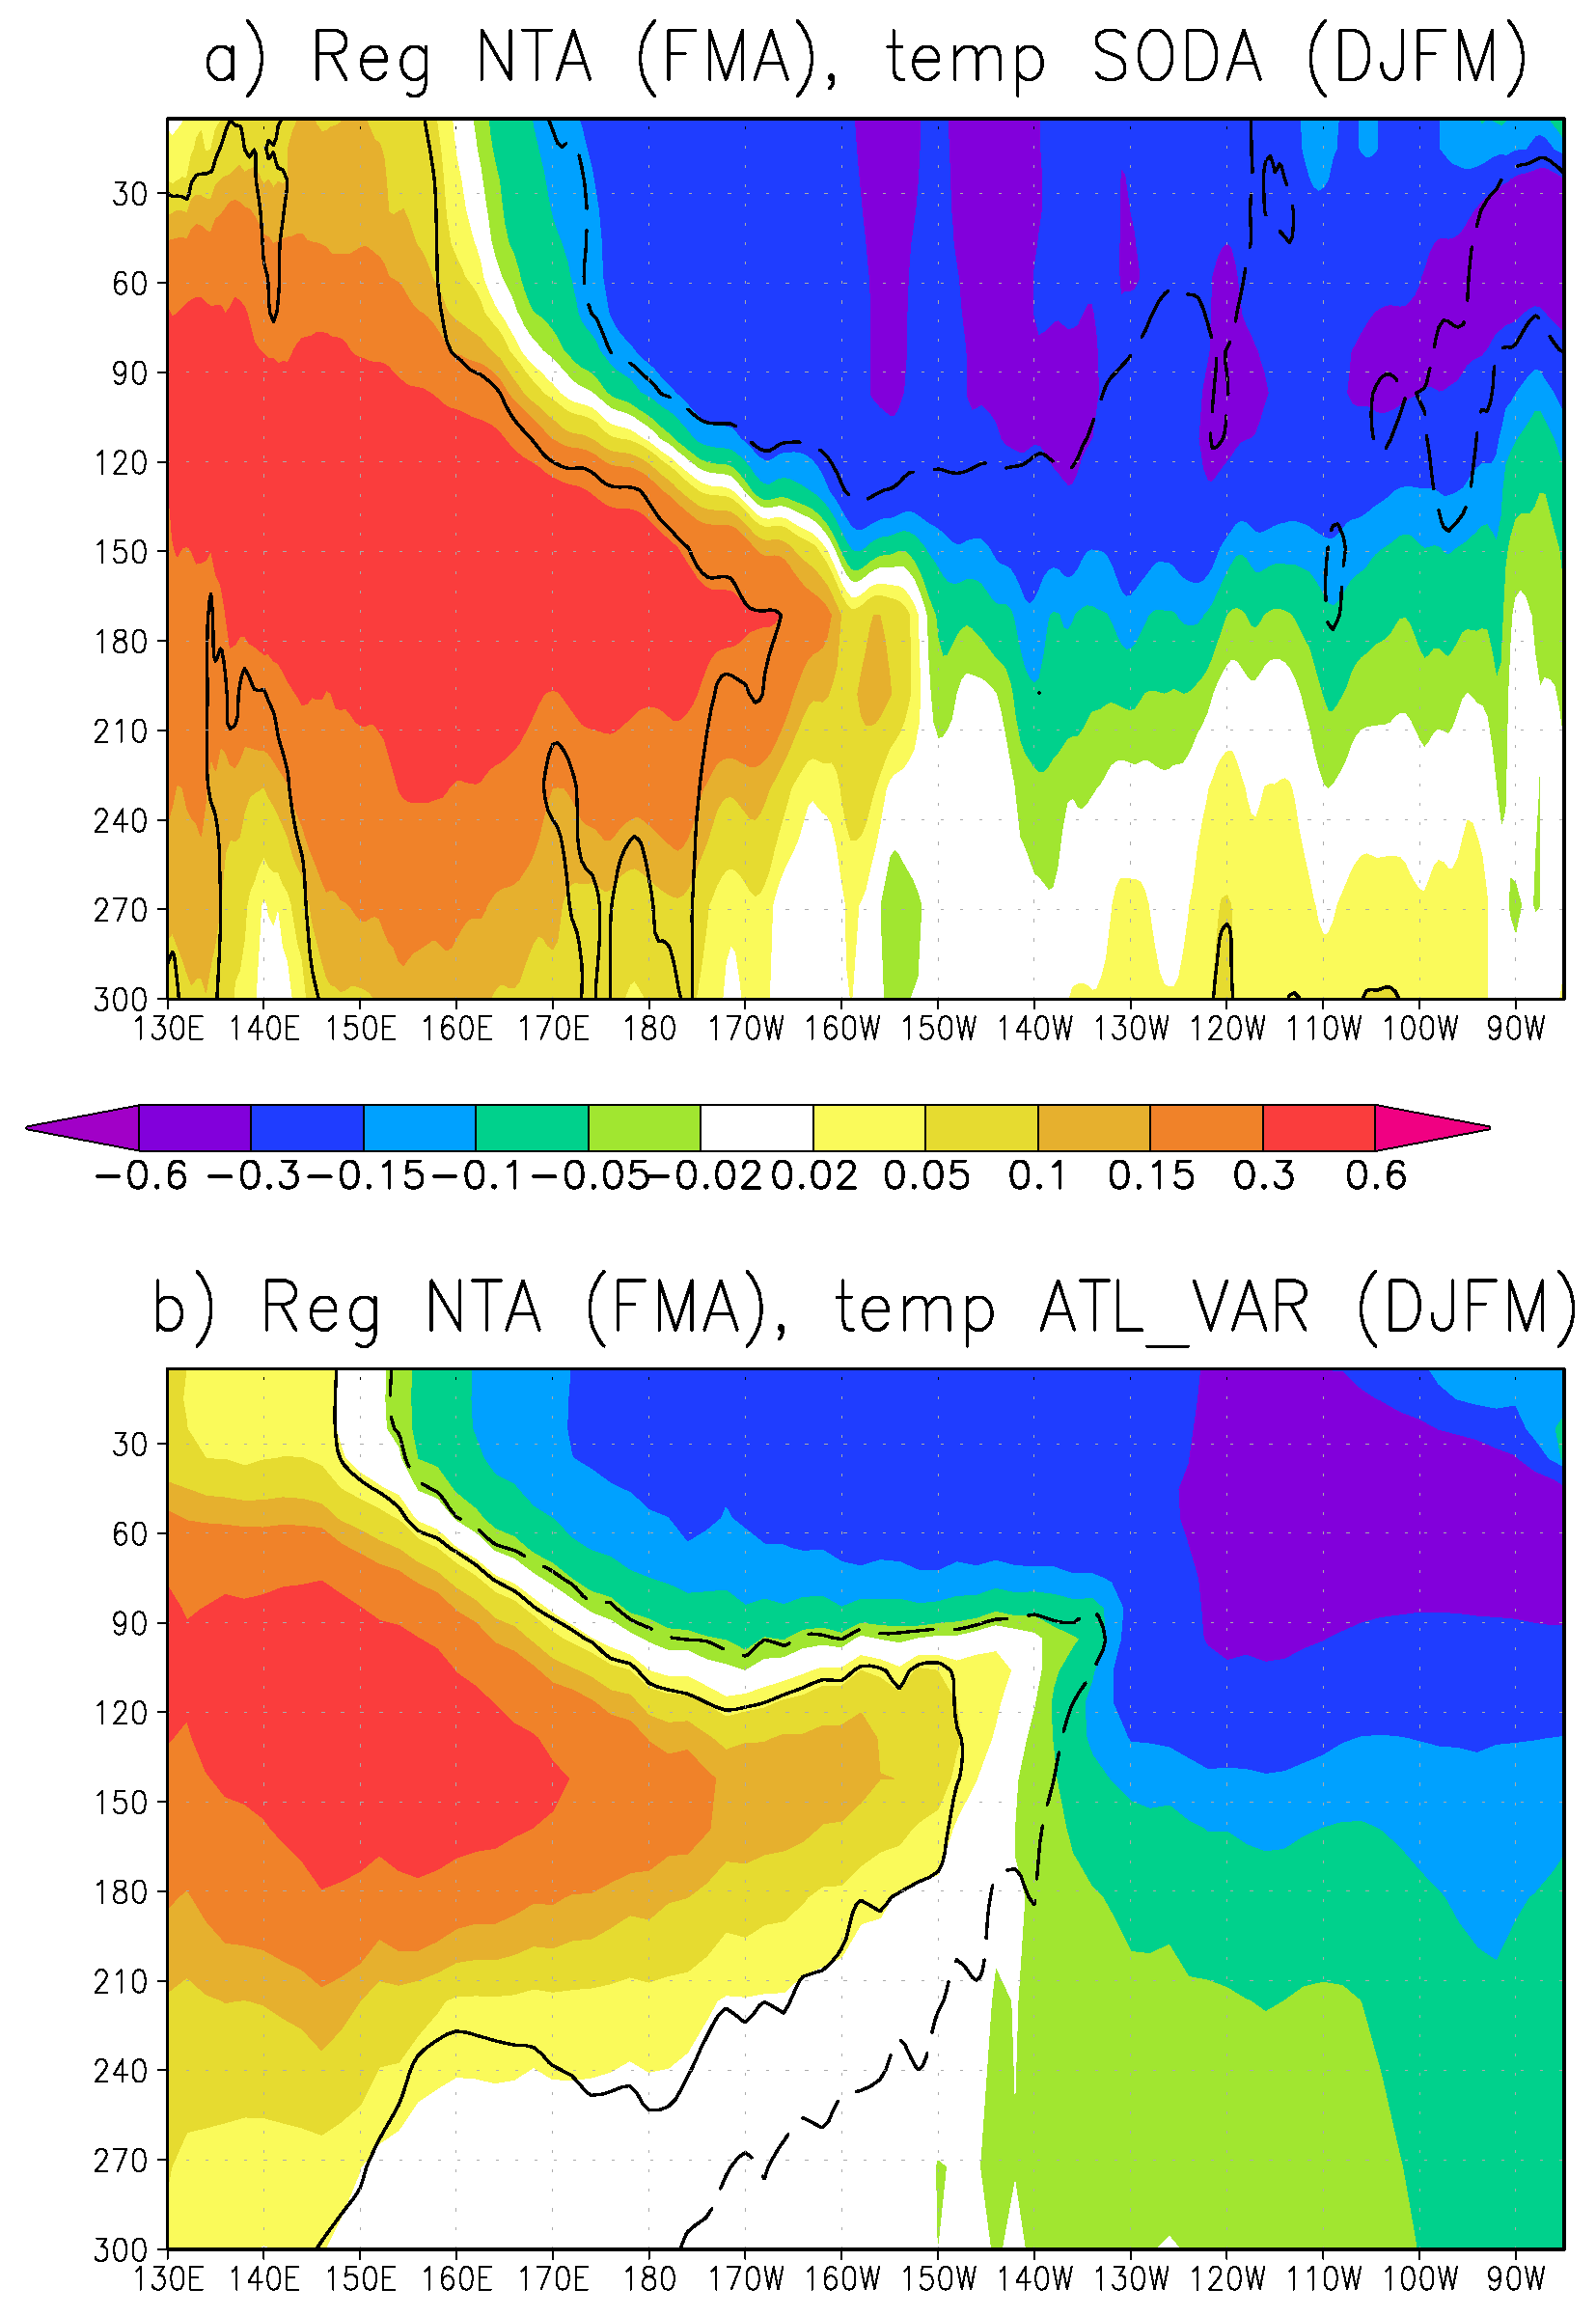
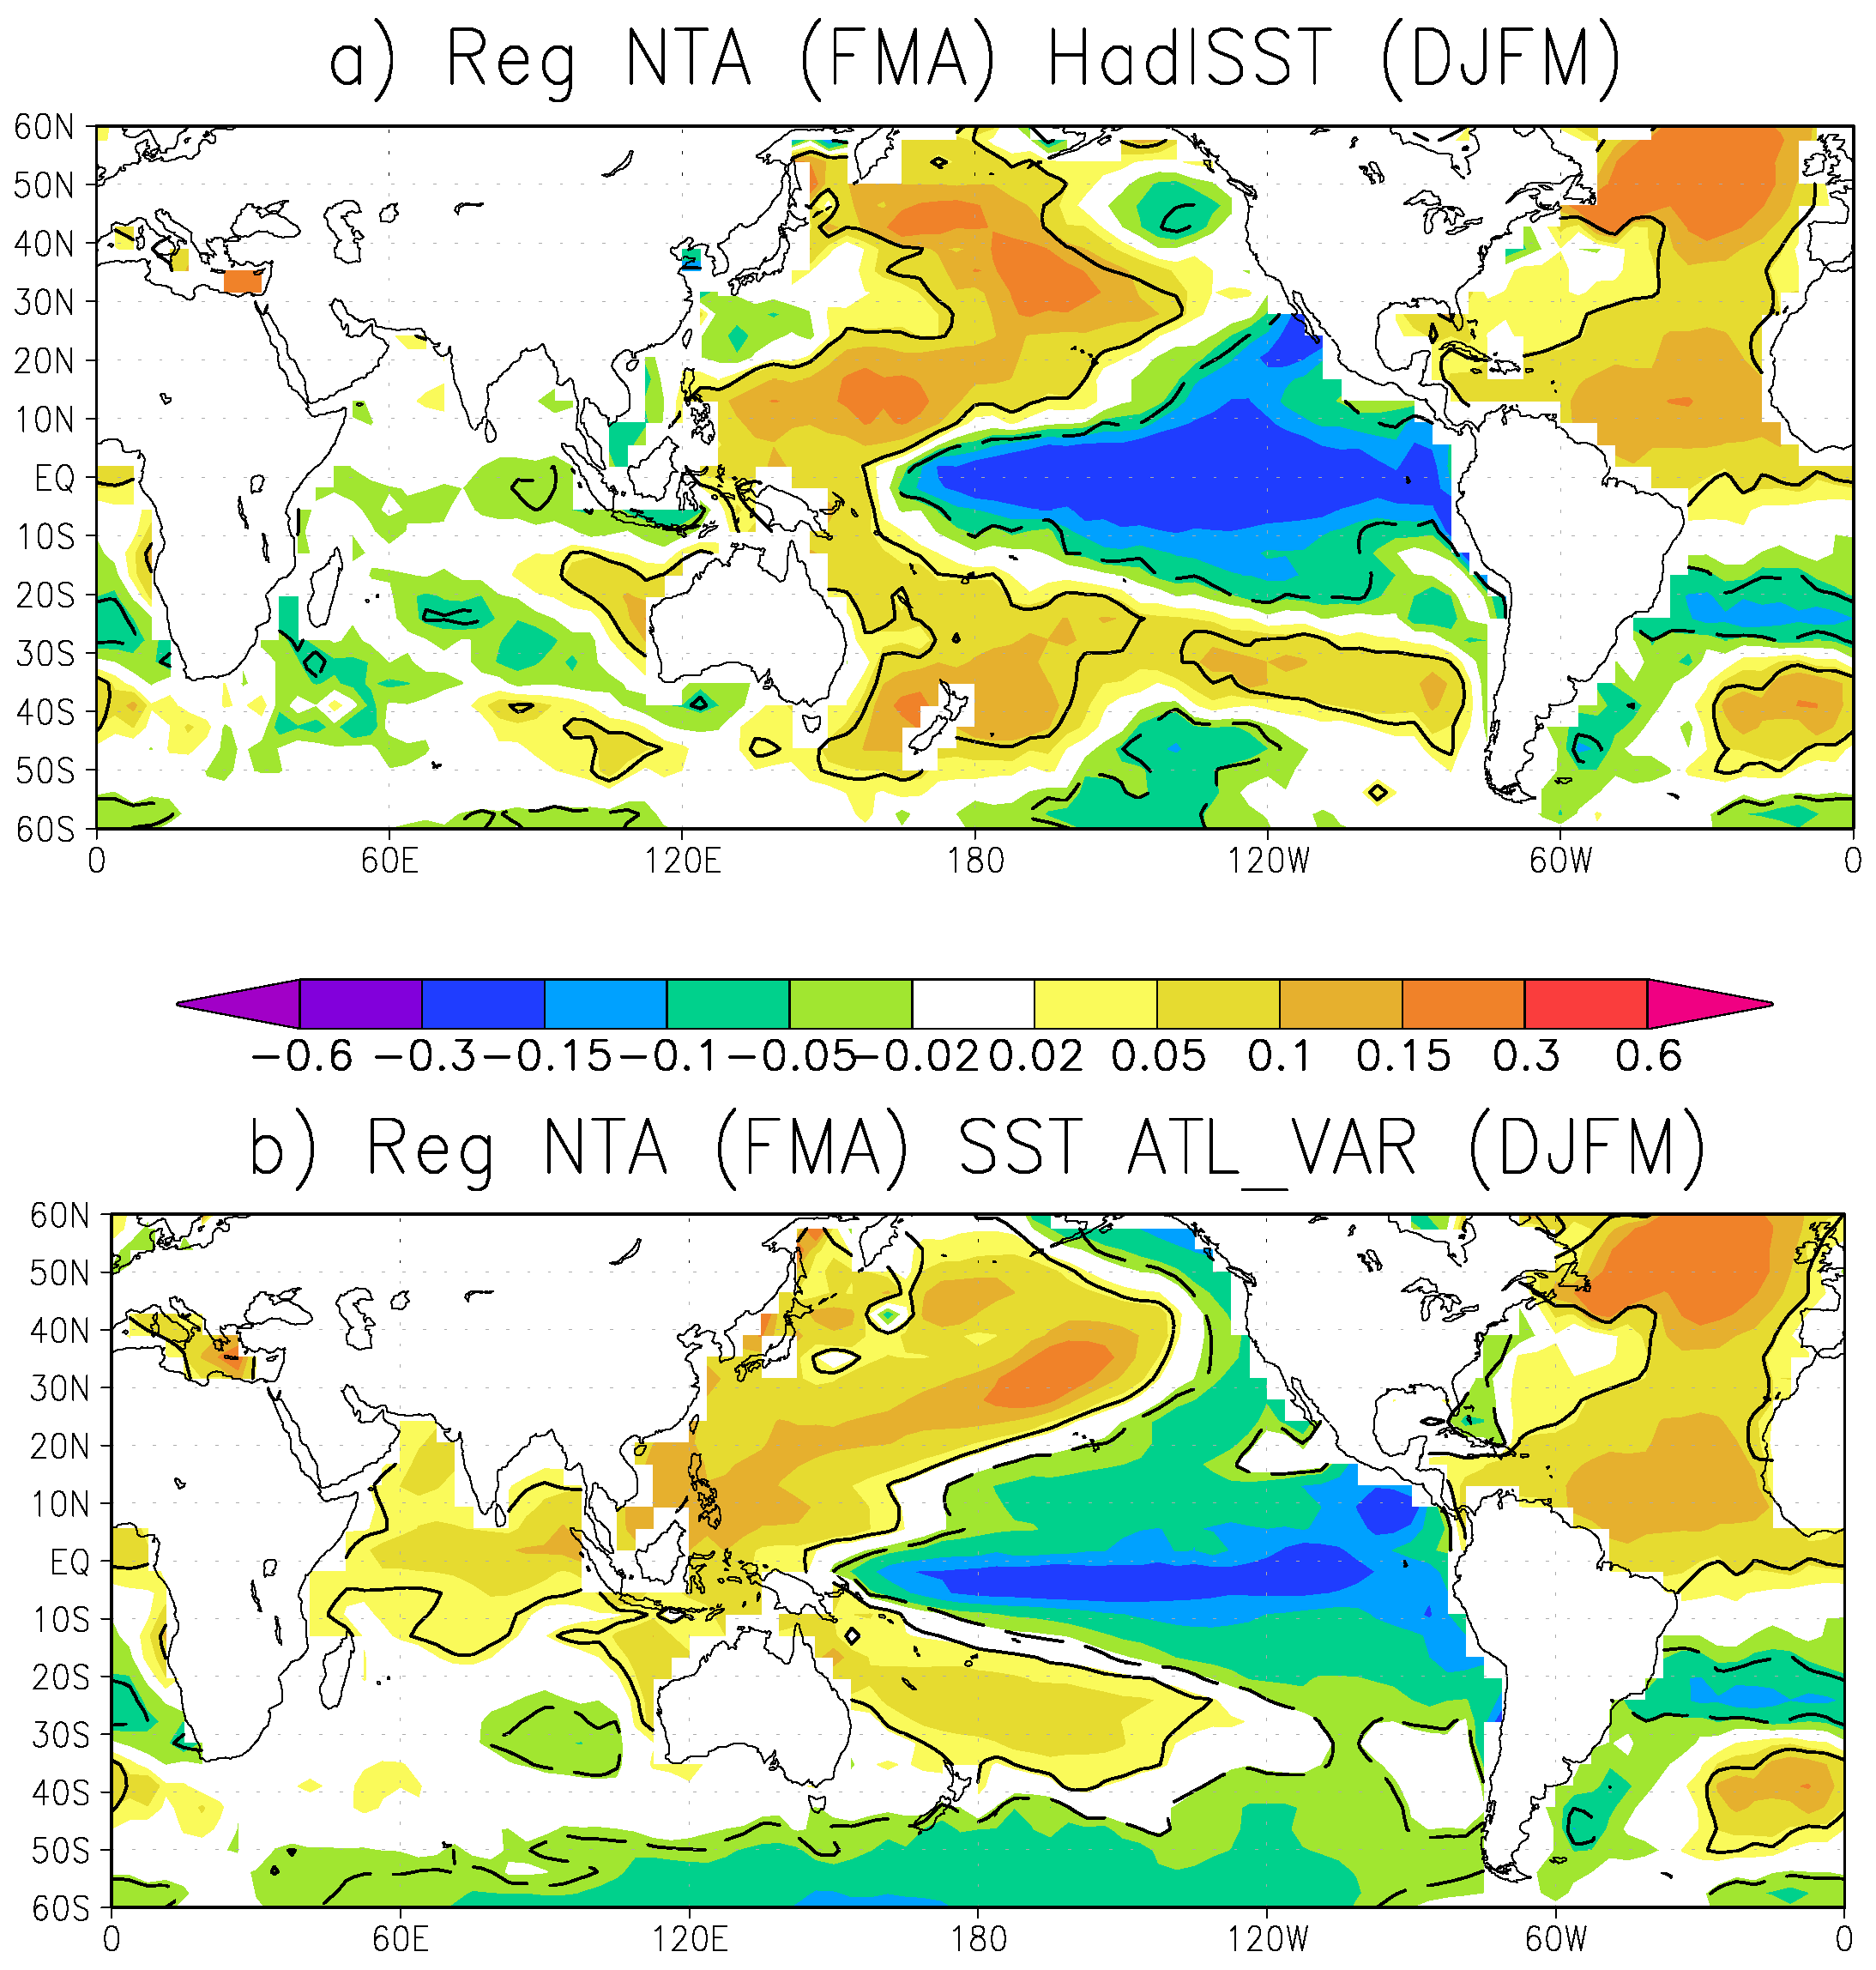
3.1.2. North Tropical Atlantic-Pacific Teleconnection

In [14,15], the teleconnection of the North Tropical Atlantic (NTA) SSTs to the tropical Pacific has been analyzed, and it has been found that SST anomalies in the NTA also favor the development of central Pacific ENSO events. Similar to [14,15], we define an index representative of the North Tropical Atlantic (60 W to 0 , 0 to 20 N, referred to as NTA index).
The season for the NTA index definition is February-to-April (FMA), as suggested by [14], according to the peak of the maximum variability of this subtropical region. The previous boreal winter (December-to-March) Niño3.4 effect is linearly removed from the FMA NTA index. Figure 4, Figure 5 and Figure 6 show similar regressions to those of Figure 1, Figure 2 and Figure 3 but using the NTA index instead of the ATL3 index. The SST, SLP and low-level wind, as well as ocean temperature fields are defined in the DJFM season following the FMA season [14,15]. The results are rather similar to those of Figure 1, Figure 2 and Figure 3 and are indicating a La Niña development, that is consistent with the findings of [14,15]. For ATL_VAR, the response is stronger compared to the response to the Atlantic Niño, and comparable in magnitude to the observed response. However, there is no indication of the response to the NTA being more central Pacific ENSO events compared to the response to the ATL3 as suggested by [14,15], either in observations or the model results. It is possible that that results depend on the exact period analyzed. Overall, however, the studies of [14,15] are confirmed in the respect that a warming (cooling) in the tropical North Atlantic indeed leads to a La Niña (El Niño)-type response in the Pacific region.
The results from the teleconnection with Atl3 and NTA over the tropical Pacific are very similar. Indeed, a better agreement is observed between model and observations in the NTA forcing. The NTA SST pattern is most pronounced in boreal spring ([49]), and the FMA season contains the early part of boreal spring. However, the above results are insensitive to which part of the boreal spring season is used to define the NTA index. For example, results are very similar if the NTA index is defined in the May-to-July season (not shown).
In order to separate the mechanisms, in the following, the results from the AGCM pacemaker experiment ATL_VARAGCM will be used.

3.1.3. Assessment of Forcing from ATL3 and NTA

Ham et al. [15] showed that the ATL3 and NTA produce different impacts in the Pacific region. In order to investigate the possibility that ATL3 and NTA produce diverse initial forcings for La Niña development, we use the experiment ATL_VARAGCM that excludes the coupling in the Indo-Pacific region. In the following, we use contemporaneous regressions or regressions of SLP and low-level winds with smaller time lags than in Figure 2 and Figure 5, because in the ATL_VARAGCM there is no SST feedback that may delay the response in the Indo-Pacific region. Figure 7a shows the JJAS SLP and low-level wind regression onto the JJAS ATL3 index, whereas Figure 7b shows the FMA SLP and low-level wind regressions onto the FMA NTA index. Note that the contour intervals and wind vectors are changed with respect to Figure 2 and Figure 5, in order to better identify the forcing mechanisms in the Pacific region where SST feedbacks are excluded in the ATL_VARAGCM simulation. Figure 7a confirms that the ATL3 is modifying the Walker circulation and leading to a low pressure anomaly in the tropical Atlantic and a high pressure anomaly in the central Pacific, which induces easterly wind anomalies in the central-western Pacific. Moreover, the Atlantic forcing also generates stronger westerly wind anomalies in the eastern equatorial Pacific, which would favor a local warming through the reduction of the evaporation. Eventually, the western Pacific wind anomalies are more efficient in triggering a La Niña-like response than the eastern Pacific ones in forcing an El Niño-like response once the model is coupled. [4,9] have indicated that stronger easterly wind anomalies in the central-western Pacific appear from September-to-December (SOND). The regression of the JJAS ATL3 index onto the SOND SLP and low-level winds in ATL_VARAGCM, reveals that westerly anomalies in the eastern equatorial Pacific weaken, whereas the easterly wind anomalies in the central-western Pacific strengthen (Figure 8), confirming the importance of the anomalous winds in the western side to trigger the ENSO phenomena forced by the Atlantic. The results from ATL_VARAGCM are also in agreement with [48], who found that the Atlantic Niño was able to alter the Atlantic-Pacific Walker circulation from July onwards, when the maximum anomalous divergence produced by the Atlantic Niño is located in the Caribbean region, over the climatological upward branch of the Atlantic-Pacific Walker cell.
The NTA SSTs in FMA induce also easterly wind anomalies in the central-western Pacific but displaced south of the equator, whereas the stronger westerly wind anomalies in the eastern Pacific are absent. The easterly surface wind anomalies could be effective in triggering La Niña development a few month later in the coupled ATL_VAR simulations.
Strong westerly anomalies in the eastern subtropical and tropical North Pacific, as suggested by the work of [14,15], are not seen in our AGCM simulations. This suggests that the mechanisms posited by [14,15] may not be at work in our simulations. Further research is needed to clarify this point.
The strong equatorial westerly anomalies in response to ATL3 which are absent in the response to NTA SST anomalies may explain why in the coupled ATL_VAR simulations the response to the ATL3 is weaker compared to the NTA. These differences in the instantaneous ATL_VARAGCM responses to ATL3 and NTA depend also on the fact that these indices are defined in different seasons. For example, the response to ATL3 in JJAS shows substantial anomalies in the Indian Ocean region north of the equator in correspondence with the boreal monsoon, whereas the response to NTA in FMA is strongest south of the equator in the Indian Ocean. Such responses could be model dependent, and therefore further research is needed to investigate such model dependencies.

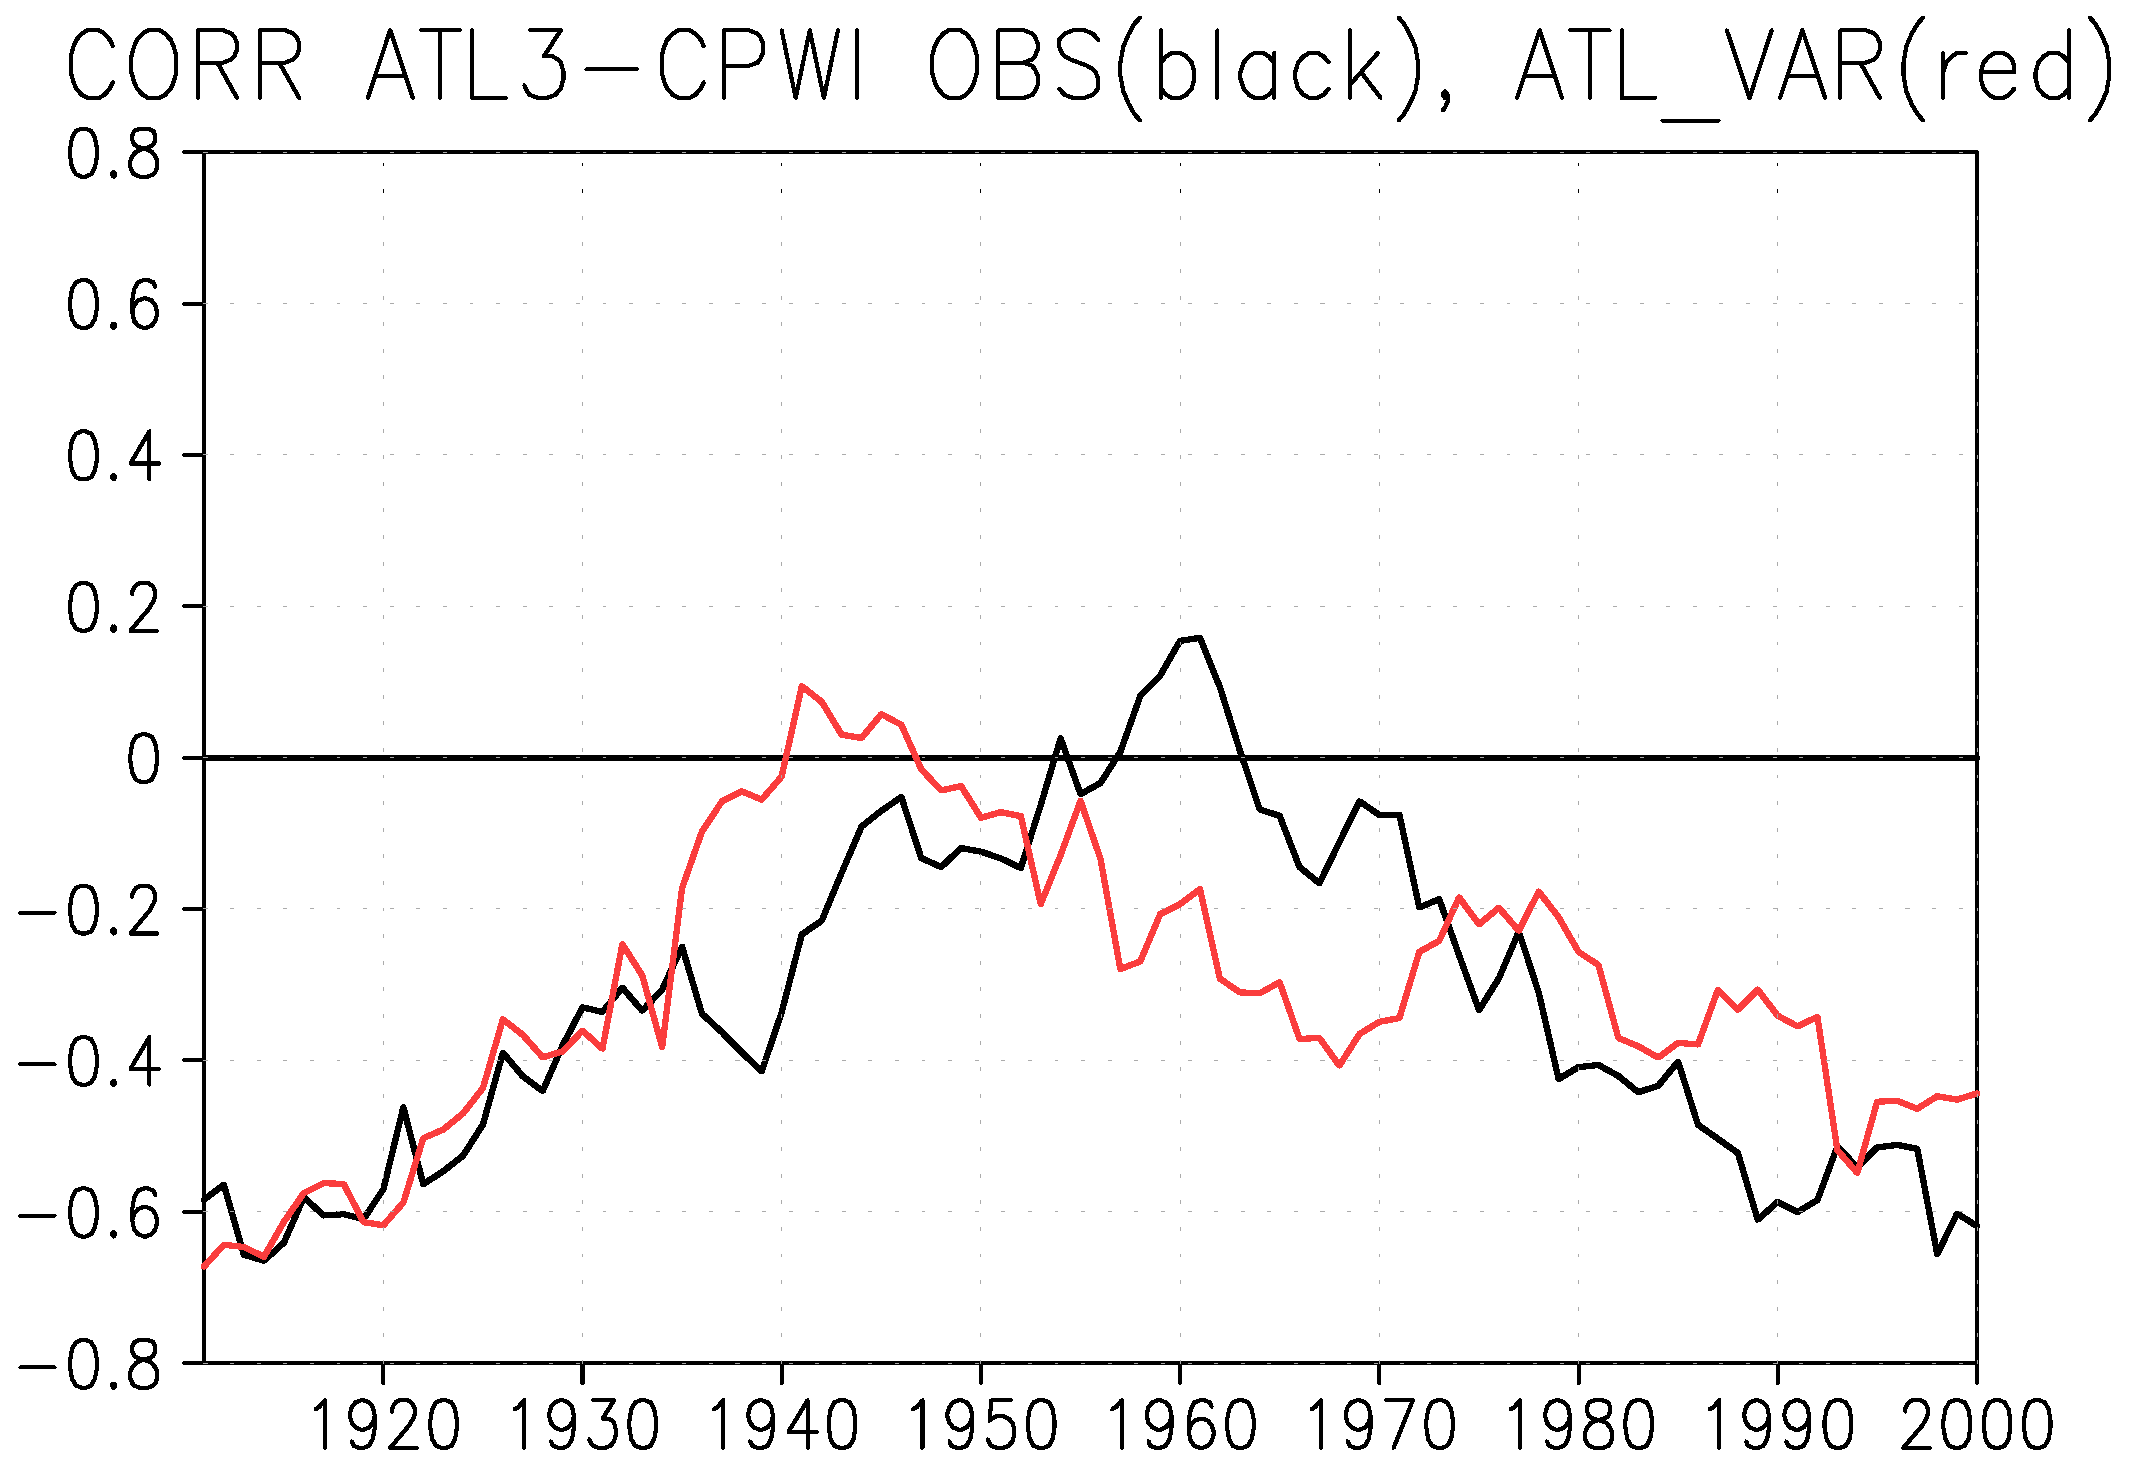
3.1.4. Multidecadal Variations of the Interannual Atlantic-Pacific Connection

Figure 1 has been derived using data for the whole 20th century and shows a statistically significant relationship between the tropical Atlantic and Pacific SST anomalies. However, as stated in the introduction, previous studies have indicated that the Atlantic-Pacific connection is modulated at multidecadal time-scales, being stronger at the beginning and at the end of the 20th century ([4,10,11]), coinciding with negative phases of the Atlantic Multidecadal Oscillation (AMO), which suggests the possible role of the background state in modulating the inter-basin connection. On the other hand, Losada et al. [50] have shown that the decadal changes in the spatial structure of the Atlantic Niño (Niña) also play a role in the decadal variations of the Atlantic-Pacific connection, favoring the inter-basin teleconnection after the 1970s. Here, we provide a brief analysis of the decadal variations on the inter-annual Atlantic Niño-Pacific connection by making use of the results from [11], who showed that the correlation between the boreal summer ATL3 index and the summer central-western equatorial Pacific zonal wind stress exhibits strong decadal variations, with strong relationships in the beginning and end of the 20th century and a weak relationship in the middle of the 20th century. Multidecadal variations in the ITCZ Pacific variability were already noticed by previous authors without considering that the Atlantic could be the forcing (e.g., [51]). Moreover, we have demonstrated using the experiment ATL_VARAGCM that indeed in the central-western Pacific low-level winds in boreal summer yield a plausible forcing for initiating the Bjerknes feedback in the Pacific region, and since low-level winds are closely related to wind-stress, our analysis will be based on this variable.
Figure 9 shows the 21-years running correlations between the ATL3 index and an equatorial central Pacific wind-stress index (CPWI) as in [22] averaged over the region 160 E to 190 E, 5 S to 5 N for observations (black curve) and ATL_VAR (red curve). Overall, the correlations for the whole period (1901 to 2010) are negative, as expected from the mechanism identified in the previous sections (–0.35 for observations and –0.36 for ATL_VAR, both statistically significant at the 95% confidence level). However, as suggested by [4,10,11], there are strong decadal variations in both the observations and ATL_VAR. In addition, both observations and ATL_VAR show strongest correlations at the beginning and the end of the 20th century, and overall weaker correlations in the middle of the century, although the phasing is somewhat different between observations and the model. Overall, the results from this analysis are consistent with the recent work by [4,10,11].

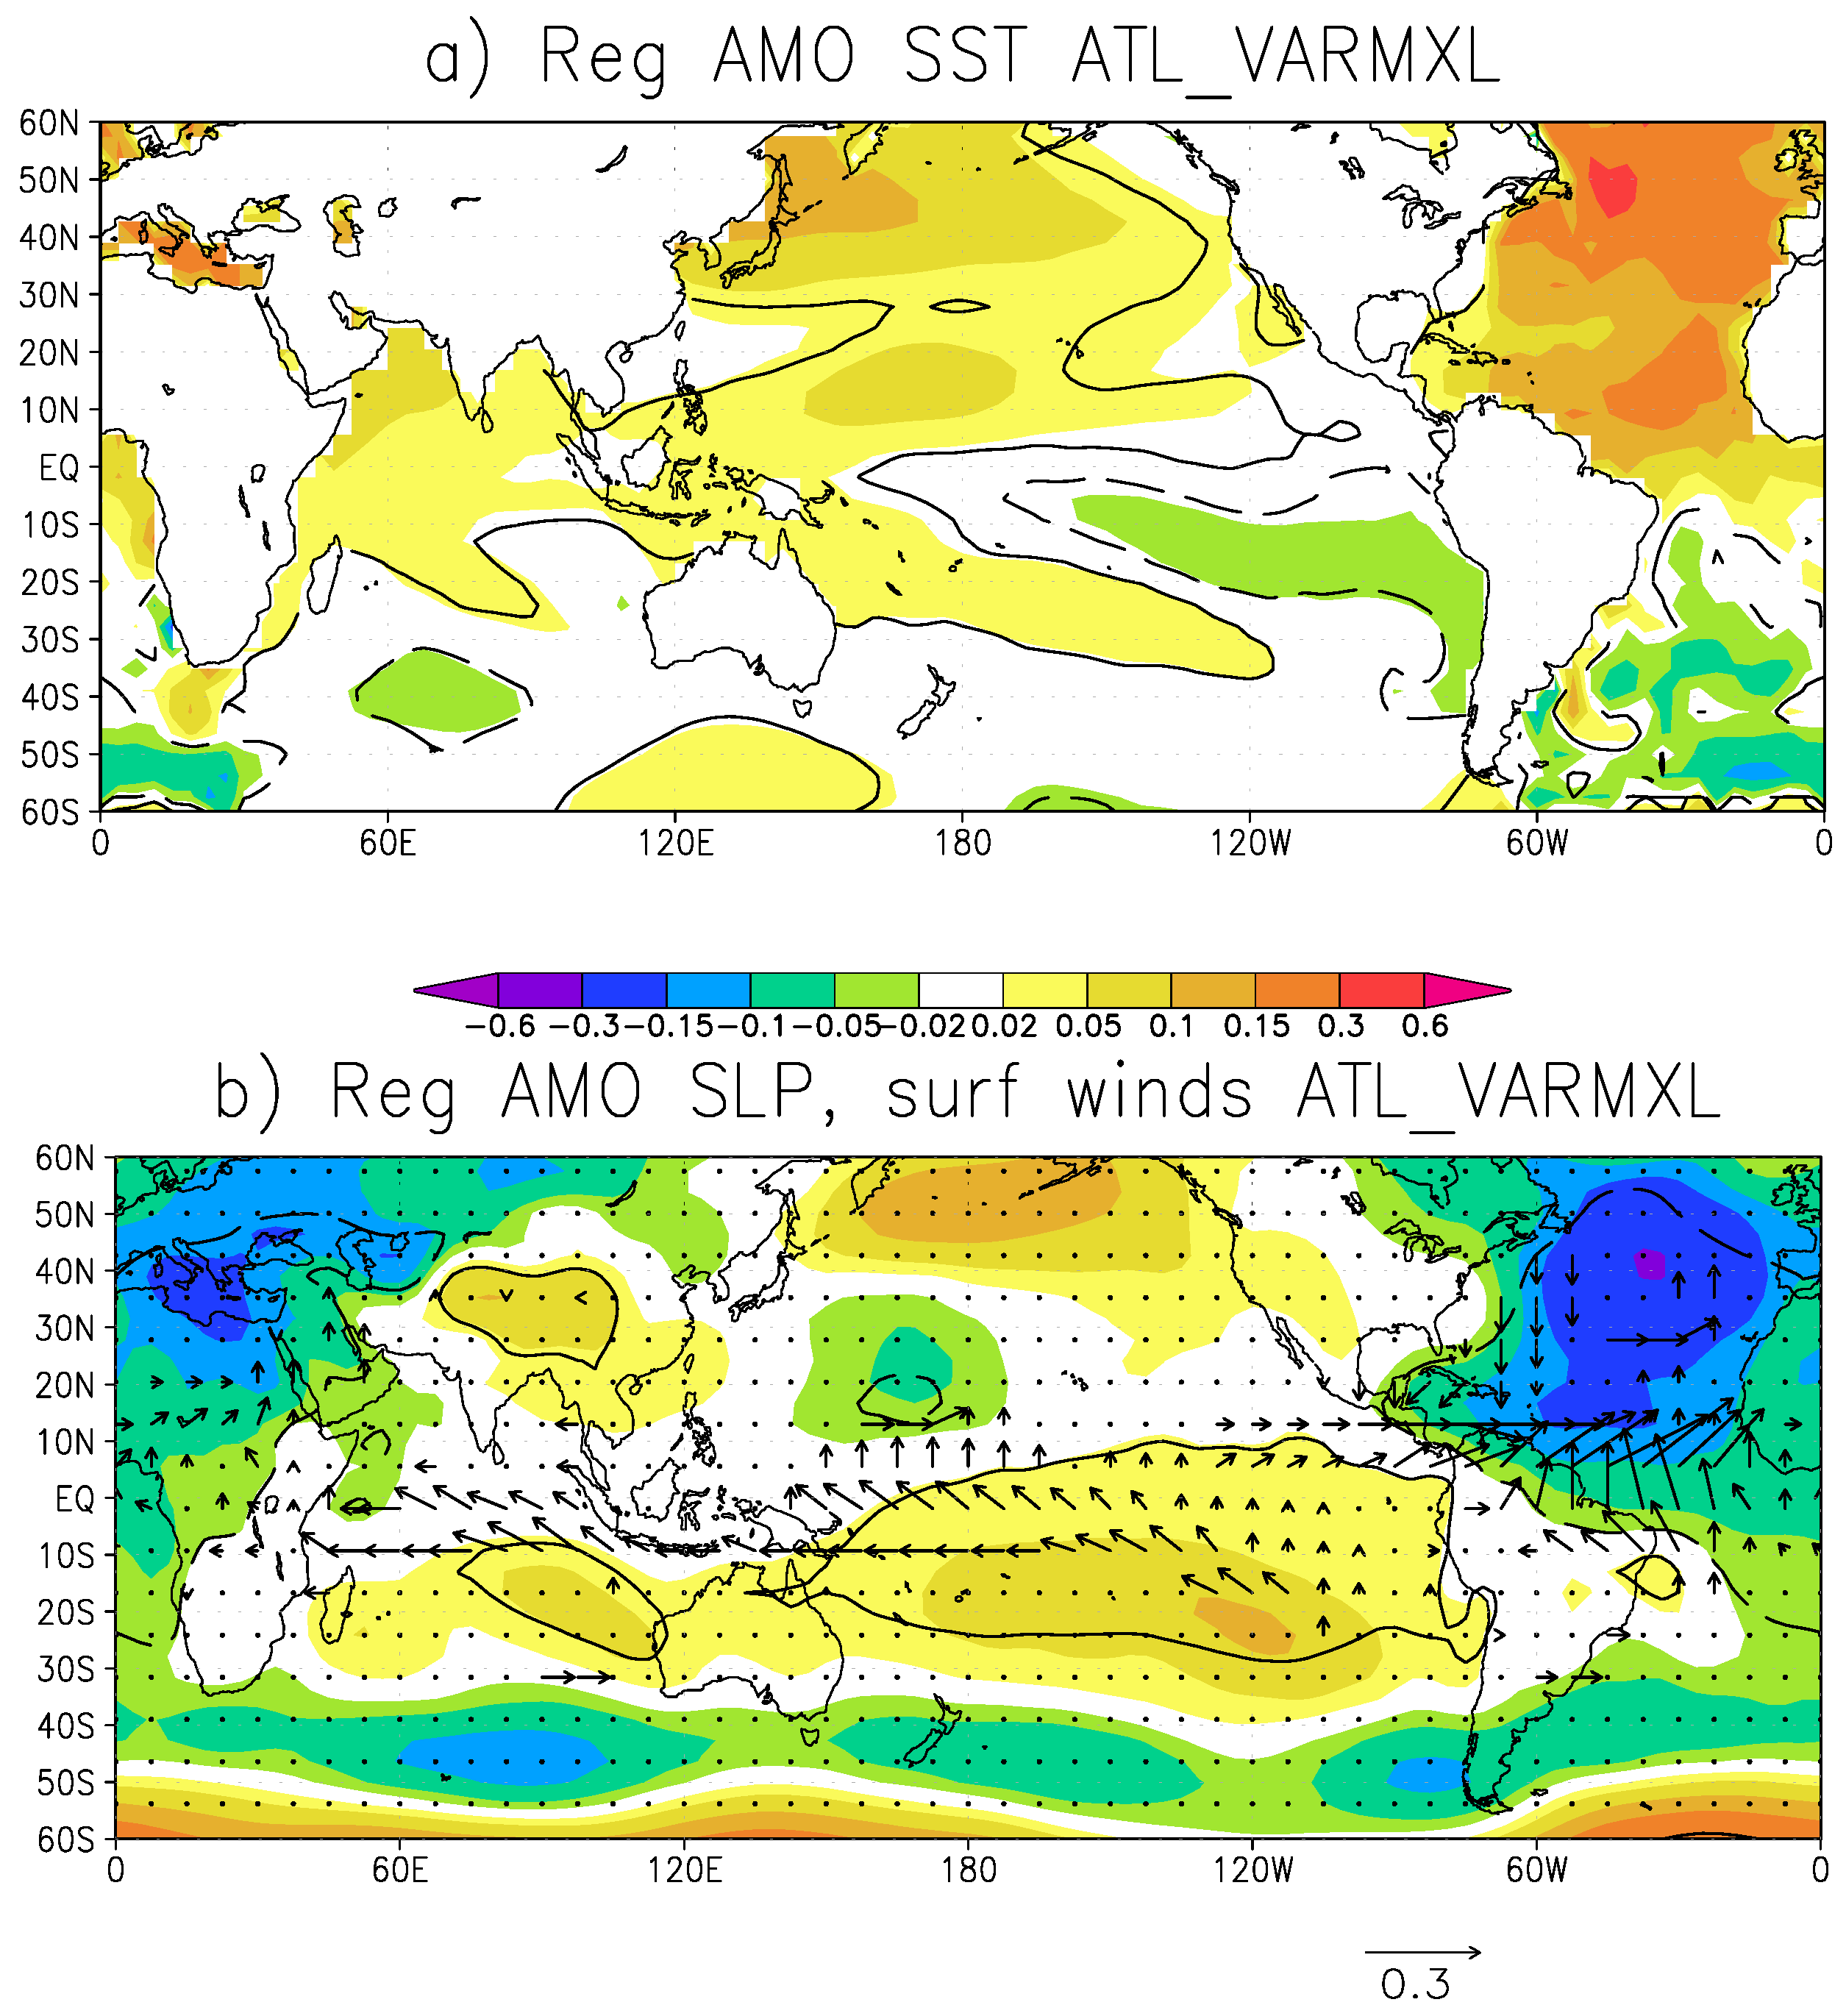
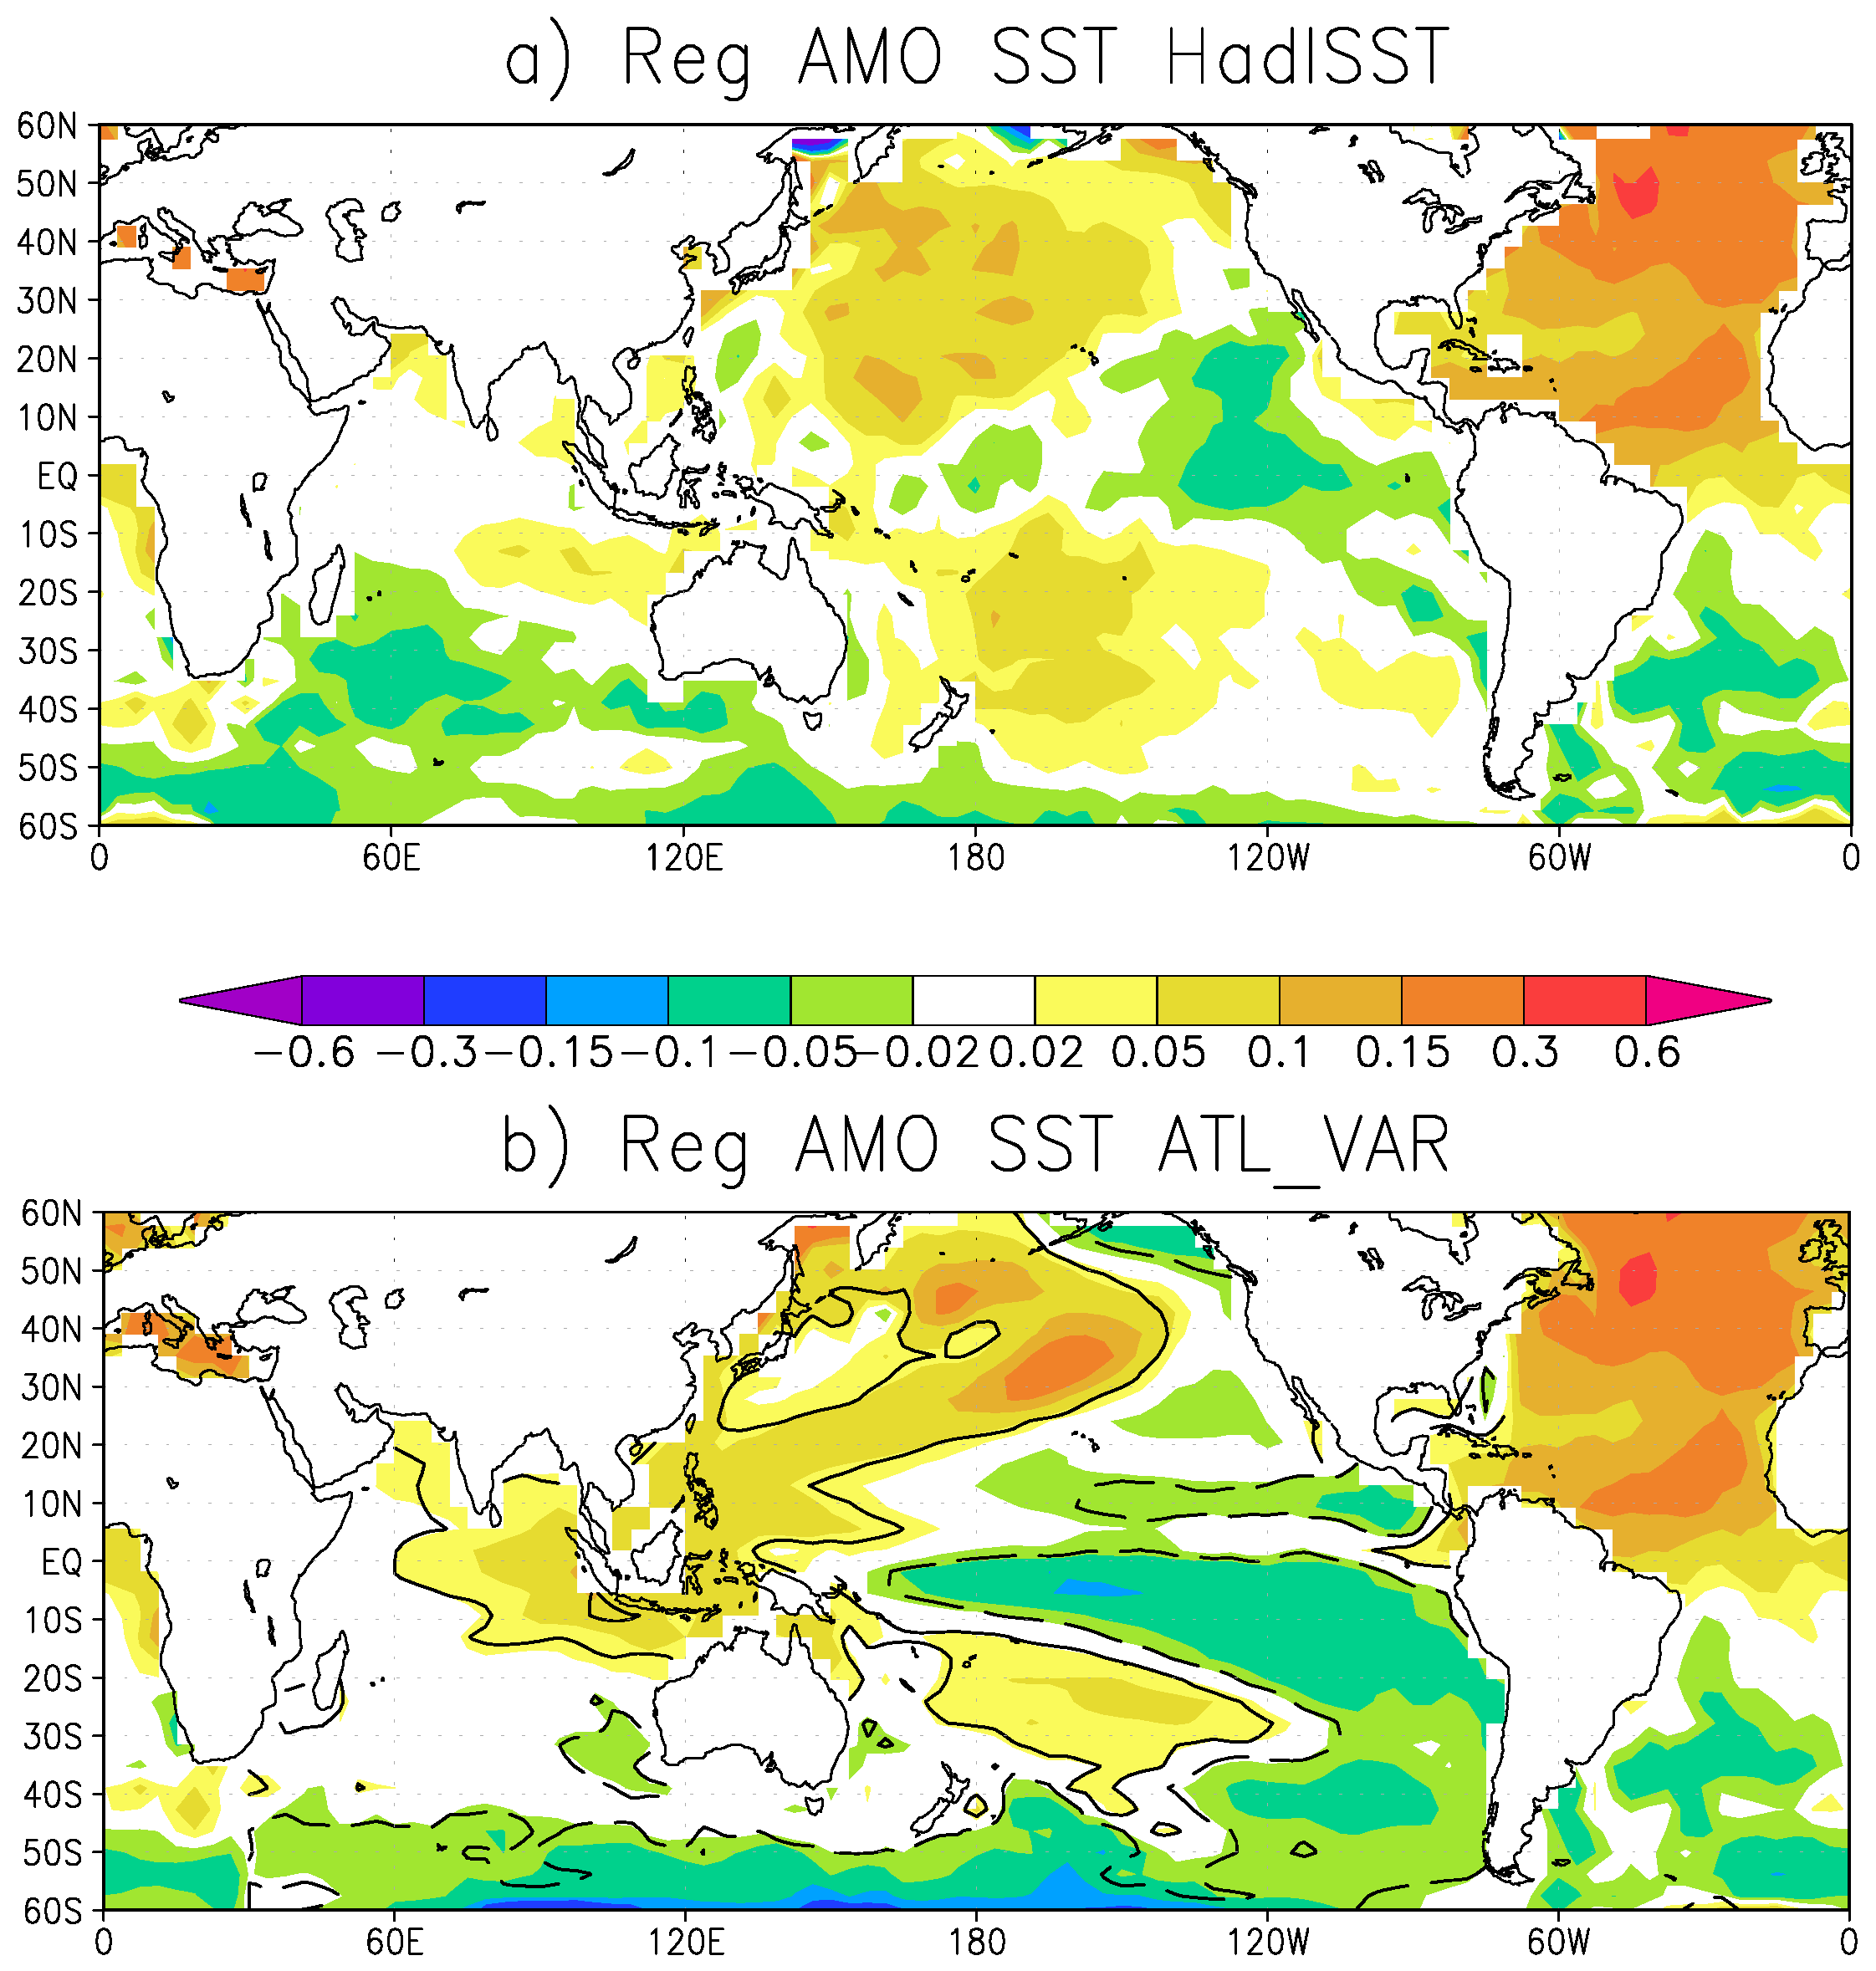
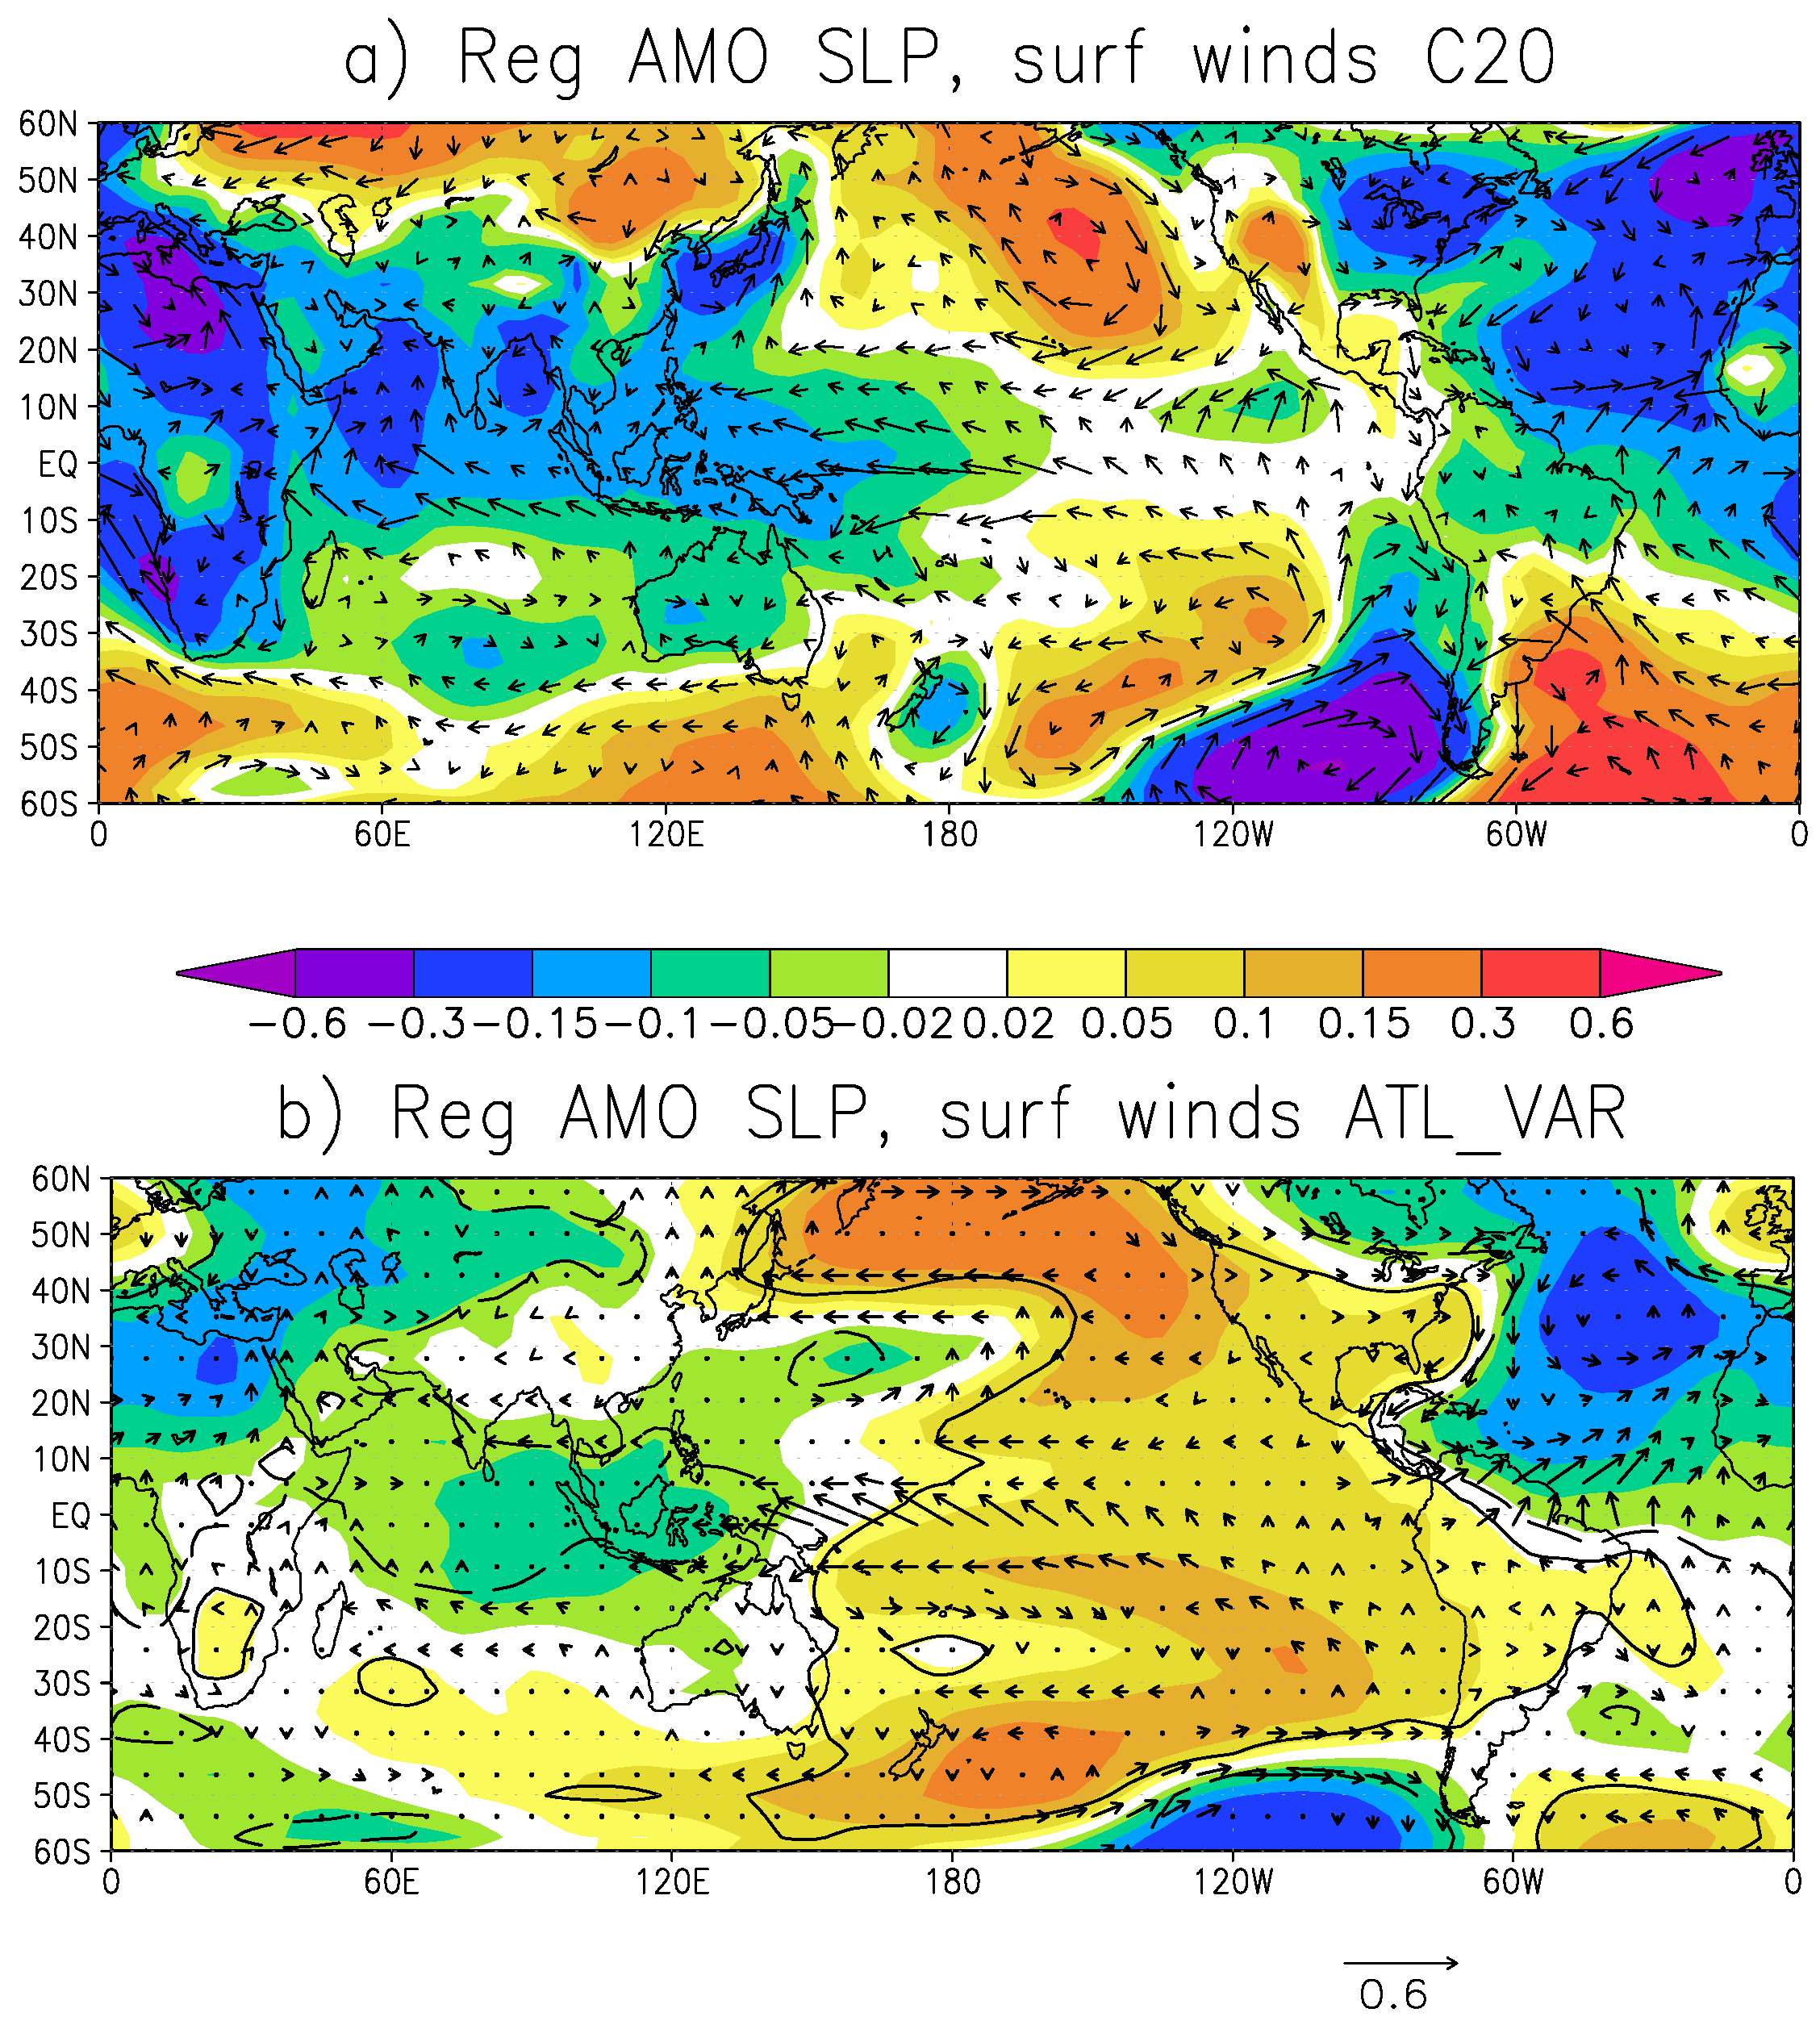
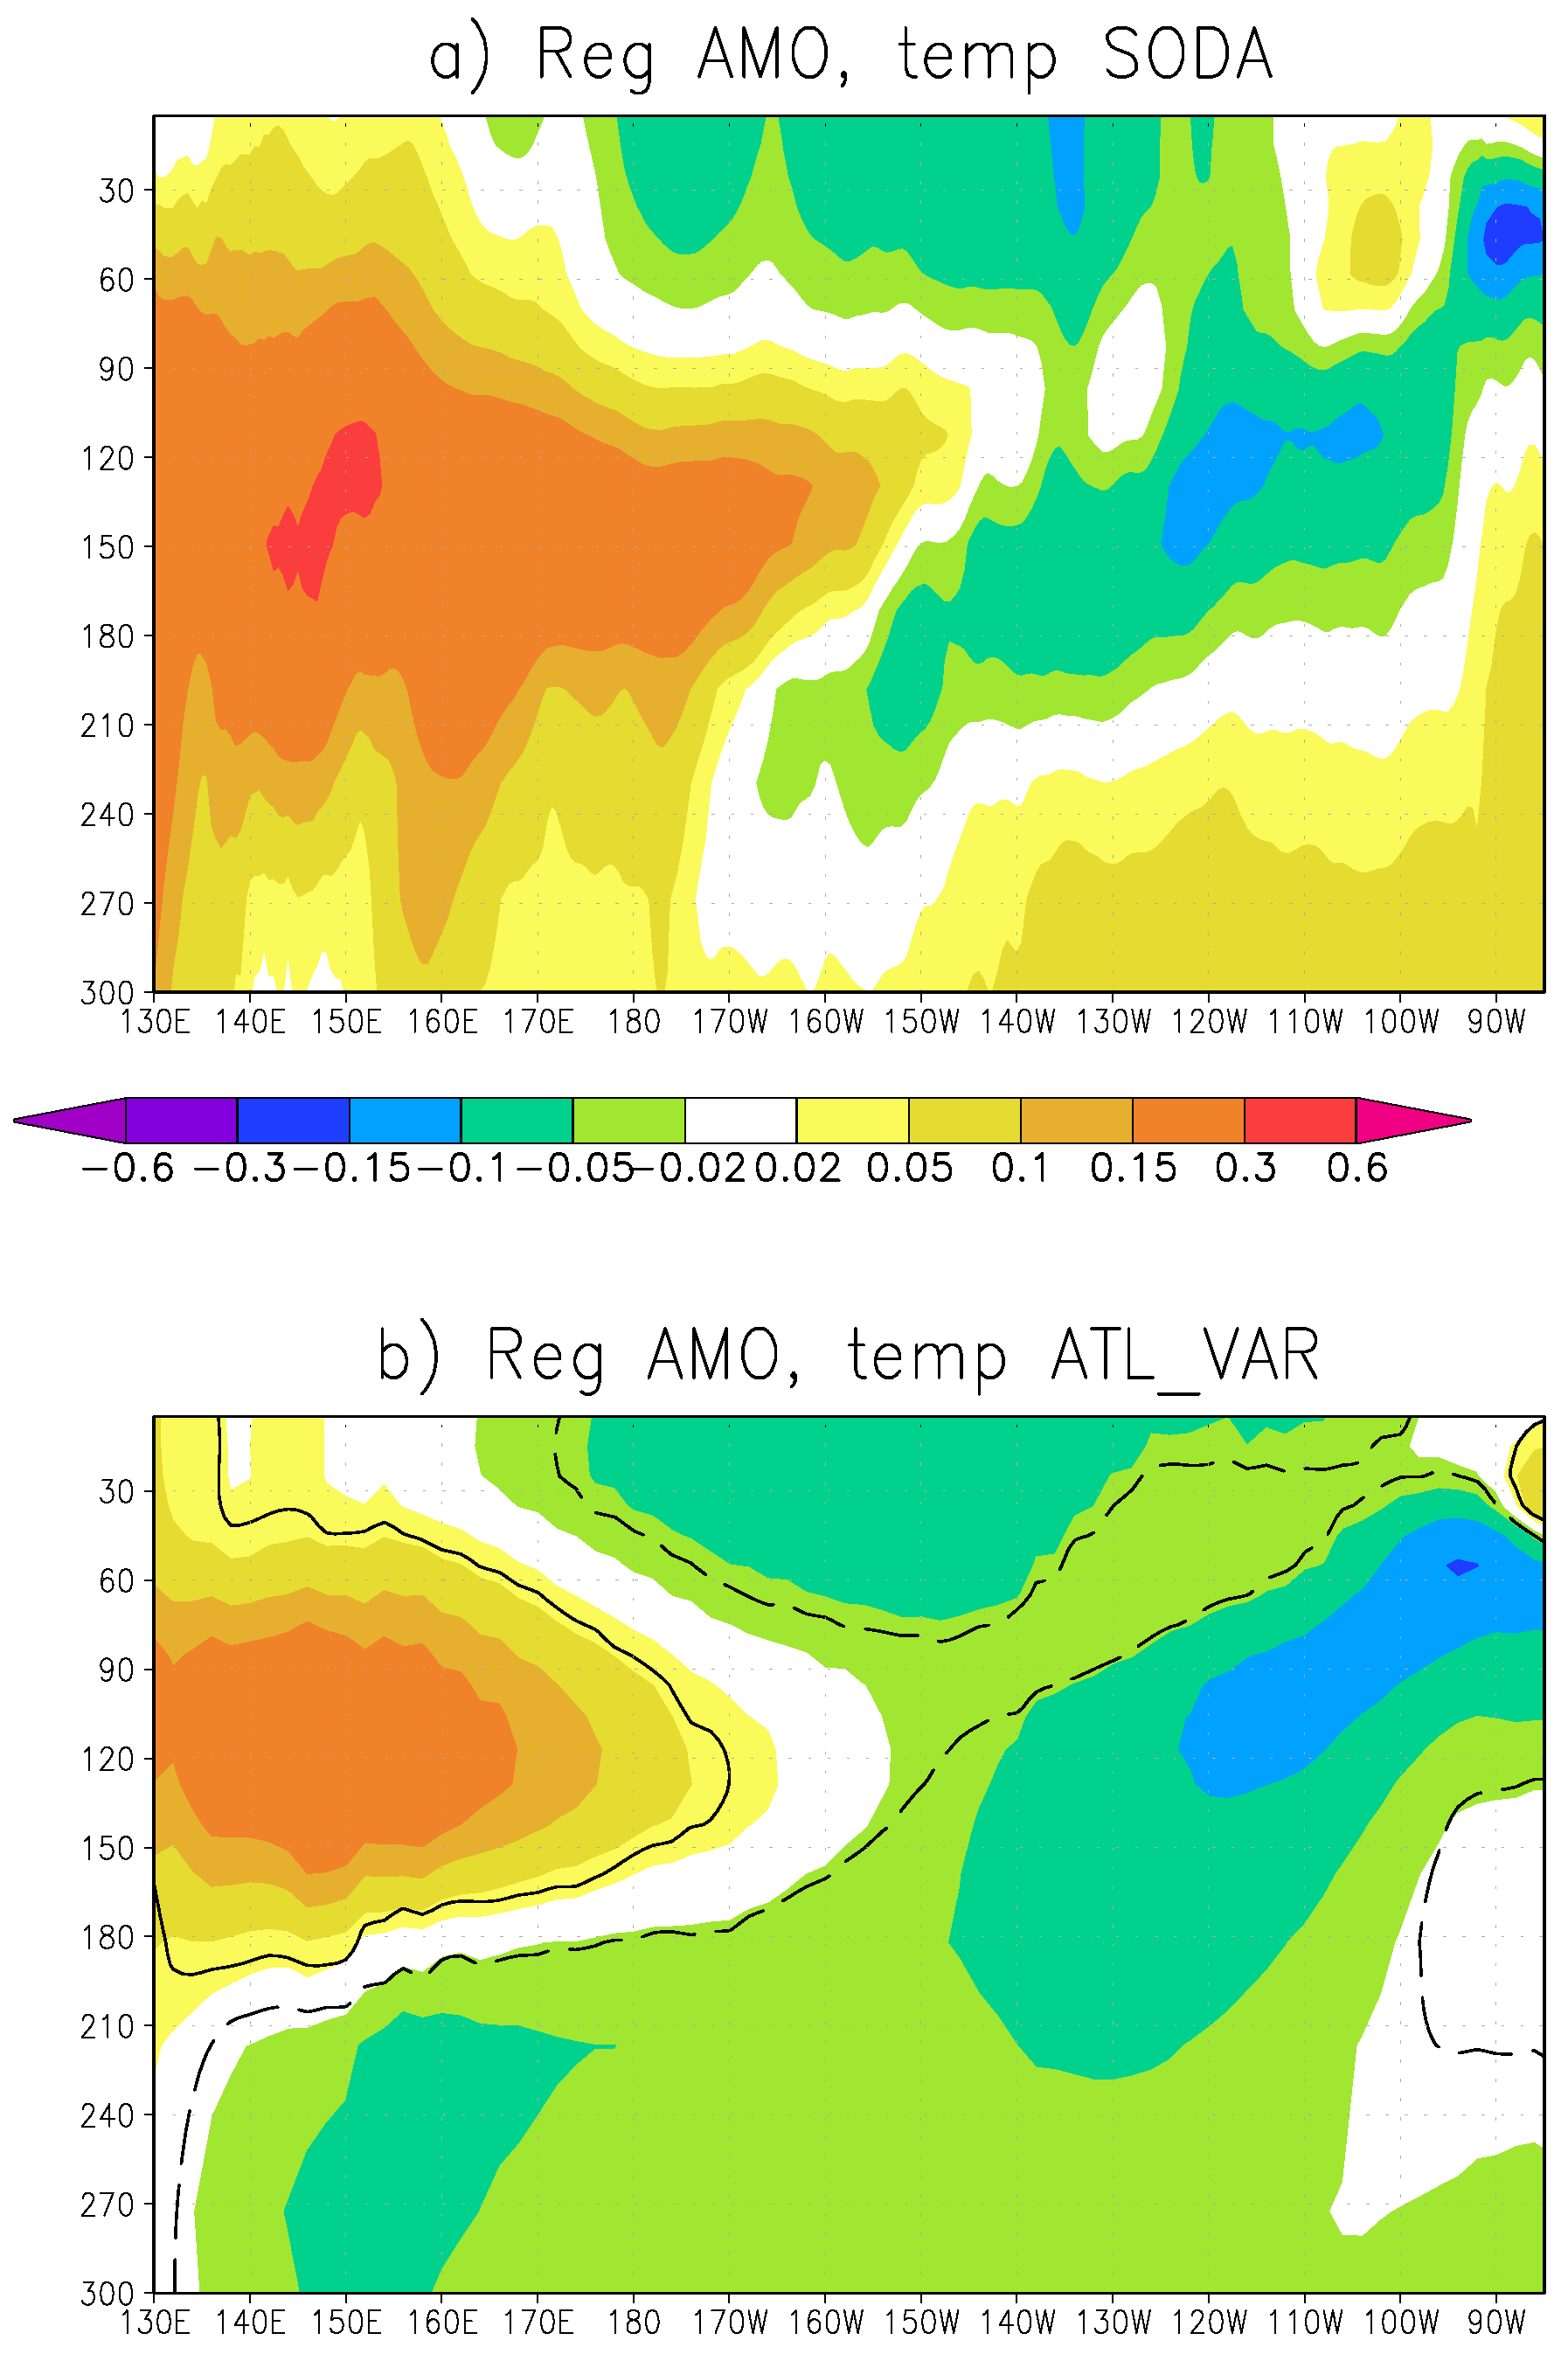
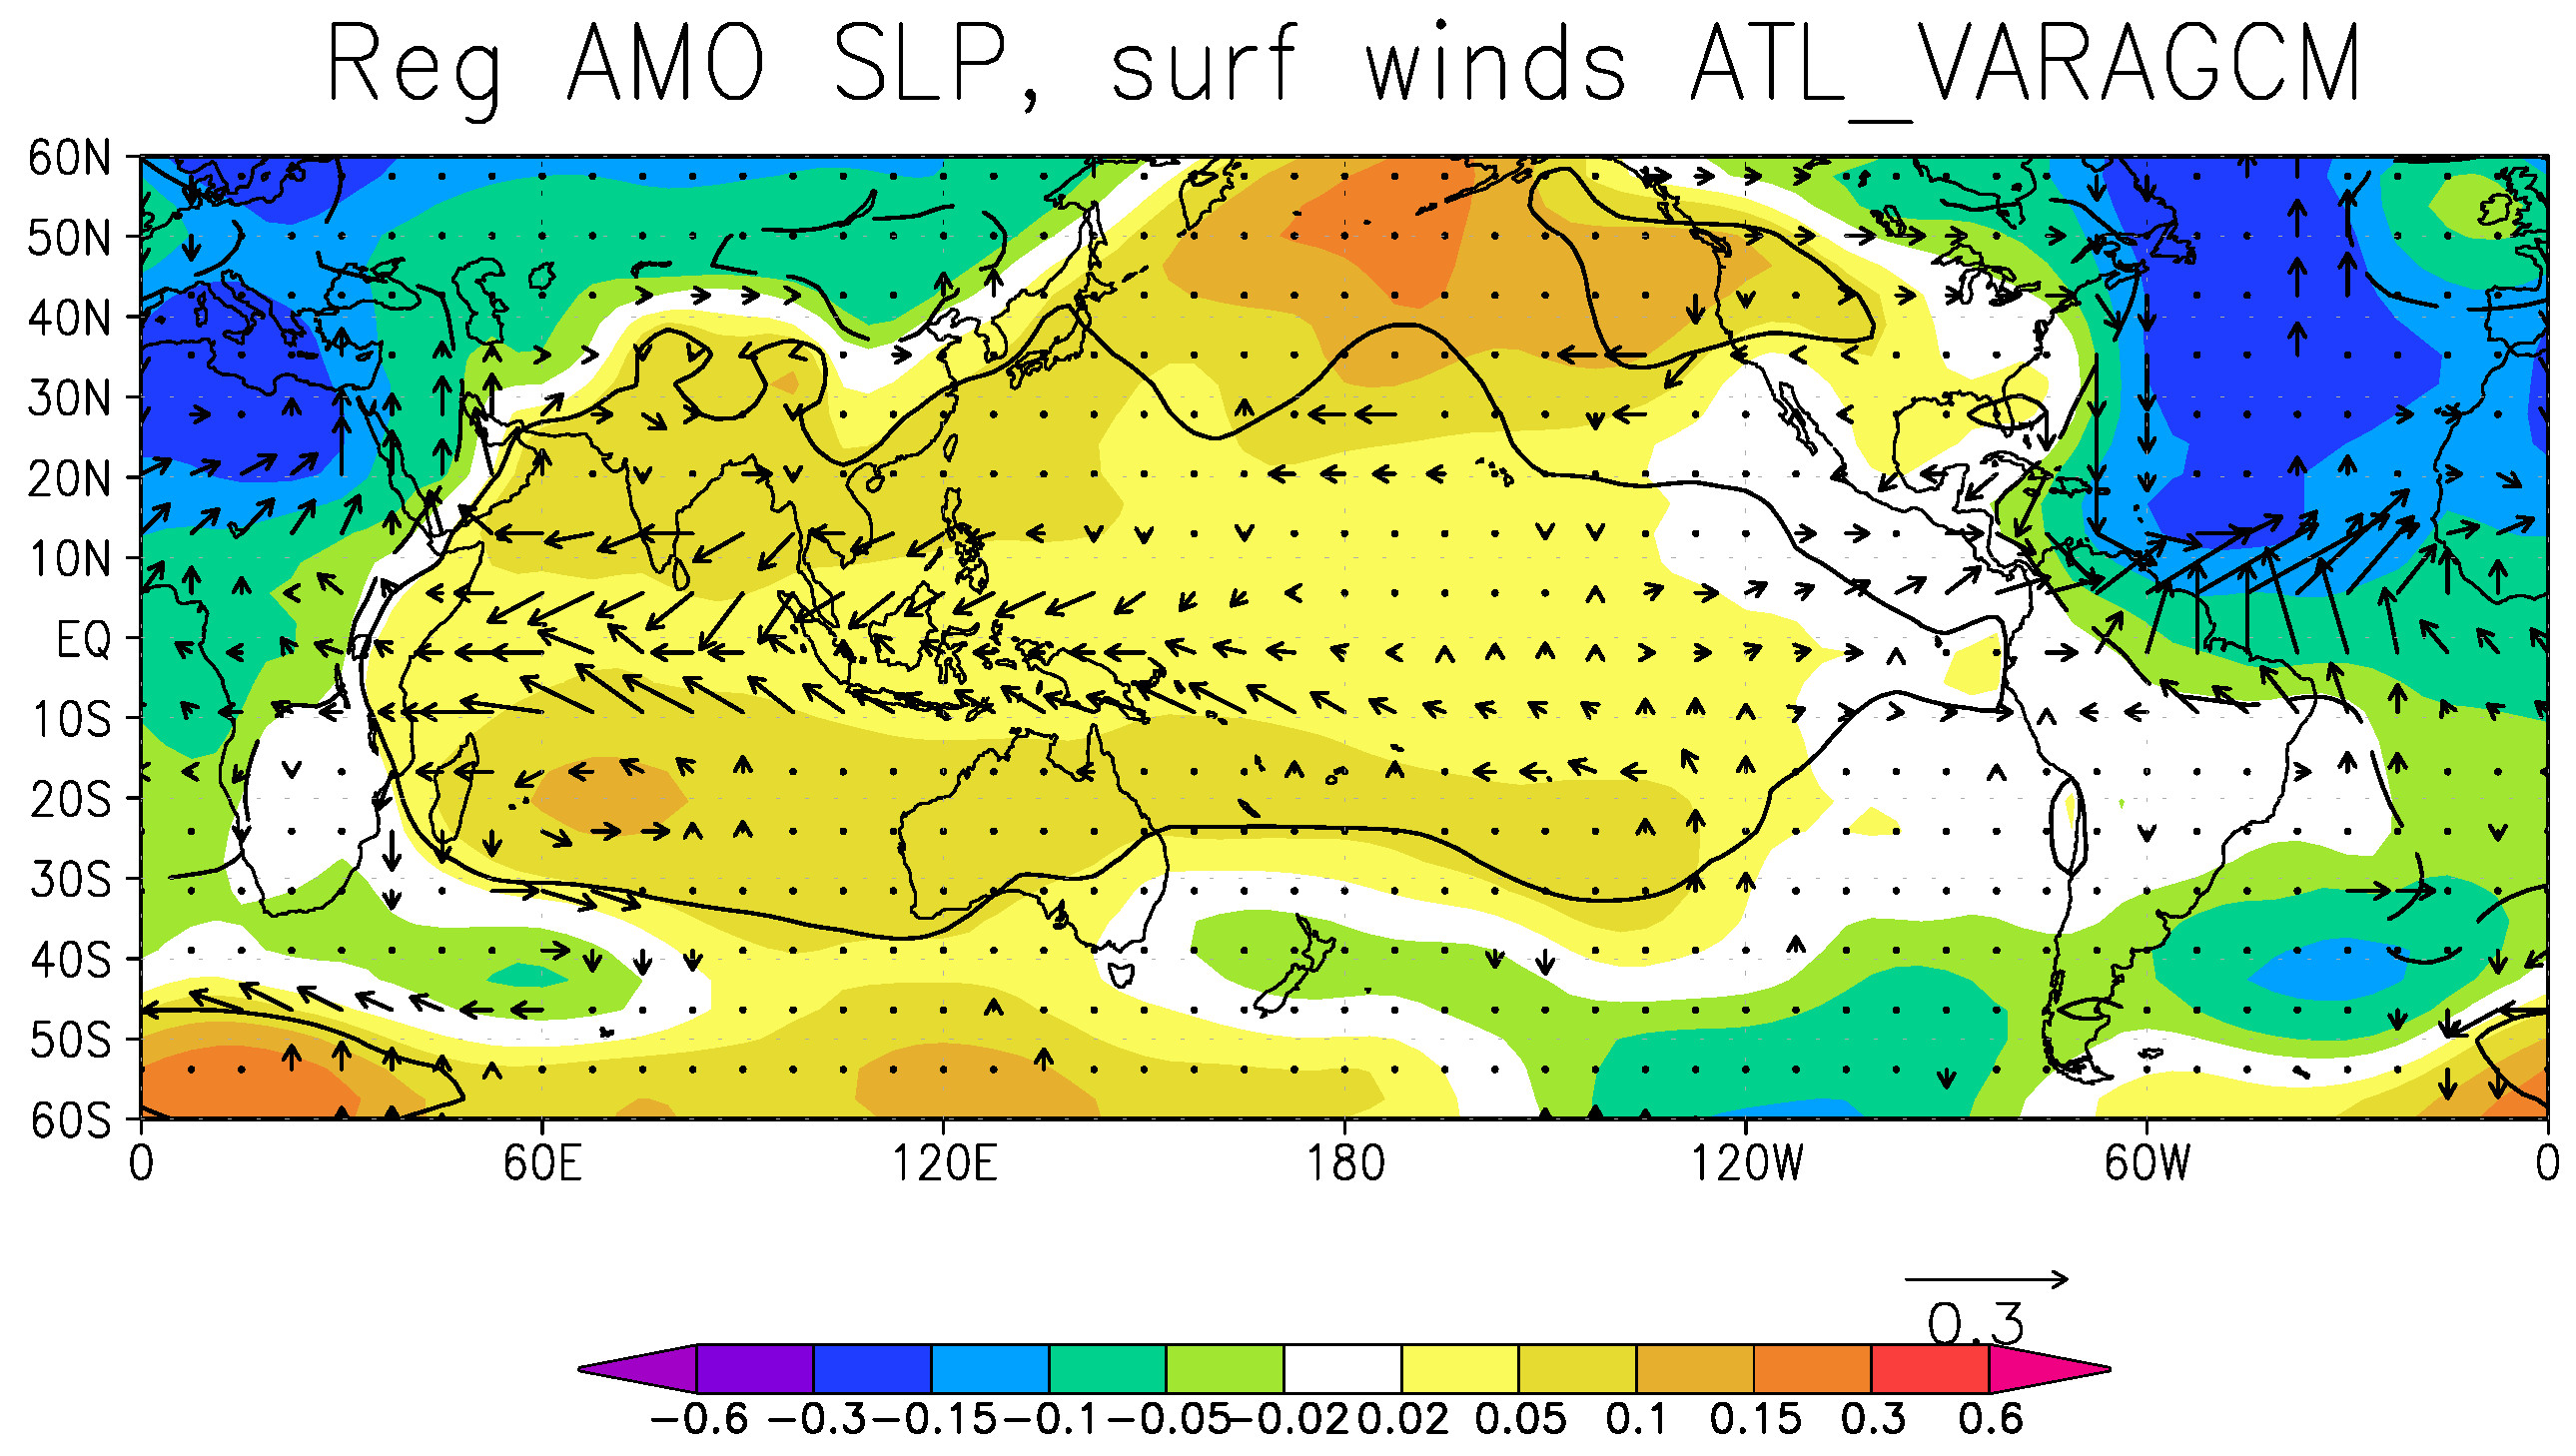
3.2. Multidecadal Atlantic-Pacific Teleconnection

In this section, the AMO (e.g., [52]) teleconnection with the Indo-Pacific region, suggested by [22], will be re-visited using the Atlantic Pacemaker experiments. Figure 10 and Figure 11 show the regression of the observed AMO index onto observed and ATL_VAR annual mean SSTs (Figure 10a,b), as well as observed and ATL_VAR annual mean SLP and low-level winds (Figure 11a,b). The AMO index has been defined as 10-year running mean of the (detrended) annual mean SSTs in the North Atlantic (70 W–0 , 0 –60 N), where also the global mean SSTs (60 S to 60 N) have been subtracted following the revised AMO definition of [53].
In [22], a very similar analysis has been presented but without removing the global mean. The results are nevertheless very similar to those presented in [22]. A positive AMO leads to a cooling and higher SLP in the eastern Pacific compared to the western Pacific as well as to a warming and decreased SLP in the other tropical Indo-Pacific regions. In addition, the observed easterly low-level wind anomalies in the central-eastern Pacific are reproduced by experiment ATL_VAR.
The global SST pattern induced by the Atlantic low-frequency SST variability in recent decades has also been highlighted in [32]. The upper ocean profile of equatorial temperature regressed onto the AMO index (Figure 12) is also very similar to the one reported in [22], and shows a La Niña-type structure.
In order to further investigate the physical mechanism for the AMO teleconnection to the Indo-Pacific region, we perform the AMO index regressions onto SLP and low-level wind from the ATL_VARAGCM experiment (Figure 13). There is a clear easterly wind response in the central-western Pacific to the AMO forcing. The SLP shows high pressure in the central Pacific. Different from the ATL_VAR results, the high pressure extends into the Indian Ocean and shows also off-equatorial Rossby wave-type gyres. Such gyres indicate a Gill-type response to sinking motion in the central-western Pacific region (e.g., [37]). Therefore, the low pressure present in the Indian Ocean in the ATL_VAR simulation may be interpreted as response to the eastern Pacific cooling and to the local SST warming. The initial low-level wind response in the central-western Pacific to the AMO act as trigger for the La Niña-type response at multidecadal decadal time scales once the model is coupled. Li et al. [32] proposed that mixed-layer adjustment processes in the western Pacific region may be relevant to modify the wind patterns induced by the Atlantic warming in such a way that the easterly wind anomalies in the central-western Pacific are strengthened. Such an adjustment may be crucial to induce effectively the upwelling oceanic Kelvin waves that eventually cool the eastern Pacific. We test this hypothesis here for the AMO-induced teleconnection by performing idealized experiments with a constant AMO-type forcing pattern in the Atlantic region but with a mixed-layer ocean coupled elsewhere (ATL_VARMIX). Figure 14a indeed shows that a warming in the western Pacific is present in the ATL_VARMIX simulation in response to the AMO, and also a weak cooling is seen in the south tropical eastern Pacific region. This heat flux-induced SST response modifies the SLP response, which shows high pressure in the south equatorial eastern Pacific that is subsequently leading to a stronger and eastward shifted easterly wind response (Figure 14b) compared to the ATL_VARAGCM experiment (Figure 13). Therefore, our analysis confirms the results of [32], indeed indicating that purely thermodynamic processes can enhance the easterly surface winds that are the trigger for the following La Niña-type development.

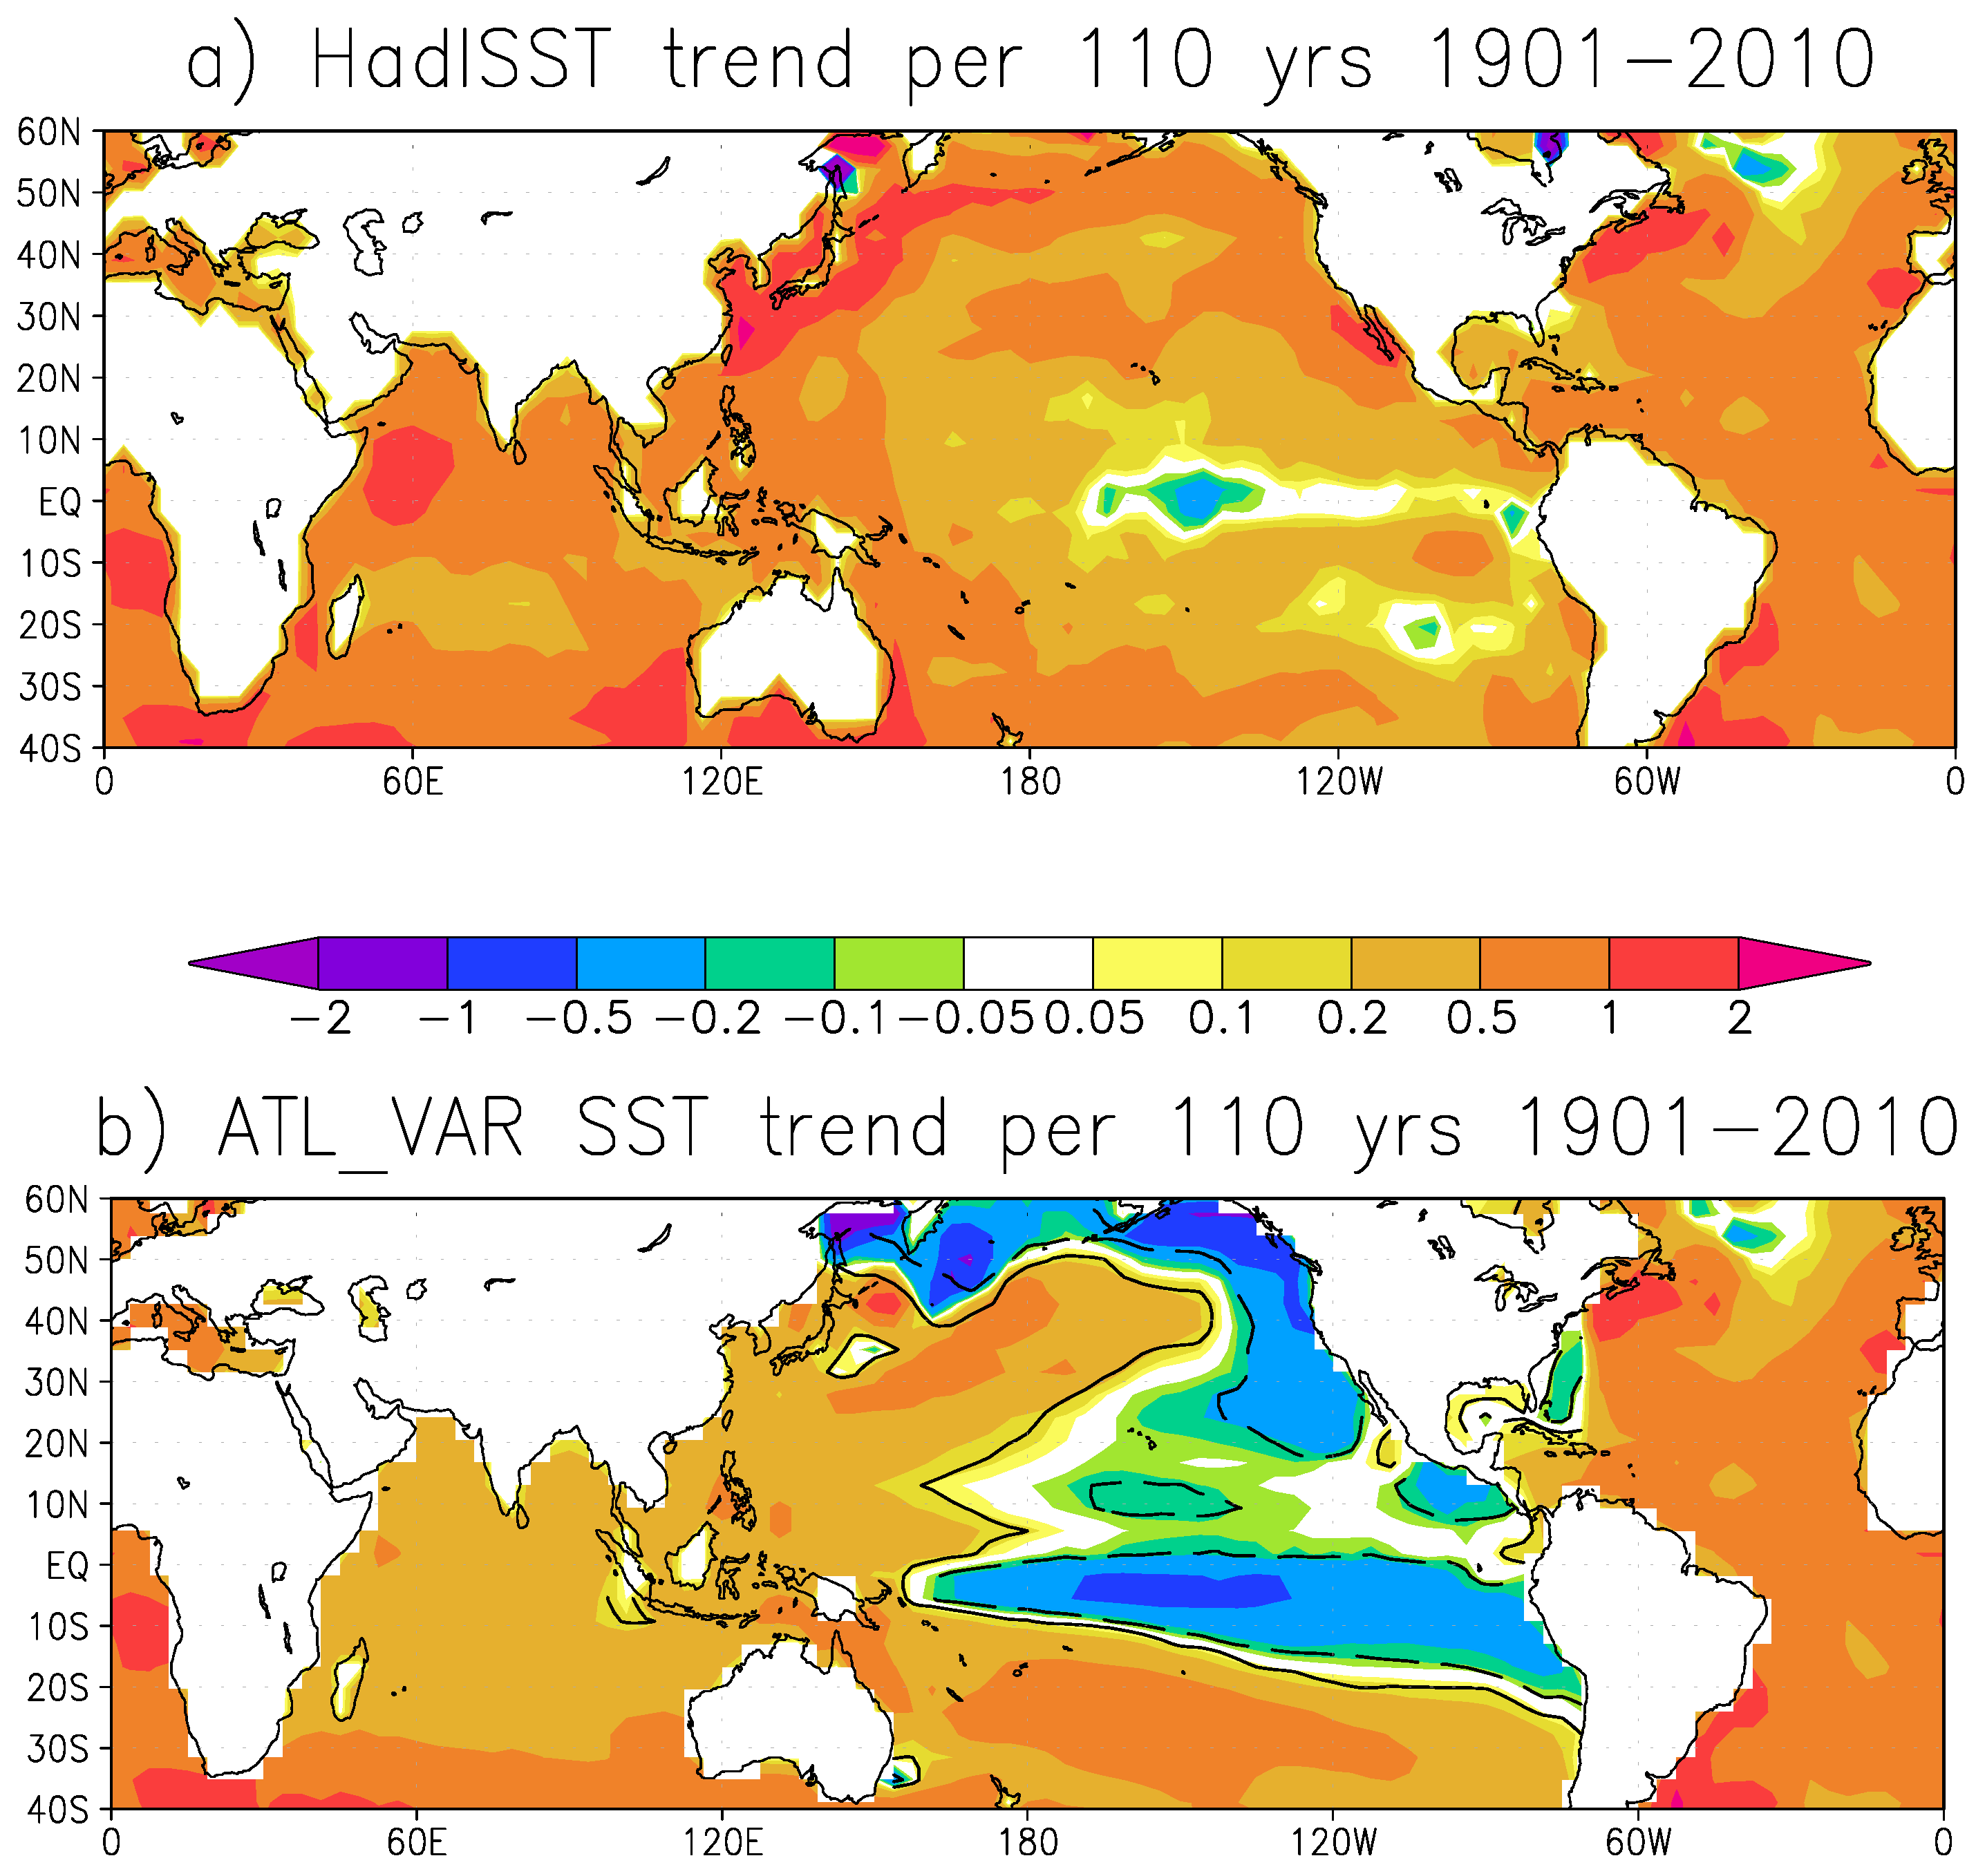
3.3. Centennial Atlantic-Pacific Teleconnection

In order to investigate the Atlantic-Pacific connection at even longer time scales, suggested by [16,37], we analyze the trend in the observational and ATL_VAR data. From the experimental set-up that does not include time-dependent CO 2 forcing, it is clear that the direct impact of CO 2 increase on the Indo-Pacific region cannot be investigated using the ATL_VAR experiment. Nevertheless, the model can be used to isolate the Atlantic impact on the Indo-Pacific at centennial time scales. Figure 15a,b shows the observed and modelled linear trends in SSTs for the periods 1901–2010, respectively. In the observations, a general warming can be found, but the eastern Pacific shows a slight cooling. On the one hand, ATL_VAR shows a much stronger eastern Pacific cooling, which is not surprising as the local CO 2 -induced eastern Pacific warming is not present in the model. On the other hand, a substantial part of the Indian Ocean and western Pacific warming can be reproduced by just the Atlantic forced experiment.
On the subsurface, the observations (Figure 16a) also show strong cooling of up to 3 K in the eastern Pacific, which is weakened close to the surface, presumably due to CO 2 -induced warming. The ATL_VAR subsurface trend (Figure 16b) is also a cooling in the eastern Pacific, but it is weaker in magnitude compared to the observed cooling. A substantial subsurface cooling trend in the equatorial eastern Pacific has also been reported by [54]. This shows that the rate of the Atlantic warming may be crucial to understand the structure of the SST changes in other ocean basins, consistent with [16,37].

4. Discussion and Conclusions

We have reviewed the teleconnection of the Atlantic to the Indo-Pacific region from inter-annual to centennial time scales and have performed further analysis using coupled and uncoupled Atlantic pacemaker experiments.
At inter-annual time scales, the observed and well-documented teleconnections from the Atlantic Niño and the tropical North Atlantic to the Pacific could be reproduced in the coupled experiments, although with reduced amplitude in the case of Atlantic Niño. An idealized AGCM pacemaker experiment showed that although the forcings from the Atlantic Niño and North tropical Atlantic are different, in their positive phases both lead to easterly surface wind anomalies in the central-western equatorial Pacific region. In our simulations, the Atlantic Niño (Niña) also leads to substantial westerly equatorial low-level wind anomalies in the eastern Pacific that counteract the La Niña (El Niño) development and may therefore explain the weaker modelled response. Thus, both the Atlantic Niño and the North Tropical Atlantic forcing lead eventually to a La Niña-type response in their warm phases.
At multidecadal time scales, the AMO is influencing Indo-Pacific decadal variability and may have influenced the recent climate shift at the beginning of the 21st century that has been made also responsible for the hiatus in global warming. A trans-basin response to the positive AMO phase is found with cooling in the eastern tropical Pacific and warming in the western Pacific and Indian Ocean. We have shown that the physical mechanism for this response is similar to that at inter-annual time scales in that a positive AMO event leads to easterly surface wind anomalies in the central-western Pacific region. Ocean mixed-layer adjustment processes have also been shown to be potentially relevant.
The La Niña-type adjustment in the equatorial Pacific further modifies the Atlantic-induced teleconnection and leads to a low-pressure response in the Indian Ocean region that is absent if the response to the AMO in an AGCM pacemaker experiment is considered.
At centennial time scale, the stronger warming in the Atlantic region compared to the global mean is likely to have reduced the warming in the eastern Pacific, which has been demonstrated by the long-term trend analysis. The Atlantic pacemaker experiments without varying CO 2 forcing indeed show a strong cooling in the eastern Pacific. A substantial cooling is also present in the equatorial subsurface in both observational estimates and the coupled model.
All of the above teleconnections from inter-annual to centennial time scales are important to understand the observed climate variability and climate changes in the 20th century and will also be relevant to understand projected future changes. The impact of the Atlantic-Pacific connection on teleconnections is also important as, during boreal summer months, the concomitant effect of the Atlantic and Pacific on remote regions as Sahel, has been found to produce counteracting effects affecting rainfall predictability ([55,56]). In addition, it has been found how the Atlantic-Pacific connection affects over north eastern southamerican rainfall ([57]) or boreal summer mediterranean rainfall ([58]).
The model that has been used in this study to investigate the Atlantic impact on Pacific climate variability has an intermediate complexity atmospheric component, which makes it computationally efficient. However, there may be larger biases of important variables compared to state-of-the-art models. On the other hand, [22] have shown that the model climatology reproduces the observations reasonably well. Therefore, we believe that useful insights can be gained from the model used here. Furthermore, [16] have shown that a substatial part of state-of-the-art models are not able to reproduce the tropical Atlantic-tropical Pacific connection satisfactorily. This may be partly due to the large biases present in the tropical Atlantic ([59]) or Pacific ([60,61]) in CGCMs. The Atlantic pacemaker experiments used in this study remove the mean state SST biases in the Atlantic region and use observed SSTs instead. This could be a reason why the relatively simple model adopted here is able to reproduce to some extend all previously reported and observed teleconnections from the Atlantic to the tropical Indo-Pacific region.
There are also many remaining questions. Further analysis of the Bjerknes versus wind-evaporation feedback over the Pacific due to Atlantic forcing in the Pacemaker simulations at inter-annual time-scales is needed as well as the assessment of the stationarity of this feedback. In addition, the decadal variations of the inter-annual Atlantic-Pacific teleconnection needs to be further analyzed, perhaps using the CMIP Multimodel dataset, in order to further clarify the reasons for such variations. Another open question is what precise properties of the AMO are required to establish the teleconnection to the tropical Pacific region. Do coupled models show AMO spatial patterns that are sufficiently close to observations to reproduce the observed AMO-tropical Pacific connection? At centennial time scales, one remaining question is the details of the interference between the local radiative impact of CO 2 increase and the forcing from the Atlantic, which tend to counteract each other. There are probably many more open questions to be answered, and the above is just a small selection.

Acknowledgments

We thank the two anonymous reviewers for their constructive comments that helped to improve the manuscript.

Author Contributions

The analysis of observations and the model data have been performed by Fred Kucharski and Afroja Parvin. Belen Rodriguez-Fonseca, Marta Martin-Rey, Irene Polo, Elsa Mohino, Teresa Losada, Carlos-Roberto Mechoso and Riccardo Farneti contributed equally to the discussion of the relevant literature in this review and helped to improve the manuscript.

Conflicts of Interest

The authors declare no conflict of interest.

References

  1. Ropelewski, C.P.; Halpert, M.S. Global and regional scale precipitation associated with the El Niño/Southern Oscillation. Mon. Weather Rev. 1987, 115, 1606–1626. [Google Scholar] [CrossRef]
  2. Duan, W.; Wei, C. The “sping predictability barrier” for ENSO predictions and its possible mechanism: results from a fully coupled model. Int. J Clim. 2012, 33, 1280–1292. [Google Scholar] [CrossRef]
  3. Chen, D.; Cane, M.A.; Kaplan, A.; Zebiak, Z.E.; Huang, D. Predictability of El Niño over the past 148 years. Nature 2004, 428, 733–736. [Google Scholar] [CrossRef] [PubMed]
  4. Rodriguez-Fonseca, B.; Polo, I.; Garcia-Serrano, J.; Losada, T.; Mohino, E.; Mechoso, C.R.; Kucharski, F. Are Atlantic Niños enhancing Pacific ENSO events in recent decades? Geophys. Res. Lett. 2009, 36, L20705. [Google Scholar] [CrossRef]
  5. Wang, C.; Kucharski, F.; Barimalala, R.; Bracco, A. Teleconnections of the tropical Atlantic to the tropical Indian and Pacific Oceans: A review of recent findings. Meteorol. Z. 2009, 18, 445–454. [Google Scholar] [CrossRef]
  6. Ding, H.; Keenlyside, N.S.; Latif, M. Impact of the Equatorial Atlantic on the El Niño Southern Oscillation. Clim. Dyn. 2012, 38, 1965–1972. [Google Scholar] [CrossRef] [Green Version]
  7. Frauen, C.; Dommenget, D. Influences of the tropical Indian and Atlantic Oceans on the predictability of ENSO. Geophys. Res. Lett. 2012, 39, L02706. [Google Scholar] [CrossRef]
  8. Jansen, M.F.; Dommenget, D.; Keenlyside, N.S. Tropical Atmosphere-Ocean Interactions in a Conceptual Framework. J. Clim. 2009, 22, 550–567. [Google Scholar] [CrossRef]
  9. Polo, I.; Martin-Rey, M.; Rodriguez-Fonseca, B.; Kucharski, F.; Mechoso, C.R. Processes in the Pacific La Niña onset triggered by the Atlantic Niño. Clim. Dyn. 2014, 44, 115–131. [Google Scholar] [CrossRef]
  10. Martin-Rey, M.; Polo, I.; Rodriguez-Fonseca, B.; Kucharski, F. Changes in the inter-annual variability of the tropical Pacific as a response to an equatorial Atlantic forcing. Sci. Mar. 2012, 76. [Google Scholar] [CrossRef]
  11. Martin-Rey, M.; Rodriguez-Fonseca, B.; Polo, I.; Kucharski, F. On the Atlantic-Pacific Niños connection: A multidecadal modulated mode. Clim. Dyn. 2014, 43. [Google Scholar] [CrossRef]
  12. Martin-Rey, M.; Rodriguez-Fonseca, B.; Polo, I. Atlantic opportunities for ENSO prediction. Geophys. Res. Lett. 2015, 42, 6802–6810. [Google Scholar] [CrossRef]
  13. Keenlyside, N.S.; Ding, H.; Latif, M. Potential of equatorial Atlantic variability to enhance El Niño prediction. Geophys. Res. Lett. 2013, 40, 2278–2283. [Google Scholar] [CrossRef] [Green Version]
  14. Ham, Y.-Y.; Kug, J.-S.; Park, J.Y.; Jin, F.-F. Sea surface temperature in the north tropical Atlantic as a trigger for El NiÃśo/Southern Oscillation events. Nat. Geosci. 2013, 6. [Google Scholar] [CrossRef]
  15. Ham, Y.-Y.; Kug, J.-S.; Park, J.Y.; Jin, F.-F. Two distinct roles of Atlantic SSTs in ENSO variability: North tropical Atlantic SST and Atlantic Niño. Geophys. Res. Lett. 2013, 40, 4012–4017. [Google Scholar] [CrossRef]
  16. Kucharski, F.; Syed, F.S.; Burhan, A.; Farah, I.; Gohar, A. Tropical Atlantic influence on Pacific variability and mean state in the twentieth century in observations and CMIP5. Clim. Dyn. 2014, 44. [Google Scholar] [CrossRef]
  17. Sasaki, W.; Doi, T.; Richards, K.J.; Masumoto, Y. Impact of the equatorial Atlantic sea surface temperature on the tropical Pacific in a CGCM. Clim. Dyn. 2014, 43, 2539–2552. [Google Scholar] [CrossRef]
  18. Dong, B.W.; Sutton, R.T. Enhancement of El Niño-Southern Oscillation (ENSO) variability by a weakened Atlantic thermohaline circulation in a coupled GCM. J. Cliamte 2007, 20, 4920–4939. [Google Scholar] [CrossRef]
  19. Lu, R.; Chen, W.; Dong, B. How does a weakened Atlantic thermohaline circulation lead to an intensification of the ENSO-south Asian summer monsoon interaction? Geophys. Res. Lett. 2008, 35, L08706. [Google Scholar] [CrossRef]
  20. Timmermann, A.; Okumura, Y.; An, S.-I.; Clement, A.; Dong, B.; Guilyardi, E.; Hu, A.; Jungclaus, J.H.; Renold, M.; Stocker, T.F.; et al. The influence of a weakening of the Atlantic Meridional overturning circulation on ENSO. J. Clim. 2007, 20, 4899–4919. [Google Scholar] [CrossRef]
  21. Zhang, R.; Delworth, T.L. Impact of the Atlantic multidecadal oscillation on north pacific climate variability. Geophys. Res. Lett. 2007, 34, L23708. [Google Scholar] [CrossRef]
  22. Kucharski, F.; Ikram, F.; Molteni, F.; Farneti, F.; Kang, I.-S.; No, H.H.; King, M.P.; Giuliani, G.; Mogensen, K. Atlantic forcing of Pacific decadal variability. Clim. Dyn. 2015. [Google Scholar] [CrossRef]
  23. Meehl, G.A.; Hu, A.; Santer, B.D. The mid-1970s climate shift in the Pacific and the relative roles of forced versus inherent decadal variability. J. Clim. 2009, 22, 780–792. [Google Scholar] [CrossRef]
  24. Graham, N.E. Decadal-scale climate variability in the tropical and North Pacific during the 1970s and 1980s: Observations and model results. Clim. Dyn 1994, 10, 135–162. [Google Scholar] [CrossRef]
  25. Dong, B.; Lu, R. Interdecadal Enhancement of the Walker Circulation over the Tropical Pacific in the Late 1990s. Adv. Atmos. Sci. 2013, 30, 247–262. [Google Scholar] [CrossRef]
  26. Miller, A.J.; Cayan, D.R.; Barnett, T.P.; Graham, N.E.; Oberhuber, J.M. Interdecadal variability of the Pacific Ocean: model response to observed heat fluxes and wind stress anomalies. Clim. Dyn. 1994, 9, 187–302. [Google Scholar] [CrossRef]
  27. England, M.H.; McGregor, S.; Spence, P.; Meehl, G.A.; Timmermann, A.; Cai, W.; Gupta, A.S.; McPhaden, M.J.; Purich, A.; Santoso, A. Recent intensification of wind- driven circulation in the Pacific and the ongoing warming hiatus. Nat. Clim. Change 2014, 4, 222–227. [Google Scholar] [CrossRef]
  28. Kosaka, Y.; Xie, S.-P. Recent global-warming hiatus tied to equatorial Pacific surface cooling. Nature 2013, 501, 403–407. [Google Scholar] [CrossRef] [PubMed]
  29. Trenberth, K.E.; Fasullo, J.T. An apparent hiatus in global warming? Earth’s Future 2013, 1, 19–32. [Google Scholar] [CrossRef]
  30. Kang, I.-S.; No, H.-H.; Kucharski, F. ENSO Amplitude Modulation Associated with the Mean SST Changes in the Tropical Central Pacific Induced by Atlantic Multidecadal Oscillation. J. Clim. 2014, 27, 7911–7920. [Google Scholar] [CrossRef]
  31. McGregor, S.; Timmermann, A.; Stuecker, M.F.; England, M.H.; Merrifield, M.; Jin, F.-F.; Chikamoto, Y. Recent Walker circulation strengthening and Pacific cooling amplified by Atlantic warming. Nat. Clim. Change 2014, 4. [Google Scholar] [CrossRef]
  32. Li, X.; Xie, S.-P.; Gille, S.T.; Yoo, C. Atlantic-induced pan-tropical climate change over the last three decades. Nat. Clim. Change 2015. [Google Scholar] [CrossRef]
  33. Chikamoto, Y.; Kimoto, M.; Watanabe, M.; Ishii, M.; Mochizuki, T. Relationship between the Pacific and Atlantic stepwise climate change during the 1990s. Geophys. Res. Lett. 2012, 39. [Google Scholar] [CrossRef]
  34. Chikamoto, Y.; Timmermann, A.; Luo, J.-J.; Mochizuki, T.; Kimoto, M.; Watanabe, M.; Ishii, M.; Xie, S.-P.; Jin, F.-F. Skilful multi-year predictions of tropical trans-basin climate variability. Nat. Commun. 2015, 6. [Google Scholar] [CrossRef] [PubMed]
  35. Farneti, R.; Molteni, F.; Kucharski, F. Pacific interdecadal variability driven by tropical-extratropical interactions. Clim. Dyn. 2014, 42, 3337–3355. [Google Scholar] [CrossRef]
  36. Farneti, R.; Dwivedi, S.; Kucharski, F.; Molteni, F.; Griffies, S.M. On Pacific Subtropical Cell Variability over the Second Half of the Twentieth Century. J. Clim. 2014, 27, 7102–7112. [Google Scholar] [CrossRef]
  37. Kucharski, F.; Kang, I.-S.; Farneti, R.; Feudale, L. Tropical Pacific response to 20th century Atlantic warming. Geophys. Res. Lett. 2011, 38, L03702. [Google Scholar] [CrossRef]
  38. Vecchi, G.A.; Clement, A.; Soden, B.J. Examining the tropical Pacific’s response to global warming. EOS Trans. AGU 2008, 89. [Google Scholar] [CrossRef]
  39. Rayner, N.A.; Parker, D.E.; Horton, E.B.; Folland, C.K.; Alexander, L.V.; Rowell, D.P.; Kent, E.C.; Kaplan, A. Global analyses of sea surface temperature, sea ice, and night marine air temperature since the late nineteenth century. J. Geophys. Res. 2003, 108. [Google Scholar] [CrossRef] [Green Version]
  40. Compo, G.P.; Whitaker, J.S.; Sardeshmukh, P.D.; Matsui, N.; Allan, R.J.; Yin, X.; Gleason, B.E.; Vose, R.S.; Rutledge, G.; Bessemoulin, P.; et al. The 20th century reanalysis project. Q. J. R. Meteorol. Soc. 2011, 137, 1–28. [Google Scholar] [CrossRef]
  41. Carton, J.A.; Giese, B. A Reanalysis of Ocean Climate Using Simple Ocean Data Assimilation (SODA). Mon. Weather Rev. 2008, 136, 2999–3017. [Google Scholar] [CrossRef]
  42. SODA: Simple Ocean Data Assimilation. Available online: https://climatedataguide.ucar.edu/climate-data/soda-simple-ocean-data-assimilation (accessed on 7 November 2014).
  43. Kucharski, F.; Molteni, F.; King, M.P.; Farneti, R.; Kang, I.S.; Feudale, L. On the need of intermediate complexity general circulation models. BAMS 2013, 94, 25–30. [Google Scholar] [CrossRef]
  44. Madec, G. NEMO Ocean Engine; Note du Pole de modalisation, Institut Pierre-Simon Laplace (IPSL): Paris, France, 2008; Volume 27, 1288–1619. [Google Scholar]
  45. Valcke, S. OASIS3 User Guide (prism_2-5); CERFACS Technical Report 2006 TR/CMGC/06/73, PRISM Report No 3; CERFACS: Toulouse, France, 2006; p. 60. [Google Scholar]
  46. Fichefet, T.; Morales Maqueda, M.A. Sensitivity of a global sea ice model to the treatment of ice thermodynamics and dynamics. J. Geophys. Res. 1997, 102, 12609–12646. [Google Scholar] [CrossRef]
  47. Kroeger, J.; Kucharski, F. Sensitivity of ENSO characteristics to a new interactive flux correction scheme in a coupled GCM. Clim. Dyn. 2011, 36, 119–137. [Google Scholar] [CrossRef]
  48. Losada, T.; Rodriguez-Fonseca, B.; Polo, I.; Janicot, S.; Gervois, S.; Chauvin, F.; Ruti, P.M. Tropical response to the Atlantic Equatorial mode: AGCM multimodel approach. Clim. Dyn. 2010, 35, 45–52. [Google Scholar] [CrossRef]
  49. Ruiz-Barradas, A.; Carton, J.A.; Nigam, S. Structure of inter-annual- to-decadal climate variability in the tropical Atlantic sector. J. Clim. 2000, 13, 3285–3297. [Google Scholar] [CrossRef]
  50. Losada, T.; Rodriguez-Fonseca, B. Tropical Atmospheric Response to Decadal Changes in the Atlantic Equatorial Mode. Clim. Dyn. 2015. [Google Scholar] [CrossRef]
  51. Chiang, J.C.H.; Kushnir, Y.; Zebiak, S.E. Interdecadal changes in the eastern Pacific ITCZ variability and its influence on the Atlantic ITCZ. Geophys. Res. Lett. 2000, 27, 3687–3690. [Google Scholar] [CrossRef]
  52. Parker, D.; Folland, C.; Scaife, A.; Knight, J.; Colman, A.; Baines, P.; Dong, B. Decadal to multidecadal variability and the climate change background. J. Geophys. Res. 2007, 112. [Google Scholar] [CrossRef]
  53. Trenberth, K.; Shea, D.J. Atlantic hurricanes and natural variability in 2005. Geophys. Res. Lett. 2005, 33. [Google Scholar] [CrossRef]
  54. Yang, C.; Giese, B.S.; Wu, L. Ocean Dynamics and Tropical Pacific Climate Change in Ocean Reanalyses and Coupled Climate Models. J. Geophys. Res. Oceans 2014, 119. [Google Scholar] [CrossRef]
  55. Mohino, E.; Rodriguez-Fonseca, B.; Losada, T.; Gervois, S.; Janicot, S.; Bader, J. Changes in the inter-annual SST-forced signals on West African rainfall. AGCM intercomparison. Clim. Dyn. 2011, 37, 1707–1725. [Google Scholar] [CrossRef]
  56. Rodriguez-Fonseca, B.; Janicot, S.; Mohino, E.; Losada, T.; Bader, J. Interannual and decadal SST-forced responses of the West African monsoon. Atmos. Sci. Lett. 2010, 12, 67–74. [Google Scholar] [CrossRef]
  57. Torralba, V.; Rodriguez-Fonseca, B.; Mohino, E.; Losada, T. The non-stationary influence of the Atlantic and Pacific Niños on North Eastern South American rainfall. Front. Earth Sci. 2015, 3. [Google Scholar] [CrossRef]
  58. Losada, T.; Rodriguez-Fonseca, B.; Kucharski, F. Tropical influence on the summer Mediterranean climate. Atmos. Sci. Lett. 2012, 13, 36–42. [Google Scholar] [CrossRef] [Green Version]
  59. Richter, I.; Xie, S.-P.; Behera, S.K.; Doi, T.; Masumoto, Y. Equatorial Atlantic variability and its relation to mean state biases in CMIP5. Clim. Dyn. 2014, 42, 171–188. [Google Scholar]
  60. Mechoso, C.R.; Robertson, A.W.; Barth, N.; Davey, M.K.; Delecluse, P.; Gent, P.R.; Ineson, S.; Kirtman, B.; Latif, M.; le Treut, H.; et al. The seasonal cycle over the Tropical Pacific in General Circulation Models. Mon. Weather Rev. 1995, 123, 2825–2838. [Google Scholar] [CrossRef]
  61. Guilyardi, E.; Bellenger, H.; Collins, M.; Ferrett, S.; Cai, W.; Wittenberg, A. A first look at ENSO in CMIP5. Clivar Exch. 2012, 17, 29–32. [Google Scholar]
Figure 1. Regression of (a) observed and (b) ATL_VAR SSTs (DJFM) onto the preceeding JJAS ATL3 index. Anomalies that are 95% statistically significant are indicated by contours. Units are K.
Atmosphere 07 00029 g001
Figure 2. Regression of (a) observed and (b) ATL_VAR SLP and low-level winds (DJFM) onto preceeding (JJAS) ATL3 index. SLP anomalies that are 95% statistically significant are indicated by contours, and only statistically significant wind vector components are shown. Units are hPa for SLP and m/s for winds.
Atmosphere 07 00029 g002
Figure 3. Regression of (a) observed; (b) ATL_VAR temperature near the equator (DJFM; averaged from 5 S to 5 N) onto the preceding (JJAS) ATL3 index. Anomalies that are 95% statistically significant are indicated by contours. Units are K.
Atmosphere 07 00029 g003
Figure 4. Regression of (a) observed and (b) ATL_VAR SSTs (DJFM) onto preceding (FMA) NTA index. Anomalies that are 95% statistically significant are indicated by contours. Units are K.
Atmosphere 07 00029 g004
Figure 5. Regression of (a) observed and (b) ATL_VAR SLP and low-level winds (DJFM) onto preceeding (FMA) NTA index. SLP anomalies that are 95% statistically significant are indicated by contours, and only statistically significant wind vector components are shown. Units are hPa for SLP and m/s for winds.
Atmosphere 07 00029 g005
Figure 6. Regression of (a) observed; (b) ATL_VAR temperature near the equator (DJFM; averaged from 5 S to 5 N) onto the preceding (FMA) NTA index. Anomalies that are 95% statistically significant are indicated by contours. Units are K.
Atmosphere 07 00029 g006
Figure 7. Regression contemporaneous of ATL_VARAGCM SLP and low-level winds onto (a) ATL3 index (JJAS) and (b) NTA index (FMA). SLP anomalies that are 95% statistically significant are indicated by contours, and only statistically significant wind vector components are shown. Units are hPa for SLP and m/s for winds.
Atmosphere 07 00029 g007
Figure 8. Regression of ATL_VARAGCM SLP and low-level winds (SOND) onto ATL3 index (JJAS). SLP anomalies that are 95% statistically significant are indicated by contours, and only statistically significant wind vector components are shown. Units are hPa for SLP and m/s for winds.
Atmosphere 07 00029 g008
Figure 9. Correlation of the ATL3 index with a central Pacific wind index (CPWI; defined as average near-surface zonal wind in the region 160 E to 190 E, 5 S to 5 N) for observations (black curve) and ATL_VAR (red curve). Note that absolute correlations of about 0.36 may be considered as 90% statistically significant for 21-year running means.
Atmosphere 07 00029 g009
Figure 10. Regression of (a) observed and (b) ATL_VAR SSTs onto the AMO index. In (b), anomalies that are 95% statistically significant are indicated by contours. Units are K.
Atmosphere 07 00029 g010
Figure 11. Regression of (a) observed and b) ATL_VAR SLP and low-level winds onto preceding AMO index. In (b), SLP anomalies that are 95% statistically significant are indicated by contours, and only statistically significant wind vector components are shown. Units are hPa for SLP and m/s for winds.
Atmosphere 07 00029 g011
Figure 12. Regression of (a) observed; (b) ATL_VAR temperature near the equator (averaged from 5 S to 5 N) onto the AMO index. In (b), anomalies that are 95% statistically significant are indicated by contours. Units are K.
Atmosphere 07 00029 g012
Figure 13. Regression of ATL_VARAGCM SLP and low-level winds onto the AMO index. SLP anomalies that are 95% statistically significant are indicated by contours, and only statistically significant wind vector components are shown. Units are hPa for SLP and m/s for winds.
Atmosphere 07 00029 g013
Figure 14. Response of ATL_VARMXL on (a) SST and (b) SLP and low-level winds to AMO forcing. SST and SLP anomalies that are 95% statistically significant are indicated by contours, and only statistically significant wind vector components are shown. Units are K for SST, hPa for SLP and m/s for winds.
Atmosphere 07 00029 g014
Figure 15. Linear SST trend for the period 1901 to 2010 per 110 years for (a) observed and (b) ATL_VAR. In (b), anomalies that are 95% statistically significant are indicated by contours. Units are K.
Atmosphere 07 00029 g015
Figure 16. Linear trend of temperature near the equator (averaged from 5 S to 5 N) for the period 1901 to 2010 per 110 years for (a) observed and (b) ATL_VAR. In (b), anomalies that are 95% statistically significant are indicated by contours. Units are K.
Atmosphere 07 00029 g016

