
Surface Ozone Concentration and Its Relationship with UV Radiation, Meteorological Parameters and Radon on the Eastern Coast of the Baltic Sea


Abstract
:1. Introduction
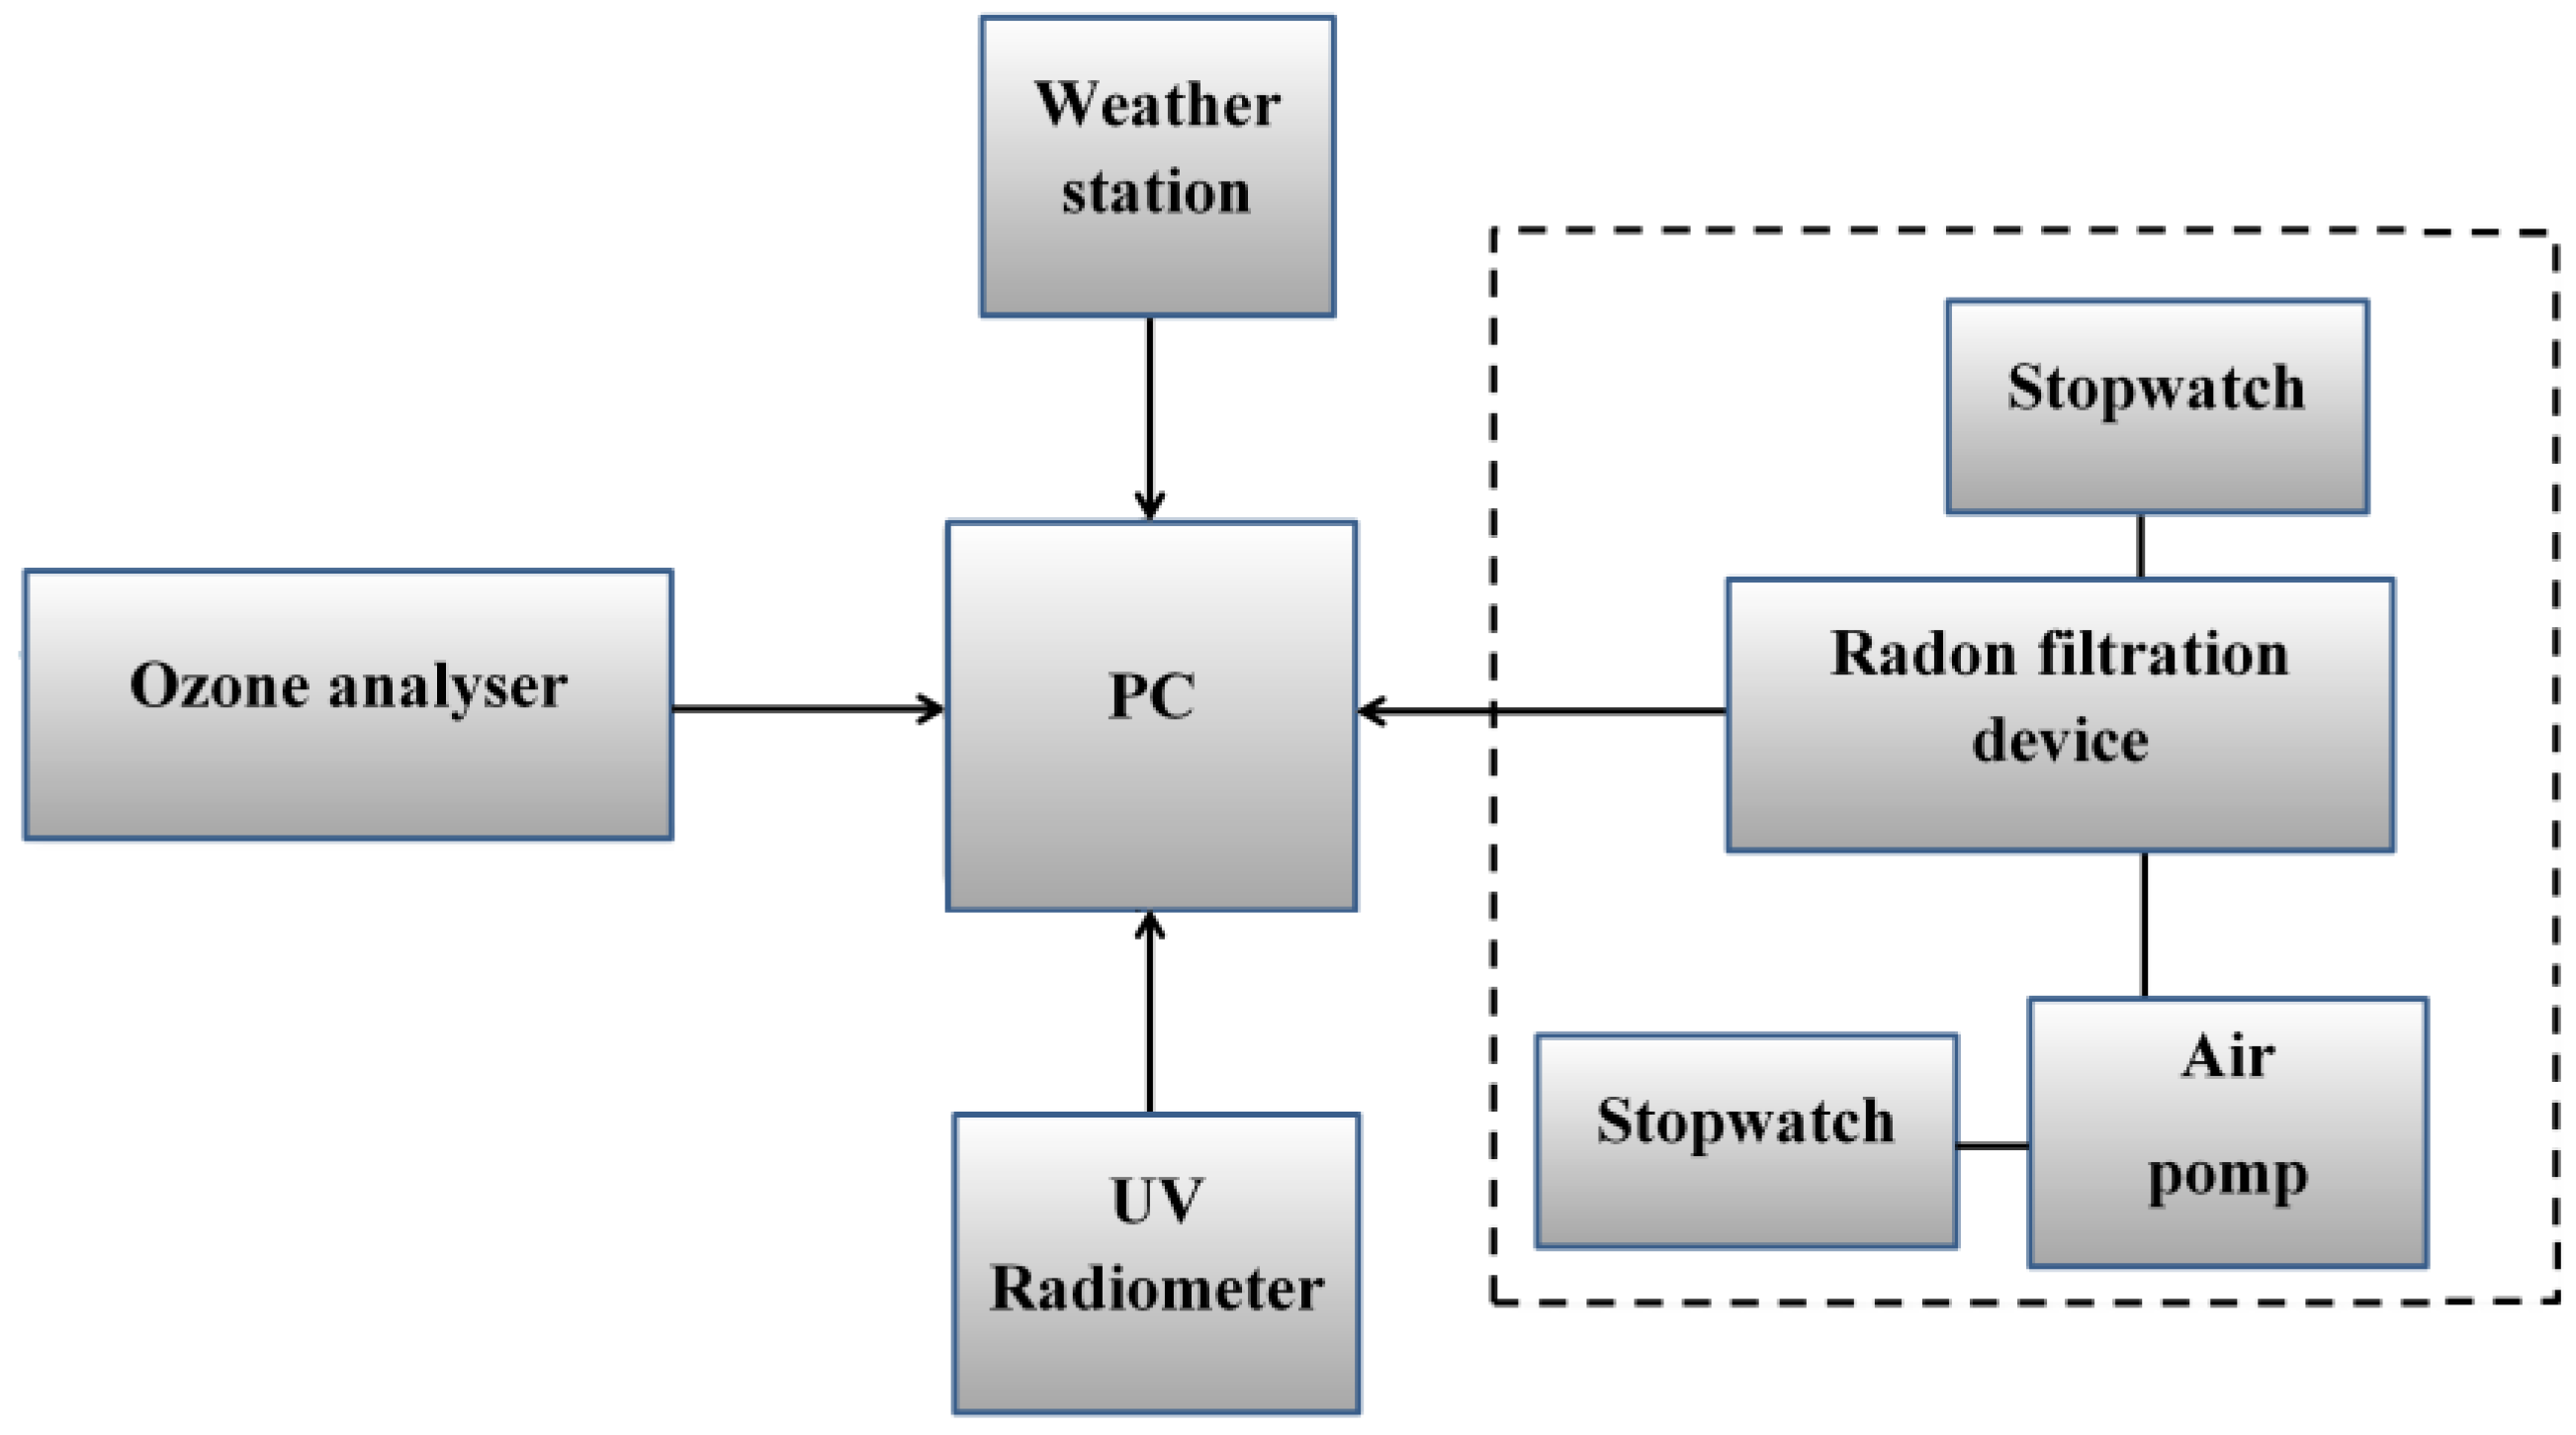
2. Methods

3. Results and Discussion


4. Conclusions
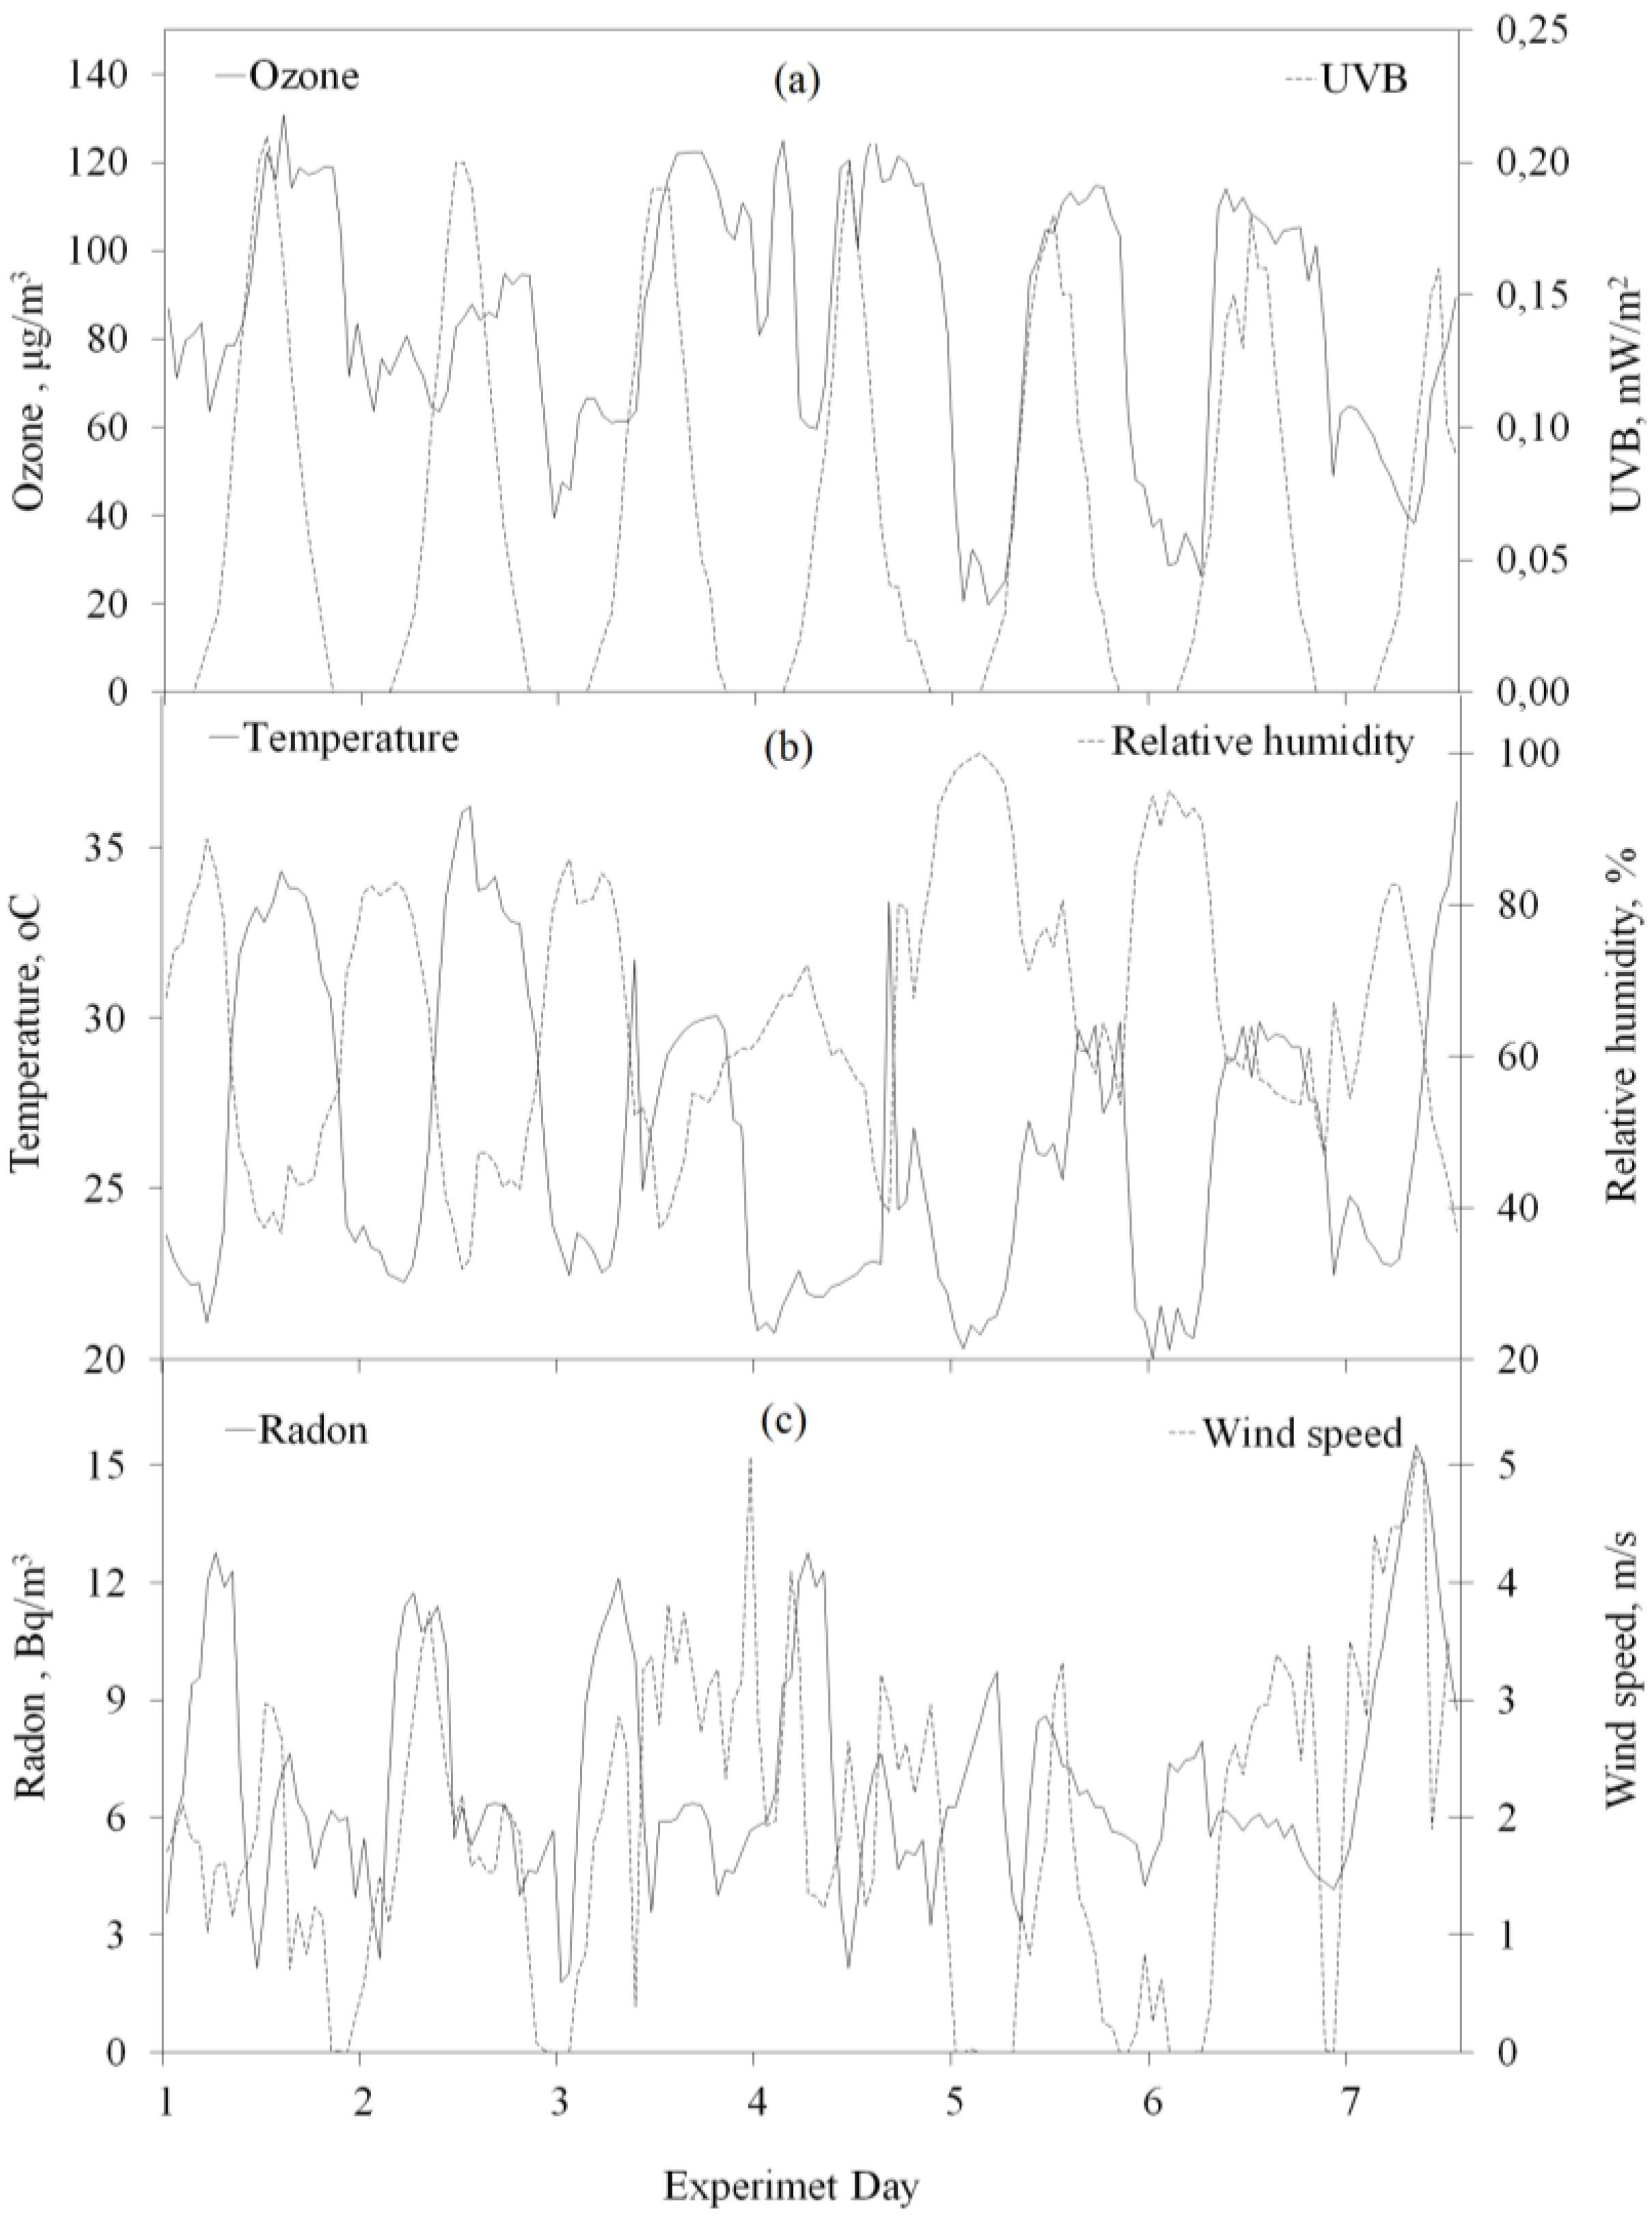
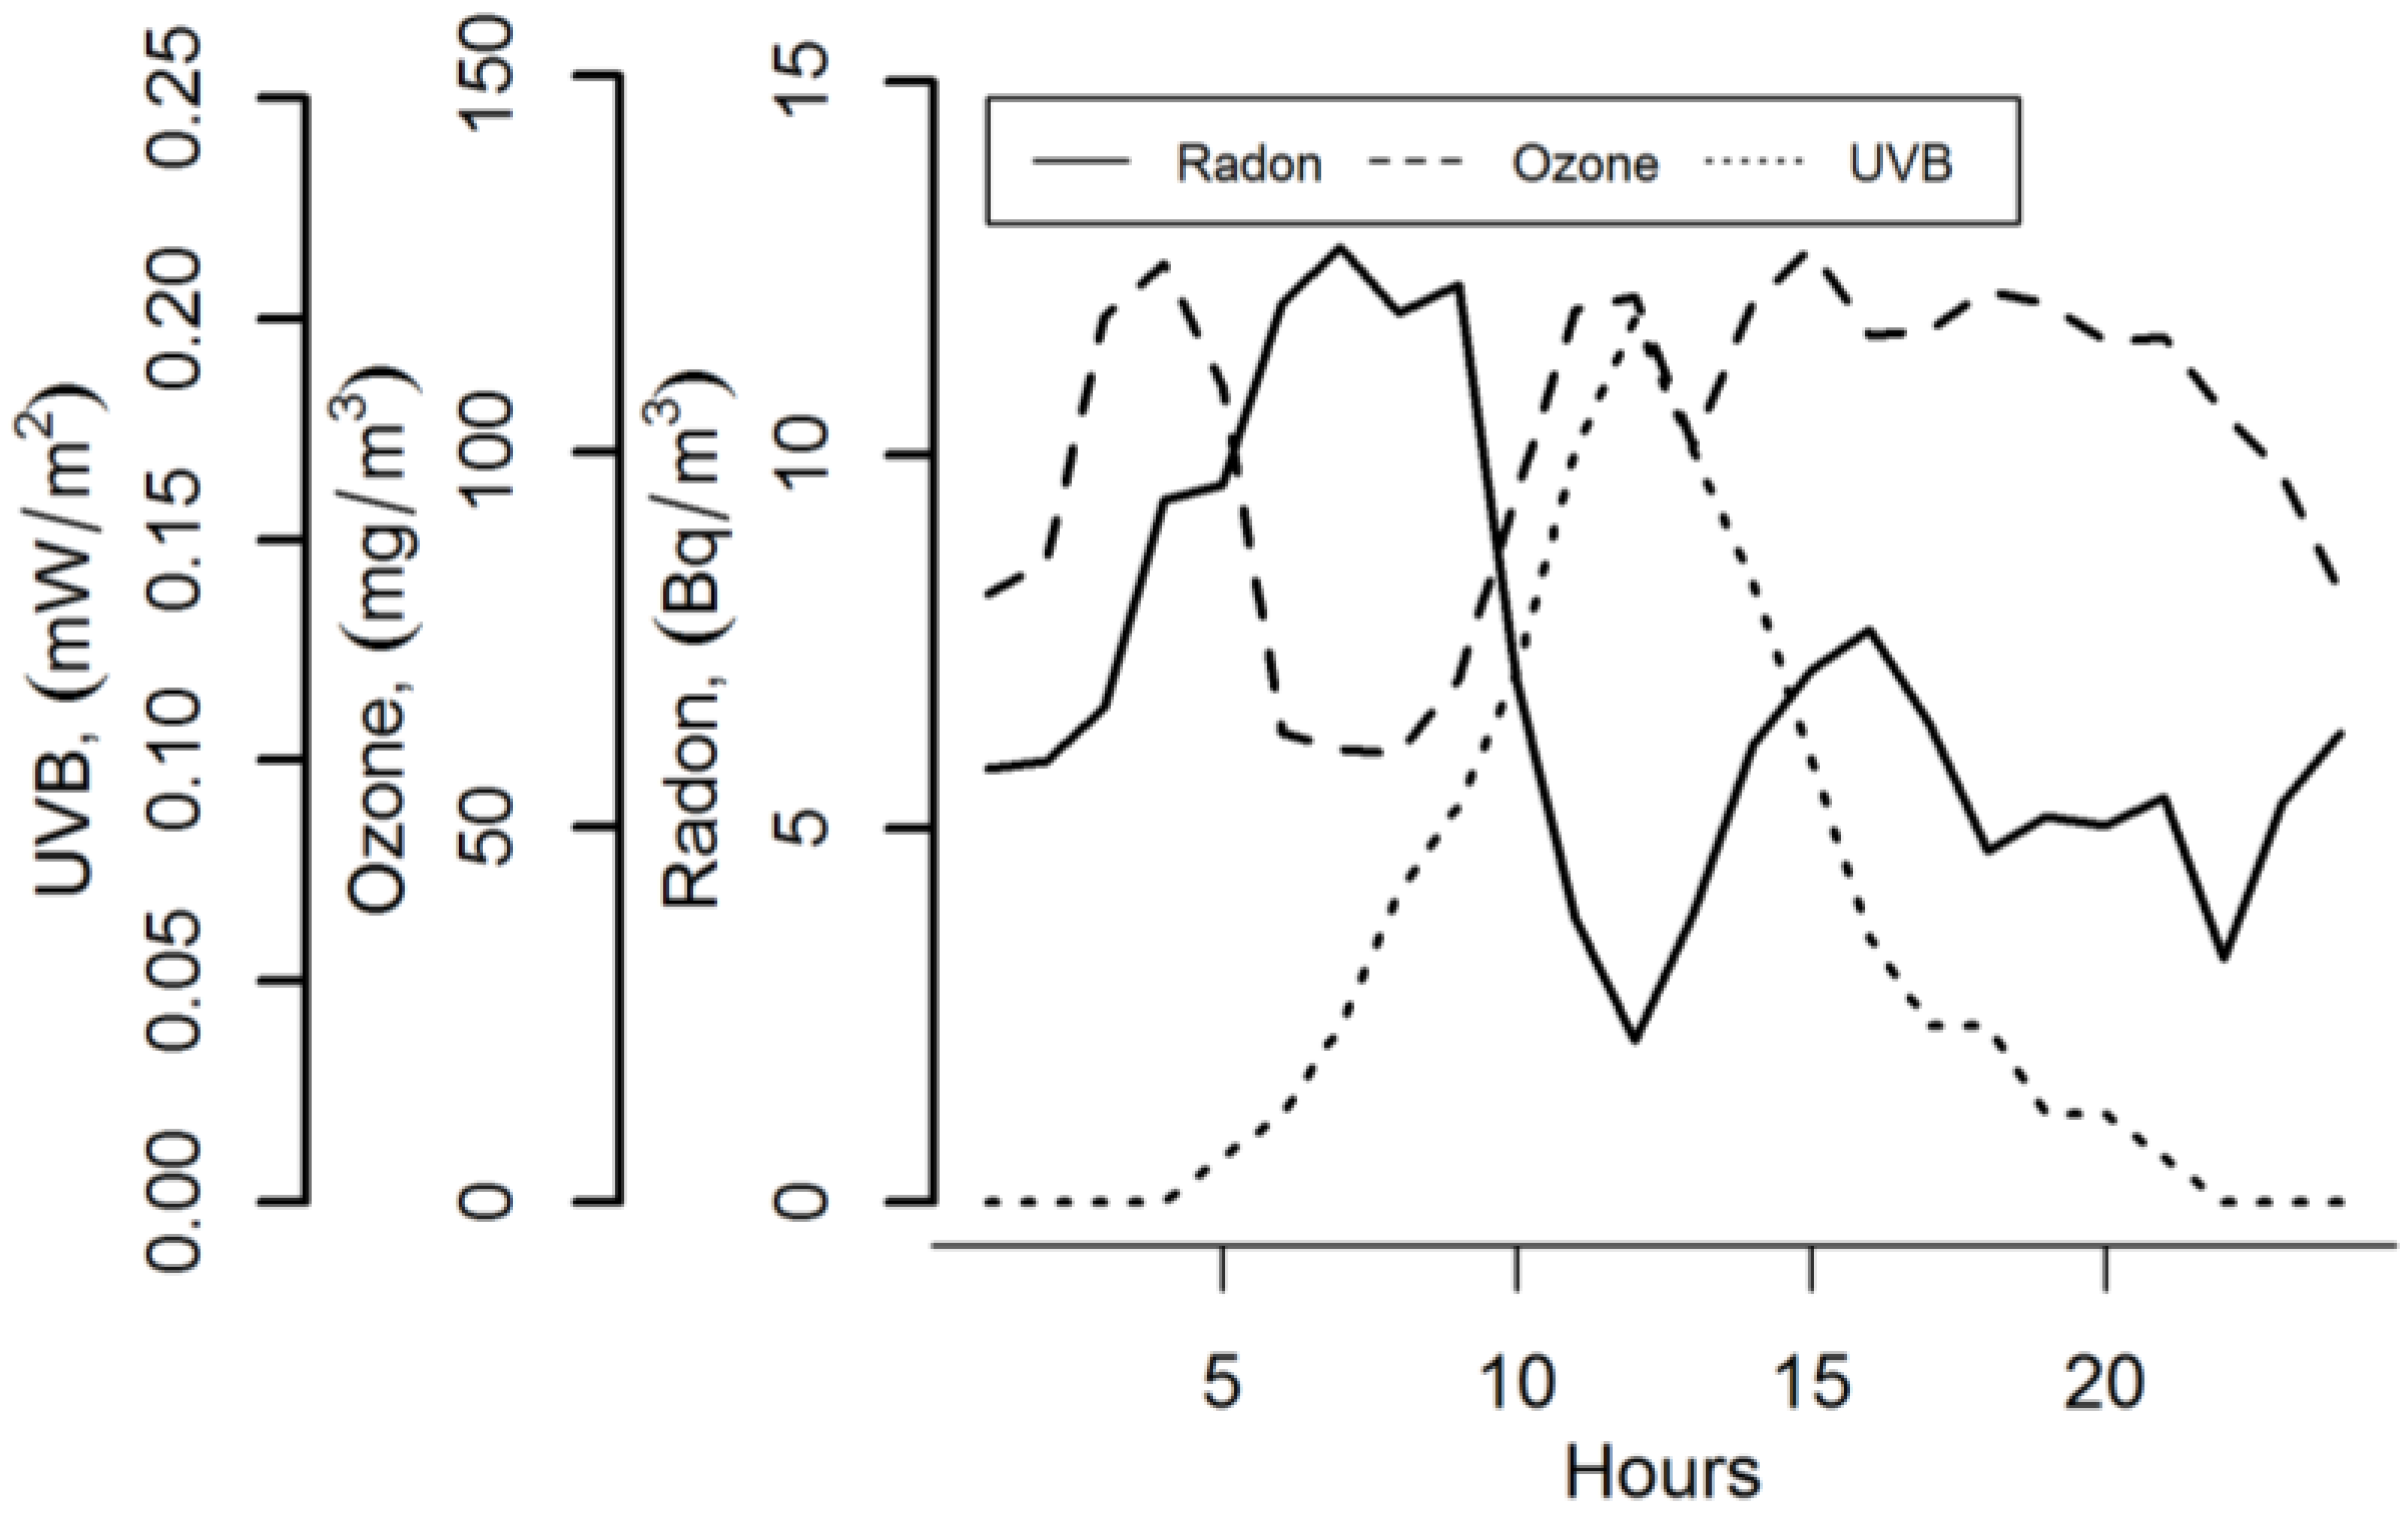
- The data analysis of the combined studies of surface ozone concentration, UV radiation, meteorological parameters and radon carried out at the Eastern Coast of the Baltic Sea under an atypical meteorological situation in this area shows clearly expressed diurnal courses of these parameters and the significant relationships among them.
- The statistically significant correlation between the UVB radiation intensity and ground-level ozone concentration has been determined, and the obtained correlation coefficient between these values was 0.52. Photochemical ozone production is strongly related to the change of the UVB radiation intensity within the exclusive territory of the Baltic Sea coast.
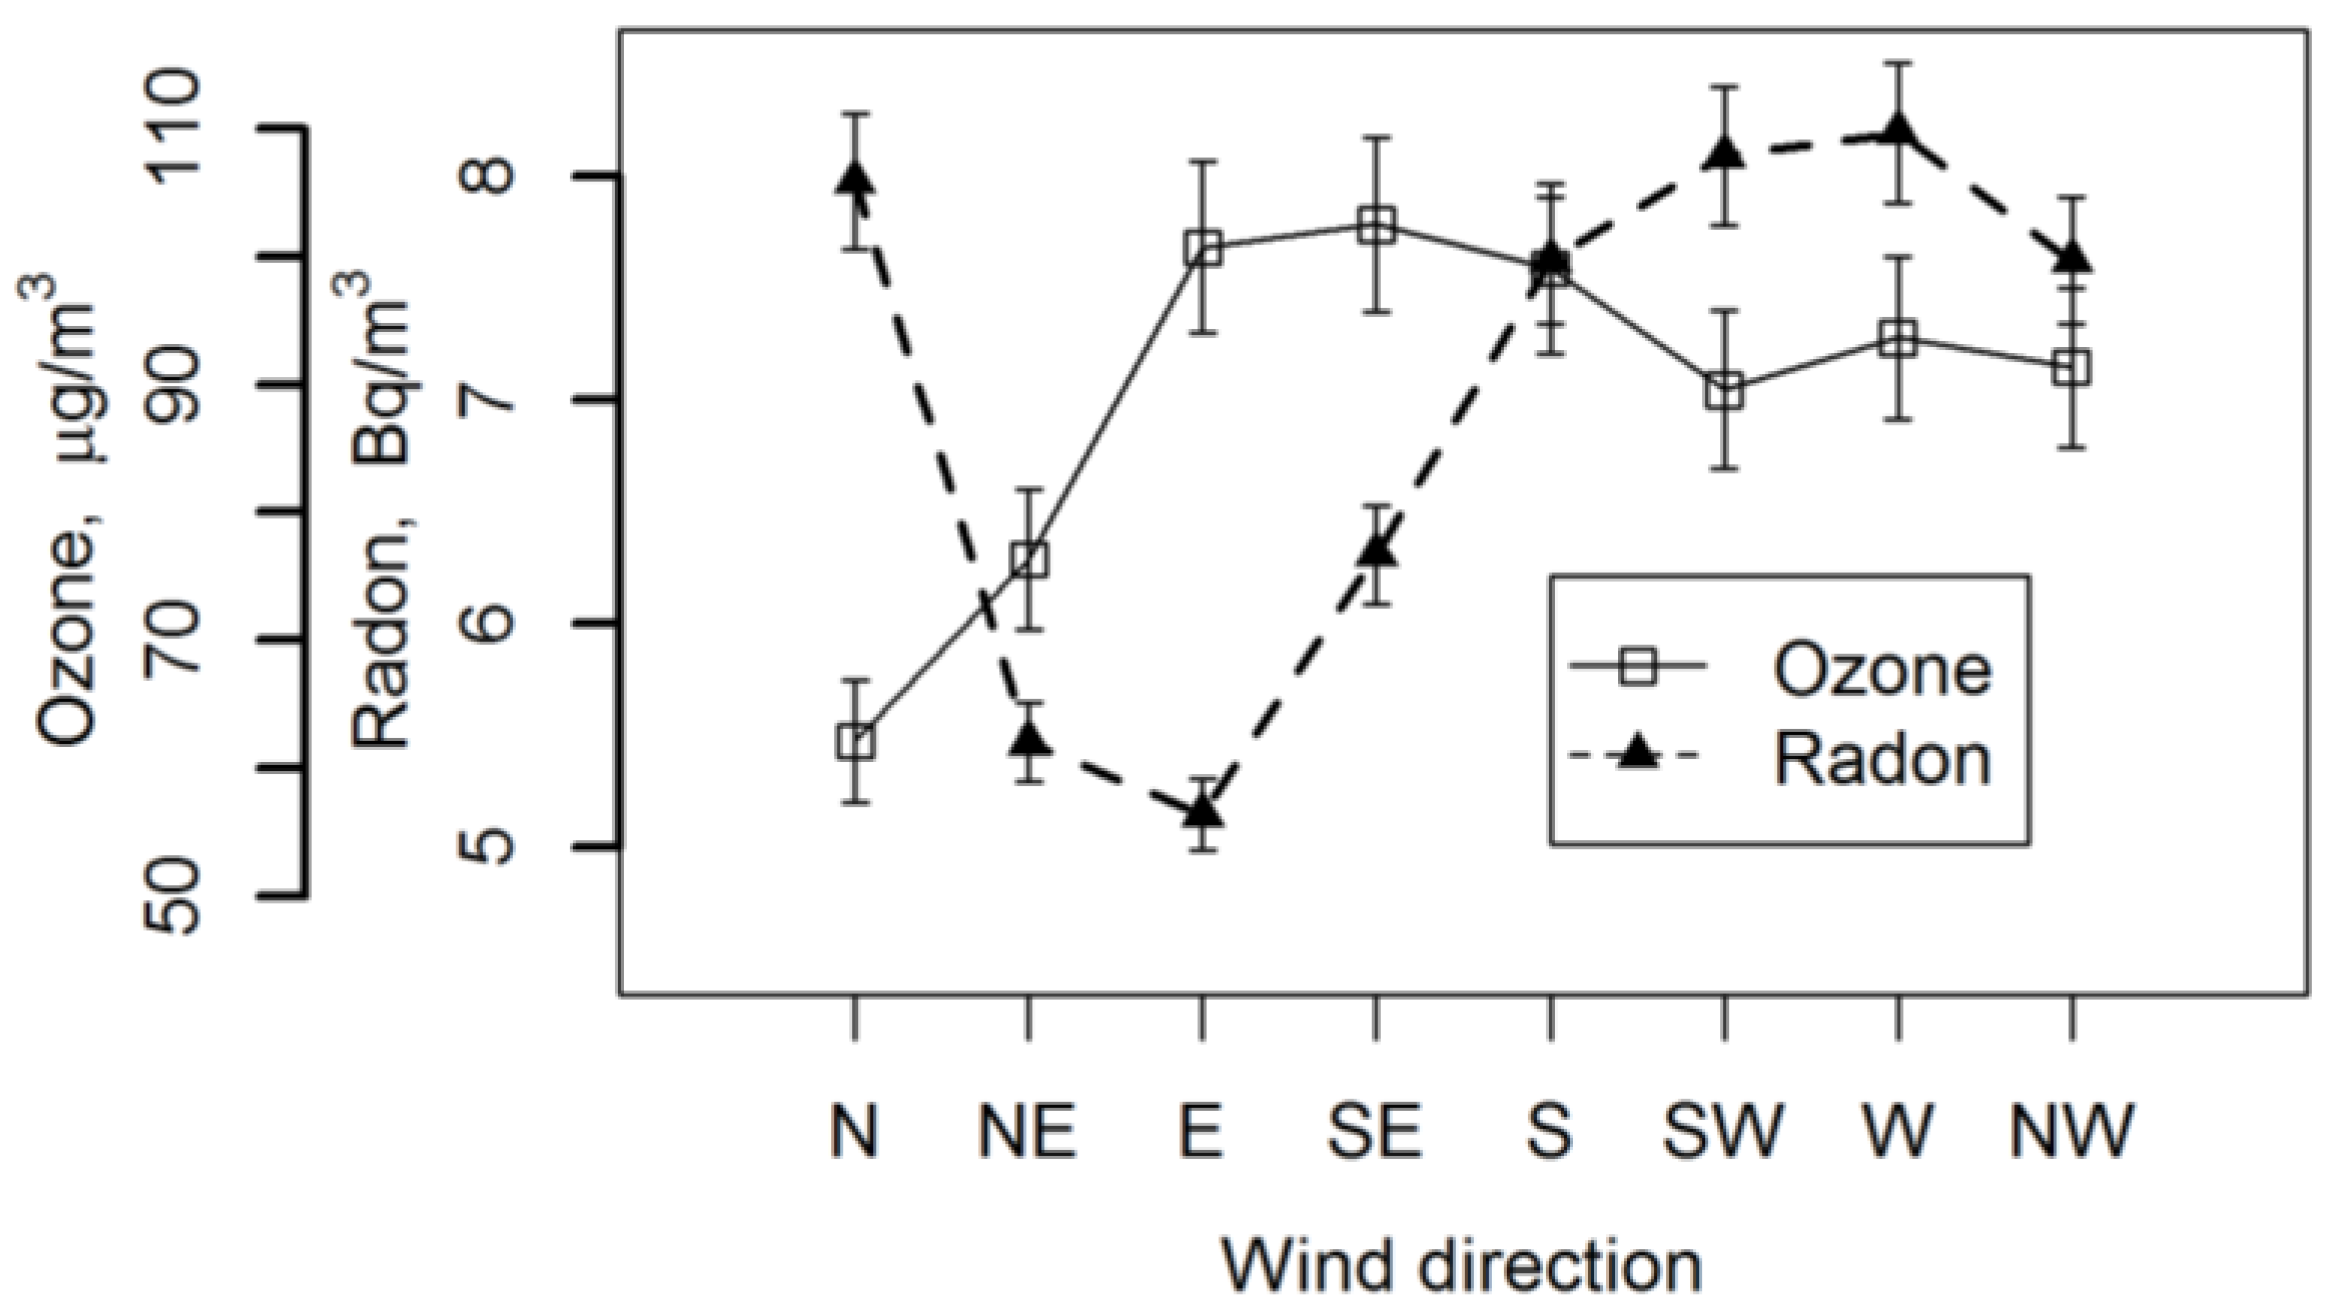
- Meteorological parameters such as relative humidity, wind speed and wind direction have various effects on ozone concentration at the ground level of the atmosphere. Data analysis has shown that surface ozone concentrations increase with the increase of temperature; however, it is not significantly related to relative air humidity. It was observed that ozone concentration decreased during the rainy period. However, the wind direction had the largest influence on the variation of ozone concentrations during the study period.
- Interdependence between ozone concentration and radon activity variations has been observed. The clear inverse diurnal course of these pollutants has been determined. The especially clearly expressed relationship between these pollutants has been observed under the conditions of anticyclone. Radon activity concentration is inversely correlated with the level of vertical mixing in the atmospheric surface layer, which is one of the most important factors of ozone variability.
- A higher ozone concentration in the atmospheric boundary layer was found when the wind blew from the Baltic Sea towards the continent due to low rate of ozone decay to the water surface. Higher radon activity concentrations were found when the wind blew from the continent. The simultaneous measurements of the ground-level ozone concentration and radon activity concentration gave the possibility of identifying the presence of a breeze phenomenon on the eastern coast of the Baltic Sea under extreme weather conditions in summer.
Acknowledgments
Author Contributions
Conflicts of Interest
References
- Previdi, M.; Polvani, L.M. Climate system response to stratospheric ozone depletion and recovery. Q. J. R. Meteorol. Soc. 2014, 140, 2401–2419. [Google Scholar] [CrossRef]
- Revell, L.E.; Tummon, F.; Stenke, A.; Sukhodoloy, T.; Coulon, A.; Rozanov, E.; Garny, H.; Grewe, V.; Peter, T. Drivers of the tropospheric ozone budget throughout the 21st century under the medium-high climate scenario RCP 6.0. Atmos. Chem. Phys. 2015, 15, 5887–5902. [Google Scholar] [CrossRef]
- Zhang, H.; Wu, S.; Huang, I.; Wang, I. Effects of stratospheric ozone recovery on photochemistry and ozone air quality in the troposphere. Atmos. Chem. Phys. 2014, 14, 4079–4086. [Google Scholar] [CrossRef]
- Aggarwal, A.; Kumari, R.; Mehla, N.; Deepali; Singh, R.P.; Bhatnagar, S.; Sharma, K.; Sharma, K.; Vashishtha, A.; Rathi, B. Depletion of the ozone layer and its consequences: A review. Am. J. Plant. Sci. 2013, 4, 1990–1997. [Google Scholar] [CrossRef]
- Yagura, T.; Makita, K.; Yamamoto, H.; Menck, C.F.; Schuch, A.P. Biological sensors for solar ultraviolet radiation. Sensors 2011, 11, 4277–4294. [Google Scholar] [CrossRef] [PubMed]
- Tian, J.Y.; Yu, J. Changes in ultrastructure and responses of antioxidant systems of algae (Dunaliella salina) during acclimation to enhanced ultraviolet-B radiation. J. Photochem. Photobiol. B Biol. 2009, 97, 152–160. [Google Scholar] [CrossRef] [PubMed]
- Zerefos, C.S.; Tourpali, K.; Eleftheratos, K.; Kazadzis, S.; Meleti, C.; Feister, U.; Koskela, T.; Heikkilä, A. Evidence of a possible turning point in solar UV-B over Canada, Europe and Japan. Atmos. Chem. Phys. 2012, 12, 2469–2477. [Google Scholar] [CrossRef] [Green Version]
- Vaida, V.; Feierabend, K.J.; Rontu, N.; Takahashi, K. Sunlight-initiated photochemistry: Excited vibrational states of atmospheric chromophores. Int. J. Photoenergy 2008, 138091, 1–13. [Google Scholar] [CrossRef]
- Bordi, I.; Berrilli, F.; Pietropaolo, E. Long-term response of stratospheric ozone and temperature to solar variability. Ann. Geophys. 2015, 33, 267–277. [Google Scholar] [CrossRef] [Green Version]
- Feister, U.; Cabrol, N.; Häder, D.-P. UV irradiance enhancements by scattering of solar radiation from clouds. Atmosphere 2015, 5, 1211–1228. [Google Scholar] [CrossRef]
- Doherty, R.M.; Wild, O.; Shindell, D.T.; Zeng, G.; MacKenzie, I.A.; Collins, W.J.; Fiore, A.M.; Stevenson, D.S.; Dentener, F.J.; Schultz, M.G.; et al. Impacts of climate change on surface ozone and intercontinental ozone pollution: A multi-model study. J. Geophys. Res. Atmos. 2013, 118, 3744–3763. [Google Scholar] [CrossRef] [Green Version]
- Anet, J.G.; Rozanov, E.V.; Muthers, S.; Peter, T.; Brönnimann, S.; Arfeuille, F.; Beer, J.; Shapiro, A.I.; Raible, C.C.; Steinhilber, F. Impact of a potential 21st century “grand solar minimum” on surface temperatures and stratospheric ozone. Geophys. Res. Lett. 2013, 40, 4420–4425. [Google Scholar] [CrossRef] [Green Version]
- Wargan, K.; Pawson, S.; Stajne, I.; Thouret, V. Spatial structure of assimilated ozone in the upper troposphere and lower stratosphere. J. Geophys. Res. 2010, 115, D24316. [Google Scholar] [CrossRef]
- Monks, P.S.; Archibald, A.T.; Colette, A.; Cooper, O.; Coyle, M.; Derwent, R.; Fowler, D.; Granier, C.; Law, K.S.; Stevenson, D.S.; et al. Tropospheric ozone and its precursors from the urban to the global scale from air quality to short-lived climate forcer. Atmos. Chem. Phys. 2015, 15, 8889–8973. [Google Scholar] [CrossRef] [Green Version]
- Lang, C.; Waugh, D.W.; Olsen, M.A.; Douglass, A.R.; Liang, Q.; Nielsen, J.E.; Oman, L.D.; Pawson, S.; Stolarski, R.S. The impact of greenhouse gases on past changes in tropospheric ozone. J. Geophys. Res. Atmos. 2012, 117, D23304. [Google Scholar] [CrossRef]
- Young, E.; Paton-Wash, C. Emission ratios of the tropospheric ozone precursors nitrogen dioxide and formaldehyde from Australia’s black Saturday fires. Atmosphere 2011, 2, 617–632. [Google Scholar] [CrossRef]
- Khoder, M.I. Diurnal, seasonal and weekdays-weekends variations of ground level ozone concentrations in an urban area in greater Cairo. Environ. Monit. Assess. 2009, 149, 349–362. [Google Scholar] [CrossRef] [PubMed]
- Girgždienė, R.; Byčenkienė, S.; Girgždys, A. Variations and trends of AOT40 and ozone in the rural areas of Lithuania. Environ. Monit. Assess. 2007, 127, 327–335. [Google Scholar] [CrossRef] [PubMed]
- Andersson, C.; Engardt, M. European ozone in a future climate: Importance of changes in dry deposition and isoprene emissions. J. Geophys. Res. Atmos. 2010, 115, D02303. [Google Scholar] [CrossRef]
- Katragkou, E.; Zanis, P.; Tsikerdekis, A.; Kapsomenakis, J.; Melas, D.; Eskes, H.; Flemming, J.; Huijnen, V.; Inness, A.; Schultz, M.G.; et al. Evaluation of near-surface ozone over Europe from the MACC reanalysis. Geosci. Model. Dev. 2015, 8, 2299–2314. [Google Scholar] [CrossRef]
- Toh, Y.Y.; Fook, L.S.; von Glasow, R. The influence of meteorological factors and biomass burning on surface ozone concentrations at Tanah Rata, Malaysia. Atmos. Environ. 2013, 70, 435–446. [Google Scholar] [CrossRef]
- Civerolo, K.; Hogrefe, C.; Lynn, B.; Rosenthal, J.; Ku, J.Y.; Solecki, W.; Cox, J.; Small, C.; Rosenzweig, C.; Goldberg, R.; et al. Estimating the effects of increased urbanization on surface meteorology and ozone concentrations in the New York City metropolitan region. Atmos. Environ. 2007, 41, 1803–1818. [Google Scholar] [CrossRef]
- Panday, A.; Prinn, R.G. Diurnal cycle of air pollution in the Kathmandu Valley, Nepal: Observations. J. Geophys. Res. 2009, 114, D09305. [Google Scholar] [CrossRef]
- Putero, D.; Cristofanelli, P.; Marinoni, A.; Adhikary, B.; Duchi, R.; Shrestha, S.D.; Verza, G.P.; Landi, T.C.; Calzolari, F.; Busetto, M.; et al. Seasonal variation of ozone and black carbon observed at Paknajol, an urban site in the Kathmandu Valley, Nepal. Atmos. Chem. Phys. Discuss. 2015, 15, 22527–22566. [Google Scholar] [CrossRef]
- Tong, N.Y.O.; Leung, D.Y.C.; Liu, C.-H. A review on ozone evolution and its relationship with boundary layer characteristics in urban environments. Water Air Soil Pollut. 2011, 214, 13–36. [Google Scholar] [CrossRef]
- Banerjee, A.; Archibald, A.T.; Maycock, A.C.; Telford, P.; Abraham, N.L.; Yang, X.; Braesicke, P.; Pyle, J.A. Lightning NOx, a key chemistry-climate interaction: Impacts of future climate change and consequences for tropospheric oxidizing capacity. Atmos. Chem. Phys. 2014, 14, 9871–9881. [Google Scholar] [CrossRef]
- Desideri, D.; Roselli, C.; Meli, M.A.; Feduzi, L. Comparison between the diurnal trends of ozone and radon gas concentrations measured at ground in the semi-rural site of Central Italy. J. Radioanal. Nucl. Chem. 2007, 273, 345–351. [Google Scholar] [CrossRef]
- Kalbarczyk, R.; Kalbarczyk, E. Assessment of the value of tropospheric ozone concentration depending on meteorological conditions as exemplified by the Widuchowa station (north-West Poland). Ekol. Bratisl. 2010, 29, 398–411. [Google Scholar] [CrossRef]
- Kulkarni, P.S.; Bortoli, D.; Silva, A. Nocturnal surface ozone enhancement and trend over urban and suburban sites in Portugal. Atmos. Environ. 2013, 71, 251–259. [Google Scholar] [CrossRef]
- Postawczyńska, A.; Kozak, K.; Pawlak, W.; Mazur, J. Seasonal and diurnal variation of outdoor radon (222Rn) concentrations in urban and rural area with reference to meteorological conditions. Nukleonika 2010, 55, 543–547. [Google Scholar]
- Ghita, A.; Vasilescu, A. Radon assessment with solid-state nuclear track detectors in Bucgarest and its surrounding region. Rom. Rep. Phys. 2011, 63, 940–947. [Google Scholar]
- Burnett, B.; Nelson, T.; Corbett, R.; Robinson, L.; Weaver, J.; McKisson, J.E.; Lane-Smith, D. Improvements the measurement of Rn-222 in natural waters. In Proceedings of the 44th Annual Conference on Bioassay, Analytical, and Environmental Radiochemistry, Albuquerque, NM, USA, 7–11 November 1998.
- Smetanova, I.; Holy, K.; Muellerova, M.; Polaskova, A. The effect of meteorological parameters on radon concentration in borehole air and water. J. Radioanal. Nucl. Chem. 2009, 283, 101–109. [Google Scholar] [CrossRef]
- Jasaitis, D.; Girgždys, A. Hourly measurement method for radon progeny volumetric activity in air. J. Environ. Eng. Landsc. 2007, 15, 158–165. [Google Scholar]
- Diffey, B.L. Solar ultraviolet radiation effects on biologicalm systems. Phys. Med. Biol. 1991, 36, 299–328. [Google Scholar] [CrossRef] [PubMed]
- Avino, P.; Manigrasso, M. Ozone formation with combustion processes in highly populated urban areas. AIMS Environ. Sci. 2015, 2, 764–781. [Google Scholar] [CrossRef]
- Pudasainee, D.; Balkrishna, S.; Shrestha, M.L.; Kaga, A.; Kondo, A.; Inoue, Y. Ground level ozone concentrations and its association with NOx and meteorological parameters in Kathmandu valley, Nepal. Atmos. Environ. 2006, 40, 8081–8087. [Google Scholar] [CrossRef]
- An, J.L.; Wang, Y.S.; Li, X.; Sun, Y.; Shen, S.H. Relationship between surface UV radiation and air pollution in Beijing. Environ. Sci. 2008, 29, 1054–1058. [Google Scholar]
- Avino, P.; Manigrasso, M. Ten-year measurements of gaseous pollutants in urban air by an open-path analyzer. Atmos. Environ. 2008, 42, 4138–4148. [Google Scholar] [CrossRef]
- Di Carlo, P.; Pitari, G.; Mancini, E.; Gentile, S.; Pichelli, E.; Visconti, G. Evolution of surface ozone in central Italy based on observations and statistical model. J. Geophys. Res. 2007, 112, D10316. [Google Scholar] [CrossRef]
- Baciu, A.C. Radon and thoron progeny concentr ation variability in relation to meteorological conditions at Bucharest (Romania). J. Environ. Radioact. 2005, 83, 171–189. [Google Scholar] [CrossRef] [PubMed]
- Zoran, M.; Dida, M.R.; Savastru, R.; Savastru, D.; Dida, A.; Ionescu, O. Ground level ozone (O3) associated with radon (222Rn) and particulate matter (PM) concentrations and adverse health effects. J. Radional. Nucl. Chem., 2014, 300, 729–746. [Google Scholar] [CrossRef]
- Porstendorfer, J.; Butterweck, G.; Reineking, A. Daily variation of indoor radon concentration indoors and outdoors and the influence of meteorological parameters. Health Phys. 1994, 67, 283–287. [Google Scholar] [CrossRef] [PubMed]
- Dörr, H.; Kromer, B.; Levin, I.; Munnich, K.O.; Volpp, H.J. CO2 and radon-222 as tracers for atmospheric transport. J. Geophys. Res. 1993, 88, 1309–1313. [Google Scholar] [CrossRef]
- Zoran, M.; Savastru, D.; Dida, A. Assessing urban air quality and its relation with radon (222Rn). J. Radional. Nucl. Chem. 2016, 1–14. [Google Scholar] [CrossRef]
- Avino, P.; Manigrasso, M.; Cuomo, F. Natural radioactivity as an easy and quick parameter for describing the dynamic of the Planetary Boundary Layer. RSC Adv. 2015, 5, 57538–57549. [Google Scholar] [CrossRef]
© 2016 by the authors; licensee MDPI, Basel, Switzerland. This article is an open access article distributed under the terms and conditions of the Creative Commons by Attribution (CC-BY) license (http://creativecommons.org/licenses/by/4.0/).
Share and Cite
Jasaitis, D.; Vasiliauskienė, V.; Chadyšienė, R.; Pečiulienė, M. Surface Ozone Concentration and Its Relationship with UV Radiation, Meteorological Parameters and Radon on the Eastern Coast of the Baltic Sea. Atmosphere 2016, 7, 27. https://doi.org/10.3390/atmos7020027
Jasaitis D, Vasiliauskienė V, Chadyšienė R, Pečiulienė M. Surface Ozone Concentration and Its Relationship with UV Radiation, Meteorological Parameters and Radon on the Eastern Coast of the Baltic Sea. Atmosphere. 2016; 7(2):27. https://doi.org/10.3390/atmos7020027
Chicago/Turabian StyleJasaitis, Dainius, Vaida Vasiliauskienė, Renata Chadyšienė, and Milda Pečiulienė. 2016. "Surface Ozone Concentration and Its Relationship with UV Radiation, Meteorological Parameters and Radon on the Eastern Coast of the Baltic Sea" Atmosphere 7, no. 2: 27. https://doi.org/10.3390/atmos7020027
APA StyleJasaitis, D., Vasiliauskienė, V., Chadyšienė, R., & Pečiulienė, M. (2016). Surface Ozone Concentration and Its Relationship with UV Radiation, Meteorological Parameters and Radon on the Eastern Coast of the Baltic Sea. Atmosphere, 7(2), 27. https://doi.org/10.3390/atmos7020027