Article

Impact of Stratospheric Volcanic Aerosols on Age-of-Air and Transport of Long-Lived Species

1
Giovanni Pitari, Department of Physical and Chemical Sciences, Università dell’Aquila, 67100 L’Aquila, Italy
2
Enea, Ente per le Nuove Tecnologie, L’Energia e L’Ambiente, 00123 Roma, Italy
3
CETEMPS—Centre of Excellence, Università dell’Aquila, 67100 L’Aquila, Italy
*
Author to whom correspondence should be addressed.
Atmosphere 2016, 7(11), 149; https://doi.org/10.3390/atmos7110149
Submission received: 30 September 2016 / Revised: 16 November 2016 / Accepted: 17 November 2016 / Published: 22 November 2016
(This article belongs to the Special Issue Atmospheric Aerosols and Their Radiative Effects)

Abstract

:
The radiative perturbation associated to stratospheric aerosols from major explosive volcanic eruptions may induce significant changes in stratospheric dynamics. The aerosol heating rates warm up the lower stratosphere and cause a westerly wind anomaly, with additional tropical upwelling. Large scale transport of stratospheric trace species may be perturbed as a consequence of this intensified Brewer–Dobson circulation. The radiatively forced changes of the stratospheric circulation during the first two years after the eruption of Mt. Pinatubo (June 1991) may help explain the observed trend decline of long-lived greenhouse gases at surface stations (approximately −8 and −0.4 ppbv/year for CH4 and N2O, respectively). This decline is partly driven by the increased mid- to high-latitude downward flux at the tropopause and also by an increased isolation of the tropical pipe in the vertical layer near the tropopause, with reduced horizontal eddy mixing. Results from a climate-chemistry coupled model are shown for both long-lived trace species and the stratospheric age-of-air. The latter results to be younger by approximately 0.5 year at 30 hPa for 3–4 years after the June 1991 Pinatubo eruption, as a result of the volcanic aerosols radiative perturbation and is consistent with independent estimates based on long time series of in situ profile measurements of SF6 and CO2. Younger age of air is also calculated after Agung, El Chichón and Ruiz eruptions, as well as negative anomalies of the N2O growth rate at the extratropical tropopause layer. This type of analysis is made comparing the results of two ensembles of model simulations (1960–2005), one including stratospheric volcanic aerosols and their radiative interactions and a reference case where the volcanic aerosols do not interact with solar and planetary radiation.

Graphical Abstract

1. Introduction

Large explosive volcanic eruptions are capable of injecting considerable amounts of particles and sulfur gases above the tropopause, causing increases in stratospheric aerosol optical depth even larger than one order of magnitude [1,2]. Perturbations of trace species transport [3,4,5] result from dynamical changes due to stratospheric aerosol heating [6] and climate changes associated with increasing scattering of the incoming solar radiation [7,8,9]. Stratospheric dynamical perturbations may in turn affect surface climate [10]. Summarizing, the dynamical perturbation of the volcanic aerosols is twofold: (a) the stratospheric mean meridional circulation is affected by local aerosol radiative heating and photo-chemically induced ozone changes [11]; and (b) the planetary wave propagation in the mid- to high-latitude lower stratosphere is altered as a consequence of perturbed atmospheric stability due to the climate perturbation and the westerly wind positive anomaly in the stratosphere [6]. The latter is a consequence of the lower stratospheric temperature increase [12] due to the additional aerosol heating rates [6]. For tropical eruptions (or planned sulfate geoengineering), the stronger pole-to-equator gradient of net heating rates ends up in an additional residual upwelling motion [5,13].
As a consequence, the large scale transport of stratospheric trace species may be radiatively affected by the volcanic aerosols from major eruptions, as well as the dispersal of the aerosol cloud itself [14,15]. The phase of the quasi-biennial oscillation (QBO) of equatorial mean zonal winds, however, is even more important for stratospheric trace species transport, including volcanic aerosol transport [6,16]. Using satellite aerosol data, Trepte and Hitchman [16] have studied the tropical stratospheric circulation under dominant easterly or westerly shear of the QBO. Enhanced upwelling motion is found everywhere in the tropical stratosphere during years with dominant easterly shear, while descent relative to the mean stratospheric circulation occurs over the equator during years with dominant westerly shear. In the latter case, more aerosols can be transported downward close to the tropopause, where poleward isentropic transport is rather efficient. The additional upwelling forced by volcanic aerosols from major tropical eruptions has therefore a feedback on the stratospheric dynamics similar to that of the QBO easterly shear and may help confine the aerosol particles in the tropical reservoir, increasing their lifetime [6]. The QBO-modulated level of isolation of the stratospheric tropical pipe may also significantly affect the horizontal mixing of stratospheric trace species and age of air [17].
An enhanced aerosol loading in the tropical stratosphere, in turn, may also modify the natural evolution of the QBO itself. Aquila et al. [18] have studied the possible impact of a sustained stratospheric injection of SO2, as suggested, for geoengineering experiments. In their study, they found that such an injection dramatically alters the QBO, prolonging the time permanence of the westerly phase in the tropical lower stratosphere.
The radiatively forced changes of the stratospheric circulation during the first two years after the eruption of Mt. Pinatubo (June 1991) may help explain the observed growth rate decline of long-lived greenhouse gases (CH4 and N2O in particular) [4,19], as a result of the increased mid- to high-latitude downward flux at the tropopause in the lower branch of the Brewer–Dobson circulation (BDC). Since the stratosphere contains lower CH4 and N2O mixing ratios, a decline in the observed trends could result from a higher degree of exchange between the stratosphere and the troposphere. Changes in tropospheric OH may also have affected the CH4 abundance after the Pinatubo eruption [20,21], through the following mechanisms: (a) tropospheric water vapor response to the aerosol-driven surface cooling, followed by a decreased OH production; (b) perturbed tropospheric UV budget, due to additional aerosol scattering and stratospheric ozone changes; and (c) increase of sulfate aerosol surface area density (SAD) in the mid-upper troposphere, which enhances the heterogeneous chemical loss of NOx. The role of OH variability has also been proposed to explain the flat CH4 growth rate from 1999 to 2006 [22], as well as decreasing anthropogenic CH4 emissions in Europe and Siberia [23,24].
Ray et al. [17] have used a tropical leaky pipe model [25] and SF6 and CO2 measurements to study the time series of the stratospheric age of air from 1975 to 2012. They found age variability associated with seasonal, QBO and decadal time scales, with the QBO variability being largest in the 20–30 km altitude range, consistent with the mean age analysis of Diallo et al. [26]. The age time series of Ray et al. [17] also shows two distinct minima above 25 km in the mid-1980s and early 1990s, following the eruptions of El Chichón and Pinatubo, respectively. Younger age of air is expected in connection with the aerosol radiative perturbations and related enhancement of the tropical upwelling. The largest increase of the stratospheric residual vertical velocity is found in the 20–28 km altitude region after major volcanic eruptions [27], so that age of air changes should be found inside or above this region.
The age of air behavior, however, cannot be simply related to the tropical ascent rate and its perturbations in the lower and mid-stratosphere, due to the simultaneous controlling role of the large scale horizontal mixing. Strahan et al. [28] have diagnosed stratospheric transport in climate-chemistry coupled models using observed data for age of air and N2O mixing ratios, for a better assessment of the two main factors controlling stratospheric species transport, i.e., tropical ascent rate and horizontal mixing. These two together affect the stratospheric age of air, whereas the latitudinal age gradient vertical profile may be regarded as an empirical measure of the ascent [25], at least in the limit of low vertical diffusion. This is because the horizontal mixing across the subtropics would equally affect both tropical and mid-latitude mean age, so that its latitudinal gradient would remain unchanged. On the other hand, the tropical N2O vertical profile can be regarded as a measure of the horizontal mixing, because tropical N2O has essentially no loss below 30 hPa, so that the tracer mixing ratio is insensitive to the ascent alone. The decreasing mixing ratio with height is due to the effects of horizontal mixing as the air ascends. This means that the volcanic aerosol radiative perturbation has to be considered not only on the tropical vertical upwelling, but also in its potential impact on the tropical pipe isolation, as observed above for the QBO phase effects.
Long time trends of age of air resulting from changes of the Brewer–Dobson circulation have been discussed in Ray et al. [17] and Garfinkel et al. [29]. They found a distinctly different behavior between the lower stratosphere (with a steady accelerating BDC and decreasing age of air) and the mid-stratosphere, which shows a more complex behavior. The analysis of Garfinkel et al. [29] highlights a decelerating BDC and an increasing age of air from late 1980s for approximately 25 years and contrary to the previous decades, despite increases in greenhouse gas concentrations and warming sea surface temperatures. This deceleration recalls changes inferred from in situ balloon-based stratospheric observations [17,30] and satellite data [31].
The volcanic aerosol perturbation on long-lived species transport and stratospheric age-of-air will be discussed in this study by means of numerical simulations conducted with the University of L’Aquila climate-chemistry-aerosol coupled model (ULAQ-CCM). This type of analysis is made by comparing the results of two ensembles of model simulations: a reference case (1960–2005) with no volcanic heating perturbations and a sensitivity experiment where the radiative impact of stratospheric aerosols from the major volcanic eruptions has been considered. A detailed evaluation is made for age-of-air and stratospheric trace species calculated in the ULAQ model, using available observations from aircraft, balloons and satellite instruments.

2. Experimental Section

The climate-chemistry-aerosol coupled model used in this study (ULAQ-CCM) has been documented in the recent literature [13] and properly evaluated in model inter-comparison campaigns [32,33,34], with detailed analyses and model inter-comparison of long term trends of tropopause temperature and water vapor [35], stratospheric ozone [36], surface UV [37] and age of air [38]. The radiative module has been evaluated for the calculation of photolysis rates in SPARC-Photocomp-2011 (Stratosphere-Troposphere Processes and their Role in Climate) [39,40] and for the calculation of shortwave radiative fluxes in AeroCom-2011 [41]. The radiative module for both shortwave and longwave radiative fluxes has also been tested and evaluated in Pitari et al. [42].
For the sake of completeness we briefly summarize here the basic model features. The ULAQ-CCM is a global scale composition-climate coupled model, including on-line aerosol-chemistry-climate interactions. It uses 126 log-pressure vertical levels extending from the surface to the mesosphere (0.04 hPa), with a T21 horizontal resolution (5° × 6° lat × lon). In the main region of study (i.e., 100–10 hPa), the ULAQ-CCM includes 30 vertical levels, with an altitude resolution of 0.568 km. The model includes an external forcing code for the QBO, using a time series of monthly-mean observed equatorial zonal winds from 1960 to 2010 [43]. Monthly varying boundary conditions are used for long-lived species, sea surface temperatures (SST) and aerosol SAD. Top-of-atmosphere solar fluxes are also prescribed as monthly varying spectrally-resolved solar irradiance data from the NRLSSI model. Details on the external data sources for long-lived species mixing ratios, sea surface temperatures, aerosol SAD and top-of-atmosphere solar fluxes are given in Eyring et al. [44]. The radiative transfer module operating on-line in the ULAQ-CCM, is a two-stream delta-Eddington approximation model for the calculation of photolysis rates in the ultra-violet (UV) to visible (VIS) wavelengths and for solar heating rates and radiative forcing in UV-VIS and solar near-infrared (NIR) bands [45]. In addition, a companion broadband, k-distribution longwave radiative module is used to compute radiative transfer and heating rates in the planetary infrared spectrum [46].
The chemistry module calculates the chemical evolution of long-lived and surface-flux species (CH4, N2O, CFCs, HCFCs, CO, NOx, NMVOC (i.e., non-methane volatile organic compounds)), with medium- and short-lived species grouped in the families Ox, NOy, HOx, CHOx, Cly, Bry, SOx and aerosols. The model includes the major components of stratospheric and tropospheric aerosols (sulfate, nitrate, organic and black carbon, soil dust, sea salt, PSCs). The aerosol module includes SOx chemistry, gas-particle conversion (starting from SO2 oxidation by OH, H2O2, O3) and microphysical processes for aerosol growth (homogeneous/heterogeneous nucleation, coagulation, condensation/evaporation); this allows explicit prediction of the sulfate aerosol size distribution. Details on tropospheric sulfur chemistry and aerosol products evaluation with satellite observations are given in Pitari et al. [47]; aircraft and in-situ campaign data have also been used to evaluate the ULAQ model tropospheric chemistry [47,48].
A detailed description of the numerical experiments made for this study is given in Pitari et al. [6], which should be intended as a companion paper of the present one. Pitari et al. [6] focus on volcanic aerosol transport, lifetime, size distribution, stratospheric circulation changes and radiative forcing, whereas the goal of the present study is to analyze the impact of the aerosol induced radiative perturbation on stratospheric species transport and age of air. In the present work, the model has been run for a total of 20 time-dependent simulations from 1960 to 2005. Of these numerical experiments, 10 will be from now on referred to as “volcanic perturbed” simulations (VE) with inclusions of the volcanic aerosols, both in heterogeneous chemistry and in the radiative transfer code (see Table 1). The other 10 experiments will be referred to as “reference” simulations (REF): they do not include the volcanic aerosols, except in the heterogeneous chemistry code, through use of externally specified time-dependent fields of SAD [44]. This same SAD is also used in the VE experiments, so that we may isolate the radiative impact of the volcanic aerosols, keeping heterogeneous chemistry unchanged, between VE and REF experiments. Results will be presented and discussed in terms of VE-REF anomalies, obtained from an average over the ensemble of simulations, in order to highlight the role of volcanic aerosols radiative interactions.
Performing an ensemble of simulations allows for a significant increase in the robustness of the calculated VE-REF anomalies for the main quantities involved in this study (vertical velocity, mean zonal wind, horizontal eddy fluxes, age of air, mixing ratio of long-lived tracers). As an example, the 20–30 hPa anomaly of the residual vertical velocity in the second half of 1991 (i.e., the Pinatubo case) is calculated to be 0.050 ± 0.015 mm/s, with the uncertainty being the standard deviation from the ensemble of simulations. Another important example is the mid-stratospheric westerly wind anomaly in the same period of time, calculated in the range of 7–10 m/s at 10 hPa and 45° latitude. The interannual variability of mean zonal wind anomalies relative to a reference decade (1970–1979) is calculated to be 2.7 m/s at the same location (i.e., 10 hPa and 45° latitude), measured by the standard deviation from the ensemble of all REF simulations. As a final example, the wintertime horizontal eddy heat flux anomaly at 100 hPa and 40°N–50°N latitude is calculated to be −2.6 ± 1.0 K·m·s−1 during winter months of 1992/1993 (i.e., −20% of the average REF value), with the uncertainty being again the standard deviation from the ensemble of simulations.

3. Results and Discussion

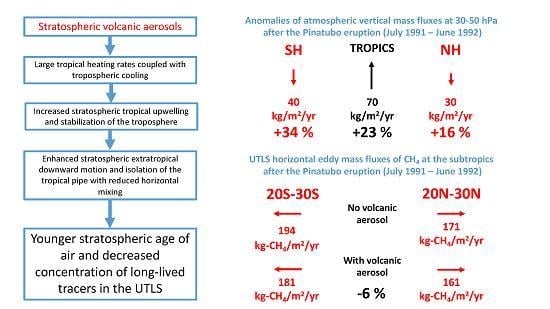
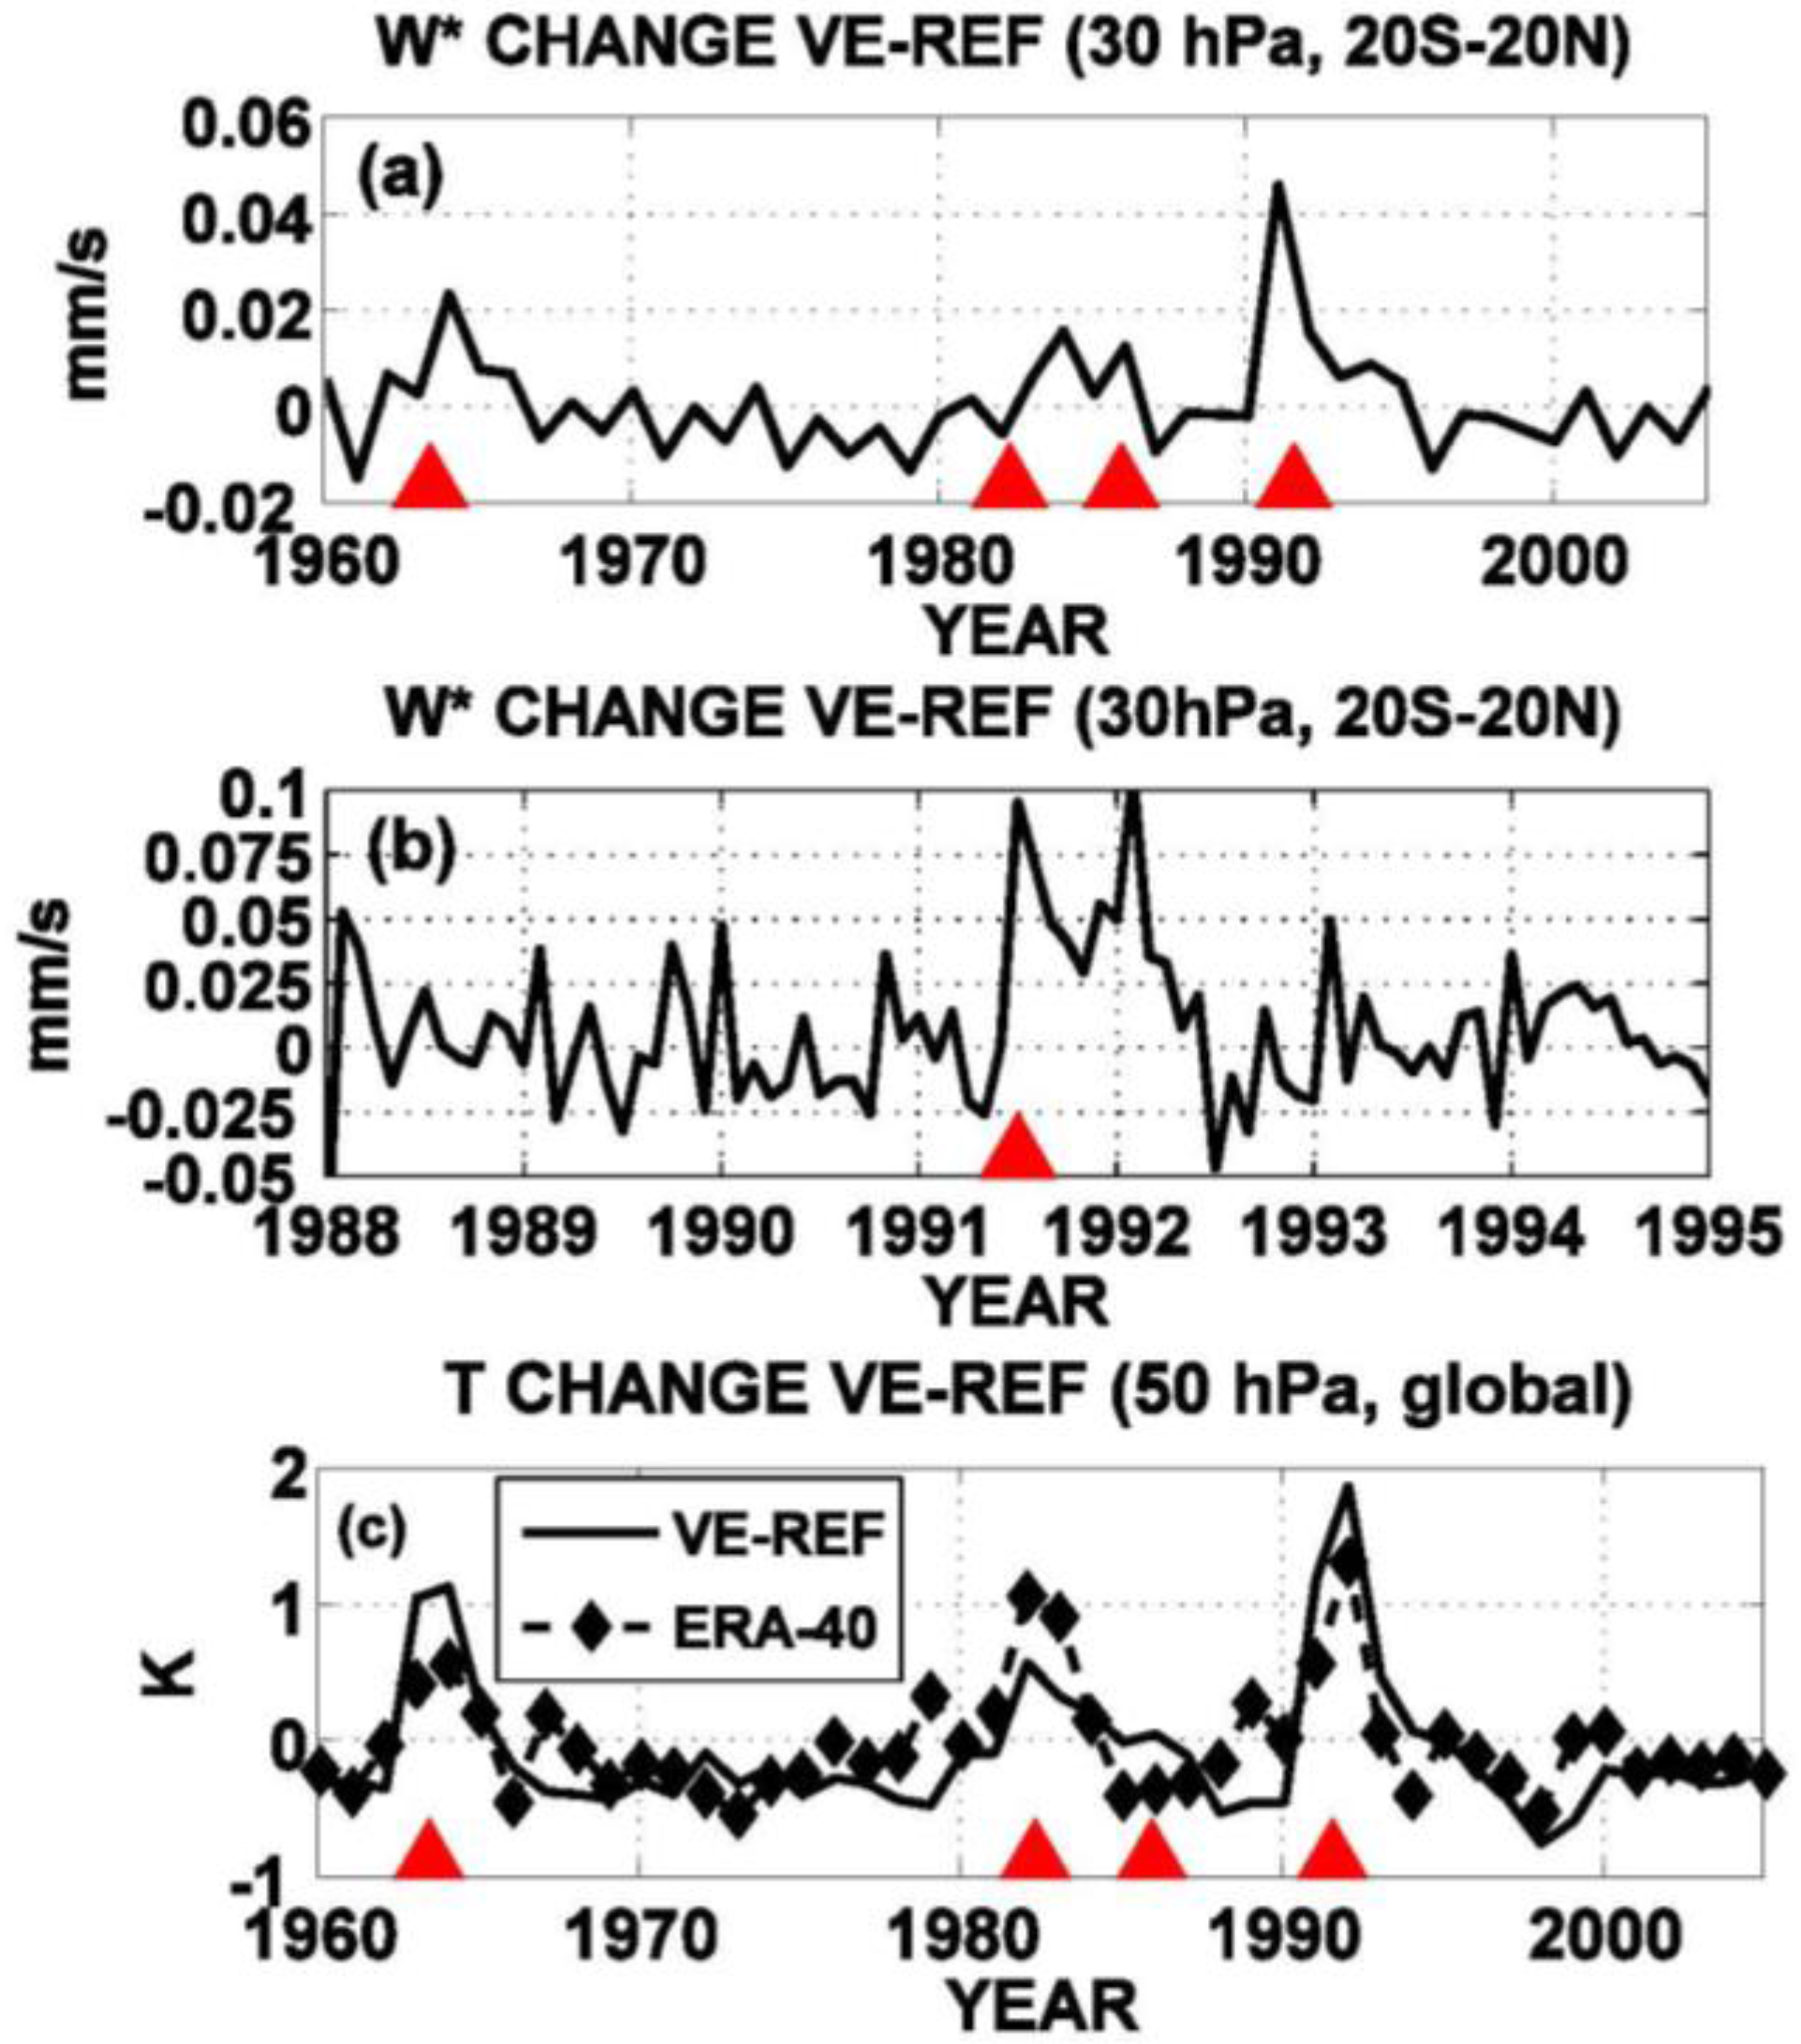
The model calculated anomalies (VE-REF) of the residual vertical velocity (w*) in the tropical stratosphere (30 hPa, 20°S–20°N) are presented in Figure 1a,b, as time series of annually averaged values from 1960 to 2005 (Figure 1a) and monthly averaged values from 1988 to 1994 (Figure 1b, Pinatubo case). Enhanced tropical upwelling of the order of 10%–40% is calculated during July 1991–June 1992 as a result of the additional aerosol heating rates in the tropical lower stratosphere, with consequent temperature increase and extratropical westerly wind anomaly that favors planetary wave propagation from the troposphere [6]. By continuity, this enhanced tropical upwelling enhances the downwelling in the extra-tropics [15].
A detailed discussion of the Pinatubo aerosol heating rates along with the consequent perturbation in the lower stratospheric dynamics is given in Pitari [3] and more recently in Pitari et al. [6]. In the latter paper the role of the QBO is discussed, for producing a better confinement of the volcanic aerosols in the tropical pipe during time periods of easterly shear of the mean zonal equatorial winds, as in the Pinatubo case [16]. The volcanic perturbation of the dynamics lasts as long as there is a strong gradient of the aerosol concentration between the tropics and mid-latitudes [5]. For this reason a major volcanic event taking place with easterly shear of the QBO during the months following the eruption (i.e., Pinatubo) is expected to prolong in time the latitudinal gradient of the aerosol heating rates, with a stronger impact on the tropical upwelling and on the whole mean meridional stratospheric circulation. Figure 1a shows that the w* change is clearly less pronounced for large eruptions such as Agung and El Chichón that are coincident with a westerly shear of the QBO [6].
Stratospheric circulation changes are the result of the volcanic aerosol radiative heating, which also produces a significant warming in the lower stratosphere. Figure 1c shows that the model calculated stratospheric warming compares reasonably well to observations during the volcanic periods (in terms of detrended temperature anomalies). An underestimated temperature increase, however, is calculated after the El Chichón eruption, probably due to some degree of inaccuracy in the vertical positioning of the initial SO2 cloud or in the subsequent large scale transport of the aerosols. In general, Figure 1 may suggest that the apportionment of the aerosol radiative heating between enhanced tropical upwelling and local stratospheric warming is rather realistic in the ULAQ-CCM experiments.
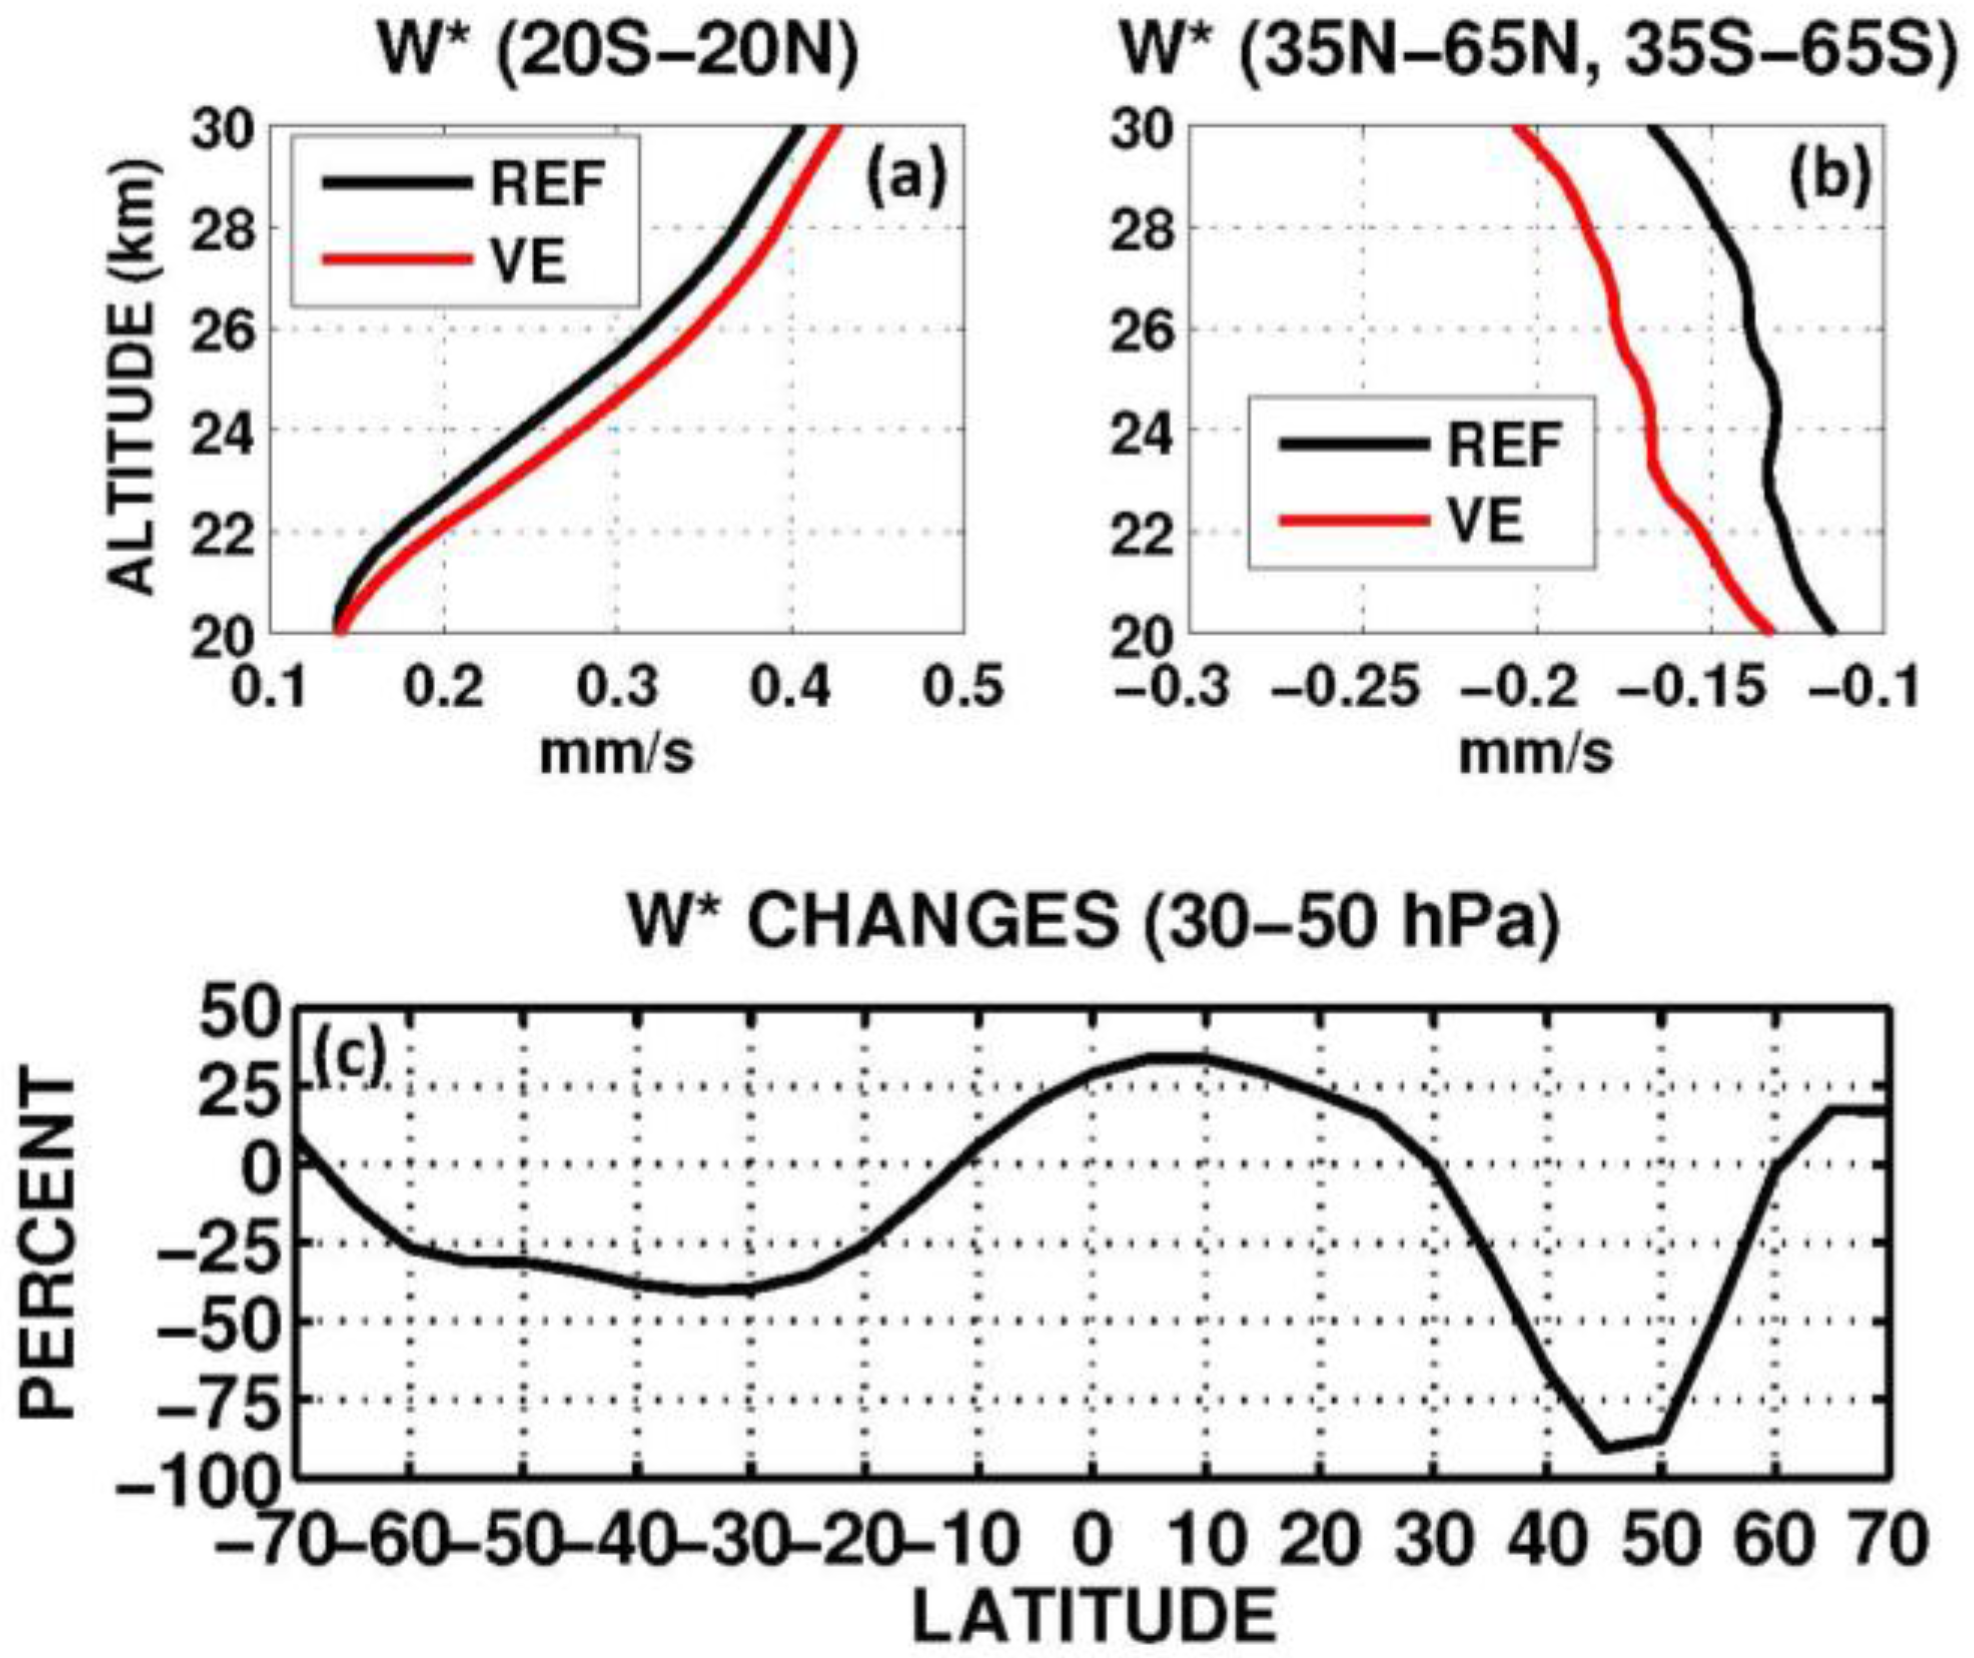
The calculated vertical profile changes of w* averaged for 12 months after the Pinatubo eruption are presented in Figure 2, both for the tropics (Figure 2a) and the mid-latitudes (
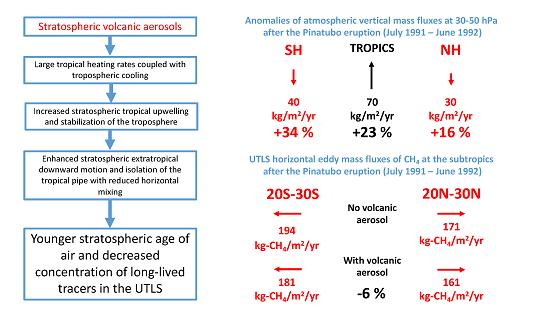
Figure 2b): here a significant downwelling enhancement is calculated for continuity in the lower branch of the Brewer–Dobson circulation (of the order of 20%–30%). Although the maximum relative change in the 30–50 hPa layer is calculated in the northern mid-latitudes (~75% at 40°N–50°N) (Figure 2c), on average, the Southern Hemisphere shows a larger perturbation in the lower branch of the stratospheric circulation. The calculated net downward mass flux change (VE-REF) averaged in the 30–50 hPa layer in the extra-tropics (90°S–20°S and 20°N–90°N) accounts to −40 kg·m−2·year−1 and −30 kg·m−2·year−1, that is −34% and −16%, respectively, with respect to the REF case (with +70 kg·m−2·year−1 in the tropics, i.e., +23% of the REF case). As shown in Aquila et al. [5], the reason of this inter-hemispheric asymmetry should be found in the time of year of the eruption relative to the phase of Brewer–Dobson circulation. They have proved that this dynamical perturbation has increased Southern Hemisphere ozone via advection, counteracting the ozone depletion due to heterogeneous chemistry on Pinatubo aerosols. Satellite observations have in fact shown a northern mid-latitude ozone decrease and a small southern mid-latitude increase, even though NO2 decreased at both southern and northern mid-latitudes in the year following the eruption of Mt. Pinatubo, with significant additional ozone depletion via heterogeneous chemistry.
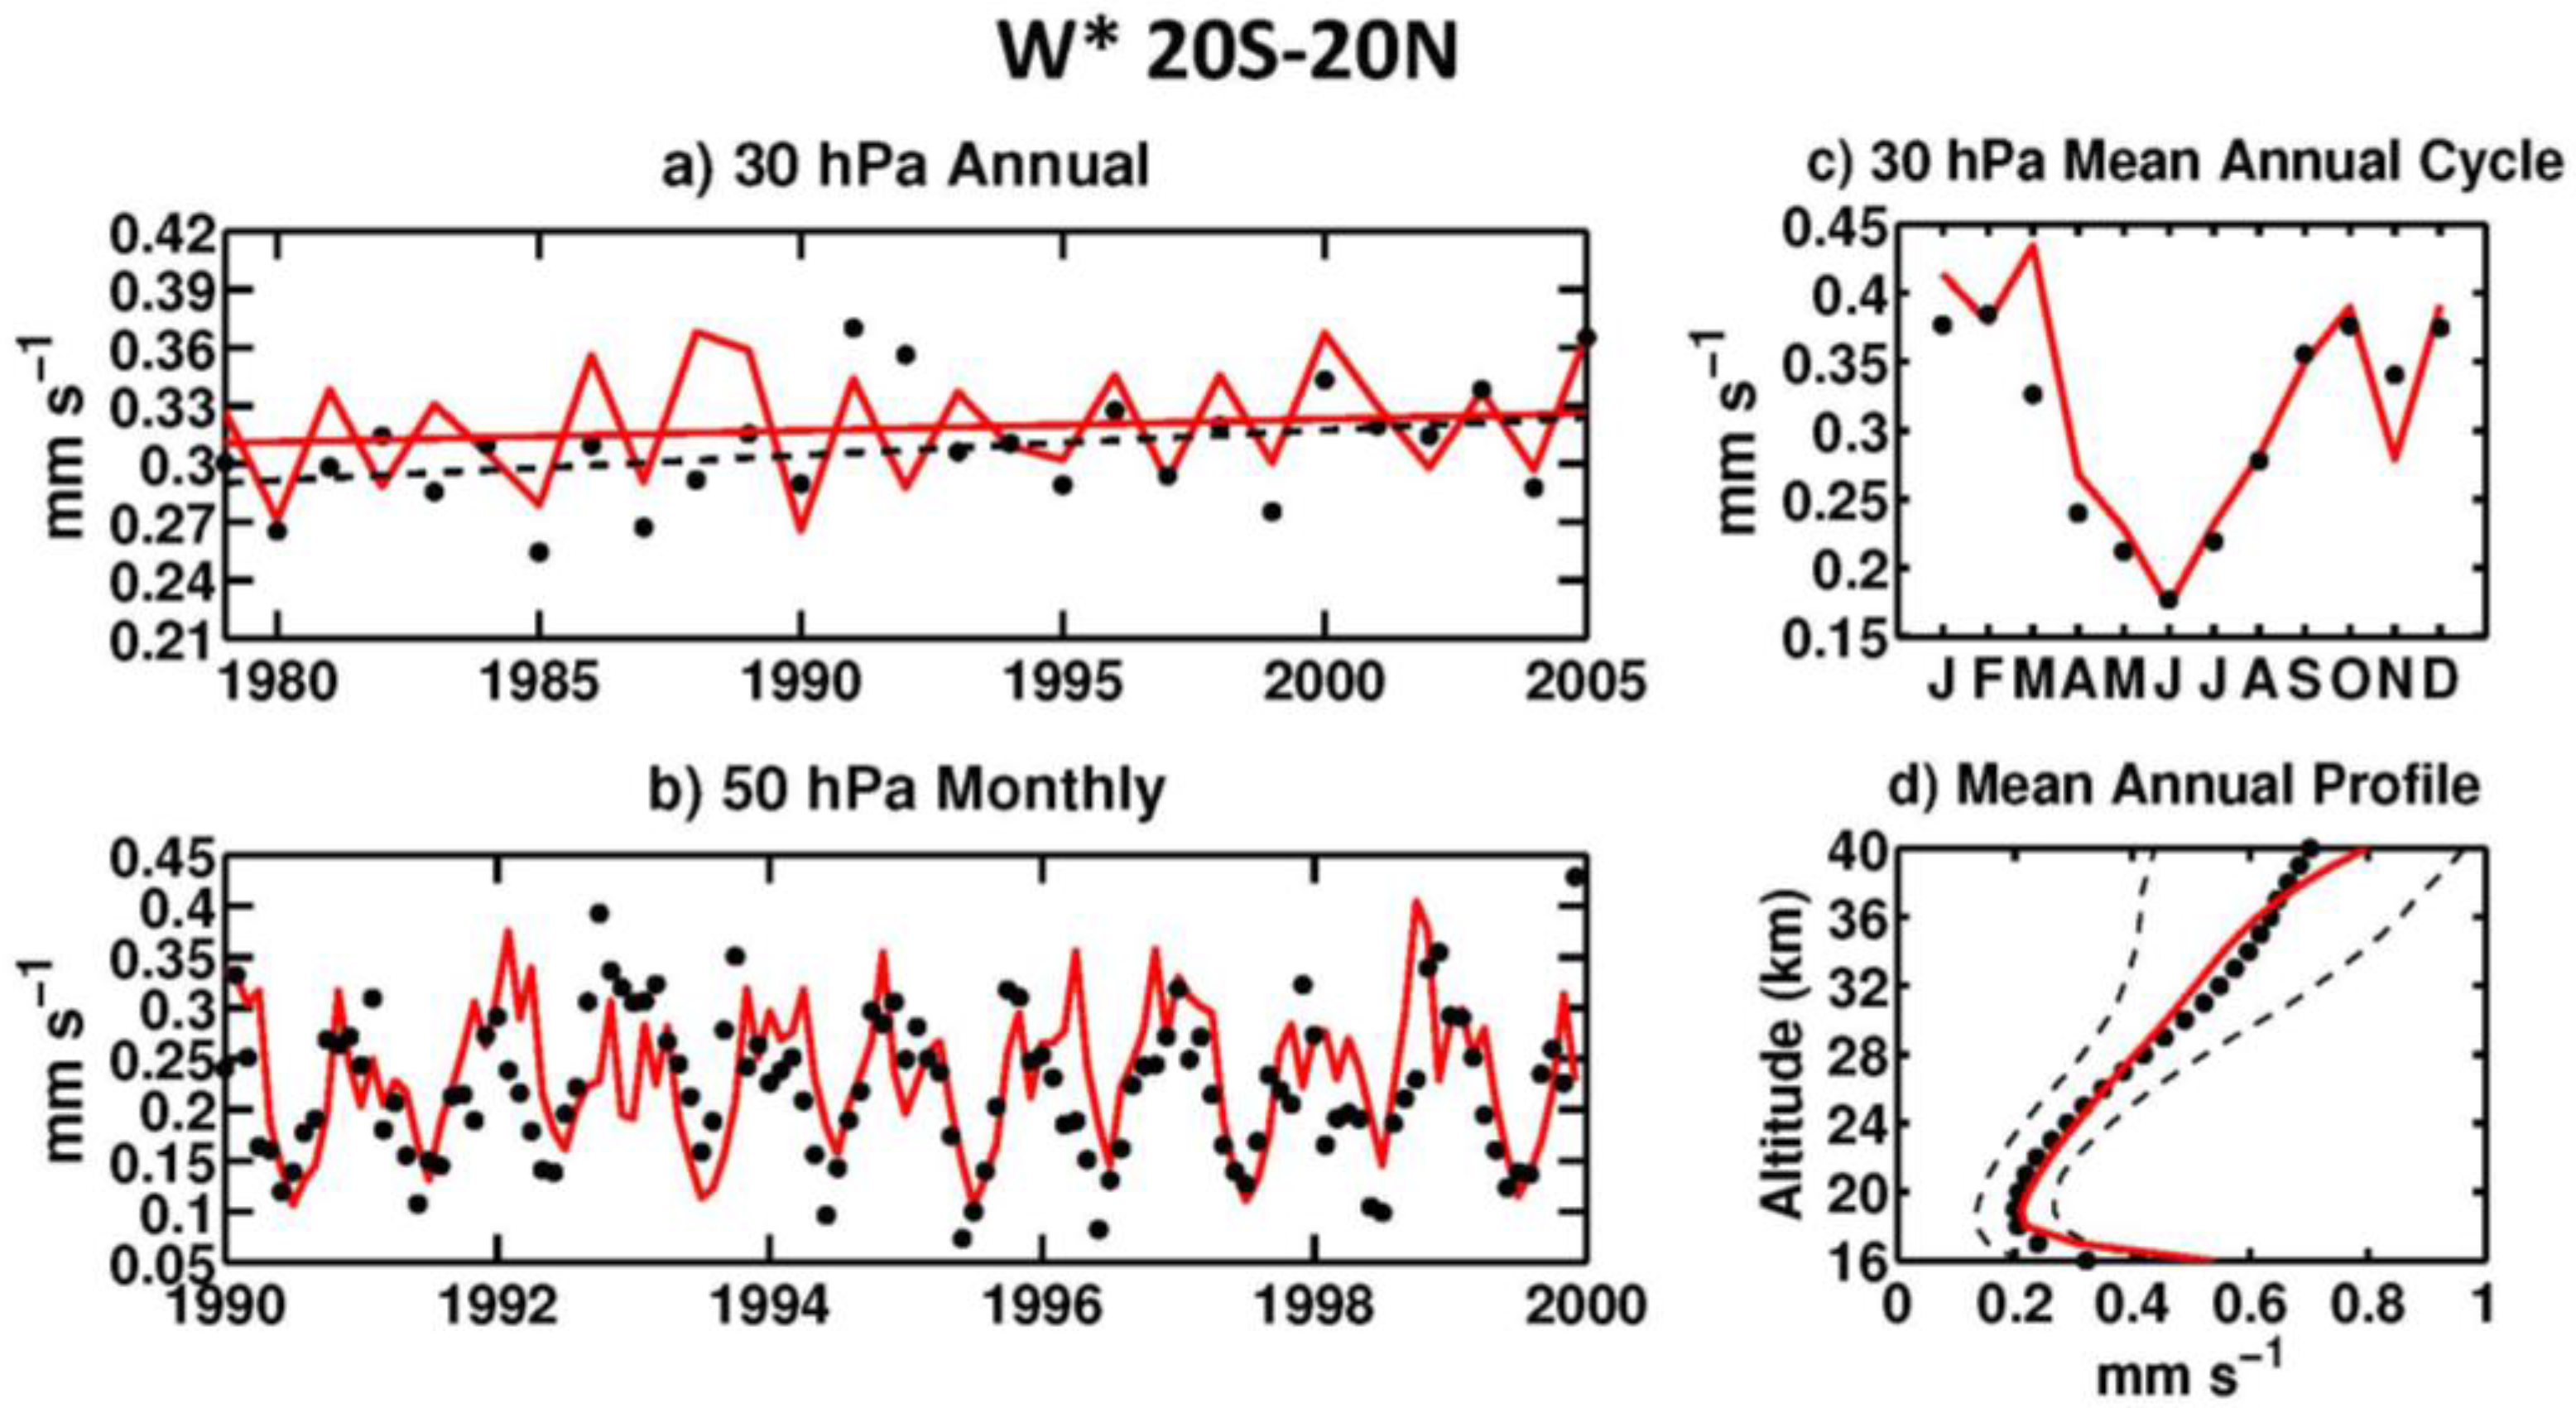
An evaluation of the ULAQ-CCM tropical upwelling is made using vertical velocity data from MERRA reanalysis [49] (Figure 3). In Figure 3a,b we show w* time series at 30 hPa and 50 hPa, respectively, in the tropical region (20°S–20°N average; VE simulation). A 20% underprediction of w* is found in the model during 1992 at 30 hPa. This could result either from a model underestimation of the volcanic aerosol enhancement of vertical ascent or from a model inaccuracy in the interannual w* variability. The underestimation, however, is well inside the observed range of variability of tropical upwelling (of the order of ±30%). A linear fit of the data shows that the ULAQ-CCM predicts a w* growth rate of 0.009 mm·s−1·decade−1, which is somewhat smaller than (but comparable to) the MERRA growth rate of 0.013 mm·s−1·decade−1 (mostly due to time-increasing well mixed greenhouse gases). The seasonal cycle of the lower stratospheric tropical w* is also reasonable, as shown in Figure 3c at 30 hPa and also in Figure 3b at 50 hPa (with 0.55 correlation coefficient for monthly data in the 1990–1999 decade). A 22-year average of the ULAQ-CCM results for the tropical w* vertical profile (1979–2005) is shown in Figure 3d and is in excellent agreement with MERRA data averaged over the same years, except for some overestimation immediately above the TTL.
Strahan et al. [28] have used transport diagnostics in the lower stratosphere to better understand chemistry-climate model ozone simulations. Observed and simulated stratospheric N2O, mean age of air and their correlation were used as powerful diagnostics tools for identifying too fast or slow model circulations and details of tropical isolation and upwelling. Vertical profiles of N
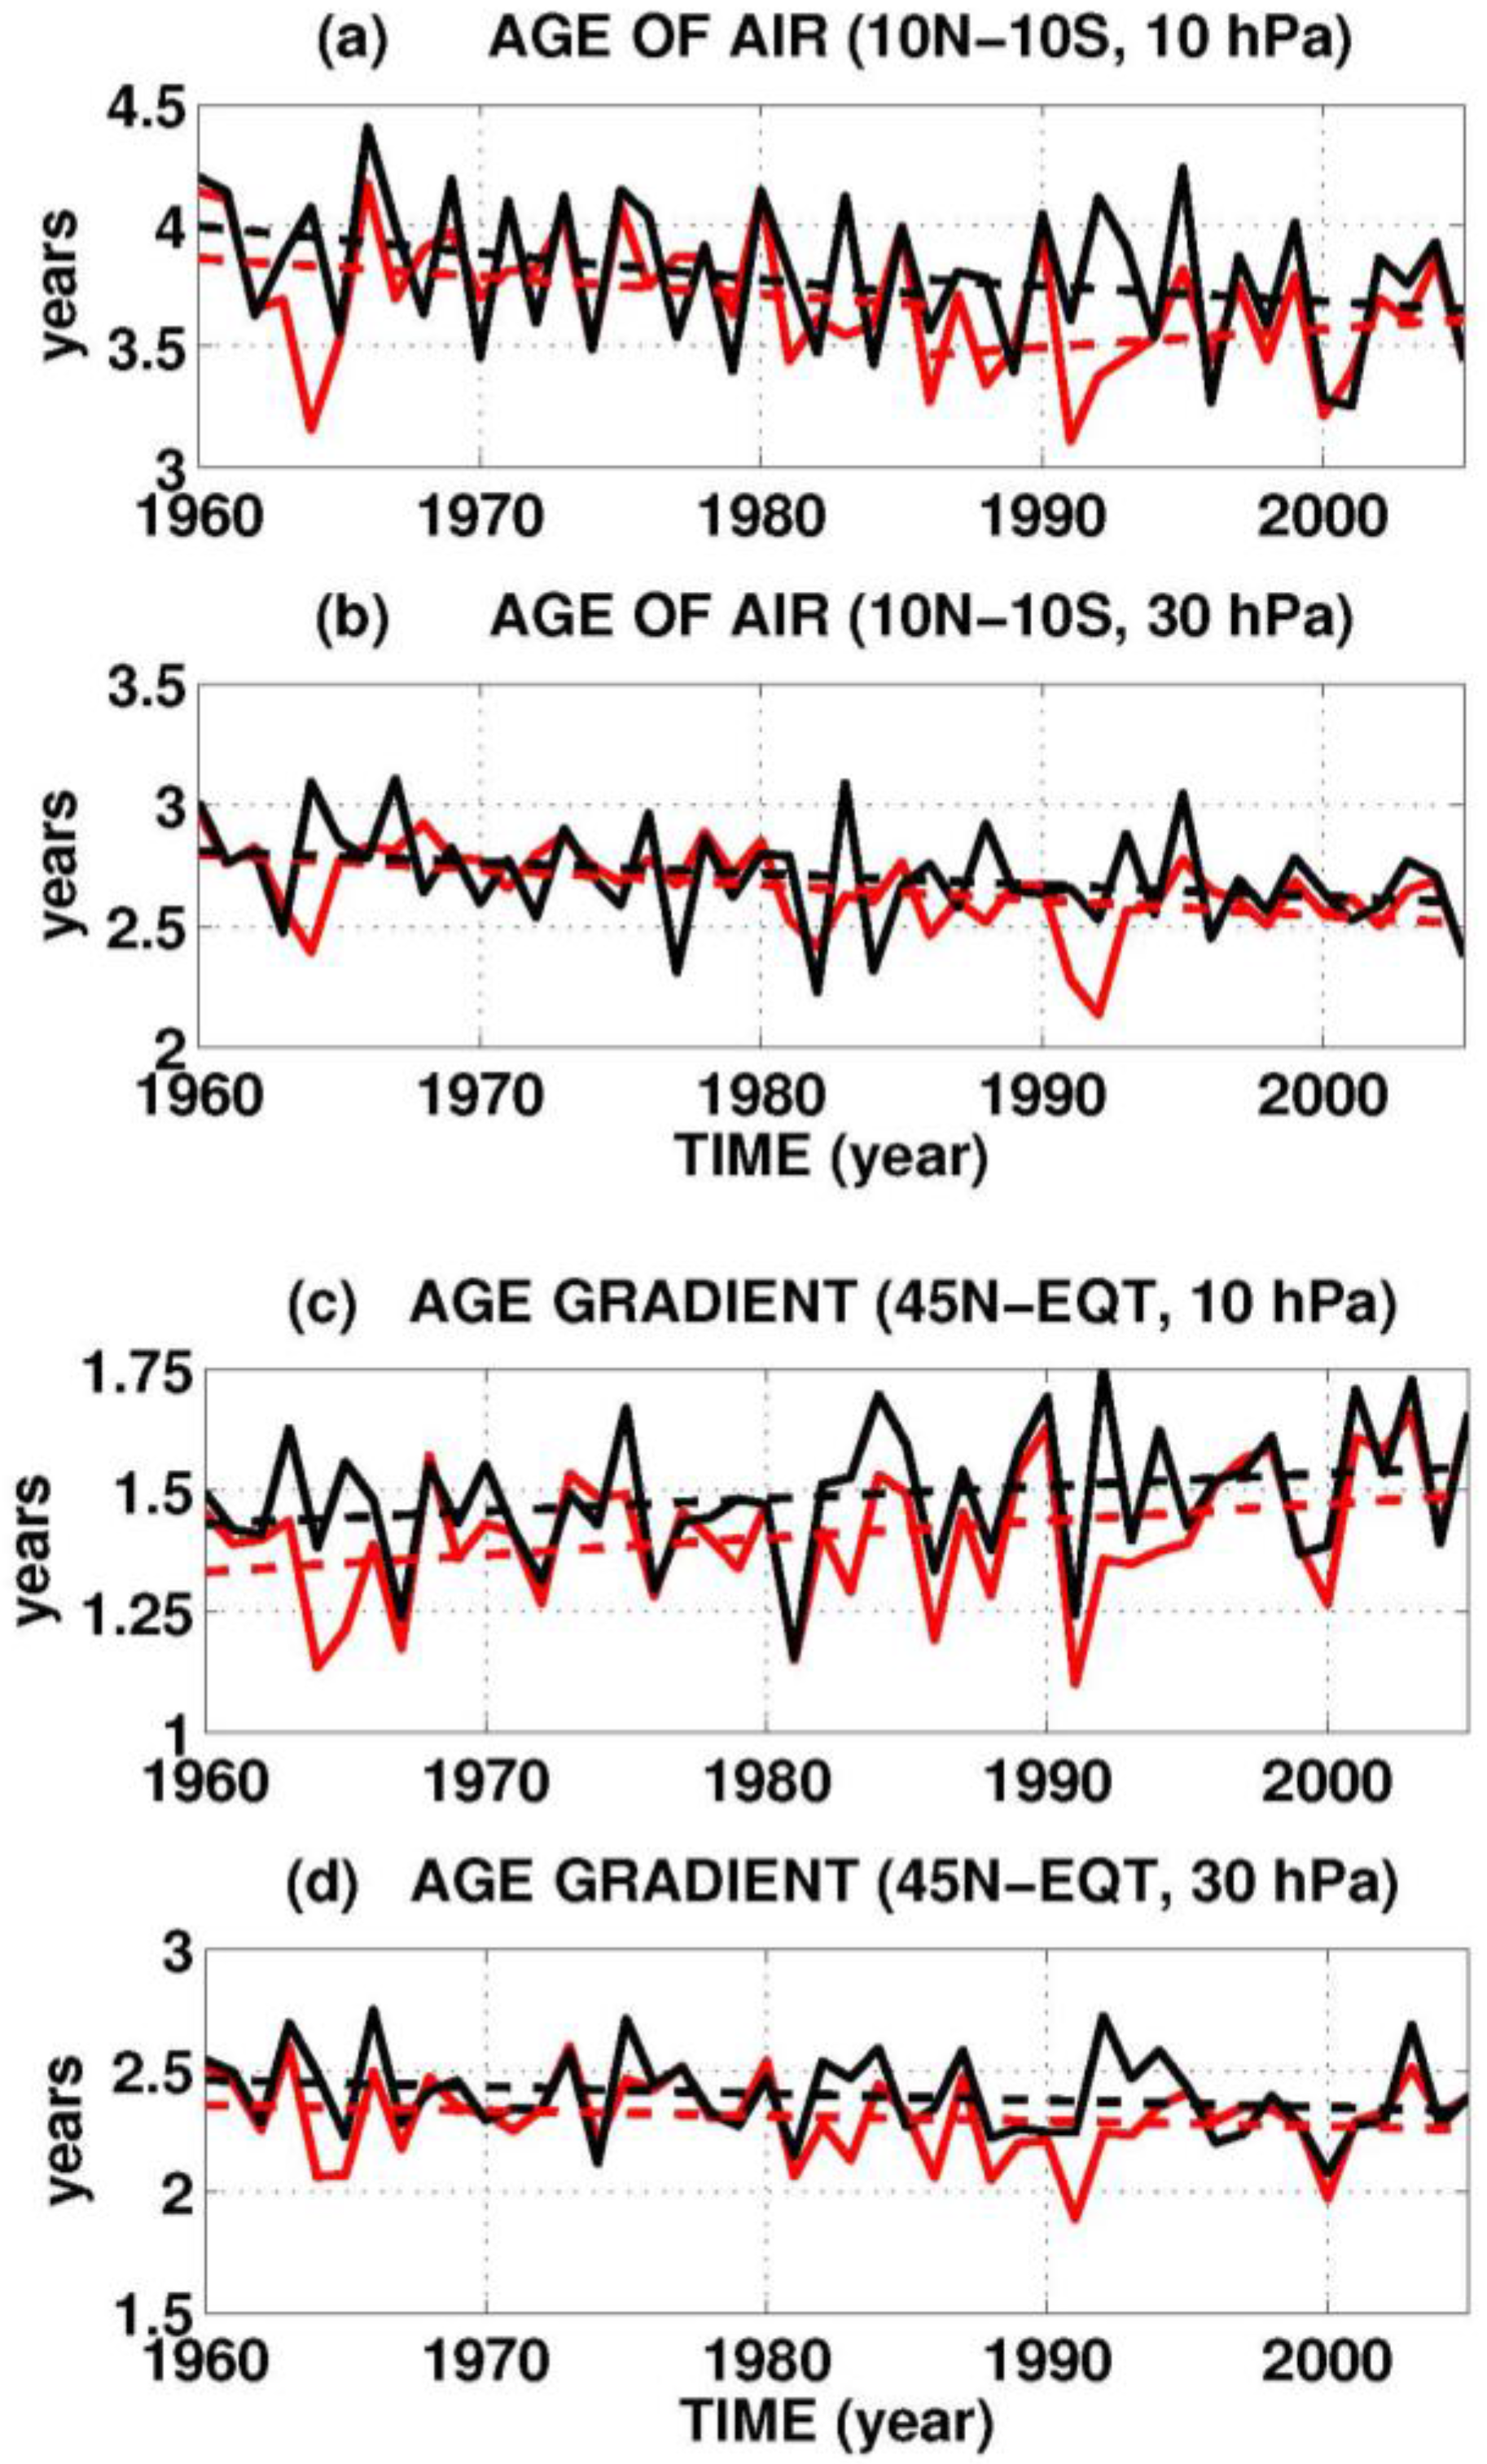
2O and horizontal mean age gradient in the tropical lower stratosphere below 30 hPa were used to diagnose the effects of horizontal mixing and tropical ascent rate, respectively, whereas the vertical profile of tropical mean age of air is sensitive to ascent and mixing together. For this reason we may expect that changes in tropical upwelling due to volcanic aerosols from major explosive eruptions may significantly affect the stratospheric age of air and its latitudinal gradient. This is shown in Figure 4, where the time series of age of air (Figure 4a,b) and latitudinal age gradient (Figure 4c,d) are compared between experiments VE and REF. Younger age of air and lower age gradient are predicted at 30 hPa and also above the aerosol cloud location (10 hPa) when the radiative effects of the volcanic aerosols are taken into account (VE case), for all three major eruptions since 1960, i.e., Agung, El Chichón and Pinatubo. In the Pinatubo case this effect is close to 0.5 year at 30 hPa and is prolonged in time up to approximately 3–4 years after the eruption. This is consistent with the larger initial aerosol optical depth and the enhanced particle confinement in the tropical pipe [6], that help increasing the stratospheric aerosol lifetime and their radiative-dynamical impact.
SF6 and CO2 measurements were used by Ray et al. [17] along with a tropical leaky pipe model, to study the stratospheric age of air from 1975 to 2012. Besides age variability on seasonal, QBO and decadal time scales, they also found two distinct minima above 25 km following the eruptions of El Chichón and Pinatubo. In the latter case they found a mean age decrease of ~0.5 year in the 25–30 km altitude layer during 1992 and 1994 with respect to a linear fit of the data, with approximately zero change during 1993, which is rather similar to our findings at 10 hPa (see Figure 4a,c). Taking into account the discussion above [28], the model predicted comparable minima of age of air and age gradient suggest that the main driver mechanism for the younger age is the radiatively forced additional tropical upwelling (see Figure 1 and Figure 2).
The time tendency of the age gradient in Figure 4c,d is consistent with the results of Ray et al. [38], who again used a tropical leaky pipe model, guided in this case by mean meridional circulation and horizontal mixing changes in several reanalysis data sets and chemistry climate model simulations. They found in fact that the best quantitative agreement with the observed mean age and ozone trends over the past three decades is found assuming a small strengthening of the mean circulation in the lower stratosphere and a moderate weakening of the mean circulation in the middle and upper stratosphere. These changes imply a negative/positive time tendency of the tropical ascent rate in the mid-upper/lower stratosphere, respectively, which drive the positive/negative time tendency of the age of air latitudinal gradient [28] (Figure 4c,d, respectively).
Similar conclusions are also reached by Garfinkel et al. [29], who find a difference in the time varying Brewer Dobson circulation when considering the mid stratosphere against the lower stratosphere and when analyzing the past 25 years of their model simulation against longer time periods. After the late 1980s, they find a deceleration of the circulation in the mid-stratosphere and northern mid-latitudes, despite increases in greenhouse concentrations and raising sea surface temperatures, while the Brewer Dobson circulation continues to accelerate in the lower stratosphere. Declining ozone depleting substances and the timing of volcanic eruptions are found as the main forcing agents for the mid-stratospheric circulation slowdown, with effects on tropical upwelling and age of air that are similar to those shown in Figure 4a. During years 1986–2005, the ozone recovery leads to slow down the deep branch of the BDC (Lin and Fu) [50] and this is coupled to its strengthening produced by Ruiz and Pinatubo aerosols in late 1980s and early 1990s [29]. The resulting overall effect is the positive trend in age of air shown in Figure 4a for the VE simulation. On the other hand, up to 30 hPa (Figure 4b), the age of air shows a steady decrease from 1960 to 2005 in both REF and VE simulations, indicating a continuous strengthening of the shallow branch of the BDC, that is only affected by the greenhouse gas (GHG) increase [50].
The trend analysis in Figure 4a confirms the fact volcanic eruptions are one of the main drivers for the sign change of the age slope at 10 hPa after late 1980s (−0.07 ± 0.03 year/decade in the REF simulation and +0.08 ± 0.04 year/decade in the VE simulation). These age slopes can be compared with −0.09 ± 0.04 year/decade from 1960 to 1986, as an average between VE and REF cases (the uncertainties are calculated as the standard deviation from the ensemble of simulations). Engel et al. [30] found an increase of +0.24 ± 0.22 year/decade of mean age in the Northern Hemisphere mid-latitudes between 24 and 35 km altitudes over the period 1975 to 2005. Stiller et al. [31] present a statistically robust increase in age of air in that region between 2002 and 2010. Finally, Ray et al. [17] show that the vertically resolved trends in the measurement-based mean ages are negative in the lower stratosphere and positive in the upper stratosphere, with a significant reduction of the uncertainty. This latter result suggests that lower and upper branches of the BDC have changed differently [50,51].
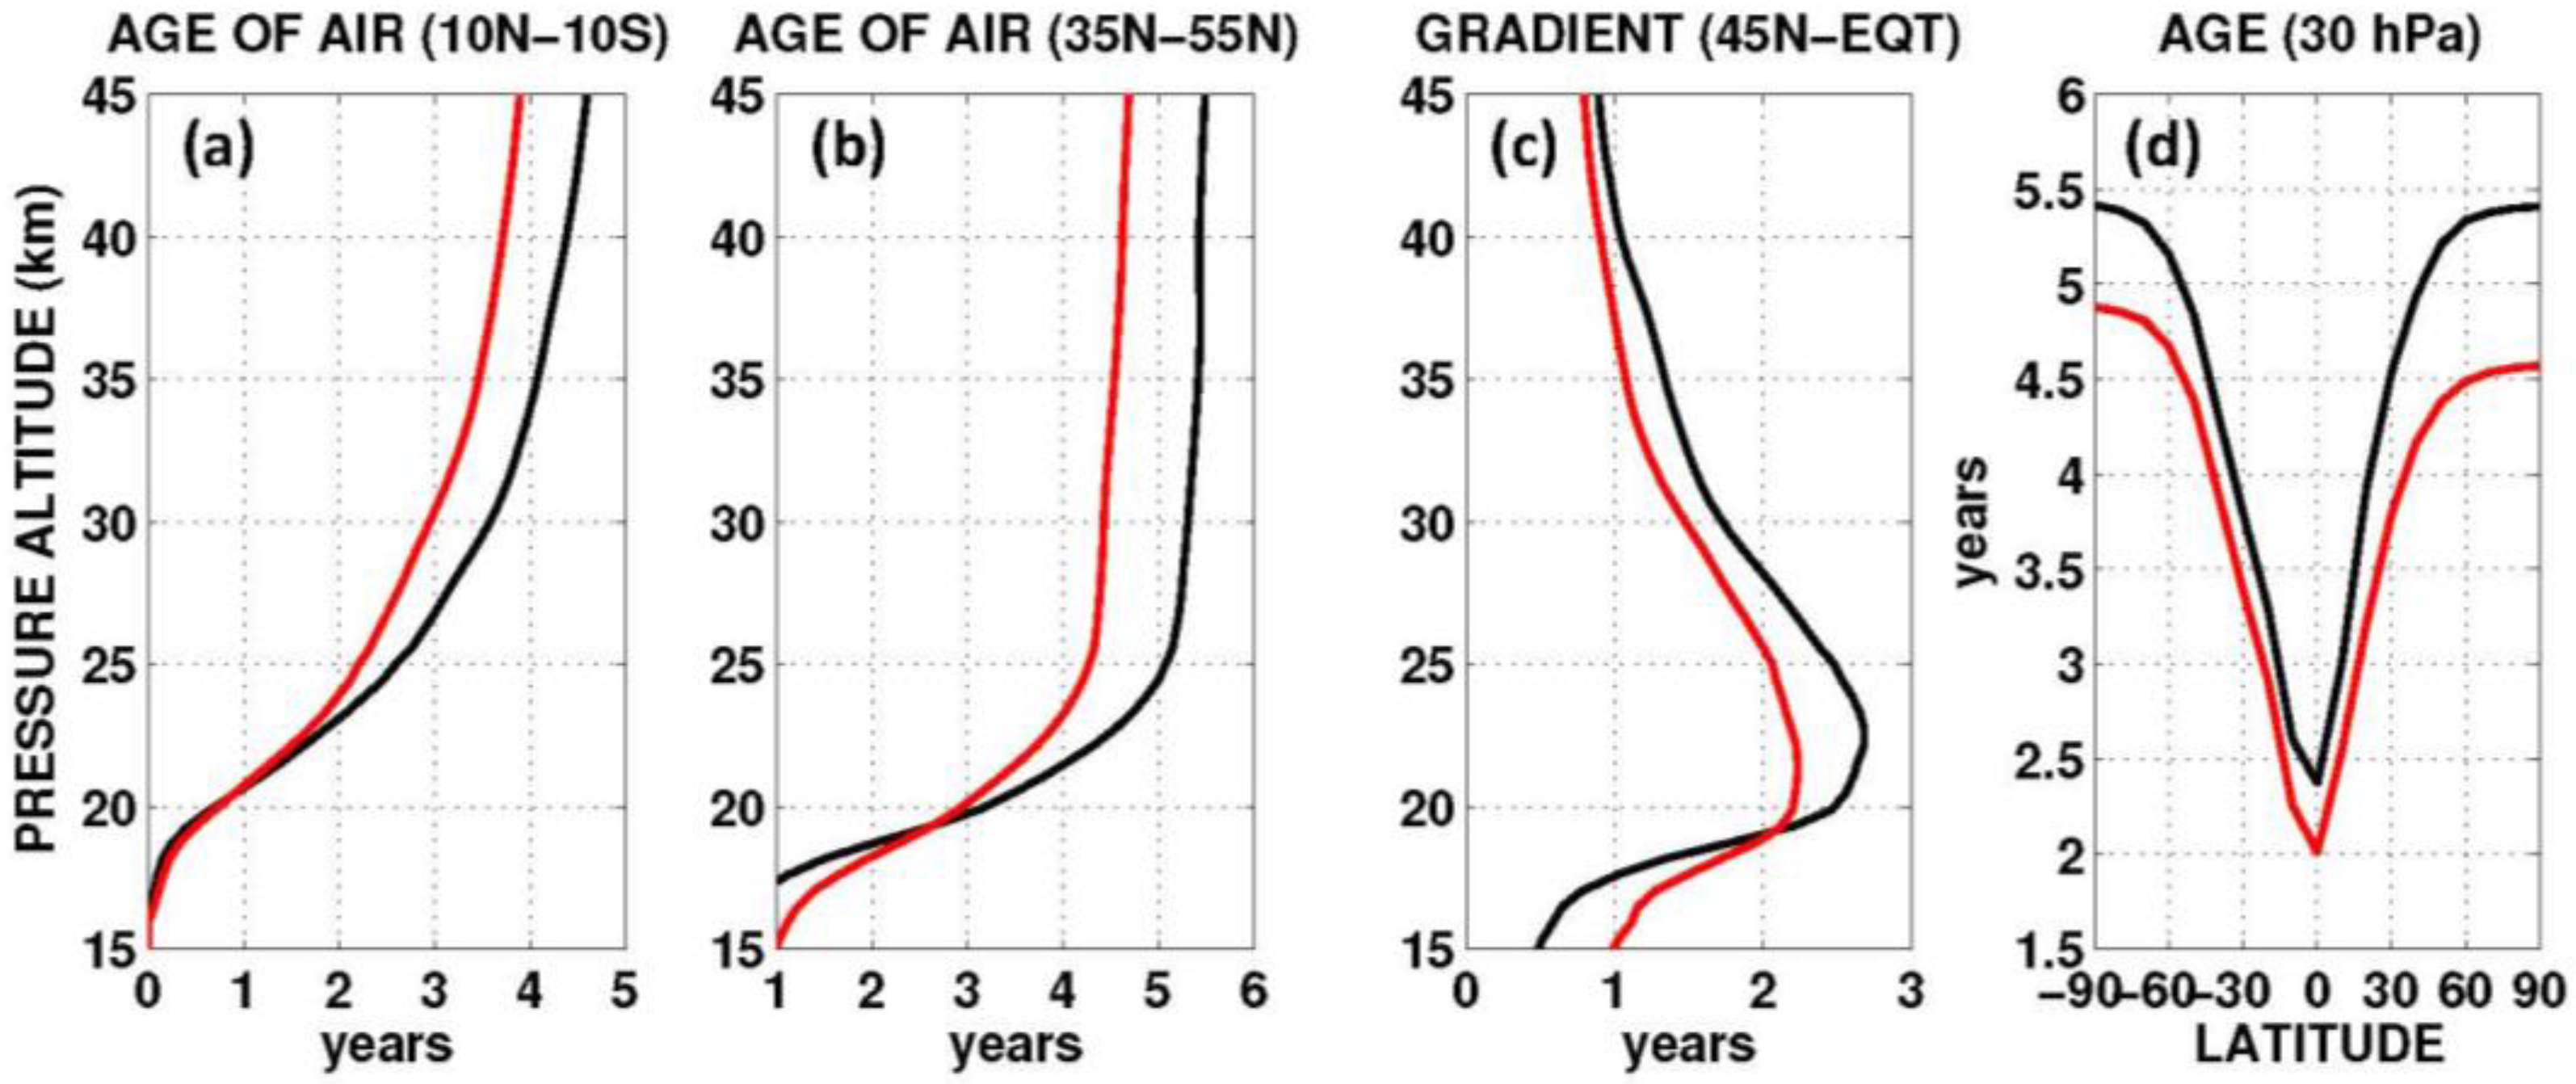
Tropical vertical profiles of mean age and its latitudinal section at 30 hPa are shown in Figure 5 for the Pinatubo case (1991–1992 average). As clearly visible from Figure 5a, the calculated age of air negative anomaly VE-REF increases with altitude from zero at ~22 km to ~0.5 year close to 30 km, whereas the mid-latitude vertical profile in Figure 5b increases from zero at ~19 km to ~1 year close to 30 km. For this reason, the latitudinal age gradient presented in Figure 5c goes from positive values above the TTL up to ~19 km and then increases with altitude up to ~0.5 year in the layer 21–25 km. This behavior is closely related to the magnitude and sign of the w* anomaly vertical profile in the tropical region, with a positive maximum in the 22–28 km layer and negative values below ~19 km [6]. The latitudinal gradient of volcanic aerosol heating rates is responsible for the positive anomaly, whereas the negative anomaly below ~19 km is induced by the tropospheric cooling and consequent increased atmospheric stabilization. The complete latitudinal section at 30hPa is presented in Figure 5d, with age values in the VE case ranging between two years at the equator and 4.5 and 4.8 years poleward of 60°N and 70°S, respectively. On the other hand, in the REF case the mean age at 30 hPa ranges between 2.4 years at the equator and 5.4 years in both polar regions.
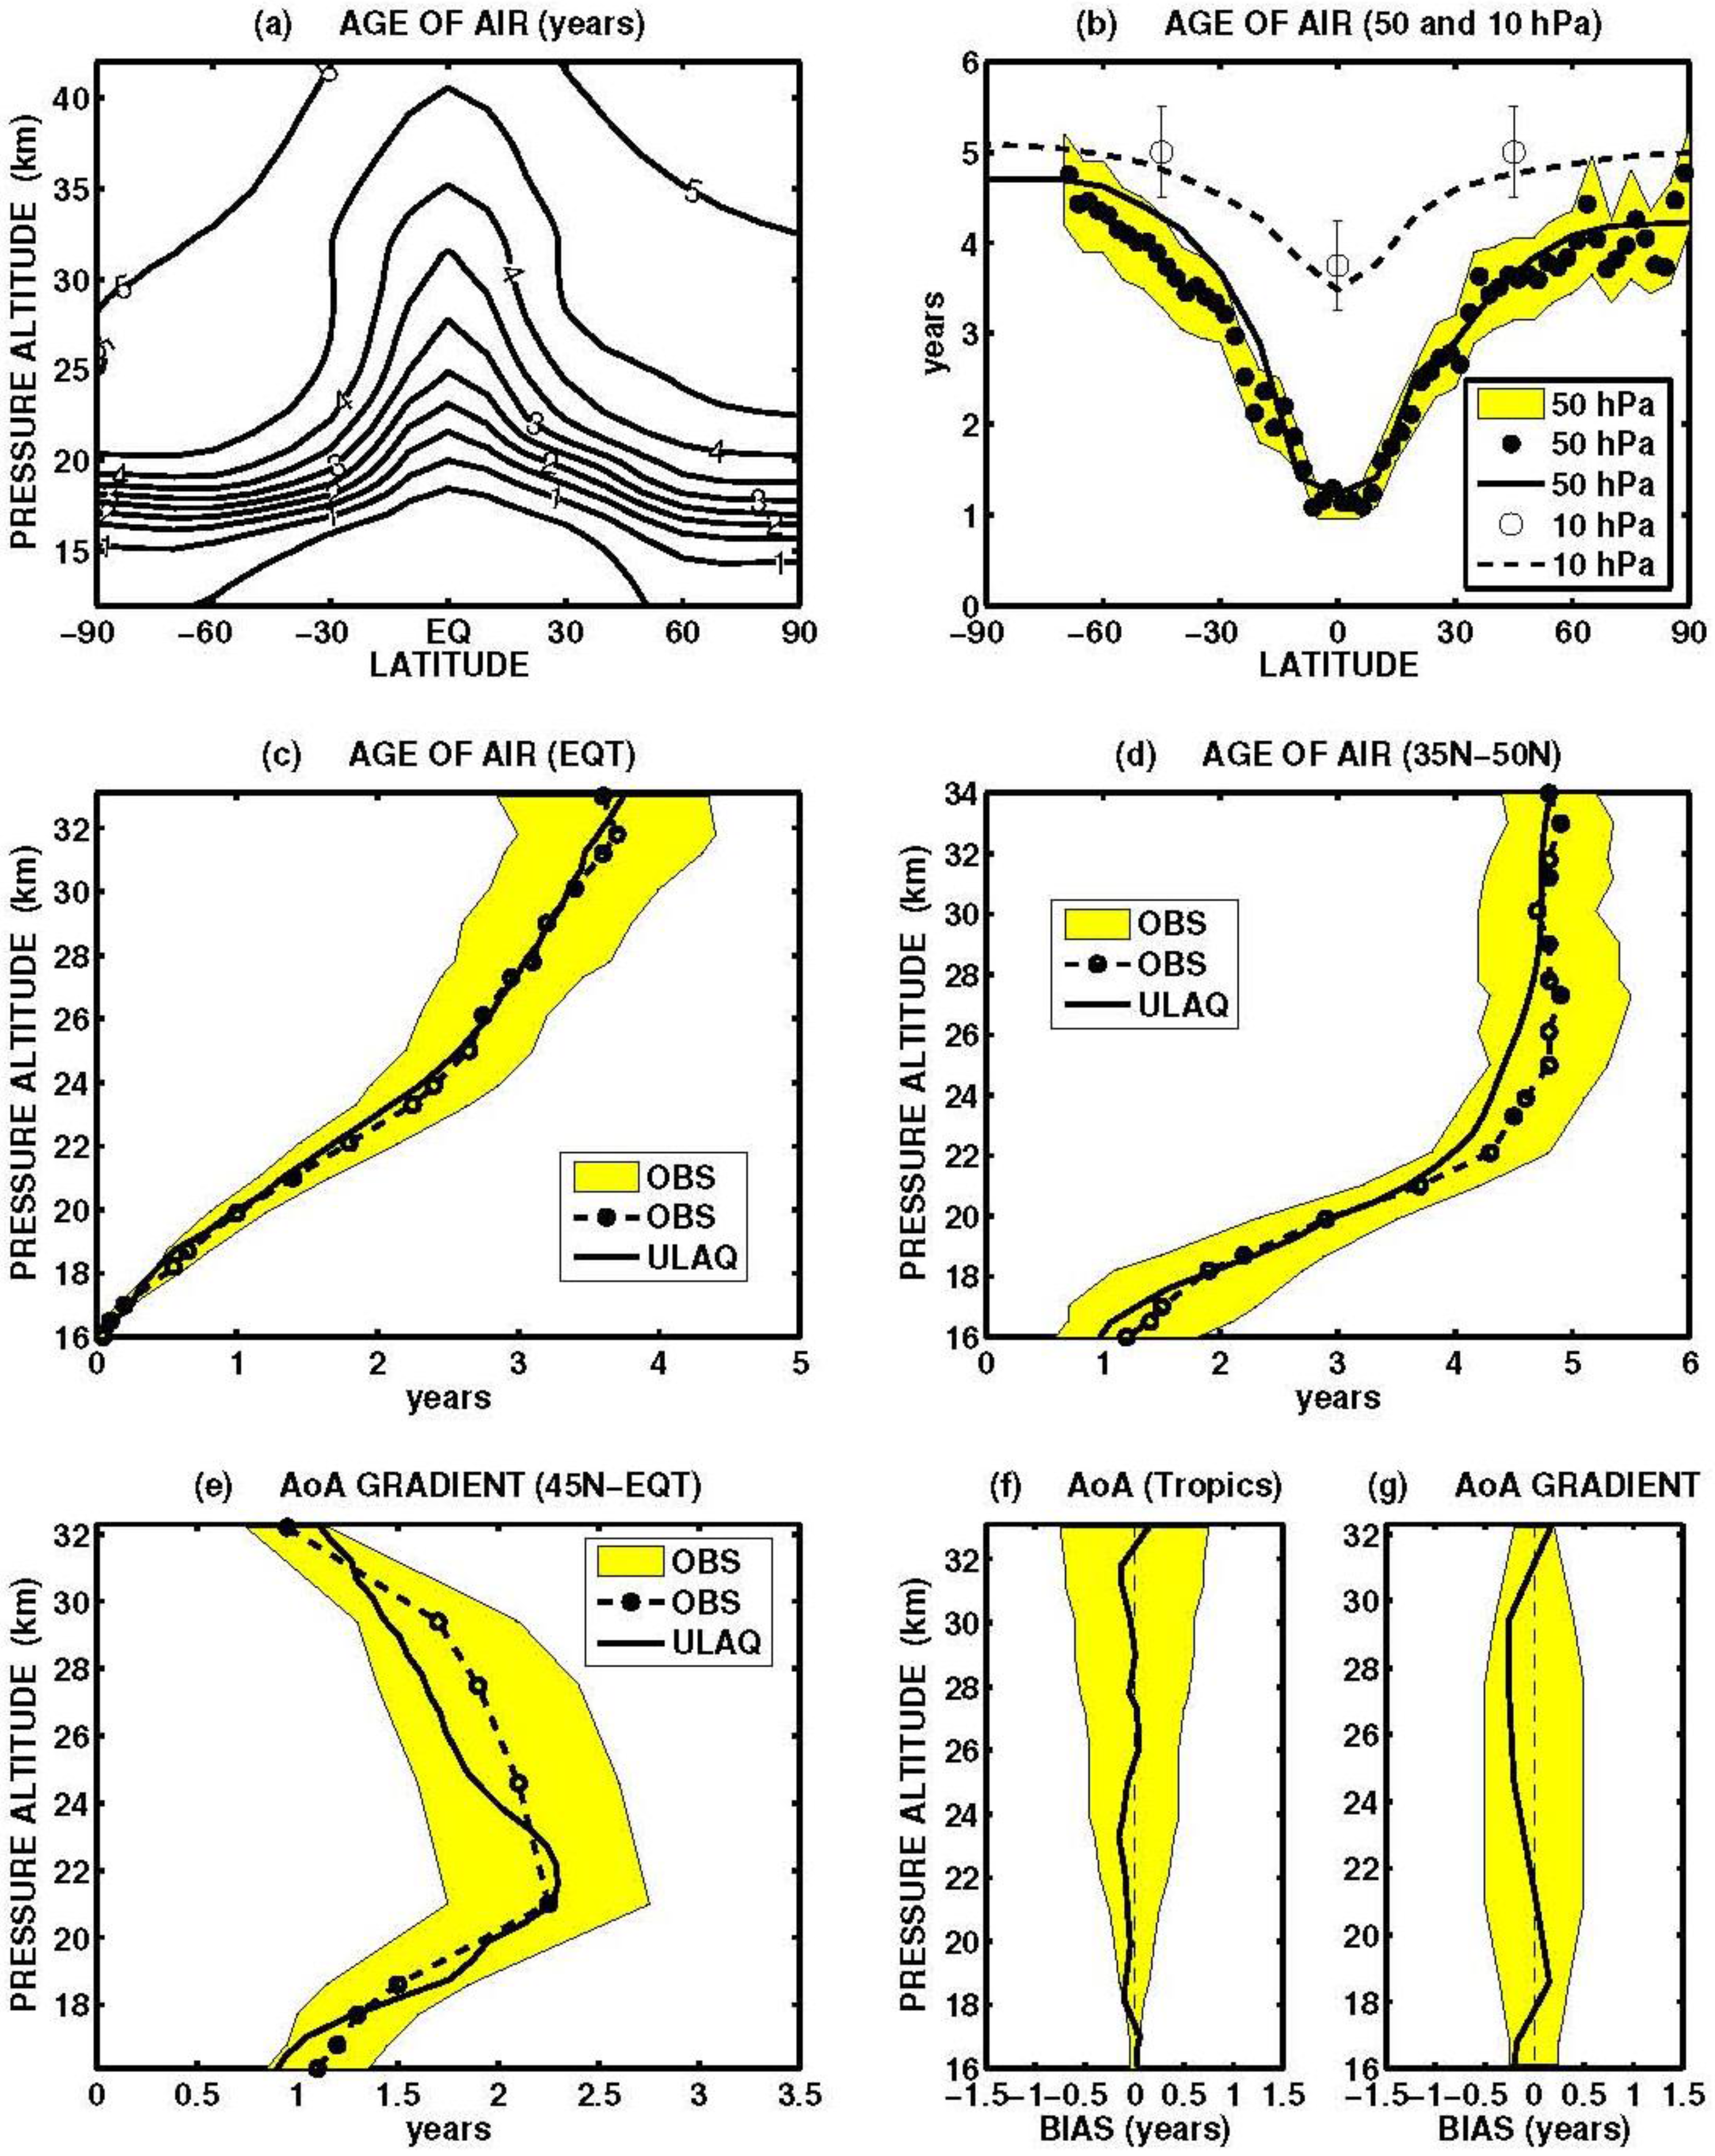
The robustness of the model calculated age of air anomalies requires a careful evaluation of the stratospheric mean age in the ULAQ-CCM. This is done in Figure 6, where we first show the zonally and annually averaged values in a 2D domain (Figure 6a): the ULAQ-CCM results are rather similar to those derived in Strahan et al. [28] who made a linear fit to the mean age and N2O points (with N2O > 150 ppbv), using N2O from the Atmospheric Chemistry Experiment (ACE) climatology 2004–2009 [52]. The age steep gradients are correctly simulated, both horizontally in the 10–50 hPa layer and vertically in the 50–100 hPa layer in the extratropics. A quantitative comparison with the measurements collected in Andrews et al. [53] and Engel et al. [30] is presented in Figure 6b–e: in all cases, the ULAQ-CCM predictions are well inside the 1σ variability range of observations and close to their mean values. For this reason, the model bias with respect to the measurement mean is close to zero for both the tropical age of air and the age latitudinal gradient (Figure 6f,g) and well inside the 1σ variability range of the observations.
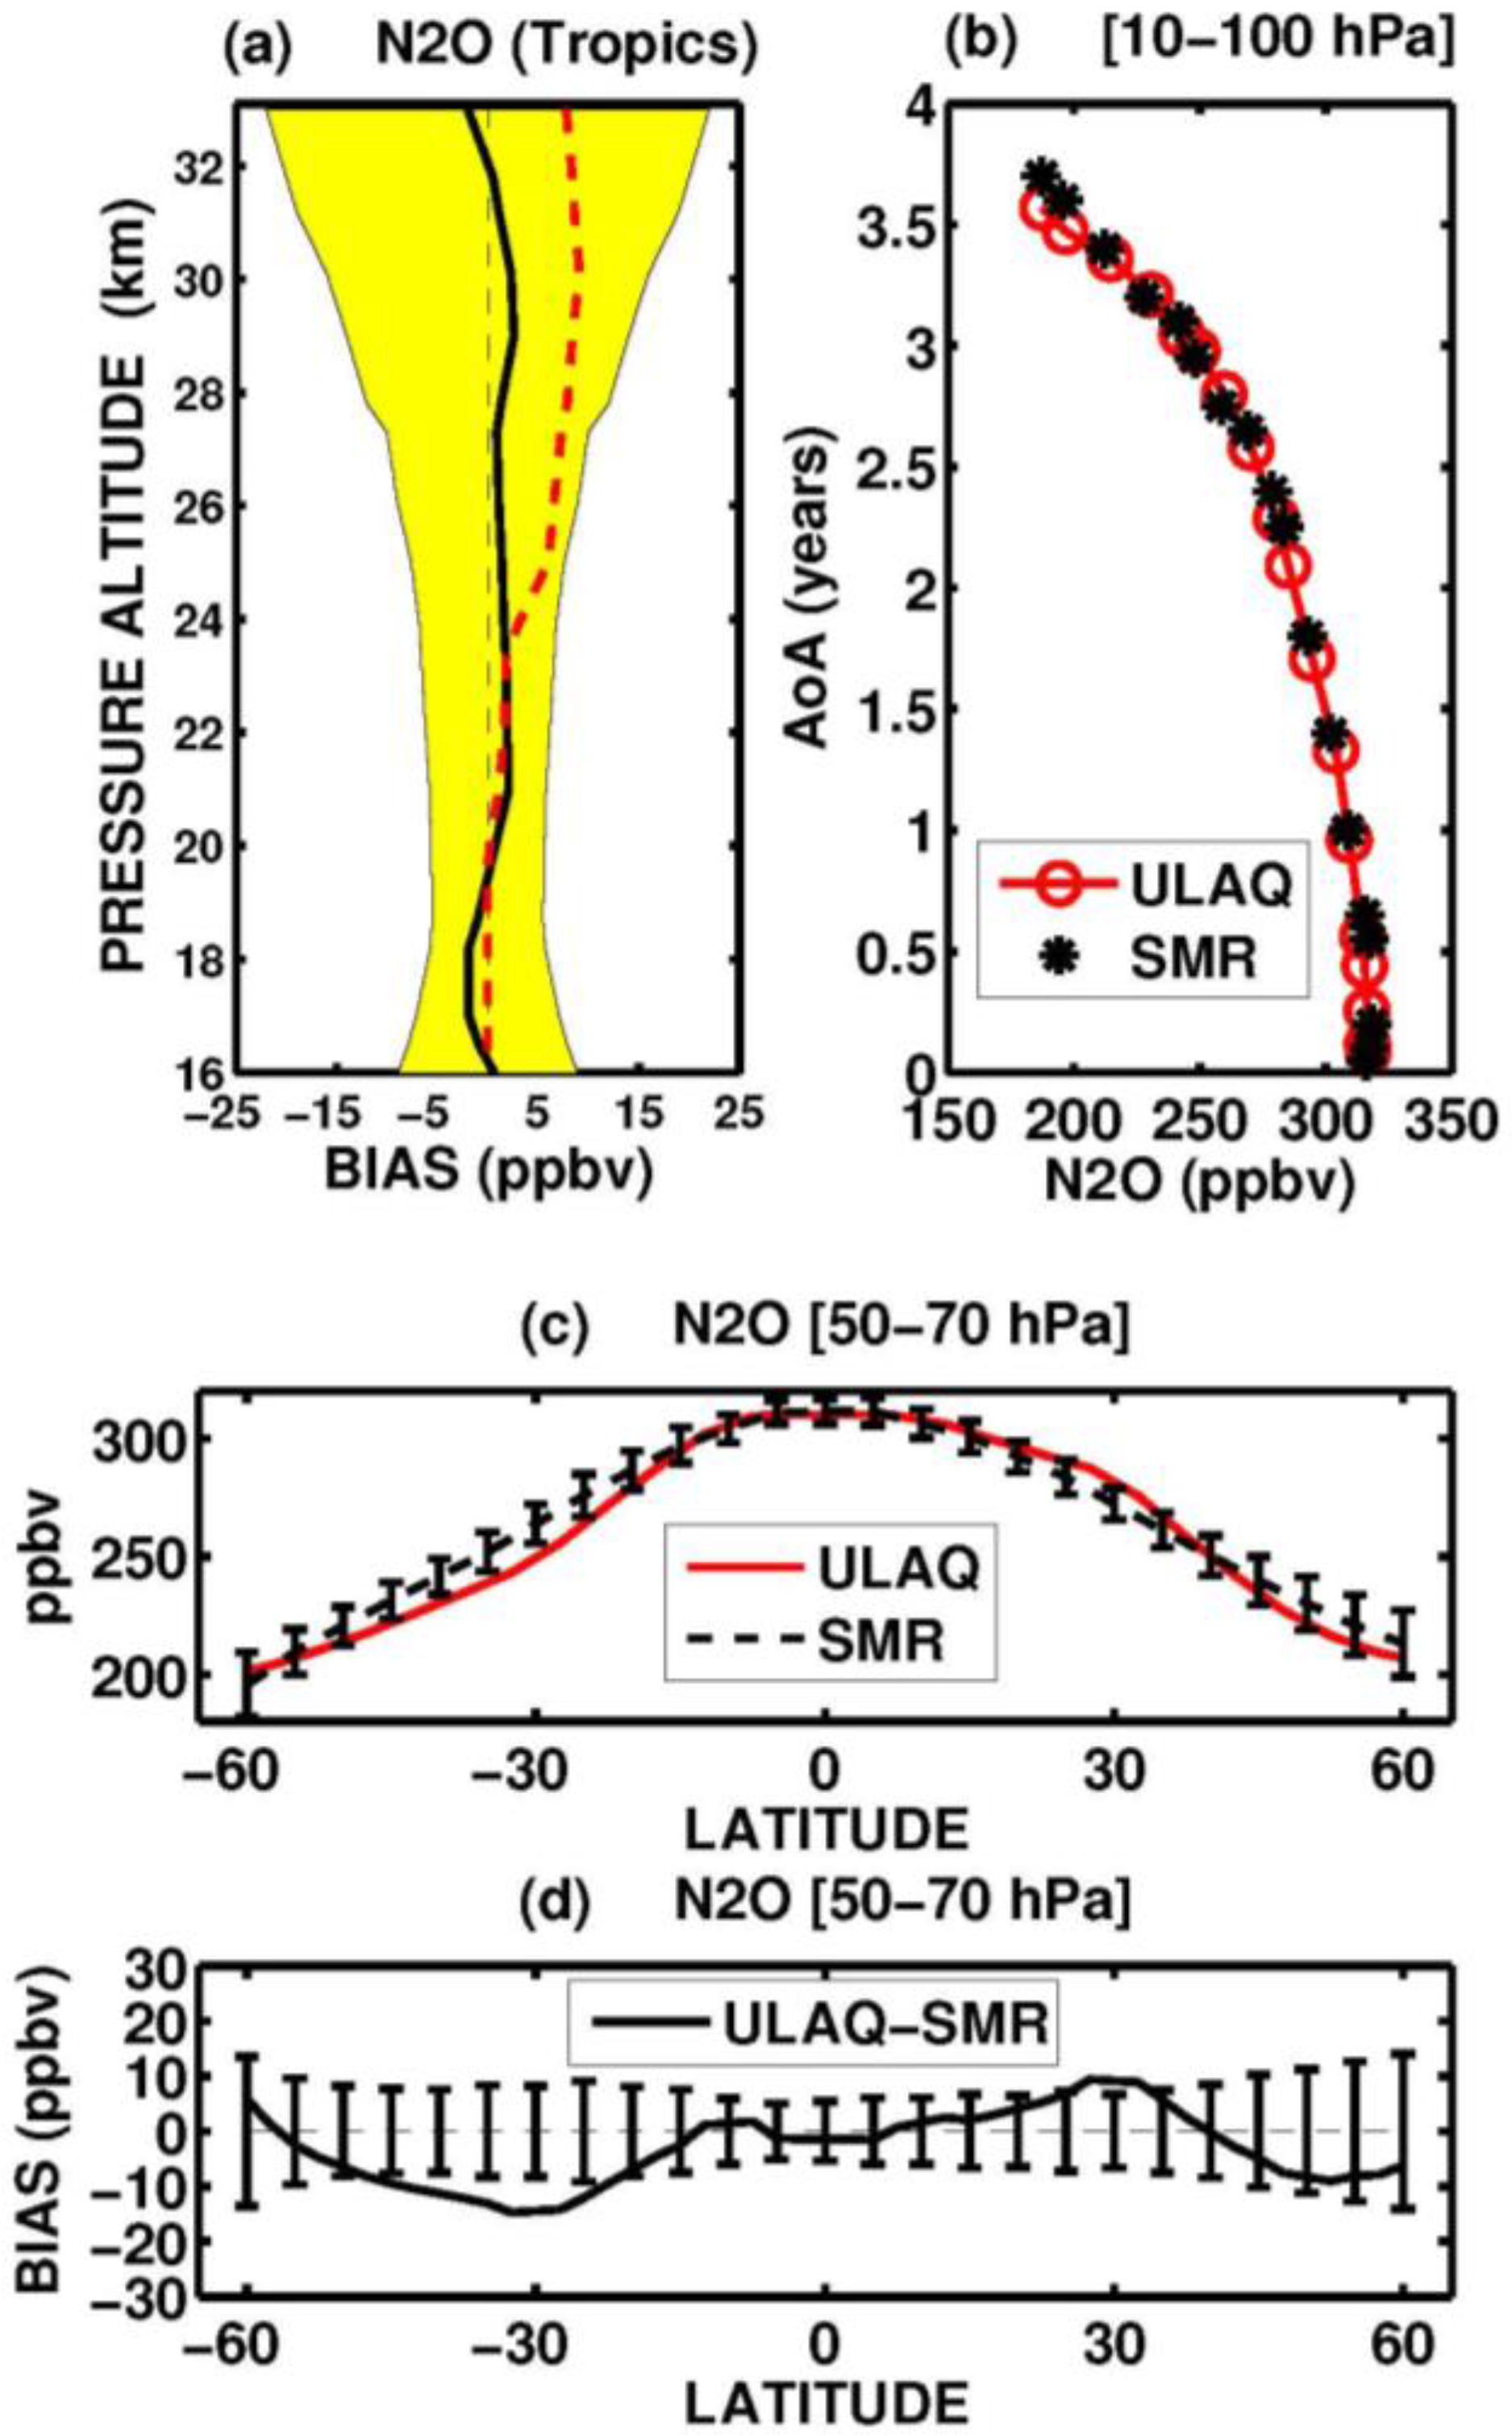
As noted before, a quasi-passive tracer as N2O can be used in the tropical lower stratosphere to isolate the horizontal mixing effects (Figure 7). A significant improvement in the new version of the ULAQ-CCM has been reached with respect to the one discussed in Strahan et al. [28] and Douglass et al. [54]. The model bias relative to SMR observations in the tropical region [55,56] is close to zero in both REF and VE simulations (Figure 7a) (2001–2005 average), and well inside the range of variability of the observations. The red dashed curve shows the calculated VE-REF anomaly in the first 12 months after the Pinatubo eruption: the positive change above 30 hPa is of the order of 5–10 ppbv and is the direct consequence of the additional upwelling shown in Figure 2. As expected from the age of air model evaluation presented in Figure 6, the age correlation with N2O in the ULAQ-CCM is compact and with a realistic height-dependent slope, if compared to observations (Figure 7b). A 50–70 hPa latitudinal section of N2O is presented in Figure 7c,d along with SMR observed data. The model bias is inside the range of variability of SMR measurements, with a model tendency to underestimate the tracer in the Southern Hemisphere mid-latitudes and overestimate it in the Northern Hemisphere subtropics.
Below 30 hPa, tropical N2O has a very small vertical gradient, because it has essentially no loss from UV photolysis and then volcanic aerosol induced changes in the ascent rate have negligible effect on its mixing ratio. The slight positive N2O change of Figure 7a in the 30–50 hPa tropical layer (0–3 ppbv) is caused by a coupling of the additional upwelling and a decreased efficiency of the horizontal mixing. This is made clear in 
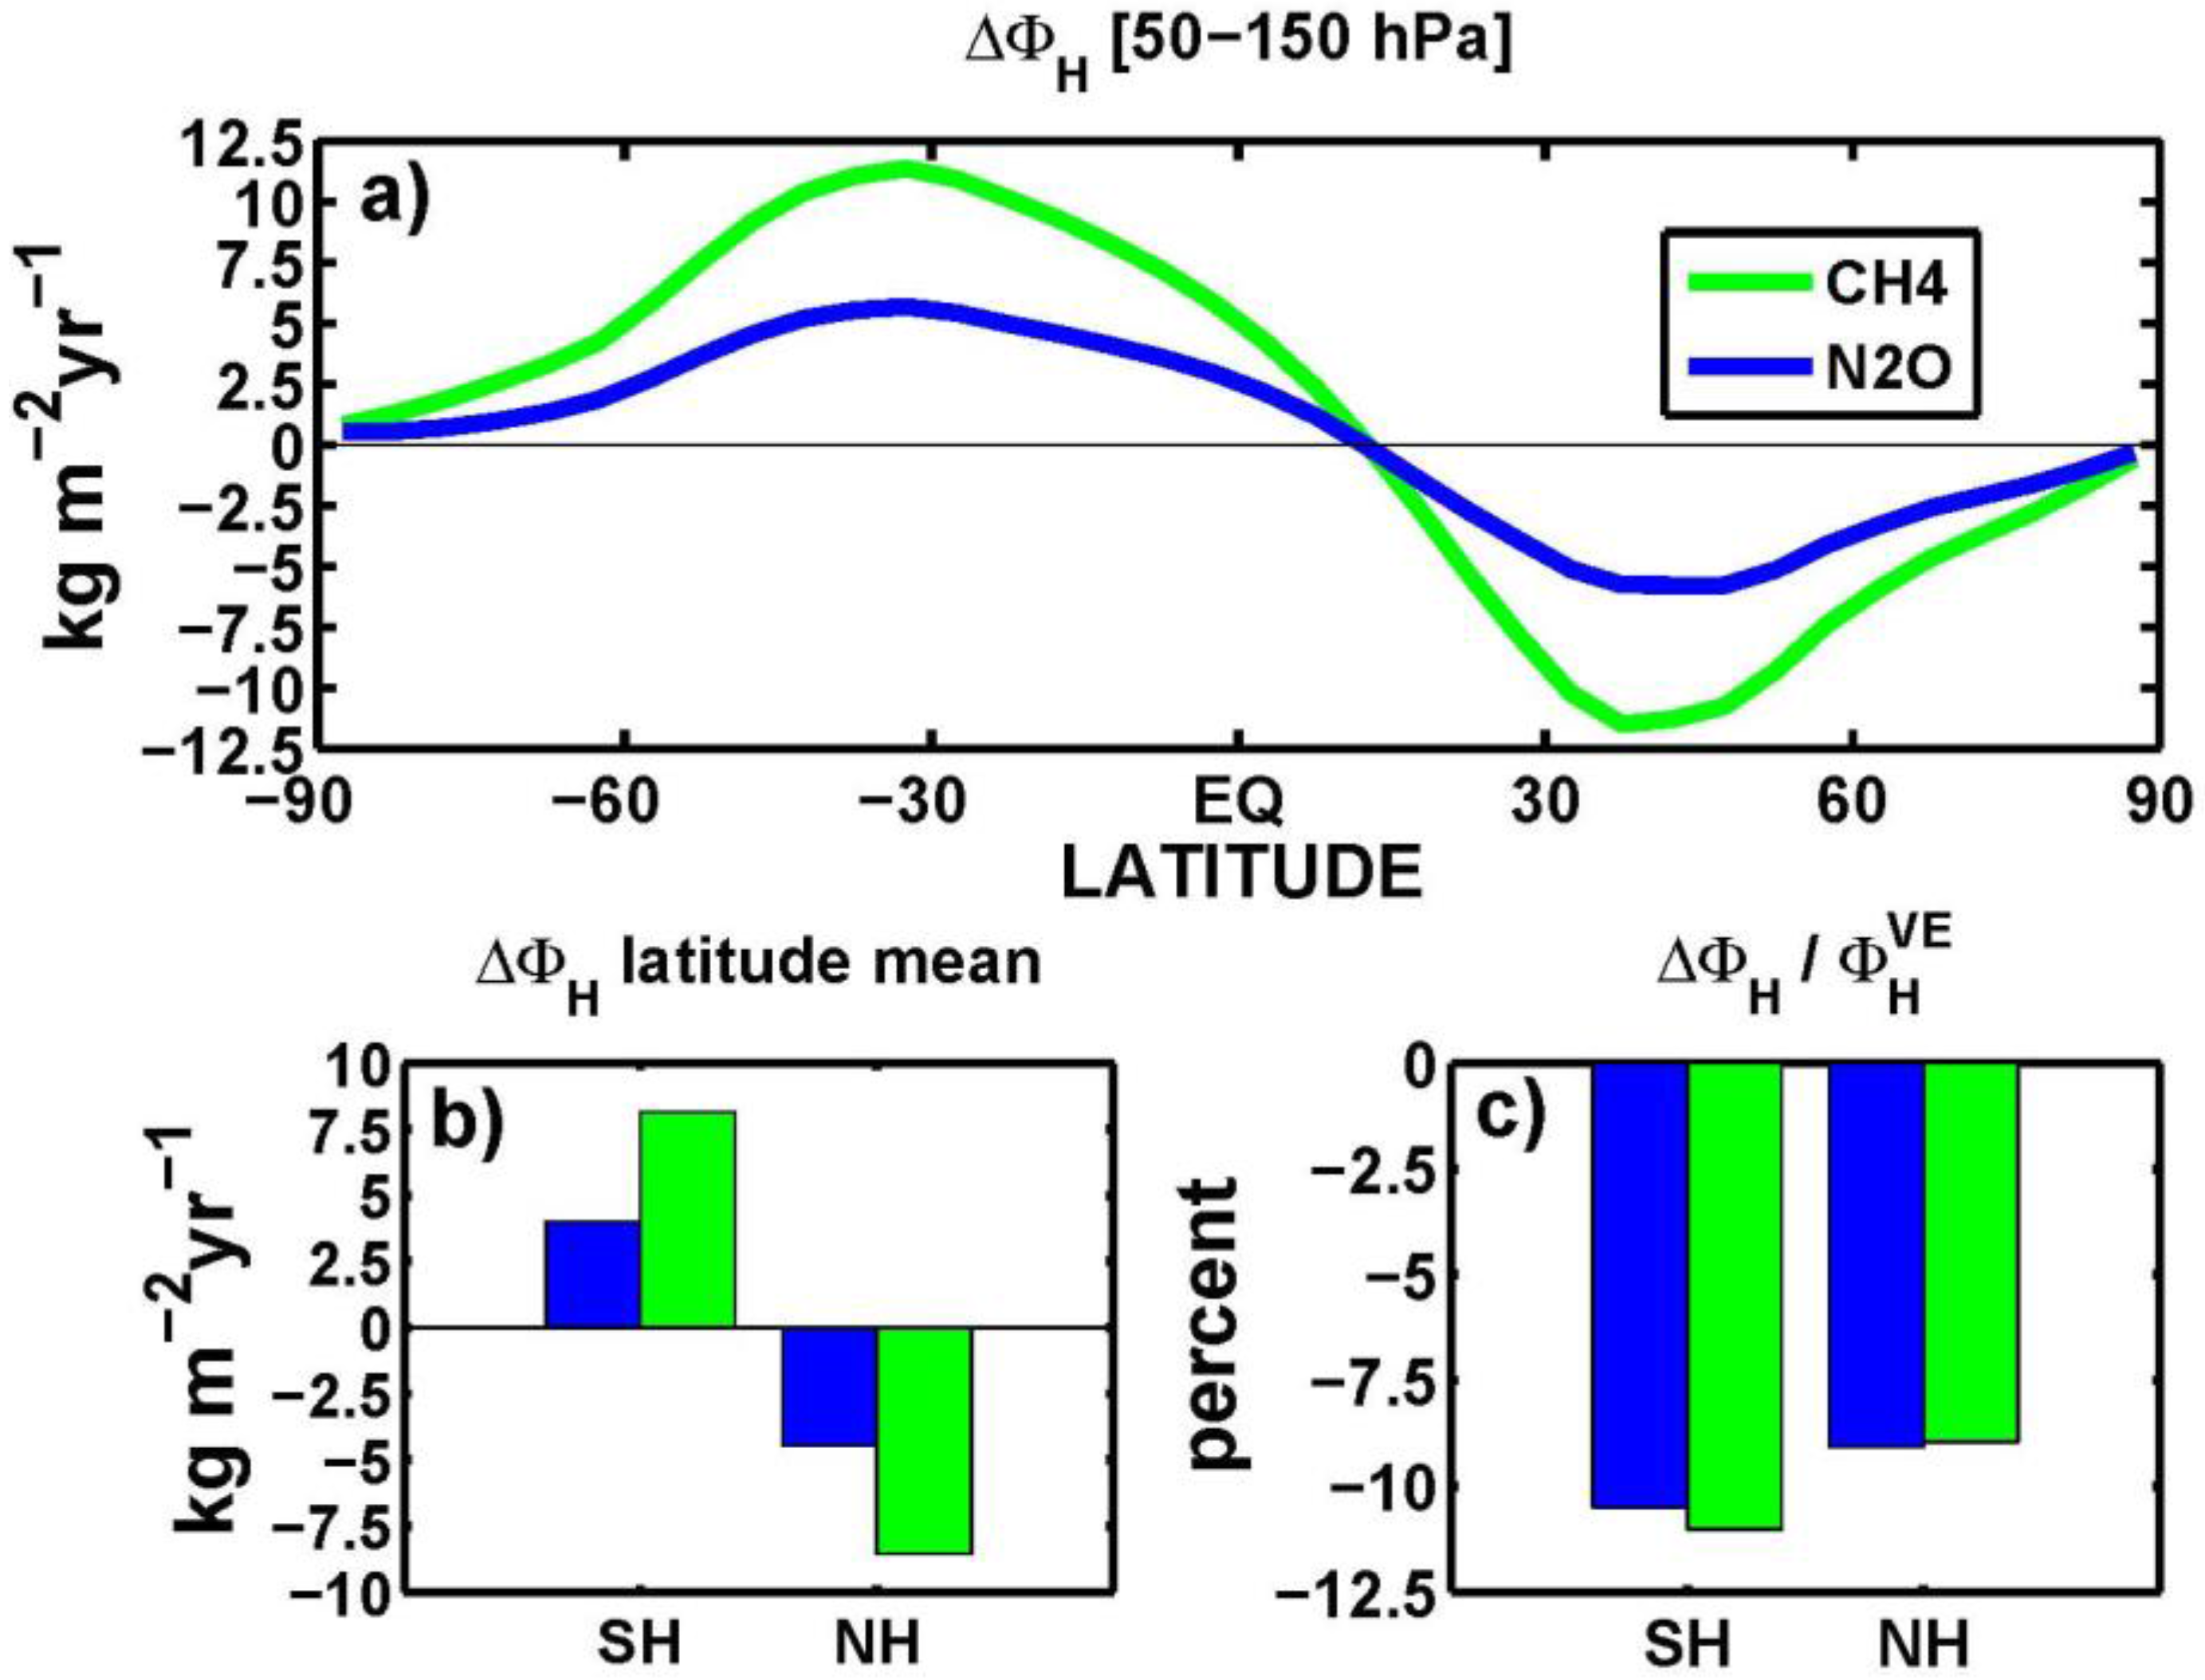
Figure 8a, where we show the latitude dependent VE-REF mean zonal anomalies of N2O and CH4 horizontal eddy mass fluxes in the upper troposphere-lower stratosphere (UTLS), for one year after the Pinatubo eruption. The horizontal mixing of these long-lived tracers is reduced as a consequence of the atmospheric stabilization produced by the volcanic aerosol induced tropospheric cooling and lower stratospheric heating. The model calculated average extratropical mass flux anomaly is shown in Figure 8b,c, in absolute and relative units, respectively (approximately −10% for both tracers in both hemispheres). The latitudinal behavior of these anomalies (Figure 8a) is also very similar to that of w* in Figure 2c. At the subtropical barrier, the calculated horizontal flux anomalies VE-REF are −13 kg/km2/year between 20°S and 30°S and −10 kg/km2/year between 20°N and 30°N, i.e., a relative anomaly of −6% in both hemispheres. These in turn produce a negative anomaly of the tracers above the tropopause since less mass is exported outside the tropics for long-lived tracers with surface source and stratospheric sink.
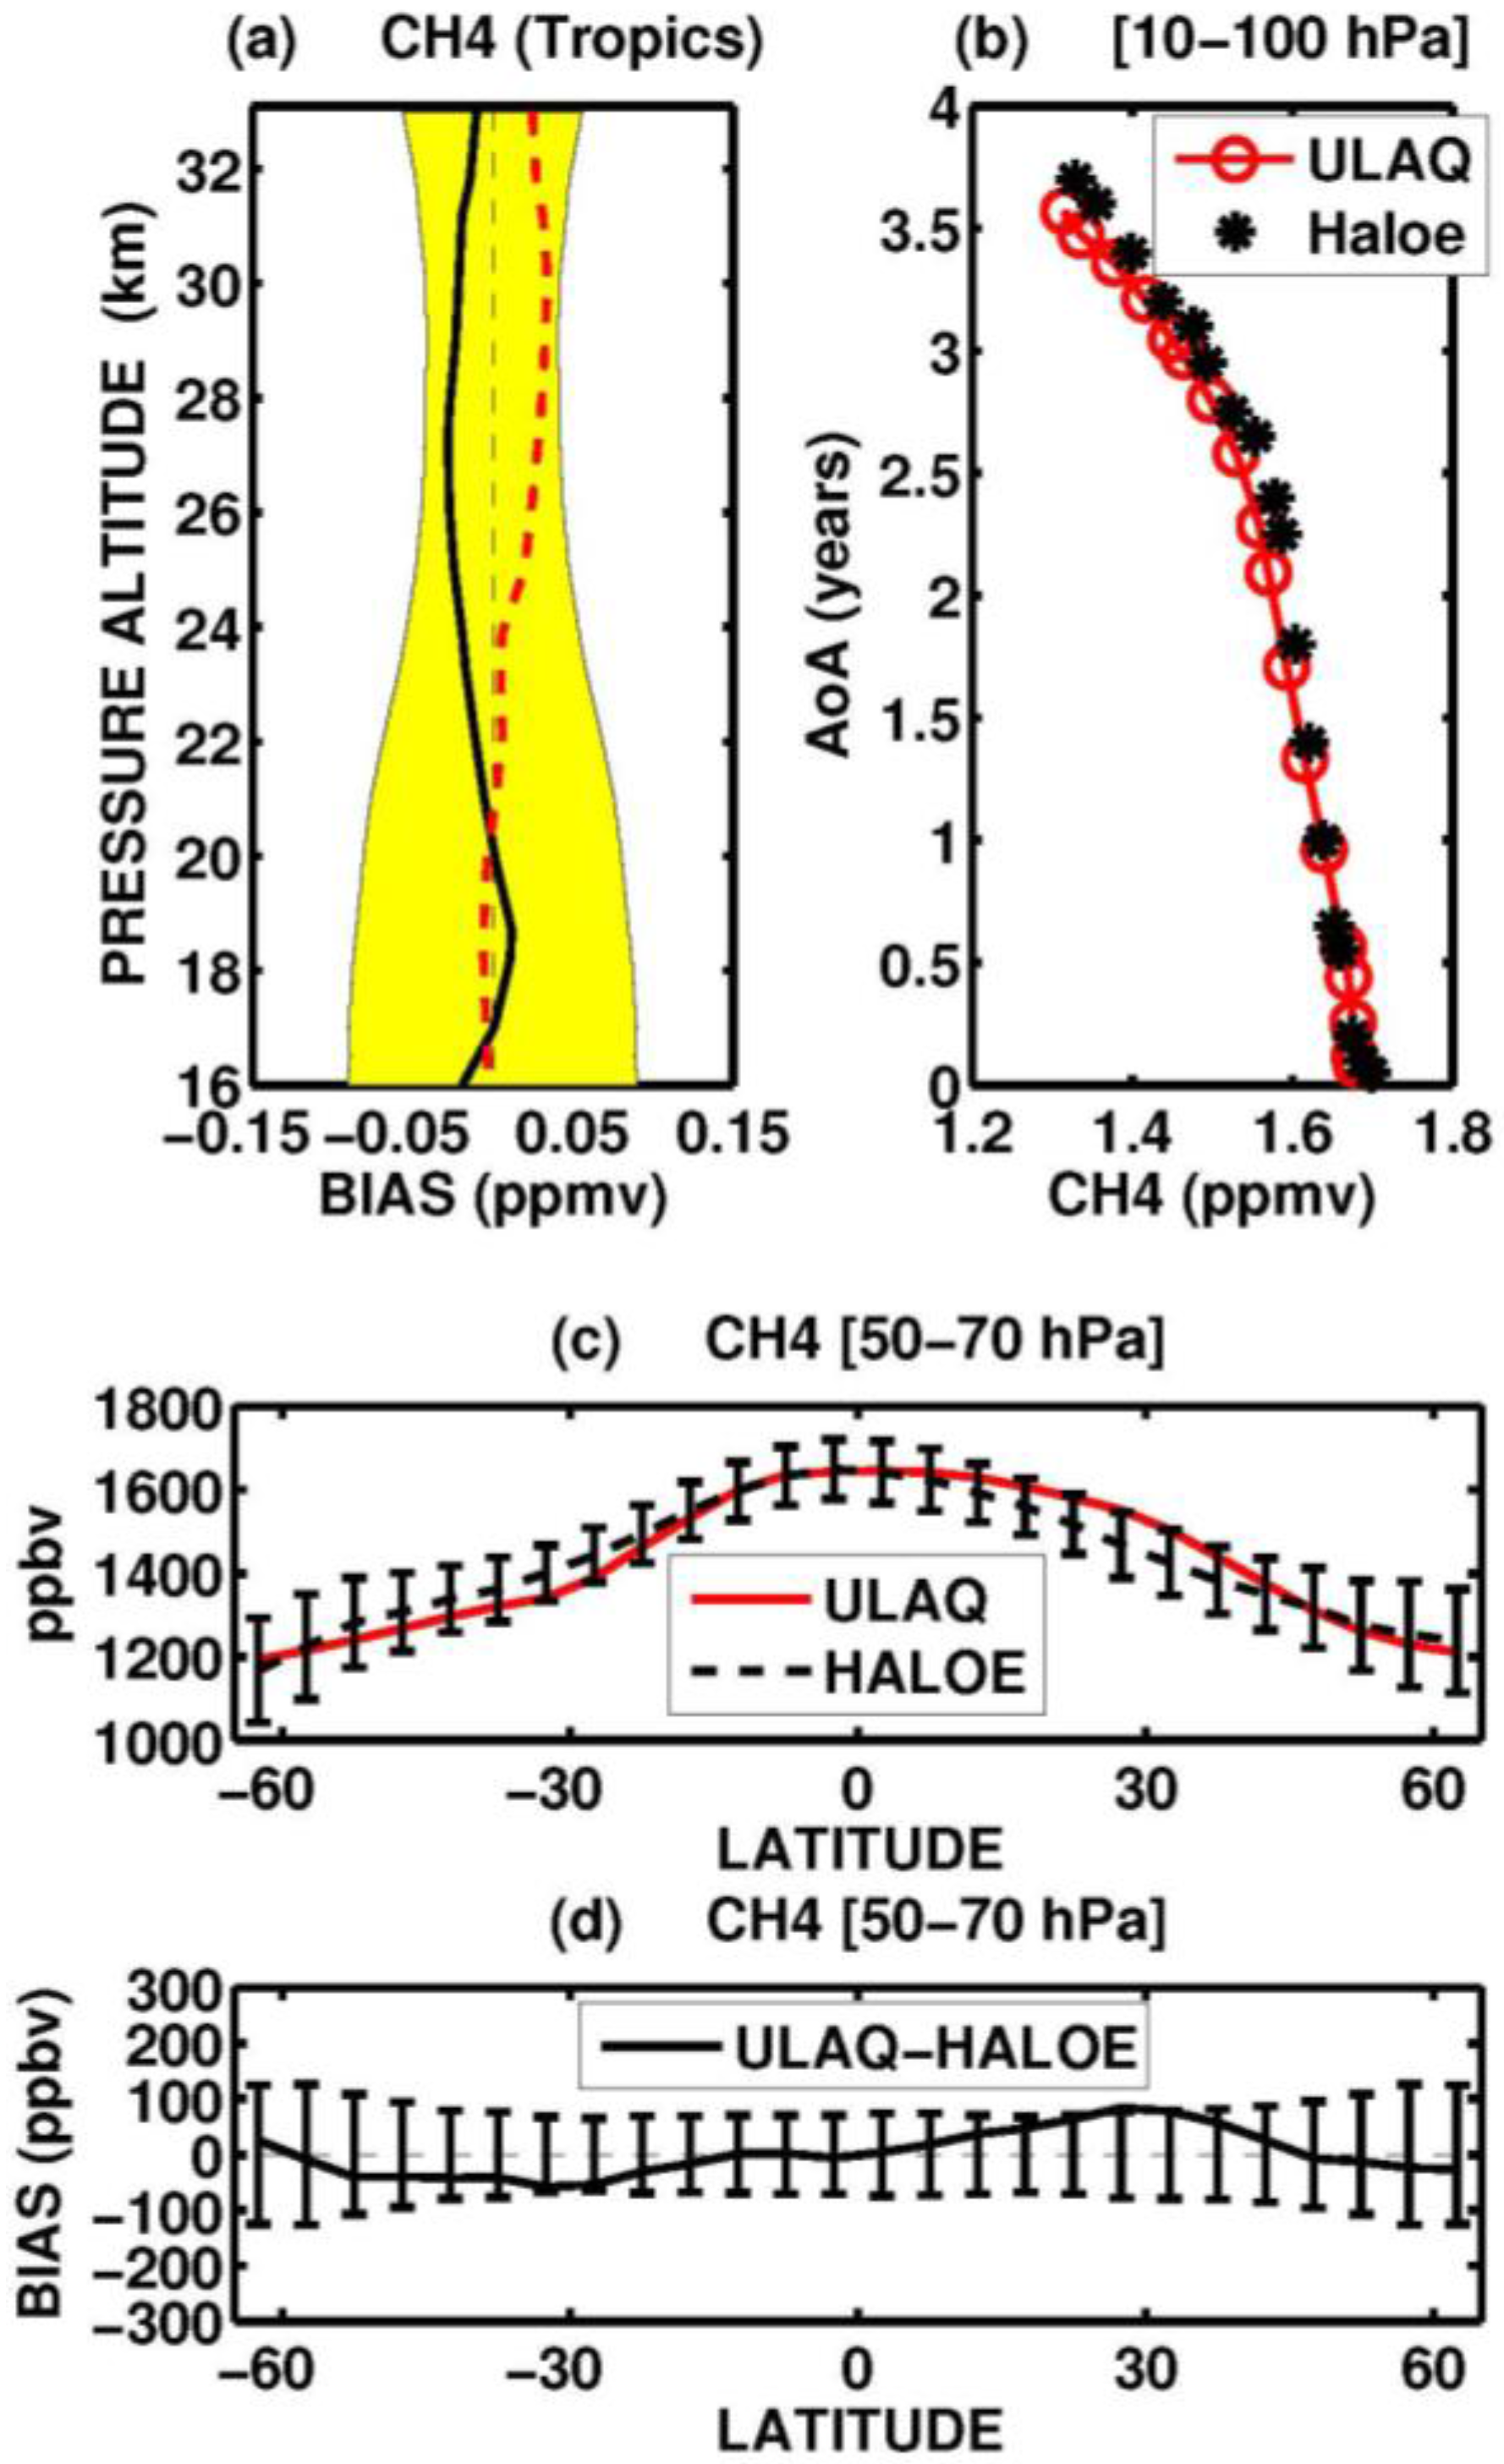
Satellite data have also been used for an evaluation of the model calculated CH4 mixing ratios. Unlike N2O, methane cannot be considered a completely passive tracer in the lower stratosphere, due to the OH sink. Their stratospheric lifetimes, however, are comparable (~130 years). HALOE observations [57] were used in Figure 9 to calculate the ULAQ-CCM CH4 bias in the tropics (1991–2005 time average): it results again close to zero (Figure 9a). The post-Pinatubo VE-REF positive anomaly above 30 hPa (red dashed line) is of the order of 30 ppbv, again as a direct consequence of the additional upwelling shown in Figure 2. As for N2O, a compact age of air correlation with CH4 is obtained in the ULAQ-CCM and with a realistic height-dependent slope, if compared to observations (Figure 9b). A 50–70 hPa latitudinal section of CH4 is presented in Figure 9c,d along with HALOE observed data. The model bias is well inside the range of variability of the measurements, with the same tendencies to under- and over-estimate in the Southern and Northern Hemisphere extratropics, as shown for N2O (Figure 7b,c). This is an indication of a model horizontal mixing somewhat too slow in the Southern Hemisphere subtropics and the opposite in the Northern Hemisphere.
The dynamical perturbations resulting from stratospheric volcanic aerosols have been shown to have a significant impact on the large scale transport of ozone and other atmospheric tracers [11,58]. The radiatively forced changes of the stratospheric circulation during the first two years after the Pinatubo eruption may help explain the observed trend decline of long-lived greenhouse gases (N2O and CH4, in particular) [19,59] and the satellite observed feature consisting of a 2% additional global ozone depletion during 1993 with respect 1992 [60,61]. As discussed in Pitari and Mancini [62], this additional depletion may in part derive from the volcanic aerosol cloud dispersal (with enhanced heterogeneous chemical reactions at mid-high latitudes) and in part from the attenuation of the volcanic aerosol radiative impact on the stratospheric circulation in 1992/1993 with respect to 1991/1992. The largest increase of the extratropical downward ozone fluxes in the lower branch of the Brewer–Dobson circulation took place during the first year after the eruption. The tracer was then transported more efficiently towards lower altitudes closer to the tropopause, where the O3 chemical lifetime is longer. This partially mitigated in the total column the 1991/1992 chemically induced O3 loss in the lower stratosphere. Substantial perturbations in the trends of greenhouse gases (CH4, N2O) occurred during 1992/1993: the average pre-Pinatubo rate of increase in atmospheric mixing ratios of CH4 declined consistently in the Northern Hemisphere (from 11.6 to 1.8 ppbv/year) [19], and a similar behavior was found for N2O (from 1.0 to 0.5 ppbv/year) [59].
As discussed with regard to the w* anomaly shown in Figure 2, an increase of the mid- to high-latitude downward flux at the tropopause may be the key factor for explaining the behavior of these atmospheric tracers during 1992 [4]. Since the stratosphere contains lower mixing ratios of N2O and CH4, a decline in the observed trends could result from a higher degree of exchange between the stratosphere and the troposphere. The anomalies of the stratospheric circulation (radiatively forced by the Pinatubo aerosols) could indeed increase the mid-latitude stratosphere-troposphere flux of atmospheric tracers. As discussed before (see Figure 7, Figure 8 and Figure 9), the increased isolation of the tropical pipe also plays a role, by decreasing the horizontal mixing in the UTLS and then the CH4 and N2O export from the tropical reservoir to the extratropics. This is clearly visible in
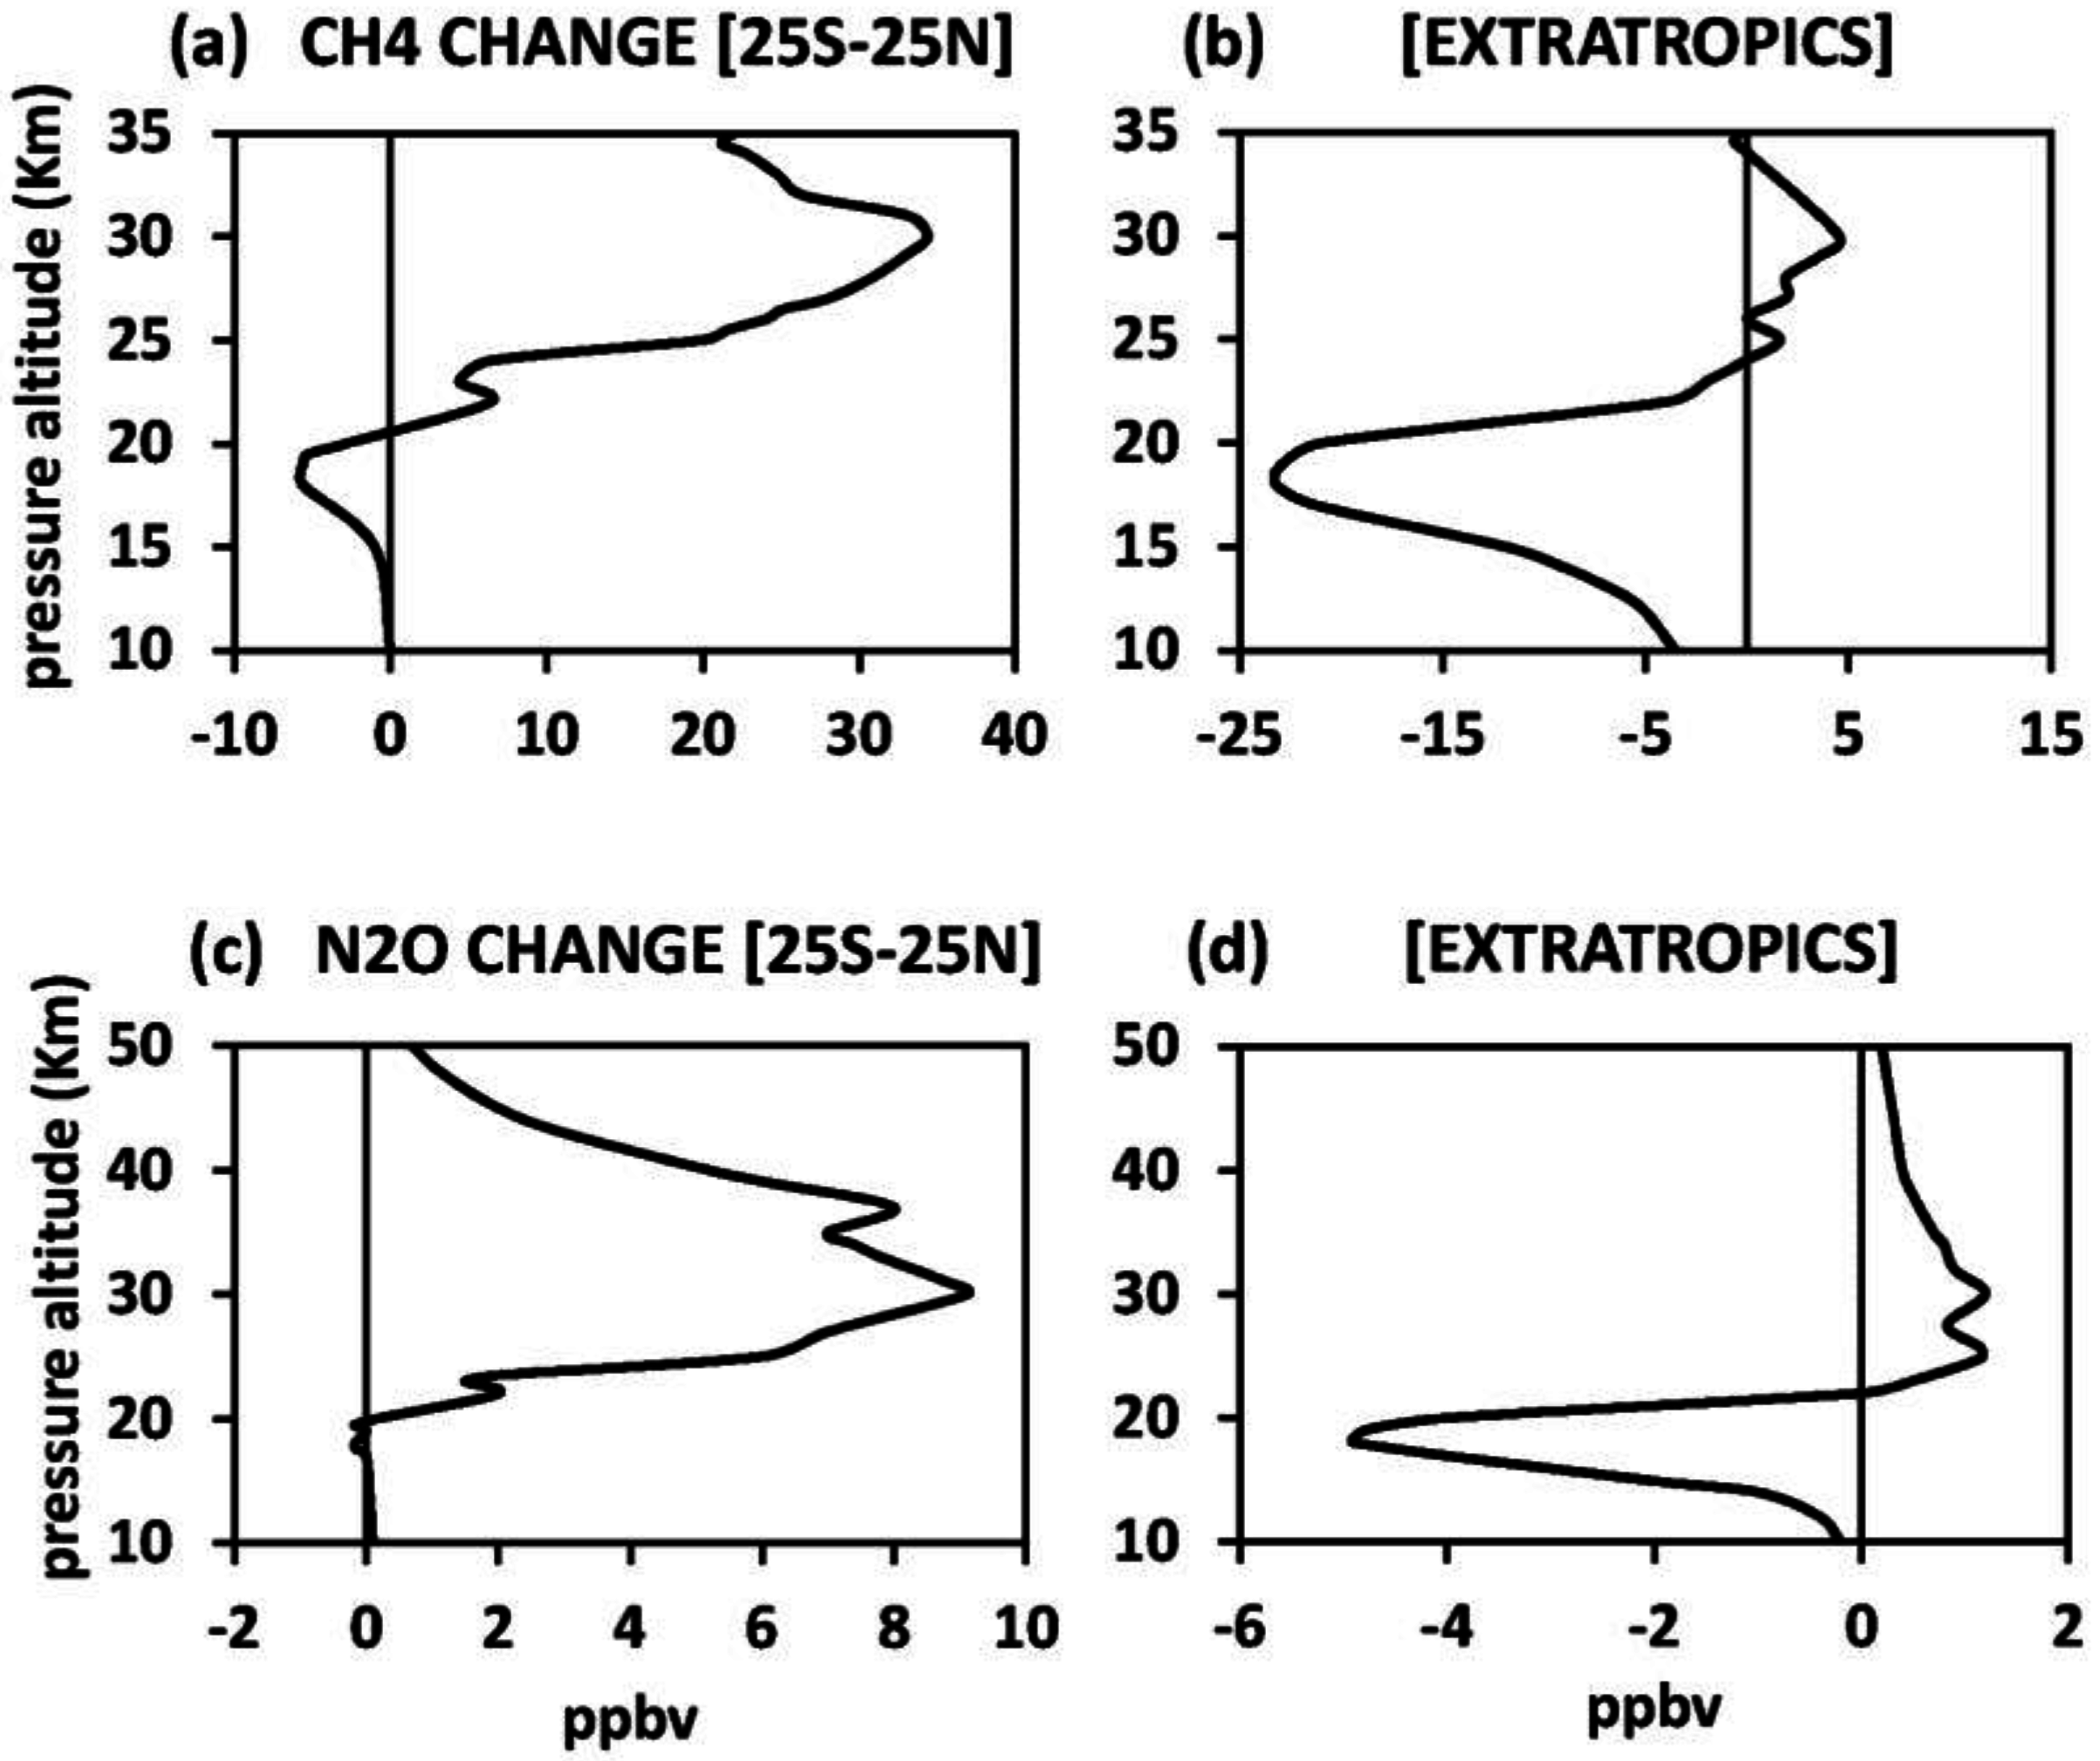
 Figure 10a,b for CH4 and Figure 10c,d for N2O. Besides the previously discussed positive anomaly in the tropics (Figure 10a,c), due to the increasing ascent rate and the decreasing horizontal mixing, a clear UTLS decrease is calculated in the extratropics, with a latitude-averaged peak of −23 ± 6 ppbv for CH4 and −5.0 ± 1.5 ppbv for N2O, both at ~18 km altitude (75 hPa) (Figure 10b,d). In the pressure layer of the extratropical tropopause (150–250 hPa), the model calculated VE-REF changes of the two tracers during July 1991–June 1992 are −6 ± 3 ppbv and −0.6 ± 0.2 ppbv, for CH4 and N2O, respectively (the uncertainties are calculated as the standard deviation from the ensemble of simulations).
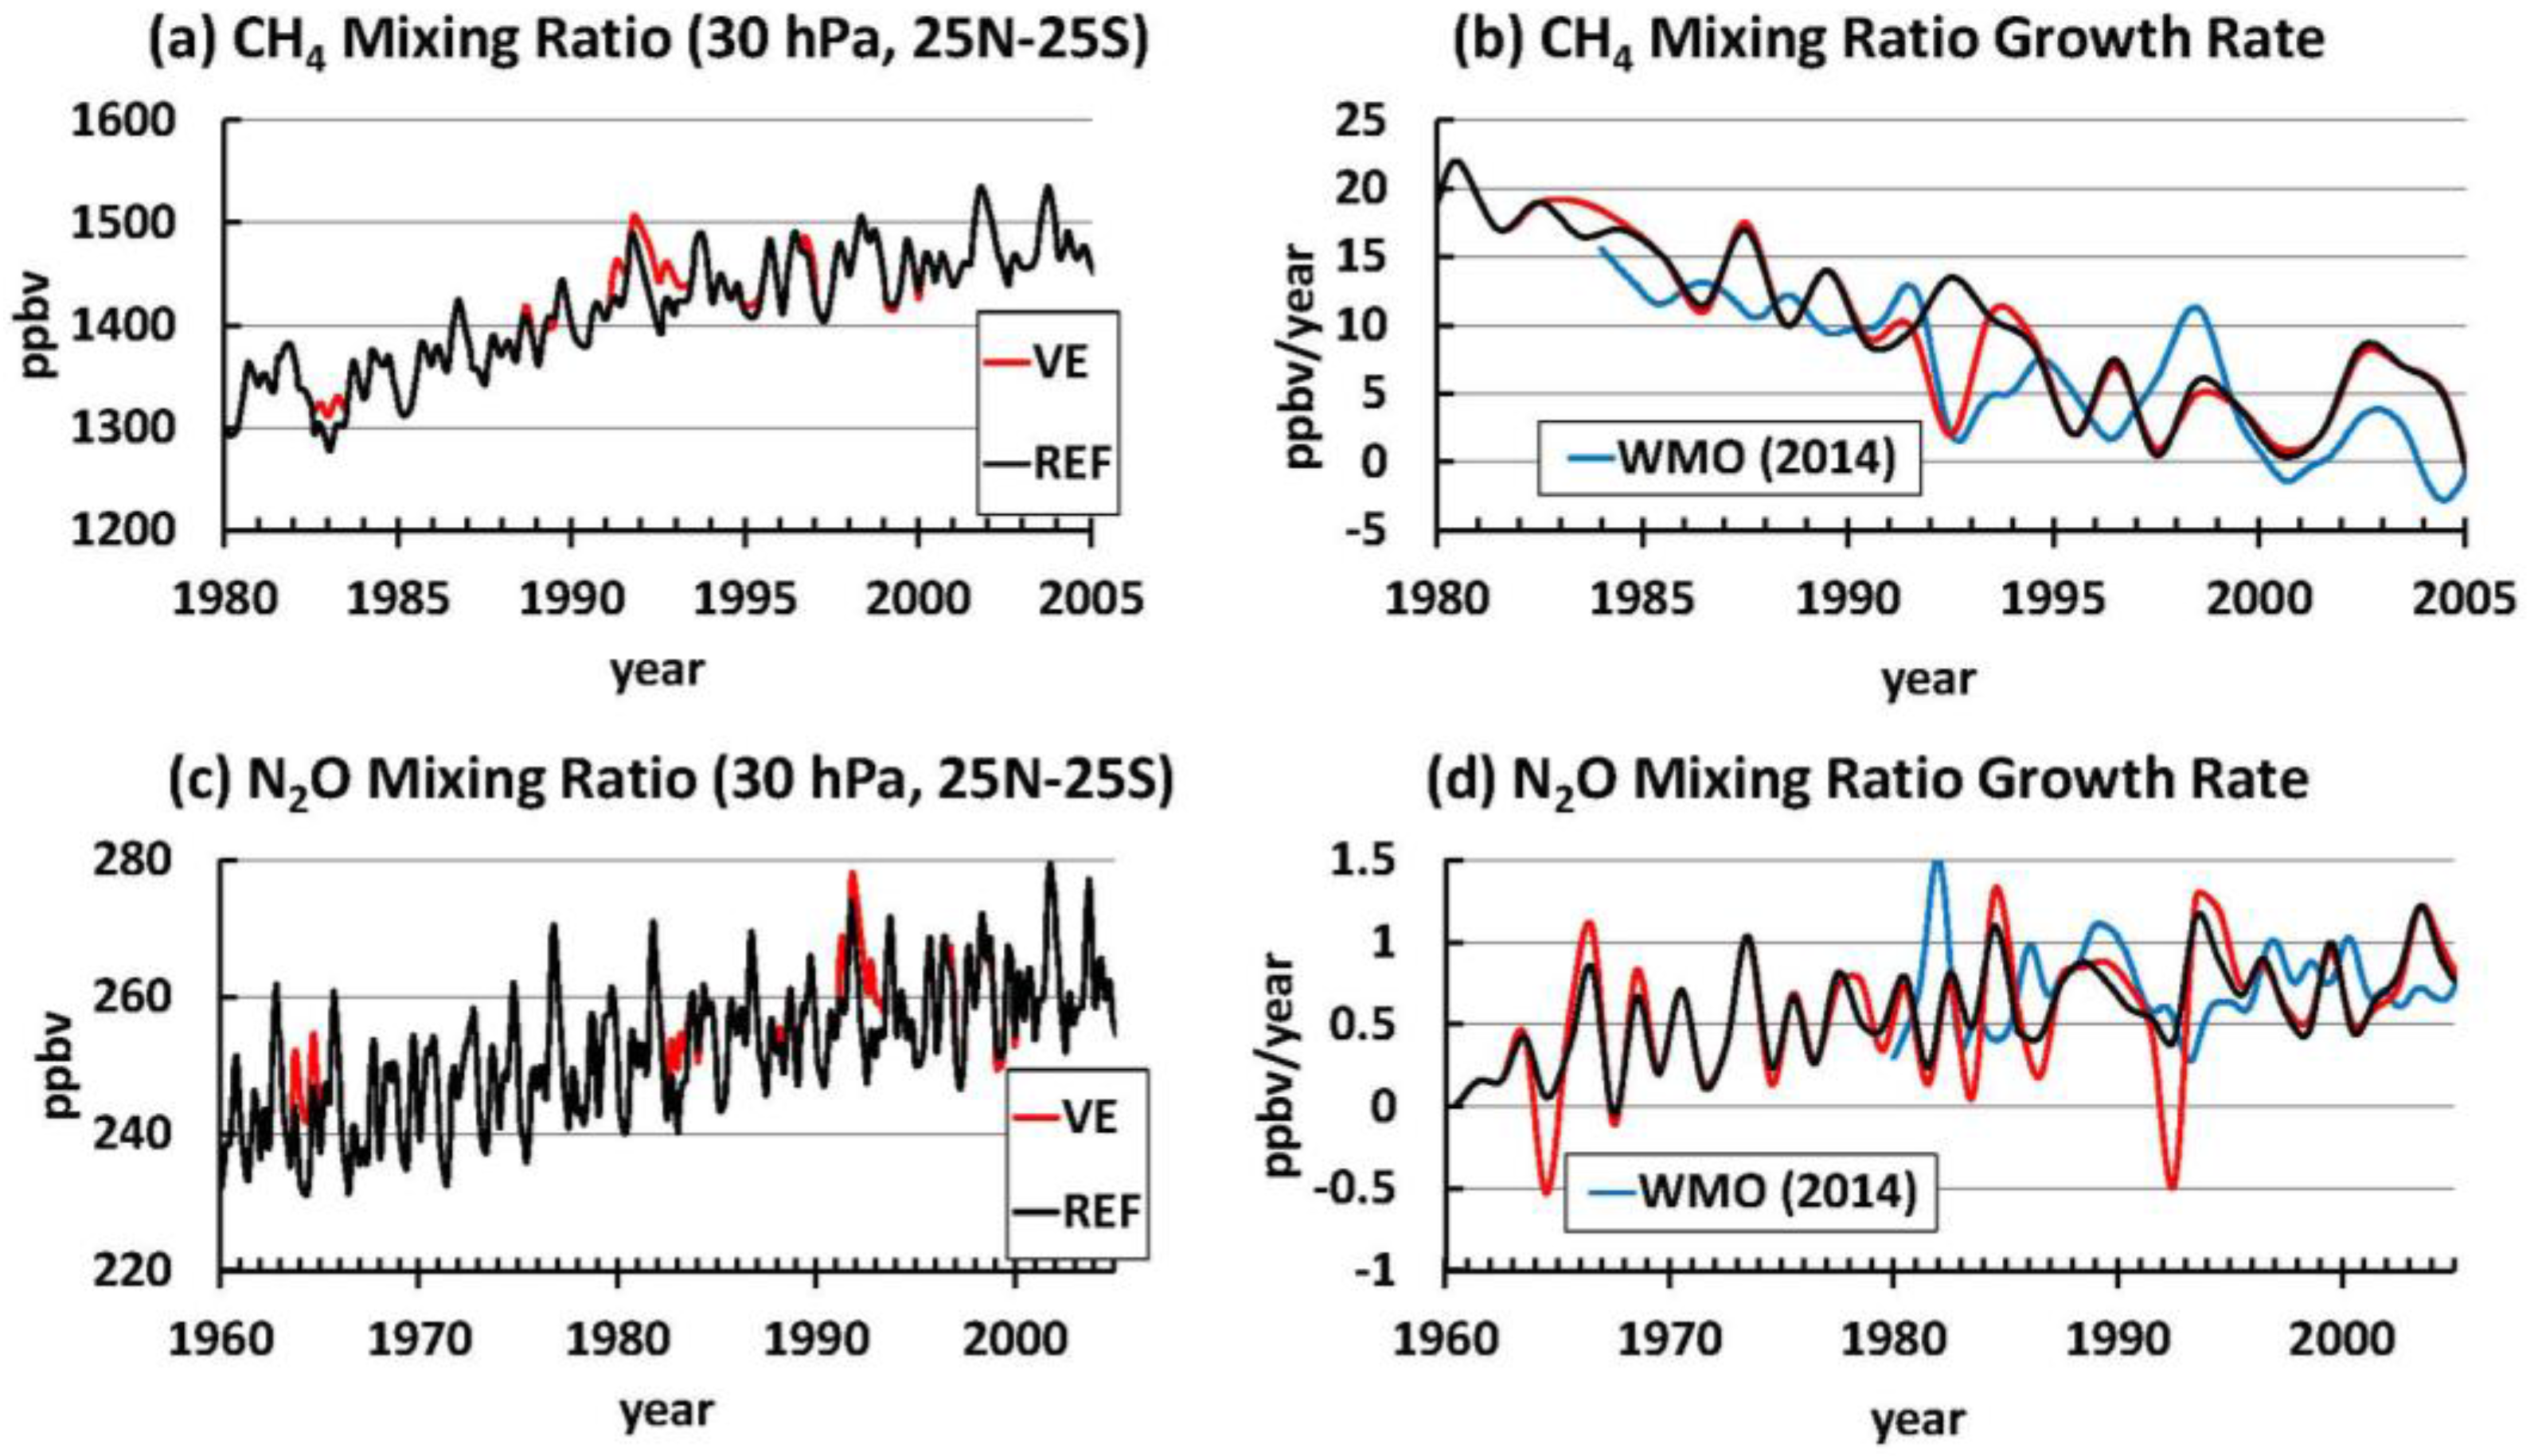
The time series of CH4 and N2O mixing ratios at 30 hPa are presented in Figure 11, along with the species growth rate averaged in the pressure layer of the extratropical tropopause (150–250 hPa). The post-Pinatubo mid-stratospheric increase of CH4 is clearly visible in Figure 11a, as well as the abrupt decrease of its growth rate in the extratropical tropopause layer in the VE case (Figure 11b). This behavior is also found in the growth rate observed at surface stations in 1992 [63] (−8 ppbv/year with respect to the 1988–1991 average), whereas is completely absent in the REF simulation, pointing out the importance of the volcanic aerosol radiative impact on the stratospheric circulation and stratosphere-troposphere exchange (VE-REF anomaly equal to −11 ± 3 ppbv/year during 1992). The interannual variability in the growth rate results from the superposition of the QBO, volcanic signals and SST forcing.
The positive VE-REF growth rate anomaly during 1983 after the El Chichón eruption results from an OH decrease in the troposphere, due to the decreased solar UV flux produced by the enhanced aerosol radiation scattering in the stratosphere [21] and by the tropospheric cooling with decreased amounts of water vapor. This positive anomaly is not sufficiently counteracted by the increased stratosphere-troposphere exchange. This is because the easterly shear of the QBO in the months following the El Chichón eruption, coupled with the geographical location of the eruption (at the northern edge of the tropical band), had produced a faster aerosol cloud dispersal towards the Northern Hemisphere mid-high latitudes. This produced smaller latitudinal gradients of the aerosol heating rates and lasting for a shorter amount of time [6]. The analysis of Bāndă et al. [21] estimated a reduction in tropospheric OH concentrations after the Pinatubo eruption such to cause an increase in the CH4 growth rate of 4 and 2 ppbv/year in the first and second year after the eruption, which could imply an impact of the enhanced stratosphere-troposphere exchange significantly larger than the observed growth rate decrease of 8 ppbv/year.
The N2O mid-stratospheric tropical time series in Figure 11c highlights the VE enhancement not only after the Pinatubo eruption but also after Agung and El Chichón. The observed change in the N2O growth rate is −0.4 ppbv/year in 1992 with respect to pre-Pinatubo years (1988–1991), with a corresponding VE-REF calculated anomaly equal to −0.8 ± 0.2 ppbv/year at the extratropical tropopause layer (Figure 11d). The major difference between the surface observed growth rates and the tropopause VE-REF calculated anomalies is during 1993/1994, when the latter come back to statistically insignificant small values, contrary to the surface observed growth rates that are still significantly lower than the pre-Pinatubo values. On the other hand, we should consider that in the model a prescribed time-dependent surface mixing ratio is used for all long-lived species [44] and it is kept unchanged between VE and REF simulations. The tropopause mixing ratios may then adjust to an “aerosol unperturbed” circulation faster than boundary layer mixing ratios in the real atmosphere, where the whole troposphere could have adjusted to lower mixing ratio values at the extratropical tropopause during 1992.
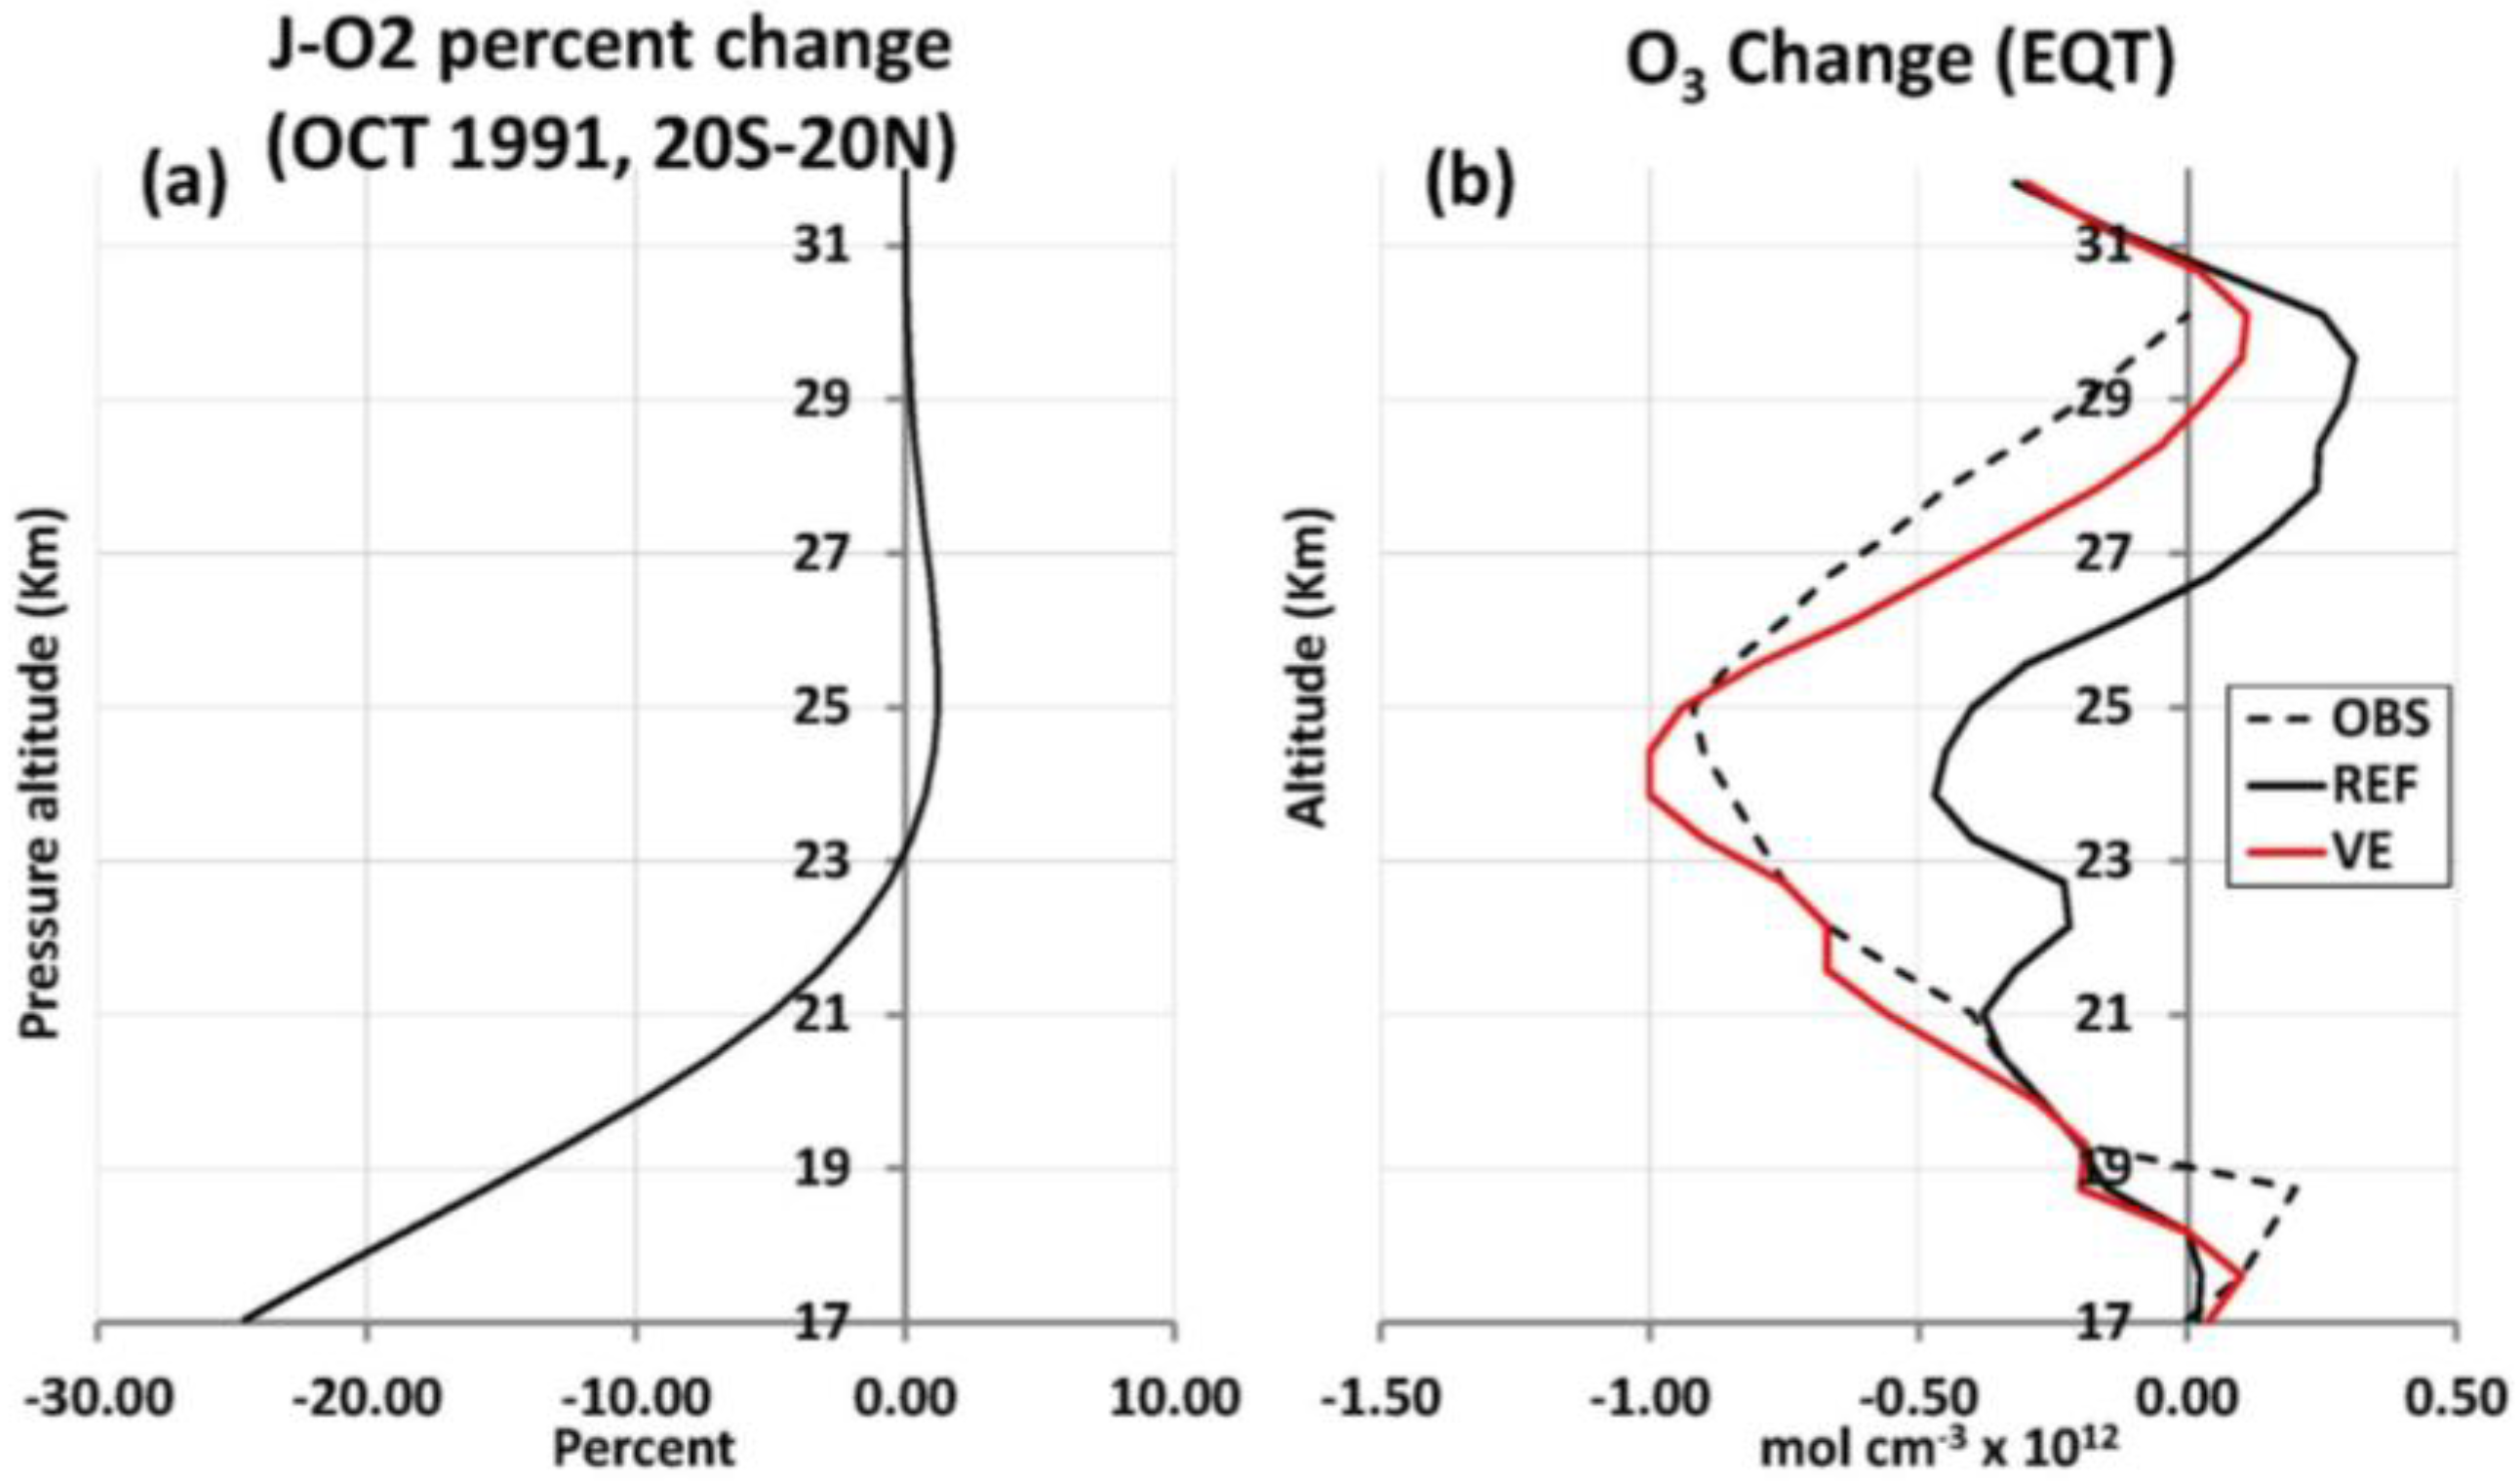
Another clear example of the significant radiative impact of stratospheric volcanic aerosols on trace species is presented in Figure 12. Here we look at post-Pinatubo radiative effects on tropical ozone. The first type of radiative perturbation acts by lowering the O3 production below ~23 km altitude, because of the aerosol cloud screening to the incoming solar UV radiation, with consequent decrease of O2 photolysis (Figure 12a). The second type of radiative perturbation acts decreasing the lower stratospheric tropical O3 concentration via the enhanced ascent rate originated by the strong latitudinal gradient of the volcanic aerosol heating rates in the lower stratosphere (Figure 12b). We compare the observed profile change during October–November 1991 with respect to April–May–June 1991 at Brazzaville, Congo [64] with the ULAQ-CCM results for the two simulations (VE and REF). In both these simulations, the aerosol SAD is prescribed from an external data source [44], so that the heterogeneous chemical impact on O3 is the same in both VE and REF simulations. The tropical ozone anomaly in October–November 1991 is much larger in the VE case with respect to REF (−23 DU versus −10 DU) and also much closer to the observed anomaly (−20 DU). This clearly shows the importance of the radiative feedbacks of volcanic aerosols on stratospheric ozone: in the tropical lower stratosphere the enhanced upwelling effect on the vertical ozone profile dominates with respect to the enhanced heterogeneous chemistry effect of the volcanic aerosols.

4. Conclusions

A process-evaluated climate-chemistry coupled model (ULAQ-CCM) has been used in the present work to study the effects on trace species transport of the radiatively forced changes of the stratospheric circulation after major volcanic eruptions. We show that the observed trend decline of long-lived greenhouse gases (N2O and CH4, in particular) one year after the Pinatubo eruption [19,59] is quantitatively consistent with the higher degree of stratosphere-troposphere exchange, due to the radiatively enhanced Brewer–Dobson circulation. Satellite observations have also highlighted a 2% additional global ozone depletion during 1993 with respect 1992. This additional depletion may in part derive from the volcanic aerosol cloud dispersal, with enhanced heterogeneous chemical reactions at mid-high latitudes during 1993. In addition, it may derive from the attenuation of the volcanic aerosol radiative impact on the stratospheric circulation in 1992/1993 with respect to 1991/1992, when the extratropical downward ozone fluxes were significantly enhanced by the Pinatubo volcanic aerosols. A coupling of photochemical and dynamical perturbations is necessary to correctly understand the observed features of the post-Pinatubo ozone depletion.
The mid-high latitude UTLS mixing ratios of long-lived species with tropospheric source and stratospheric sink (as N2O, CH4, CFCs, HCFCs etc.), may also change with a less efficient horizontal mixing, so that the export of tracer mass from the tropical reservoir toward the mid-latitudes decreases. Below 30 hPa, the tropical N2O is quasi-uniform in vertical because it has essentially no loss and the volcanic aerosol induced changes in the tropical ascent rate have small effects on its mixing ratio. The slight positive N2O anomaly calculated in the ULAQ-CCM in the 30–50 hPa layer during 1991/1992 is then caused by a coupling of the additional upwelling and a decreased efficiency of the horizontal mixing. The latter results from the atmospheric stabilization produced by the volcanic aerosol induced tropospheric cooling and lower stratospheric heating. Other possible causes for the declining or stalling CH4 growth rate in the 1990s until 2006 have been reported in the recent literature and deal with tropospheric OH variability [22] and decreasing anthropogenic CH4 emissions in Europe and Siberia [23,24], which are documented by Dedikov et al. [65].
Another effect of the volcanic aerosol radiative perturbation on the stratospheric dynamics may be found looking at the stratospheric age-of-air. According to the ULAQ-CCM, the enhanced tropical upwelling tends to decrease the tropical age of air and latitudinal age gradient after the major volcanic eruptions. This is more evident after Pinatubo, due to the better aerosol confinement in the tropical pipe favored by the QBO easterly shear in the months following this eruption. Similar results were also obtained in the work of Ray et al. [17], who made use of SF6 and CO2 measurements along a tropical leaky pipe model to study the stratospheric age of air from 1975 to 2012. Our analysis also suggests that trends in age of air are strongly dependent on ozone changes, increase of well mixed GHGs (including SST warming) and volcanic eruptions, consistently with the findings of Garfinkel et al. [29]. A negative age trend related to a stronger BDC characterizes the full tropical stratosphere (mid and lower) during the period from 1960 to 1986, as consequence of the ozone depletion and increase of well mixed GHGs. In the 1990s and later, mid stratosphere age of air increases as a consequence of the rising ozone concentration, and the eruption of Pinatubo contributes to intensify this positive trend. Otherwise, lower stratosphere age of air continuously declines because of GHG rising and SST warming.

Acknowledgments

The authors thank Samuel Brohede and Jo Urban for use of the Odin/SMR N2O climatology. One of the authors (IC) would like to acknowledge support by the European Union’s Horizon 2020 research and innovation program under grant agreement No. 641816 (CRESCENDO).

Author Contributions

Giovanni Pitari: Overall coordination and responsibility for the ULAQ climate-chemistry model. Irene Cionni: Evaluation of model results. Glauco Di Genova: Responsibility for the ULAQ radiative transfer module. Daniele Visioni: Post-analyses of model results. Ilaria Gandolfi: Setup of the tropospheric SOx module. Eva Mancini: Setup of the aerosol module for volcanic aerosols.

Conflicts of Interest

The authors declare no conflict of interest.

References

  1. Sato, M.; Hansen, J.E.; McCormick, M.P.; Pollack, J.B. Stratospheric aerosol optical depth, 1850–1990. J. Geophys. Res. 1993, 98, 22987–22994. [Google Scholar] [CrossRef]
  2. McCormick, M.P.; Thomason, L. Collection of Global Profiles of Aerosol Extinction, Temperature, Ozone, Nitrogen Dioxide and Water Vapour as Part of the Stratospheric Aerosol and Gas Experiment II (SAGE II). NCAS British Atmospheric Data Centre, 2006. Available online: http://catalogue.ceda.ac.uk/uuid/bd5e5f99d8f789324698379efba64502 (accessed on 21 January 2016).
  3. Pitari, G. A numerical study of the possible perturbation of stratospheric dynamics due to Pinatubo aerosols: Implications for tracer transport. J. Atmos. Sci. 1993, 50, 2443–2461. [Google Scholar] [CrossRef]
  4. Schauffler, S.M.; Daniel, J.S. On the effects of stratospheric circulation changes on trace gas trends. J. Geophys. Res. 1994, 99, 25747. [Google Scholar] [CrossRef]
  5. Aquila, V.; Oman, L.D.; Stolarski, R.S.; Douglass, A.R.; Newman, P.A. The response of ozone and nitrogen dioxide to the eruption of Mount Pinatubo at southern and northern midlatitudes. J. Atmos. Sci. 2013, 70, 894–900. [Google Scholar] [CrossRef]
  6. Pitari, G.; Di Genova, G.; Mancini, E.; Visioni, D.; Gandolfi, I.; Cionni, I. Stratospheric aerosols from major volcanic eruptions: A composition-climate model study of the aerosol cloud dispersal and e-folding time. Atmosphere 2016, 7. [Google Scholar] [CrossRef]
  7. Hansen, J.E.; Lacis, A.; Ruedy, R.; Sato, M. Potential climate impact of Mount Pinatubo eruption. Geophys. Res. Lett. 1992, 19, 215–218. [Google Scholar] [CrossRef]
  8. Stenchikov, G.L.; Kirchner, I.; Robock, A.; Graf, H.-F.; Antuna, J.C.; Grainger, R.; Lambert, A.; Thomason, L. Radiative forcing from the 1991 Mt. Pinatubo volcanic eruption. J. Geophys. Res. 1998, 103, 13837–13858. [Google Scholar] [CrossRef]
  9. Ridley, D.A.; Solomon, S.; Barnes, J.E.; Burlakov, V.D.; Deshler, T.; Dolgii, S.D.; Herber, A.B.; Nagai, T.; Neely, R.R., III; Nevzorov, A.V.; et al. Total volcanic stratospheric aerosol optical depths and implications for global climate change. J. Geophys. Res. 2014, 41, 7763–7769. [Google Scholar] [Green Version]
  10. Shindell, D.T.; Schmidt, G.A.; Mann, M.E.; Faluvegi, G. Dynamic winter climate response to large tropical volcanic eruptions since 1600. J. Geophys. Res. 2004, 109, D05104. [Google Scholar] [CrossRef]
  11. Kinne, S.; Toon, O.B.; Prather, M.J. Buffering of stratospheric circulation by changing amounts of tropical ozone: A Pinatubo case study. Geophys. Res. Lett. 1992, 19, 1927–1930. [Google Scholar] [CrossRef]
  12. Labitzke, K.; McCormick, M.P. Stratospheric temperature increases due to Pinatubo aerosols. Geophys. Res. Lett. 1992, 19, 207–210. [Google Scholar] [CrossRef]
  13. Pitari, G.; Aquila, V.; Kravitz, B.; Robock, A.; Watanabe, S.; Cionni, I.; de Luca, N.; Di Genova, G.; Mancini, E.; Tilmes, S. Stratospheric ozone response to sulfate geoengineering: Results from the Geoengineering Model Intercomparison Project (GeoMIP). J. Geophys. Res. 2014, 119, 2629–2653. [Google Scholar] [CrossRef]
  14. Young, R.E.; Houben, H.; Toon, O.B. Radiatively forced dispersion of the Mt. Pinatubo volcanic cloud and induced temperature perturbations in the stratosphere during the first few months following the eruption. Geophys. Res. Lett. 1994, 21, 369–372. [Google Scholar] [CrossRef]
  15. Aquila, V.; Oman, L.D.; Stolarski, R.S.; Colarco, P.R.; Newman, P.A. Dispersion of the volcanic sulfate cloud from a Mount Pinatubo-like eruption. J. Geophys. Res. 2012, 117, D06216. [Google Scholar] [CrossRef]
  16. Trepte, C.R.; Hitchman, M.H. Tropical stratospheric circulation deduced from satellite aerosol data. Nature 1992, 355, 626–628. [Google Scholar] [CrossRef]
  17. Ray, E.A.; Moore, F.L.; Rosenlof, K.L.; Davis, S.M.; Sweeney, C.; Tans, P.; Wang, T.; Elkins, J.W.; Bönisch, H.; Engel, A.; et al. Improving stratospheric transport trend analysis based on SF6 and CO2 measurements. J. Geophys. Res. 2014, 119. [Google Scholar] [CrossRef]
  18. Aquila, V.; Garfinkel, C.; Oman, L.D.; Waugh, D. Modifications of the quasi-biennial oscillation by a geoengineering perturbation of the stratospheric aerosol layer. Geophys. Res. Lett. 2014, 41, 1738–1744. [Google Scholar] [CrossRef]
  19. Dlugokencky, E.J.; Masarie, K.A.; Lang, P.M.; Tans, P.P.; Steele, L.P.; Nisbet, E.G. A dramatic decrease in the growth rate of atmospheric methane in the northern hemisphere during 1992. Geophys. Res. Lett. 1994, 21, 45–48. [Google Scholar] [CrossRef]
  20. Bāndă, N.; Krol, M.; van Weele, M.; van Noije, T.; Röckmann, T. Analysis of global methane changes after the 1991 Pinatubo volcanic eruption. Atmos. Chem. Phys. 2013, 13, 2267–2281. [Google Scholar] [CrossRef]
  21. Bāndă, N.; Krol, M.; van Noije, T.; van Weele, M.; Williams, J.E.; Le Sager, P.; Niemeier, U.; Thomason, L.; Röckmann, T. The effect of stratospheric sulfur from Mount Pinatubo on tropospheric oxidizing capacity and methane. J. Geophys. Res. Atmos. 2015, 120, 1202–1220. [Google Scholar] [CrossRef]
  22. McNorton, J.; Chipperfield, M.P.; Gloor, M.; Wilson, C.; Feng, W.; Hayman, G.D.; Rigby, M.; Krummel, P.B.; O’Doherty, S.; Prinn, R.G.; et al. Role of OH variability in the stalling of the global atmospheric CH4 growth rate from 1999 to 2006. Atmos. Chem. Phys. 2016, 16, 7943–7956. [Google Scholar] [CrossRef]
  23. Dlugokencky, E.J.; Houweling, S.; Bruhwiler, L.; Masarie, K.A.; Lang, P.M.; Miller, J.B.; Tans, P.P. Atmospheric methane levels off: Temporary pause or a new steady-state? Geophys. Res. Lett. 2003, 30, 19. [Google Scholar] [CrossRef]
  24. Worthy, D.E.; Chan, E.; Ishizawa, M.; Chan, D.; Poss, C.; Dlugokencky, E.J.; Maksyutov, S.; Levin, I. Decreasing anthropogenic methane emissions in Europe and Siberia inferred from continuous carbon dioxide and methane observations at Alert, Canada. J. Geophys. Res. 2009, 114, D10301. [Google Scholar] [CrossRef]
  25. Neu, J.L.; Plumb, R.A. Age of air in a “leaky pipe” model of stratospheric transport. J. Geophys. Res. 1999, 104, 19243–19255. [Google Scholar] [CrossRef]
  26. Diallo, M.; Legras, B.; Chedin, A. Age of stratospheric air in the ERA-Interim. Atmos. Chem. Phys. 2012, 12, 12133–12154. [Google Scholar] [CrossRef]
  27. Rosenfield, J.E.; Considine, D.B.; Meade, P.E.; Bacmeister, J.T.; Jackman, C.H.; Schoeberl, M.R. Stratospheric effects of Mount Pinatubo aerosol studied with a coupled two-dimensional model. J. Geophys. Res. 1997, 102, 3649–3670. [Google Scholar] [CrossRef]
  28. Strahan, S.E.; Douglass, A.R.; Stolarski, R.S.; Akiyoshi, H.; Bekki, S.; Braesicke, P.; Butchart, N.; Chipperfield, M.P.; Cugnet, D.; Dhomse, S.; et al. Using transport diagnostics to understand Chemistry Climate Model ozone simulations. J. Geophys. Res. 2011, 116, D17302. [Google Scholar] [CrossRef]
  29. Garfinkel, C.I.; Aquila, V.; Waugh, D.W.; Oman, L.D. Time varying changes in the simulated structure of the brewer dobson circulation. Atmos. Chem. Phys. Discuss. 2016. [Google Scholar] [CrossRef]
  30. Engel, A.; Möbius, T.; Bönisch, H.; Schmidt, U.; Heinz, R.; Levin, I.; Atlas, E.; Aoki, S.; Nakazawa, T.; Sugawara, S.; et al. Age of stratospheric air unchanged within uncertainties over the past 30 years. Nat. Geosci. 2009, 2, 28–31. [Google Scholar] [CrossRef]
  31. Stiller, G.P.; von Clarmann, T.; Haenel, F.; Funke, B.; Glatthor, N.; Grabowski, U.; Kellmann, S.; Kiefer, M.; Linden, A.; Lossow, S.; et al. Observed temporal evolution of global mean age of stratospheric air for the 2002 to 2010 period. Atmos. Chem. Phys. 2012, 12, 3311–3331. [Google Scholar] [CrossRef] [Green Version]
  32. Eyring, V.; Butchart, N.; Waugh, D.W.; Akiyoshi, H.; Austin, J.; Bekki, S.; Bodeker, G.E.; Boville, B.A.; Bruhl, C.; Chipperfield, M.P.; et al. Assessment of temperature, trace species, and ozone in chemistry-climate model simulation of the recent past. J. Geophys. Res. 2006, 111, D22308. [Google Scholar] [CrossRef]
  33. Hegglin, M.I.; Gettelman, A.; Hoor, P.; Krichevsky, R.; Manney, G.L.; Pan, L.L.; Son, S.W.; Stiller, G.; Tilmes, S.; Walker, K.A.; et al. Multi-model assessment of the upper troposphere and lower stratosphere: Extra-tropics. J. Geophys. Res. 2010, 115, D00M09. [Google Scholar] [CrossRef]
  34. Austin, J.; Struthers, H.; Scinocca, J.; Plummer, D.A.; Akiyoshi, H.; Baumgaertner, A.J.G.; Bekki, S.; Bodeker, G.E.; Braesicke, P.; Brühl, C.; et al. Chemistry-climate model simulations of spring Antarctic ozone. J. Geophys. Res. 2010, 115, D00M11. [Google Scholar] [CrossRef]
  35. Gettelman, A.; Birner, T.; Eyring, V.; Akiyoshi, H.; Bekki, S.; Bruhl, C.; Dameris, M.; Kinnison, D.E.; Lefevre, F.; Lott, F.; et al. The tropical tropopause layer 1960–2100. Atmos. Chem. Phys. 2009, 9, 1621–1637. [Google Scholar] [CrossRef] [Green Version]
  36. Austin, J.; Scinocca, J.; Plummer, D.; Oman, L.; Waugh, D.; Akiyoshi, H.; Bekki, S.; Braesicke, P.; Butchart, N.; Chipperfield, M.; et al. The decline and recovery of total column ozone using a multi-model time series analysis. J. Geophys. Res. 2010, 115, D00M10. [Google Scholar] [CrossRef]
  37. Bais, A.F.; Tourpali, K.; Kazantzidis, A.; Akiyoshi, H.; Bekki, S.; Braesicke, P.; Chipperfield, M.P.; Dameris, M.; Eyring, V.; Garny, H.; et al. Projections of UV radiation changes in the 21st century: Impact of ozone recovery and cloud effects. Atmos. Chem. Phys. 2011, 11, 7533–7545. [Google Scholar] [CrossRef] [Green Version]
  38. Ray, E.A.; Moore, F.L.; Rosenlof, K.H.; Davis, S.M.; Boenisch, H.; Morgenstern, O.; Smale, D.; Rozanov, E.; Hegglin, M.; Pitari, G.; et al. Evidence for changes in stratospheric transport and mixing over the past Three decades based on multiple datasets and tropical leaky pipe analysis. J. Geophys. Res. 2010, 115, D21304. [Google Scholar] [CrossRef]
  39. Stratosphere-troposphere Processes And their Role in Climate (SPARC). Report on the Lifetimes of Stratospheric Ozone-Depleting Substances, Their Replacements, and Related Species; Ko, M.K.W., Newman, P.A., Reimann, S., Strahan, S.E., Eds.; SPARC Report No. 6; WCRP-15/2013; SPARC Office c/o ETH Zurich: Zurich, Switzerland, 2013. [Google Scholar]
  40. Chipperfield, M.P.; Liang, Q.; Strahan, S.E.; Morgenstern, O.; Dhomse, S.S.; Abraham, N.L.; Archibald, A.T.; Bekki, S.; Braesicke, P.; Di Genova, G.; et al. Multi-model estimates of atmospheric lifetimes of long-lived ozone-depleting substances: Present and future. J. Geophys. Res. 2014, 119, 2555–2573. [Google Scholar]
  41. Randles, C.A.; Kinne, S.; Myhre, G.; Schulz, M.; Stier, P.; Fischer, J.; Doppler, L.; Highwood, E.; Ryder, C.; Harris, B.; et al. Intercomparison of shortwave radiative transfer schemes in global aerosol modeling: Results from the AeroCom Radiative Transfer Experiment. Atmos. Chem. Phys. 2013, 13, 2347–2379. [Google Scholar] [CrossRef] [Green Version]
  42. Pitari, G.; Di Genova, G.; Coppari, E.; de Luca, N.; Di Carlo, P.; Iarlori, M.; Rizi, V. Desert dust transported over Europe: Lidar observations and model evaluation of the radiative impact. J. Geophys. Res. 2015, 120, 2881–2898. [Google Scholar] [CrossRef]
  43. Morgenstern, O.; Giorgetta, M.A.; Shibata, K.; Eyring, V.; Waugh, D.; Shepherd, T.G.; Akiyoshi, H.; Austin, J.; Baumgärtner, A.; Bekki, S.; et al. A review of CCMVal-2 models and simulations. J. Geophys. Res. 2010, 115, D00M02. [Google Scholar]
  44. Eyring, V.; Lamarque, J.-F.; Hess, P.; Arfeuille, F.; Bowman, K.; Chipperfield, M.P.; Duncan, B.; Fiore, A.; Gettelman, A.; Giorgetta, M.A.; et al. Overview of IGAC/SPARC chemistry-climate model initiative (CCMI) community simulations in support of upcoming ozone and climate assessments. SPARC Newslett. 2013, 40, 48–66. [Google Scholar]
  45. Pitari, G.; Di Genova, G.; de Luca, N. A modelling study of the impact of on-road diesel emissions on Arctic black carbon and solar radiation transfer. Atmosphere 2015, 6, 318–340. [Google Scholar] [CrossRef]
  46. Chou, M.-D.; Suarez, M.J.; Liang, X.-Z.; Yan, M.M.-H. A Thermal Infrared Radiation Parameterization for Atmospheric Studies; NASA/TM-2001-104606 19; NASA Goddard Space Flight Center: Greenbelt, MD, USA, 2001.
  47. Pitari, G.; Visioni, D.; Mancini, E.; Cionni, I.; Di Genova, G.; Gandolfi, I. Sulfate aerosols from non-explosive volcanoes: Chemical-radiative effects in the troposphere and lower stratosphere. Atmosphere 2016. [Google Scholar] [CrossRef]
  48. Brunner, D.; Staehelin, J.; Rogers, H.L.; Köhler, M.O.; Pyle, J.A.; Hauglustaine, D.; Jourdain, L.; Berntsen, T.K.; Gauss, M.; Isaksen, I.S.A.; et al. An evaluation of the performance of chemistry transport models. Part 2: Detailed comparison with two selected campaigns. Atmos. Chem. Phys. 2005, 5, 107–129. [Google Scholar] [CrossRef]
  49. Rienecker, M.M.; Suarez, M.J.; Gelaro, R.; Todling, R.; Bacmeister, J.; Liu, E.; Bosilovich, M.G.; Schubert, S.D.; Takacs, L.; Kim, G.-K.; et al. MERRA: NASA’s Modern-Era retrospective analysis for research and applications. J. Clim. 2011, 24, 3624–3648. [Google Scholar] [CrossRef]
  50. Lin, P.; Fu, Q. Changes in various branches of the Brewer Dobson circulation from an ensemble of chemistry climate models. J. Geophys. Res. 2013, 118, 73–84. [Google Scholar] [CrossRef]
  51. Arblaster, J.M.; Gillett, N.P.; Calvo, N.; Forster, P.M.; Polvani, L.M.; Son, S.-W.; Waugh, D.W.; Young, P.J. Stratospheric ozone changes and climate. In Scientific Assessment of Ozone Depletion: 2014; Global Ozone Research and Monitoring Project—Report No. 55; World Meteorological Organization: Geneva, Switzerland, 2014; pp. 1–66. [Google Scholar]
  52. Jones, A.; Walker, K.A.; Jin, J.J.; Taylor, J.R.; Boone, C.D.; Bernath, P.F.; Brohede, S.; Manney, G.L.; McLeod, S.; Hughes, R.; et al. Technical Note: A trace gas climatology derived from the Atmospheric Chemistry Experiment Fourier Transform Spectrometer (ACE-FTS) data set. Atmos. Chem. Phys. 2012, 12, 5207–5220. [Google Scholar] [CrossRef] [Green Version]
  53. Andrews, A.E.; Boering, K.A.; Daube, B.C.; Wofsy, S.C.; Loewenstein, M.; Jost, H.; Podolske, J.R.; Webster, C.R.; Herman, R.L.; Scott, D.C. Mean age of stratospheric air derived from in situ observation of CO2, CH4, and N2O. J. Geophys. Res. 2001, 106, 32295–32314. [Google Scholar] [CrossRef]
  54. Douglass, A.R.; Strahan, S.E.; Oman, L.D.; Stolarski, R.S. Understanding differences in chemistry climate model projections of stratospheric ozone. J. Geophys. Res. Atmos. 2014, 119, 4922–4939. [Google Scholar] [CrossRef]
  55. Urban, J.; Lautié, N.; Le Flochmoën, E.; Jiménez, C.; Eriksson, P.; de La Noë, J.; Dupuy, E.; Ekström, M.; El Amraoui, L.; Frisk, U.; et al. Odin/SMR limb observations of stratospheric trace gases: Level 2 processing of ClO, N2O, HNO3, and O3. J. Geophys. Res. 2005, 110, D14307. [Google Scholar] [CrossRef]
  56. Urban, J.; Pommier, M.; Murtagh, D.P.; Santee, M.L.; Orsolini, Y.J. Nitric acid in the stratosphere based on Odin observations from 2001 to 2007—Part 1: A global climatology. Atmos. Chem. Phys. 2009, 9, 7031–7044. [Google Scholar] [CrossRef] [Green Version]
  57. Grooss, J.-U.; Russell, M., III. Technical note: A stratospheric climatology for O3, H2O, CH4, NOx, HCl and HF derived from HALOE measurements. Atmos. Chem. Phys. 2005, 5, 2797–2807. [Google Scholar] [CrossRef]
  58. Schoeberl, M.R.; Bhartia, P.K.; Hilsenrath, E. Tropical ozone loss following the eruption of Mt. Pinatubo. Geophys. Res. Lett. 1993, 20, 29–32. [Google Scholar] [CrossRef]
  59. Swanson, T.H.; Elkins, J.W.; Butler, J.H.; Montzka, S.A.; Myers, R.C.; Thompson, T.M.; Baring, T.J.; Cummings, S.O.; Dution, G.S.; Hayden, A.H.; et al. Nitrous Oxide and Halocarbons Division; Climate Monitoring and Diagnostic Laboratory No. 21, Summary Report, 1992; Peterson, J.T., Rosson, R.M., Eds.; National Oceanic and Atmospheric Administration Earth System Research Laboratory (NOAA ERL): Boulder, CO, USA, 1993.
  60. McPeters, R.D.; Hollandsworth, S.M.; Flynn, L.E.; Herman, J.R.; Seftor, C.J. Long-term ozone trends derived from the 16-year combined Nimbus 7/Meteor 3 TOMS Version 7 record. Geophys. Res. Lett. 1996, 23, 3699–3702. [Google Scholar] [CrossRef]
  61. World Meteorological Organization (WMO). Scientific Assessment of Ozone Depletion: 1998; Global Ozone Research and Monitoring Project, WMO Report #44; WMO: Geneva, Switzerland, 1999. [Google Scholar]
  62. Pitari, G.; Mancini, E. Short-term climatic impact of the 1991 volcanic eruption of Mt. Pinatubo and effects on atmospheric tracers. Nat. Hazards Earth Syst. Sci. 2002, 2, 91–108. [Google Scholar] [CrossRef]
  63. World Meteorological Organization (WMO). Greenhouse Gas Bulletin (GHG Bulletin) #10—Climate Summit Edition: The State of Greenhouse Gases in the Atmosphere Based on Global Observations through 2013. 2014. Available online: http://library.wmo.int (accessed on 15 March 2016).
  64. Grant, W.B.; Fishman, J.; Browell, E.V.; Brackett, V.G.; Nganga, D.; Minga, A.; Cros, B.; Veiga, R.E.; Butler, C.F.; Fenn, M.A.; et al. Observations of reduced ozone concentrations in the tropical stratosphere after the eruption of Mt. Pinatubo. Geophys. Res. Lett. 1992, 19, 1109–1112. [Google Scholar] [CrossRef]
  65. Dedikov, J.V.; Akopova, G.S.; Gladkaja, N.G.; Piotrovskij, A.S.; Markellov, V.A.; Salichov, S.S.; Kaesler, H.; Ramm, A.; von Blumencron, A.M.; Lelieveld, J. Estimating methane releases from natural gas production and transmission in Russia. Atmos. Environ. 1999, 3, 3291–3299. [Google Scholar] [CrossRef]
Figure 1. (a) Time series of annually averaged values of residual vertical velocity anomalies (VE-REF) in the tropics (mm/s) at 30 hPa (~24.5 km altitude) (1960–2005); (b) as in (a), but for monthly averages of w* (1988–1994), to better highlight the Pinatubo perturbation; and (c) time series of annually and globally averaged temperature changes (K) at 50 hPa (~21 km altitude) (1960–2005). The solid curve is for the model calculated VE-REF anomalies; the dashed curve with diamonds is for the ERA-40 and radiosondes detrended anomalies, i.e., the difference between the actual annually averaged global temperature and the corresponding value obtained from a linear fit of the temperatures between 1960 and 2005 (ERA-interim is used for years 2001–2005). The 1960–2005 temperature trends are: −0.38 K/decade and −0.45 K/decade for model and ERA-40 and radiosondes time series, respectively. The red triangles indicate the timing of the four tropical eruptions considered in this study (see Table 1); that is, Agung, El Chichón, Ruiz and Pinatubo.
Atmosphere 07 00149 g001
Figure 2. (a,b) Residual vertical velocity profiles (VE, REF) in: the tropics (a); and mid-latitudes (b), averaged over June 1991–June 1992 (mm/s); and (c) residual vertical velocity percent changes (VE-REF) averaged in the 50–30 hPa (~21–24.5 km altitude) layer as a function of latitude (June 1991–June 1992).
Atmosphere 07 00149 g002
Figure 3. Evaluation of the ULAQ model residual vertical velocity (w*, mm/s) in the tropical stratosphere (20° S–20° N) (VE simulation), using MERRA reanalysis data [49]: (a) Time series of annually averaged 30 hPa w* values (ULAQ in red and MERRA with black dots) (1979–2005). Dashed lines show a linear fit of the data: the slope is 0.009 mm·s−1·decade−1 for ULAQ and 0.013 mm·s−1·decade−1 for MERRA (dashed black line); (b) As in (a), but for 50 hPa monthly averaged w* values (1990–1999); (c) The 30 hPa mean annual cycle of w*, averaged over 1979–2005; (d) The w* vertical profile (1979–2005). The dashed lines show a ±30% range of variability of the vertical velocity [17], related to seasonal and interannual oscillations.
Atmosphere 07 00149 g003
Figure 4. (a,b) Time series of the equatorial age of air (10°S–10°N) (years) at: 10 hPa (~32 km altitude) (a); and 30 hPa (~24.5 km altitude) (b), for VE and REF experiments, in red and black, respectively; (c,d) As in (a,b), but for the latitudinal age gradient, calculated as the mean age difference between 45° N and the equator. Dashed lines show a linear fit of the calculated age or age gradient. The linear fit is calculated between 1960 and 2005, except in (a), where two different slopes of mid stratospheric age air are highlighted with a linear fit between 1960 and 1986 and a second one between 1986 and 2005.
Atmosphere 07 00149 g004
Figure 5. (a,b) Vertical profiles of mean stratospheric age of air (years) at: the equator (10°S–10°N) (a); and northern mid-latitudes (35°N–55°N) (b), for VE and REF experiments, in red and black, respectively (1991–1992 average, i.e., Pinatubo case); (c): As in (a,b), but for the latitudinal age gradient (45° N–EQT); (d) Mean age of air (years) at 30 hPa as a function of latitude, for VE and REF experiments, in red and black, respectively.
Atmosphere 07 00149 g005
Figure 6. (a) Model calculated zonally and annually averaged age of air (years), for the VE case; contour line increment 0.5 years. (bd) E valuation of the ULAQ-CCM age of air, using observations from Andrews et al. [53] and Engel et al. [30]: 50 hPa (~21 km altitude) and 10 hPa (~32 km altitude) latitudinal sections (b); and vertical profiles (c,d) for the equator and 35°N–50°N latitude, respectively. Dots show mean values, with 1σ variability in the yellow-filled areas [28]. Whiskers show the uncertainty in the measurement-derived mean age of air at 10 hPa; (e) As in panels (c,d), but for the latitudinal gradient (45°N-EQT) of age of air (AoA); (f,g) Bias of the: ULAQ-CCM AoA (f); and latitudinal AoA gradient (g), both with respect to the measurements mean. The yellow-filled areas show the bias interval, considering the range of observations in (c,d).
Atmosphere 07 00149 g006
Figure 7. Evaluation of ULAQ-CCM upwelling and horizontal mixing in the tropical lower stratosphere (10°S–10°N), using N2O and age of air observations: (a) Vertical profile of the ULAQ-CCM N2O mixing ratio bias (ppbv) with respect to Odin/SMR observations [55,56] (2001–2005 time average; VE case, solid black line). The yellow-filled area shows the bias interval, considering the range of variability of SMR measurements (i.e., ±1σ calculated over all months between 2001 and 2005). The red dashed line shows the ULAQ-CCM VE-REF anomaly for the Pinatubo case (June 1991–June 1992). (b) Scatter plot of AoA (years) versus the N2O mixing ratio (ppbv), for the ULAQ-CCM (VE case, red line with open circles) and the age observations median of Figure 6c with N2O SMR observations (black line with asterisks). (c,d) The 50–70 hPa latitudinal section of the: N2O mixing ratio (ppbv) (c); and model-measurements bias (d). The uncertainty bars show the bias interval, considering the range of variability of SMR measurements (i.e., ±1σ, as above).
Atmosphere 07 00149 g007
Figure 8. (a) Latitude dependent CH4 (green) and N2O (blue) horizontal eddy mass flux anomalies VE-REF from the ULAQ-CCM calculations (mass weighted average 50–150 hPa; time average July 1991–June 1992). Units are kg·m−2·year−1; (b,c) The latitude integrated flux anomalies: Southern Hemisphere (SH) from 90° S to 20° S; and Northern Hemisphere (NH) from 20°N to 90°N. The horizontal eddy mass flux anomalies ΔΦH are defined as Δ[v’ρ’CH4] and Δ[v’ρ’N2O], where v is the meridional wind component, ρCH4 and ρN2O are the mass concentrations of CH4 and N2O, respectively, and Δ refers to the difference VE-REF. The square brackets [] denote a zonal average and the prime a deviation from the zonal average.
Atmosphere 07 00149 g008
Figure 9. As in Figure 7, but for tropical CH4 (10°S–10°N) and age of air observations: (a) Vertical profile of the ULAQ-CCM CH4 mixing ratio bias (ppmv) with respect to HALOE observations [57] (1991–2005 time average; VE case, solid black line). The yellow-filled area shows the bias interval, considering the range of variability of HALOE measurements (i.e., ±1σ calculated over all months between 1991 and 2005). The red dashed line shows the ULAQ-CCM VE-REF anomaly for the Pinatubo case (June 1991–June 1992); (b) Scatter plot of AoA (years) versus the CH4 mixing ratio (ppmv), for the ULAQ-CCM (VE case, red line with open circles) and the age observations median of Figure 6c with CH4 HALOE observations (black line with asterisks); (c,d) The 50–70 hPa latitudinal section of the: CH4 mixing ratio (ppbv) (c); and model-measurements bias (d). The uncertainty bars show the bias interval, considering the range of variability of HALOE measurements (i.e., ±1σ, as above).
Atmosphere 07 00149 g009
Figure 10. Vertical profiles of VE-REF anomalies of: CH4 (a,b); and N2O (c,d), averaged over July 1991–June 1992 (ppbv). (a,c) Tropical anomalies (average 25°S–25°N); and (c,d) extra-tropical anomalies (average 90°S–25°S and 25°N–90°N).
Atmosphere 07 00149 g010
Figure 11. (a) Time series of the model calculated tropical CH4 mixing ratios (25°S–25°N) at 30 hPa (ppbv), for REF and VE cases (black and red lines, respectively); and (b) time series of the globally averaged surface stations observed CH4 growth rate (blue line; ppbv/year) [63]; superimposed is the time series of the CH4 growth rate at the extratropical tropopause (average 90°S–25°S and 25°N–90°N; 150–250 hPa), for REF and VE cases (black and red lines, respectively). (c,d) As in panels (a,b), but for N2O. Volume mixing ratios for both CH4 and N2O are smoothed with respect to seasonal variations in order to derive long term trends. The long term trends are then time-differentiated to compute growth rates.
Atmosphere 07 00149 g011
Figure 12. (a) Volcanic aerosol induced perturbation on O2 photolysis during October 1991 (percent) (20°S–20°N); and (b): O3 concentration changes at the equator (VE, REF, OBS), during October–November 1991 with respect to April–May–June 1991. Observations are from ozone sounding at Brazzaville, Congo [64]. Calculated column ozone changes are −20 DU from the observed profiles and −23 DU in the aerosol radiative-interactive case VE, to be compared with −10 DU in the REF case without the aerosol radiative perturbations.
Atmosphere 07 00149 g012
Table 1. Major volcanic eruptions considered in the present study, with the adopted amounts of the injected SO2 and indication of the QBO E/W shear at the eruption time and following months. The vertical layer of SO2 injection is assumed between 90 and 40 hPa (~16–22 km altitude), with a peak at 60 hPa (~18 km altitude).
EruptionTimeTg-SO2QBO E/W Shear
Agung (8°S,11°E)16 May 196312W
St. Helens (46°N,122°W)18 May 19802.1W
El Chichón (17°N,93°W)4 April 19827W
Nevado del Ruiz (5°N,75°W)13 November 19851.2E
Pinatubo (15°N,120°E)16 June 199120E

