1. Introduction
Air travel, both civilian and military, have been growing rapidly, and will keep increasing in the next decades [
1].
Various studies have shown that air quality near airports can be impaired by the emission of airborne particulate matter (PM) from the aircrafts [
2] and the ground support vehicles, which might have a potential impact on the environment and the health of people living near or working at the airports [
3].
Health effects associated with PM exposure include respiratory and cardiopulmonary effects, increased hospitalization rates, and increased mortality rates from all causes and from lung cancer specifically [
4,
5]. In 2013, the International Agency for Research on Cancer classified diesel engine exhaust, a major source of PM, as a Group 1 human carcinogen [
6].
Ultrafine Particles (UFPs, number based diameter <= 100 nm) are considered to cause adverse health effects [
7], which might be diverse, more severe and frequent than those generated by larger particles, because of their increased surface area per unit mass, and their ability to penetrate cells [
8,
9].
Previous studies have tried to clarify what aircraft activities would contribute to UFP emission, by measuring emissions next to a grounded aircraft standing still with engines running at different thrust levels [
10,
11], or in a controlled cycle [
12,
13].
However, aircraft operations may differ from a standard cycle, depending on the piloting techniques, flight traffic, and airport layout. In particular, the major factors that affect the total particulate emissions from each aircraft are the engine type, the time spent at each landing-take off (LTO) engine state, which is in turn related to flight at any airport, number of passengers and airport schedule, and its mechanical history [
14].
While those studies have detected UFPs in aircraft emissions [
14,
15], their results have not identified their relationship with the operating conditions and with exposure of resident populations living nearby to airports. Indeed, other variables may influence the airborne UFP formation, coagulation, growth, and dispersion at the exit from the aircraft engine, including meteorological conditions such as wind speed and direction, and humidity.
A second set of studies was addressed to evaluate airborne UFP concentration in airports and in the surrounding urban areas [
16,
17], with only a few capable of quantifying the contribution of aviation sources related to other local and regional sources. The main difficulty in these studies was the occurrence of numerous other sources emitting similar fuel combustion products around the airports.
Furthermore, characterization was complicated by the fact that an aircraft is a point source that moves rapidly in a three-dimensional area, and only for a short time on the ground; another problem was related to the flight activities and the prevailing wind direction in the examined sites.
Recently, two studies that reported high airborne UFP concentrations in communities downwind of Los Angeles International Airport (LAX) and Santa Monica Airport (SMA, California) [
18,
19,
20,
21] demonstrated a significant contribution by the aircraft activities on departure on the UFP concentrations in close proximity to departure runways, with evidence of rapid plume evolution in the near fields.
Another study, conducted in an aviation base [
22], showed the relationship between several main short-term peaks on UFP concentration during pre-flight operations, take-offs, and landings of jet engine aircrafts.
The object of this study is to estimate the contribution of aircraft activity emissions on the concentration of UFPs in areas nearby and inside one military airport. The sampling sites, outside the airport, were located in kindergarten courtyards, as children are most susceptible to airborne particle exposure [
23], but the acquired data can provide useful information for the assessment of the impact on local air quality, and can be used to support a correct risk perception by the population.
2. Experiments
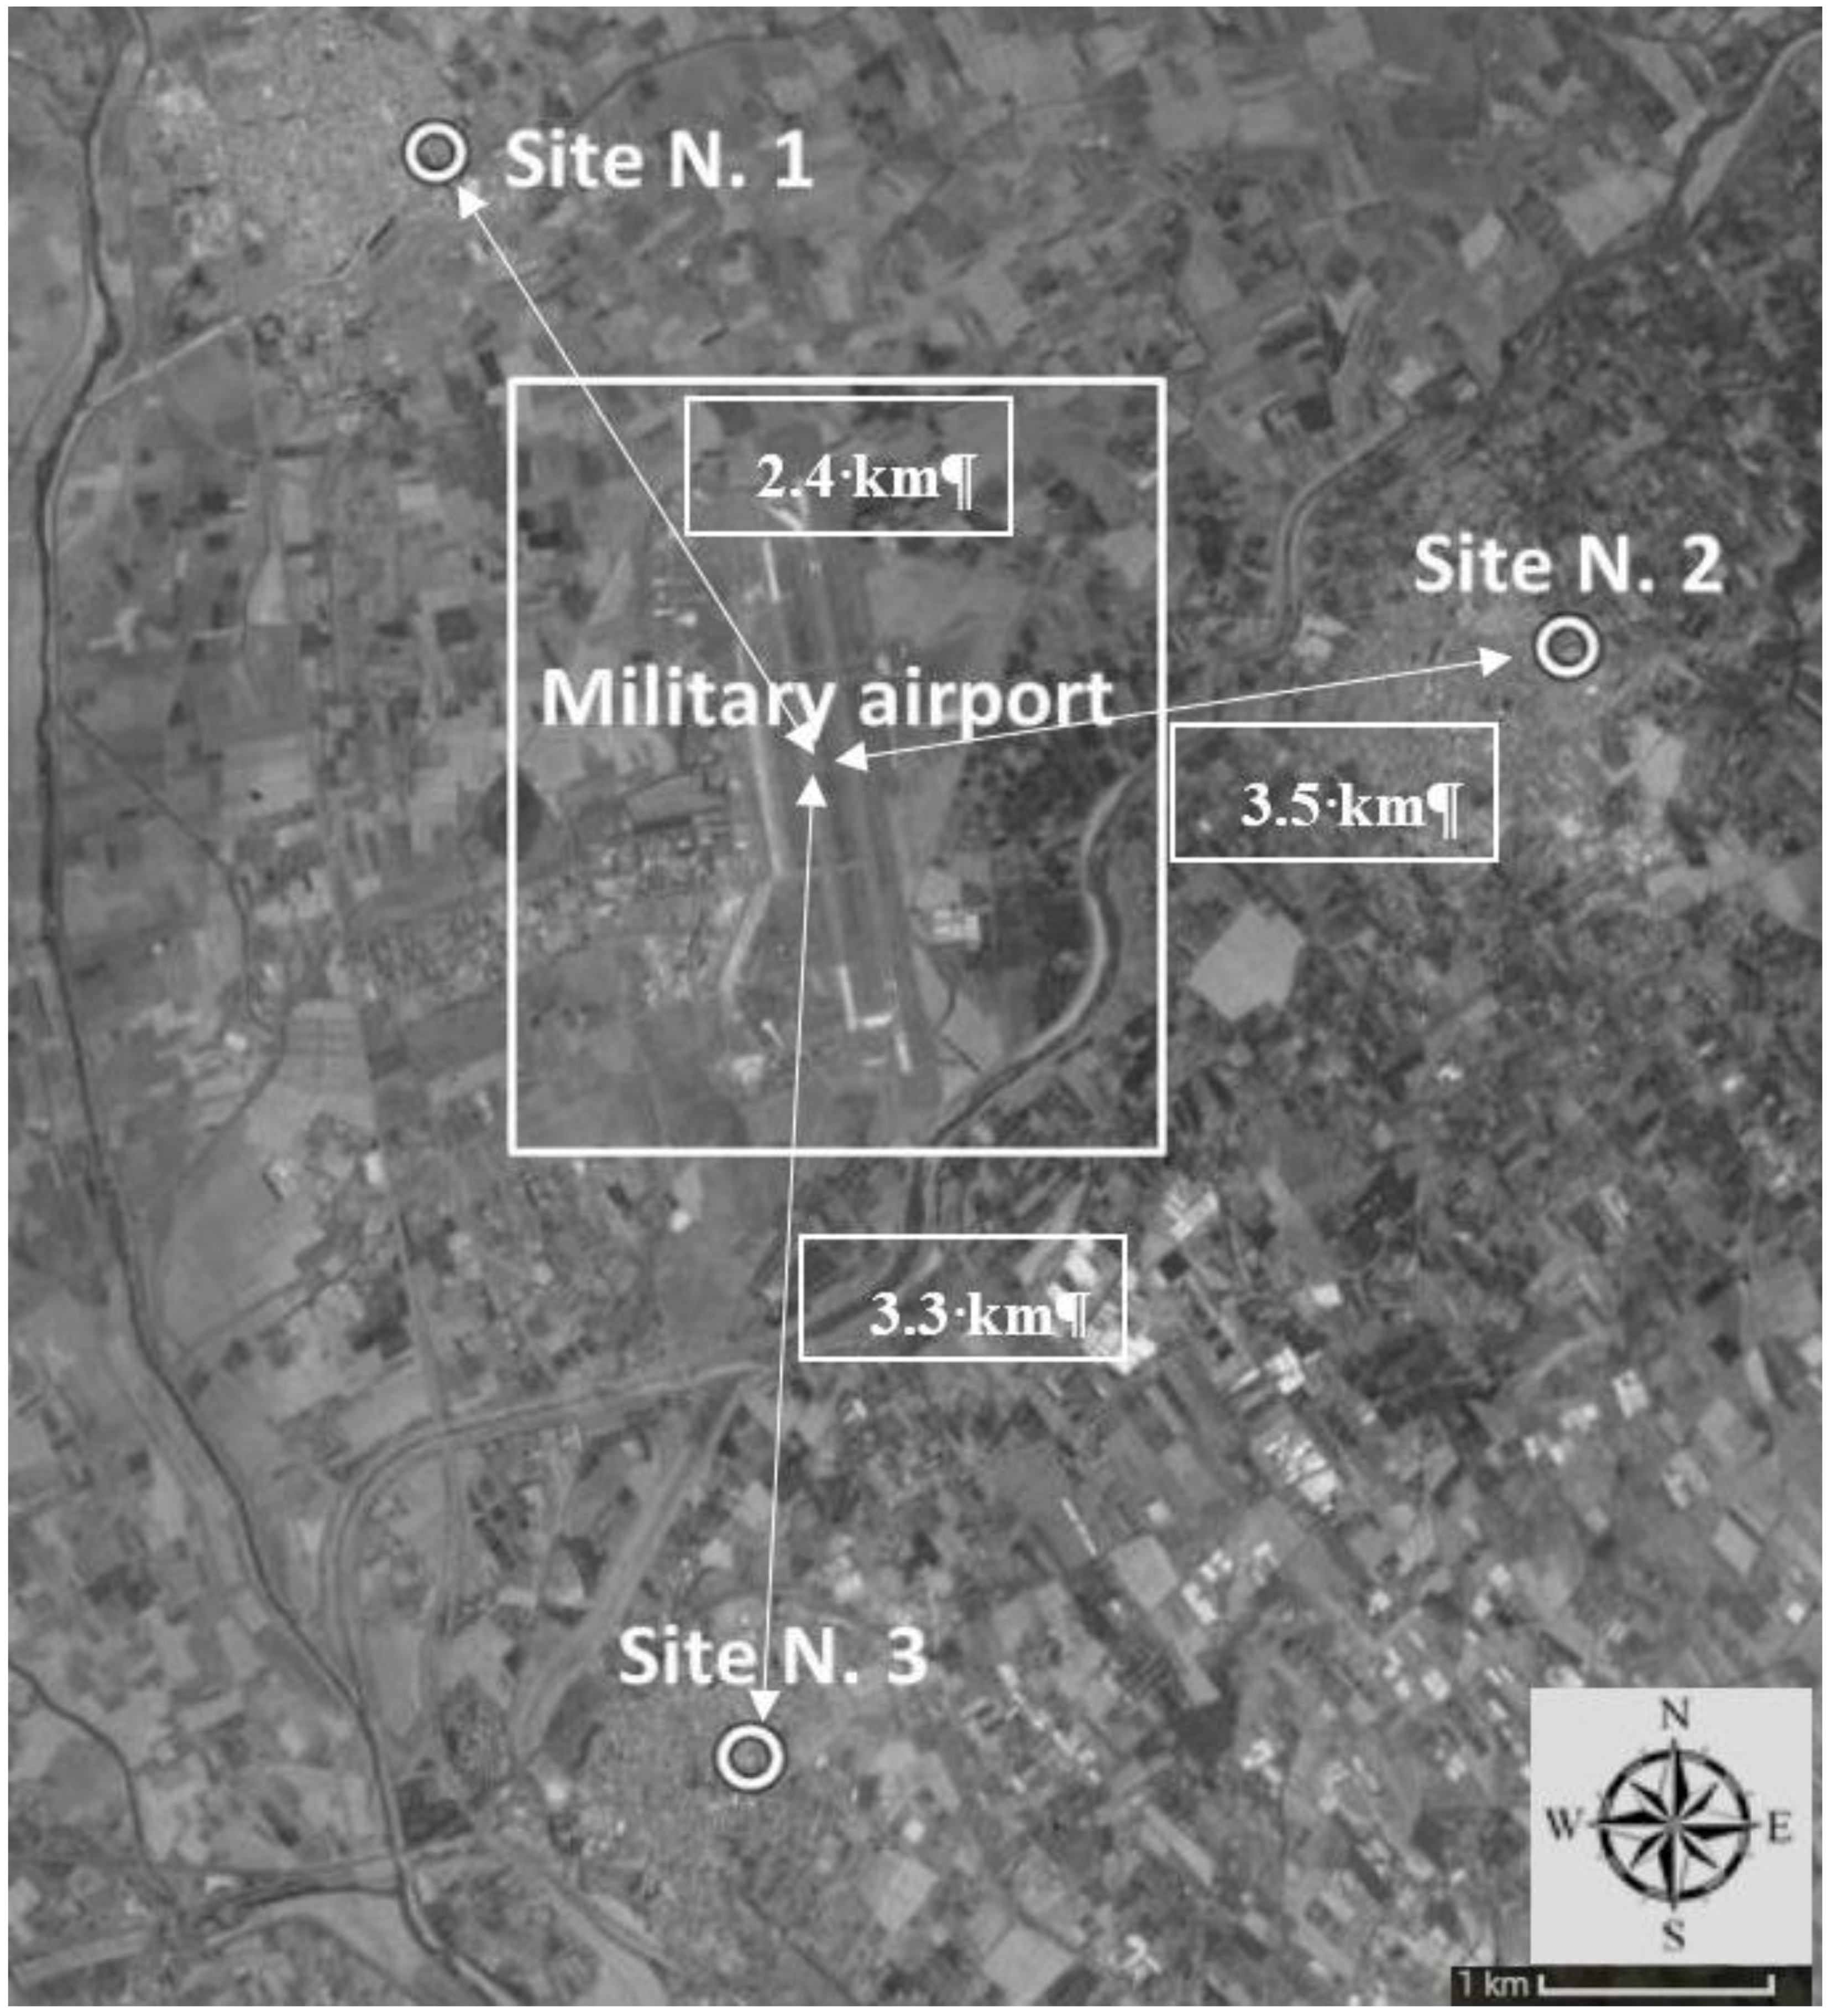
In this paper, we present results of 12 outdoor air samplings carried out in three different sites at different times, between January and June 2014. The three sampling sites (
Figure 1) were located in the courtyard of kindergarten schools at distance of 2.4 km (Site N. 1), 3.5 km (Site N. 2), and 3.3 km (Site N. 3) from the center of the runway of a military airport.
Because of the impossibility of carrying out multiple samplings at the same time, the measurements were repeated four days in each site: two during wintertime and two during springtime. Each sampling lasted no less than 4 hours. The courtyards of kindergarten schools were chosen as representative of areas attended by susceptible people (children). In particular, the sampling instrument was placed at least 15 meters from the road and at least 15 meters from other possible emission sources (e.g., the school kitchen).
In order to match aircraft activities with the UFP concentration in specific areas, flight operations and aircraft passages above the sampling sites were recorded for each sampling, along with exact hour and meteorological data, including temperature (min and max), average wind speed, wind direction, and relative humidity. No pre-flight data were available, which are reportedly responsible for a significant amount of UFP emissions [
2].
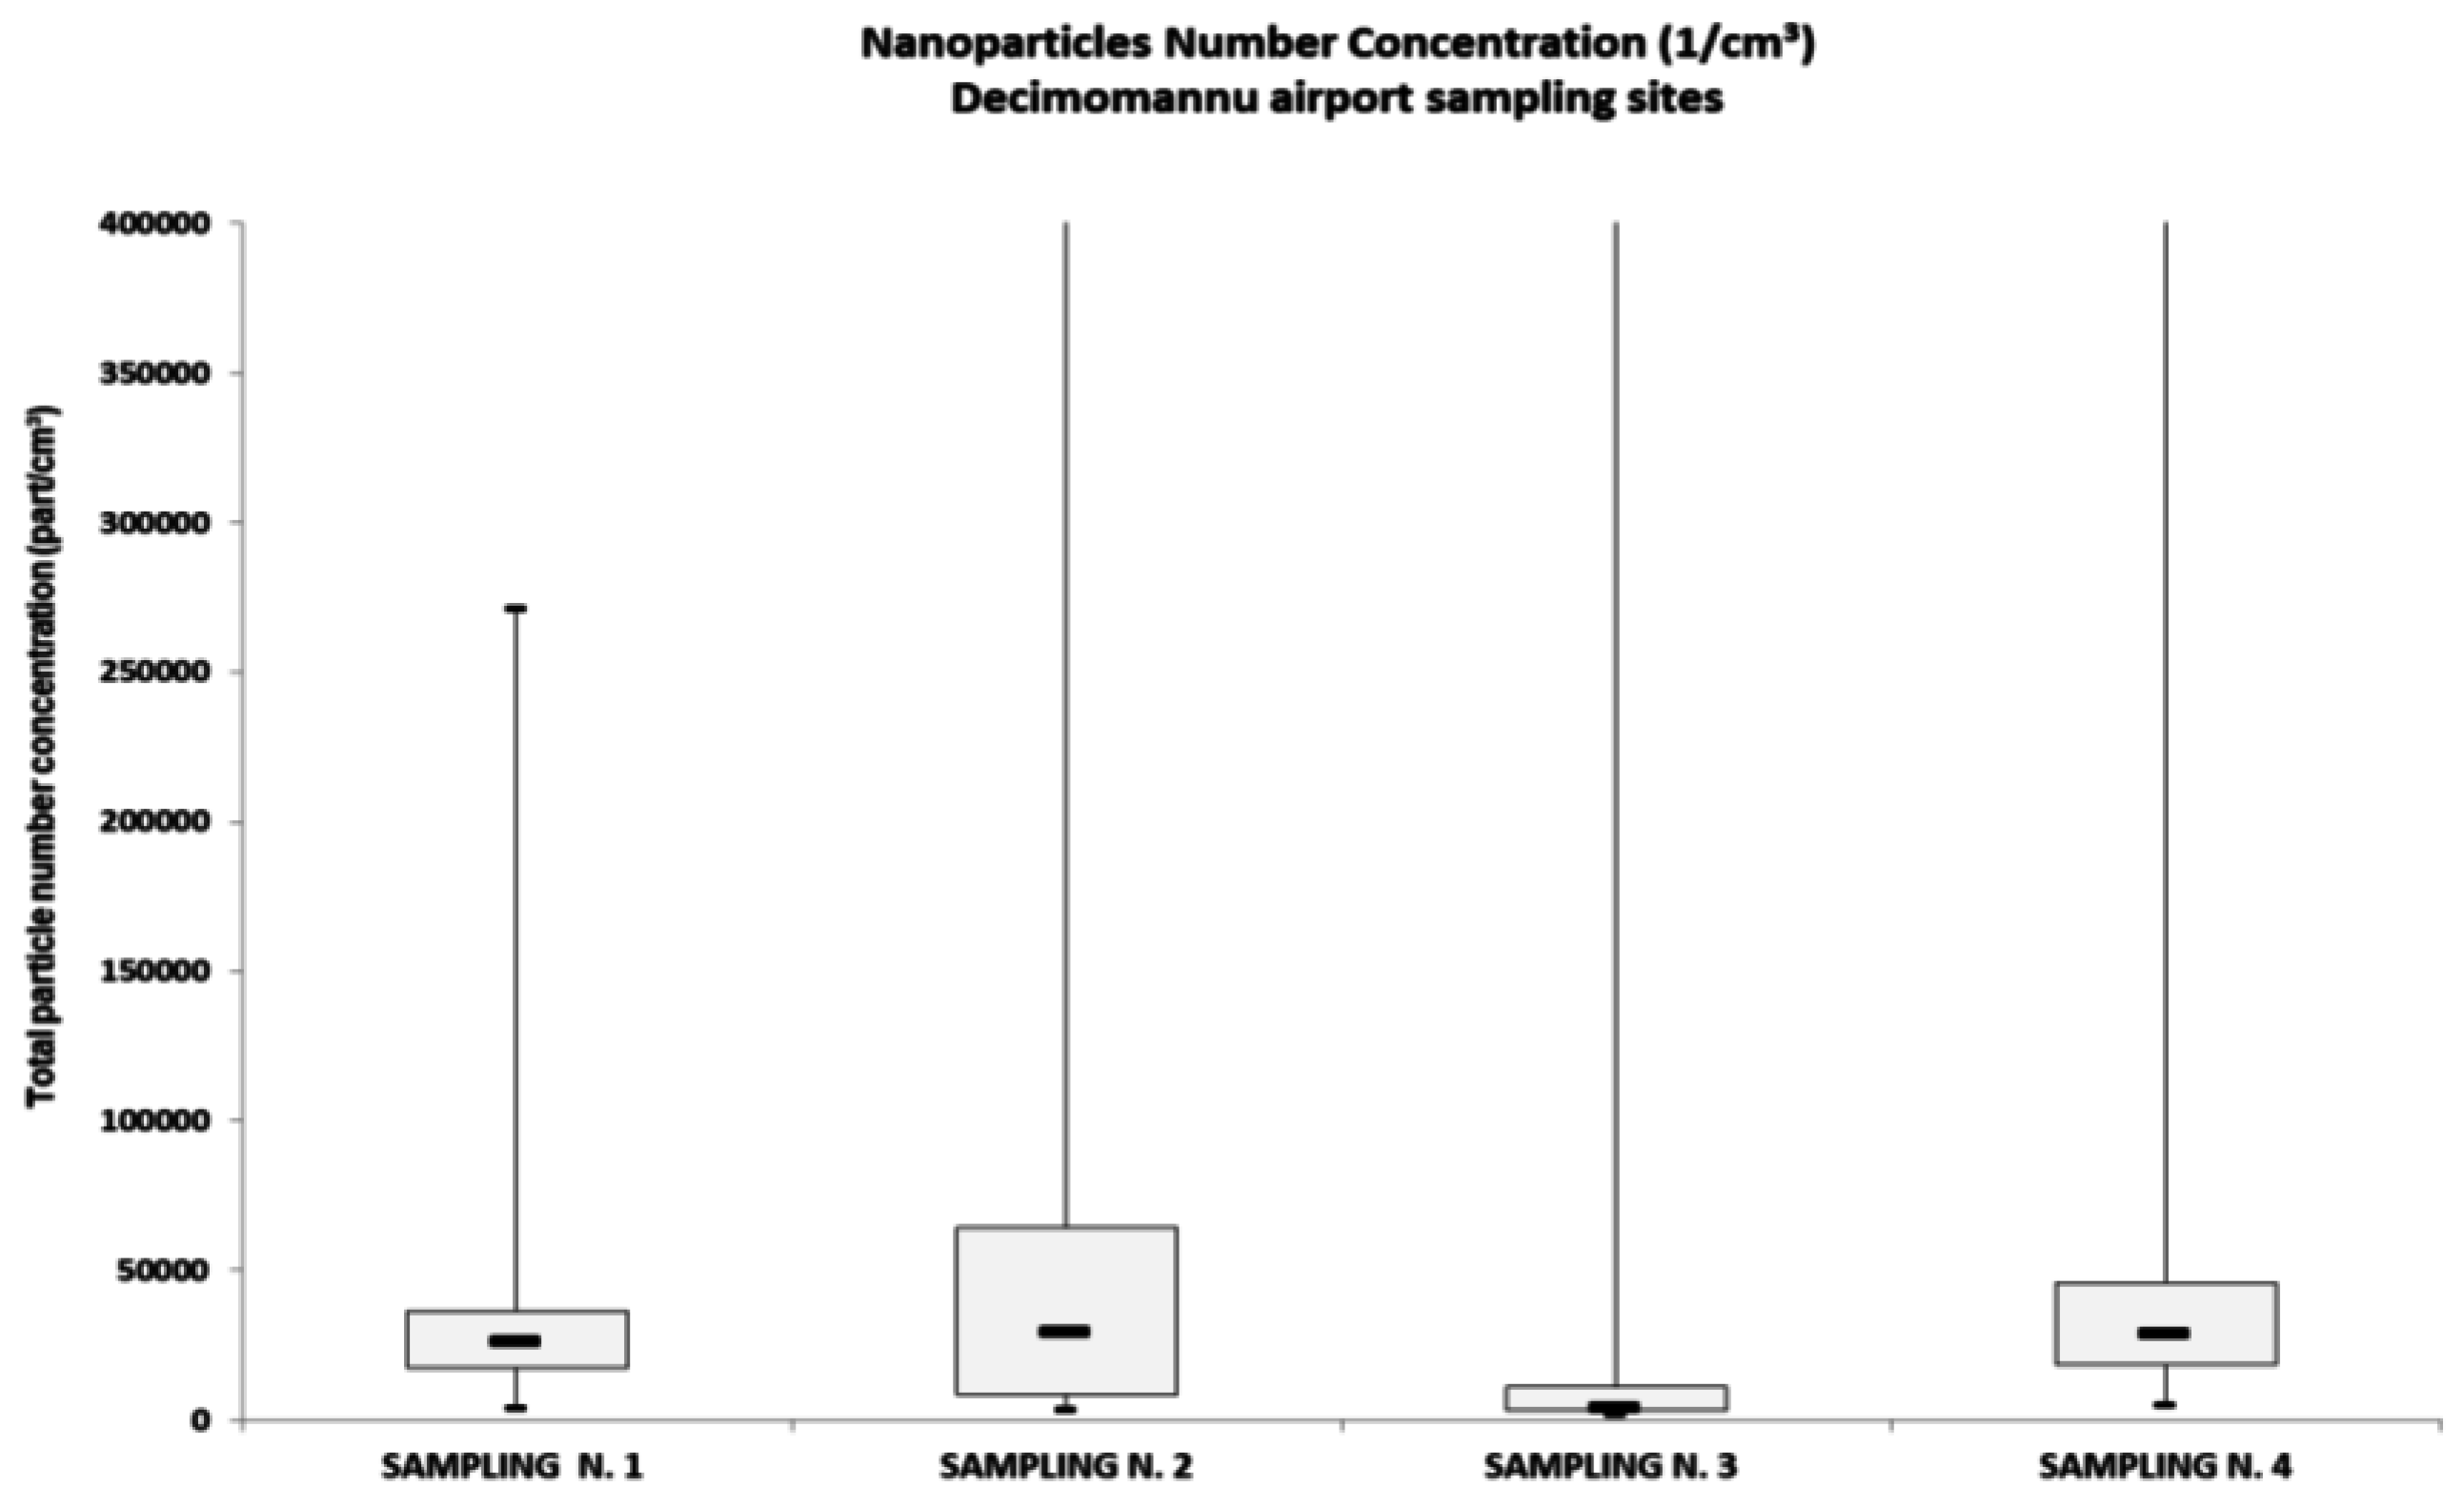
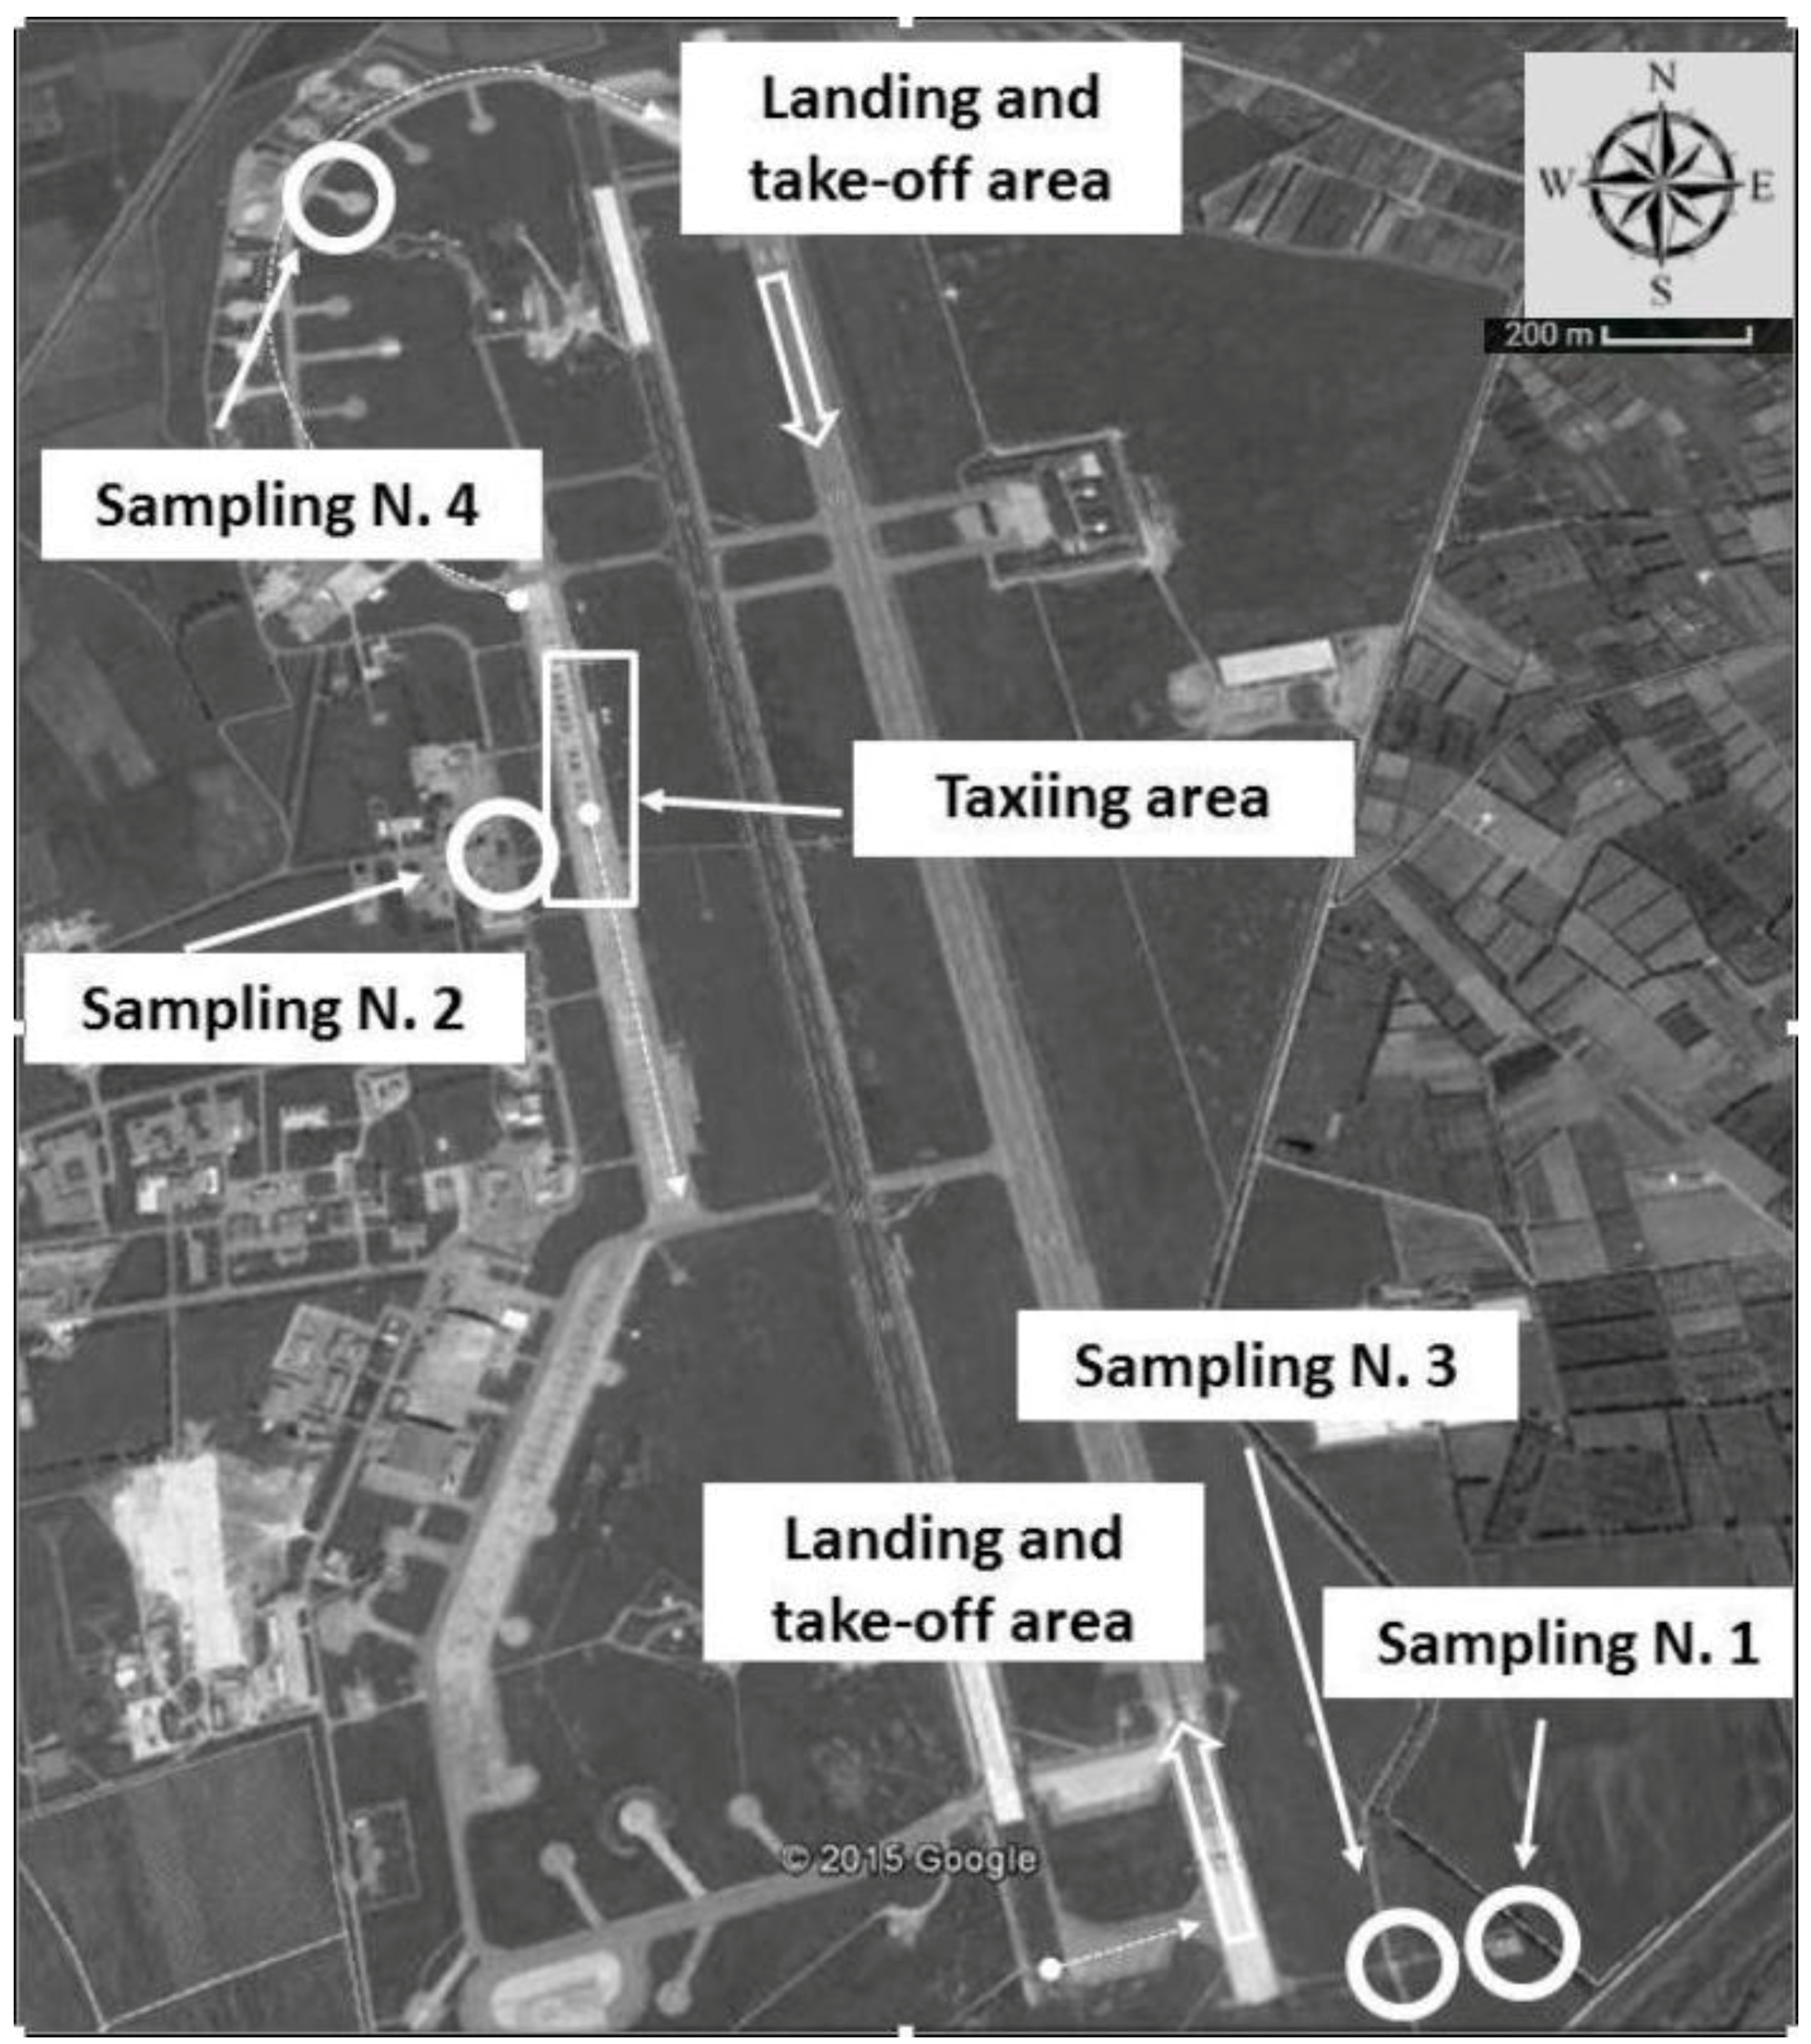
In order to inquire into the role of the flying activity inside the airport, we carried out four outdoor air samplings (
Figure 2), by means of Electrical Low Pressure Impactor (ELPI), inside the military airport during flight activity of some specific military aircrafts (Tornado Fighter):
at a distance of 300 meters from the take-off area, situated to the south of the runway, and 250 meters from the taxiway (sampling N. 1);
at a distance of 1400 meters from the take-off area and 100 meters from the taxiway (sampling N. 2);
at a distance of 150 meters from the take-off area, situated to the south of the runway, and 100 meters from taxiway (sampling N. 3);
outside the helicopter hangar at a distance of 600 meters from the take-off area, situated to the north of the runway, and 30 meters from taxiway (sampling N. 4).
All the sampling sites inside the military airport were chosen in order to have a downwind position from the emitting sources, depending on the operational needs of the aircraft activities.
These measurements were conducted in September 2014 and February 2015.
As for the measurements outside the airport, exact timing, meteorological conditions, and aircraft activities were recorded. Each sampling lasted no less than 3 hours.
Additionally, in March–June 2014 we carried out five outdoor air samplings in the courtyard of a kindergarten in an urban area with high traffic density, and one outdoor air sampling in the courtyard of a school in a rural area, to serve as background environmental conditions.
A summary of measurement times and meteorological data of all sampling sites are reported in
Table 1 (nearby airport, urban, and rural area) and
Table 2 (inside the airport). In
Table 2 the measurement site is defined with respect to the runway.
The monitoring program was carried out with ELPI+™ (Dekati, Tampere, Finland). A detailed description of the ELPI+™ function and its functioning has been published [
24]. The ELPI+™ is connected to a vacuum pump with a flow rate of 0.6 m³/h and a pressure of 40 mbar measured at the final stage of the impactor. Particle size distribution and concentration are measured in the size range between 6 nm–10 μm, with a 10 Hz sampling rate. In this study, we focused on particles ranging between 6 nm and 94 nm in size, divided into four classes of geometric mean aerodynamic diameter (Di) of 10, 22, 39, and 72 nm, which correspond to the first, second, third, and fourth size fraction, respectively.
During selected samplings, particles in the second, third, and fourth size fractions were collected on the aluminum foil substrates to be subsequently analyzed by Field Emission Scanning Electron Microscopy (FESEM SUPRA™ 35 with GEMINI column technology, Carl Zeiss, Oberkochen, Germany). For technical reasons this procedure was not possible for particles in the first size fraction (Di 10 nm).
3. Results
3.1. Outdoor Air Sampling Nearby the Airport
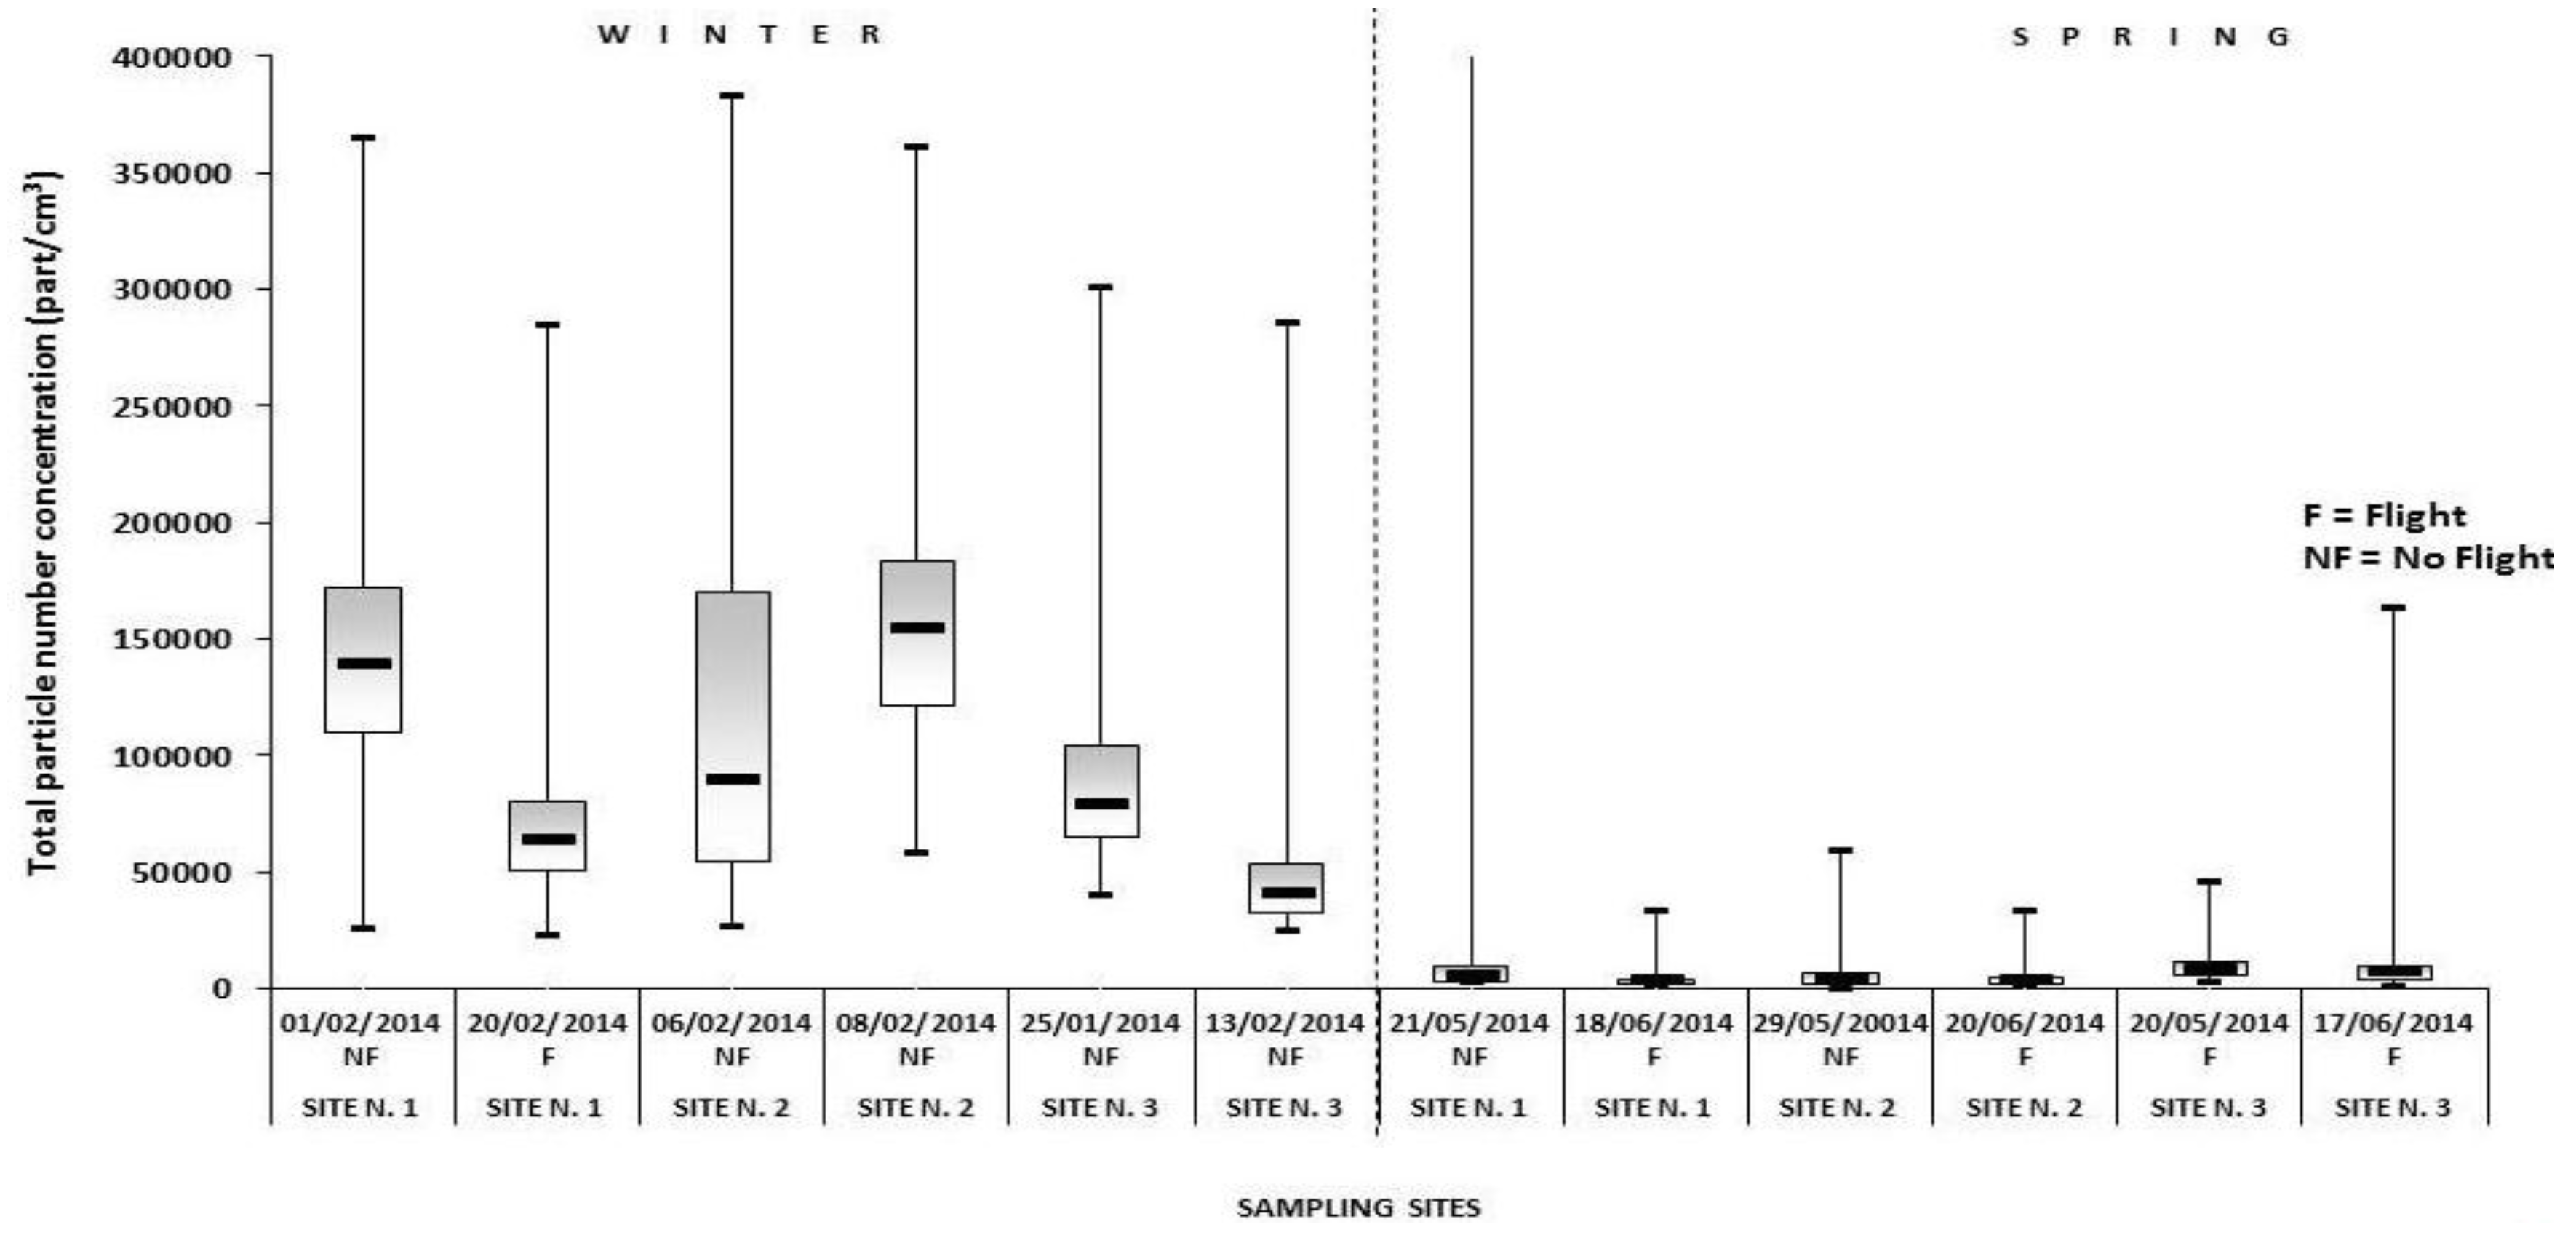
Figure 3 shows UFP counts (number of particles/cm³) in the courtyard of three kindergartens nearby the military airport during wintertime and springtime samplings; whether any flight activity occurred during the sampling is indicated in the subheading of each column.
In springtime, results did not vary by flight activity. Values were comprised within a limited range, with UFP median counts between 3.2 × 10
3–8.8 × 10
3 part/cm
3 (max 1.3 × 10
6 part/cm
3), and increased in winter conditions, in which median values between 4.1 × 10
4–1.5 × 10
5 part/cm
3 (max 3.8 × 10
5 part/cm
3) were detected. Still, no change was observed in relation to the flight activities. The maximum value, detected on 21 May 2014, is not shown in
Figure 3, since the Y scale was limited to 4.0 × 10
5 part/cm
3 to make the chart readable.
3.2. Air Sampling Inside the Airport
The sampling sites inside the military airport were located downwind to the take-off and taxiing area. The median UFP count ranged 3.7 × 10
3–2.9 × 10
4 particles/cm
3 across the sampling sites, with a highest UFP count of 4.0 × 10
6 particles/cm
3 at the sampling site N. 4.
Figure 4 shows the graphs of the samplings inside the military airport.
The highest UFP count was measured near the helicopter hangar, 30 meters from the taxiway on the north part of the runway, during the taxi and take-off activities. In sampling site N. 4, helicopter engines were tested nearby the sampling site, which contributed to the emission from aircraft activities in the last fraction of the sampling period. In
Figure 4 (as for
Figure 3), the maximum values are not shown as the Y scale was limited to 4.0 × 10
5 part/cm3 to make the chart more readable.
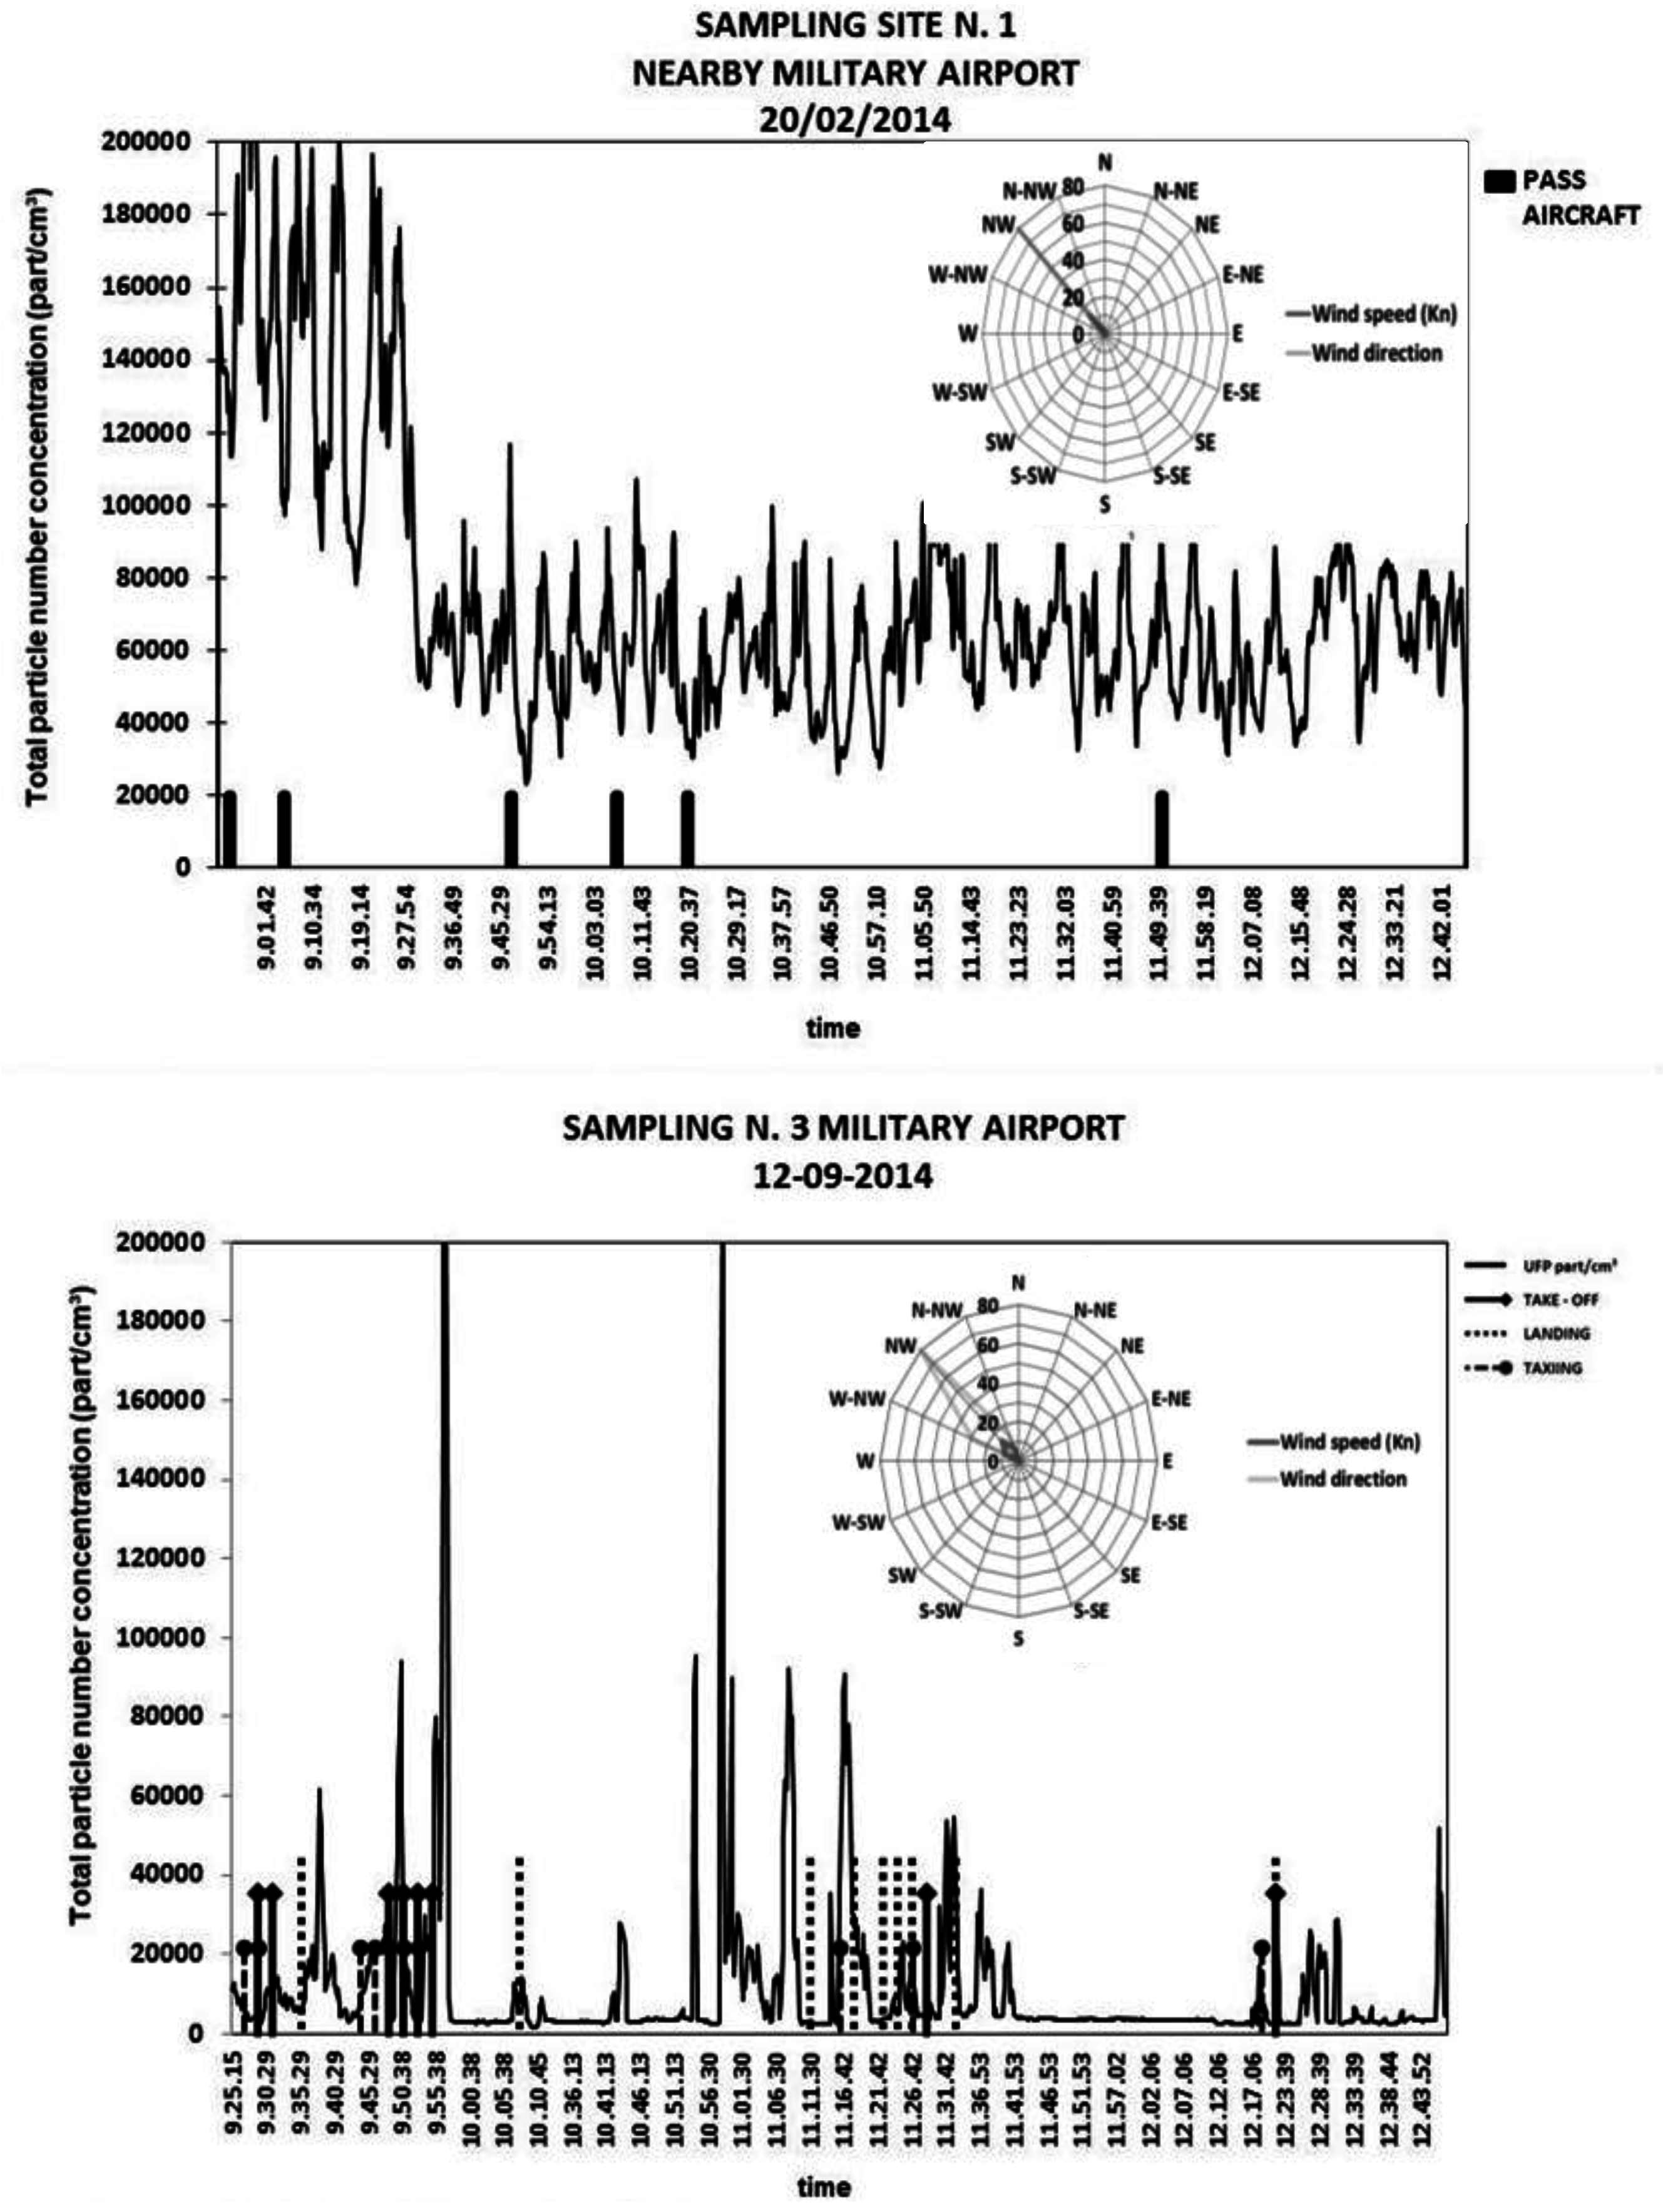
Figure 5 shows, as an example, UFP counts at the sampling sites N. 1 and N. 3 located about 2400 m upwind from the main airport building, the first outside its fences about 150 meters from the take-off area, and the second inside the fences and 100 meters from the taxiway. The overflying aircraft, landings, take-off, and taxi times are highlighted with vertical lines in the graph. The spider chart indicates the prevailing wind direction during sampling. The UFP count at the sampling site N. 1 does not vary with the flight activities (passage of the aircraft above the sampling site). On the contrary, the UFP count at sampling site N. 3 increases with flight activity.
3.3. Air Samplings in Urban and Rural Areas
In the urban area, UFP values were higher than the rural area. In particular, in the urban area (five samplings) median values between 1.6 × 10⁴ – 3.9 × 10⁴ part/cm3 (max 9.2 × 10⁵ part/cm3) were detected, while in the rural area (one sampling) the median UFP count was 7.5 × 10³ part/cm3 (max 1.5 × 10⁴ part/cm3).
3.4. Morphology of Ultrafine Particles
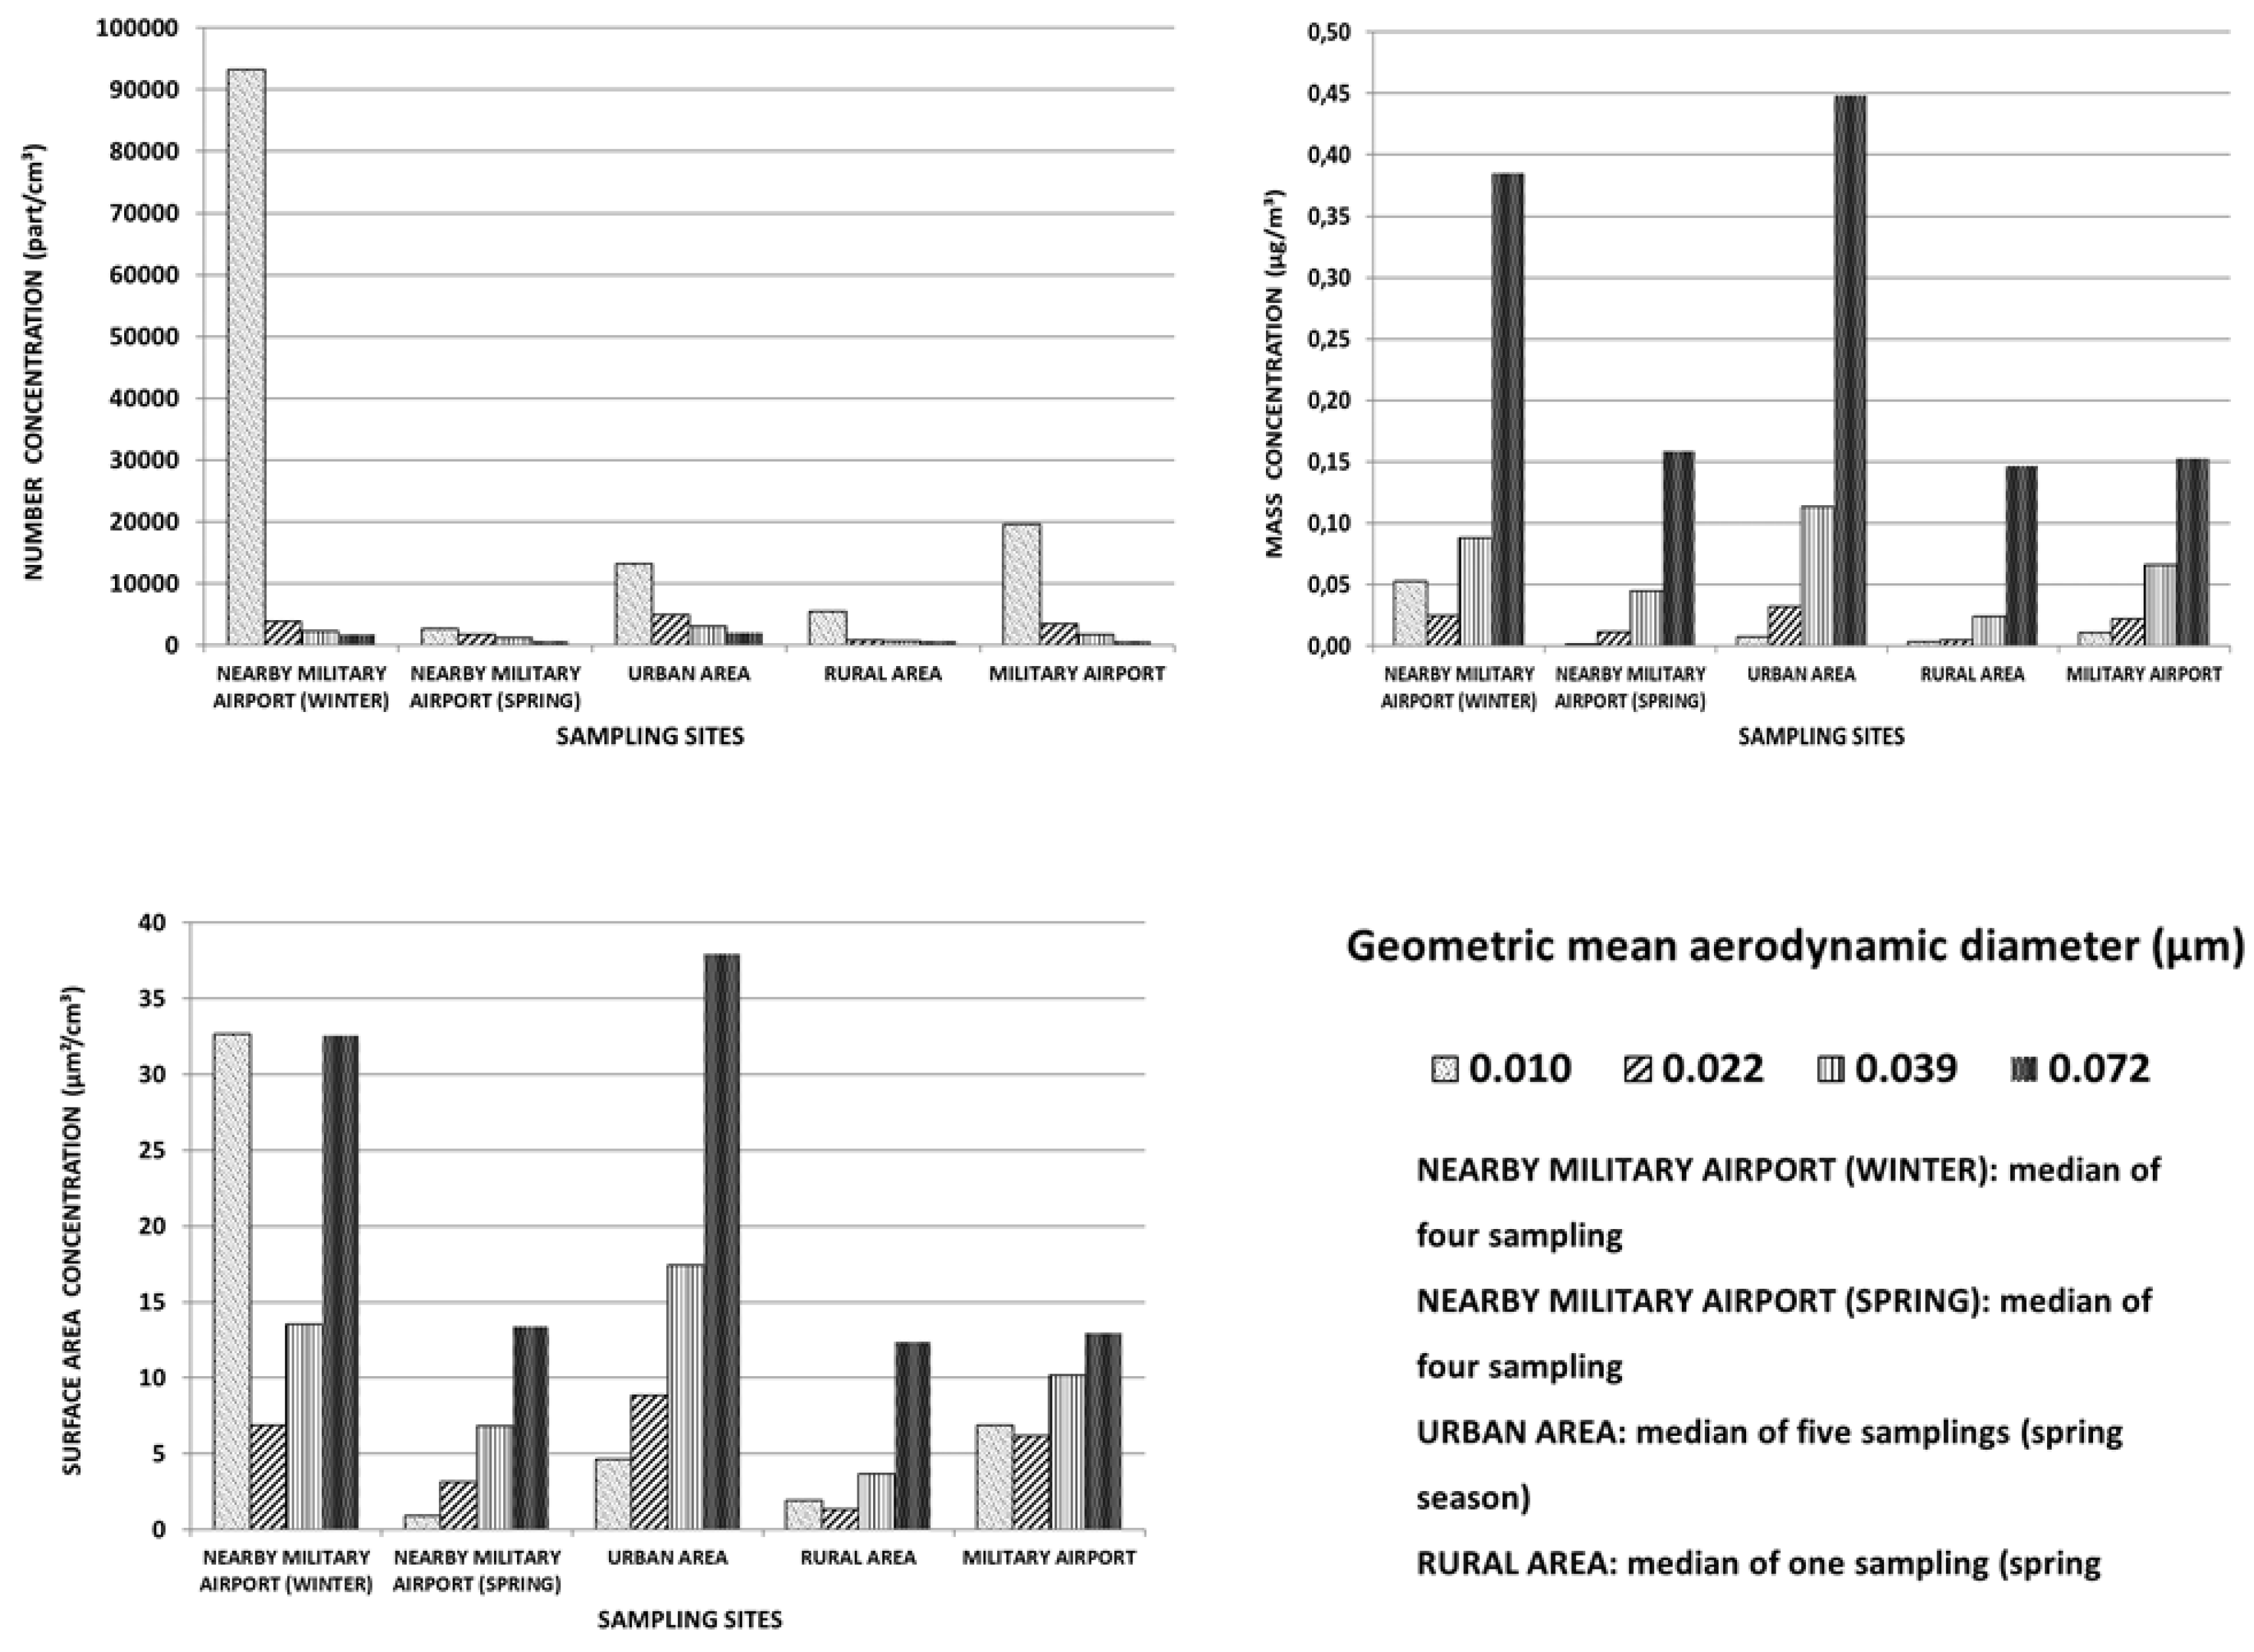
Figure 6 shows the distribution in UFP number, mass, and surface area by location of the sampling sites, whether inside the military airport, the nearby area, the urban, or the rural area. The bar chart shows the median of the four particle size fractions (10, 22, 39, and 72 nm).
In all the locations, the count distribution shows a mode in the nucleation range equal to 10 nm, although with different concentrations by location. However, in the urban area and nearby the military airport winter samplings, particles of the 22, 39, and 72 nm size fraction are more represented, particularly in the UFP mass distribution. The mass distribution shows a mode at the 72 nm size fraction in all the areas. In the winter samplings nearby the military airport the mass distribution shows a peak also at the 10 nm size fraction. The surface area distribution of winter samplings nearby the military airport is bimodal, with the greatest contribution provided by the 10 nm size fraction, followed by the 72 nm size fraction. The larger size fraction prevails in the other locations, with the finest fraction more represented in the military airport.
Figure 7 shows an example of the morphology of particles collected during the sampling in the kindergarten courtyards in the urban area.
The morphology of deposited particles seems to vary, in form of single spherical primary particles <94 nm and irregular aggregates/agglomerates of particles. We did not find differences in morphology among the sampling sites.
4. Discussion
In our study, the median winter UFP count in the outdoor air samplings nearby the military airport was higher than the spring median values in all sampling sites. Such findings suggest a role of domestic heating with fireplaces and pellet stoves, particularly widespread in those communities, which are considered to be a relevant contributor to airborne particulate matter [
25]. Moreover, atmospheric stability plays the most important role in the transport and dispersion of air pollutants. In the case-study considered, winter represents the most stable season and spring the most unstable, as shown in
Table 2 in regards to the direction and speed of winds
Springtime UFP counts at the three sampling sites nearby the military airport were similar to those detected in a rural area, and did not vary with the flight activities. In this area, UFP counts in a no flight day were approximately twice as high as those detected during the passage of aircrafts.
Consistently with our observation, elevated UFP counts were observed 660 m downwind at Santa Monica, CA Airport, and background levels were observed 830 m downwind to the civil airport. It is worth highlighting that the Santa Monica airport study was conducted in an urban area nearby a civil airport, where aircraft size and flight activities are much larger than in our study area [
20].
The measurements carried out inside the military airport show the UFP count increases with flight activity.
The highest UFP count was measured at the sampling sites nearest to the taxiway, at a distance of 100 and 30 meters, respectively, which suggests a correlation between UFP count and distance from the source, which is consistent with other reports [
18,
19].
In all four sampling sites, following the emission peak, we observed a fast decrease of the UFP count to the previous background levels. During all the samplings, we observed several peaks that were apparently non-correlated to flight activities near the sampling sites; this might be due to the ground activities (idling and taxiing operation, ground vehicles emissions) inside the military base.
While peaks levels were higher 150 m from runway in respect to 300 meters, the median UFP count comparison was reversed. This might be due to the meteorological conditions variability (wind speed and wind direction) between the two sampling sites.
The values we detected in an urban area appear to be similar to those reported in other studies [
26].
5. Conclusions
Our results do not show a correlation between military flight activities and the UFP counts in the residential areas nearby a military airport. Nonetheless, the measurements carried out inside the airport during flying activities showed an increase in the UFP count, with a tendency to decrease with distance from the emission source, which confirms that distance from the source is an important factor. On the other hand, the UFP count during flight activities at the military airport was comparable to that measured in the urban area, with a prevalence of the smallest 10 nm size fraction number and surface area in the airport and of the largest 72 nm mass and surface area in the urban area.
Limitations of the study include a limited sampling time (4 hours per day on average, instead of the whole day), the extreme variability of the phenomenon we investigated, the impossibility of carrying out multiple samplings at the same time, and the execution of outdoor samplings only.
The ELPI+ impact collector successfully identified the particle size distribution and allowed for the collection of separate samples to be analyzed chemically and morphologically by Energy-Dispersive X-Ray Spectroscopy (EDS).
Further investigation is warranted to assess and characterize the impact of the UFP emission sources and to assess indoor UFP levels, in order to more effectively estimate exposure at the population level and to promote correct risk perception and management.
Acknowledgments
We thank Col. Manuele Bernabei and Valentina Brusadin from the Chemical Unit of the Centro Sperimentale di Volo of Pratica di Mare (Rome) for the SEM analysis.
Author Contributions
Marcello Campagna contributed to design of the study, analysis, and interpretation of data. Andrea Frattolillo and Costantino Carlo Mastino contributed to the interpretation of data and a critical revision. Sergio Pili and Gabriele Marcias contributed to the provision, collection, and assembly of study data, and the analysis and interpretation of data. Natalia Angius contributed to the provision, collection, and assembly of study data. Pierluigi Cocco and Giorgio Buonanno contributed to a critical revision and final approval of the study.
Conflicts of Interest
Marcello Campagna is Occupational Physician for the Italian Ministry of Defence at the Reparto Sperimentale Standardizzazione al Tiro Aereo of Decimomannu and at the Poligono Sperimentale e di Addestramento Interforze di Salto di Quirra.
References
- OECD. The Impacts of Globalisation on International Air Transport Activity. Available online: http://www.oecd.org/greengrowth/greening-transport/41373470.pdf (accessed on 16 July 2016).
- Mazaheri, M.; Johnson, G.R.; Morawska, L. Particle and gaseous emissions from commercial aircraft at each stage of the landing and takeoff cycle. Environ. Sci. Technol. 2009, 43, 441–446. [Google Scholar] [CrossRef] [PubMed]
- Cattani, G.; Di Menno di Bucchianico, A.; Gaeta, A.; Romani, D.; Fontana, L.; Iavicoli, I. Airports and air quality: A critical synthesis of the literature. Epidemiol. Prev. 2014, 38, 254–261. [Google Scholar] [PubMed]
- Boldo, E.; Medina, S.; LeTertre, A.; Hurley, F.; Mucke, H.G.; Ballester, F.; Aguilera, I.; Eilstein, D. Apheis: Health impact assessment of long-term exposure to PM2.5 in 23 European cities. Eur. J. Epidemiol. 2006, 21, 449–458. [Google Scholar] [CrossRef] [PubMed]
- Buonanno, G.; Giovinco, G.; Morawska, L.; Stabile, L. Lung cancer risk of airborne particles for Italian population. Environ. Res. 2015, 142, 443–451. [Google Scholar] [CrossRef] [PubMed]
- International Agency for Research on Cancer. Available online: http://monographs.iarc.fr/ENG/Monographs/vol109/mono109.pdf (accessed on 30 August 2016).
- Pedata, P.; Garzillo, E.M.; Sannolo, N. Ultrafine particles and effects on the body: Review of the literature. G. Ital. Med. Lav. Ergon. 2010, 32, 23–31. [Google Scholar] [PubMed]
- Diapouli, E.; Chaloulakou, A.; Spyrellis, N. Levels of ultrafine particles in different microenvironments e implications to children exposure. Sci. Total Environ. 2007, 388, 128–136. [Google Scholar] [CrossRef] [PubMed]
- Oberdorster, G.; Sharp, Z.; Atudorei, V.; Elder, A.; Gelein, R.; Kreyling, W.; Cox, C. Translocation of inhaled ultrafine particles to the brain. Inhal. Toxicol. 2004, 16, 437–445. [Google Scholar] [CrossRef] [PubMed]
- Kinsey, J.S.; Dong, Y.; Williams, D.C.; Logan, R. Physical characterization of the fine particle emissions from commercial aircraft engines during the aircraft particle emissions experiment (APEX) 1–3. Atmos. Environ. 2010, 44, 2147–2156. [Google Scholar] [CrossRef]
- Kinsey, J.S.; Hays, M.D.; Dong, Y.; Williams, D.C.; Logan, R. Chemical characterization of the fine particle emissions from commercial aircraft engines during the aircraft particle emissions experiment (APEX) 1 to 3. Environ. Sci. Technol. 2011, 45, 3415–3421. [Google Scholar] [CrossRef] [PubMed]
- Properties of Jet Engine Combustion Particles During the PartEmis Experiment: Hygroscopicity at Subsaturated Conditions. Available online: http://onlinelibrary.wiley.com/doi/10.1029/2003GL016896/pdf (accessed on 30 August 2016).
- Properties of Jet Engine Combustion Particles During the PartEmis Experiment: Microphysics and Chemistry. Available online: http://onlinelibrary.wiley.com/doi/10.1029/2003GL017283/full (accessed on 30 August 2016).
- Particulate Emissions from In-Use Commercial Aircraft. Available online: http://www.tandfonline.com/doi/pdf/10.1080/02786820500247363 (accessed on 30 August 2016).
- Yu, K.N.; Cheung, Y.P.; Cheung, T.; Henry, R.C. Identifying the impact of large urban airports on local air quality by nonparametric regression. Atmos. Environ. 2004, 38, 4501–4507. [Google Scholar] [CrossRef]
- Dodson, R.E.; Andres, H.E.; Morin, B.; Levy, J.I. An analysis of continuous black carbon concentrations in proximity to an airport and major roadways. Atmos. Environ. 2009, 43, 3764–3773. [Google Scholar] [CrossRef]
- Zhu, Y.; Fanning, E.; Yu, R.C.; Zhang, Q.; Froines, J.R. Aircraft emissions and local air quality impacts from takeoff activities at a large international airport. Atmos. Environ. 2011, 45, 6526–6533. [Google Scholar] [CrossRef]
- Hsu, H.H.; Adamkiewicz, G.; Houseman, E.A.; Vallarino, J.; Melly, S.J.; Wayson, R.L.; Spengler, J.D.; Levy, J.I. The relationship between aviation activities and ultrafine particulate matter concentrations near a mid-sized airport. Atmos. Environ. 2012, 50, 328–337. [Google Scholar] [CrossRef]
- Hsu, H.H.; Adamkiewicz, G.; Houseman, E.A.; Zarubiak, D.; Spengler, J.D.; Levy, J.I. Contributions of aircraft arrivals and departures to ultrafine particle counts near Los Angeles International Airport. Sci. Total Environ. 2013, 444, 347–355. [Google Scholar] [CrossRef] [PubMed]
- Hu, S.; Fruin, S.; Kozawa, K.; Mara, S.; Winer, A.M.; Paulson, S.E. Aircraft emission impacts in a neighbourhood adjacent to a general aviation airport in Southern California. Environ. Sci. Technol. 2009, 43, 8039–8045. [Google Scholar] [CrossRef] [PubMed]
- Westerdahl, D.; Fruin, S.A.; Fine, P.L.; Sioutas, C. The Los Angeles International Airport as a source of ultrafine particles and other pollutants to nearby communities. Atmos. Env. 2008, 42, 3143–3155. [Google Scholar] [CrossRef]
- Buonanno, G.; Bernabei, M.; Avino, P.; Stabile, L. Occupational exposure to airborne particles and other pollutants in an aviation base. Environ. Pollut. 2012, 170, 78–87. [Google Scholar] [CrossRef] [PubMed]
- Grigg, J.; Kulkarni, N.; Pierse, N.; Rushton, L.; O'Callaghan, C.; Rutman, A. Black-pigmented material in airway macrophages from healthy children: association with lung function and modeled PM10. Res. Rep. Health Eff. Inst. 2008, 134, 1–23. [Google Scholar] [PubMed]
- Marjamäki, M.; Keskinen, J.; Chen, D.R.; Pui, D.Y. Performance evaluation of the electrical low-pressure impactor (ELPI). J. Aerosol Sci. 2000, 31, 249–261. [Google Scholar] [CrossRef]
- Allegato al Comunicato Stampa ISPRA—IX Rapporto Sulla Qualità Dell’ambiente Urbano, I Dati (Annex to the Press Release ISPRA—IX Report on the Quality of Urban Environment, the Data). Available online: http://www.isprambiente.gov.it/files/comunicati-stampa/2013/ALLEGATO_AL_COMUNICATO_AREE_URBANE_I_DATI2013.pdf (accessed on 30 August 2016).
- Buonanno, G.; Fuoco, F.C.; Stabile, L. Influential parameters on particle exposure of pedestrians in urban microenvironments. Atmos. Env. 2011, 45, 1434–1443. [Google Scholar] [CrossRef]
© 2016 by the authors; licensee MDPI, Basel, Switzerland. This article is an open access article distributed under the terms and conditions of the Creative Commons Attribution (CC-BY) license (http://creativecommons.org/licenses/by/4.0/).


 ,
, 


