Article

Characteristics of the Nonoccurrence of Tropical Cyclones in the Western North Pacific in August 2014

National Institute of Meteorological Sciences, 33, Seohobuk-ro, Seogwipo, Jeju 63568, Korea
*
Author to whom correspondence should be addressed.
Atmosphere 2016, 7(10), 133; https://doi.org/10.3390/atmos7100133
Submission received: 30 August 2016 / Revised: 8 October 2016 / Accepted: 12 October 2016 / Published: 19 October 2016

Abstract

:
This study identified the causes of the nonoccurrence of tropical cyclones (TCs) in August 2014 by examining large-scale environments. First, over the previous 30 years, the TC genesis frequency in August showed an overall statistically significant decline. In the tropical and subtropical western Pacific, the outgoing longwave radiation anomaly index also exhibited an overall increase until recently. Regarding precipitable water and precipitation, an analysis was performed on the difference between the mean values for August 2014 and the mean values for August over the previous 30 years. As a result, while convective activities were suppressed in the tropical and subtropical western Pacific, convective activities were strong in the mid-latitudes of East Asia. This indicates that while the western North Pacific summer monsoon was weakened in August 2014, the East Asian summer monsoon was strengthened. The weakening of the western North Pacific summer monsoon may have made it difficult for TCs to occur. An analysis of 850 hPa and 500 hPa stream flows showed the strengthening of anomalous huge anticyclonic circulations in the tropical and subtropical western Pacific, whereas anomalously cyclonic circulations were reinforced in the mid-latitudes of East Asia. This was associated with the result that the western North Pacific subtropical high (WNPSH) showed further westward and southward expansion in August 2014 compared to the climatological mean WNPSH. Therefore, TCs were unlikely to occur in the tropical and subtropical western Pacific, but anomalous cold northerlies and anomalous warm southerlies converged in the Japanese Islands after originating in China’s central region and passing the East China Sea. Therefore, a favorable environment for the occurrence of precipitation had been formed.

1. Introduction

Every year, over one-third of the TCs that occur throughout the world are located in the western North Pacific. A better understanding of the mechanism of TC activities can help prevent disasters caused by TCs. To this end, a number of studies have been carried out. Most of these studies have focused on TC genesis and interannual variations.
First, Atkinson [1] conducted a study on TC genesis frequency and demonstrated that the frequency of TCs that occurred in the western North Pacific during the summer of 1972 was higher than the average. Gray [2] identified six physical parameters for TC genesis: (i) low-level relative vorticity; (ii) local or planetary vorticity (Coriolis parameter); (iii) inverse of the vertical shear of the horizontal wind between the lower and upper troposphere; (iv) ocean thermal energy due to temperatures above 26.8 °C to a depth of 60 m; (v) vertical gradient of equivalent potential temperature between the surface and 500 mb (hPa); and (vi) middle-troposphere relative humidity. As the thresholds for TC genesis, there is the “seasonal genesis parameter” by Gray [3] and the “genesis potential index” by Emanuel and Nolan [4].
Chan [5] suggested, based on a spectral analysis, that the El Niño-Southern Oscillation (ENSO) was closely associated with TC genesis frequency. Contrarily, Ramage and Hori [6] argued that no clear correlations existed between the two variables. Some studies analyzed that the TC genesis and TC track in the western North Pacific were deeply related to various climate factors such as the Antarctic Oscillation (AAO), Arctic Oscillation (AO), and North Pacific Oscillation (NPO) [7,8].
Meanwhile, some studies researched the relationship between TC genesis locations and the ENSO. Chan [5], Dong [9], and Lander [10] showed that the frequency of TCs that occurred in the area west of 160°E decreased during the El Niño years, whereas the frequency of TCs that occurred in the area south of 20°N in the west of 160°E increased. In addition, these studies mentioned the formation of opposite patterns during the La Niña years.
Lander [10] reported that monsoon troughs were mostly located in favorable regions for TC genesis. McBride [11] showed that major TC genesis locations mostly coincided with the regions where sea surface temperatures (SSTs) were 26.5 °C or above and monsoon troughs were located. However, Chen et al. [12] argued that the south to north or east to west movements of monsoon troughs were a more important variable for TC genesis locations than SSTs. Furthermore, Chan [13] discovered that the TC genesis and TC genesis frequency showed large variations not only during the El Niño and La Niña years, but also the years before and after these years. He also made efforts to correlate TC genesis locations and TC genesis frequency with large-scale environments by performing a case study regarding this characteristic. As the above studies showed, existing studies on the western North Pacific TC genesis are mostly focused on interannual variations.
Along with a great deal of studies on interannual variations of TCs, studies on interdecadal variations also exist. Gray et al. [14] suggested the trend that the TC genesis frequency was strengthened during the westerly wind phase of zonal winds in the lower stratosphere. Zhang et al. [15] discovered that the TC genesis frequency had a periodicity of 6, 15, 21, and 31 years although they could not identify its physical mechanism. They also presented large changes in TC genesis frequency in the years 1931, 1959, and 1977. Chan and Shi [16] confirmed that the overall TC genesis frequency had increased since the early 1990s using polynomial regression equations. However, this increasing trend has turned into a decreasing trend since the 2000s. Yumoto and Matsuura [17] showed that the recent 49-year period (1951–1999) could be divided into two high-frequency periods (1961–1972, 1986–1994) and two low-frequency periods (1951–1960, 1973–1985) based on TC genesis frequency. In addition, Matsuura et al. [18] performed long-term simulations of the last 50 years using a high resolution global model, and based on the results, explained interdecadal variations of TC genesis frequency as the relationship with global warming. Chan [19] reported that the mechanism of interdecadal variations of the western North Pacific TC genesis frequency could be explained to some extent by tropical oscillations such as the ENSO and Quasi-Biennial Oscillation (QBO). However, because of the variability of location, intensity and the degree of expansion in the western North Pacific subtropical high, he suggested that more in-depth studies should be conducted on interdecadal variations of TC track and TC intensity. Chia and Ropelewski [20] also suggested that the ENSO is an important variable for the seasonal prediction of TCs, but it is not a single variable.
Notably, there was not even a single TC during August 2014 since starting the observation of TCs in the western North Pacific. Therefore, this study intended to analyze the causes of the nonoccurrence of TCs in August 2014. Nakazawa [21] analyzed that the low TC genesis frequency in 1998 resulted from the strengthening of anomalous upward flows in the eastern Pacific and the strengthening of anomalous downward flows in the western Pacific due to the reinforcement of El Niño between 1997 and 1998. Kim et al. [22] showed that although the lowest TC genesis frequency was recorded in 2010 since starting the observation of TCs, the frequency of TCs that affected coastal countries in East Asia was high. They suggested that the main reason for this was the weakening of monsoon troughs along with the abnormal development of the western North Pacific subtropical high because of the strengthening of La Niña.
In Section 2, this study’s data and analysis methods are introduced. In Section 3, the time series of TCs that occurred during August in the western North Pacific is analyzed. In Section 4, the causes of the nonoccurrence of TCs in August 2014 are analyzed by examining large-scale environments. In Section 5, this study’s results are summarized.

2. Data and Methods

2.1. Data

The TC data in this study was obtained from the best-track of TC provided by Regional Specialized Meteorological Center (RSMC)-Tokyo Typhoon Center. This data consists of TC name, latitude and longitude location of TC, TC central pressure, and TC Maximum Sustained Wind Speed (MSWS), which were observed in every 6 h for 30 years from 1985 to 2014.
Moreover, this study also used the variables of geopotential height (gpm), zonal and meridional winds (m·s−1), precipitable water (kg·m−2), relative humidity (%), and specific humidity (g·kg−1) data from National Centers for Environmental Prediction-National Center for Atmospheric Research (NCEP-NCAR) reanalysis in 1985 to 2014 [23,24]. This NCEP-NCAR reanalysis data consisted of spatial resolution such as latitude and longitude 2.5° × 2.5° and 17 vertical levels (relative humidity is 16 vertical levels and precipitable water is 1 level). Also, velocity potential consisted of a grid box such as latitude and longitude 192 × 94 and five sigma levels (1000, 850, 500, 200, 100 hPa).
The NOAA Extended Reconstructured monthly Sea Surface Temperature (SST) [25], available from the same organization, was also used. The data have a horizontal resolution of 2.0° × 2.0° latitude-longitude and are available for the period of 1854 to the present day.
In addition, the Climate Prediction Center (CPC) Merged Analysis of Precipitation (CMAP) data [26], the horizontal spatial resolution of which is the same as the NCEP-NCAR reanalysis dataset. This data is based on the monthly average and is available from 1979 to the present day. The CMAP data, which is global precipitation data that covers the ocean, are derived by merging rain gauge observations, five different satellite estimates, and numerical model outputs.
The NCEP/NCAR reanalysis uses a frozen state-of-the art global data assimilation system and a database as complete as possible. The data assimilation and the model used are identical to the global system implemented operationally at the NCEP on 11 January 1995, except that the horizontal resolution is T62 (about 210 km). The database has been enhanced with many sources of observations not available in real time for operations, provided by different countries and organizations. The system has been designed with advanced quality control and monitoring components, and can produce 1 mon of reanalysis per day on a Cray YMP/8 supercomputer.

2.2. Methods

The vertical wind shear (VWS) to diagnose the large-scale condition is calculated as follows:
V W S = ( u 200 850 ) 2 + ( v 200 850 ) 2
where, u and v indicate zonal and meridional flows, respectively. 200 and 850 represent 200 hPa and 850 hPa levels, respectively [27].
In this study, the mean value for the 1985 to 2014 period (30 years) was used as the climatological mean to calculate the anomaly for August 2014.
For the outgoing longwave radiation (OLR) index and OLR anomaly, this study used the data published by the Earth System Research Laboratory (ESRL) / the National Oceanic and Atmospheric Administration (NOAA). In addition, the Niño-3.4 index was provided by the Climate Prediction Center (CPC) / the NOAA.

2.3. Definition of Western North Pacific Monsoon Index (WNPMI)

The western North Pacific monsoon index (WNPMI) is calculated using the below equation [28].
WNPMI = UWND 850 ( 1 ) ( 5 15 N , 100 130 E ) UWND 850 ( 2 ) ( 20 30 N , 110 140 E )
UWND850 indicates a zonal wind at 850 hPa. In this equation, if the UWND850(1) shows a positive value (strengthening of westerlies) and the UWND850(2) shows a negative value (strengthening of easterlies), the WNPMI comes to have a positive value. This indicates the strengthening of monsoon troughs in the tropical and subtropical western North Pacific. The contrary concept indicates the weakening of monsoon troughs in the tropical and subtropical western North Pacific. In other words, when the WNPMI has a positive (negative) value, anomalously cyclonic (anticyclonic) circulations are intensified in the tropical and subtropical western North Pacific. Regarding this issue, Wang and Fan [28] demonstrated that strong (weak) western North Pacific monsoons were caused by stronger (weaker) convections in the tropical and subtropical western North Pacific by analyzing OLR.

2.4. Definition of East Asian Summer Monsoon Index (EASMI)

This study defined the EASMI using the Dynamical Normalized Seasonality (DNS) index developed by Li and Zeng [29,30,31]. The basic concept of the DNS index is based on the intensity of the normalized seasonality of wind fields. As monsoons have highly strong seasonal variations of winds direction, strong and weak monsoons should be defined using the magnitude of the seasonality of wind fields. Using this basic concept regarding monsoons, the DNS index is calculated using the below equation.
δ m n = V ¯ 1 V m n V ¯ 2
Here, V ¯ 1 and V ¯ denote the January climatological wind vector and July climatological wind vector. V m n indicates the monthly wind vector regarding year n and month m. The EASMI is defined as the area-averaged seasonally (August) DNS at 850 hPa within the East Asian monsoon domain (10°N–40°N, 110°E–140°E). The double vertical line indicates the normalized value. The above study showed a clear correlation between the EASMI calculated using the above equation and the June to August rainfall in the middle and lower reaches of China’s Yangtze River, thereby proving the validity of the EASMI’s definition.
Li and Zeng [29,30,31] showed that the opposite phase between EASM and WNPM was because there exists local Hadley circulation in East Asia. That is, when the EASM (WNPM) is reinforced, the WNPM (EASM) is weakened.

3. Time Series Analysis

Figure 1 presents the time series of TC frequencies recorded during August in the tropical and subtropical western North Pacific over the recent 30 years. The TC genesis frequency exhibits clear interannual and interdecadal variations. The climatological mean TC genesis frequency in August was 6.7TCs (dashed line). Most of the years over the observation period until 2001 showed higher frequencies than the climatological mean TC genesis frequency, whereas many years after 2001 exhibited lower frequencies than the climatological mean TC genesis frequency. Because of these characteristics of interannual and interdecadal variations, this time series showed an overall decreasing pattern (thick solid line). This decreasing trend was statistically significant at the 95% confidence level.

4. Large-Scale Environments

This study obtained anomalies regarding large-scale environments in August 2014 to identify the causes of the nonoccurrence of TCs in August 2014.
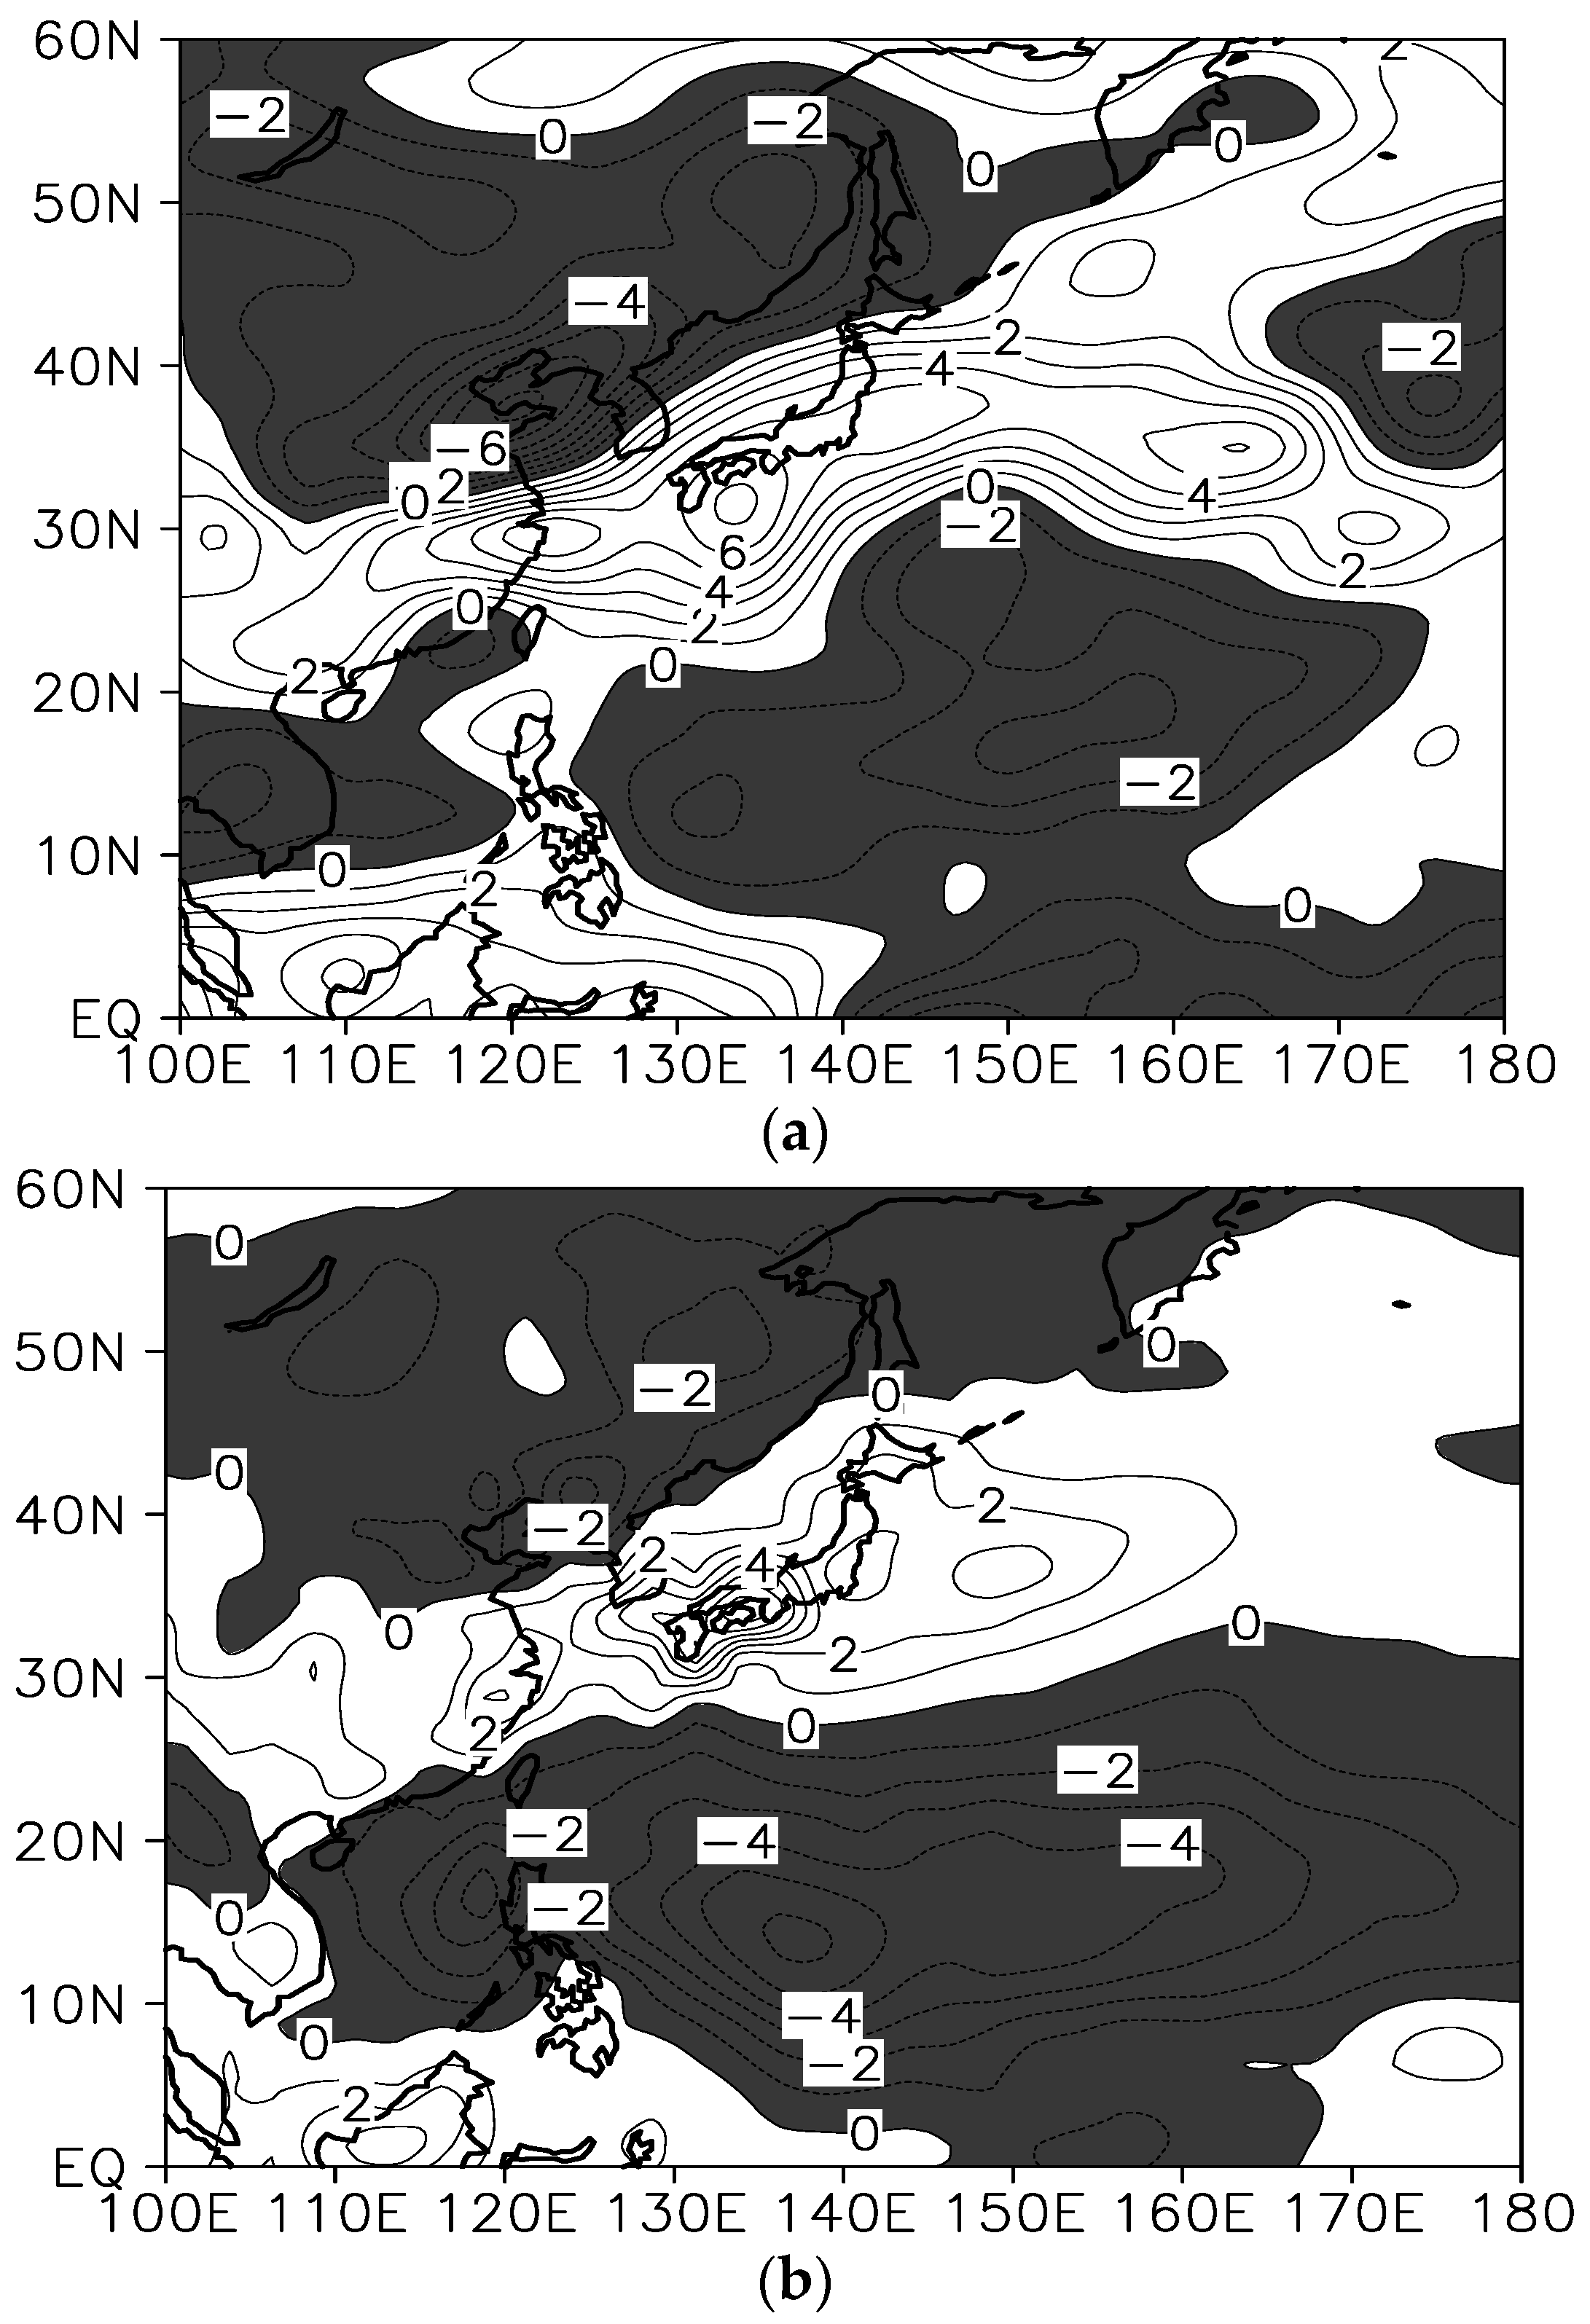
First, an analysis of precipitable water showed negative anomalies in the tropical and subtropical western Pacific and the north of China’s northern region (Figure 2a). On the other hand, positive anomalies are exhibited in the area ranging from China’s central region and the East China Sea to the Japanese Islands. The results of analyzing precipitation are also similar to those of analyzing precipitable water (Figure 2b). Negative anomalies are observed in the tropical and subtropical western Pacific and the north of China’s northern region (Figure 2b).
On the other hand, positive anomalies are shown in the area ranging from China’s central region and the East China Sea to the Japanese Islands. The combination of the above results indicates that during August 2014, convective activities were weakened in the tropical and subtropical western Pacific, whereas convective activities were strengthened in the mid-latitudes of East Asia. This is related to the fact that the western North Pacific summer monsoon was weakened, but the East Asian summer monsoon was strengthened.
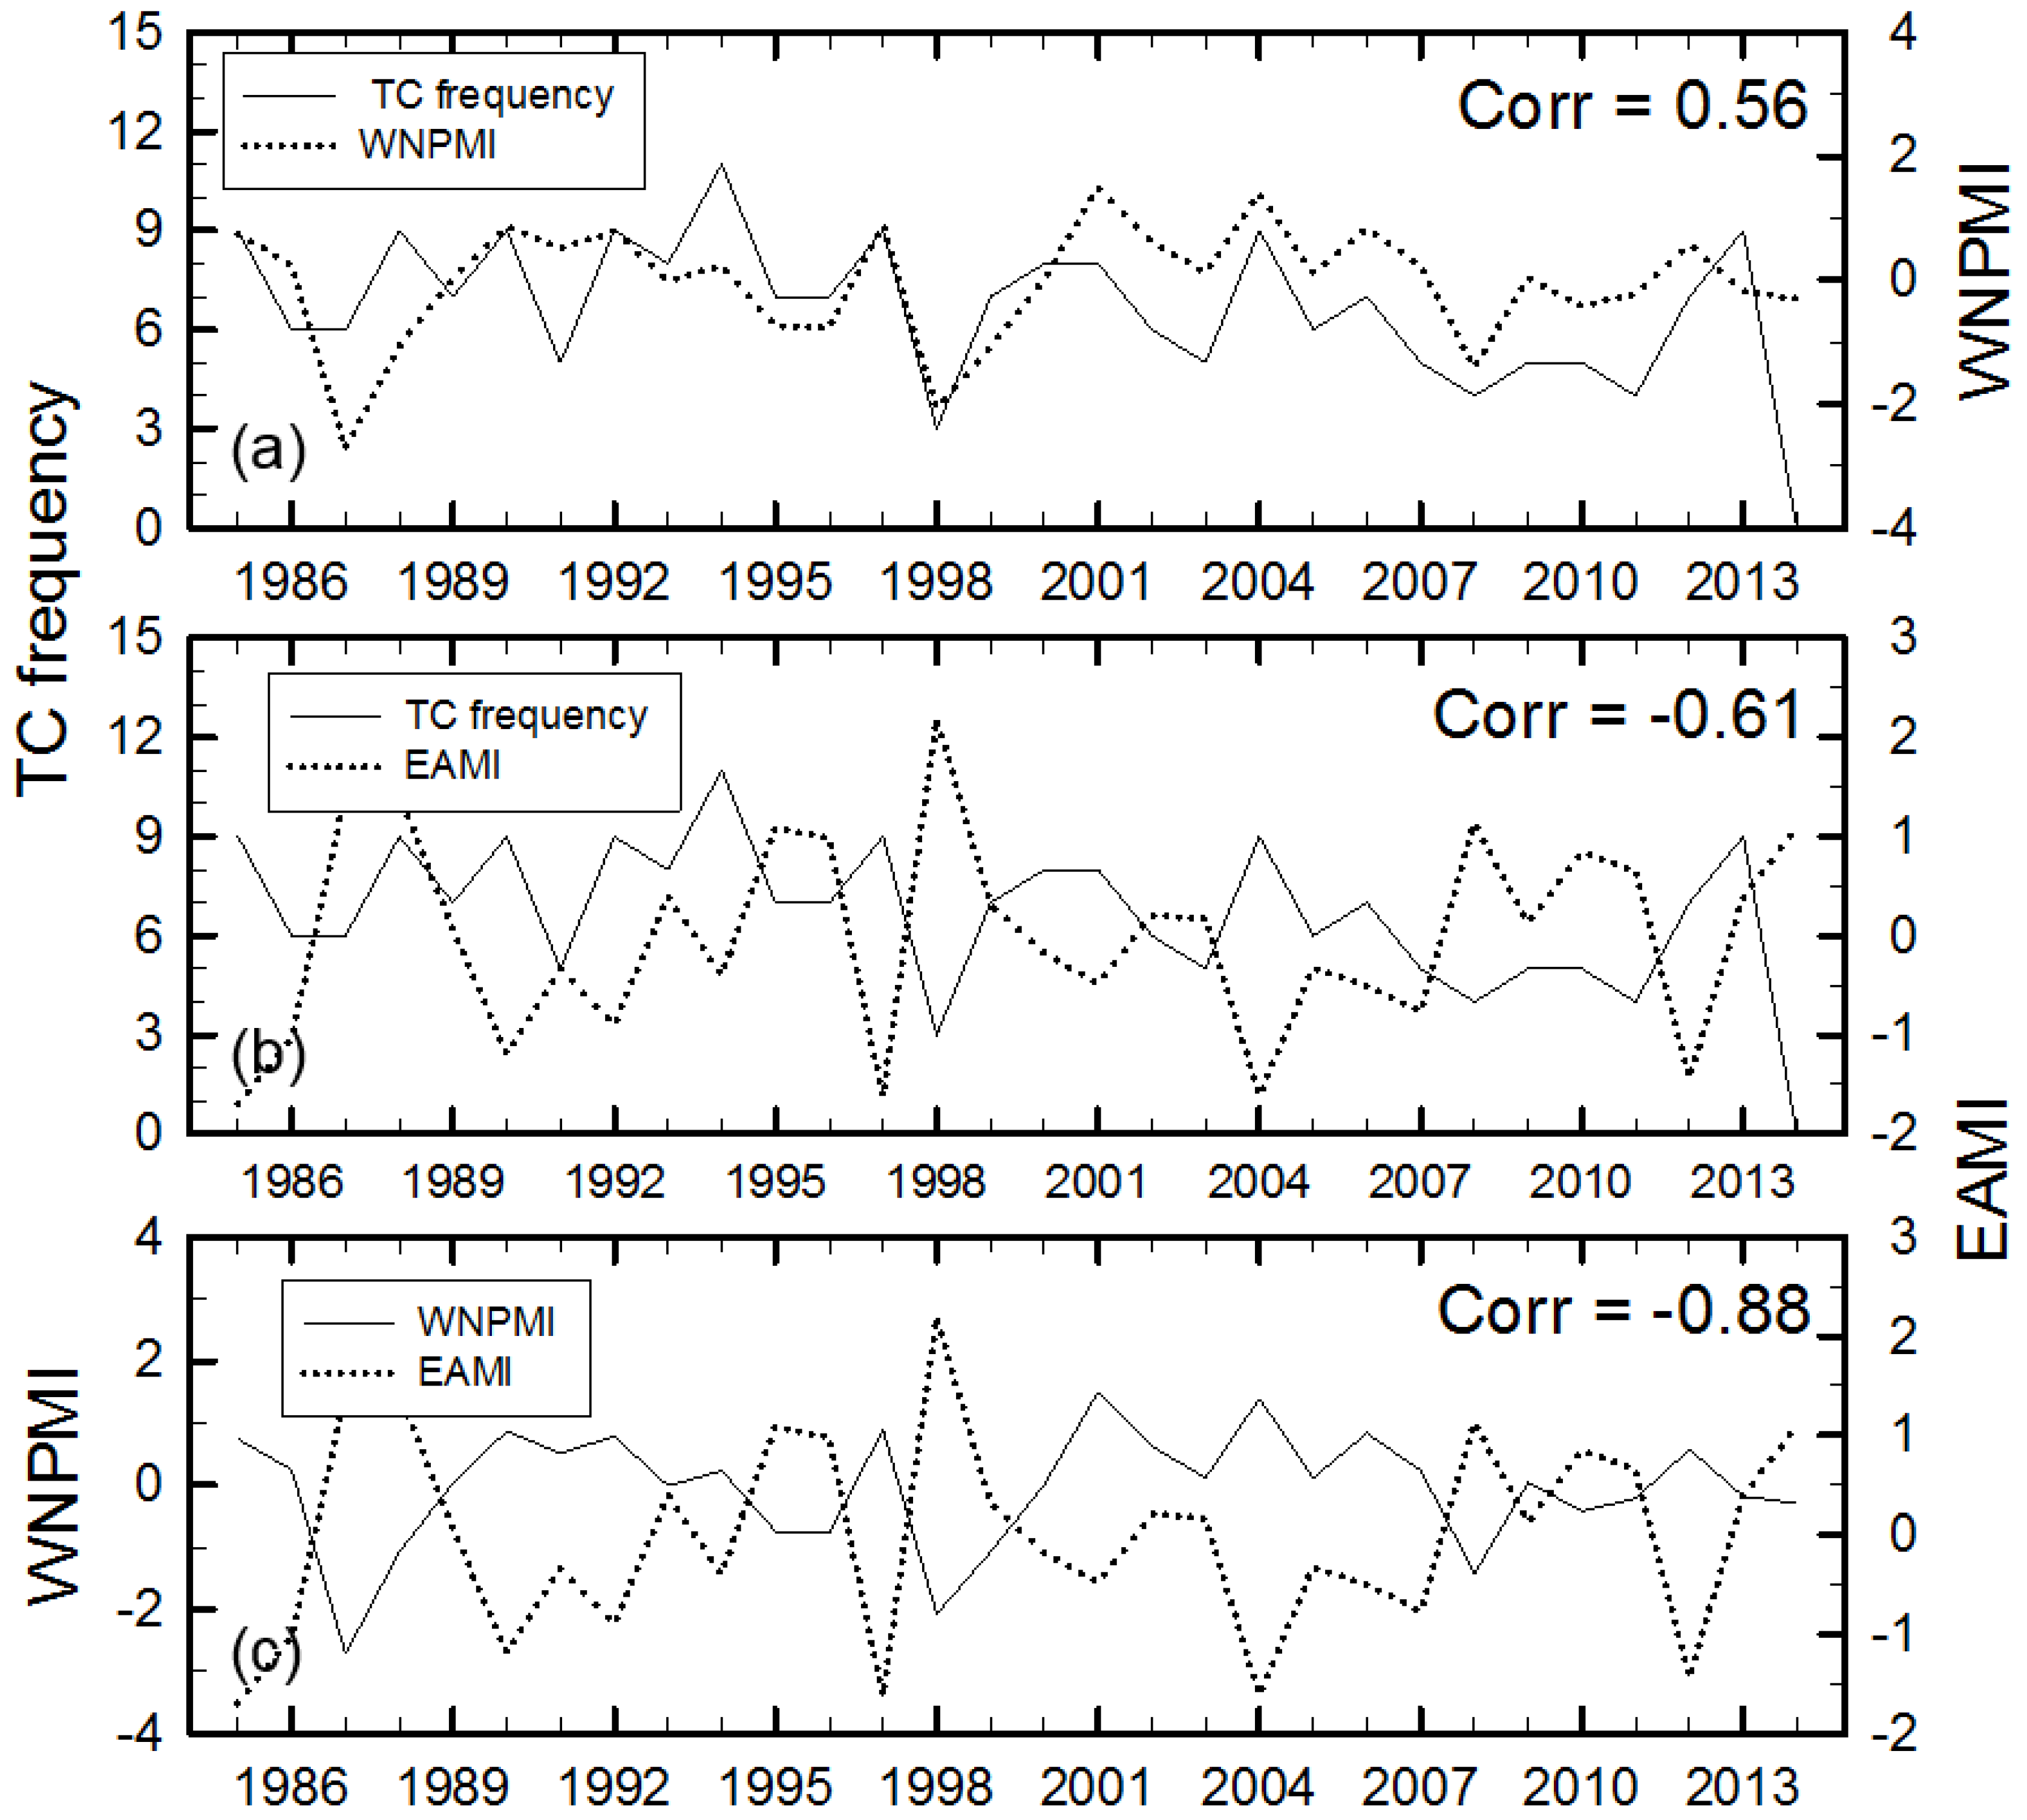
Therefore, this study analyzed the time series of the TC genesis frequency and WNPMI in August over the previous 30 years (Figure 3a). A clear in-phase relationship between the two variables could be confirmed and a highly positive correlation at 0.56 existed between the two variables. This result was statistically significant at the 99% confidence level. The result suggests that when the western North Pacific summer monsoon is strengthened (or weakened), the TC genesis frequency increases (or decreases). On the other hand, a clear out-of-phase relationship was confirmed between the TC genesis frequency and East Asian monsoon index (EAMI) in August, and a highly negative correlation at −0.61 existed between the two variables (Figure 3b). This result was statistically significant at the 99% confidence level. This indicates that when the East Asian summer monsoon is strengthened (or weakened), the TC genesis frequency decreases (or increases). Eventually, a highly negative correlation at −0.88 existed between the western North Pacific summer monsoon and the East Asian summer monsoon, which was statistically significant at the 99% confidence level (Figure 3c). In particular, while the WNPMI exhibited a negative index value in August 2014, the EAMI revealed a highly positive index value. As explained earlier, this indicates that during August 2014, convective activities were weak in the tropical and subtropical western Pacific during, whereas convective activities were strong in the mid-latitudes of East Asia.
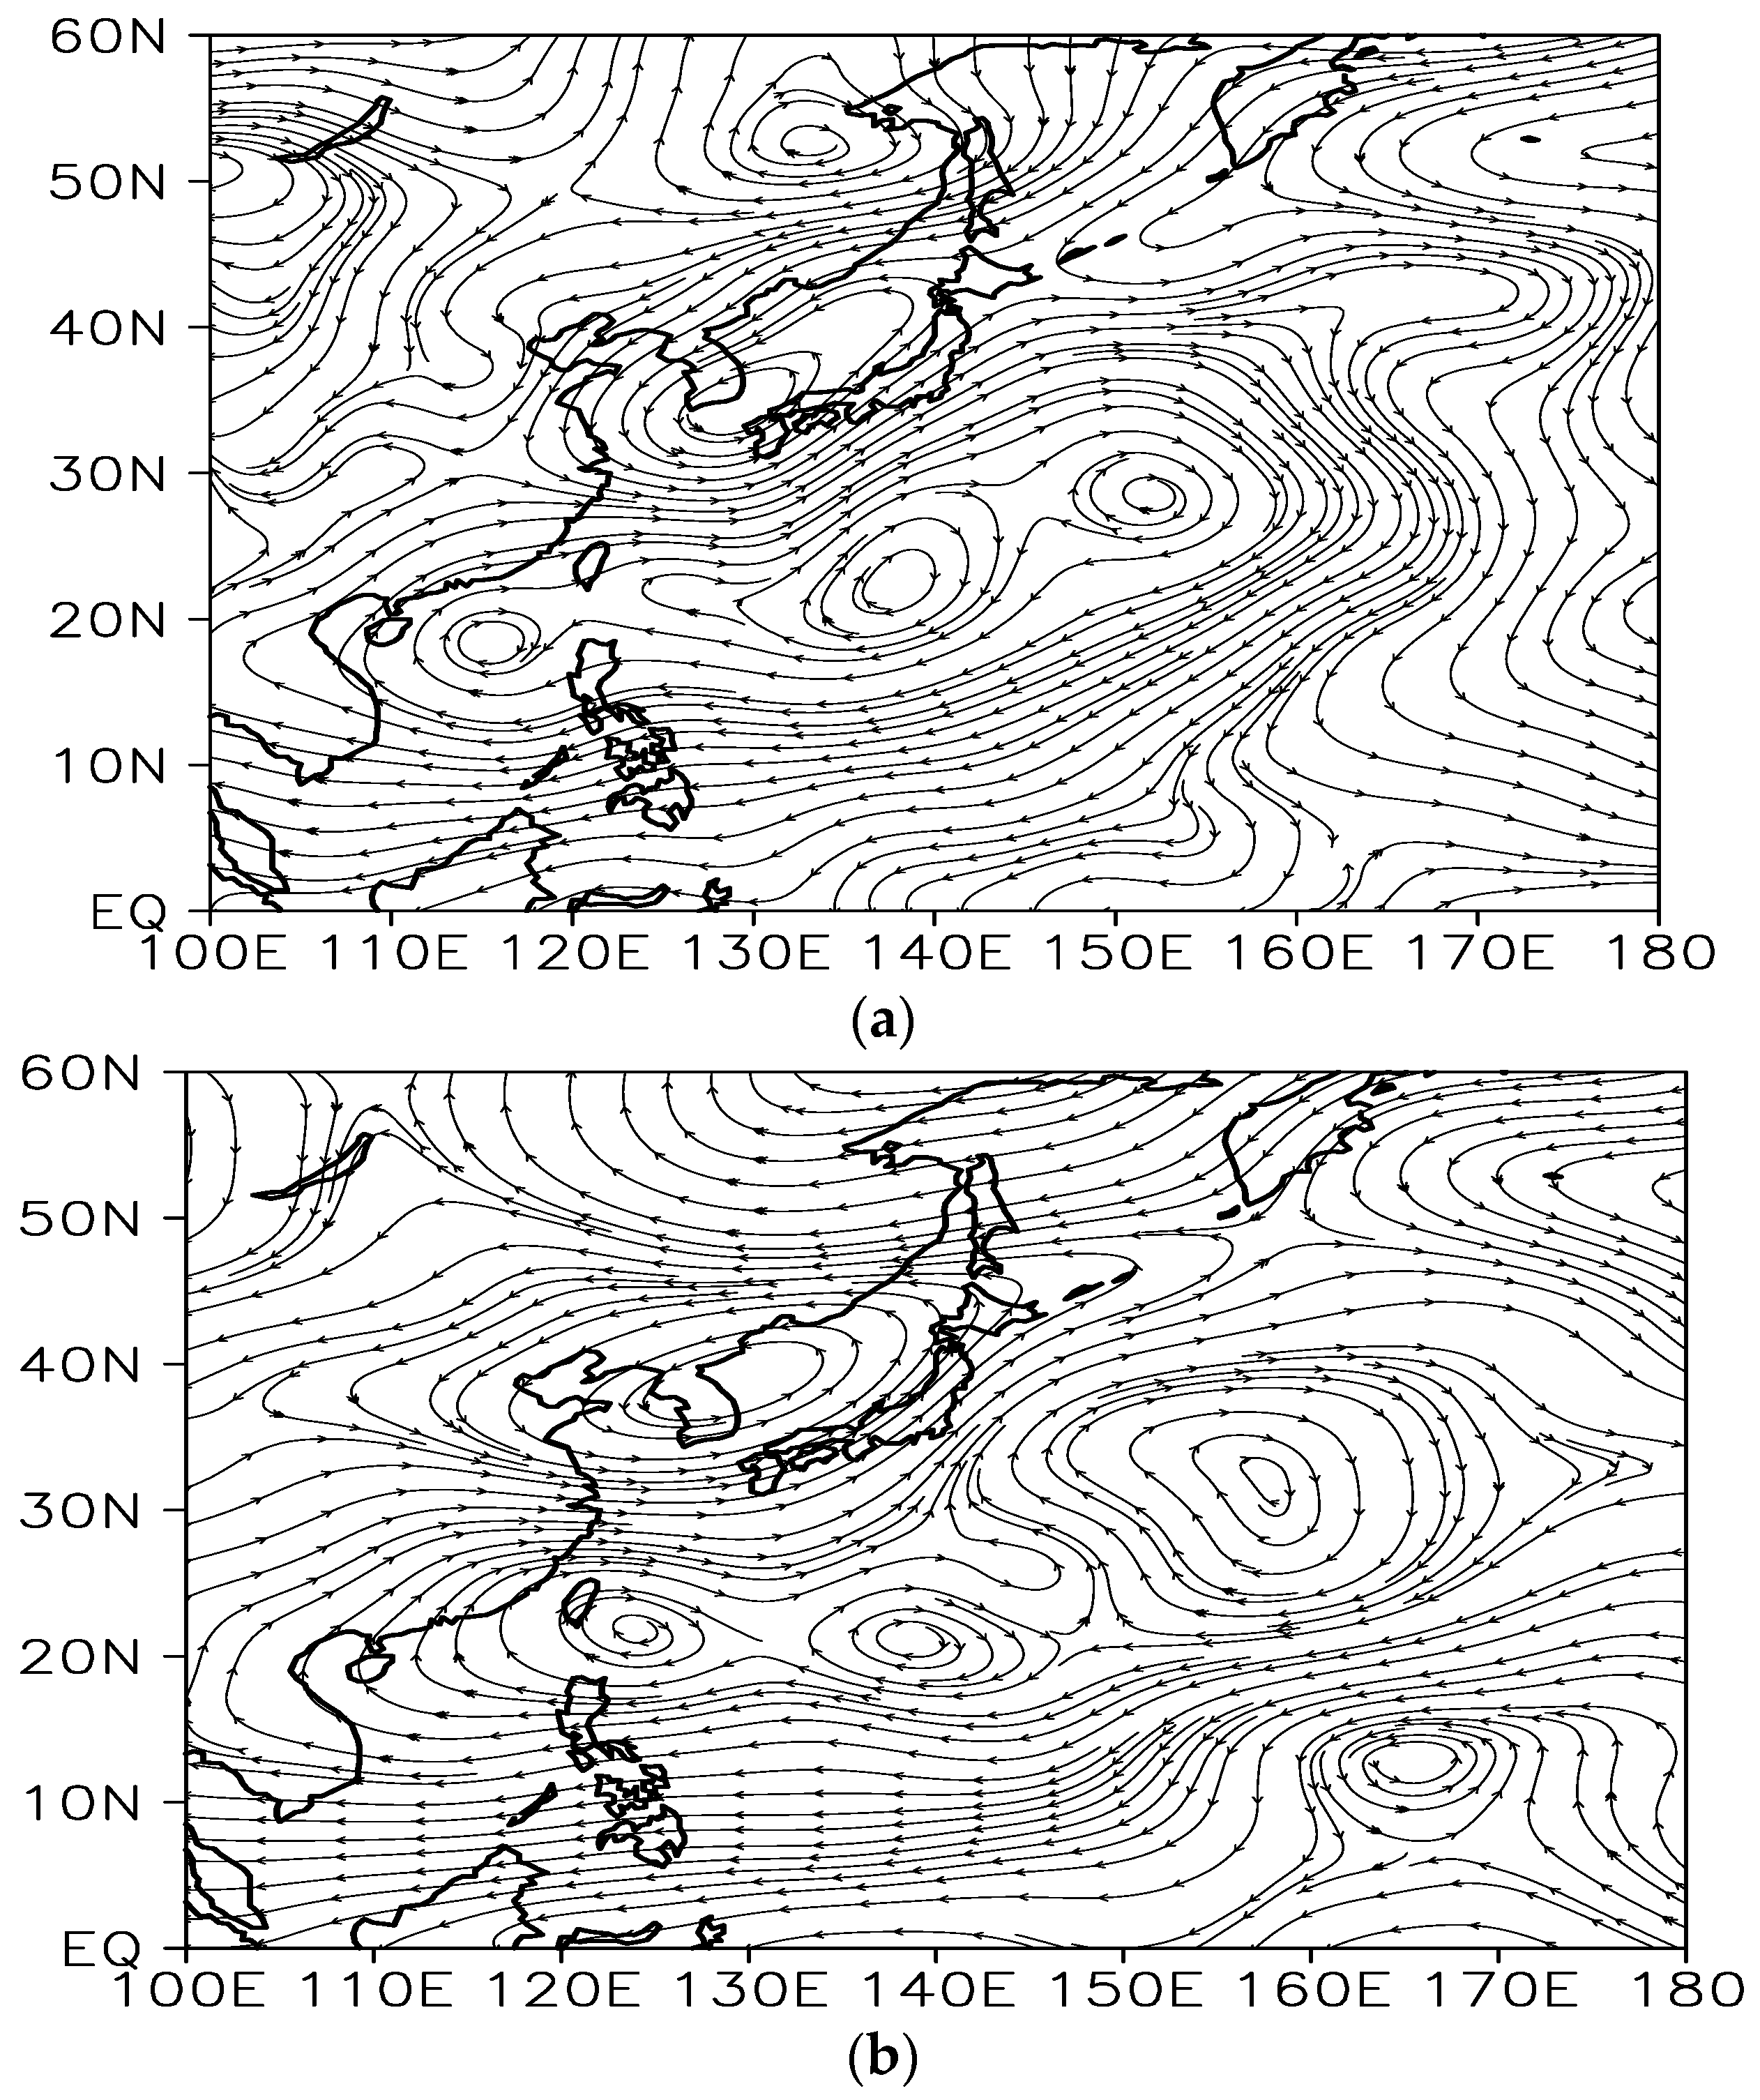
An analysis of 850 hPa stream flows showed that anomalous huge anticyclonic circulations were strengthened in the tropical and subtropical western Pacific (Figure 4a). This indicates that monsoon troughs in August 2014 were weakened compared to the climatological mean. Meanwhile, in China’s central region, anomalous southwesterlies from anomalous huge anticyclonic circulations in the tropical and subtropical western Pacific and anomalous northerlies from anomalously cyclonic circulations centered on the southern region of the Korean Peninsula were converging, and the converged flows were moving towards Japan’s eastern coast. Therefore, during August 2014, anomalously atmospheric circulations which facilitate the formation of precipitation were strengthened in the mid-latitudes of East Asia and anomalously atmospheric circulations that inhibit the formation of TCs were strengthened in the tropical and subtropical western Pacific. The results of analyzing 500 hPa stream flows are similar to those of analyzing 850 hPa stream flows (Figure 4b). While anomalous huge anticyclonic circulations were strengthened in the tropical and subtropical western Pacific, anomalously cyclonic circulations were strengthened in the mid-latitudes of East Asia.
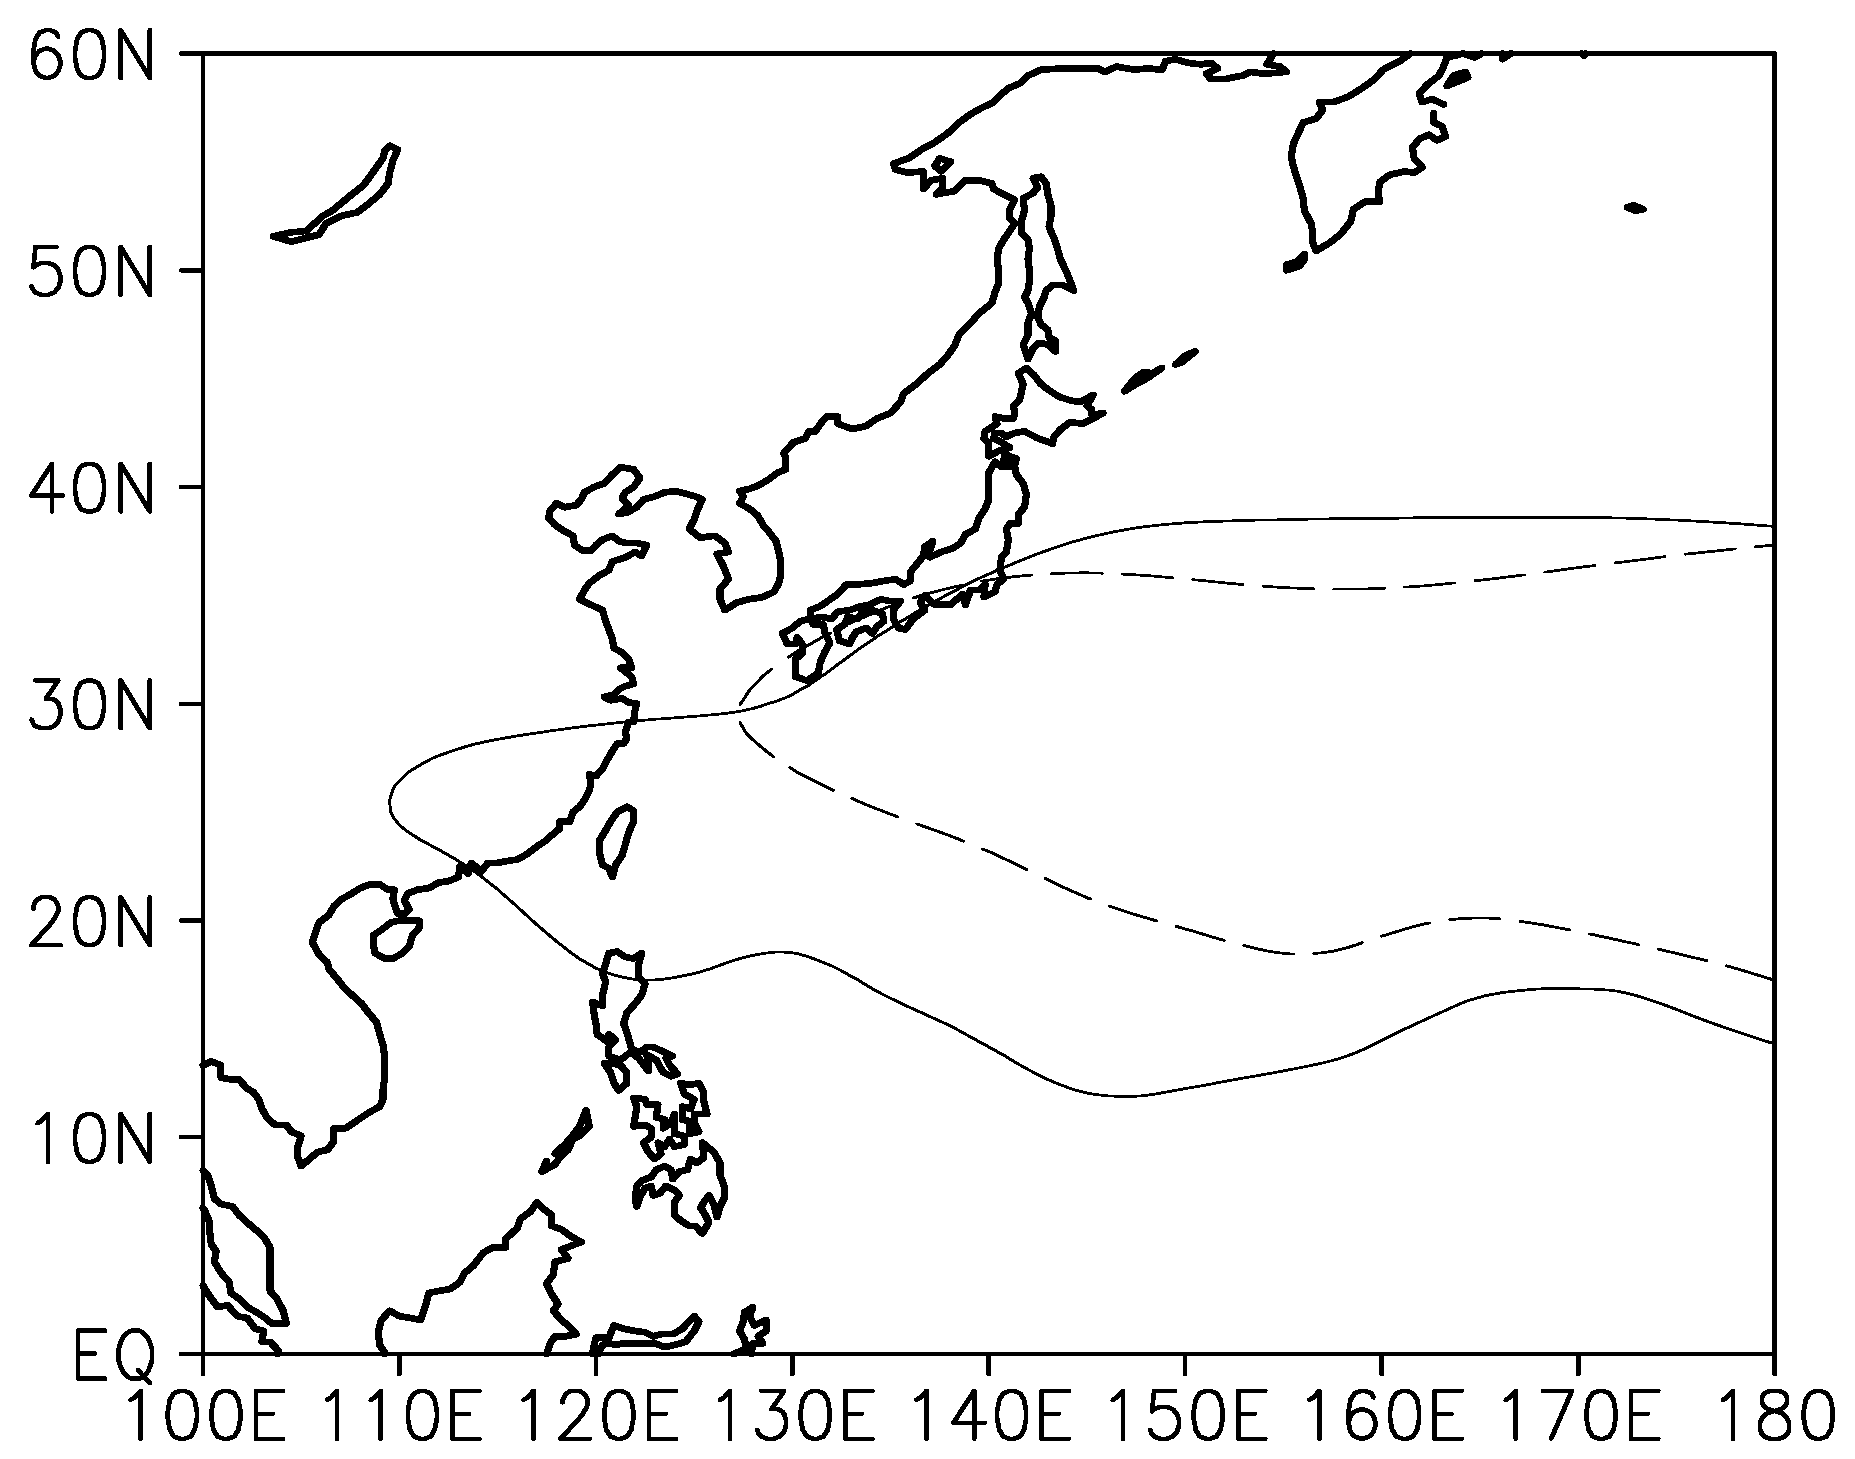
Anomalous huge anticyclonic circulations that were strengthened in the tropical and subtropical western Pacific during August 2014 may indicate that the western North Pacific subtropical high (WNPSH) was developed further than the climatological mean during the same period. Therefore, this study compared the WNPSH in relation to August 2014 and the climatological mean (Figure 5). Here, the WNPSH is defined as the area with higher values than 5875 gpm. While the climatological mean WNPSH developed on Japan’s western coast, the WNPSH during August 2014 spread westward deep into China’s southern region and was fairly expanded equatorward at the same time. Therefore, during August 2014, TCs could not occur because convection was suppressed according to the WNPSH’s abnormal development in the tropical and subtropical western Pacific.
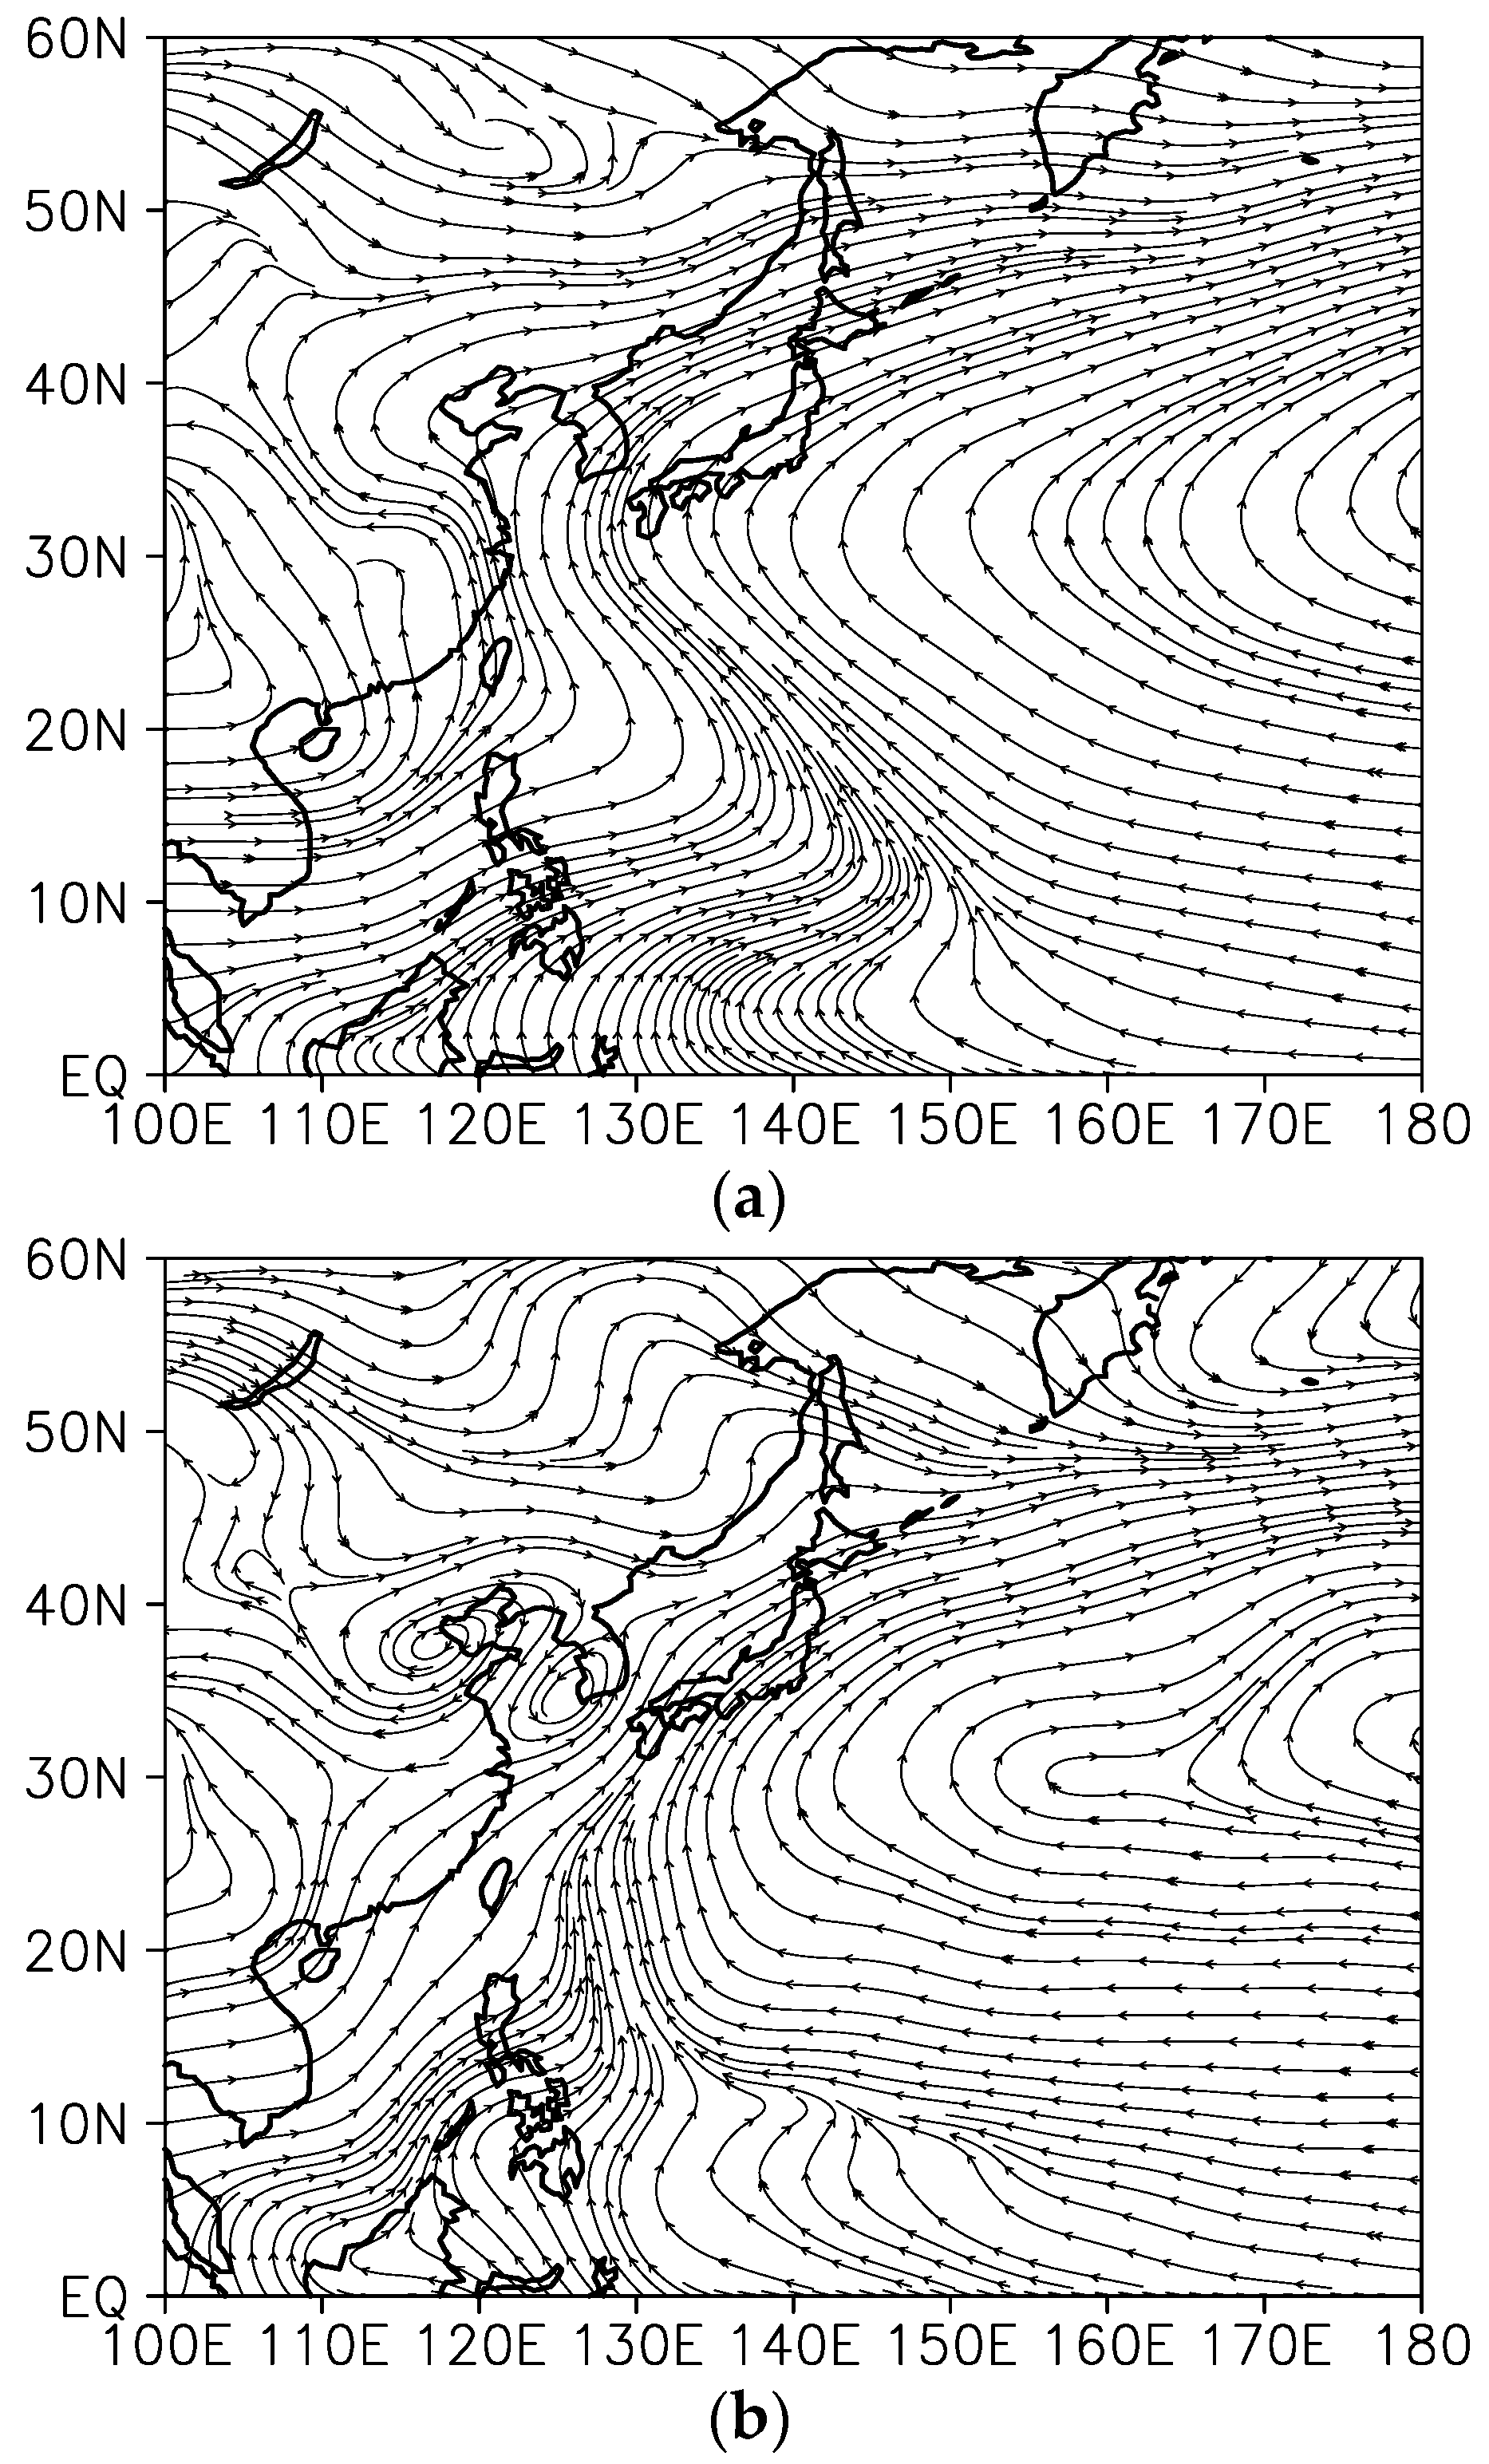
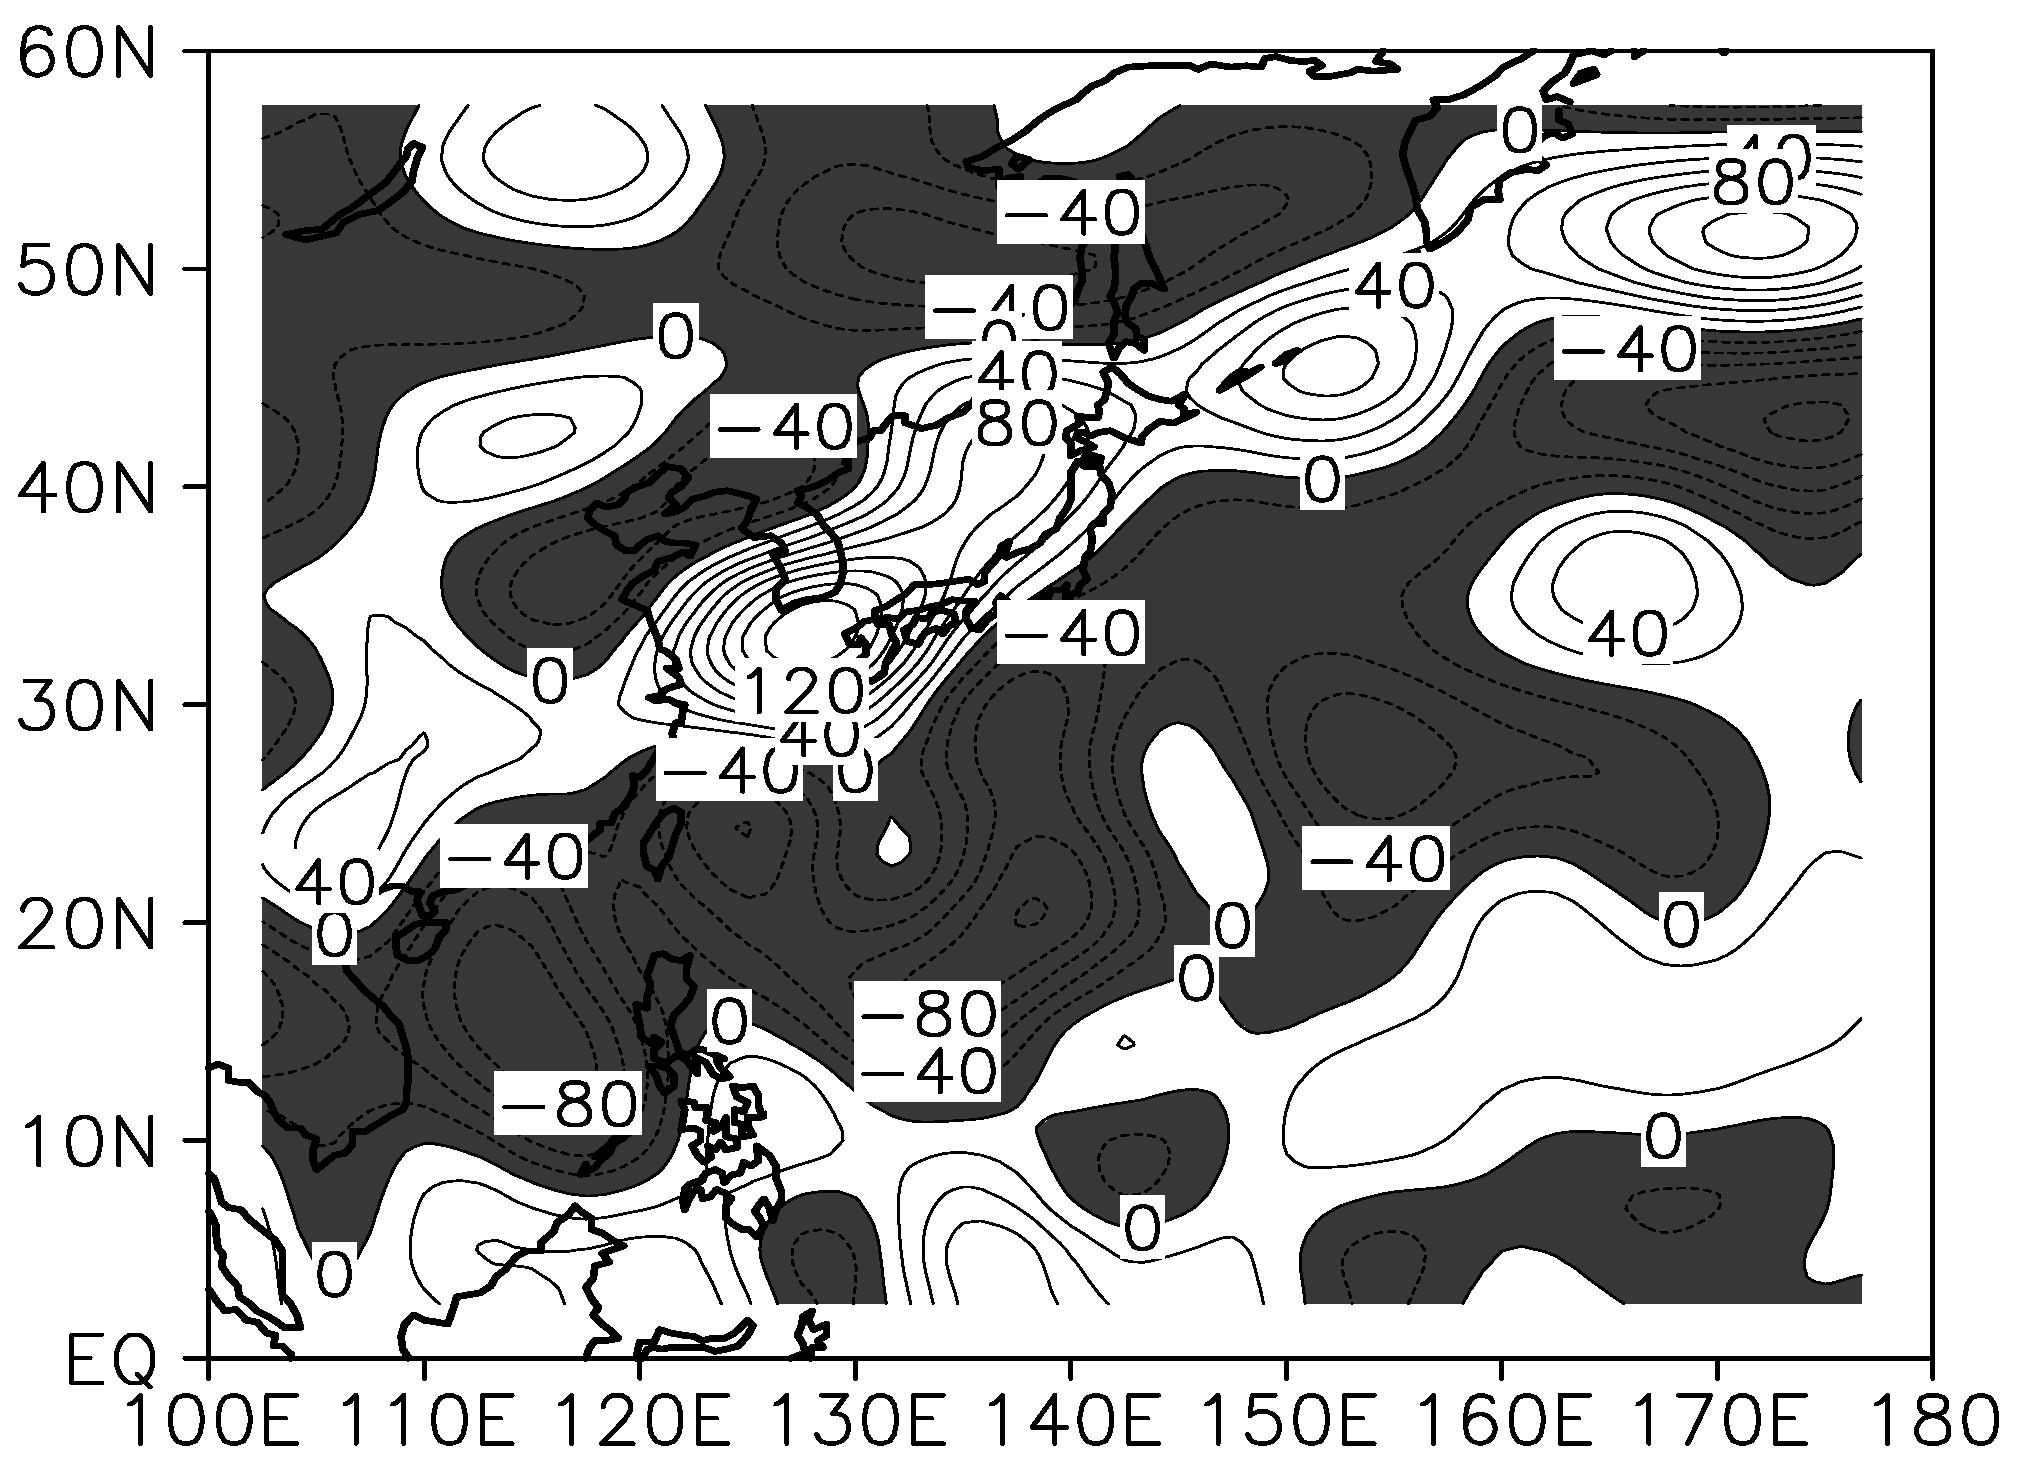
The climatological mean 850 hPa stream flows and the mean 850 hPa stream flows for August 2014 were analyzed to identify whether monsoon troughs were indeed weakened according to the WNPSH’s abnormal development in August 2014 (Figure 6). In the climatological mean, monsoon troughs were developed eastward up to 150°E (Figure 6a), whereas monsoon troughs were developed only up to 130°E in August 2014 (Figure 6b). In general, TCs are inclined to develop in monsoon troughs. Therefore, the above results suggest that monsoon circulations that inhibited the occurrence of TCs were formed during August 2014.
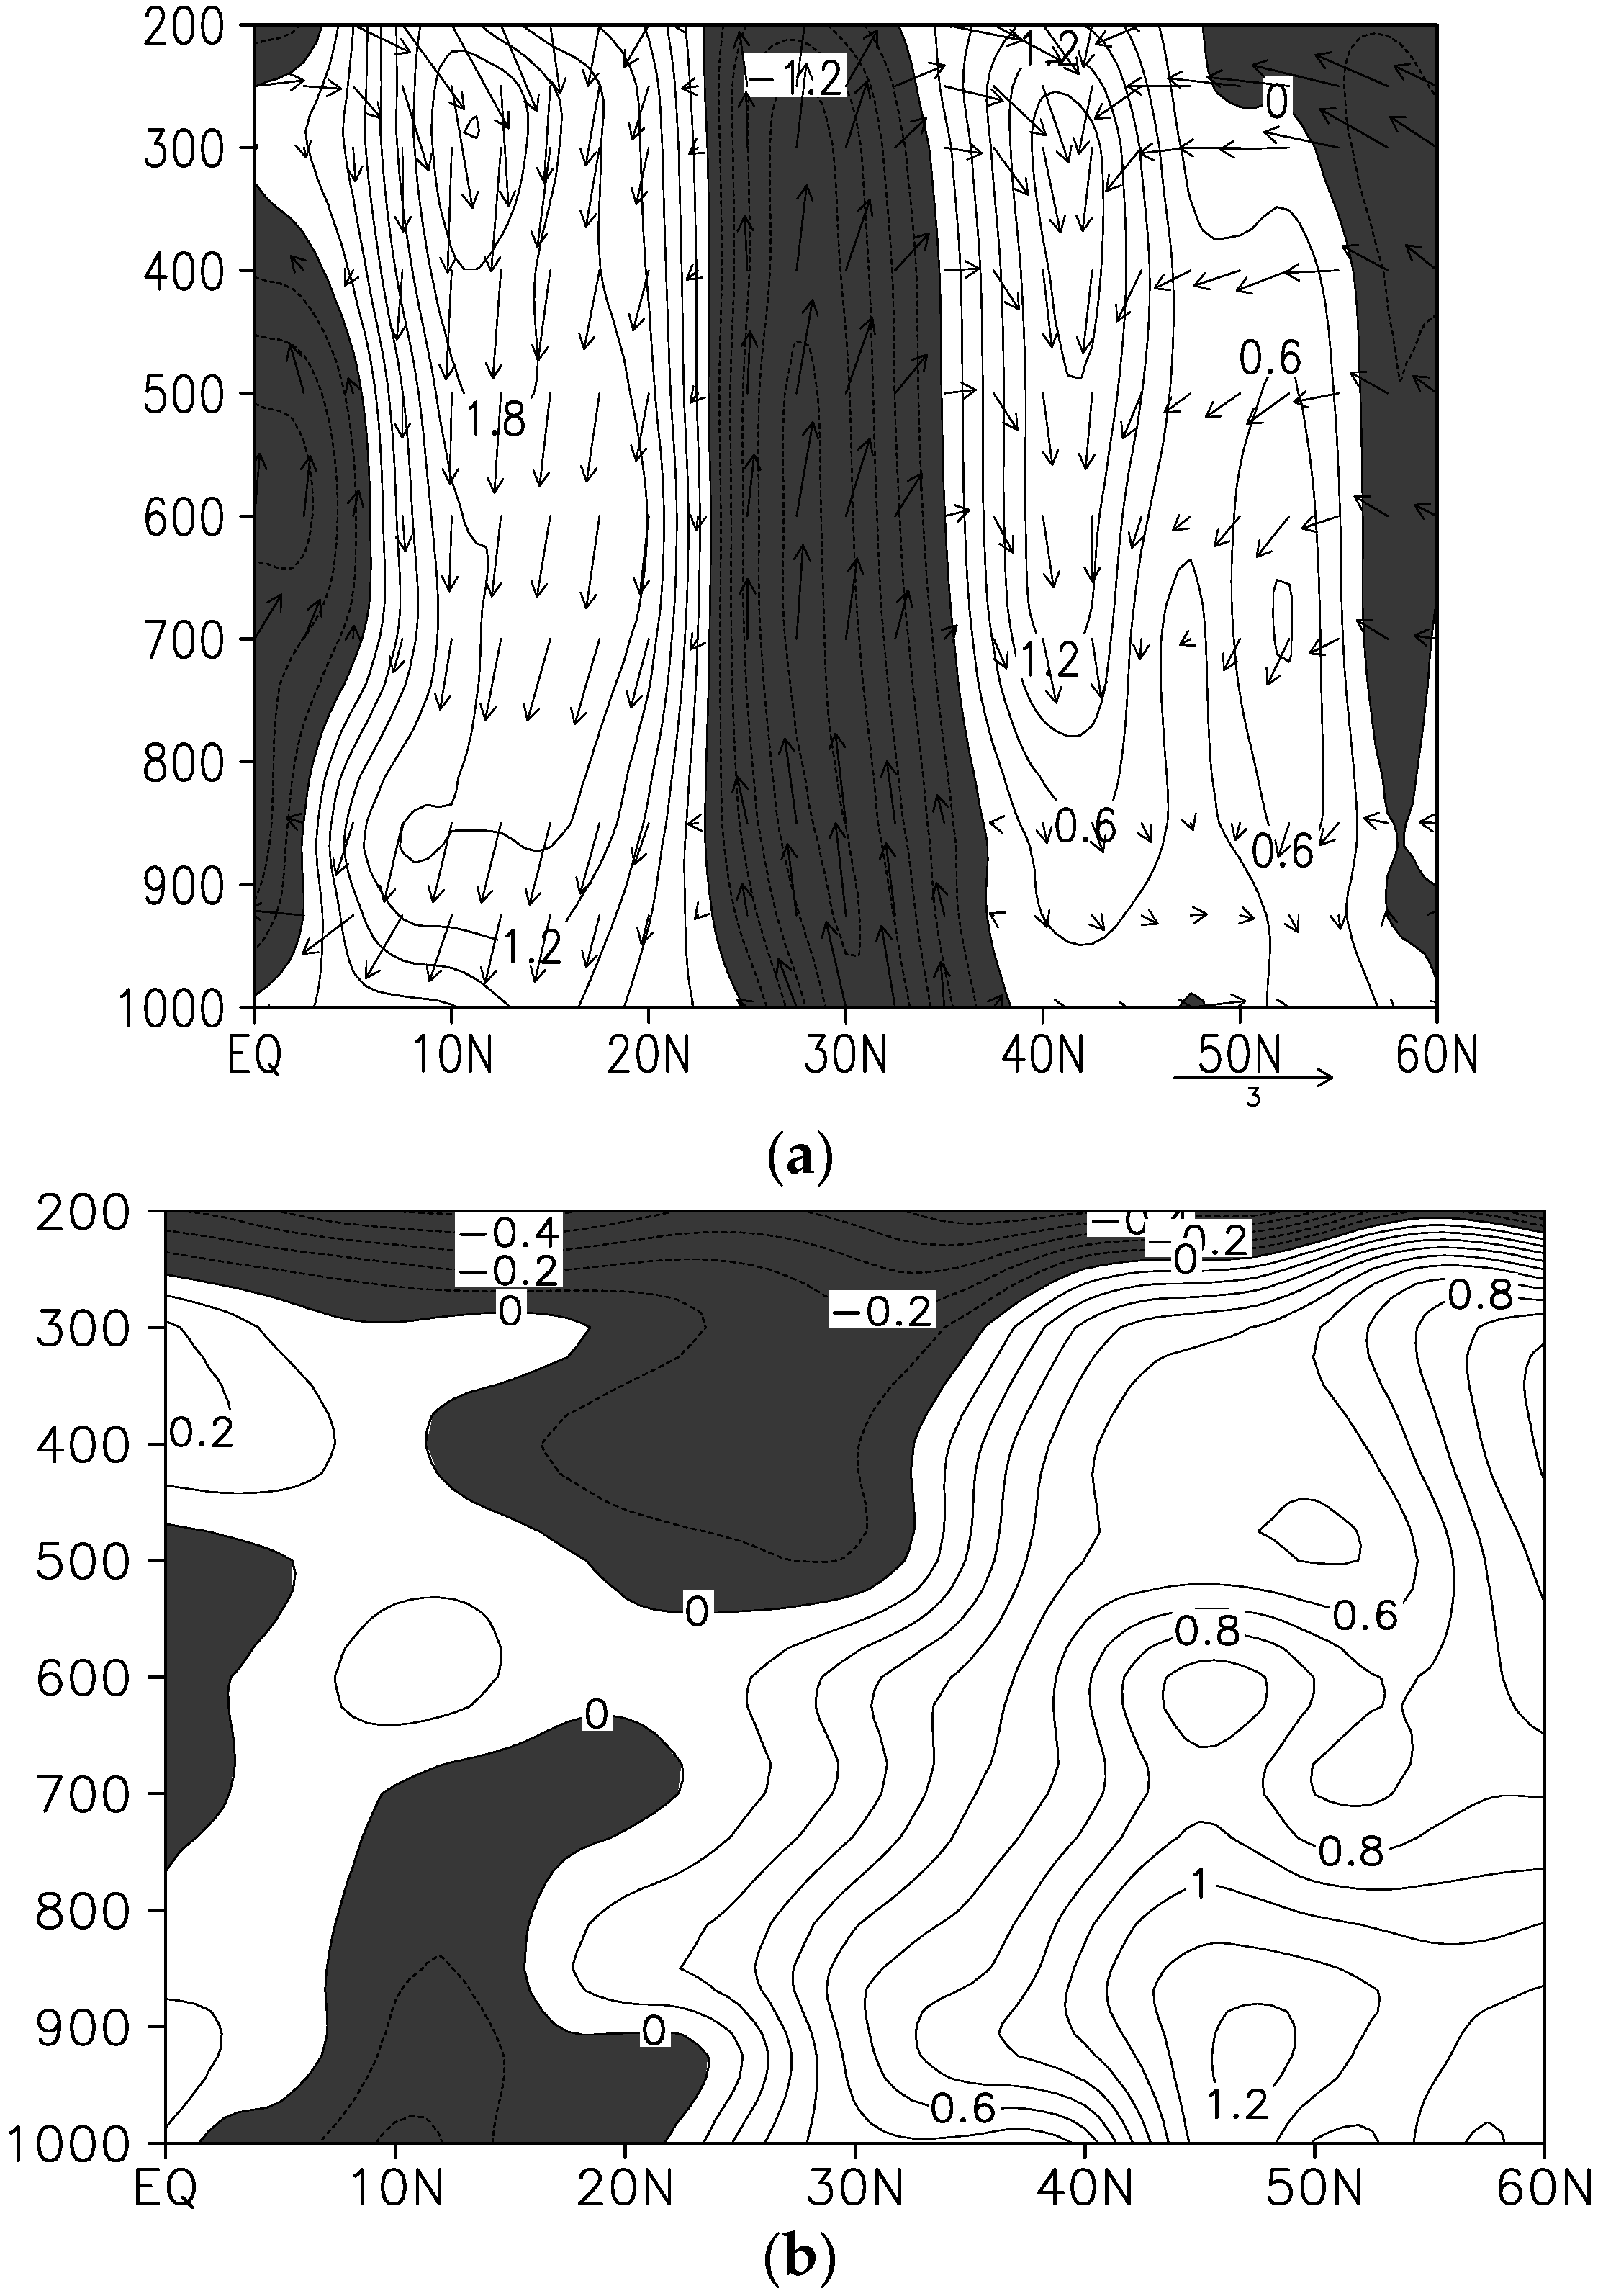
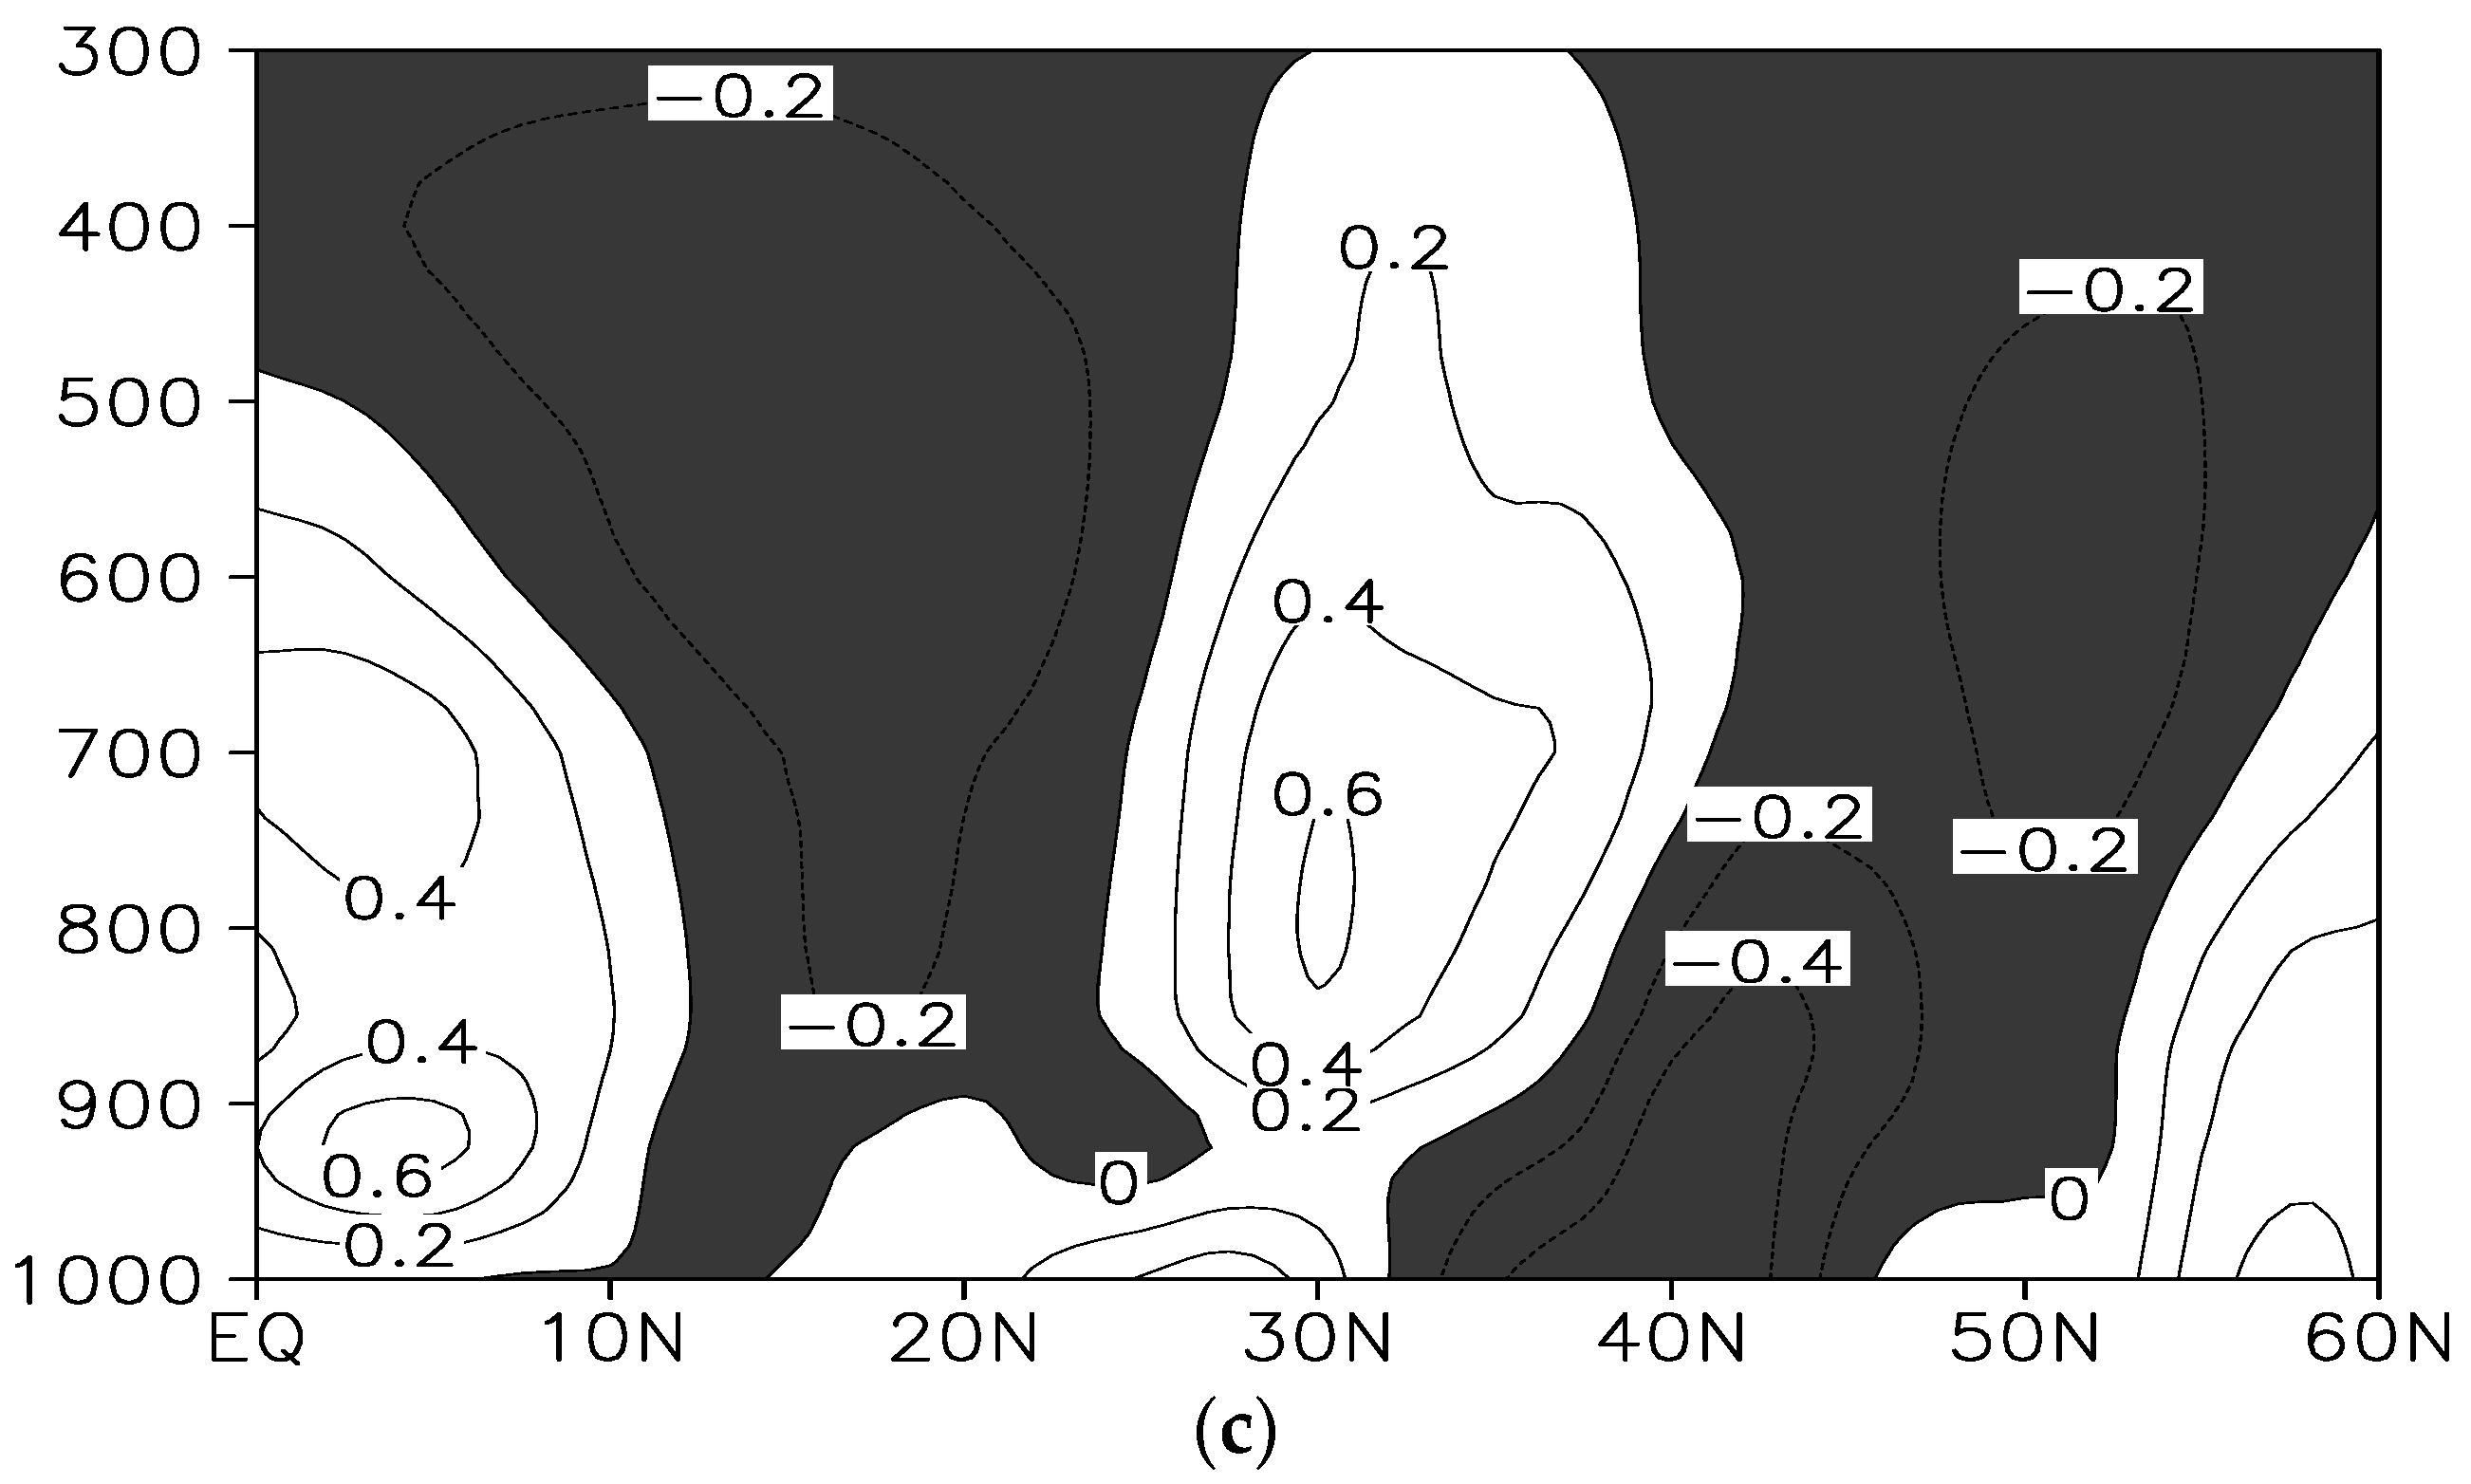
To examine whether unfavorable atmospheric conditions for the occurrence of TCs were formed in August 2014 because the East Asian summer monsoon was strengthened and the western North Pacific summer monsoon was weakened, differences between the mean atmospheric conditions for August 2014 and the climatological mean for August were obtained regarding the variables of vertical meridional circulation, vertical air temperature, and vertical specific humidity by averaging the variables for the longitudinal zone 100°–180° where TCs mainly occur (Figure 7). First, for vertical meridional circulations, anomalous downward flows were reinforced in the latitudinal zone (0°N–25°N) of the tropical and subtropical western North Pacific, in which most TCs occur, but anomalous upward flows were strengthened in the latitudinal zone of the mid-latitudes of East Asia (25°N–40°N) (Figure 7a). This indicates the formation of vertical meridional circulations that suppressed the occurrence of TCs in the tropical and subtropical western North Pacific during August 2014. Regarding vertical air temperatures, while cold anomalies were reinforced from the lower to upper troposphere in the latitudinal zone of the tropical and subtropical western North Pacific, warm anomalies were formed in the latitudinal zone of the mid-latitudes of East Asia (Figure 7b). On the other hand, for vertical specific humidity, negative anomalies were strengthened from the lower to upper troposphere in the latitudinal zone of the tropical and subtropical western North Pacific, whereas positive anomalies were formed in the latitudinal zone of the mid-latitudes of East Asia (Figure 7c). The above results of two atmospheric conditions suggest that cold and dry atmospheric conditions were exhibited from the lower to upper troposphere in the latitudinal zone of the tropical and subtropical western North Pacific, whereas relatively warm and humid atmospheric conditions were shown in the latitudinal zone of the mid-latitudes of East Asia. This indicates that during August 2014, the East Asian summer monsoon was strengthened, whereas the western North Pacific summer monsoon was weakened.
In the anomaly field for the 850 hPa relative vorticity during August 2014, many regions in the tropical and subtropical western North Pacific exhibited negative anomalies (Figure 8). A smaller value in 850 hPa relative vorticity indicates a corresponding strengthening of clockwise circulations. Therefore, many regions in the tropical and subtropical western North Pacific had the environments disturbing the occurrence of TCs according to the strengthening of clockwise circulations. On the other hand, positive anomalies were strengthened in the area ranging from China’s central region and the East China Sea to Japan.
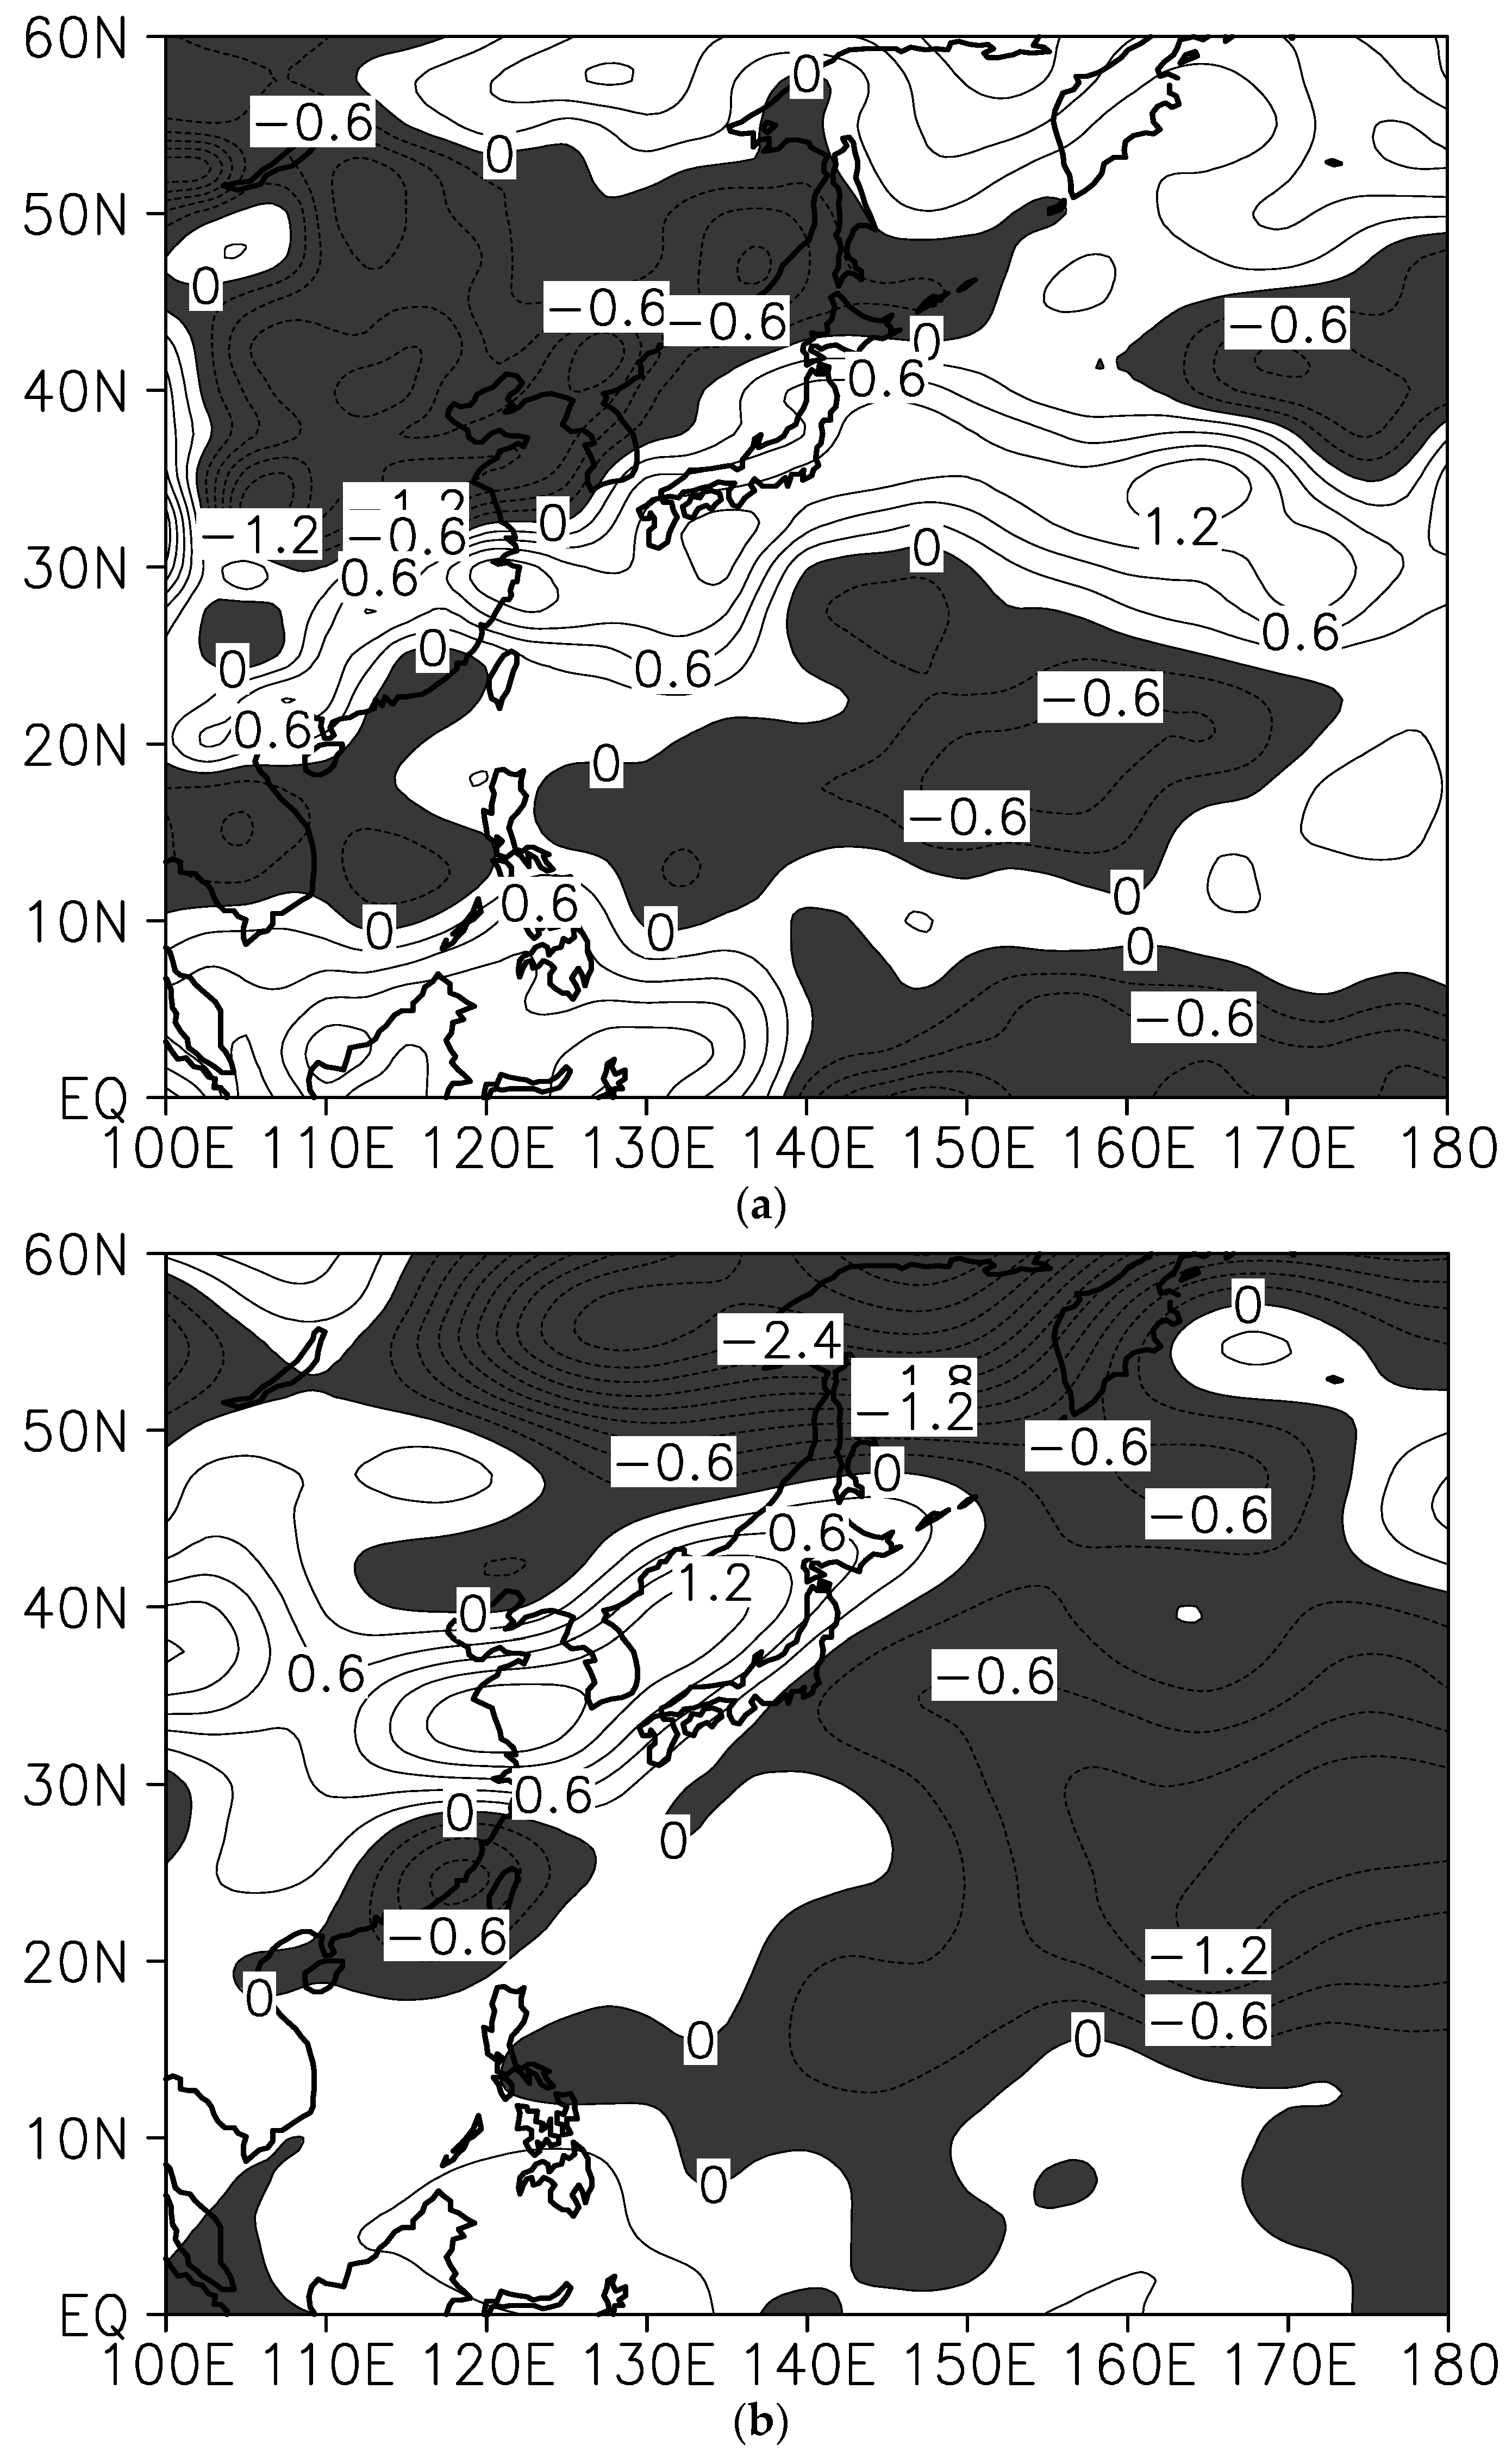
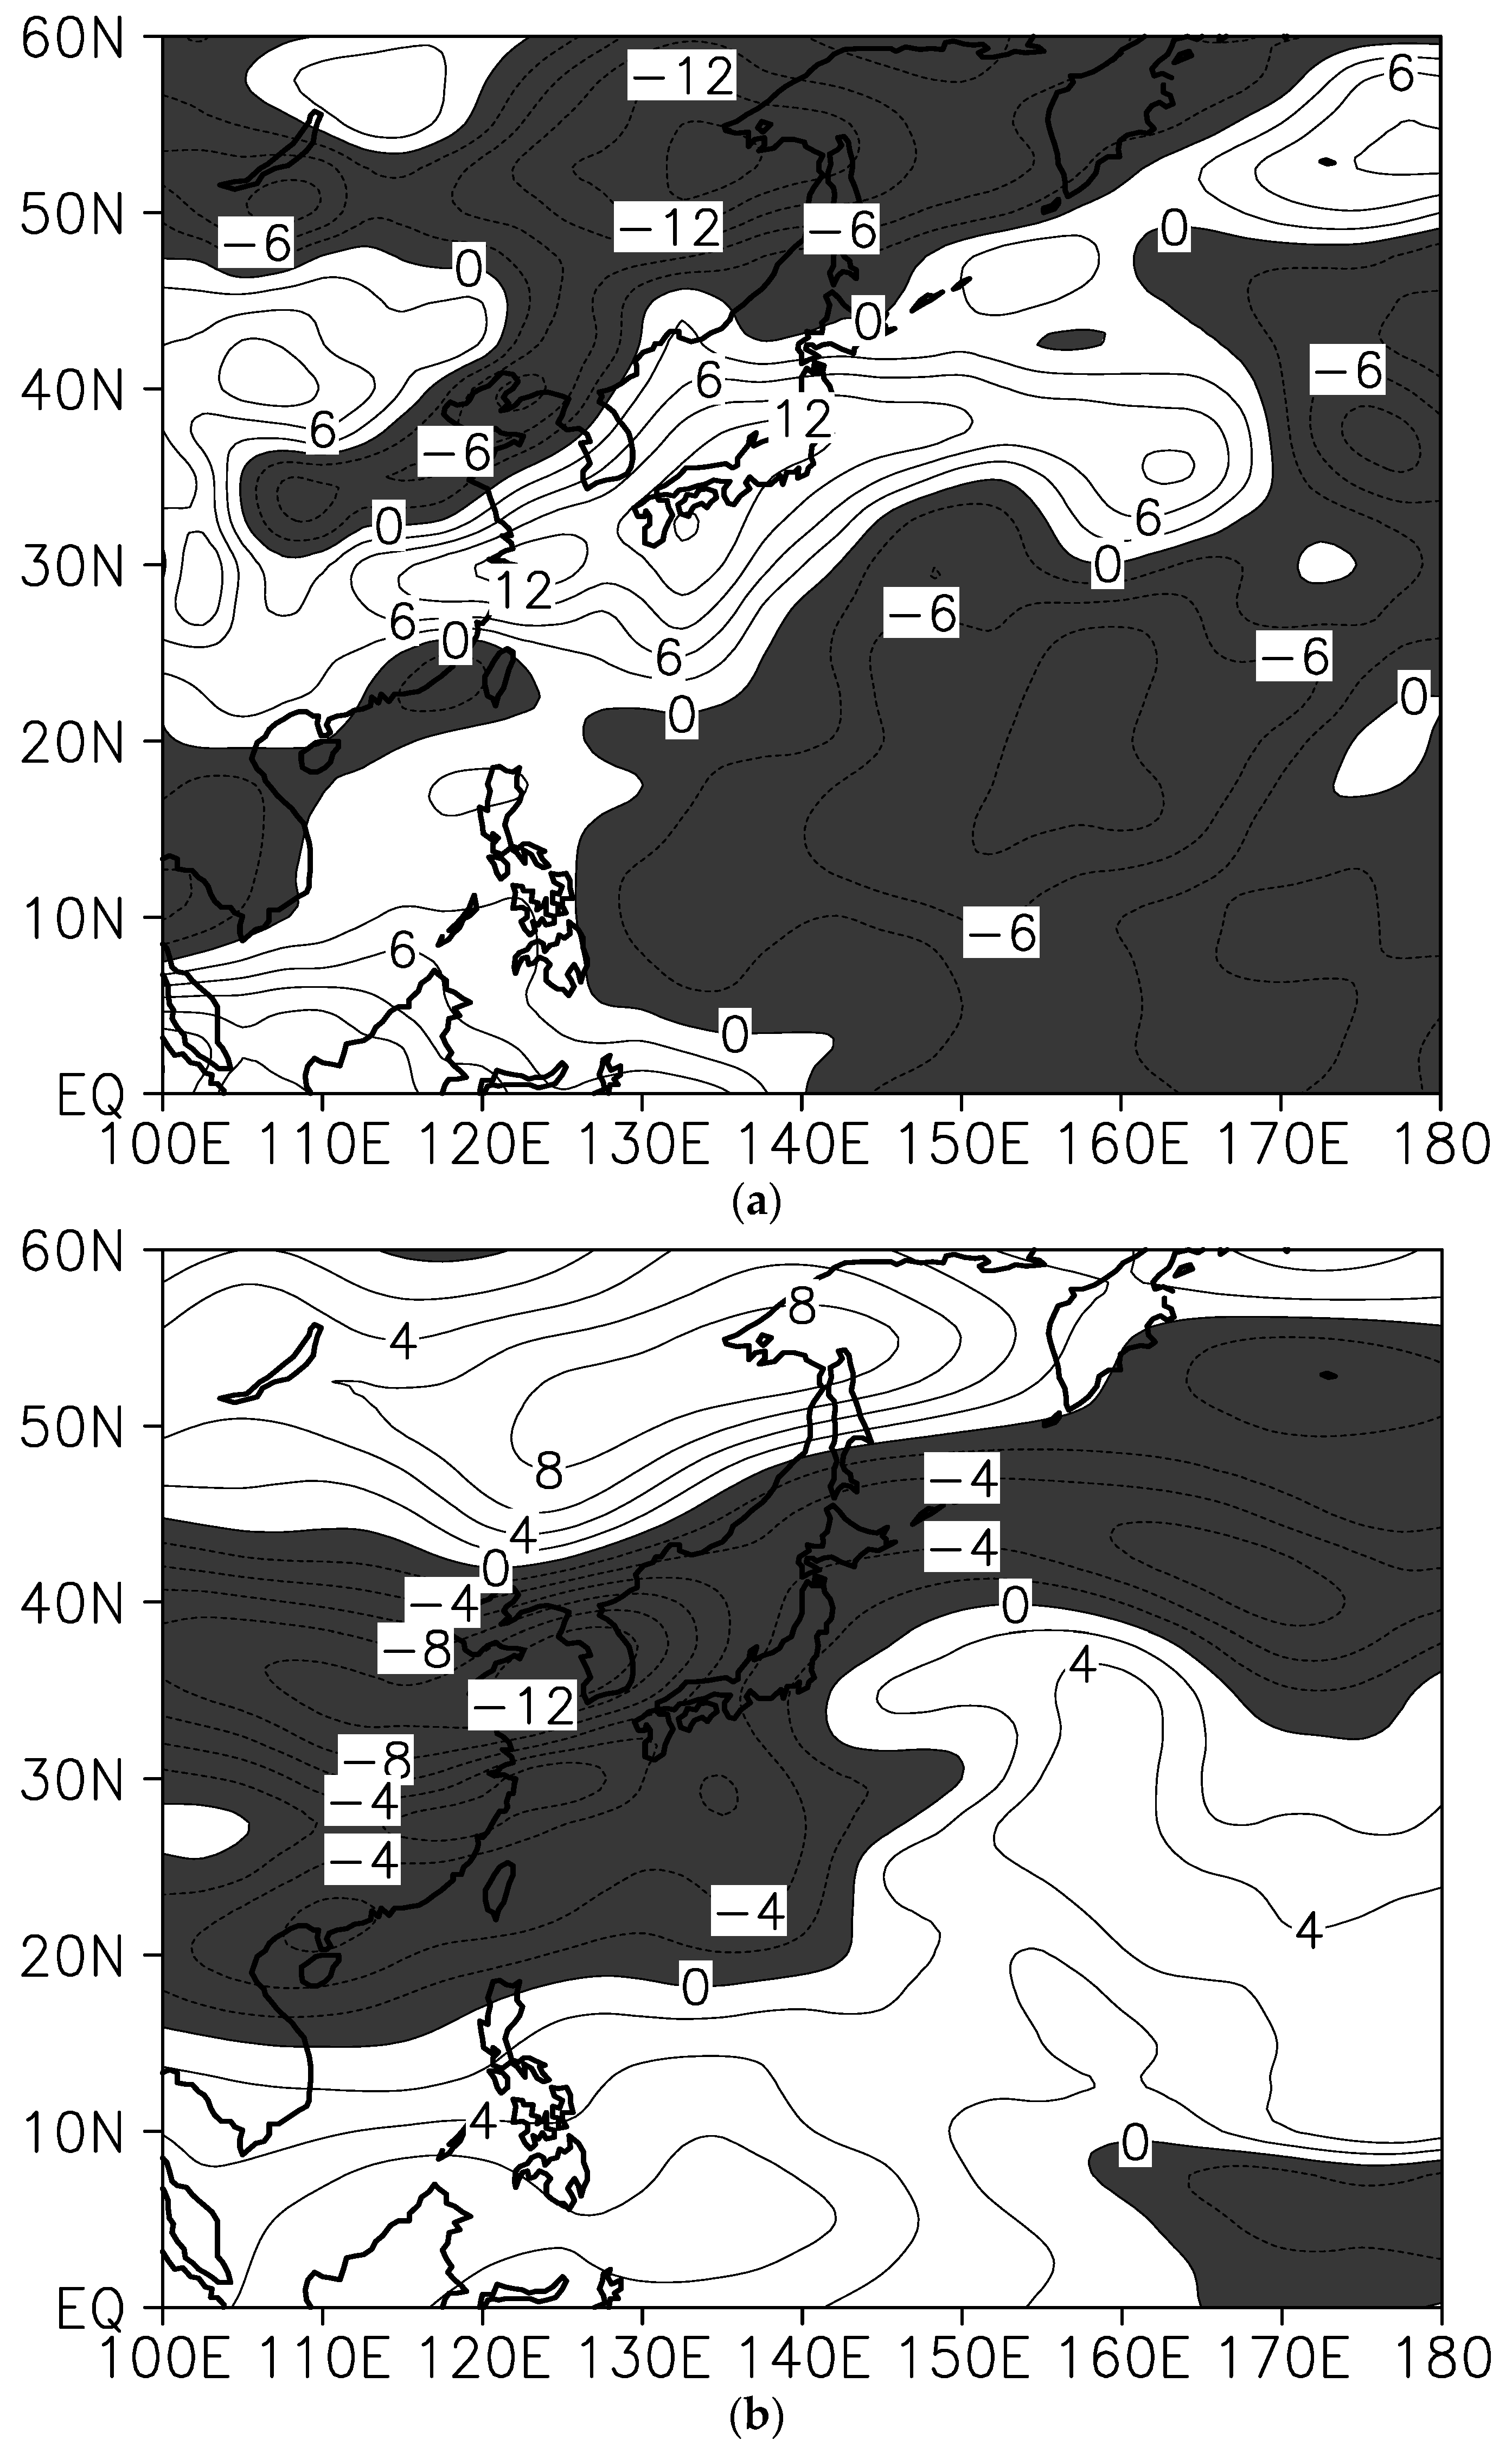
Regarding atmospheric conditions in the lower troposphere, anomalies during August 2014 were analyzed (Figure 9). Regarding the 850 hPa specific humidity and 850 hPa air temperature, many regions in the tropical and subtropical western North Pacific exhibited negative anomalies. This shows that many regions in the tropical and subtropical western North Pacific in the lower troposphere were relatively cold and dry. These atmospheric conditions indicate an unfavorable environment for the occurrence of TCs. On the other hand, positive anomalies were observed from east to west, ranging from China’s central region and the East China Sea to the Japanese Islands.
For the occurrence of TCs, the conditions of relative humidity in the mid-troposphere are also important. Therefore, anomalies for August 2014 were analyzed regarding the 600 hPa relative humidity (Figure 10a). Most regions in the tropical and subtropical western North Pacific exhibited negative anomalies. This indicates an unfavorable environment for the occurrence of TCs. On the other hand, positive anomalies were found in the area ranging from China’s central region and the East China Sea to the Japanese Islands.
For the occurrence of TCs, the conditions of vertical wind shear (VWS) between 200 hPa and 850 hPa are also important. A higher value in this variable indicates a larger difference in wind direction between the upper and lower troposphere. This leads to unstable TC structures which are unfavorable for TC genesis and TC development. Therefore, anomalies for August 2014 were analyzed regarding the VWS between 200 hPa and 850 hPa (Figure 10b). Most regions in the tropical and subtropical western North Pacific showed positive anomalies, and thus, atmospheric structures that suppress the occurrence of TCs were formed. On the other hand, negative anomalies were shown in the mid-latitudes of East Asia.
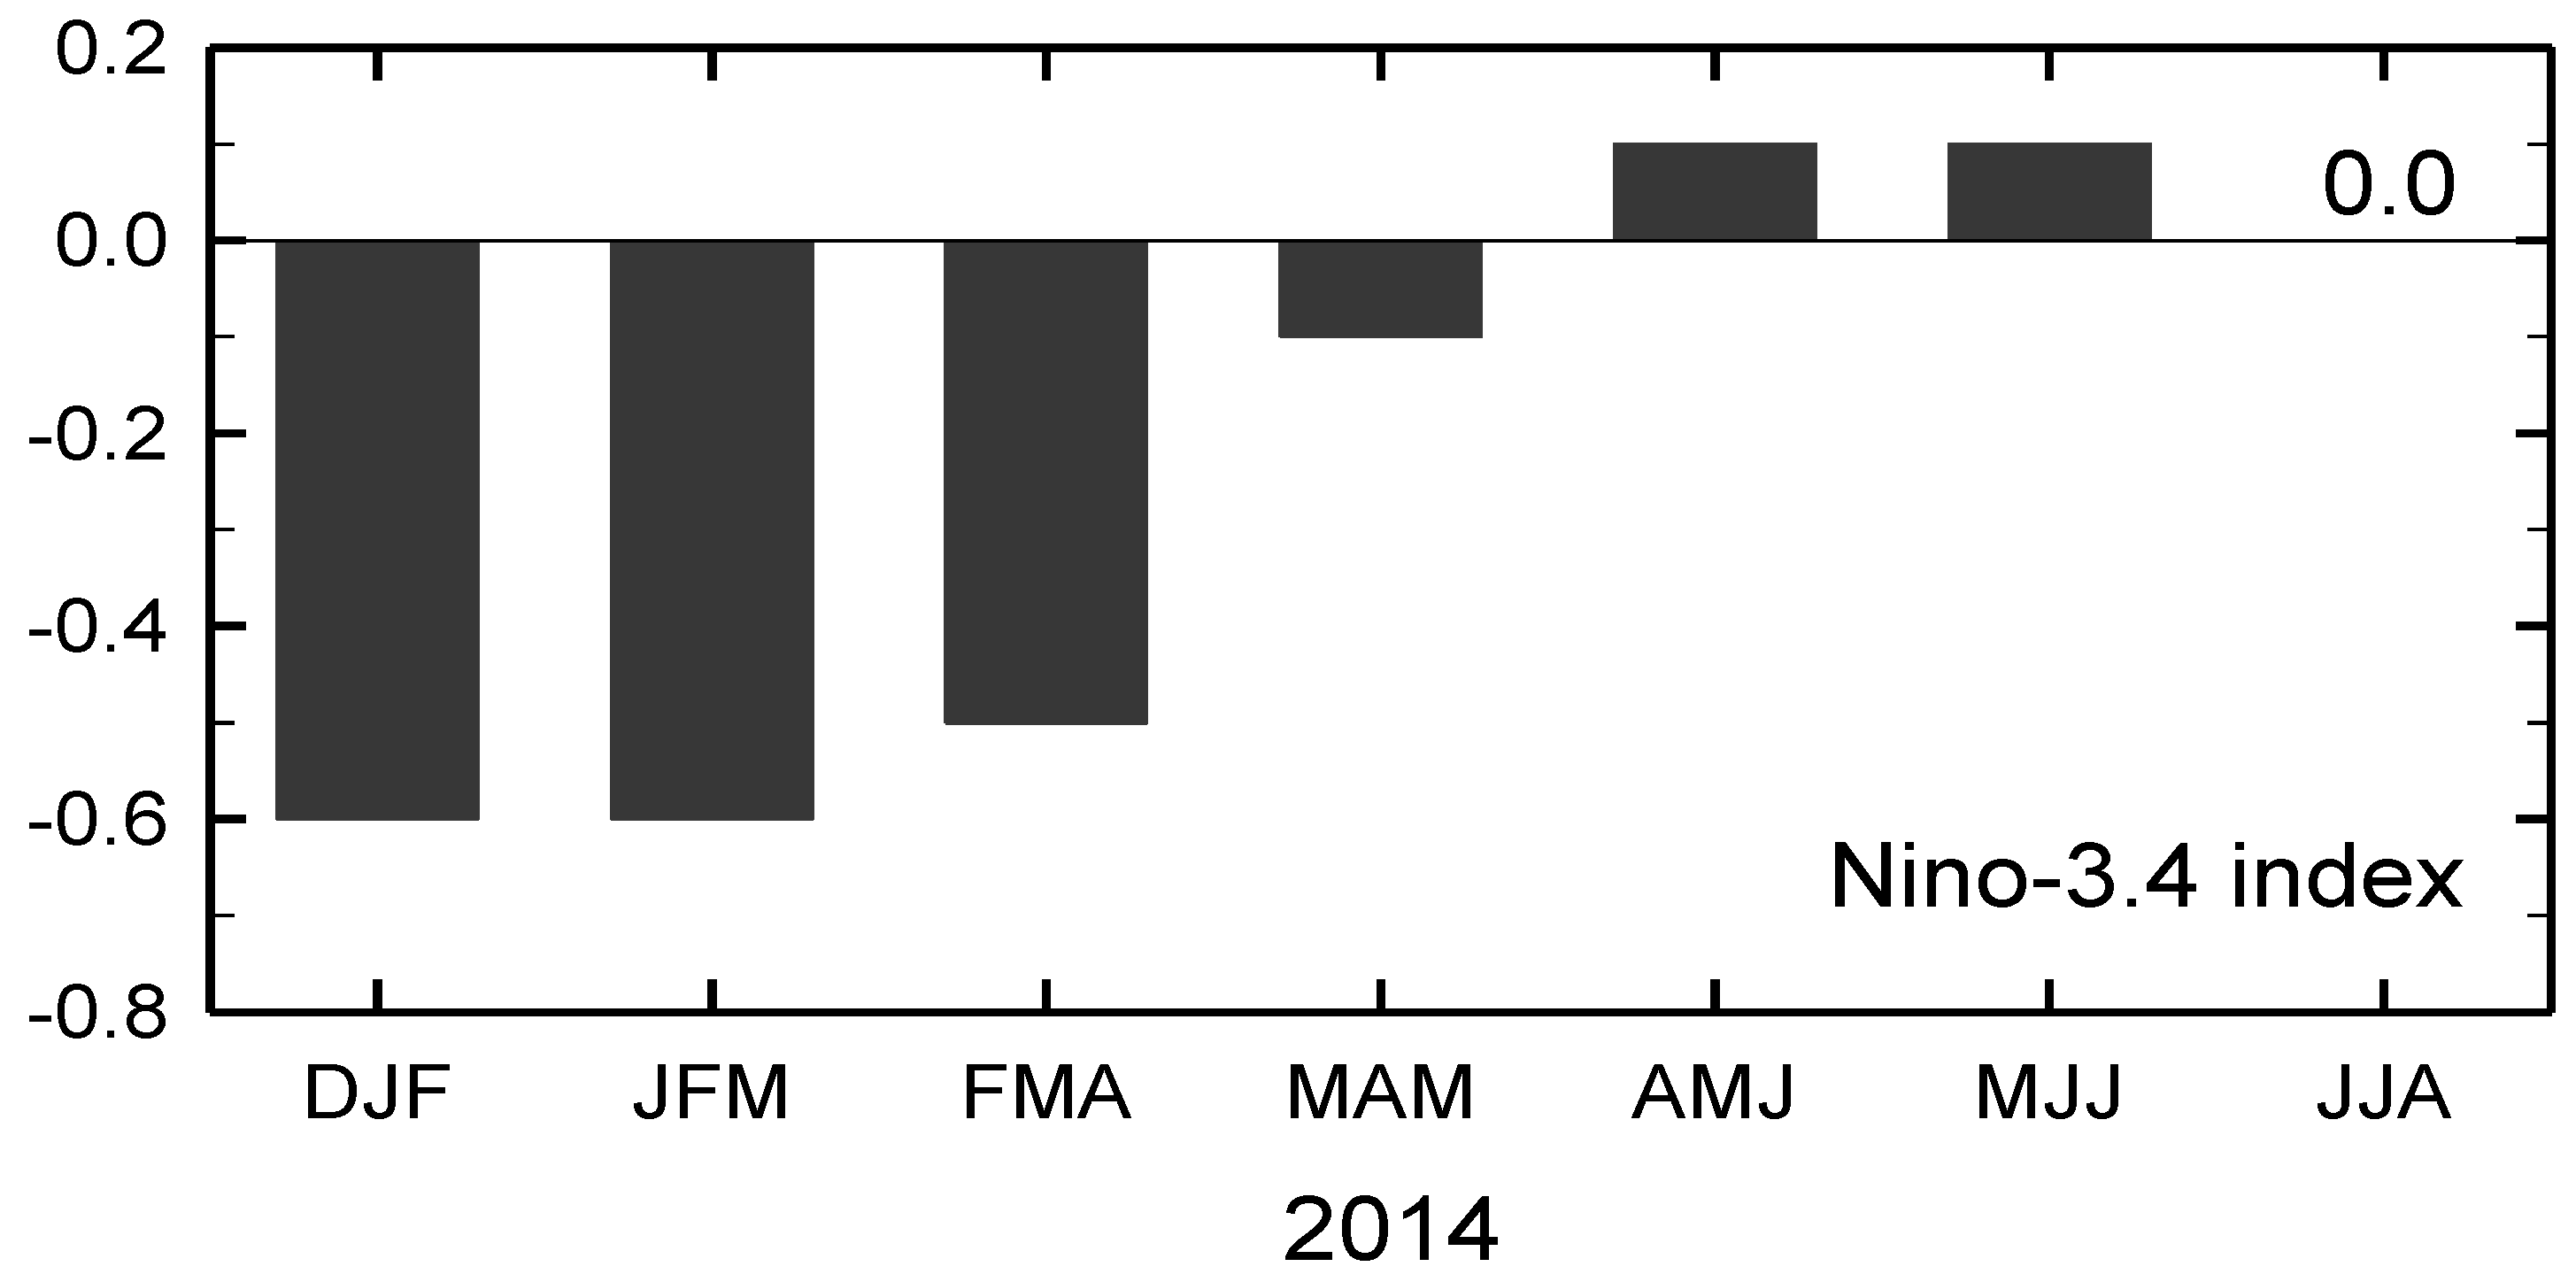
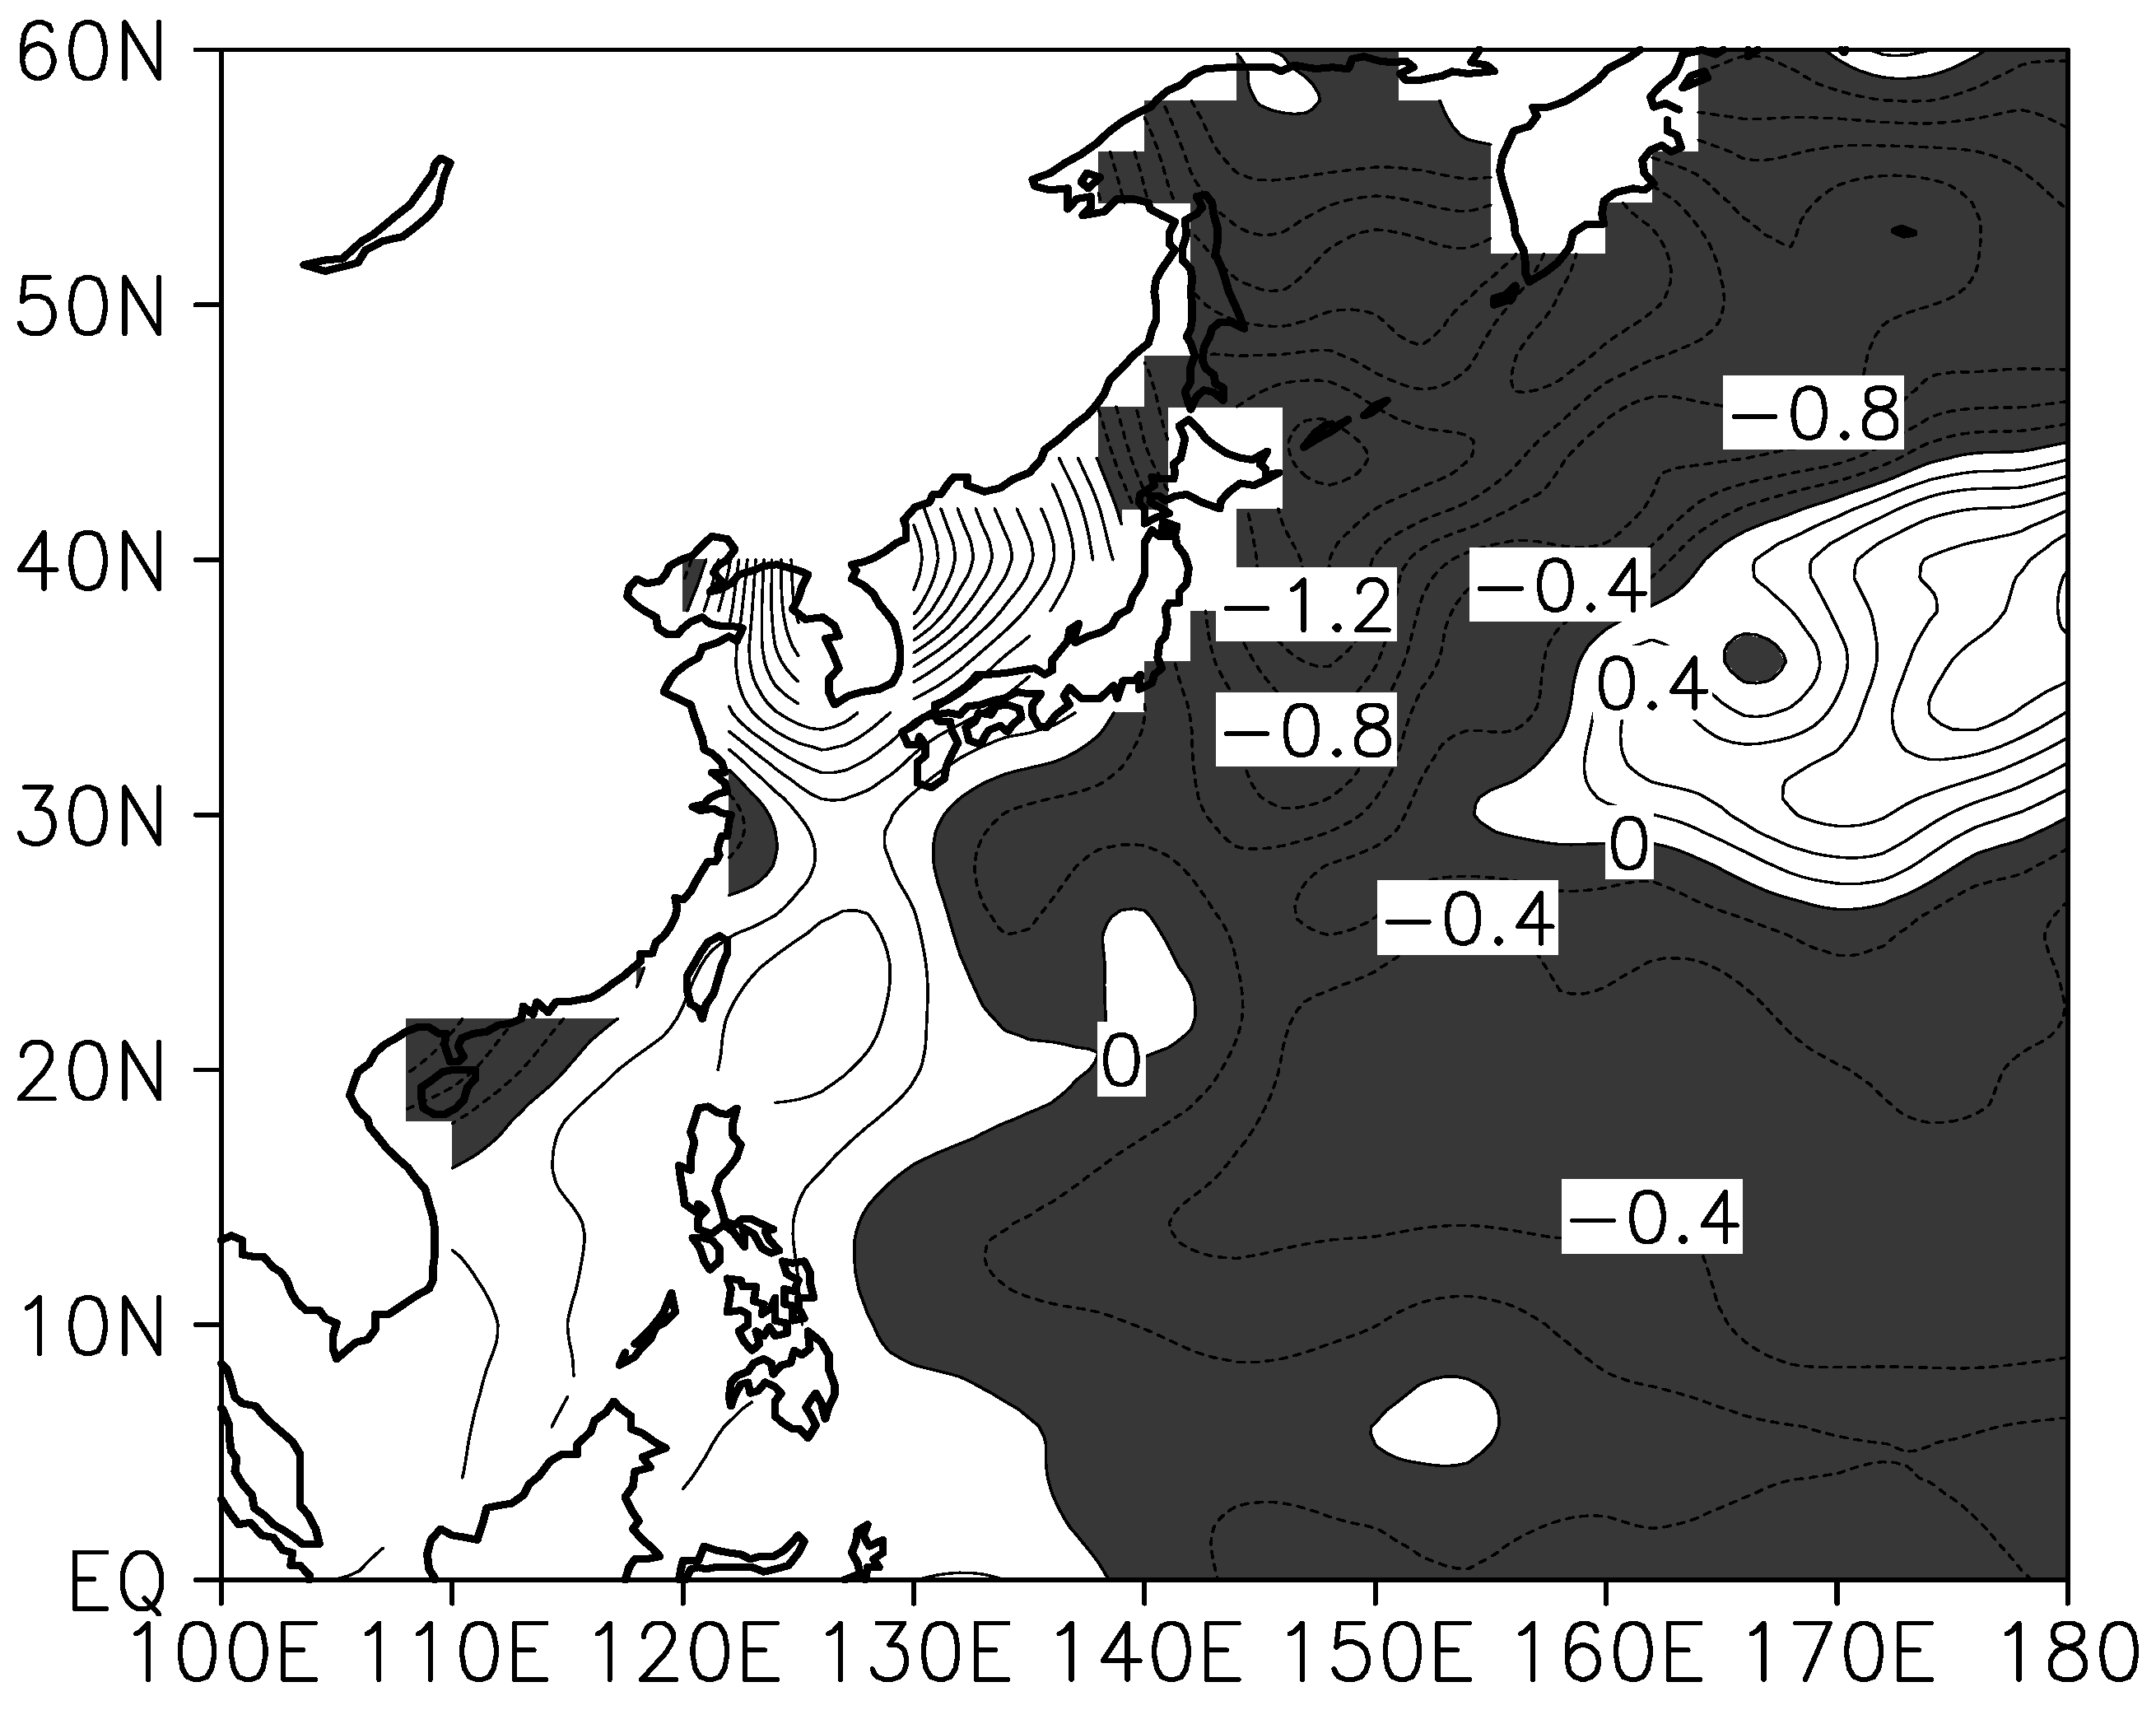
SSTs are also an important factor in the occurrence of TCs. Therefore, the Niño-3.4 index during 2014 was examined (Figure 11). During the winter and spring of 2014, La Niña conditions were exhibited. However, during the summer of the same year, positive index values were shown although El Niño conditions were not formed. Consequently, the analysis of anomalies for August 2014 regarding the SST confirmed that most coastal areas except the South China Sea showed cold anomalies (Figure 12). This SST condition caused difficulties in the occurrence of TCs. Actually, local SSTs are not an important predictor of TC genesis over the Northwest Pacific basin. A recent study by Mei et al. [32] of both observed and simulated TC genesis suggests that SSTs over the off-equatorial tropical central North Pacific largely determine TC genesis frequency in this basin; it is achieved by modulating large-scale atmospheric circulation (such as low-level vorticity).

5. Summary and Conclusions

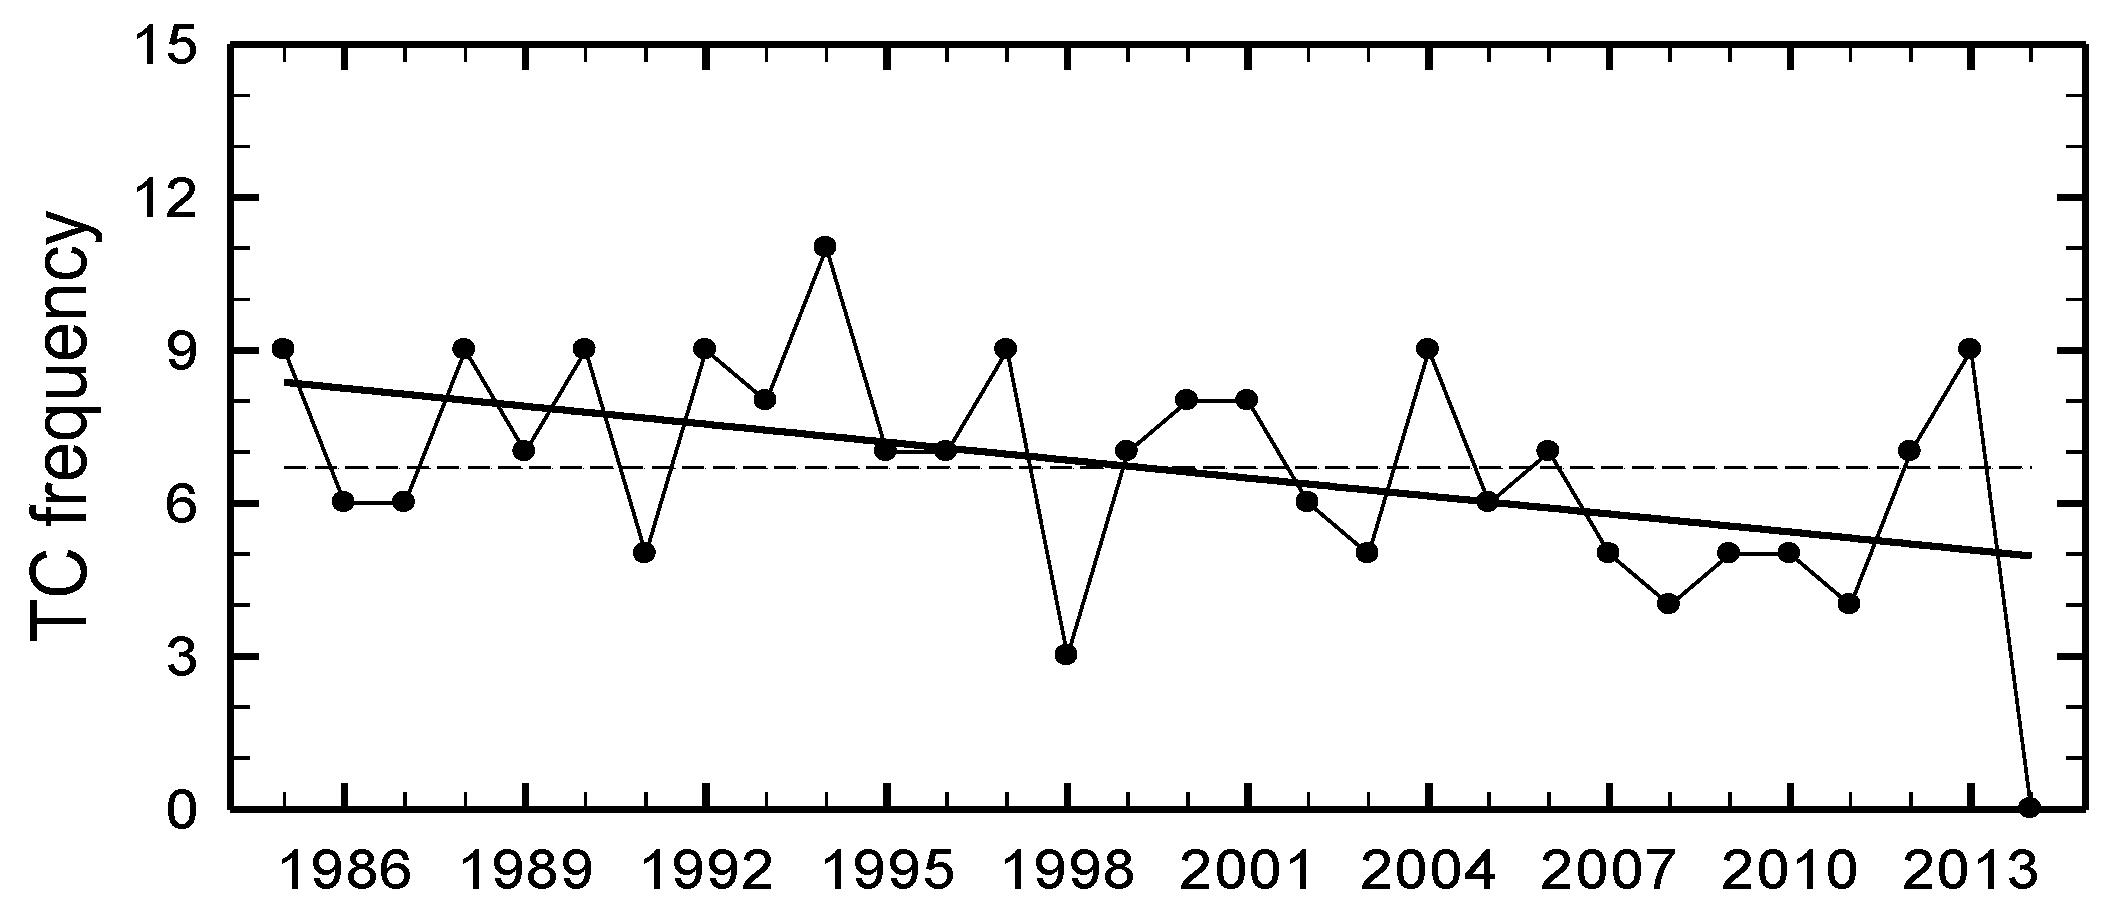
This study examined the causes of the nonoccurrence of TCs in August 2014 based on large-scale environments. First, TC genesis frequencies in August over the recent 30-year period showed an overall statistically significant decreasing trend. The OLR anomaly index also exhibited an increasing trend in the tropical and subtropical western Pacific until recently.
Regarding precipitable water and precipitation, differences between the mean for August 2014 and the mean for August over the previous 30 years were analyzed. The results showed that while convective activities were suppressed in the tropical and subtropical western Pacific, convective activities were strong in the mid-latitudes of East Asia. This indicates that during August 2014, the western North Pacific summer monsoon was weakened, whereas the East Asian summer monsoon was intensified, and therefore, TCs could not occur due to the weakening of the western North Pacific summer monsoon.
In the analysis of 850 hPa and 500 hPa stream flows, while anomalous huge anticyclonic circulations were intensified in the tropical subtropical western Pacific, anomalously cyclonic circulations were strengthened in the mid-latitudes of East Asia. Therefore, the occurrence of TCs was difficult in the tropical and subtropical western Pacific. On the other hand, anomalous cold northerlies and anomalous warm southerlies converged in the Japanese Islands after passing China’s central region and the East China Sea, thereby creating a favorable environment for the occurrence of precipitation. This is associated with the result that the WNPSH showed further westward and southward expansion in August 2014 compared to the climatological mean WNPSH. This subsequently resulted in the substantial weakening of anomalous monsoon troughs in August 2014.
The WNPSH developed in the tropical and subtropical western Pacific was confirmed by analyzing differences between the mean atmospheric conditions for August 1984 and the climatological mean for August in vertical meridional circulation, vertical air temperature, and vertical specific humidity by averaging the values for the longitudinal zone 100°E–180°E where most TCs occur. In the latitudinal zone (0°–25°) where TCs mainly occur, anomalous cold and dry atmospheric conditions were exhibited along with anomalous downward flows. On the other hand, in the latitudinal zone (25°N–40°N) of the mid-latitudes of East Asia, anomalous warm and humid atmospheric conditions were observed along with anomalous upward flows. This indicated that during August 2014, the western North Pacific summer monsoon was weakened, whereas the East Asian summer monsoon was strengthened.
In the 850 hPa relative vorticity, clockwise circulations were intensified in the tropical and subtropical western Pacific. Regarding the 850 hPa specific humidity, air temperature, and 600 hPa relative humidity, anomalous cold and dry atmospheric conditions were shown in this region. In the analysis of 200–850 hPa VWS, while positive anomalies were shown in the tropical and subtropical western Pacific, negative anomalies were exhibited in the mid-latitudes of East Asia. The analysis of SSTs showed that in most coastal areas of the western North Pacific, anomalous cold SSTs were strengthened. Consequently, during August 2014, unfavorable atmospheric circulations and environment conditions were formed for the occurrence of TCs.

Acknowledgments

This work was supported by the R&D Project of the Korea Meteorological Administration “Development and application of technology for weather forecast”.

Author Contributions

Jae-Won Choi designed and carried out the study and wrote the paper. Yumi Cha provided detailed information on East Asian meteorological data. Jeoung-Yun Kim acquired and processed the data of Yumi Cha. Jae-Won Choi, Yumi Cha, and Jeoung-Yun Kim contributed extensively to the scientific discussion. All authors read and approved the final manuscript.

Conflicts of Interest

The authors declare no conflict of interest.

Abbreviations

The following abbreviations are used in this manuscript:
ENSOEl Niño-Southern Oscillation
AAOAntarctic Oscillation
AOArctic Oscillation
NPONorth Pacific Oscillation
TCTropical Cyclone
SSTSea Surface Temperature
QBOQuasi-Biennial Oscillation
RSMCRegional Specialized Meteorological Center
MSWSMaximum Sustained Wind Speed
TDTropical Depression
TSTropical Storm
STSSevere Tropical Storm
TYTyphoon
NCEP-NCARNational Centers for Environmental Prediction-National Center for Atmospheric Research
CPCClimate Prediction Center
CMAPClimate Prediction Center (CPC) Merged Analysis of Precipitation
VWSVertical Wind Shear
OLROutgoing Longwave Radiation
ESRLEarth System Research Laboratory
NOAANational Oceanic and Atmospheric Administration
WNPMIWestern North Pacific Monsoon Index
EASMIEast Asian Summer Monsoon Index
DNSDynamical Normalized Seasonality
WNPSHWestern North Pacific Subtropical High

References

  1. Atkinson, G.D. Forecasters Guide to Tropical Meteorology; Air Weather Service (Military Airlift Command (MAC)): St. Clair County, IL, USA, 1977. [Google Scholar]
  2. Gray, W.M. Tropical Cyclone Genesis; Colorado State University: Fort Collins, CO, USA, 1975. [Google Scholar]
  3. Gray, W.M. Hurricanes: Their formation, structure and likely role in the tropical circulation. In Meteorology over the Tropical Oceans; Shaw, D.B., Ed.; Royal Meteorological Society: Berkshire, UK, 1979; pp. 155–218. [Google Scholar]
  4. Emanuel, K.A.; Nolan, D.S. Tropical cyclone activity and global climate. In Proceedings of the 26th Conference on Hurricanes and Tropical Meteorology, Miami, FL, USA, 2–7 May 2004; pp. 240–241.
  5. Chan, J.C.L. Tropical cyclone activity in the northwest Pacific in relation to the El Niño/Southern Oscillation phenomenon. Mon. Weather Rev. 1985, 113, 599–606. [Google Scholar] [CrossRef]
  6. Ramage, C.S.; Hori, A.M. Meteorological aspects of El Niño. Mon. Weather Rev. 1981, 109, 1827–1835. [Google Scholar] [CrossRef]
  7. Ho, C.H.; Kim, J.H.; Kim, H.S.; Sui, C.H.; Gong, D.Y. Possible influence of the Antarctic Oscillation on tropical cyclone activity in the western North Pacific. J. Geophys. Res. 2005, 110. [Google Scholar] [CrossRef]
  8. Choi, K.S.; Kim, B.J.; Kim, D.W.; Byun, H.R. Interdecadal variation of tropical cyclone making landfall over the Korean Peninsula. Int. J. Climatol. 2010, 30, 1472–1483. [Google Scholar] [CrossRef]
  9. Dong, K. El Niño and tropical cyclone frequency in the Australian region and the Northwest Pacific. Aust. Meteorol. Mag. 1988, 36, 219–255. [Google Scholar]
  10. Lander, M.A. An exploratory analysis of the relationship between tropical storm formation in the western North Pacific and ENSO. Mon. Weather Rev. 1994, 122, 636–651. [Google Scholar] [CrossRef]
  11. McBride, J.L. Tropical Cyclone Formation. Global Perspective on Tropical Cyclones; WMO Tech. Doc. 693; World Meteorological Organization: Geneva, Switzerland, 1995; pp. 63–105. [Google Scholar]
  12. Chen, T.C.; Weng, S.P.; Yamazaki, N.; Kiehne, S. Interannual variation in the tropical cyclone formation over the western North Pacific. Mon. Weather Rev. 1998, 126, 1080–1090. [Google Scholar] [CrossRef]
  13. Chan, J.C.L. Tropical cyclone activity over the western North Pacific associated with El Niño and La Niña events. J. Clim. 2000, 13, 2960–2927. [Google Scholar] [CrossRef]
  14. Gray, W.M.; Sheaffer, J.D.; Knaff, J.A. Influence of stratospheric QBO on ENSO variability. J. Meteorol. Soc. Jpn. 1992, 70, 975–994. [Google Scholar]
  15. Zhang, G.; Zhang, X.; Wei, F. A study on the variations of annual frequency of tropical cyclone in northwest Pacific during the last hundred years. J. Trop. Meteorol. 1994, 11, 315–323. [Google Scholar]
  16. Chan, J.C.L.; Shi, J.E. Long-term trends and interannual variability in tropical cyclone activity over the western North Pacific. Geophys. Res. Lett. 1996, 23, 2765–2767. [Google Scholar] [CrossRef]
  17. Yumoto, M.; Matsuura, T. Interdecadal variability of tropical cyclone activity in the western North Pacific. J. Meteorol. Soc. Jpn. 2001, 79, 23–35. [Google Scholar] [CrossRef]
  18. Matsuura, T.; Yumoto, M.; Iizuka, S. A mechanism of interdecadal variability of tropical cyclone activity over the western North Pacific. Clim. Dyn. 2003, 21, 105–117. [Google Scholar] [CrossRef]
  19. Chan, J.C.L. Interannual and interdecadal variations of tropical cyclone activity over the western North Pacific. Meteorol. Atmos. Phys. 2005, 89, 143–152. [Google Scholar] [CrossRef]
  20. Chia, H.H.; Ropelewski, C.F. The interannual variability in the genesis location of tropical cyclones in the Northwest Pacific. J. Clim. 2002, 15, 2934–2944. [Google Scholar] [CrossRef]
  21. Nakazawa, T. Suppressed tropical cyclone formation over the western North Pacific in 1998. J. Meteorol. Soc. Jpn. 2001, 79, 173–183. [Google Scholar] [CrossRef]
  22. Kim, J.H.; Ho, C.H.; Choi, W.; Kim, H.S. 2010 western North Pacific typhoon season: Seasonal overview and forecast using track-pattern-based model. Weather Forecast. 2012, 27, 730–743. [Google Scholar] [CrossRef]
  23. Kalnay, E.; Kanamitsu, M.; Kistler, R.; Collins, W.; Deaven, D.; Gandin, L.; Iredell, M.; Saha, S.; White, G.; Woollen, J.; et al. The NCEP/NCAR 40-year reanalysis project. Bull. Am. Meteorol. Soc. 1996, 77, 437–471. [Google Scholar] [CrossRef]
  24. Kistler, R.; Kalnay, E.; Collins, W.; Woollen, J.; Chelliah, M.; Ebisuzaki, W.; Kanamitsau, M.; Kousky, V.; van den Dool, H.; Jenne, R.; et al. The NCEP–NCAR 50-year reanalysis: Monthly means CD-ROM and documentation. Bull. Am. Meteorol. Soc. 2001, 82, 247–267. [Google Scholar] [CrossRef]
  25. Reynolds, R.W.; Rayner, N.A.; Smith, T.M.; Stokes, D.C.; Wang, W. An improved in situ and satellite SST analysis for climate. J. Clim. 2002, 15, 1609–1625. [Google Scholar] [CrossRef]
  26. Xie, P.; Arkin, P.A. Global precipitation: A 17-year monthly analysis based on gauge observations, satellite estimates, and numerical model outputs. Bull. Am. Meteorol. Soc. 1997, 78, 2539–2558. [Google Scholar] [CrossRef]
  27. Wingo, M.T.; Cecil, D.J. Effects of vertical wind shear on tropical cyclone precipitation. Mon. Weather Rev. 2010, 138, 645–662. [Google Scholar] [CrossRef]
  28. Wang, B.; Fan, Z. Choice of South Asian summer monsoon indices. Bull. Am. Meteorol. Soc. 1999, 80, 629–638. [Google Scholar] [CrossRef]
  29. Li, J.P.; Zeng, Q.C. A unified monsoon index. Geophys. Res. Lett. 2002. [Google Scholar] [CrossRef]
  30. Li, J.P.; Zeng, Q.C. A new monsoon index and the geographical distribution of the global monsoons. Adv. Atmos. Sci. 2003, 20, 299–302. [Google Scholar]
  31. Li, J.P.; Zeng, Q.C. A new monsoon index, its interannual variability and relation with monsoon precipitation. Clim. Environ. Res. 2005, 10, 351–365. [Google Scholar]
  32. Mei, W.; Xie, S.P.; Zhao, M.; Wang, Y. Forced and internal variability of tropical cyclone track density in the western North Pacific. J. Clim. 2015, 28, 143–167. [Google Scholar] [CrossRef]
Figure 1. Time series of TC genesis frequency in August in the western North Pacific. Dashed and thick solid lines denote a climatological mean TC genesis frequency and trend, respectively.
Atmosphere 07 00133 g001
Figure 2. Differences in (a) precipitable water and (b) precipitation between 2014 and climatological mean in August. Contour intervals are 1 kg·m−2 and 1 mm·day−1. Shaded areas denote negative values.
Atmosphere 07 00133 g002
Figure 3. Time series of (a) TC genesis frequency and western North Pacific monsoon index (WNPMI); (b) TC genesis frequency and East Asian monsoon index (EAMI); and (c) WNPMI and EAMI.
Atmosphere 07 00133 g003
Figure 4. Differences in (a) 850 hPa and (b) 500 hPa stream flows between 2014 and climatological mean.
Atmosphere 07 00133 g004
Figure 5. Western North Pacific subtropical highs (WNPSHs) of 2014 (solid line) and climatological mean (dashed line) in August. Here, WNPSHs are defined as areas that are greater than 5875 gpm.
Atmosphere 07 00133 g005
Figure 6. 850 hPa stream flows of (a) climatological mean and (b) 2014 in August.
Atmosphere 07 00133 g006
Figure 7. Composite differences of latitude–pressure cross section of (a) vertical velocity (contours) and meridional circulations (vectors); (b) air temperature; and (c) specific humidity averaged along 100°E–180°E between 2014 and climatological mean in August. The values of vertical velocity are multiplied by −100. Shaded areas denote negative values. Contour intervals are 0.3−2 hPa·s−1 for vertical velocity, 0.1 °C for air temperature, and 0.2 g·kg−1 for specific humidity, respectively.
Atmosphere 07 00133 g007aAtmosphere 07 00133 g007b
Figure 8. Same as in Figure 4, but for 850 hPa relative vorticity. Contour interval is 20 × 10−6 s−1. Shaded areas denote negative values.
Atmosphere 07 00133 g008
Figure 9. Same as in Figure 4, but for (a) 850 hPa specific humidity and (b) 850 hPa air temperature. Contour intervals are 0.3 g·kg−1 for 850 hPa specific humidity and 0.3 °C for 850 hPa air temperature. Shaded areas denote negative values.
Atmosphere 07 00133 g009
Figure 10. Same as in Figure 4, but for (a) 600 hPa relative humidity and (b) 200–850 hPa vertical wind shear. Contour intervals are 3% for 600 hPa relative humidity and 2 ms−1 for 200–850 hPa vertical wind shear. Shaded areas denote negative values.
Atmosphere 07 00133 g010
Figure 11. Time series of Niño-3.4 index in 2014.
Atmosphere 07 00133 g011
Figure 12. Same as in Figure 4, but for sea surface temperature (SST). Contour interval is 0.2 °C. Shaded areas denote negative values.
Atmosphere 07 00133 g012

