
Analysis of the Error in Retrievals of Aerosol Optical Properties from Sunphotometer Measurements of CARSNET Due to a Variety of Objective Factors

 ,
,
Abstract
:1. Introduction
2. Data and Analysis Method
2.1. Instruments and Measurement Data

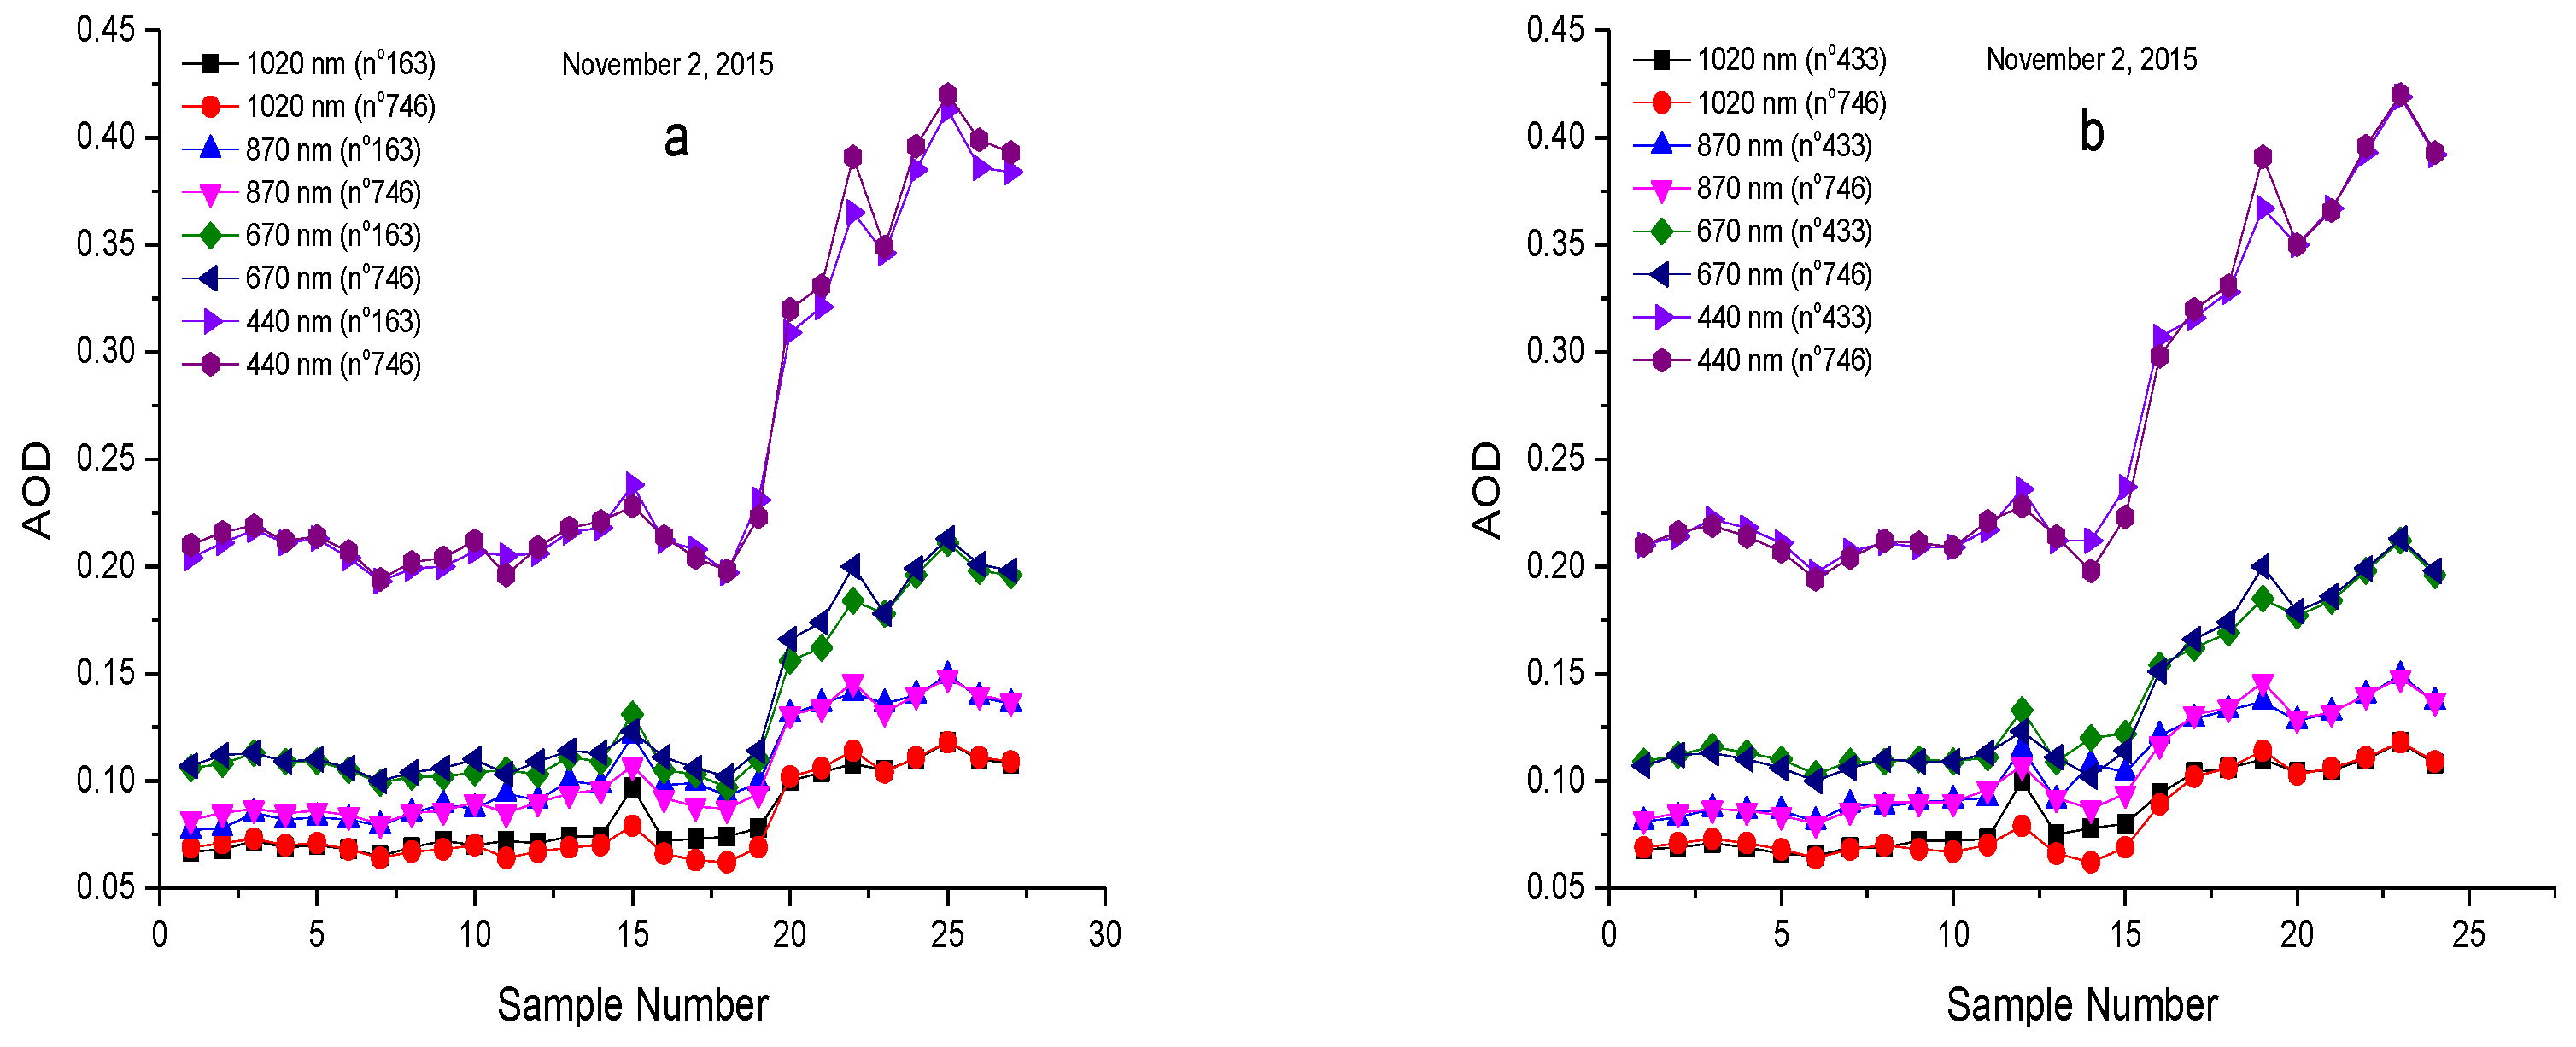
| Factors | Spider Web | Collimator Bending | Dust | Incrustation Scale | Dust and Incrustation Scale |
|---|---|---|---|---|---|
| Instrument number | n°163 | n°433 | n°433 | n°433 | n°433 |
| Observation period | 2 days | 3 days | 2 days | 2 days | 2 days |
| Raw data | 54 | 120 | 90 | 56 | 63 |
| Valid data | 15 | 49 | 25 | 19 | 11 |
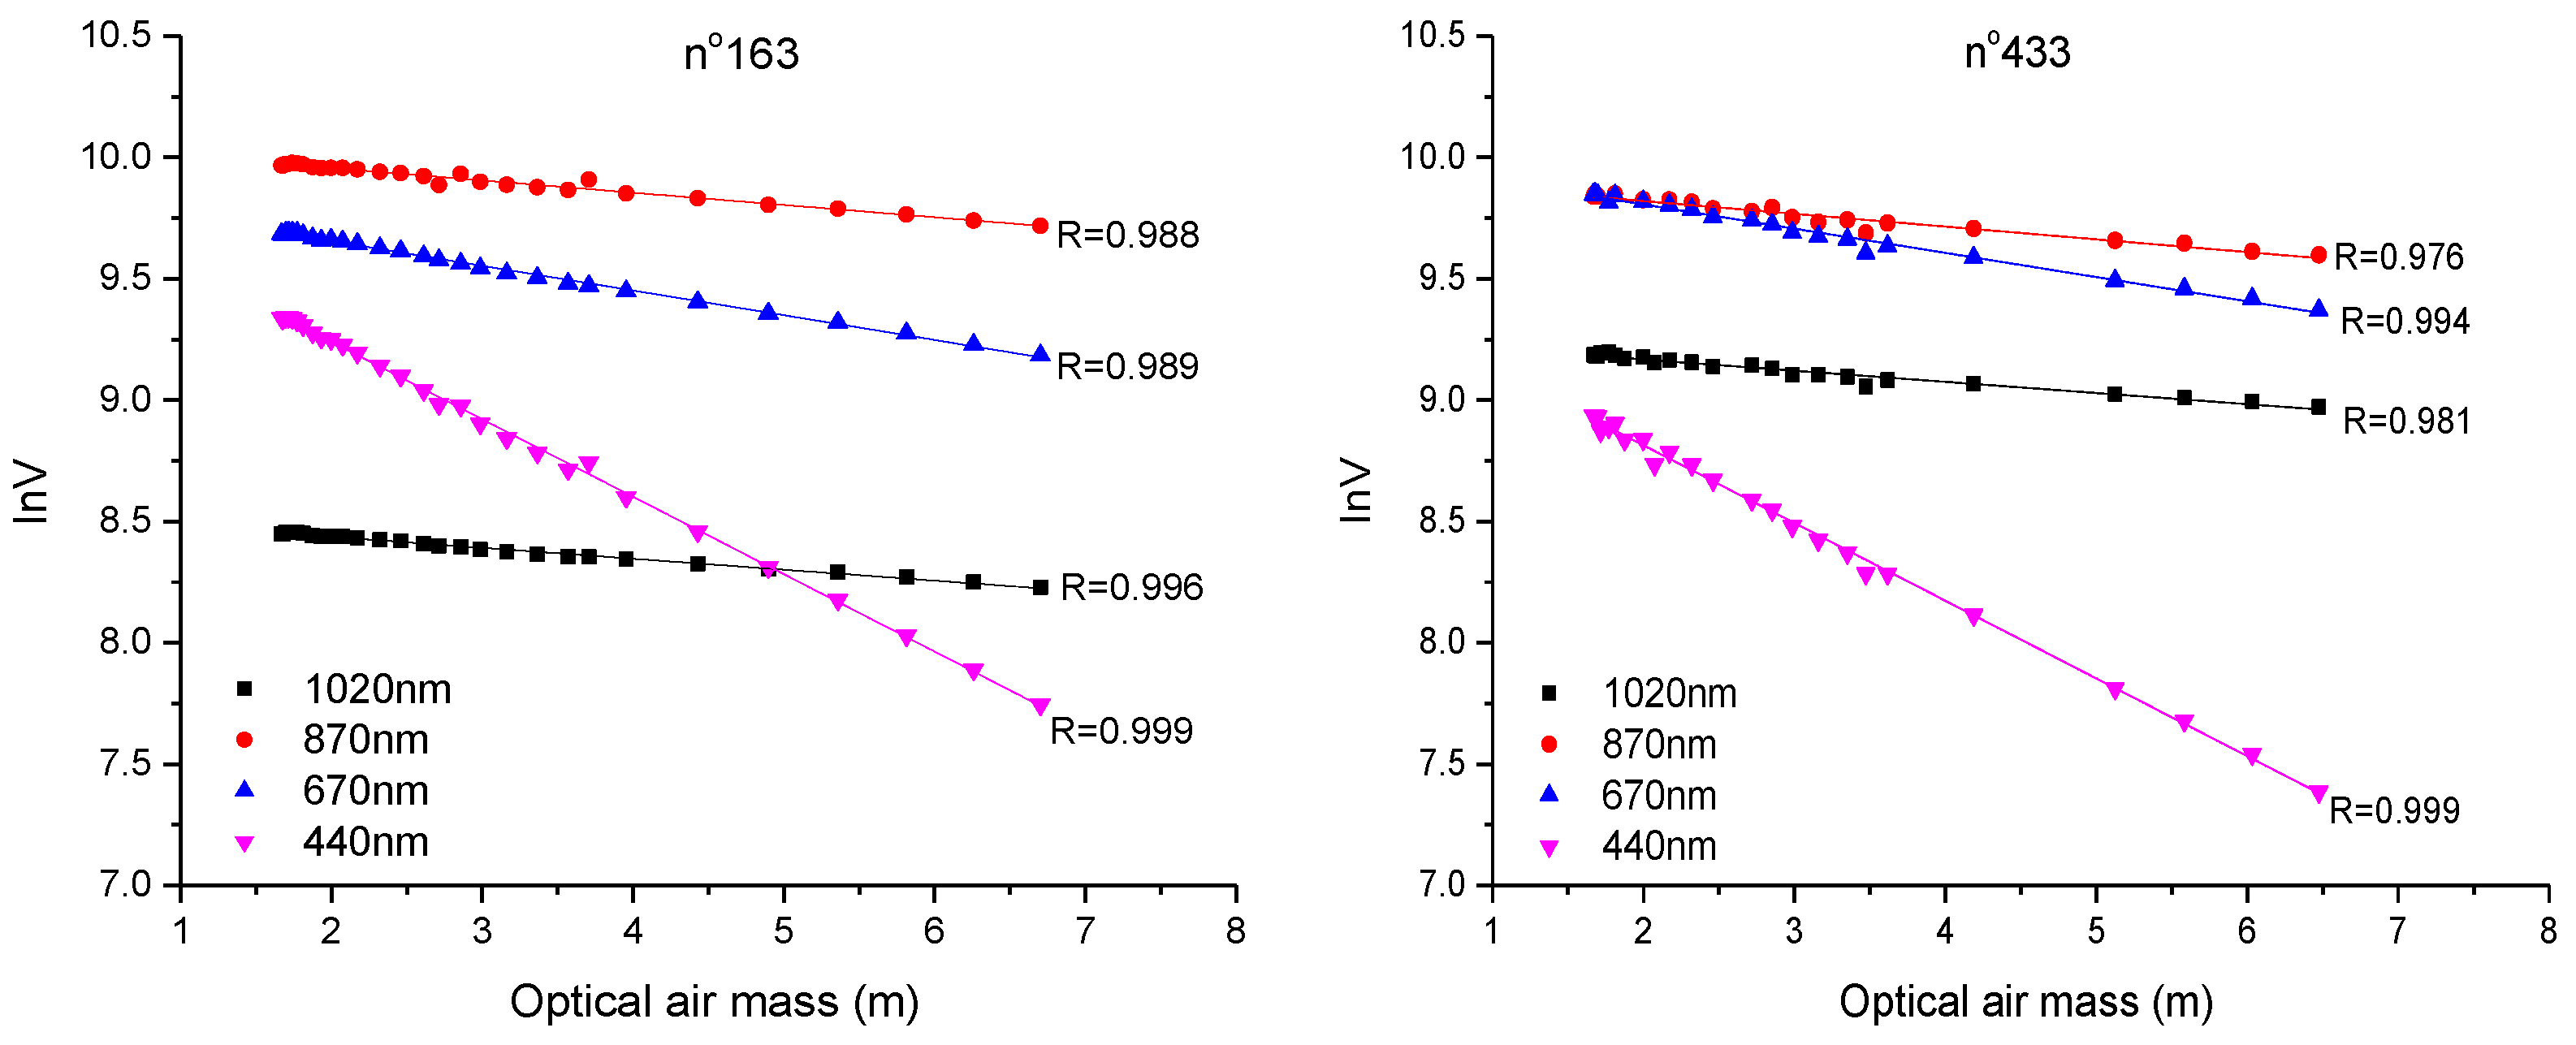
2.2. Calibration

2.3. Calculation of Aerosol Optical Properties
2.3.1. Aerosol Optical Depth
2.3.2. Ångström Exponent
2.4. Analysis Method
2.4.1. Relative Error Analysis Method of Aerosol Optical Depth
2.4.2. Relative Error Analysis Method of the Ångström Exponent
3. Results and Discussion
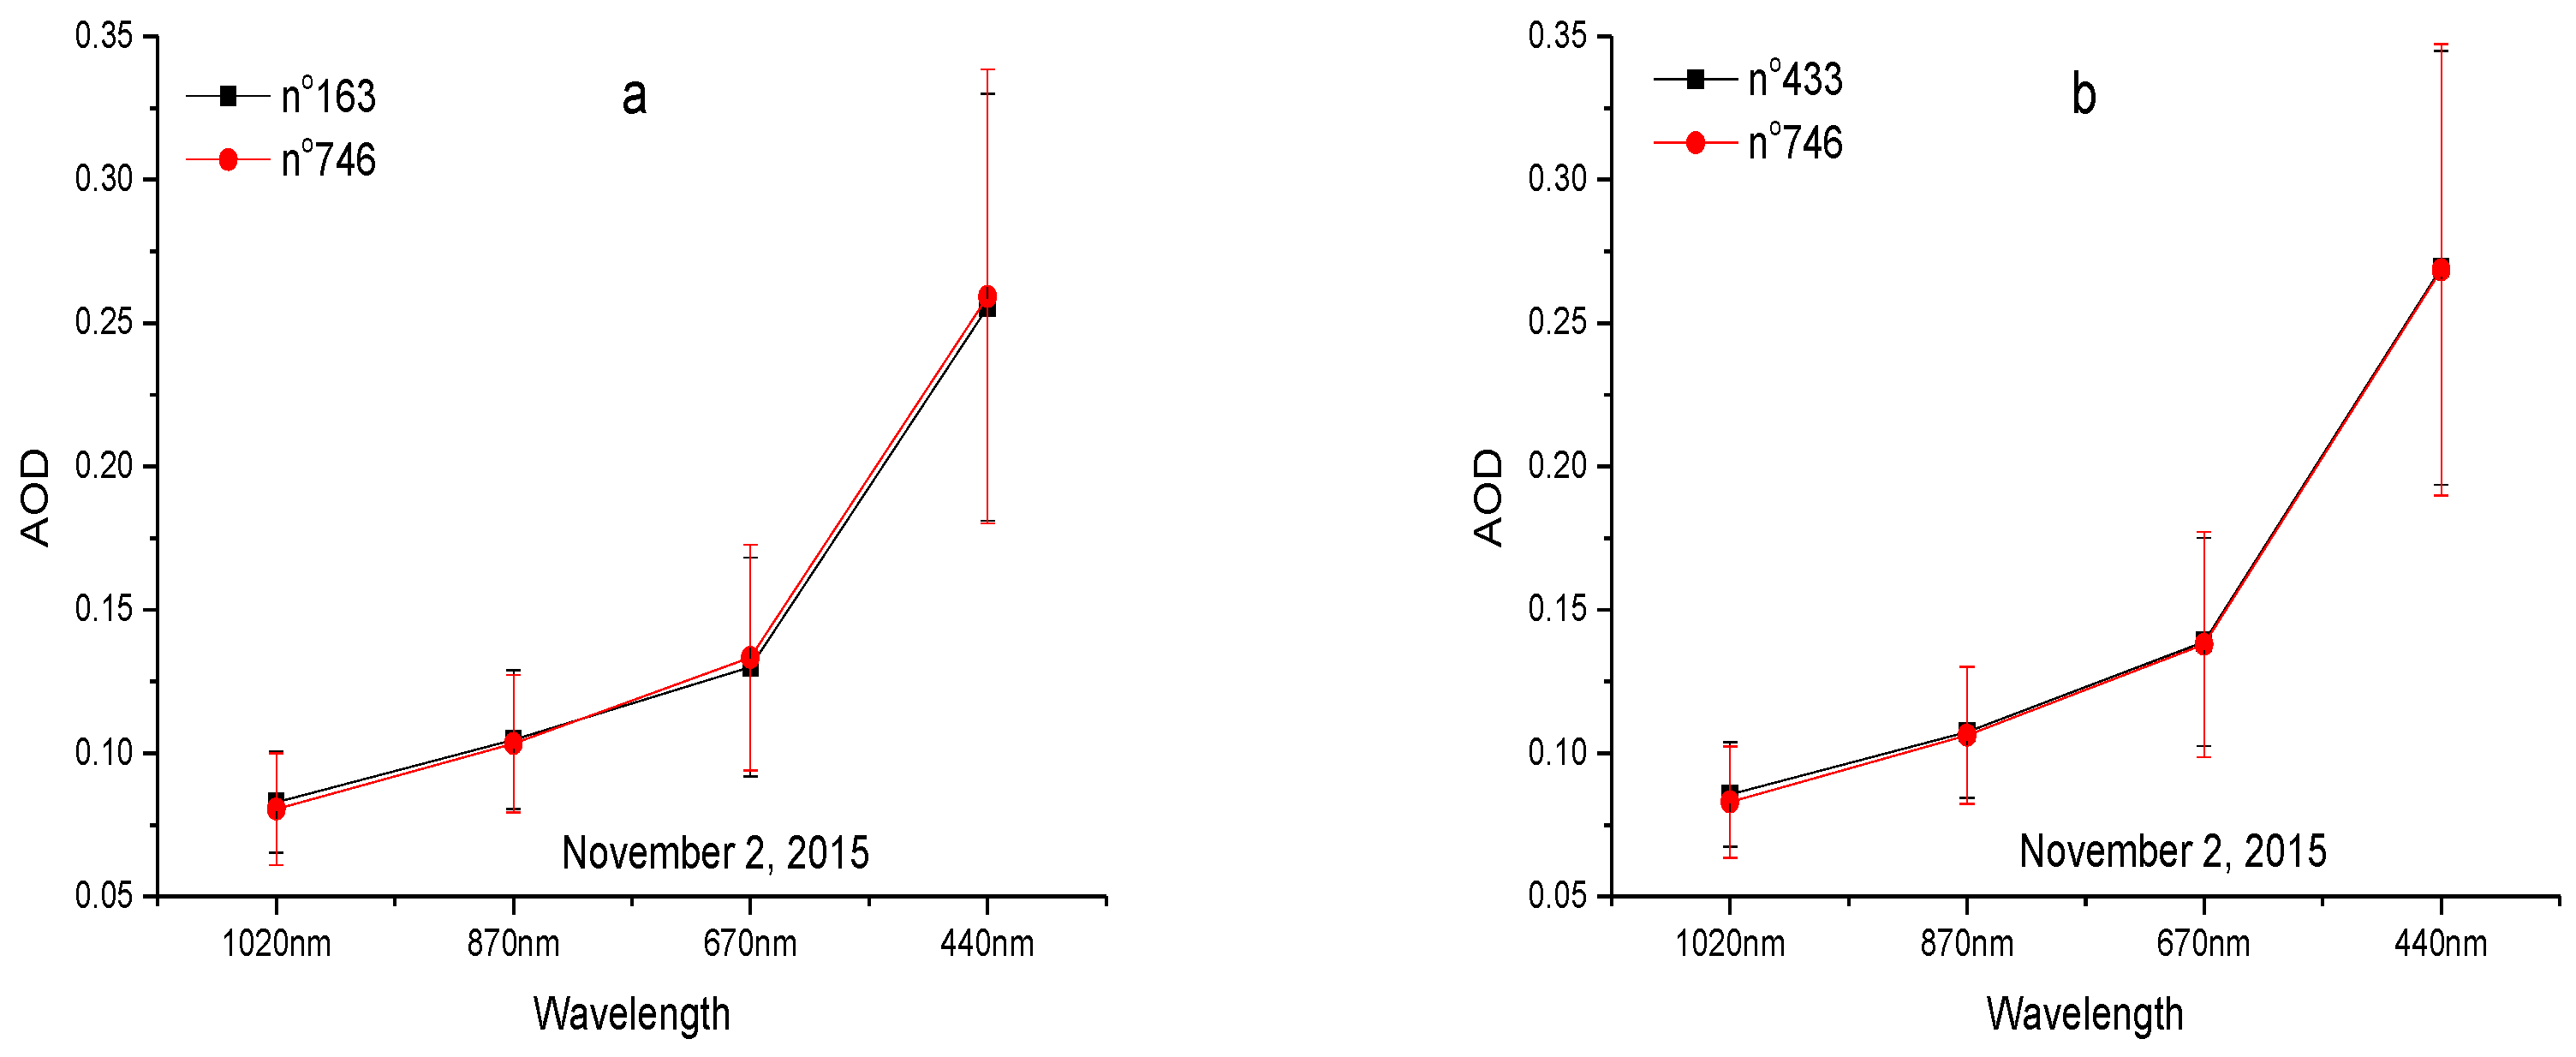
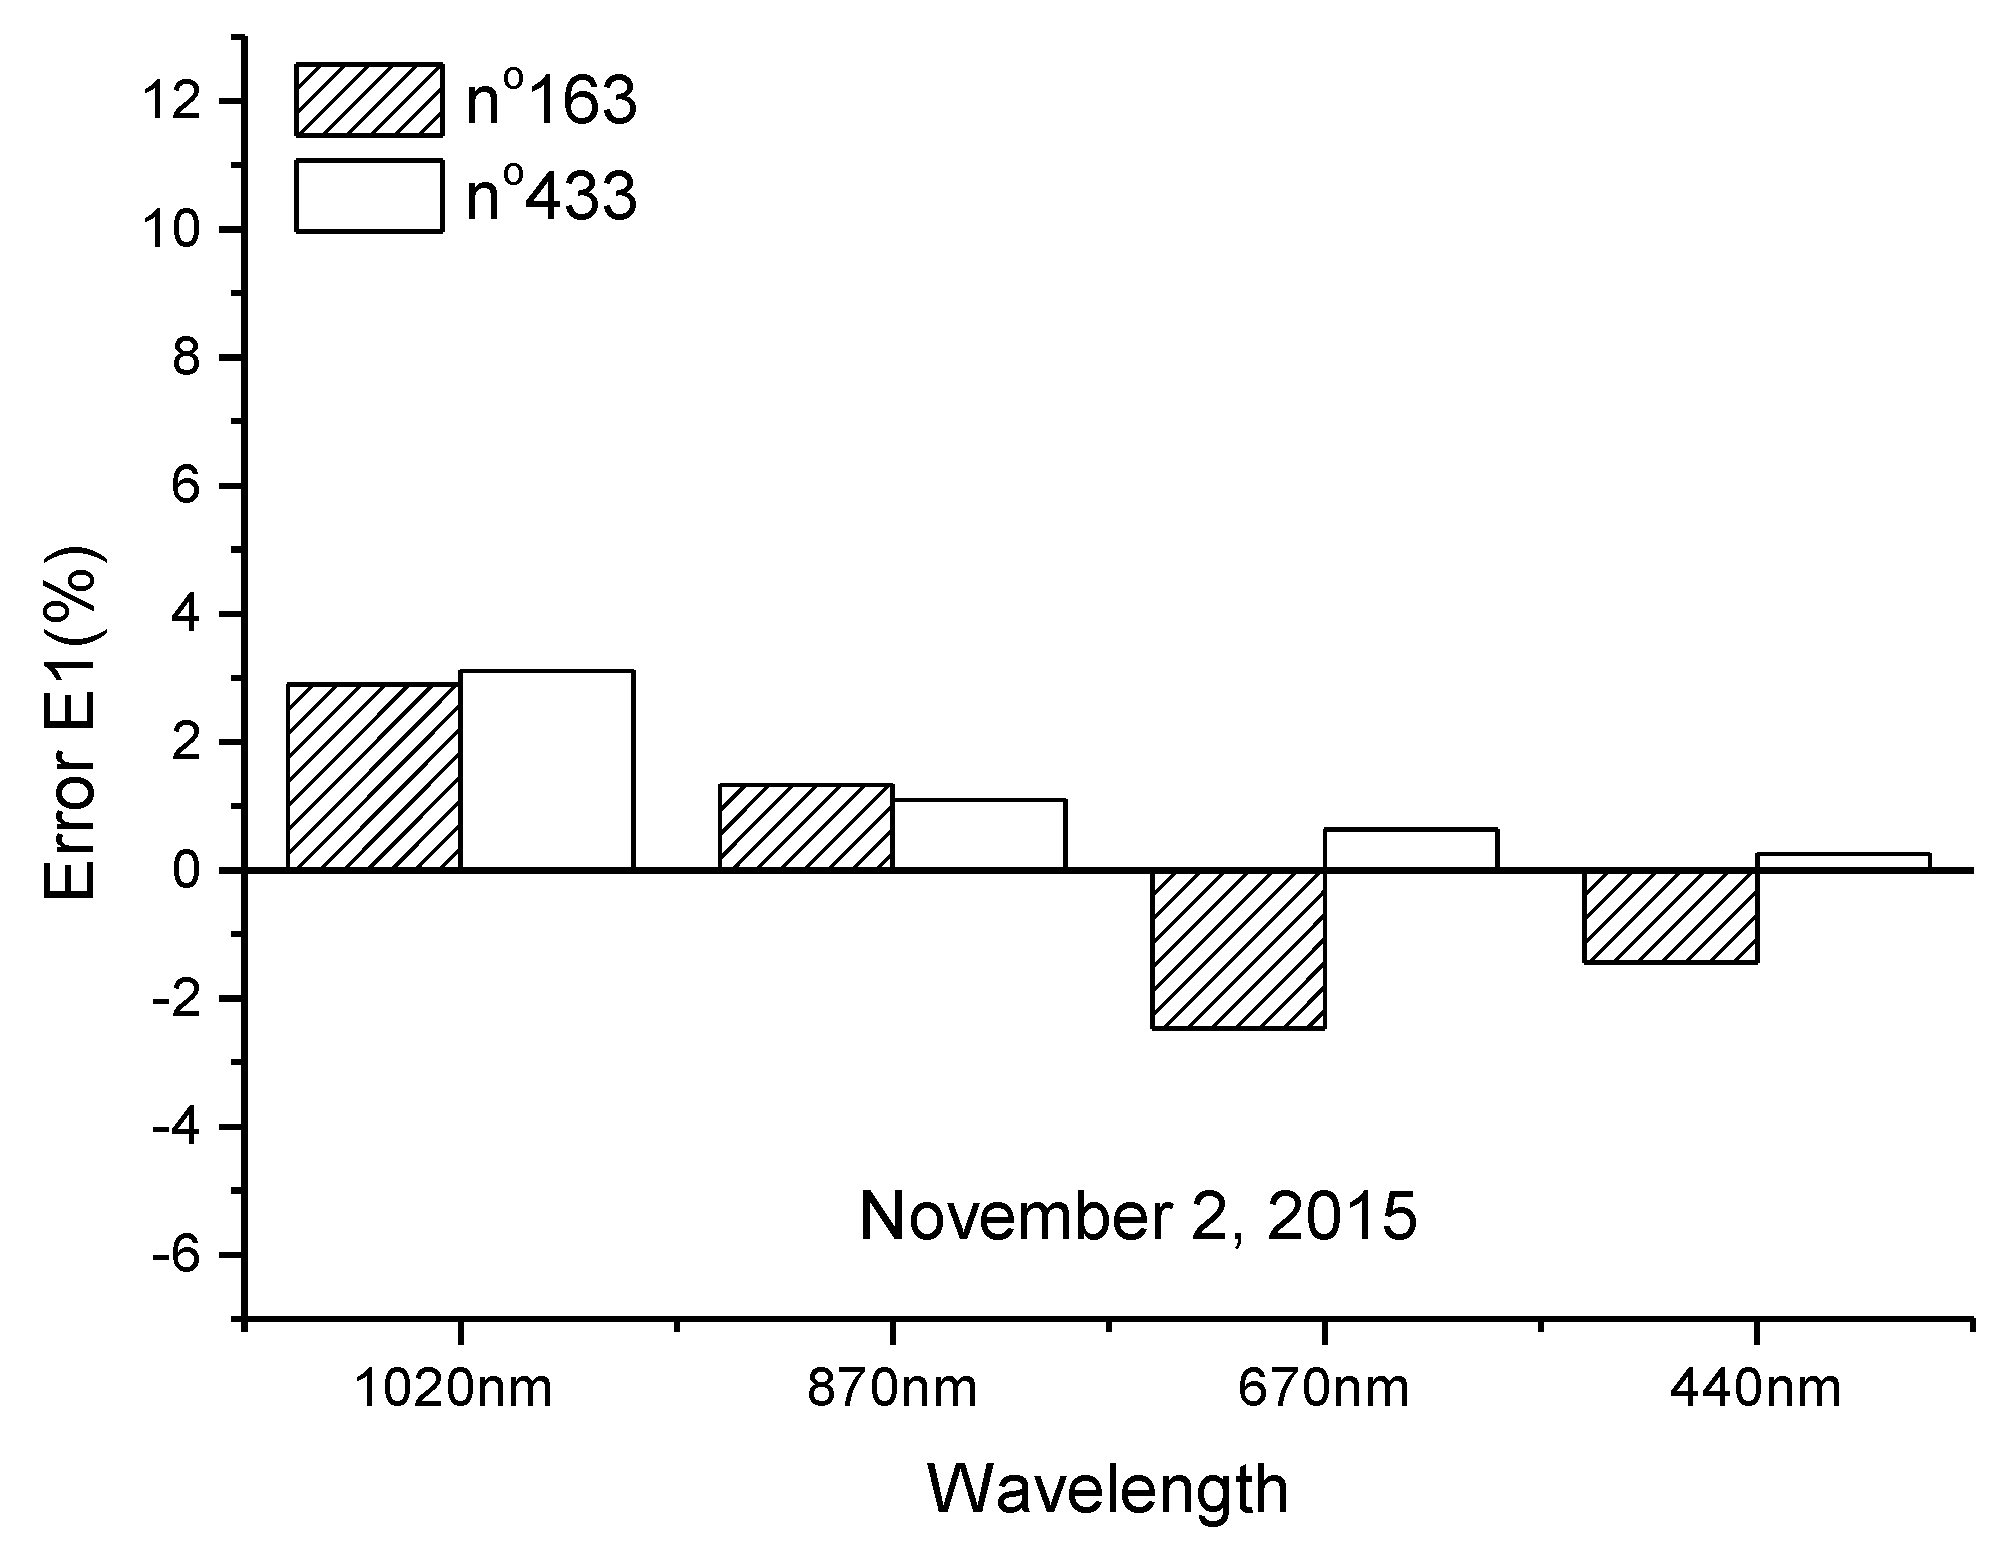
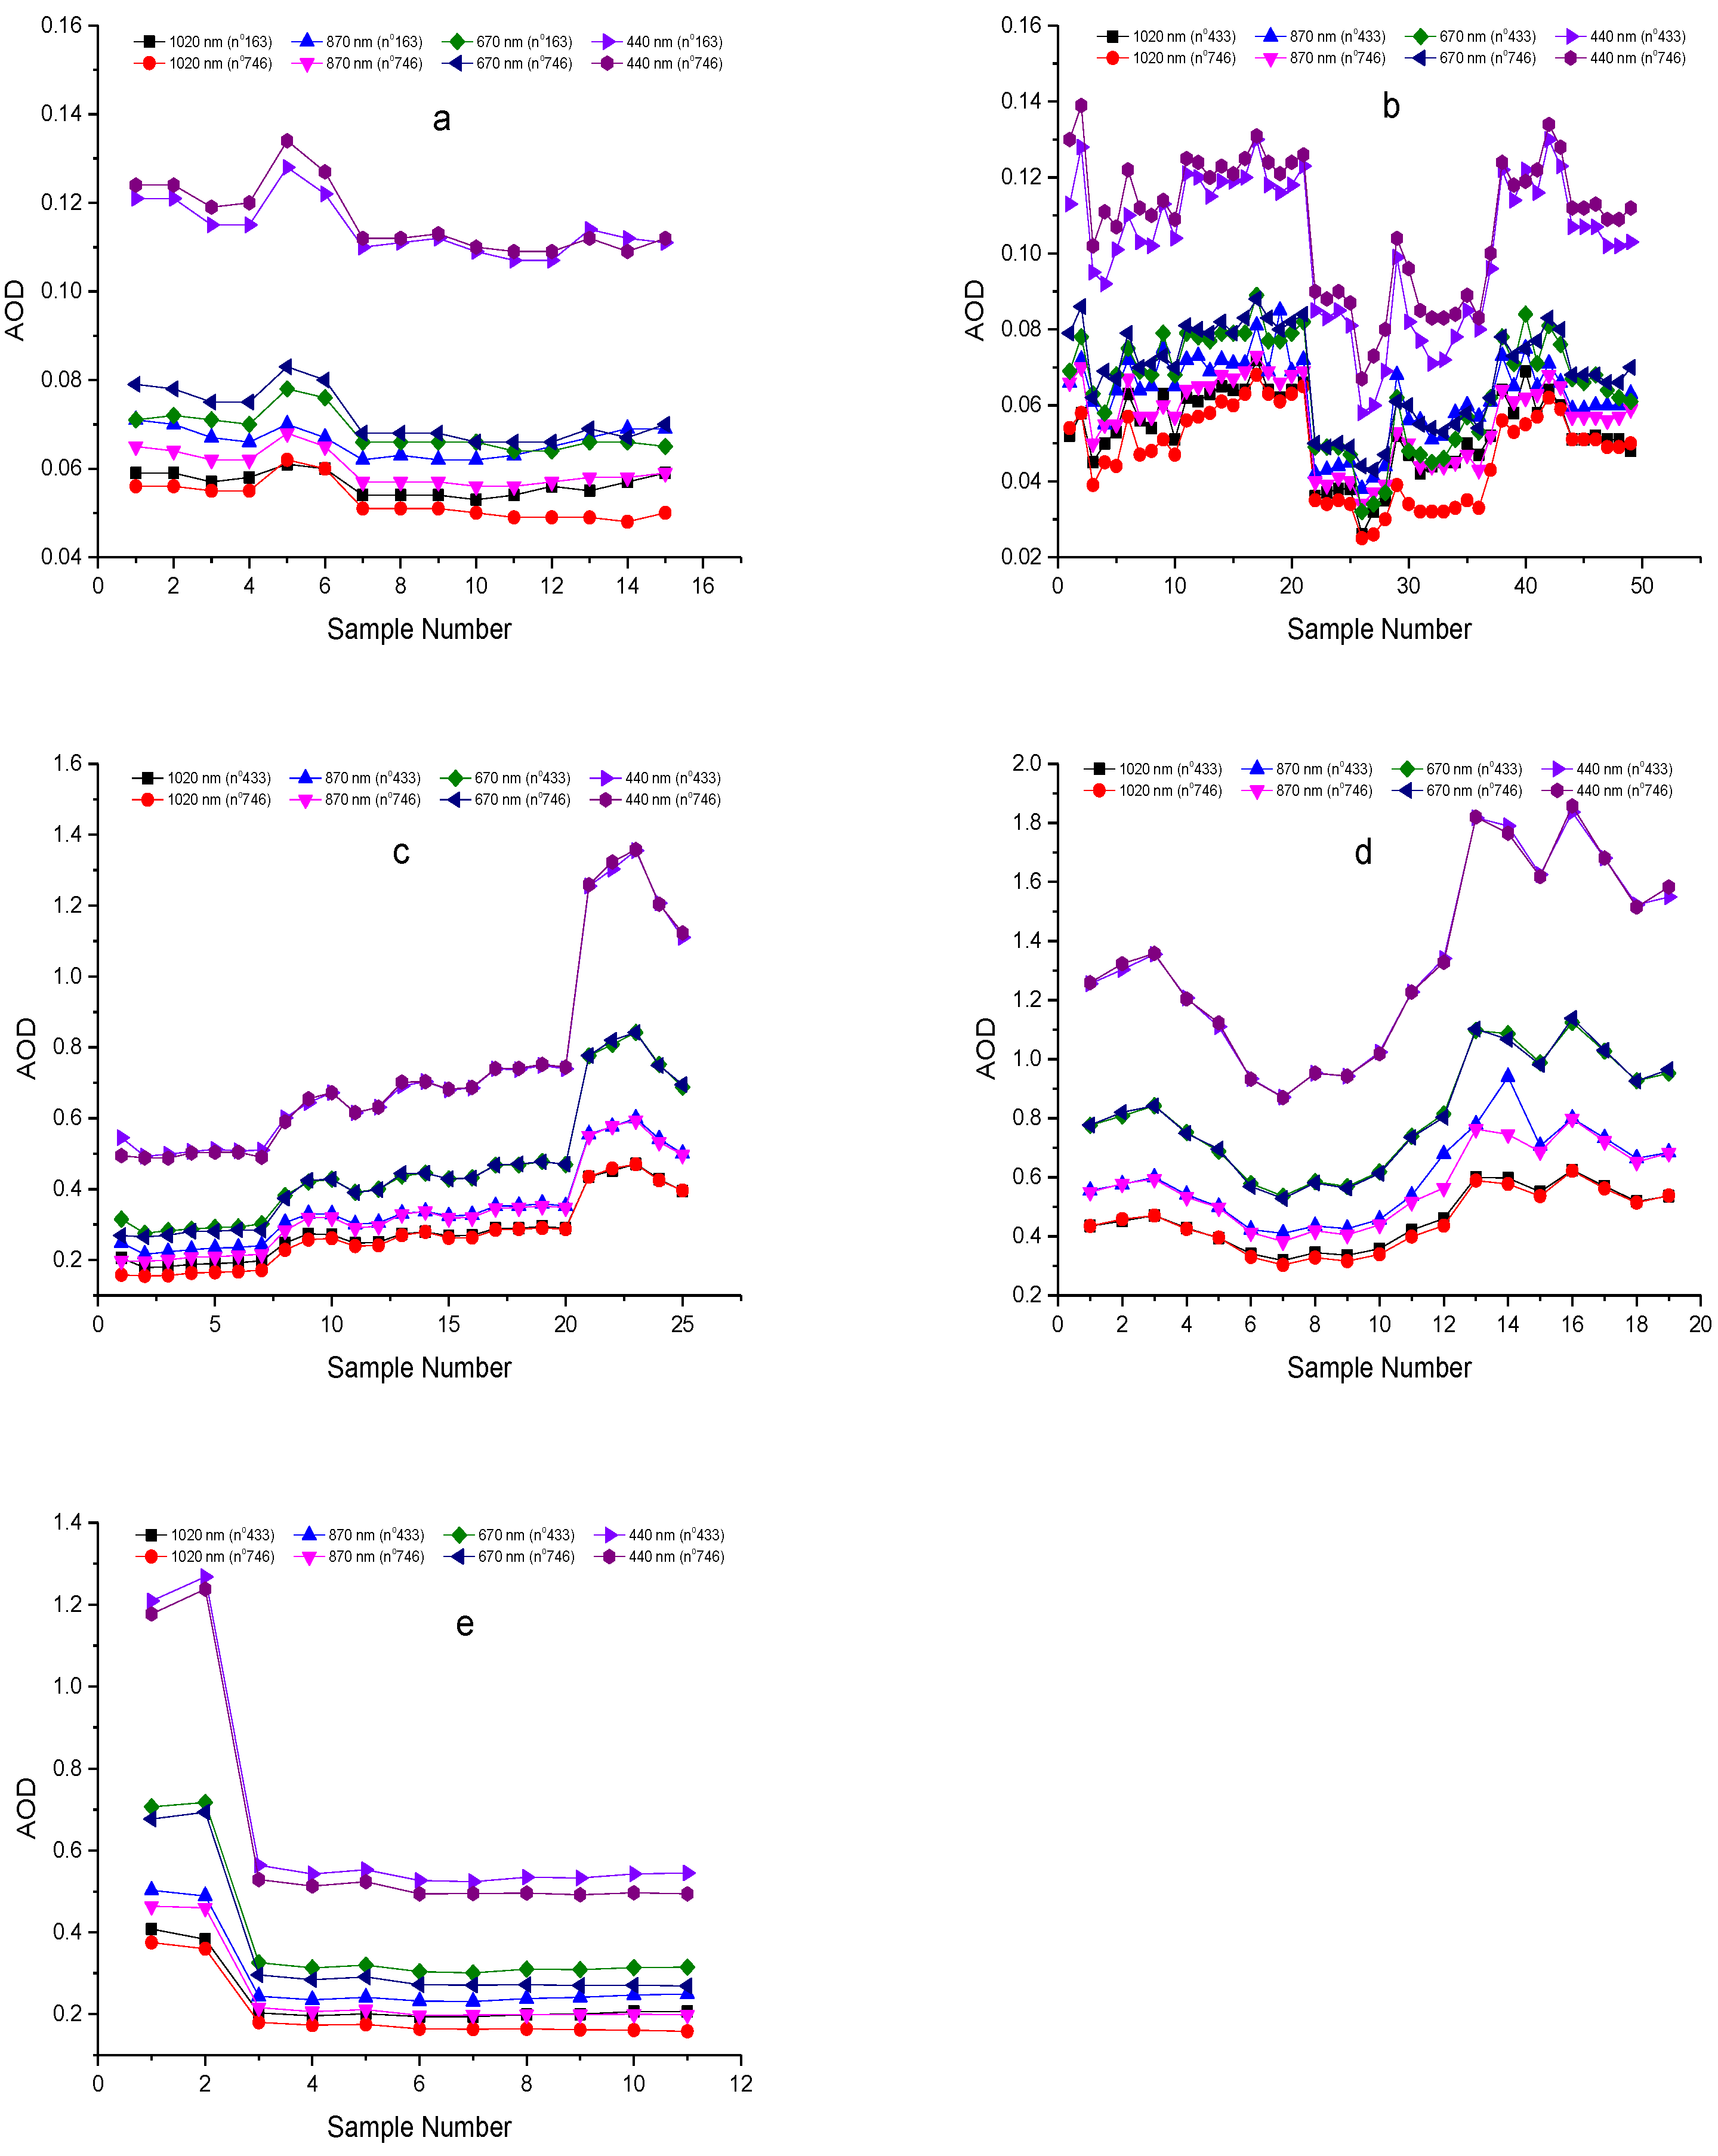
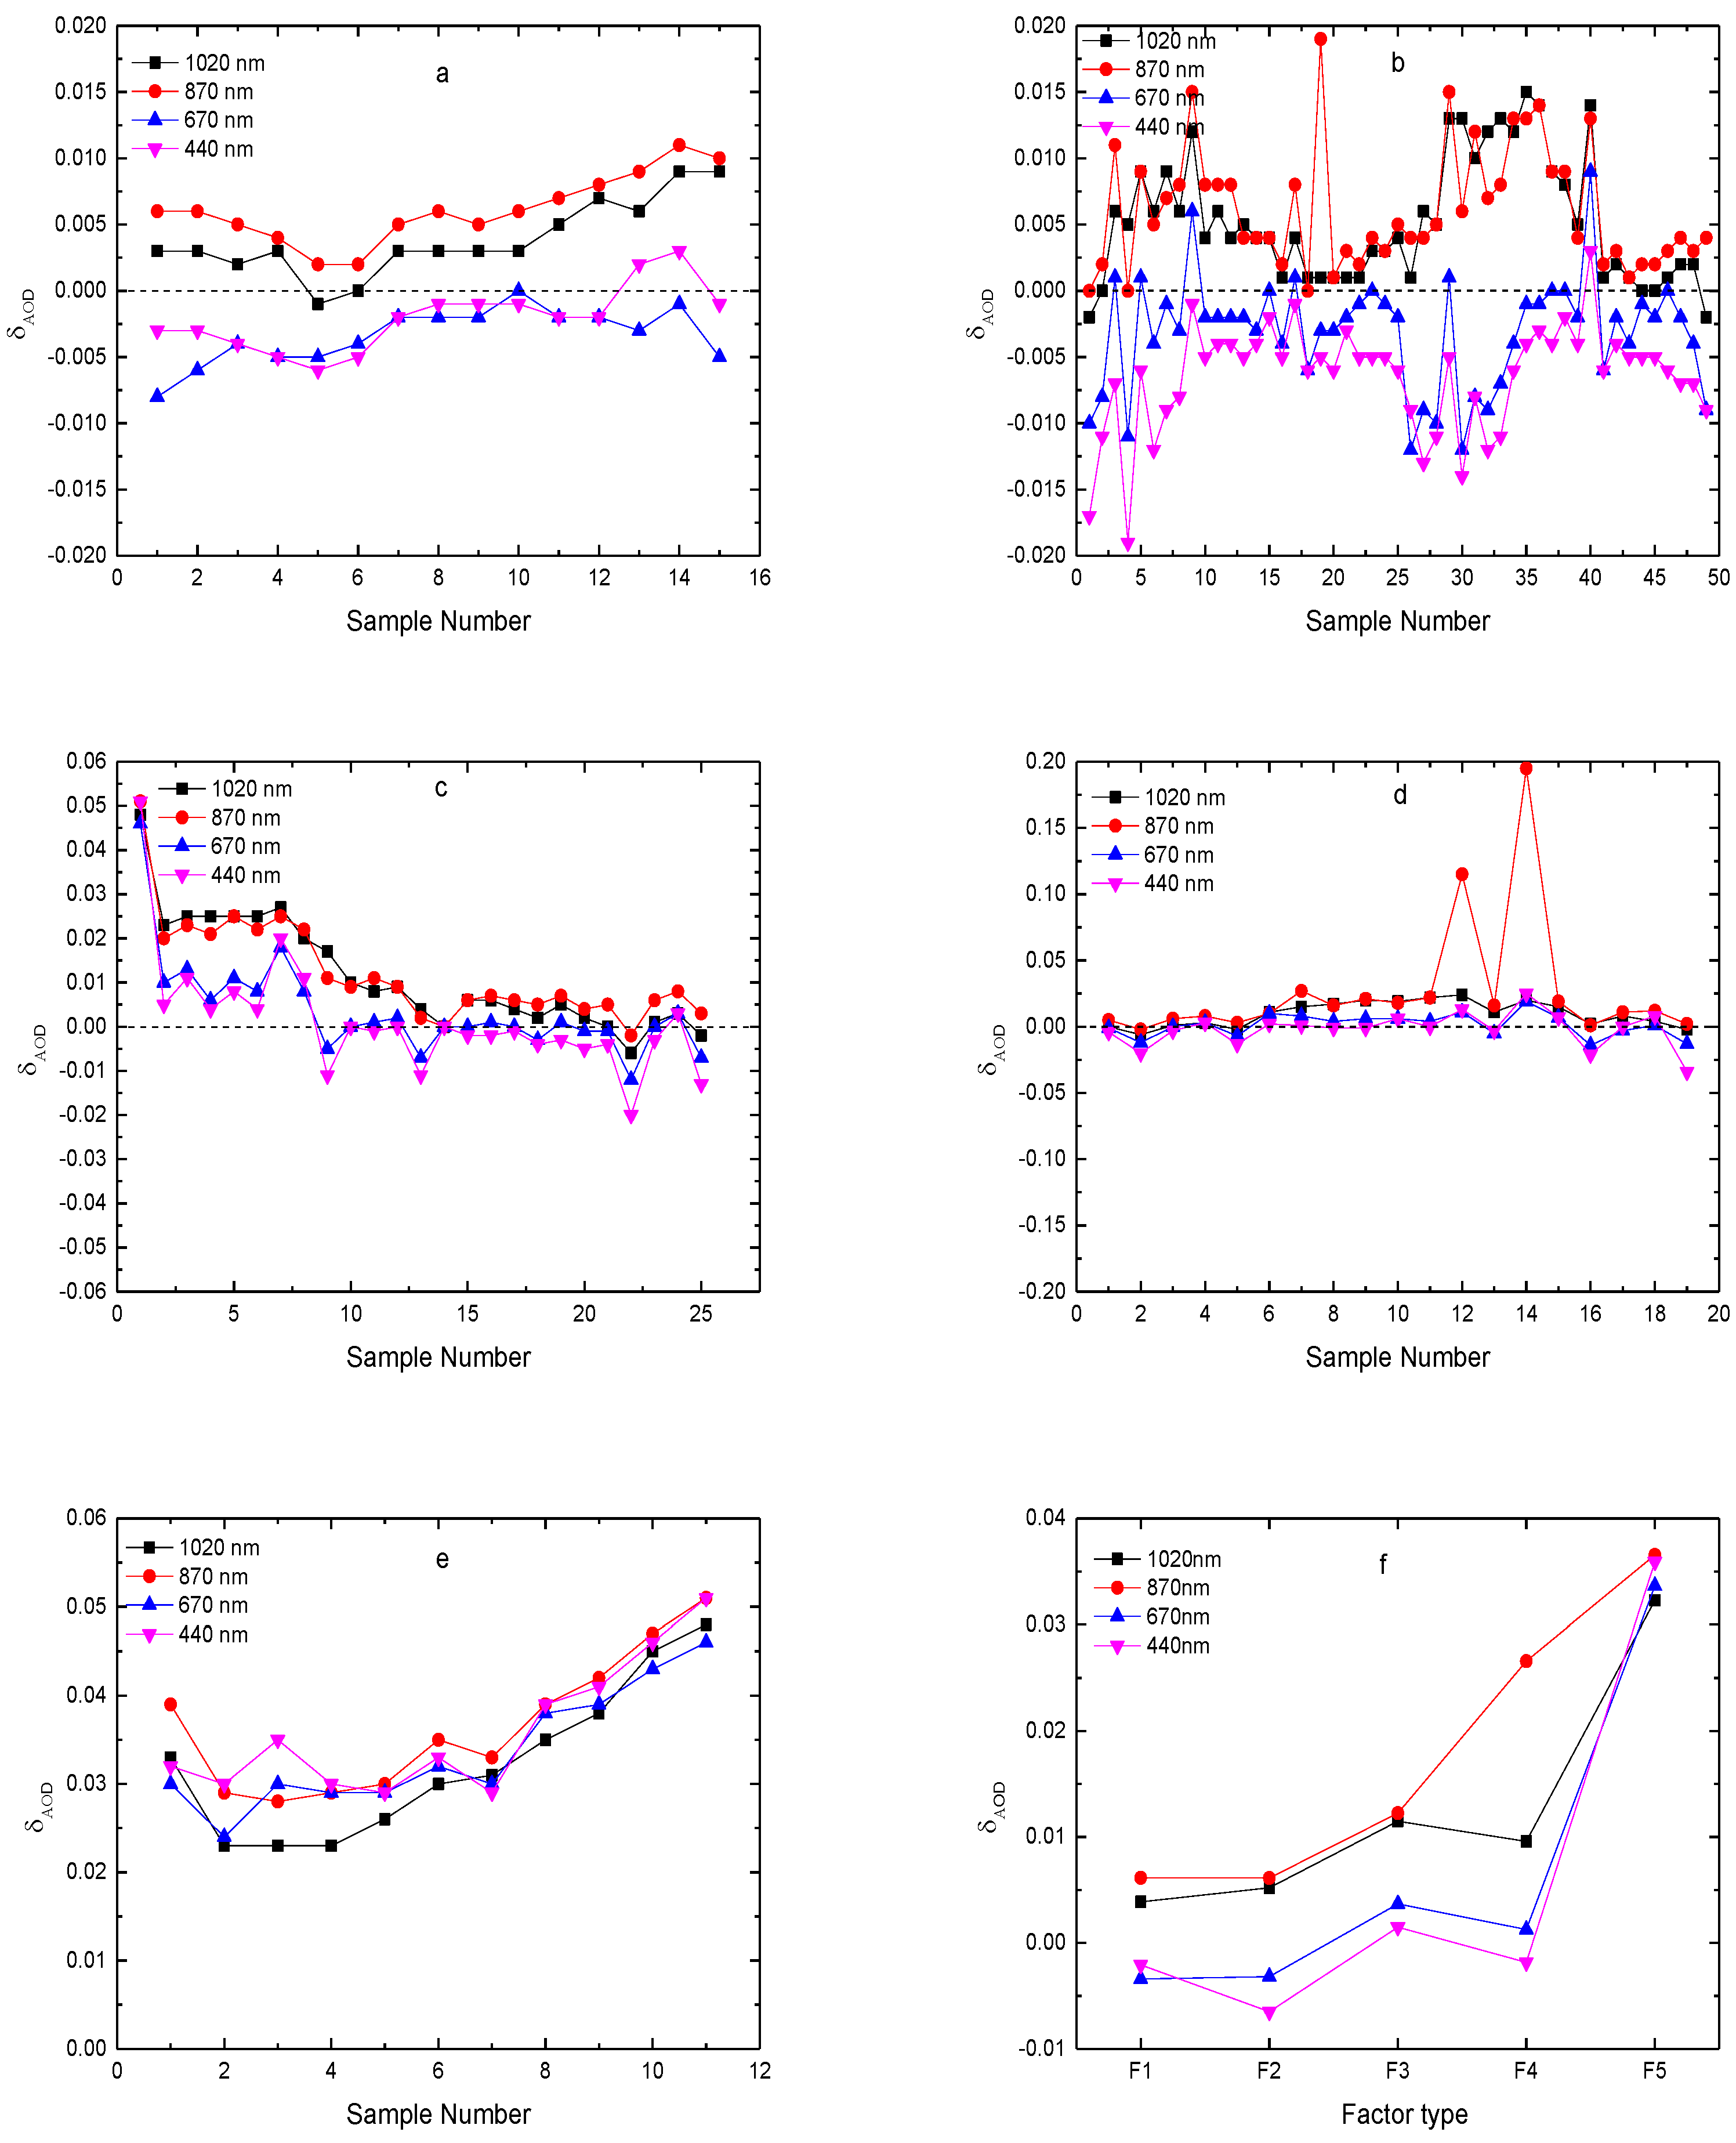
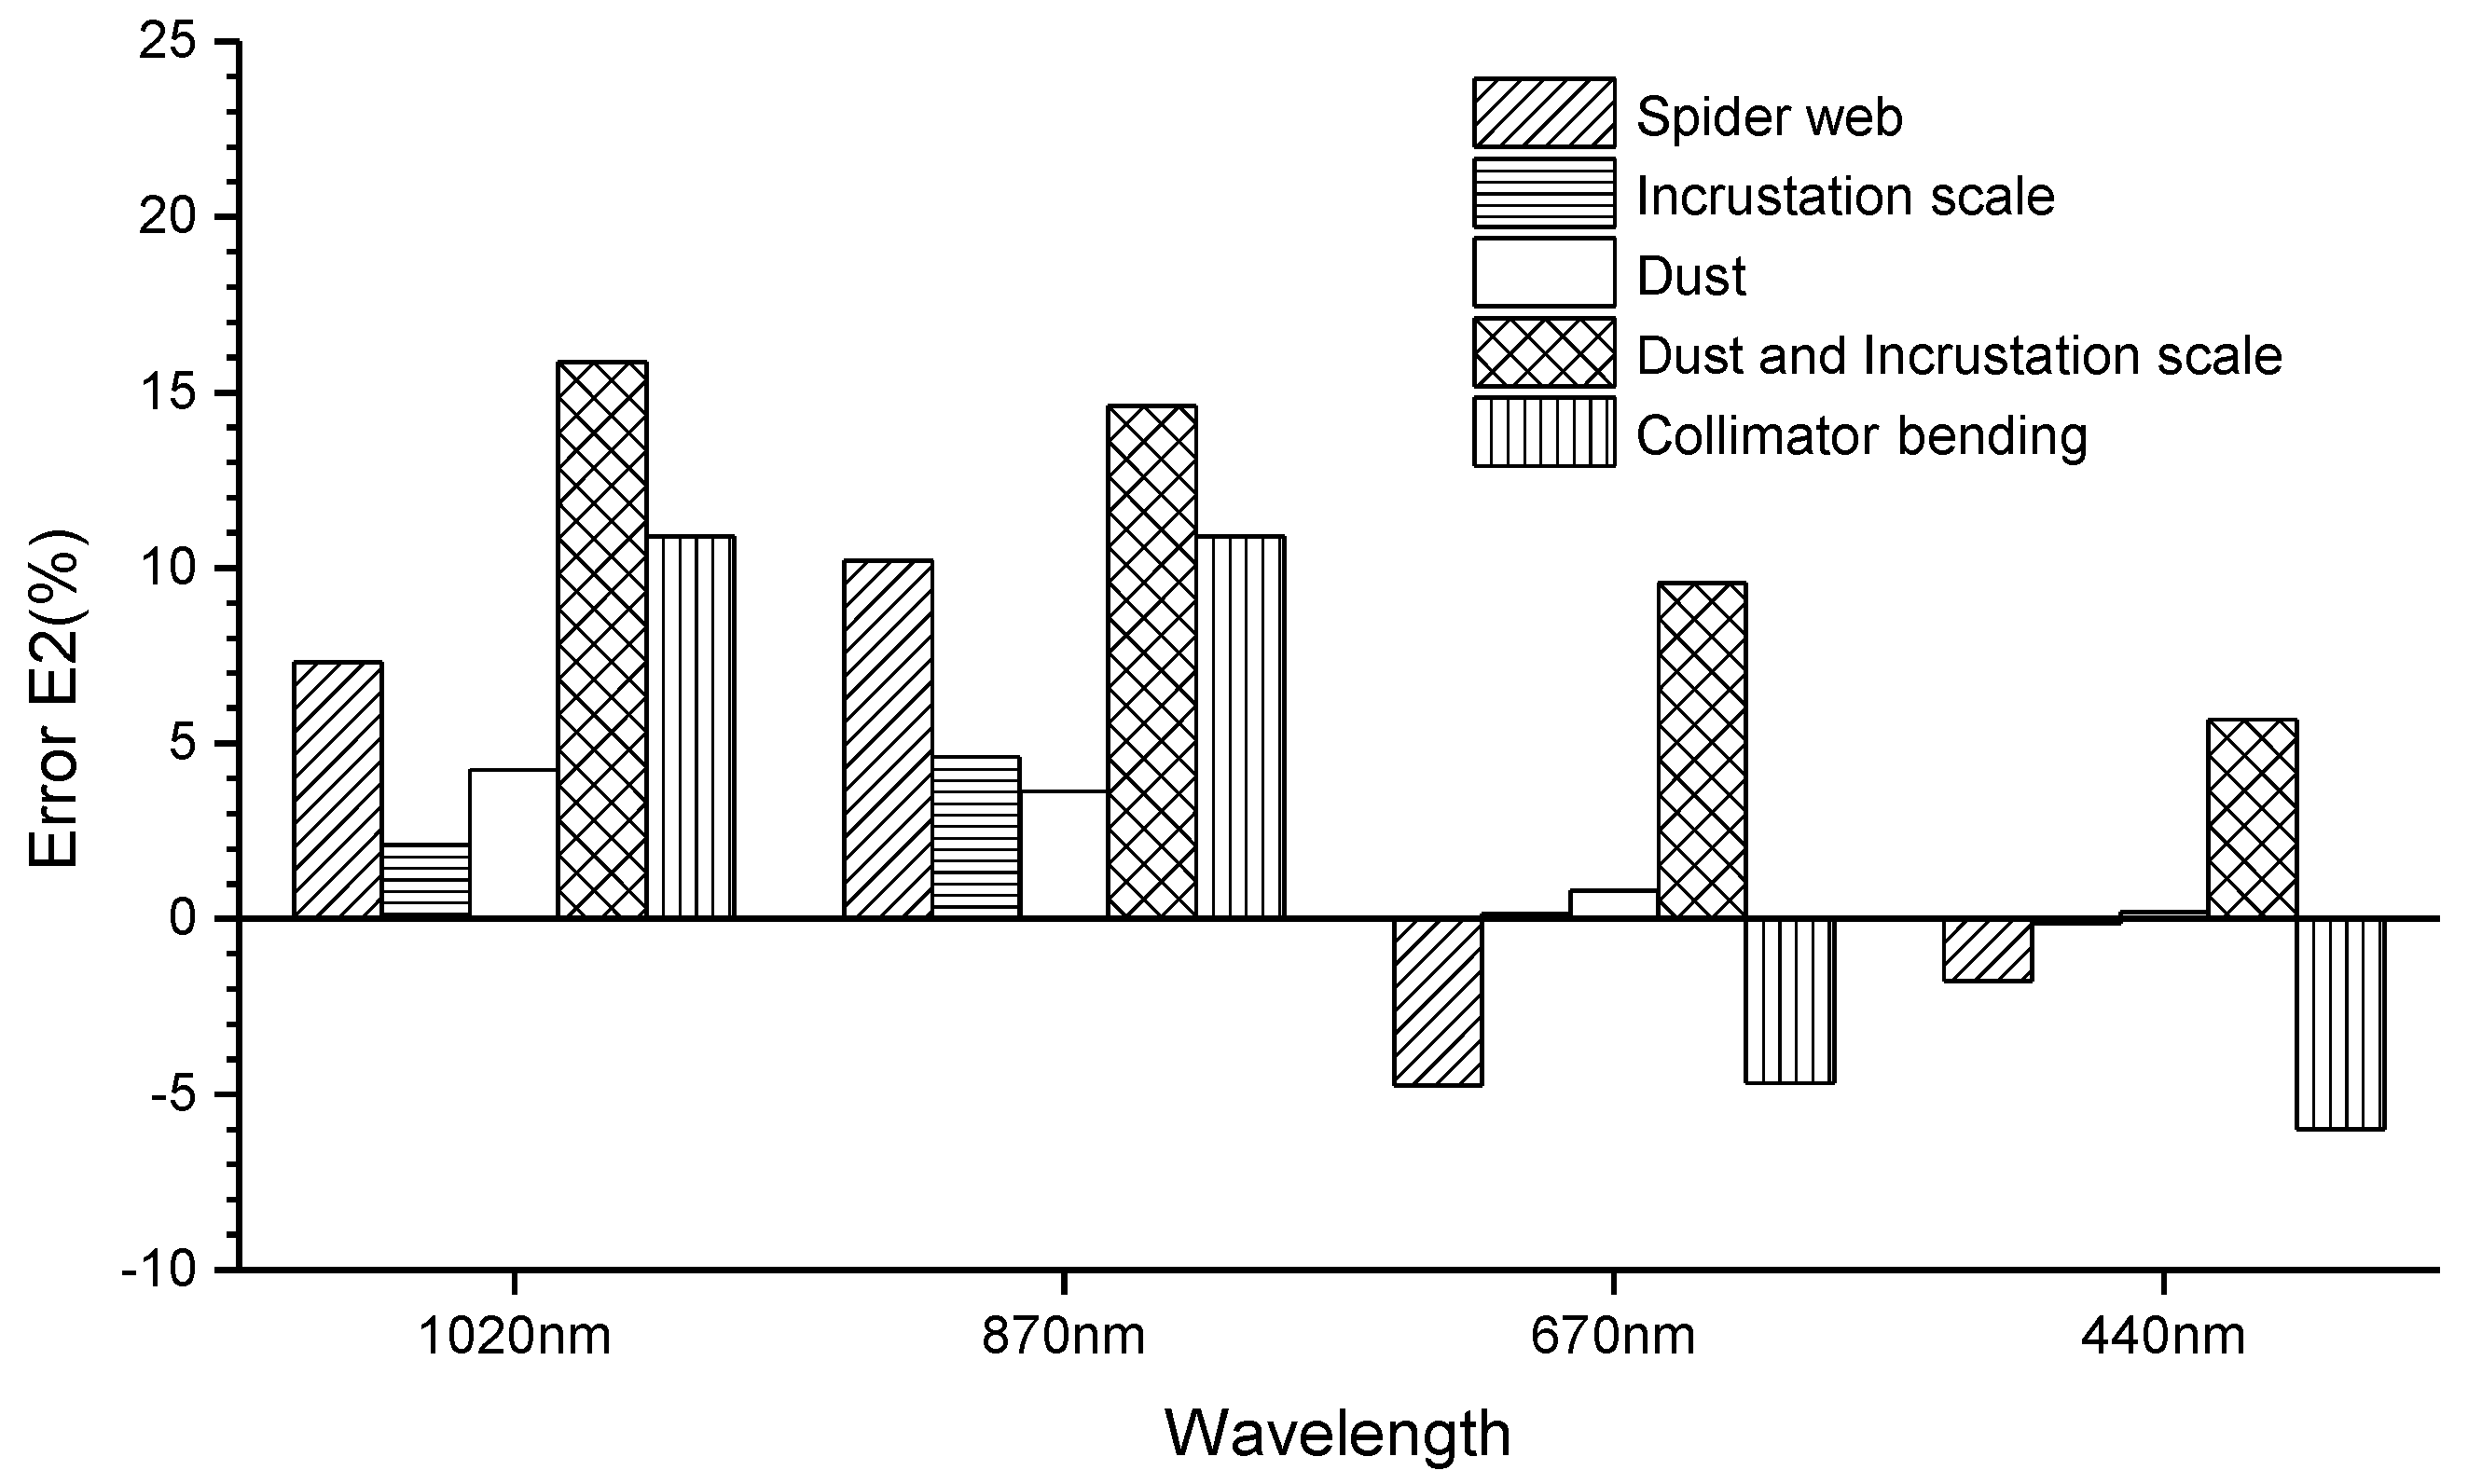
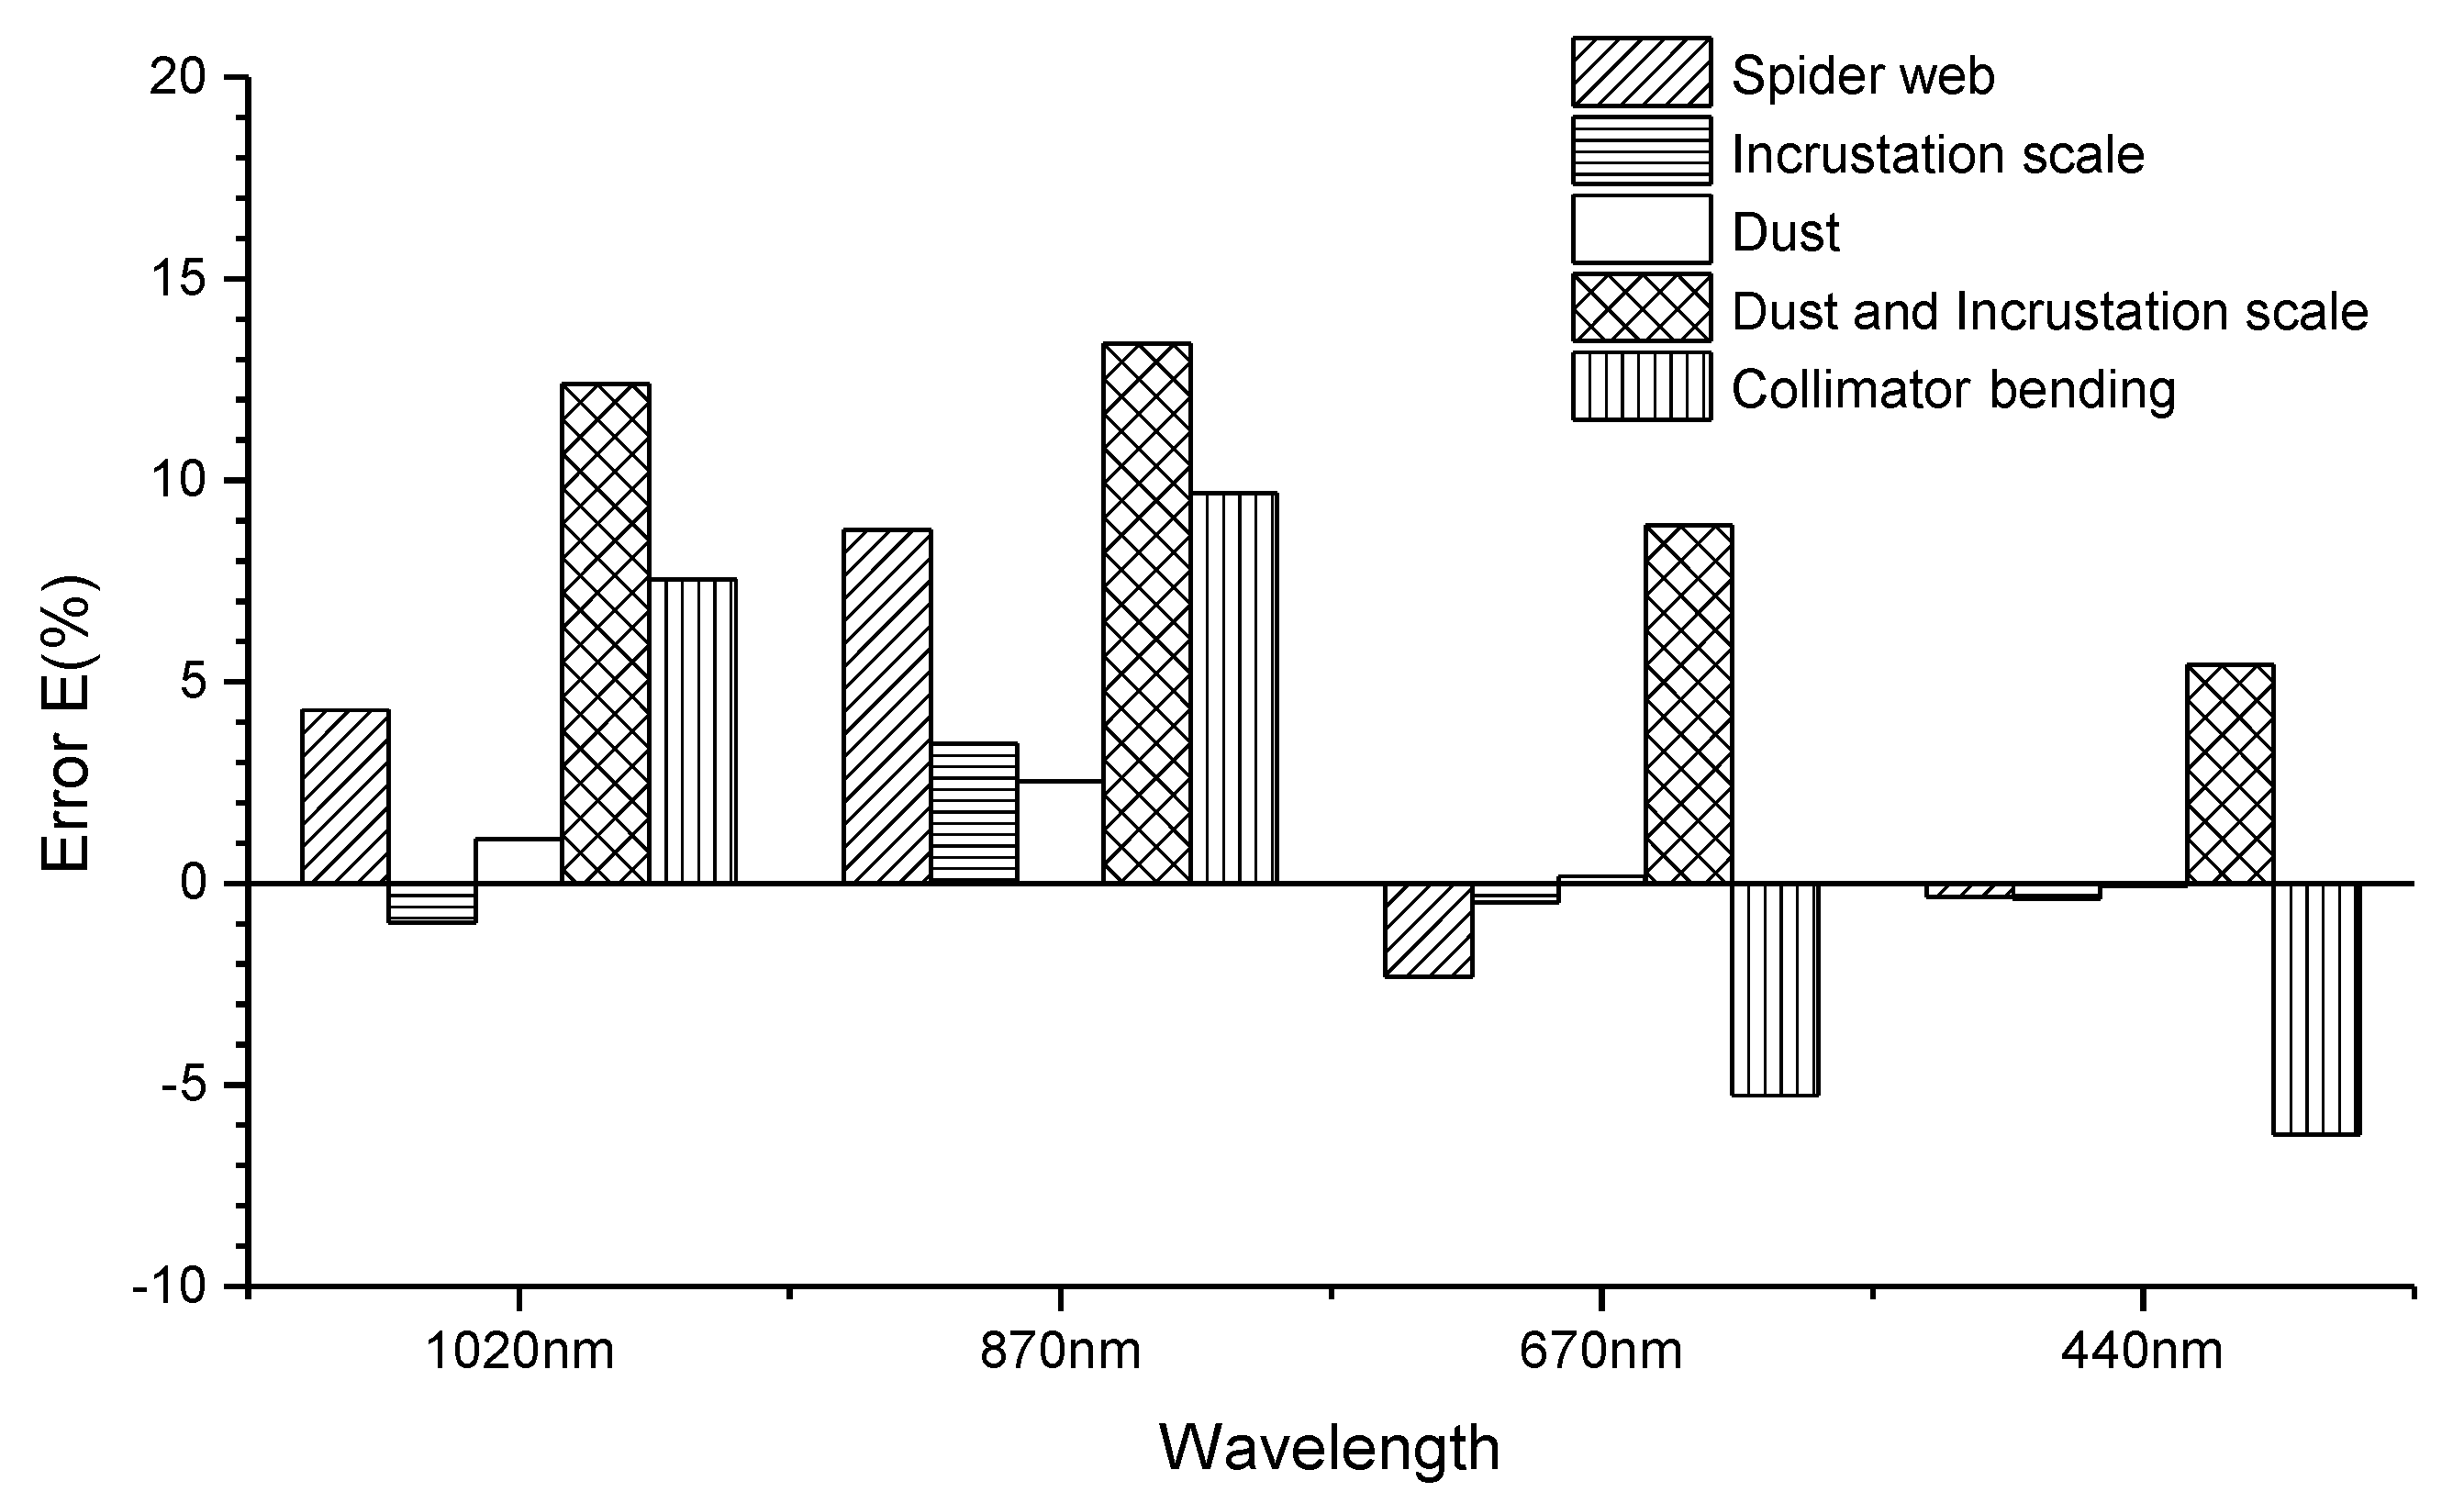
3.1. Error Analysis of Aerosol Optical Depth


| Wavelength (nm) | AOD Error (%) | ||||||||||||||
|---|---|---|---|---|---|---|---|---|---|---|---|---|---|---|---|
| Error E1 | Error E2 | Error E | |||||||||||||
| F1 | F2 | F3 | F4 | F5 | F1 | F2 | F3 | F4 | F5 | F1 | F2 | F3 | F4 | F5 | |
| 1020 | 2.90 | 3.11 | 3.11 | 3.11 | 3.11 | 7.32 | 10.90 | 4.24 | 2.12 | 15.88 | 4.30 | 7.55 | 1.10 | −0.96 | 12.39 |
| 870 | 1.33 | 1.10 | 1.10 | 1.10 | 1.10 | 10.21 | 10.89 | 3.64 | 4.62 | 14.63 | 8.77 | 9.68 | 2.52 | 3.48 | 13.38 |
| 670 | −2.47 | 0.63 | 0.63 | 0.63 | 0.63 | −4.73 | −4.67 | 0.80 | 0.15 | 9.57 | −2.32 | −5.27 | 0.17 | −0.48 | 8.88 |
| 440 | −1.44 | 0.25 | 0.25 | 0.25 | 0.25 | −1.78 | −5.98 | 0.20 | −0.14 | 5.68 | −0.34 | −6.22 | −0.05 | −0.39 | 5.42 |


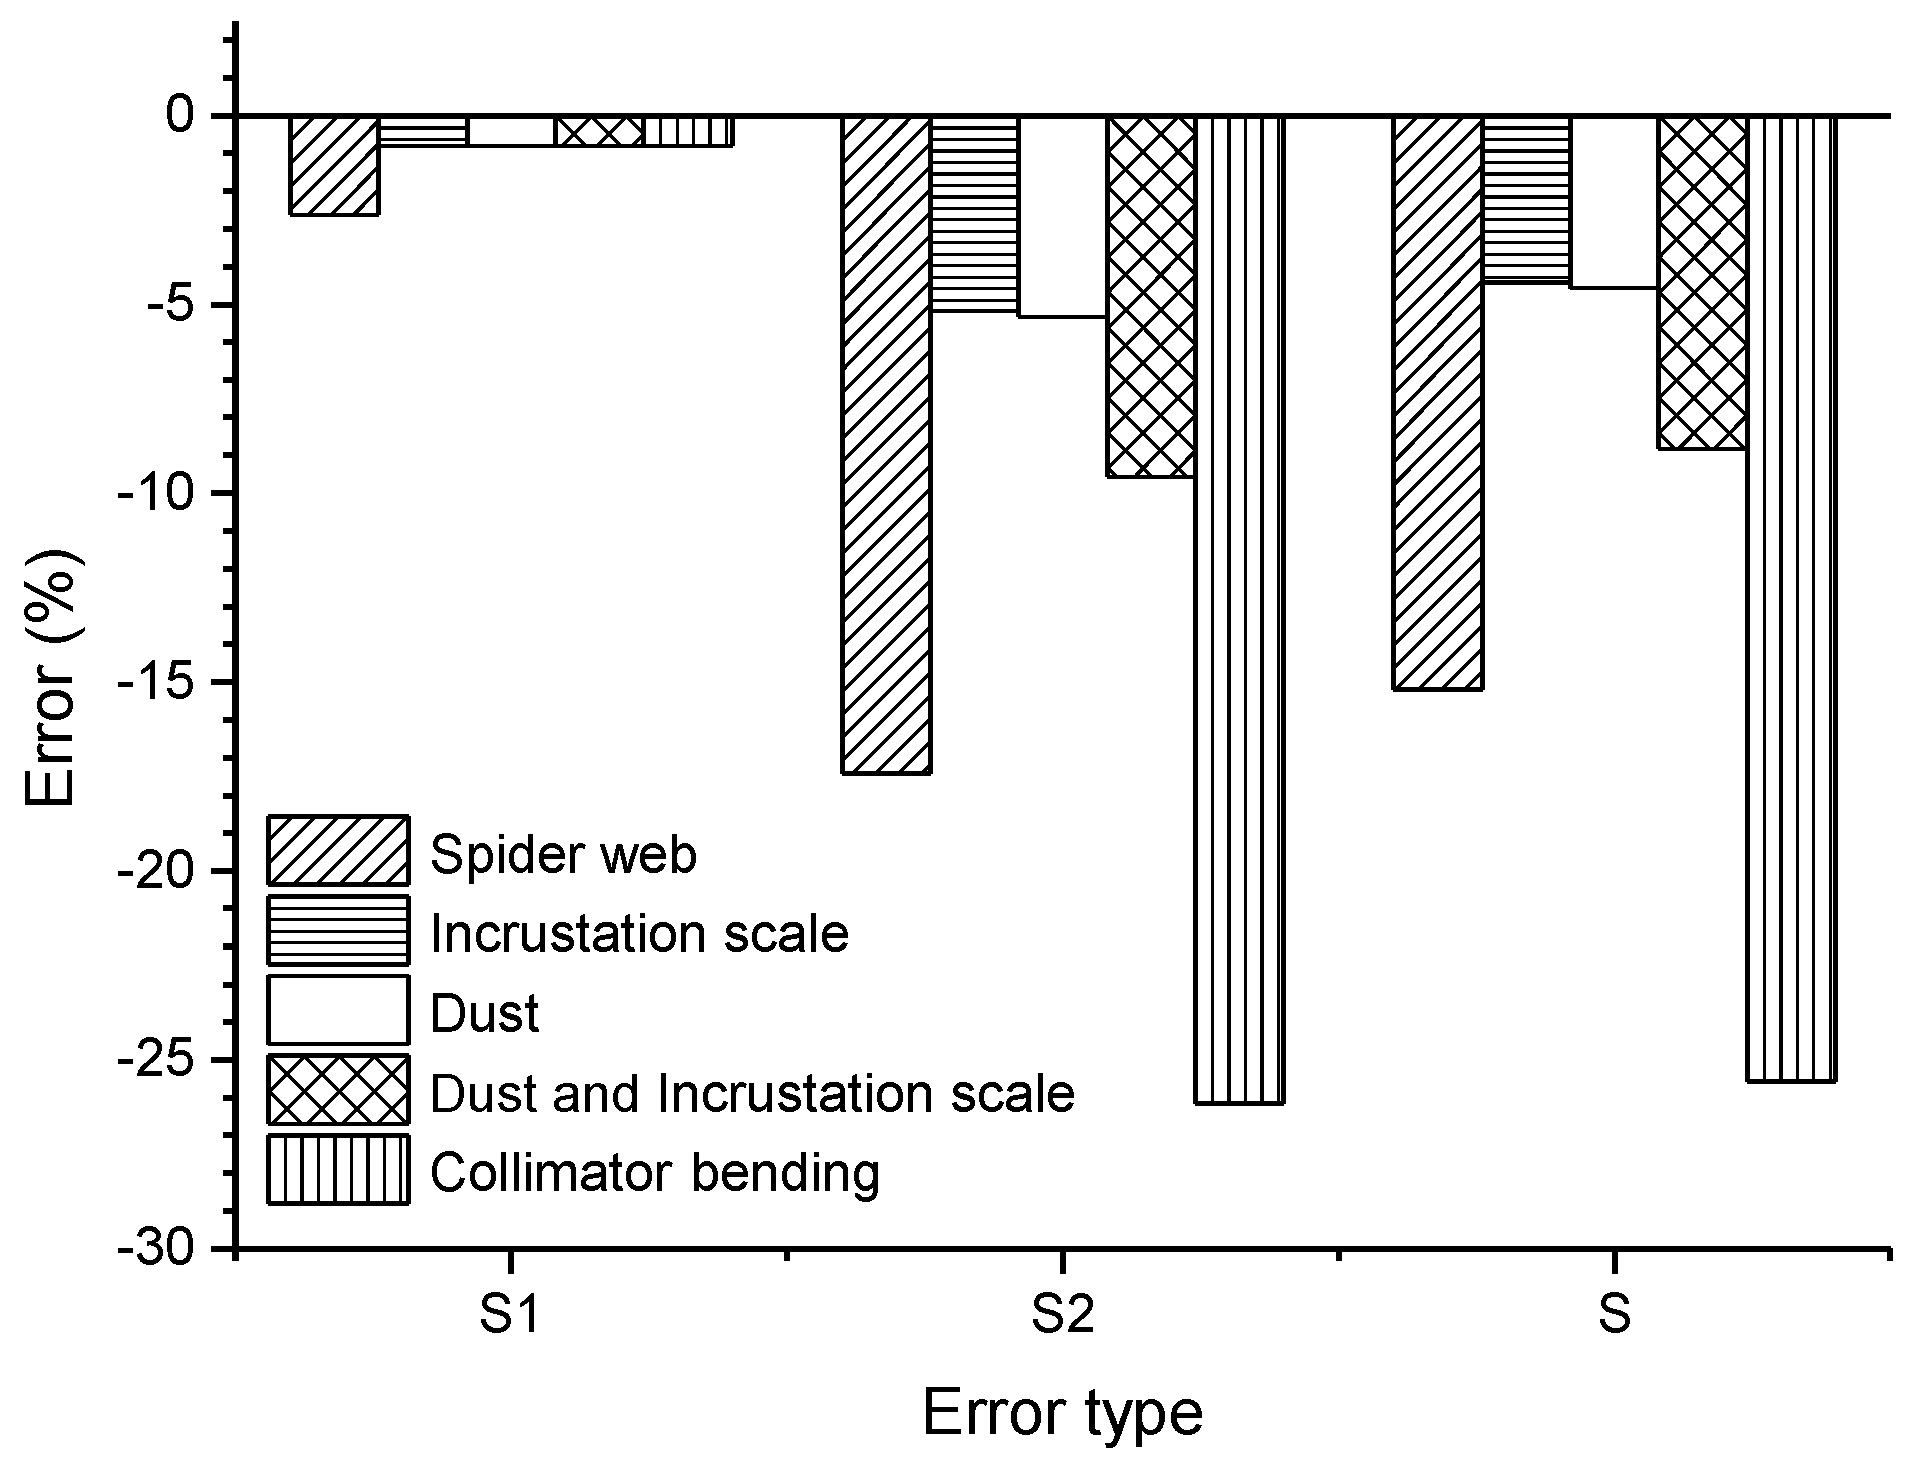
3.2. Error Analysis of Ångström Exponent
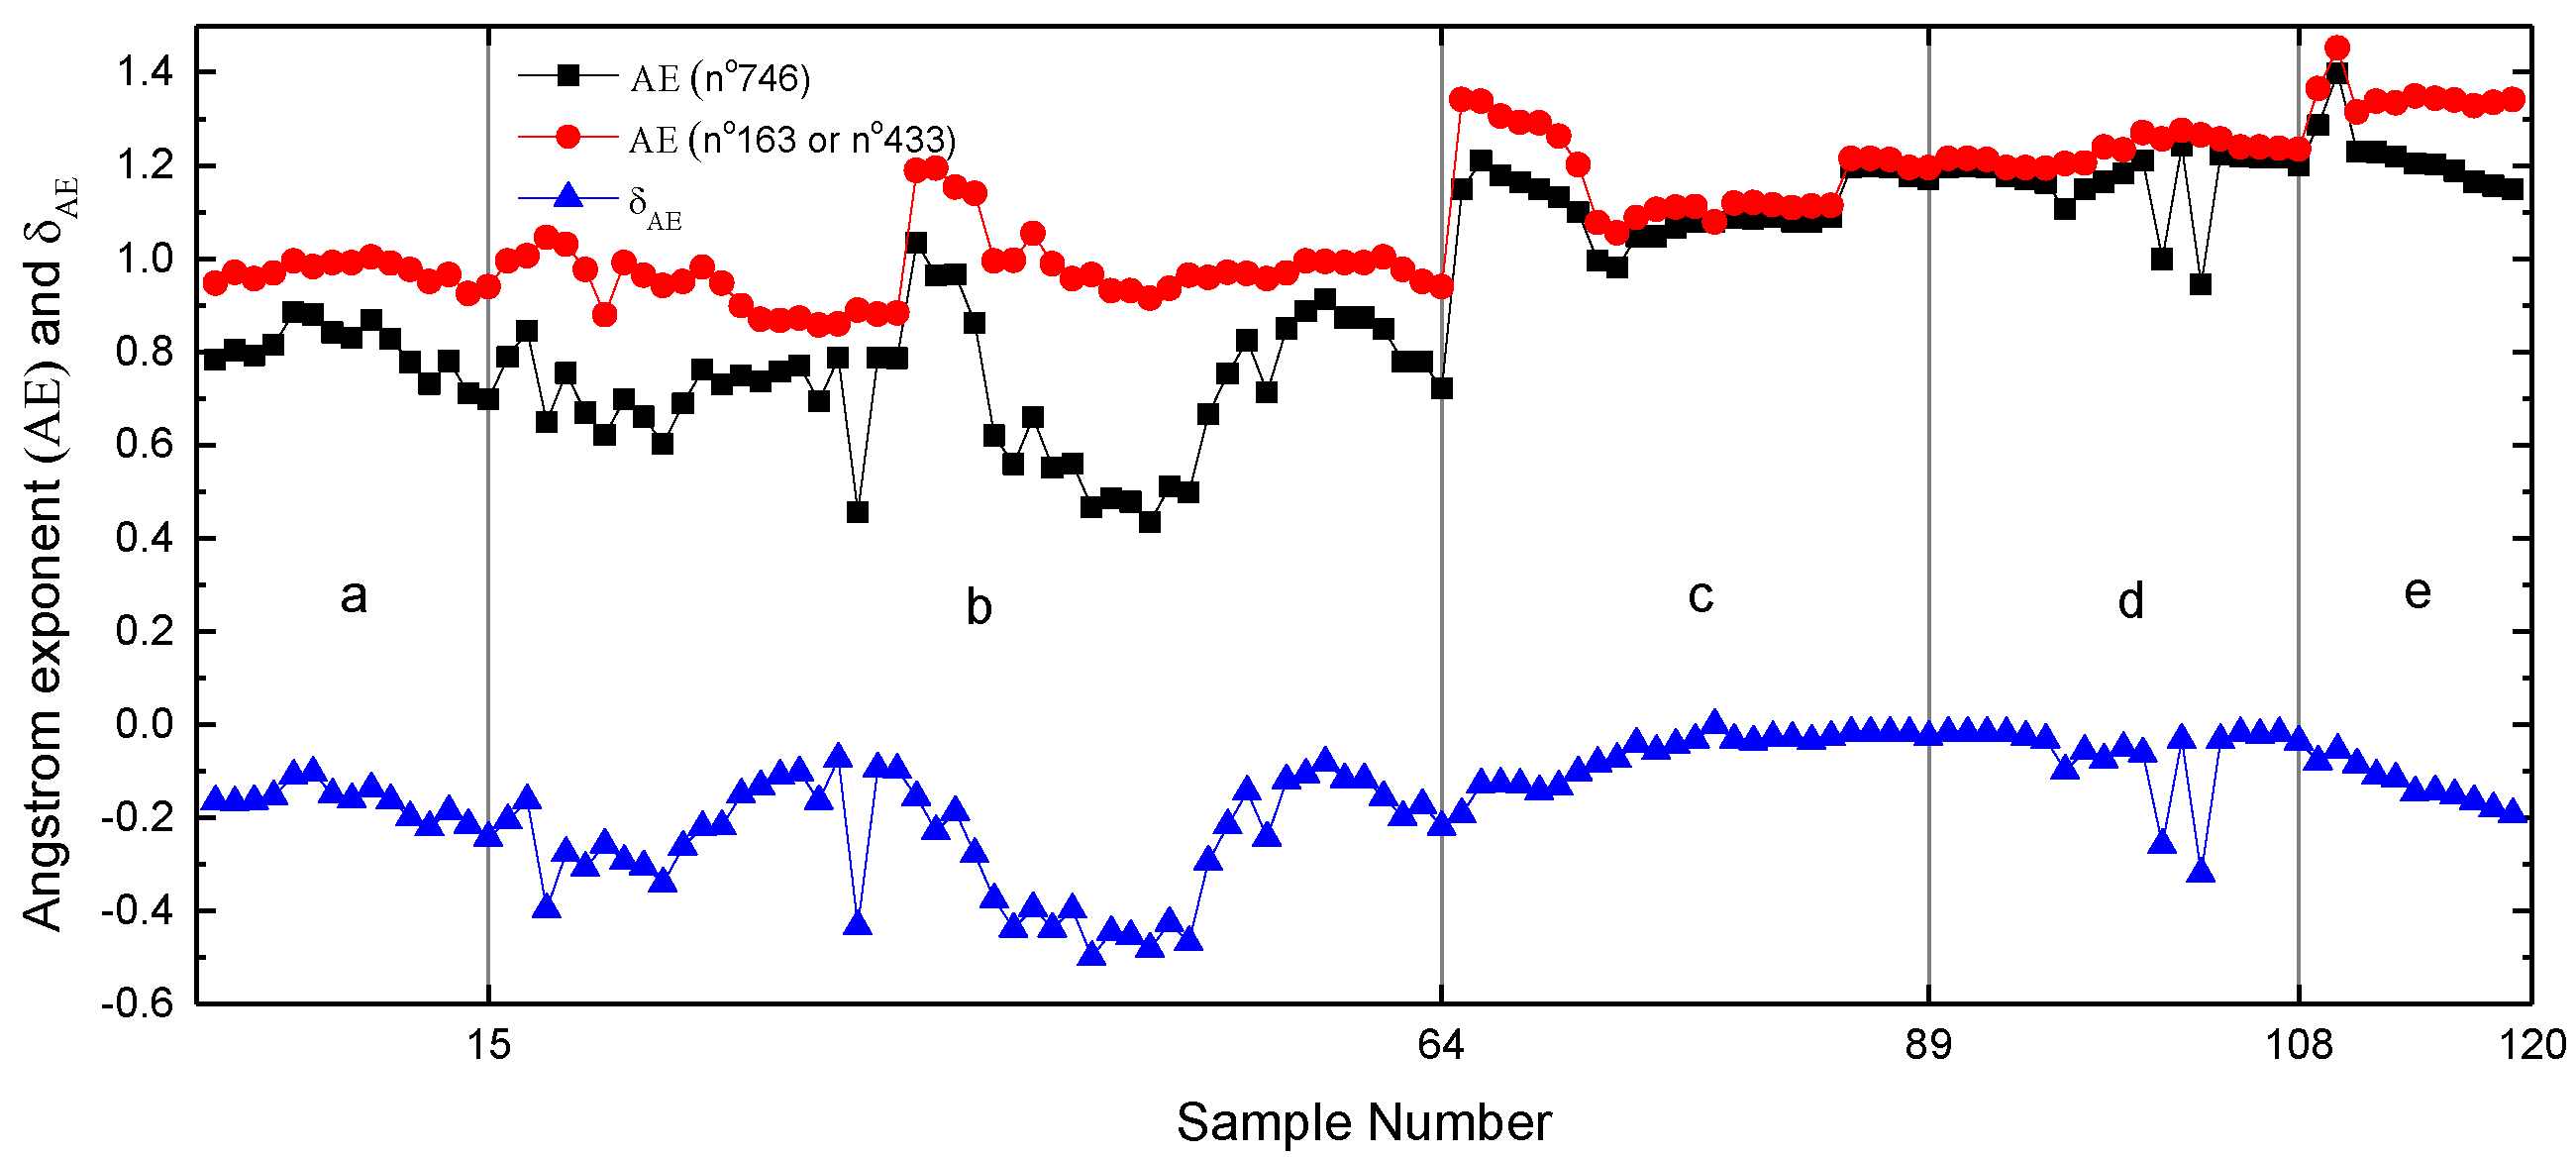

| Error Type | AE Error (%) | ||||
|---|---|---|---|---|---|
| F1 | F2 | F3 | F4 | F5 | |
| S1 | −2.62 | −0.80 | −0.80 | −0.80 | −0.80 |
| S2 | −17.42 | −26.17 | −5.33 | −5.18 | −9.56 |
| S | −15.19 | −25.57 | −4.56 | −4.41 | −8.83 |
4. Conclusions
Acknowledgements
Author Contributions
Conflicts of Interest
References
- Zhang, X.Y. Aerosol over China and their climate effect. Adv. Earth Sci. 2007, 22, 12–16. [Google Scholar]
- Shi, G.Y.; Wang, B.; Zhang, H.; Zhao, J.Q.; Tan, S.C.; Wen, T.X. The radiative and climatic effects of atmospheric aerosols. Chin. J. Atmos. Sci. 2008, 32, 826–840. [Google Scholar]
- Charlson, R.J.; Schwartz, S.E.; Hales, J.M.; Cess, R.D.; Coakley, J.A.; Hansen, J.E.; Hofmann, D.J. Climate forcing by anthropogenic aerosols. Science 1992, 255, 423–430. [Google Scholar] [CrossRef] [PubMed]
- Hansen, J.; Sato, M.; Ruedy, R. Radiative forcing and climate response. J. Geophys. Res. 1997, 102, 6831–6864. [Google Scholar] [CrossRef]
- Toon, O.B. How pollution suppresses rain. Science 2000, 287, 1763–1765. [Google Scholar] [CrossRef]
- Rosenfeld, D. Aerosols, clouds, and climate. Science 2006, 312, 1323–1324. [Google Scholar] [CrossRef] [PubMed]
- Rosenfeld, D. Suppression of rain and snow by urban and industrial air pollution. Science 2000, 287, 1793–1796. [Google Scholar] [CrossRef] [PubMed]
- Rosenfeld, D. Aerosol-cloud interactions control of earth radiation and latent heat release budgets. Sp. Sci. Rev. 2006, 125, 149–157. [Google Scholar] [CrossRef]
- Che, H.Z.; Shi, G.Y.; Zhang, X.Y.; Arimoto, R.; Zhao, J.Q.; Xu, L.; Wang, B.; Chen, Z.H. Analysis of 40 years of solar radiation data from China, 1961–2000. Geophys. Res. Lett. 2005, 32. [Google Scholar] [CrossRef]
- Menon, S.; Hansen, J.E.; Nazarenko, L.; Luo, Y.F. Climate effects of black carbon aerosols in China and India. Science 2002, 297, 2250–2253. [Google Scholar] [CrossRef] [PubMed]
- Collins, M.; Knutti, R.; Arblaster, J.; Dufresne, J.; Fichefet, T.; Friedlingstein, P.; Gao, X.; Gutowski, W.; Johns, T.; Krinner, G. Contribution of working group I to the fifth assessment report of the intergovernmental panel on climate change. In Climate Change 2013: The Physical Science Basis; Qin, D., Plattner, G.K., Tignor, S.K.A., Judith, B., Alexander, N., Yu, X., Vincent, B., Pauline, M.M., Eds.; Cambridge University Press: Cambridge, UK, 2013; pp. 571–657. [Google Scholar]
- Ramanathan, V.; Crutzen, P.J.; Kiehl, J.T.; Rosenfeld, D. Atmosphere—Aerosols, climate, and the hydrological cycle. Science 2001, 294, 2119–2124. [Google Scholar] [CrossRef] [PubMed]
- McComiskey, A.; Feingold, G.; Frisch, A.S.; Turner, D.D.; Miller, M.A.; Chiu, J.C.; Min, Q.; Ogren, J.A. An assessment of aerosol-cloud interaction in marine stratus clouds based on surface remote sensing. J. Geophys. Res. 2009, 114, D09203. [Google Scholar] [CrossRef]
- Forest, C.E.; Stone, P.H.; Sokolov, A.P.; Allen, M.R.; Webster, M.D. Quantifying uncertainties in climate system properties with the use of recent climate observations. Science 2002, 295, 113–117. [Google Scholar] [CrossRef] [PubMed]
- Cattani, E.; Costa, M.J.; Torricella, F.; Levizzani, V.; Silva, A.M. The influence of the aerosol particles from biomass burning on cloud microphysical properties and radiative forcing. Atmos. Res. 2006, 82, 310–327. [Google Scholar] [CrossRef]
- Anderson, T.L.; Charlson, R.J.; Schwartz, S.E.; Knutti, R.; Boucher, O.; et al. Climate forcing by aerosols—A hazy picture. Science 2003, 300, 1103–1104. [Google Scholar] [CrossRef] [PubMed]
- Hansen, J.; Sato, M.; Ruedy, R.; Lacis, A.; Oinas, V. Global warming in the twenty-first century: An alternative scenario. Proc. Natl. Acad. Sci. USA 2000, 97, 9875–9880. [Google Scholar] [CrossRef] [PubMed]
- Holben, B.; Tanre, D.; Smirnov, A.; Eck, T.; Slutsker, I.; Abuhassan, N.; Newcomb, W.W.; Schafer, J.; Chatenet, B.; Lavenue, F.; et al. An emerging ground-based aerosol climatology: Aerosol optical depth from AERONET. J. Geophys. Res. 2001, 106, 12067–12097. [Google Scholar] [CrossRef]
- Holben, B.N.; Eck, T.F.; Slutsker, I.; Tanre, D.; Buis, J.P.; Setzer, A.; Vermote, E.; Reagan, J.A.; Kaufman, Y.; Nakajima, T.; et al. AERONET—A federated instrument network and data archive for aerosol characterization. Remote Sens. Environ. 1998, 66, 1–16. [Google Scholar] [CrossRef]
- Goloub, P.; Li, Z.; Dubovik, O.; Blarel, L.; Podvin, T.; Jankowiak, I.; Lecoq, R.; Deroo, C.; Chatenet, B.; Morel, J.P.; et al. PHOTONS/AERONET sunphotometer network overview: Description, activities, results. Proc. SPIE 2007, 6936, 69360V. [Google Scholar]
- Prats, N.; Cachorro, V.E.; Berjón, A.; Toledano, C.; De Frutos, A.M. Column-integrated aerosol microphysical properties from AERONET Sun photometer over southwestern Spain. Atmos. Chem. Phys. 2001, 11, 12535–12547. [Google Scholar] [CrossRef]
- Bokoye, A.I.; Royer, A.; O’Neill, N.T.; Cliche, P.; Fedosejevs, G.; Teillet, P.M.; McArthur, L.J.B. Characterization of atmospheric aerosols across Canada from a ground-based sunphotometer network. Aerocan. Atmos. Ocean. 2001, 39, 429–456. [Google Scholar] [CrossRef]
- Kim, D.H.; Sohn, B.J.; Nakajima, T.; Takamura, T.; Takemura, T.; Choi, B.C.; Yoon, S.C. Aerosol optical properties over east Asia determined from ground-based sky radiation measurements. J. Geophys. Res. 2004, 109. [Google Scholar] [CrossRef]
- Uchiyama, A.; Yamazaki, A.; Togawa, H.; Asano, J. Characteristics of aeolian dust observed by sky-radiometer in the Intensive Observation Period 1 (IOP1). J. Meteorol. Soc. Jpn. 2005, 83A, 291–305. [Google Scholar] [CrossRef]
- Pappalardo, G.; Amodeo, A.; Apituley, A.; Comerón, A.; Freudenthaler, V.; Linné, H.; Ansmann, A.; Bösenberg, J.; D’Amico, G.; Mattis, I.; et al. EARLINET: Towards an advanced sustainable European aerosol lidar network. Atmos. Meas. Tech. 2014, 7, 2389–2409. [Google Scholar] [CrossRef] [Green Version]
- Guerrero-Rascado, J.L.; Landulfo, E.; Antuña, J.C.; Barbosa, H.M.J.; Barja, B.; Bastidas, A.E.; Bedoya, A.E.; Costa, R.; Estevan, R.; Forno, R.; et al. Latin American Lidar Network (LALINET) for aerosol research: Diagnosis on network instrumentation. J. Atmos. Sol.-Terr. Phys. 2016. [Google Scholar] [CrossRef]
- Welton, E.J.; Campbell, J.R.; Spinhirne, J.D.; Scott, V.S. Global monitoring of clouds and aerosols using a network of micro-pulse lidar systems. Proc. SPIE 2001, 4153. [Google Scholar] [CrossRef]
- Che, H.; Zhang, X.Y.; Chen, H.B.; Damiri, B.; Goloub, P.; Li, Z.Q.; Zhang, X.C.; Wei, Y.; Zhou, H.G.; Dong, F.; et al. Instrument calibration and aerosol optical depth validation of the China aerosol remote sensing network. J. Geophys. Res. 2009, 114. [Google Scholar] [CrossRef]
- Che, H.; Zhang, X.Y.; Xia, X.; Goloub, P.; Holben, B.; Zhao, H.; Wang, Y.; Zhang, X.C.; Wang, H.; Blarel, L.; et al. Ground-based aerosol climatology of China: Aerosol optical depths from the China aerosol remote sensing network (CARSNET) 2002–2013. Atmos. Chem. Phys. 2015, 15, 7619–7652. [Google Scholar] [CrossRef]
- Tao, R.; Che, H.Z.; Chen, Q.L.; Wang, Y.Q.; Sun, J.Y.; Zhang, X.C.; Lu, S.; Guo, J.P.; Wang, H.; Zhang, X.Y. Development of an integrating sphere calibration method for Cimel sunphotometers in China aerosol remote sensing network. Particuology 2014, 13, 88–99. [Google Scholar] [CrossRef]
- Che, H.Z.; Wang, Y.Q.; Sun, J.Y.; Zhang, X.C. Assessment of In-situ langley calibration of CE-318 sunphotometer at Mt. Waliguan Observatory, China. SOLA 2011, 7. [Google Scholar] [CrossRef]
- Che, H.; Xia, X.; Zhu, J.; Li, Z.; Dubovik, O.; Holben, B.; Goloub, P.; Chen, H.; Estelles, V.; Cuevas-Agulló, E.; et al. Column aerosol optical properties and aerosol radiative forcing during a serious haze-fog month over North China Plain in 2013 based on ground-based sunphotometer measurements. Atmos. Chem. Phys. 2014, 14, 2125–2138. [Google Scholar] [CrossRef]
- Yu, J.; Che, H.Z.; Chen, Q.L.; Xia, X.A.; Zhao, H.J.; Wang, H.; Wang, Y.Q.; Zhang, X.Y.; Shi, G.Y. Investigation of aerosol optical depth (AOD) and Ångström exponent over the desert region of Northwestern China based on measurements from the China aerosol remote sensing network. Aerosol. Air. Qual. Res. 2014, 15, 2024–2036. [Google Scholar] [CrossRef]
- Zhao, H.J.; Che, H.Z.; Ma, Y.J.; Xia, X.A.; Wang, Y.F.; Wang, P.; Wu, X.C. Temporal variability of the visibility, particulate matter mass concentration and aerosol optical properties over an urban site in Northeast China. Atmos. Res. 2015, 166. [Google Scholar] [CrossRef]
- Xia, X.; Che, H.; Zhu, J.; Chen, H.; Cong, Z.; Deng, X.; Fan, X.; Fu, Y.; Goloub, P.; Jiang, H.; et al. Ground-based remote sensing of aerosol climatology in China: Aerosol optical properties, direct radiative effect and its parameterization. Atmos. Environ. 2015, 124. [Google Scholar] [CrossRef]
- Kaufman, Y.J.; Gitelson, A.; Karnieli, A.; Ganor, E.; Fraser, R.S.; Nakajima, T.; Mattoo, S.; Holben, B.N. Size distribution and scattering phase function of aerosol particles retrieved from sky brightness measurements. J. Geophys. Res. 1994, 99. [Google Scholar] [CrossRef]
- Eck, T.F.; Holben, B.N.; Reid, J.S.; Dubovik, O.; Smirnov, A.; O'neill, N.T.; Slutsker, I.; Kinne, S. Wavelength dependence of the optical depth of biomass burning, urban, and desert dust aerosols. J. Geophys. Res. 1999, 104, 31333–31349. [Google Scholar] [CrossRef]
- Wagner, F.; Silva, A.M. Some considerations about Angström exponent distributions. Atmos. Chem. Phys. 2008, 8, 481–489. [Google Scholar] [CrossRef]
- Zhang, R.; Jing, J.; Tao, J.; Hsu, S.-C.; Wang, G.; Cao, J.; Lee, C.S.L.; Zhu, L.; Chen, Z.; Zhao, Y.; et al. Chemical characterization and source apportionment of PM2.5 in Beijing: Seasonal perspective. Atmos. Chem. Phys. 2013, 13, 7053–7074. [Google Scholar] [CrossRef]
- Dubovik, O.; King, M.D. A flexible inversion algorithm for the retrieval of aerosol optical properties from Sun and sky radiance measurements. J. Geophys. Res. 2000, 105, 673–696. [Google Scholar] [CrossRef]
- Dubovik, O.; Smirnov, A.; Holben, B.N.; King, M.D.; Kaufman, Y.J.; Eck, T.F.; Slutsker, I. Accuracy assessments of aerosol optical properties retrieved from AERONET sun and sky radiance measurements. J. Geophys. Res. 2000, 105, 9791–9806. [Google Scholar] [CrossRef]
- Dubovik, O.; Sinyuk, A.; Lapyonok, T.; Holben, B.N.; Mishchenko, M.; Yang, P.; Eck, T.F.; Volten, H.; Munoz, O.; Veihelmann, B.; et al. Application of spheroid models to account for aerosol particlenonsphericity in remote sensing of desert dust. J. Geophys. Res. Atmos. 2006, 111. [Google Scholar] [CrossRef]
- Kasten, F. A new table and approximate formula for relative optical air mass. Arc. Meteorol. Geophys. Bio. 1966, 14, 206–233. [Google Scholar] [CrossRef]
- Kasten, F.; Young, A.T. Revised optical air mass tables and approximation formula. Appl. Opt. 1989, 28, 4735–4738. [Google Scholar] [CrossRef] [PubMed]
- Komhyr, W.D.; Mateer, C.L.; Hudson, R.D. Operations Handbook—Ozone Observations with A Dobson Spectrophotometer; Report No.6; WMO Global Ozone Research and Monitoring Project: Geneva, Switzerland, 1980. [Google Scholar]
- Fröhlich, C.; Shaw, G.E. New determination of Rayleigh scattering in the terrestrial atmosphere. Appl. Opt. 1980, 19, 1773–1775. [Google Scholar] [CrossRef] [PubMed]
- Thome, K.J.; Herman, B.M.; Reagan, J.A. Determination of precipitable water from solartransmission. J. Appl. Meteorol. 1992, 31, 157–165. [Google Scholar] [CrossRef]
- Paltridge, G.W.; Platt, C.M.R. Radiative processes in meteorology and climatology. Dev. Atmos. Sci. 1976, 5. [Google Scholar] [CrossRef]
- Smirnov, A.; Holben, B.N.; Eck, T.F.; Dubovik, O.; Slutsker, I. Cloud-screening and quality control algorithms for the AERONET database. Remote. Sens. Environ. 2000, 73, 337–349. [Google Scholar] [CrossRef]
© 2016 by the authors; licensee MDPI, Basel, Switzerland. This article is an open access article distributed under the terms and conditions of the Creative Commons by Attribution (CC-BY) license (http://creativecommons.org/licenses/by/4.0/).
Share and Cite
Gui, K.; Che, H.; Chen, Q.; Yu, J.; Zheng, Y.; Lu, S.; Wang, H.; Wang, Y.; Zhang, X.; Shi, G. Analysis of the Error in Retrievals of Aerosol Optical Properties from Sunphotometer Measurements of CARSNET Due to a Variety of Objective Factors. Atmosphere 2016, 7, 9. https://doi.org/10.3390/atmos7010009
Gui K, Che H, Chen Q, Yu J, Zheng Y, Lu S, Wang H, Wang Y, Zhang X, Shi G. Analysis of the Error in Retrievals of Aerosol Optical Properties from Sunphotometer Measurements of CARSNET Due to a Variety of Objective Factors. Atmosphere. 2016; 7(1):9. https://doi.org/10.3390/atmos7010009
Chicago/Turabian StyleGui, Ke, Huizheng Che, Quanliang Chen, Jie Yu, Yu Zheng, Sai Lu, Hong Wang, Yaqiang Wang, Xiaoye Zhang, and Guangyu Shi. 2016. "Analysis of the Error in Retrievals of Aerosol Optical Properties from Sunphotometer Measurements of CARSNET Due to a Variety of Objective Factors" Atmosphere 7, no. 1: 9. https://doi.org/10.3390/atmos7010009