Article

Synthesis Analysis of One Severe Convection Precipitation Event in Jiangsu Using Ground-Based GPS Technology

1
College of Meteorological Observation, Chengdu University of Information Technology, Chengdu 610225, China
2
Key Laboratory of Atmosphere Sounding, China Meteorological Administration, Chengdu 610225, China
3
Key Laboratory of Meteorological Disasters, Ministry of Education, Nanjing University of Information Science and Technology, Nanjing 210044, China
4
Meteorological Service Center of Jiangsu Province, Jangsu Meteorological Bureau, Nanjing 210008, China
*
Author to whom correspondence should be addressed.
Atmosphere 2015, 6(7), 908-927; https://doi.org/10.3390/atmos6070908
Submission received: 17 March 2015 / Revised: 27 June 2015 / Accepted: 2 July 2015 / Published: 10 July 2015

Abstract

:
Global positioning system (GPS) detection technology has several advantageous characteristics (i.e., all-weather applications, high accuracy, high spatial and temporal resolution, and low cost), and GPS tracking and monitoring techniques for water vapor have developed rapidly in recent years. The GPS-precipitable water vapor (GPS-PWV), obtained through inversion using this technology can reflect the water vapor inflow and outflow in a vertical air column above a certain area in nearly real-time, which is especially important for areas of severe water vapor variation. In this paper, we studied the relationship between GPS-PWV variation and actual precipitation. The specific aim was to identify the underlying physical mechanisms driving the variation and to further strengthen the utility of GPS-PWV in forecasts and warnings of severe convection weather. We concluded that (1) rapid rise in the GPS-PWV in the long-term low-level data predicted the arrival of precipitation and was therefore useful in weather forecasts; (2) the GPS-PWV variation was closely related with the movement of the water vapor transfer belt; (3) the atmosphere showed an unstable energy structure before the GPS-PWV increase; and (4) local motion was strongly related with the development and maintenance of precipitation.

1. Introduction

Although water vapor represents a small fraction of the atmosphere, it is its most active element and it plays a critical role in atmospheric processes such as cloud formation, precipitation, and climatic variation [1,2]. Radio-sounding data, which are commonly used in weather studies [3], barely reflect the continuous transformations in atmospheric water vapor because of their low temporal and spatial horizontal resolution. Consequently, such data fail to satisfy the requirements for advanced weather research such as highly refined forecasting of weather changes. Global positioning system meteorology (GPS/MET) started in the 1990s and developed rapidly. It has many advantages for obtaining atmospheric water vapor content data. For example, this technology can be used to obtain large volumes of data with high precision and high spatial–temporal resolution at low costs; furthermore, this data can be used in all-weather conditions and can be supplied at near real-time [4,5]. Studies have proven that GPS/MET data have a precision equivalent to data obtained by microwave radiometers and radiosondes [4,6,7,8]; thus, this technology has gained attention from meteorologists in recent years and has gradually become an effective water vapor detection method, especially for refined forecasts of sudden heavy precipitation. The GPS-precipitable water vapor (GPS-PWV) data obtained through inversion using this technology reflect the inflow and outflow of water vapor in a vertical air column above a certain area in nearly real-time [9,10], which is especially important in areas of severe water vapor variation [11]. Hence, GPS-PWV data have been widely used in meteorology applications.
The precipitable water vapor (PWV) data, derived from inversion of ground-based GPS data, have been used for data assimilation and numerical model calibration efforts, climate studies, and precipitation forecasts and analyses. Notably, GPS-derived PWV data can be used as an independent data source to evaluate and correct the output results of a model so as to further improve the output precision. Using GPS-PWV data for the Great Plains in the mid-western United States, Roman et al. [12] systematically assessed the water vapor data obtained from various global climate models and determined the water vapor errors under various models through comparison, thus improving the precision in the water vapor outflow in global and regional climate models to a certain extent. Bennitt et al. [13] assimilated GPS-derived zenith total delay (ZTD) data into a numerical weather forecast model and found that such assimilation improved the performance of cloud prediction to a certain degree. Poli et al. [14] found that assimilation of ZTD data into a four-dimensional variational data assimilation and forecast system enhanced the accuracy of predictions for precipitation regions in France, and this, in turn, improved the precision of the 12–36 h precipitation forecasts. Because of the high precision and high spatial and temporal resolution of GPS-PWV data, long-term continuous GPS-PWV time series can be also used for the monitoring and assessment of the climate system. Means [15] analyzed almost seven years worth of GPS-PWV data for California and Nevada and discovered that variations in the North American monsoon significantly affected the PWV distribution; additionally, a close correlation was found between the PWV variation and the start and end of the monsoon. Wang et al. [10] performed a multi-scale analysis on the unique “autumn rainfall” phenomenon in the Chengdu Plain region based on a 30-min interval GPS-PWV time series and identified the physical mechanism underlying “autumn rainfall” formation by combining a synthesis analysis approach with the unique local topographical conditions and climate features. Ryu et al. [16] analyzed the features of water vapor transport in the middle Atlantic states based on GPS-PWV data with high spatial and temporal resolution, and their analysis results showed that water vapor exhibited significant seasonal changes but only small daily changes. Meanwhile, climate-scale studies also revealed the difference in water vapor flux under precipitating and non-precipitating conditions. Because of the high precision as well as high spatial–emporal resolution, GPS-PWV data are also suitable for all-weather applications that seek to predict and monitor strong precipitation events. Kanda [17] analyzed the total water vapor in the atmosphere in the Kanto region and discovered a close relationship between precipitation and water vapor over 1-h increments. That study found that the peak in total water vapor generally preceded precipitation by 1–2 h. When using the total water vapor as an index for precipitation forecasting, its accuracy rate reached approximately 60%. Liu et al. [18] concluded that with levels of total atmospheric water vapor above 25 mm and an increase in water vapor higher than 5 mm, the probability of precipitation is about 50%. Radhakrishna [19] predicted a convective event 3 h before its occurrence by monitoring GPS-PWV variations. Through analyzing two main systems (the plateau vortex and southwest vortex) that affect the precipitation in South China, Li et al. [20] found that GPS-PWV increased rapidly before the development of the plateau vortex and southwest vortex, and precipitation mainly occurred during the time periods with high GPS-PWV levels. Moore et al. [21] found that a dense GPS-PWV monitoring network could play a very important role in the timely release of information about floods, debris flows, and other disasters, and such data could effectively complement the 1–6 h numerical forecasting results.
In this research, we studied the relationship between GPS-PWV variation and actual precipitation using a typical severe convection weather event as an example. Previous domestic and overseas studies on the application of GPS-PWV in severe convection weather mainly discovered that there is a close relationship between the total water vapor in the atmosphere, as measured by remote sensing, and the local precipitation, i.e., there is typically significant change in PWV before and after precipitation. However, under severe convection weather, the configuration and movement speed of the synoptic situation will have an important influence on the water vapor transfer rate, dynamic lifting, and thermodynamic variation [20], with the variation among the three determining the start time, development strength, duration, and other weather characteristics. Since current research on practical synoptic processes using GPS-PWV is mostly limited to the correspondence between the PWV variation and the actual rainfall, and research on the physical mechanisms involved is lacking, there are considerable uncertainties regarding this relationship (e.g., there can be a 3–16 h difference between the GPS-PWV and the precipitation peak), making an effective forecast difficult. The aim of this research was to not only investigate the corresponding relationship between GPS-PWV and precipitation, but also to further identify the underlying physical mechanisms behind GPS-PWV variation. Clarification of such mechanisms can further strengthen the application of GPS-PWV in forecasts and warnings of severe convection weather. A detailed description of the severe weather event that was used in this study is presented in Section 2. The data acquisition procedures and methods are discussed in Section 3. Section 4 presents and discusses detailed variations in the GPS-PWV and the physical mechanisms that drive it. The last section presents the conclusions, discusses remaining problems, and recommends potentially valuable future research directions.

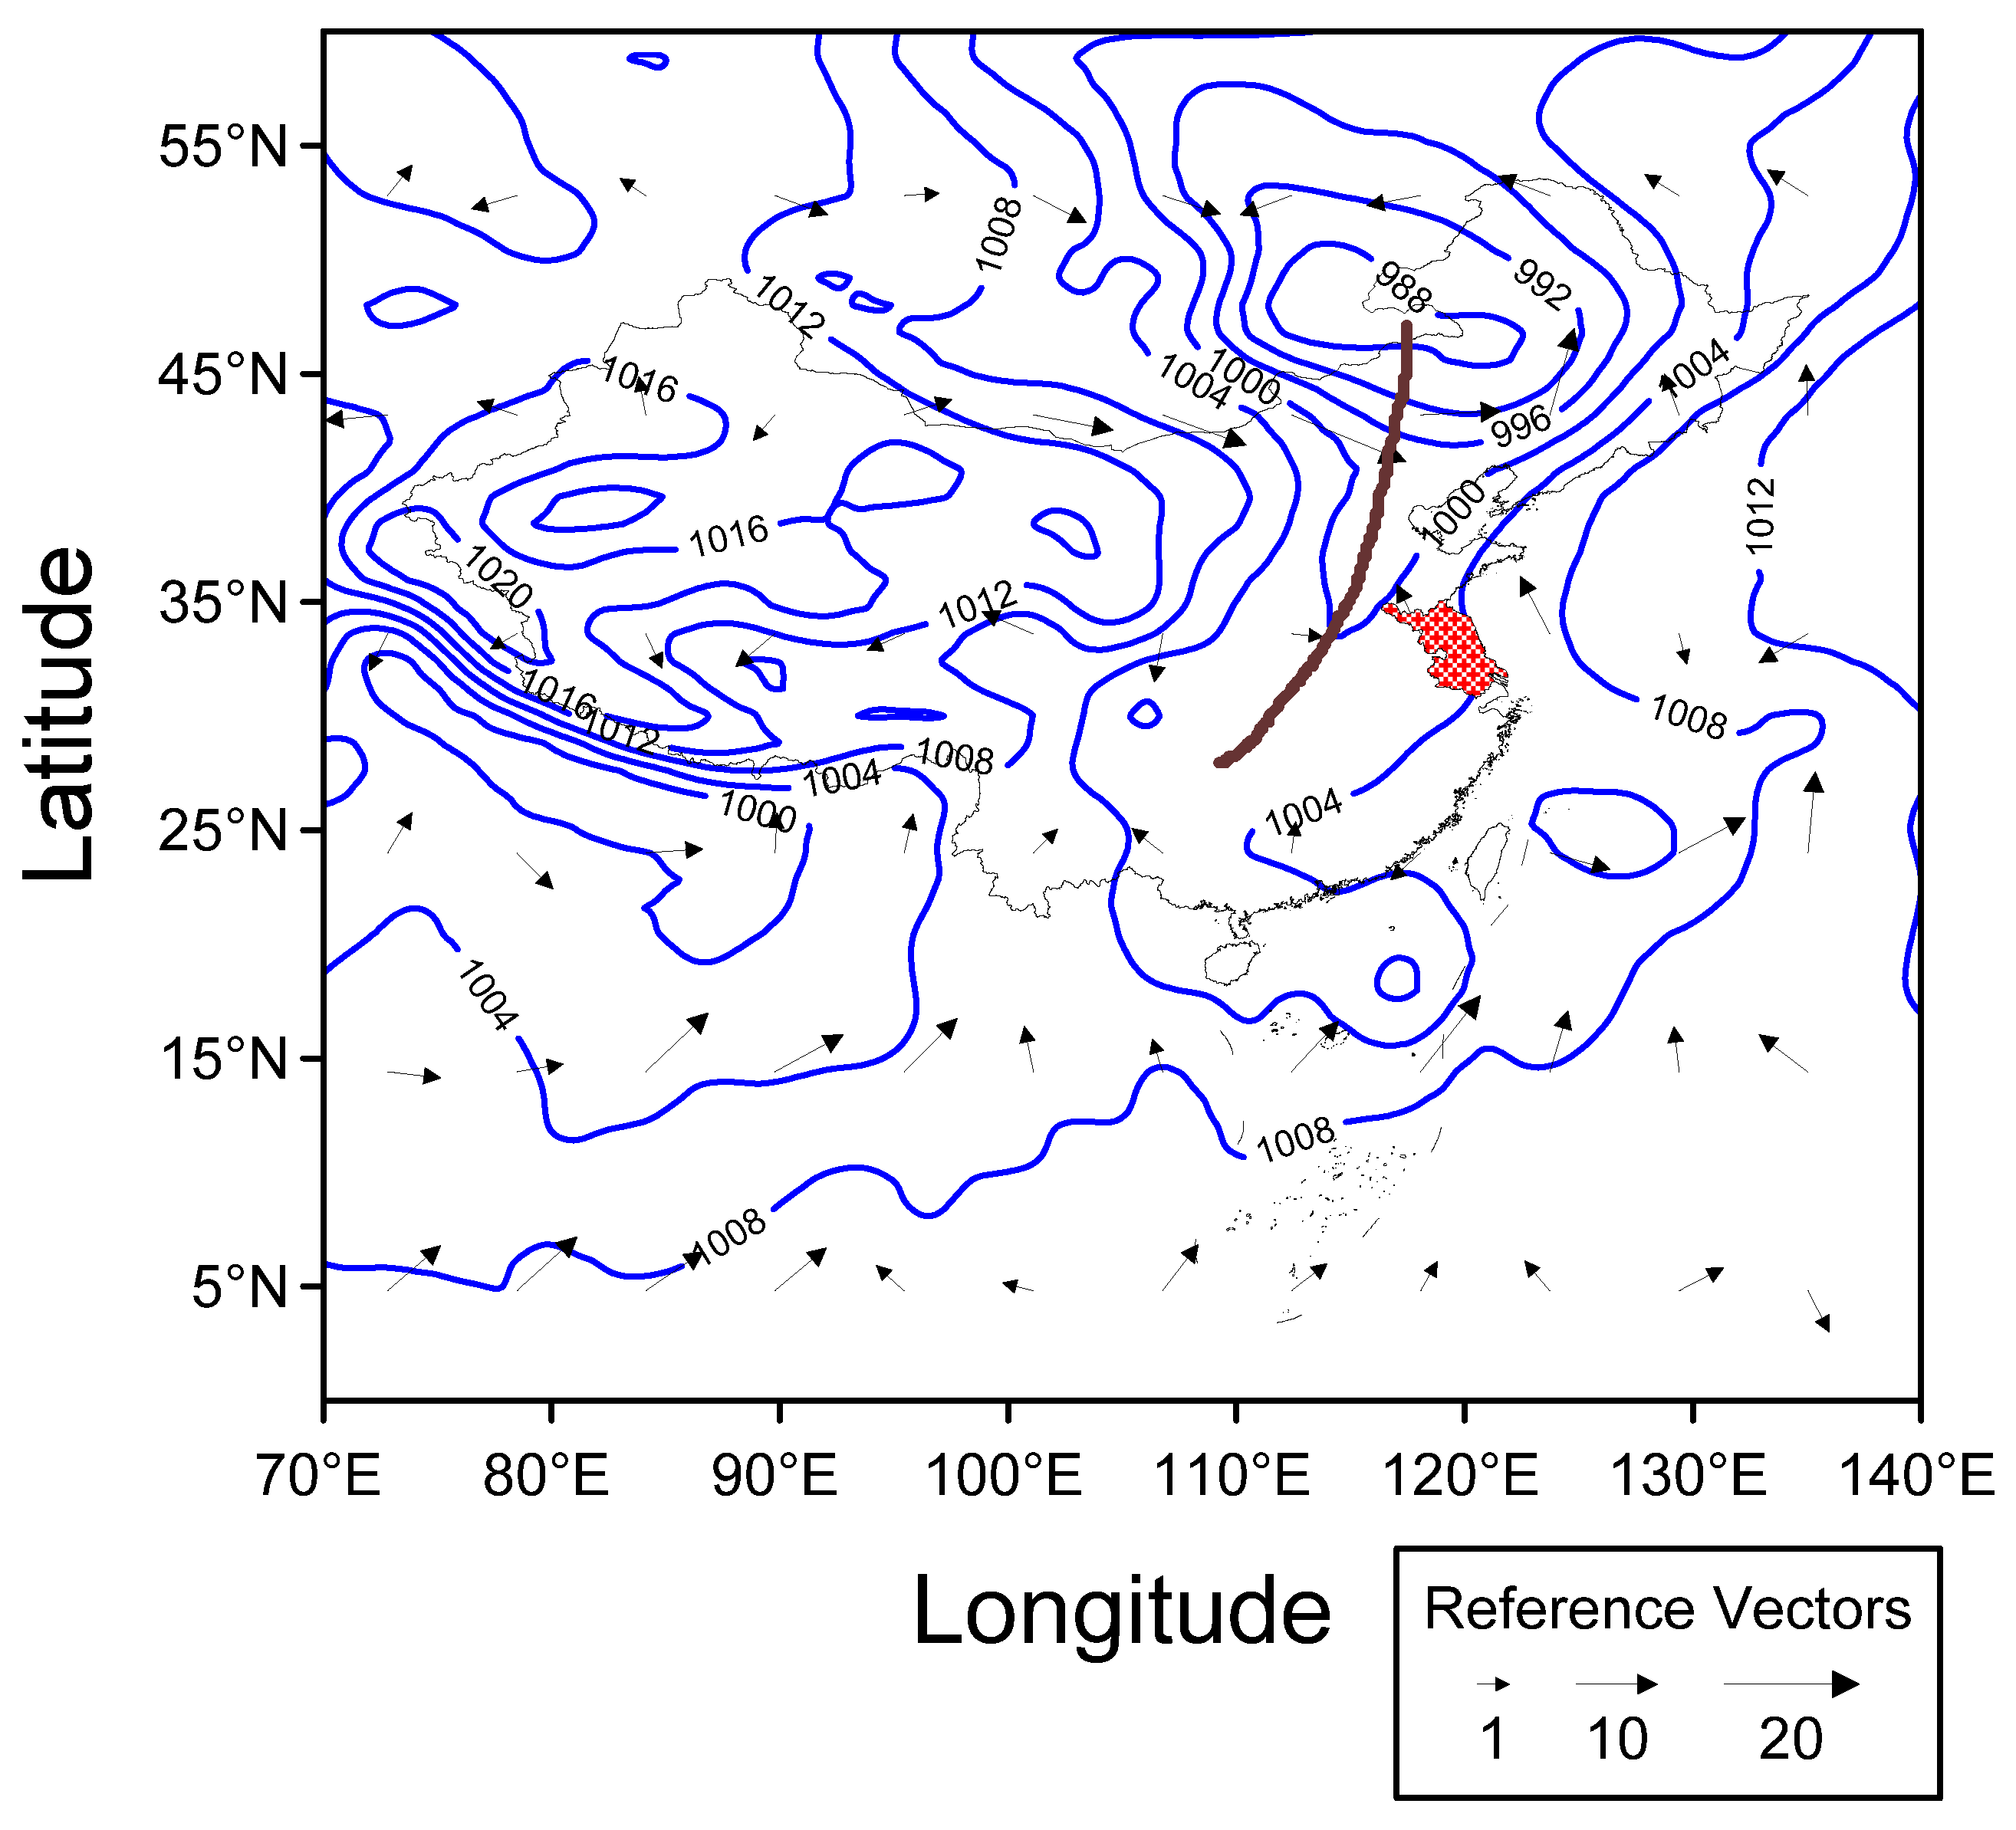
2. Case Study: 19–22 June 2009 Convective Weather Event

The Jiangsu Province (116° E–121° E, 30° N–35° N), which has a subtropical monsoon climate, is a region in China that experiences frequent rainstorms. In this region, intense precipitation may occur over a large area during abnormal monsoon circulation [22]. In general, rainstorm disasters mainly occur in the Jiangsu Province for the following two reasons: abnormally large amount of precipitation that tends to fall during the East Asian rainy season (the Meiyu flood period) and the exceptionally severe rainstorm events caused by strong typhoons. Statistical data show that floods occur in the Jiangsu Province frequently from May to September, and floods are most frequent during June to July, which is when 78.3% of the annual flood events happened. Over a period of 40 years, the Jiangsu Province has suffered 17 major flood events, with an average occurrence frequency of 2–3 years, and six catastrophic floods, with an average occurrence frequency of seven years [22].
During 19–22 June 2009, under the influence of an upper-level trough, many provinces in east China experienced meso- to micro-scale severe convection weather. The Jiangsu Province, in particular, experienced heavy precipitation over a short period of time. This event was the result of a combination of local weather conditions and background large-scale circulation, and it was associated with intense rainfall resulting from the confluence of typical cold air from the southwest wind trough and southeastern warm air from low latitudes. At 12:00 a.m. (UTC) on 19 June 2009, the upper air circulation chart showed two troughs and one ridge for the 500-hPa level (data not shown). The Ural Mountains showed a high ridge, and a low eddy was located west of the Ural Mountain and Baikal area. The 700 and 850 hPa upper air charts showed a low eddy center near the Baikal area, which was indicative of a deep low-value system with a trough line located along the Liaoning Province (113°–119°E, 36°–42°N), Shandong Province (114°–122°E, 34°–38°N), and Shanxi Province (110°–114°E, 34°–40°N). In addition, there was strong southwest airflow south of the Yangtze River. In the surface weather chart (Figure 1), a cold eddy was observed in northeast China with a negative temperature center of −13 °C. During this period, the two troughs and the ridge remained stable, while the low Baikal trough slowly moved east, and this affected the weather in east China. Later, the trough line of the lower level also moved east and reached Jiangsu at 12:00 p.m. on 19 June. This movement strengthened the low-level jet south of the share line, which favored the abundant transfer of water vapor from the low latitudes to the upper reaches of the Yangtze River. The faster movement of the 500-hPa trough over the lower-level trough caused a fore rake structure and unstable convection, and this resulted in typical strong convection weather.
This severe convection weather involved thunderstorms, gales, and intense rainfall in several areas of the country including the region east of Shandong and Henan (110°–116°E, 31°–36°N), the area encompassing Jiangsu and Anhui (114°–119°E, 29°–34°N), and in Hubei (108°–116°E, 29°–33°N). Under the influence of this weather process, severe convection rainfall characterized by short but heavy precipitation occurred in several areas of the Jiangsu Province. Statistical data show that heavy rainfall (daily accumulated rainfall amount greater than 50 mm) occurred at 14 automatic stations in northern Jiangsu on 19 June. Moreover, heavy rainfall was detected at 19 and 21 automatic stations in southern Jiangsu on 20 June and 21 June, respectively.
Figure 1. Surface weather chart of 700 hPa for East Asia at 12:00 p.m. on 19 June 2009. The red area is the studied region in the Jiangsu Province, and the data in the figure were derived from the National Centers for Environmental Prediction (NCEP) 1° × 1° reanalysis data.
Atmosphere 06 00908 g001

3. Data Acquisition and Calculations
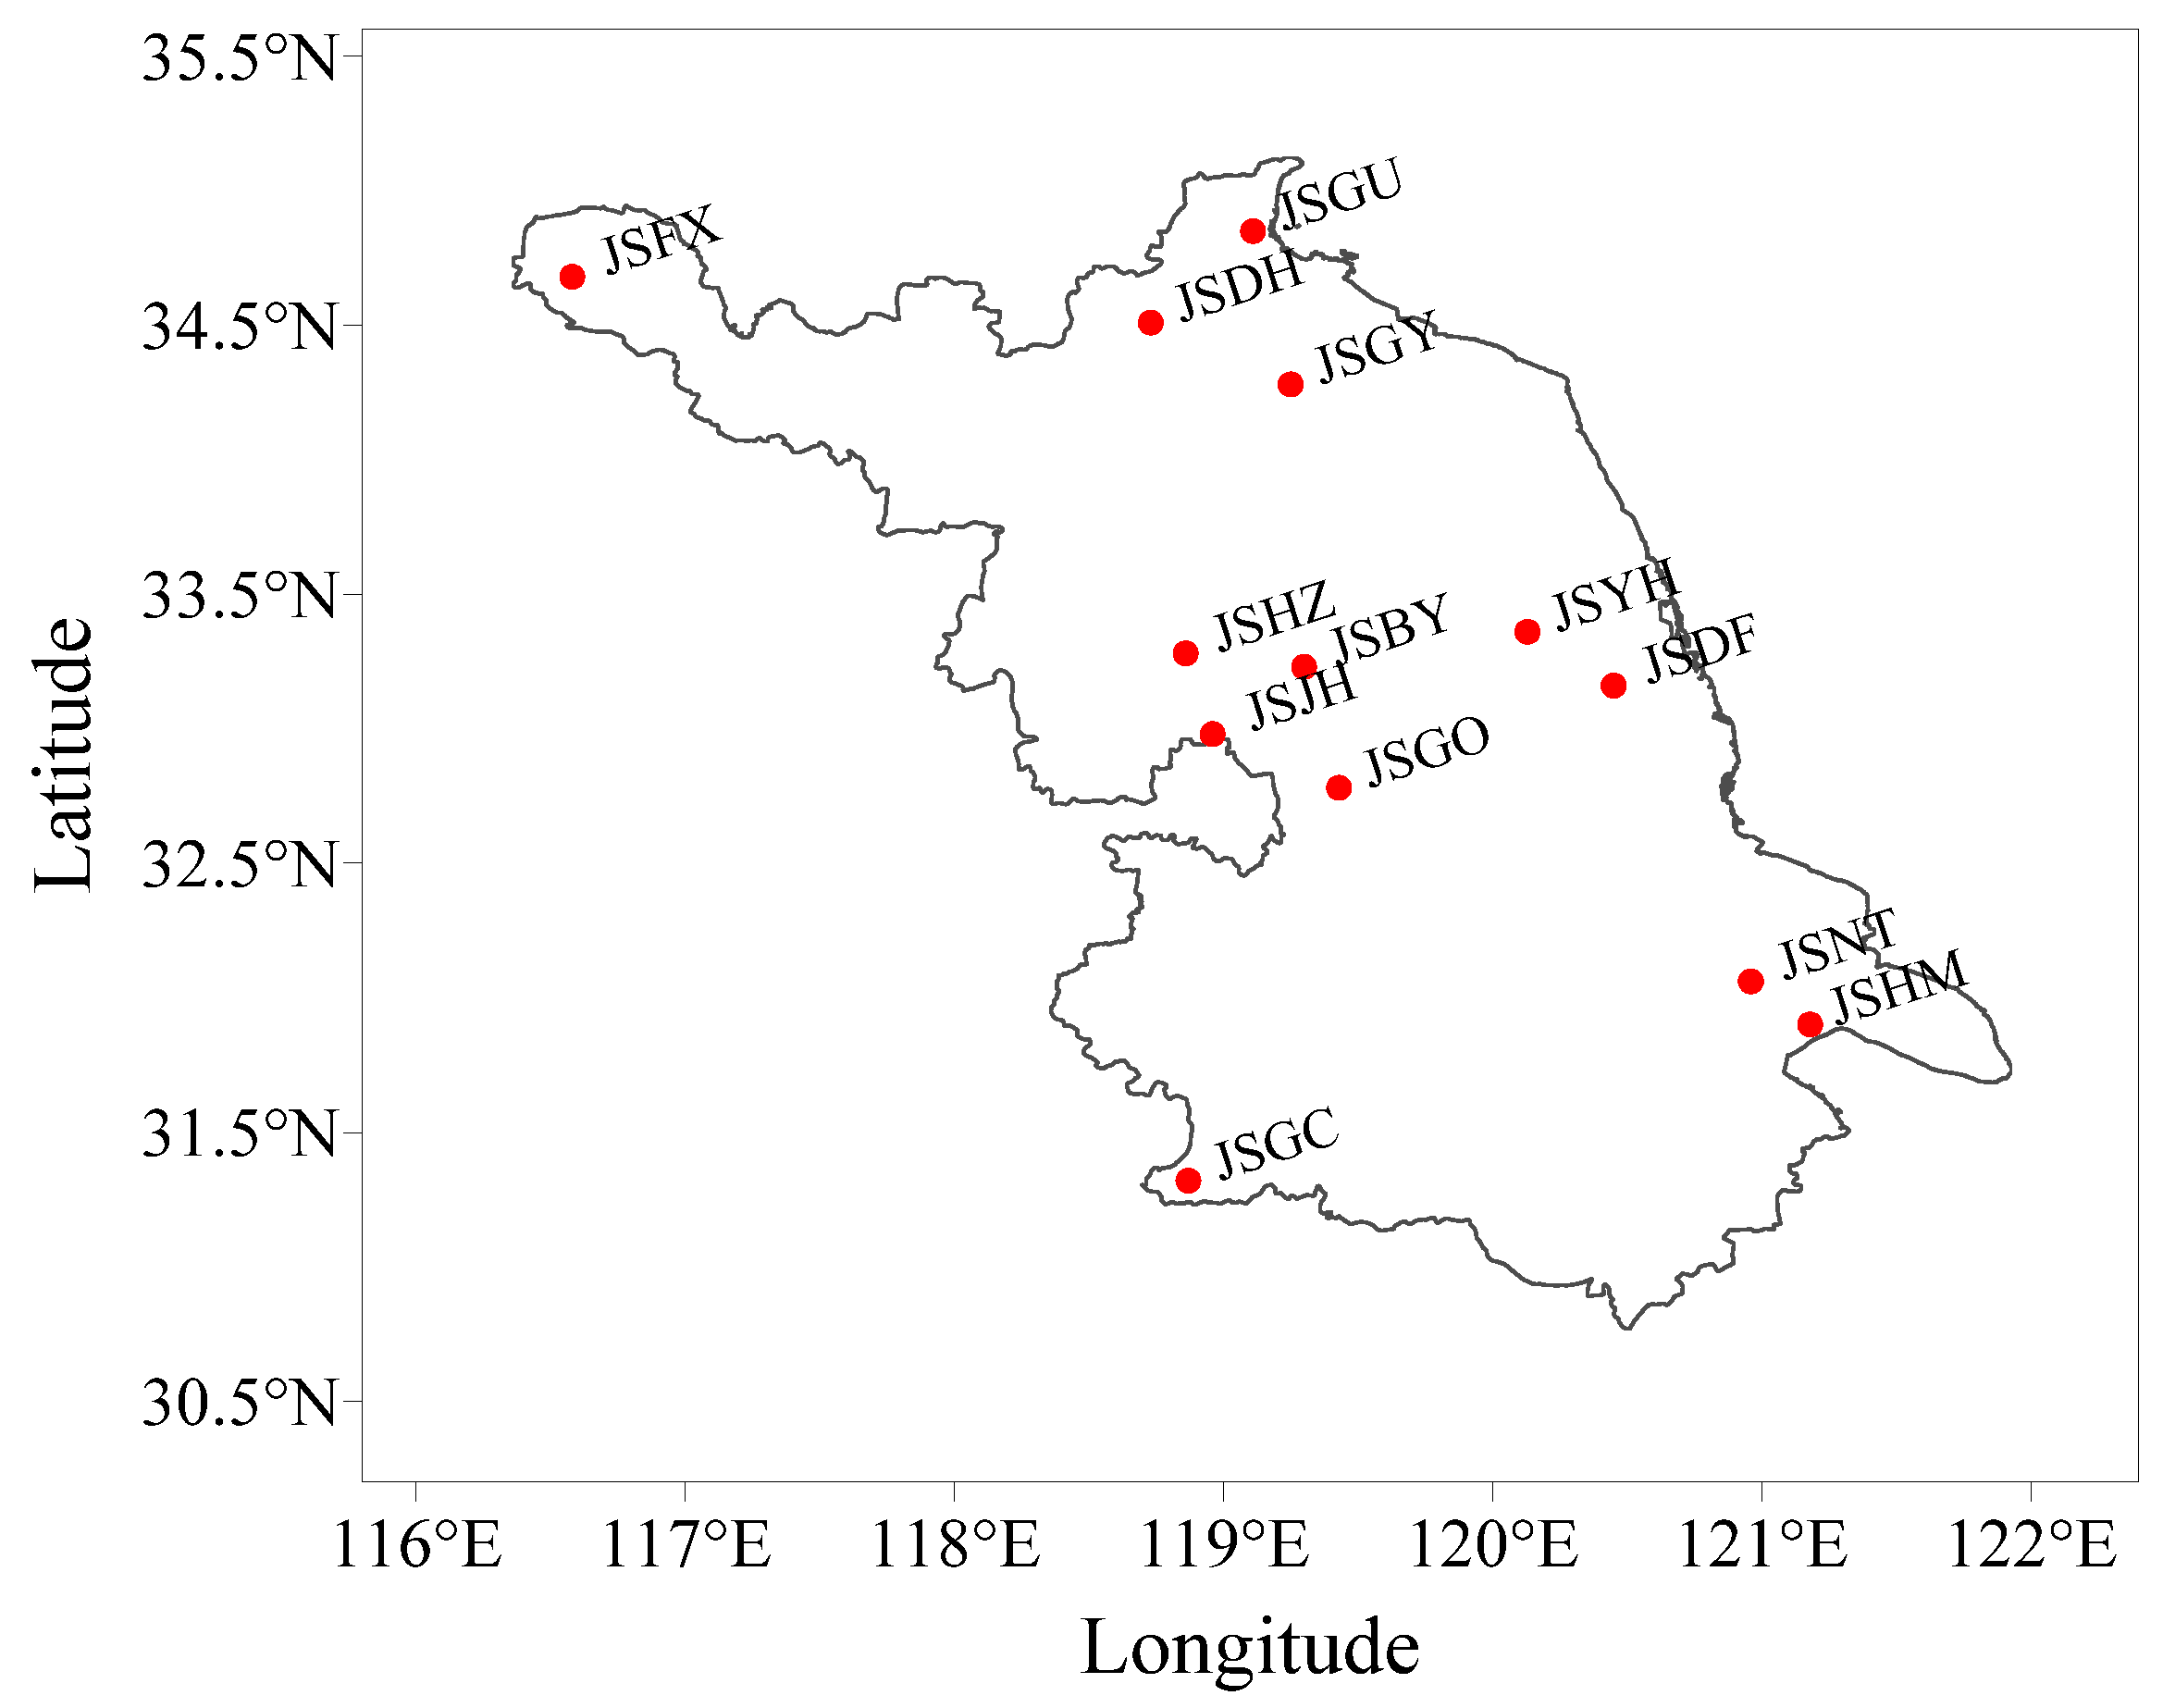
The GPS signals are affected by reflections in the ionosphere and troposphere, and there is typically a delay in the radio signal when the satellite signal reaches the GPS receiver on the ground. This delay can be defined as the difference between the real travel path of the signal and the rectilinear propagation in vacuum. In geodesy, it is the main error that affects measurement accuracy. In GPS meteorology, this error is inverted to obtain relevant meteorology data. The delay includes the ionospheric delay (ID) and the ZTD. Since the ID corresponds to the inverse ratio of the square of the signal’s frequency, it can be estimated using the signal delay difference given by the double frequency receiver, with an error precision on the order of millimeters. The ZTD includes the zenith hydrostatic delay (ZHD) and the zenith wet delay (ZWD). Since the error caused by the ZHD represents 90% of the ZTD, it can be confirmed with relative accuracy by the Saastamoine model [23]. The transition relation between the ZWD and the PWV can then be used to obtain the PWV in the atmosphere. This calculation can be described as follows:
Z W D = Z T D Z H D
P W V = × Z W D
where ZWD is the zenith wet delay, ZTD is the zenith total delay, ZHD is the zenith hydrostatic delay, and PWV is the transiting total water vapor in the air column equivalent to the height of a liquid water column. The term Π is a dimensionless conversion coefficient that is calculated as follows:
= 10 6 ρ w R v [ ( k 3 T m ) + k 2 ]
where ρw is the density of liquid water, k2=k2k1Rd/ρwand k1, k2, and k3 are experimental constants that were assumed to be equal to 77.6 k∙hPa−1 [4], 71.98 k∙hPa−1 [24], and 3.752 × 10⁵ k2∙hPa−1 [24], respectively. The term Tm is the weighted average temperature of the troposphere, which can be calculated by the empirical formula from Bevis [4] using the ground temperature Ts as follows:
T m = 70.2 + 0.72 T s
The weighted average temperature can also be obtained by a local parameter modification of Tm acquired with extensive sounding data [25].
Following the development of GPS technology, a Chinese GPS/MET monitoring network was constructed that consists of many ground-based GPS monitoring stations. Data from this network are used for many applications including in earthquake, mapping, astronomy, and reconnaissance studies, and data sharing has been vigorously promoted in meteorology departments throughout the country. Furthermore, the weather and mapping bureaus of the Jiangsu Province jointly constructed a water vapor monitoring network in 2006. This monitoring network uses the high precision GPS data processing software GAMIT/GLOBK, which was developed by researchers at the Massachusetts Institute of Technology (MIT) and Scripps Institution of Oceanography, to obtain near real-time PWV distributions by combining surface meteorological observations with highly resolved ground-based GPS-PWV data [26]. The GPS-PWV data for the period between 12:00 a.m. on 19 June and 12:00 a.m. on 22 June used in this study were provided by this monitoring network, and the data had a temporal resolution of 1 h. After considering the homogeneity and integrity of the spatial distributions of the data, 13 GPS stations were selected for further analysis. These stations, located in Jiangsu Province, include the northern stations of Fengxian (JSFX), Ganyu (JSGU), Donghai (JSDH), and Guanyun (JSGY); the middle region stations of Hongze (JSHZ), Baoying (JSBY), Yancheng (JSYH), Gaoyou (JSGO), Jinhu (JSJH), and Dafeng (JSDF); and the southern stations of Gaocun (JSGC), Nantong (JSNT), and Haimen (JSHM) (Table 1, Figure 2). Before analysis, a quality control procedure was performed on the GPS-PWV data to assure that it met the requirements for meteorology applications [10]. Each GPS receiver was equipped with a weather station at close proximity so that the derived GPS-PWV data would represent the actual amount of PWV at the station. In terms of precision determinations, because 13 GPS stations did not have corresponding radiosonde or microwave radiometer data at the same locations for comparative analyses [10], the precipitable water data at 360 time points during a three-month period (June, July, and August of 2009) were selected from the National Centers for Environmental Prediction (NCEP) reanalysis dataset and the GPS-derived PWV data at the same time points were used for comparative analyses in this study. The analysis results showed that except for three stations, namely, JSGU, JSDF, and JSNT, where the root-mean-square error was greater than 6 mm (11.2 mm for JSGU, 8.8 mm for JSDF, and 7.4 mm for JSNT), all the other stations met the precision requirements for PWV measurements in meteorological applications. We believe that the reason for this large error in PWV is that these three stations are located in the coastal area, and consequently, they had more drastic vapor variations within a wider range than the other stations. Importantly, the errors mainly occurred during the time periods with drastic PWV variations. At these three stations, all the GPS-derived PWV values were greater than the PWV values obtained from the NCEP reanalysis data. After excluding several time periods with significant PWV variations from the GPS-PWV time series, we compared the GPS-derived PWV data with the PWV data obtained from NCEP reanalysis and found that the root-mean-square error associated with PWV data were less than 6 mm. From the above analysis, we concluded that such data could meet the requirements for meteorological applications and that GPS-PWV data might better illustrate the drastic variation tendencies of water vapor.
Figure 2. Location of the Global positioning system (GPS) stations (JSFX, JSGY, JSDH, JSGY, JSHZ, JSBY, JSYH, JSGO, JSJH, JSDF, JSGC, JSNT, and JSHM).
Atmosphere 06 00908 g002
Table 1. Information for each station, including the longitude, latitude, and altitude.
StationLongitude (°)Latitude (°)Altitude (m)
JSFX116.5834.6834
JSGU119.1134.8510
JSDH118.7334.5137
JSGY119.2534.2819
JSHZ118.8633.2814
JSBY119.3033.239
JSYH120.1333.3634
JSGO119.4332.7819
JSJH118.9632.9828
JSDF120.4533.1612
JSGC118.8731.3219
JSNT120.9632.0616
JSHM121.1831.9016
For the purpose of analysis, we also used NCEP reanalysis data [27] with a spatial resolution of 1° × 1° and a temporal resolution of 6 h.

4. Results and Discussion

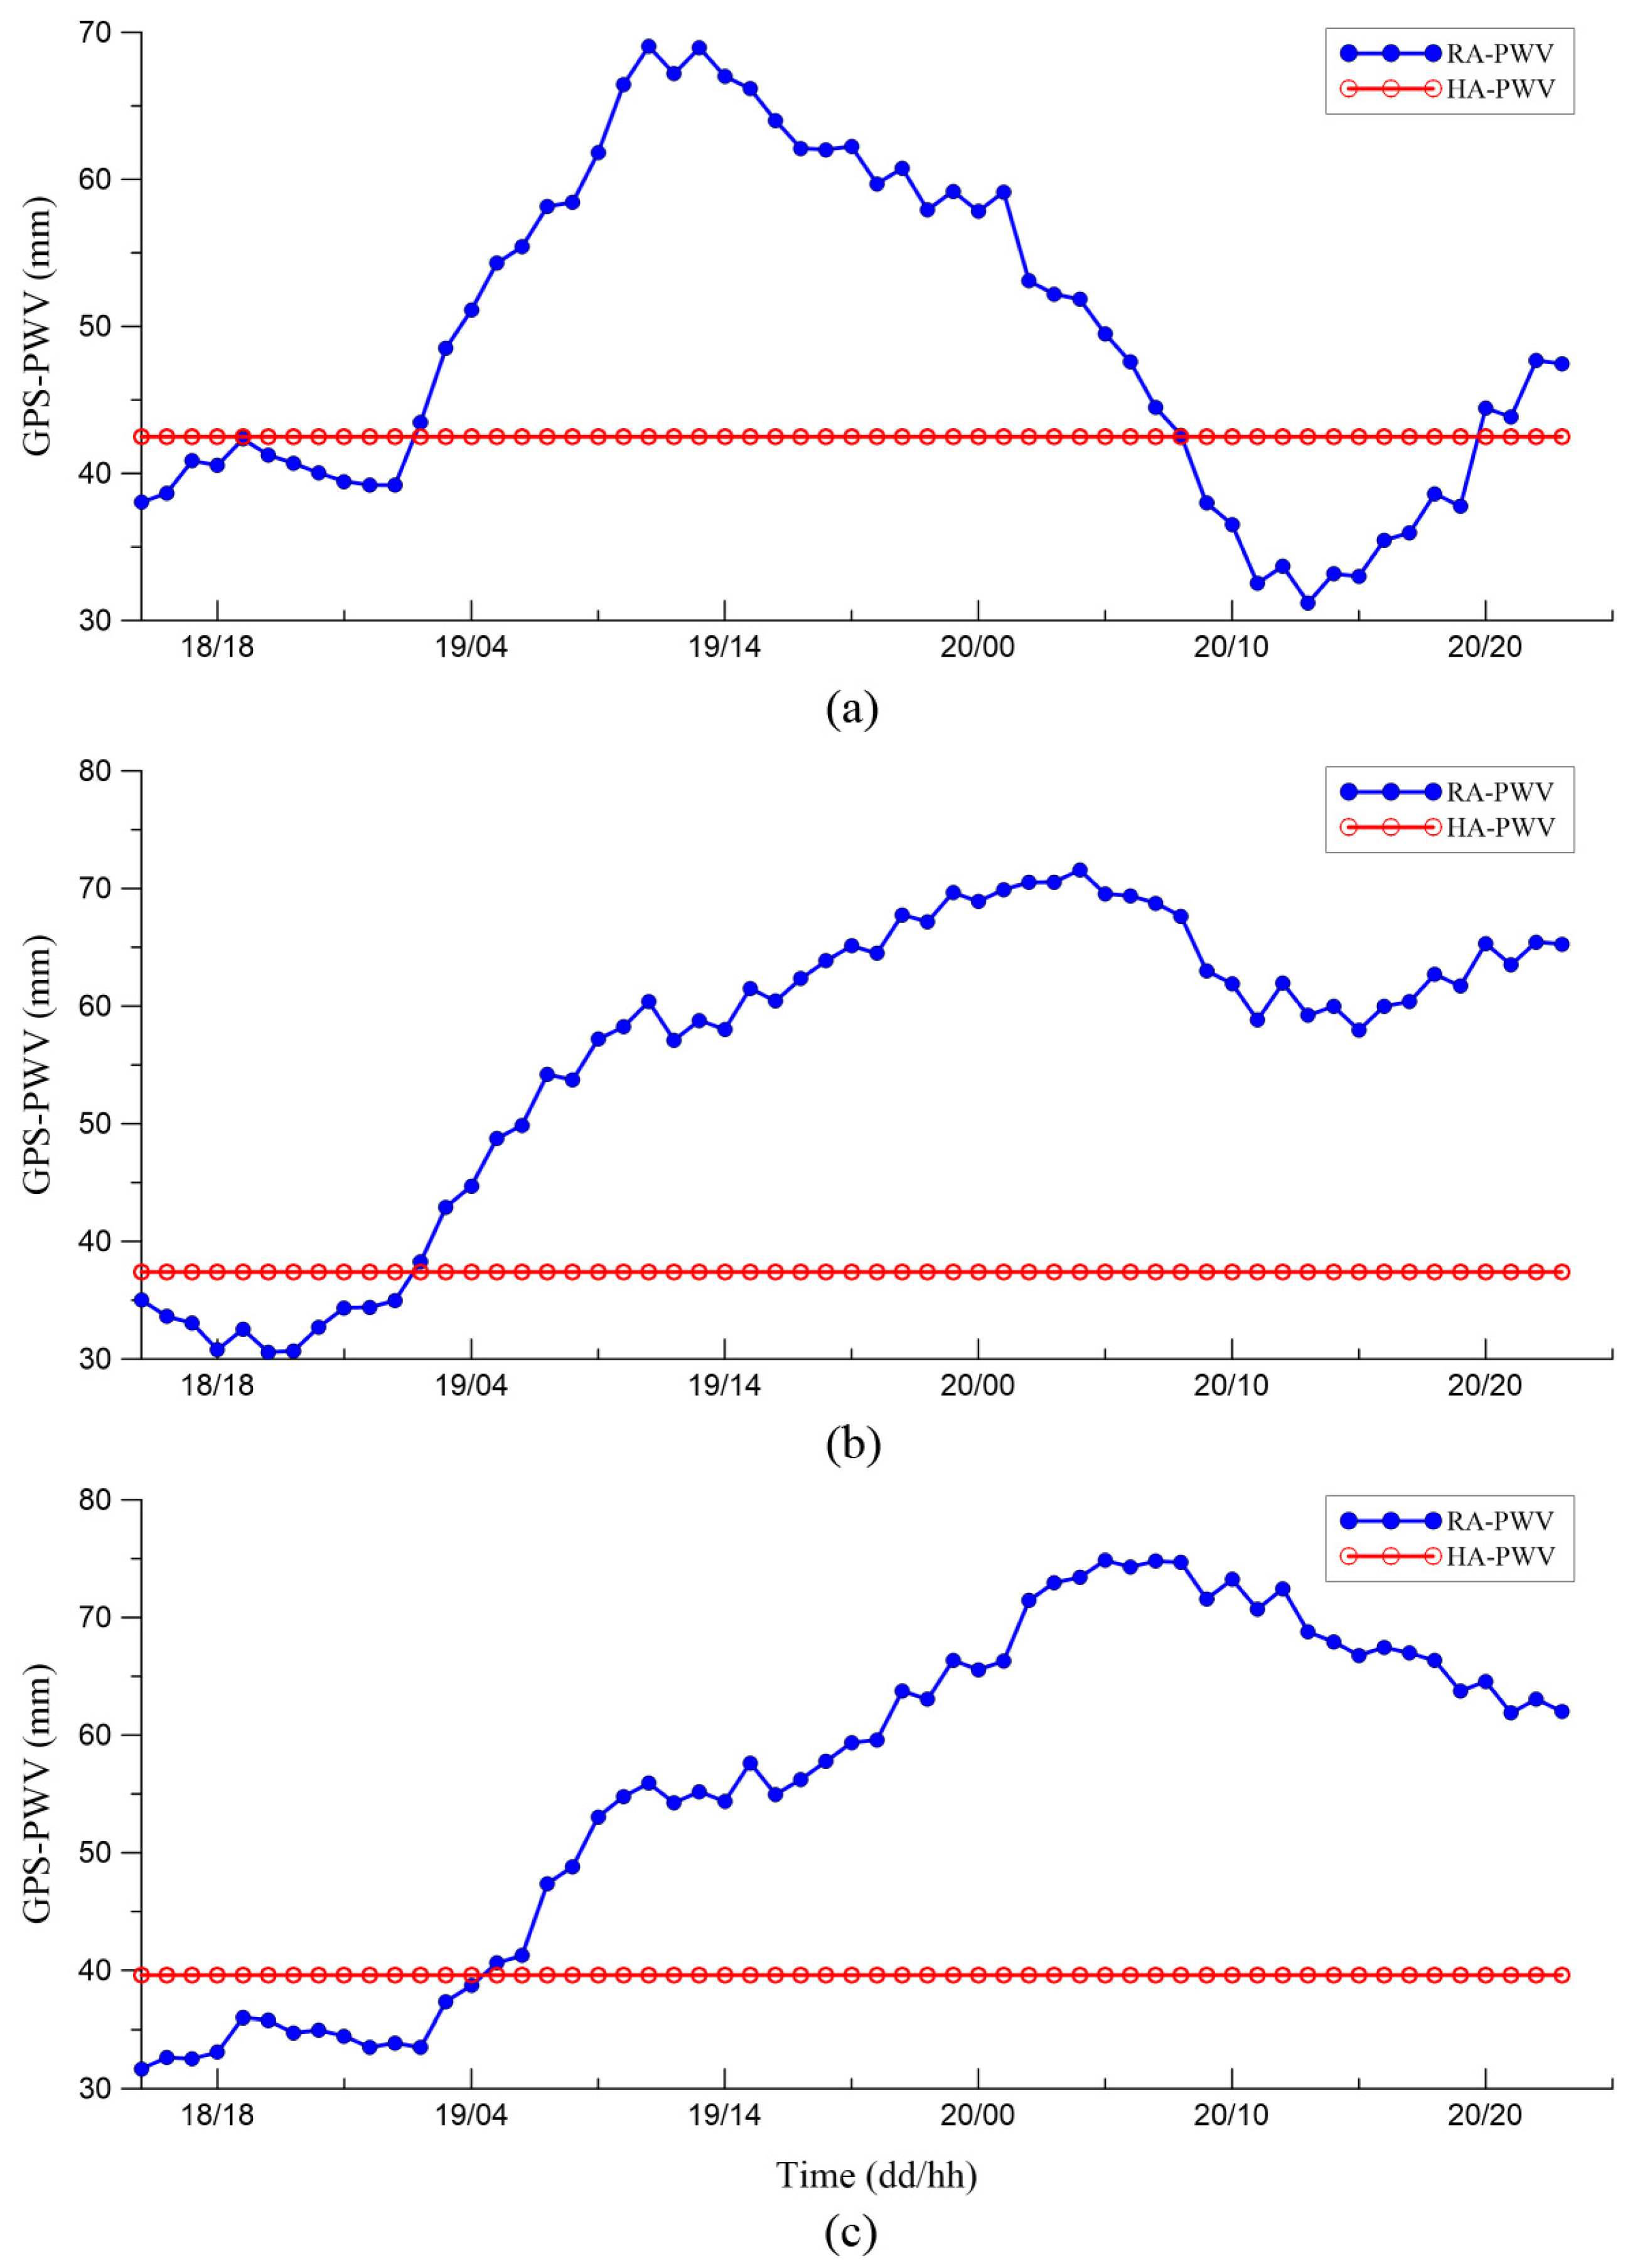
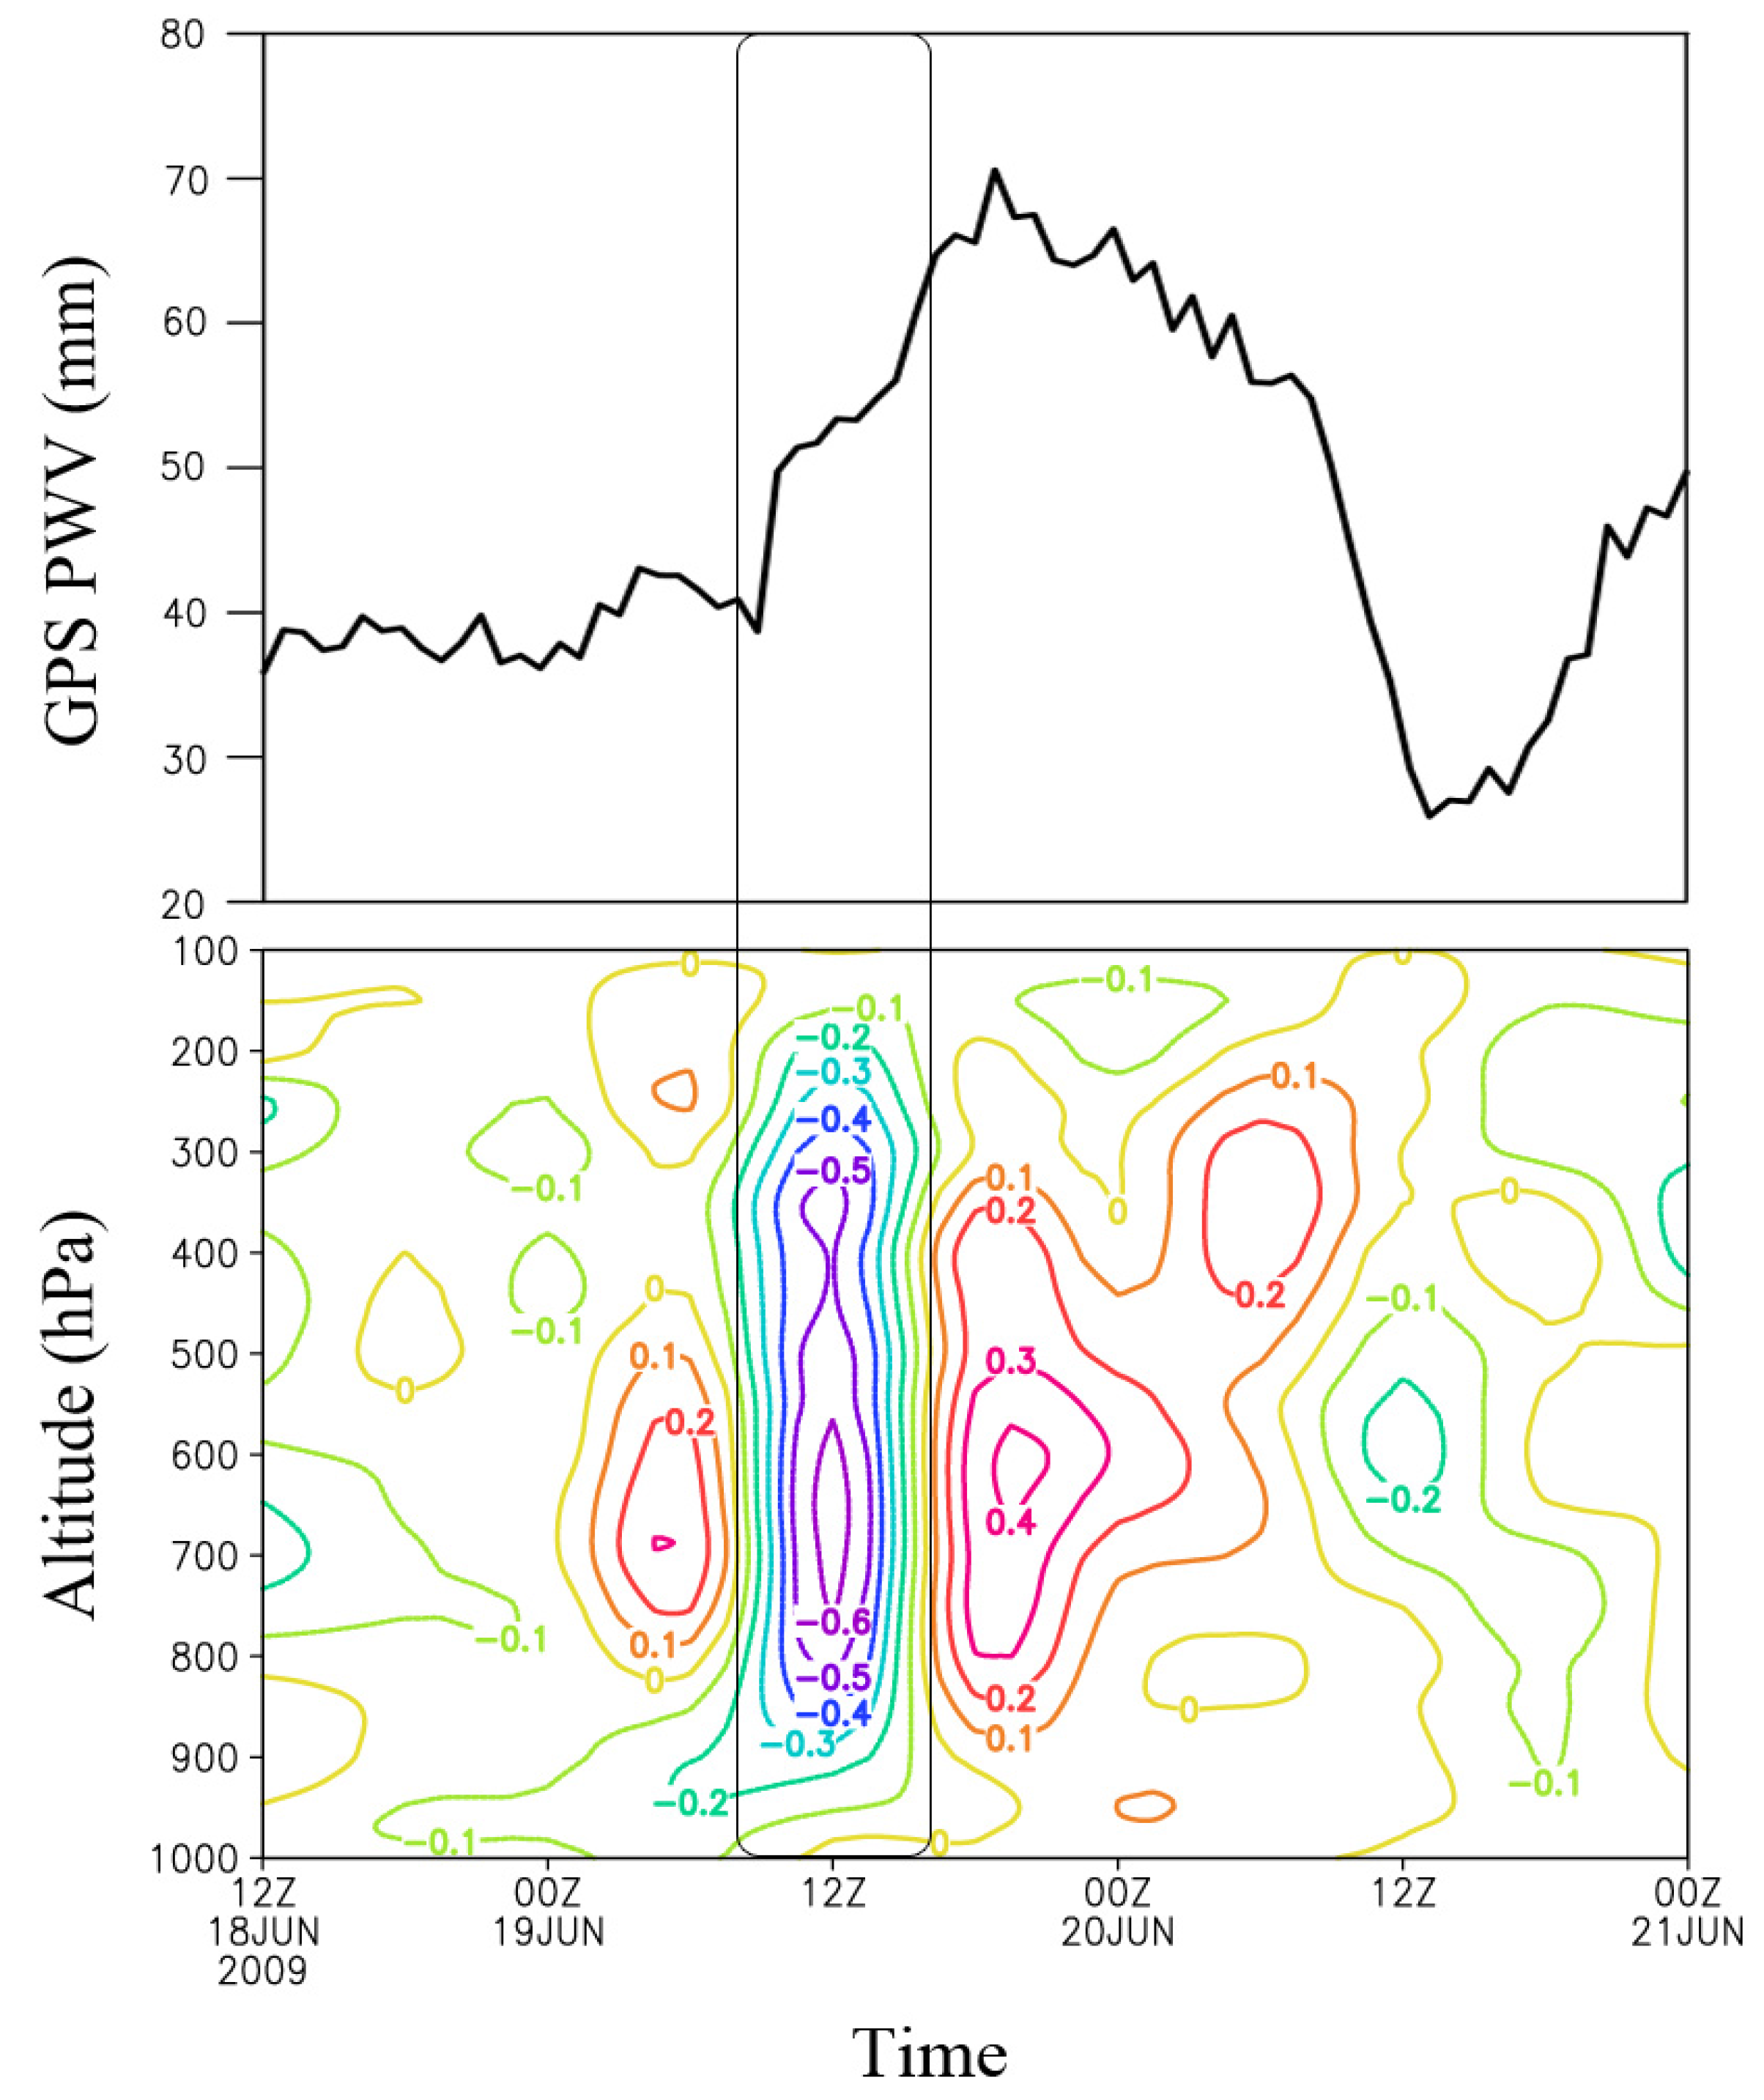
4.1. Relationship between GPS-PWV and Precipitation

To understand the distribution and variation of the GPS-PWV, data were collected at 11:00 a.m., 6:00 p.m., and 10:00 p.m. on 19 June 2009 and at 6:00 a.m. on 20 June 2009 from 13 stations, and then, a kriging interpolation was applied to the study region. The region of high GPS-PWV values moved gradually from northeastern Jiangsu to southeastern Jiangsu (Figure 3). The stations located in the northeast–southeast direction registered a particular regional feature, namely, there was a sequential rise and fall of the GPS-PWV. According to this trend, we divided the study region into three areas, which consisted of northern, central, and southern Jiangsu. In regards to the evolution trend of the GPS-PWV, we identified two development stages that consisted of an accumulation and a releasing stage. In this section, the relationship between the GPS-PWV and the actual precipitation was studied for these two stages and a theory and method were suggested to further understand this process.
Figure 3. Application of the kriging interpolation to obtain the 2009 GPS-PWV evolution (in mm) in the Jiangsu Province at (a) 11:00 a.m. on 19 June; (b) 6:00 p.m. on 19 June; (c) 10:00 p.m. on 19 June; and (d) 6:00 a.m. on 20 June.
Atmosphere 06 00908 g003

4.1.1. Accumulation Stage

The PWV accumulation stage was defined as the stage when the GPS-PWV rapidly reached a high value zone (Figure 4). A synthesis analysis of the accumulation stage for the 13 stations revealed a clear difference in GPS-PWV at 12:00 a.m. on 19 June, which was the turning point for PWV content. The GPS-PWV increased gradually after 1:00 p.m. on 19 June, with water vapor being continuously transferred and accumulated in the Jiangsu area. The GPS-PWV was higher in the northwest than in the southeast, and JSHM had the lowest value (24.43 mm), whereas JSXF had the highest (55.01 mm). The major transfer of water vapor was then towards northwestern Jiangsu. From 12:00 a.m. on 19 June forward, the GPS-PWV increased dramatically for most stations to around 50 mm with starting values of 20–30 mm. The ascent rate of precipitable water reached 2.1–3.6 mm∙h−1 except for at JSFX before 11:00 a.m. on 19 June. Nevertheless, in spite of the rapid increase in atmospheric water vapor, only a few stations recorded any precipitation. Thus, this time frame was referred to as the accumulation stage. The comparison results in Figure 5 demonstrate that the regional average PWV increases of about 70% to 90% above the hourly average PWV in this month suggesting that abnormal increases in PWV may be an early sign of impending actual precipitation.
Figure 4. The GPS-PWV and precipitation from 3:00 p.m. on 18 June 2009 to 11:00 p.m. on 20 June 2009 at (a) four stations in northern Jiangsu; (b) six stations in central Jiangsu; and (c) three stations in southern Jiangsu. The lines indicate the GPS-PWV data and the bars indicate the hourly precipitation for each station in mm.
Atmosphere 06 00908 g004
Figure 5. Regional average GPS-PWV (RA-PWV) and hourly average PWV (HA-PWV) (a) In northern Jiangsu; (b) In central Jiangsu; and (c) In southern Jiangsu. The RA-PWV was the average value from all the stations at affiliated region between 3:00 p.m. 18 June and 11:00 p.m. 20 June 2009, HA-PWV was the average value from all the stations at affiliated region in June.
Atmosphere 06 00908 g005

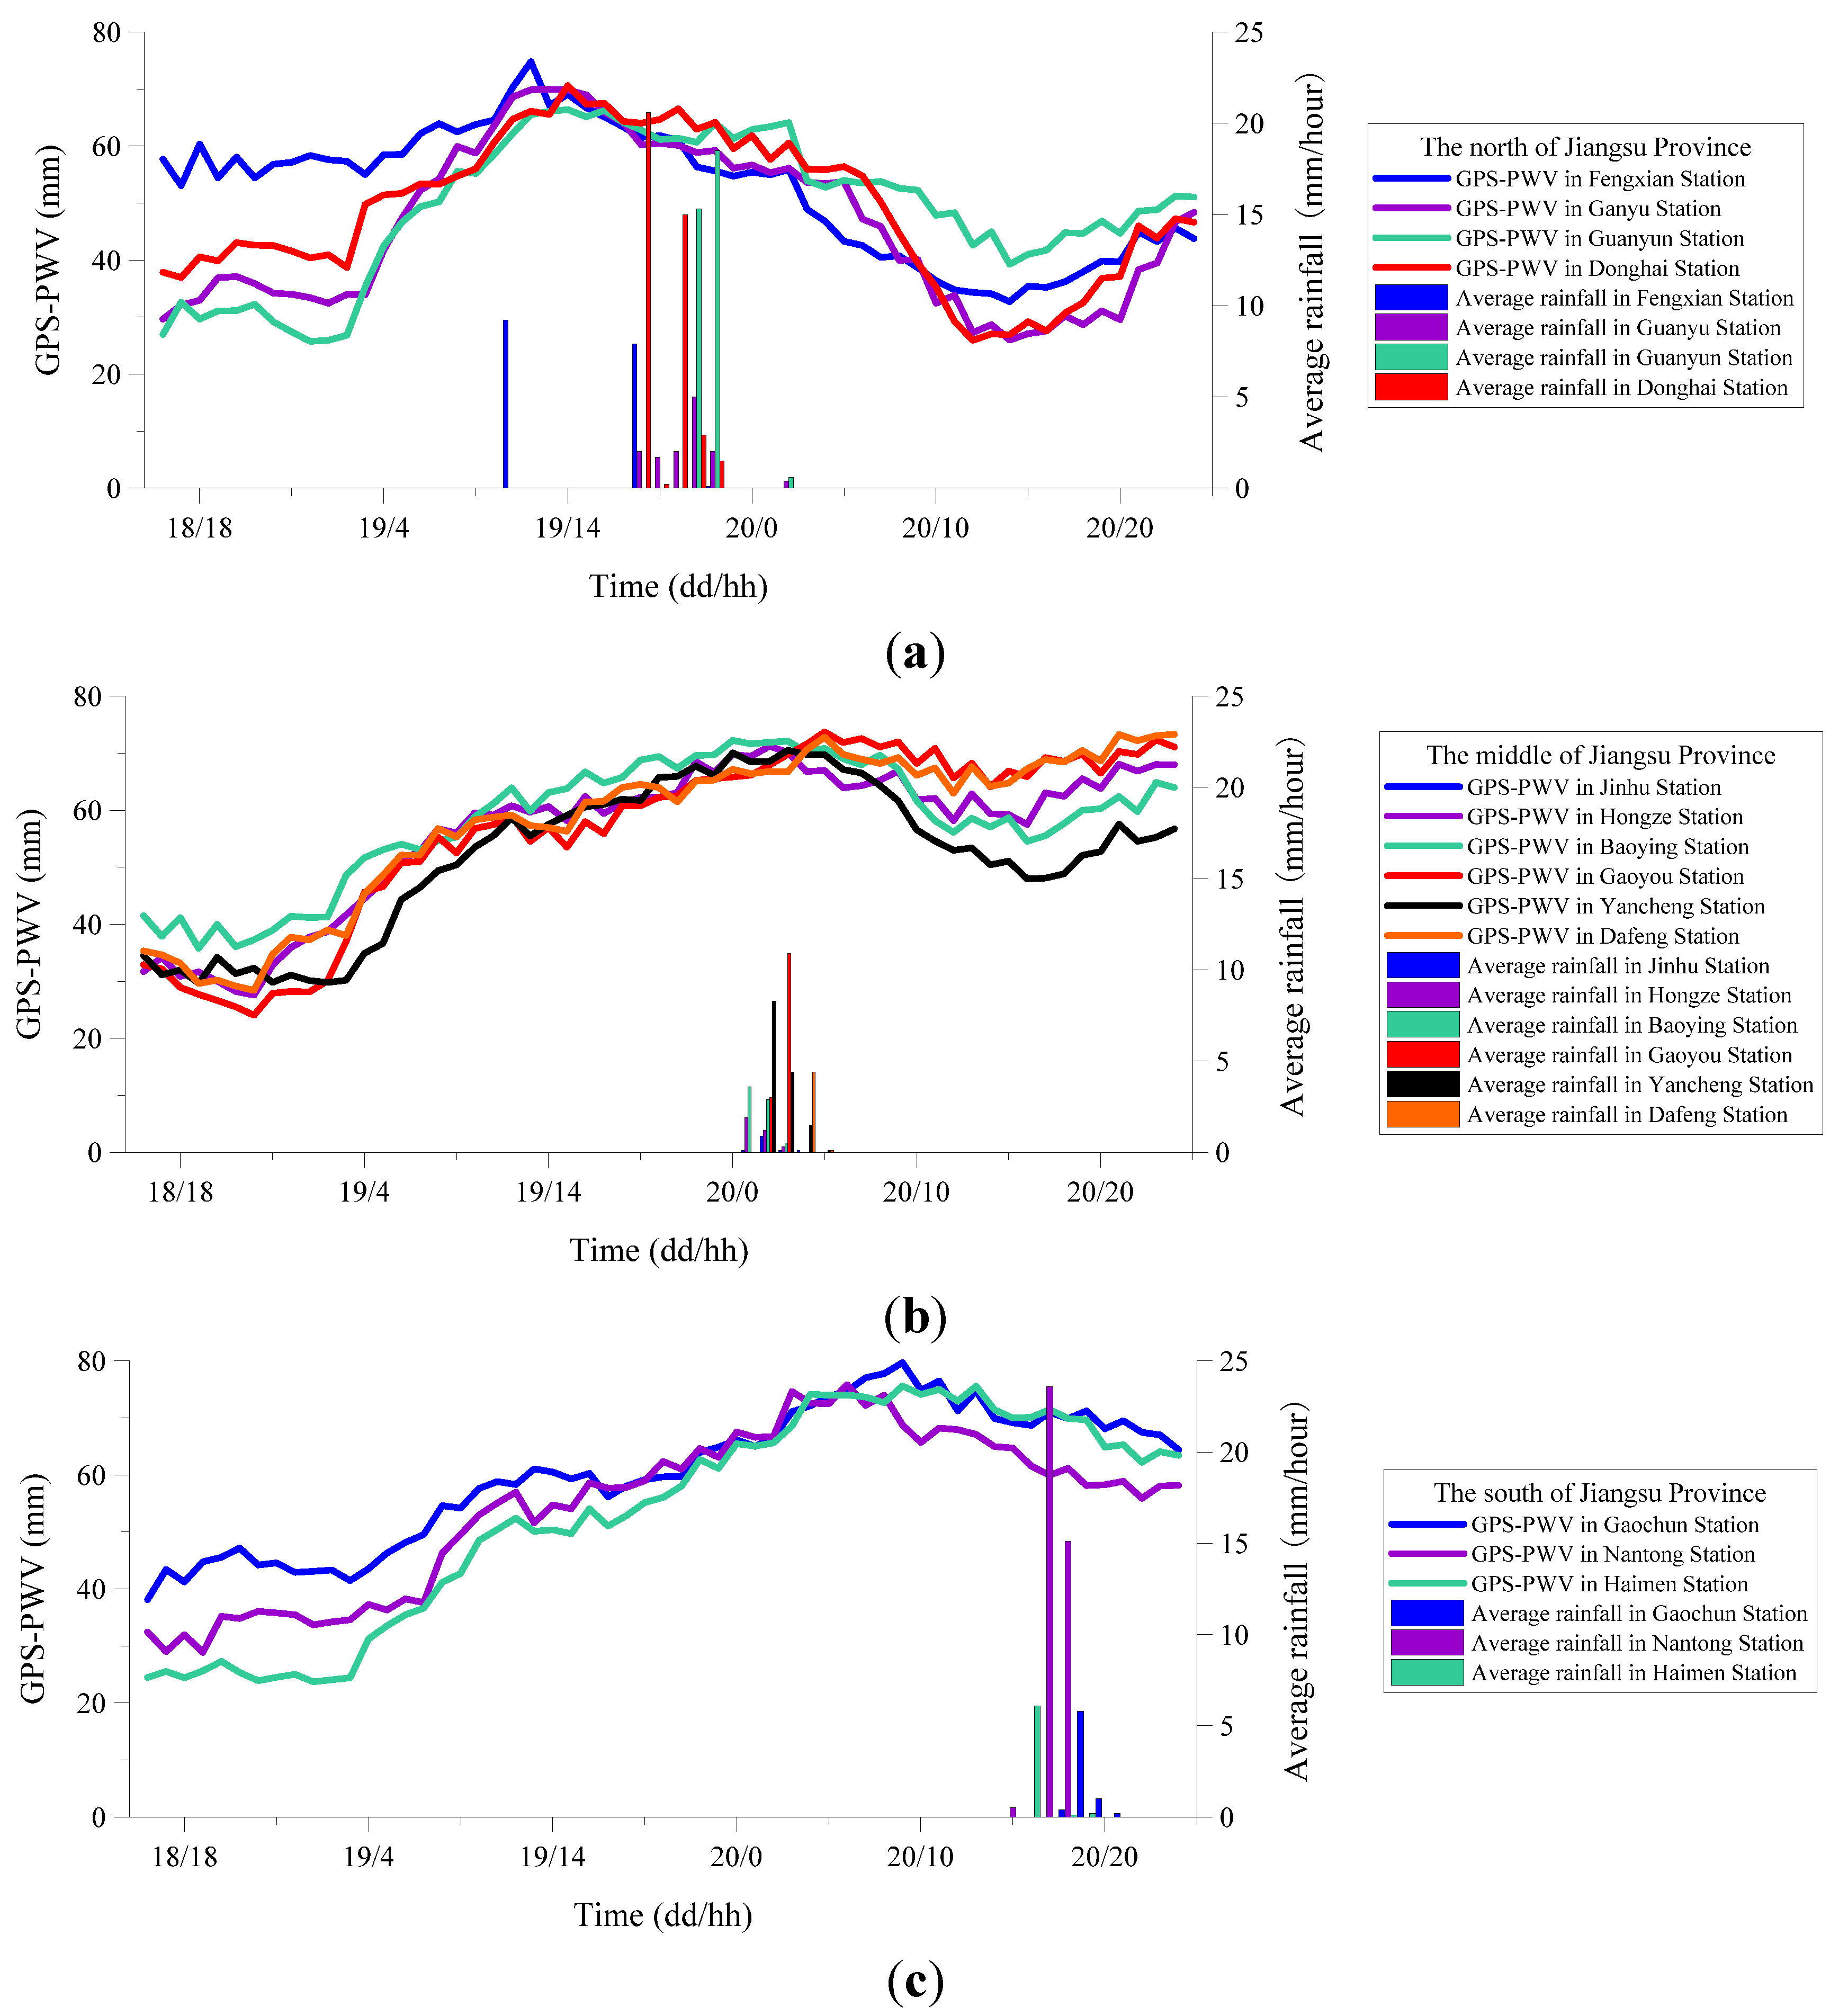
4.1.2. Releasing Stage

The releasing stage was characterized by the maintenance of the GPS-PWV at a high level followed by its gradual decline (Figure 4). When the GPS-PWV reached around 60 mm, precipitation occurred. While the GPS-PWV in central and southern Jiangsu continuously and slowly increased, no precipitation occurred until after the 60 mm threshold was reached. From the GPS-PWV variation at all stations, we observed that when the GPS-PWV increased above 50 mm, it produced a small amplitude shock upward trend, and precipitation started at around 60 mm. Likewise, Champollion et al. (2004) found from GPS data that heavy precipitation is associated with ongoing accumulation of water vapor [28]. The fast increase in GPS-PWV before precipitation indicates that the atmospheric water vapor almost reached saturation conditions. However, even though central and southern Jiangsu reached saturation at almost the same time, precipitation in these regions occurred up to 15 h apart, which means that a GPS-PWV value of 60 mm does not imply that precipitation will immediately occur, but only that saturation conditions have been reached.

4.2. Physical Mechanisms

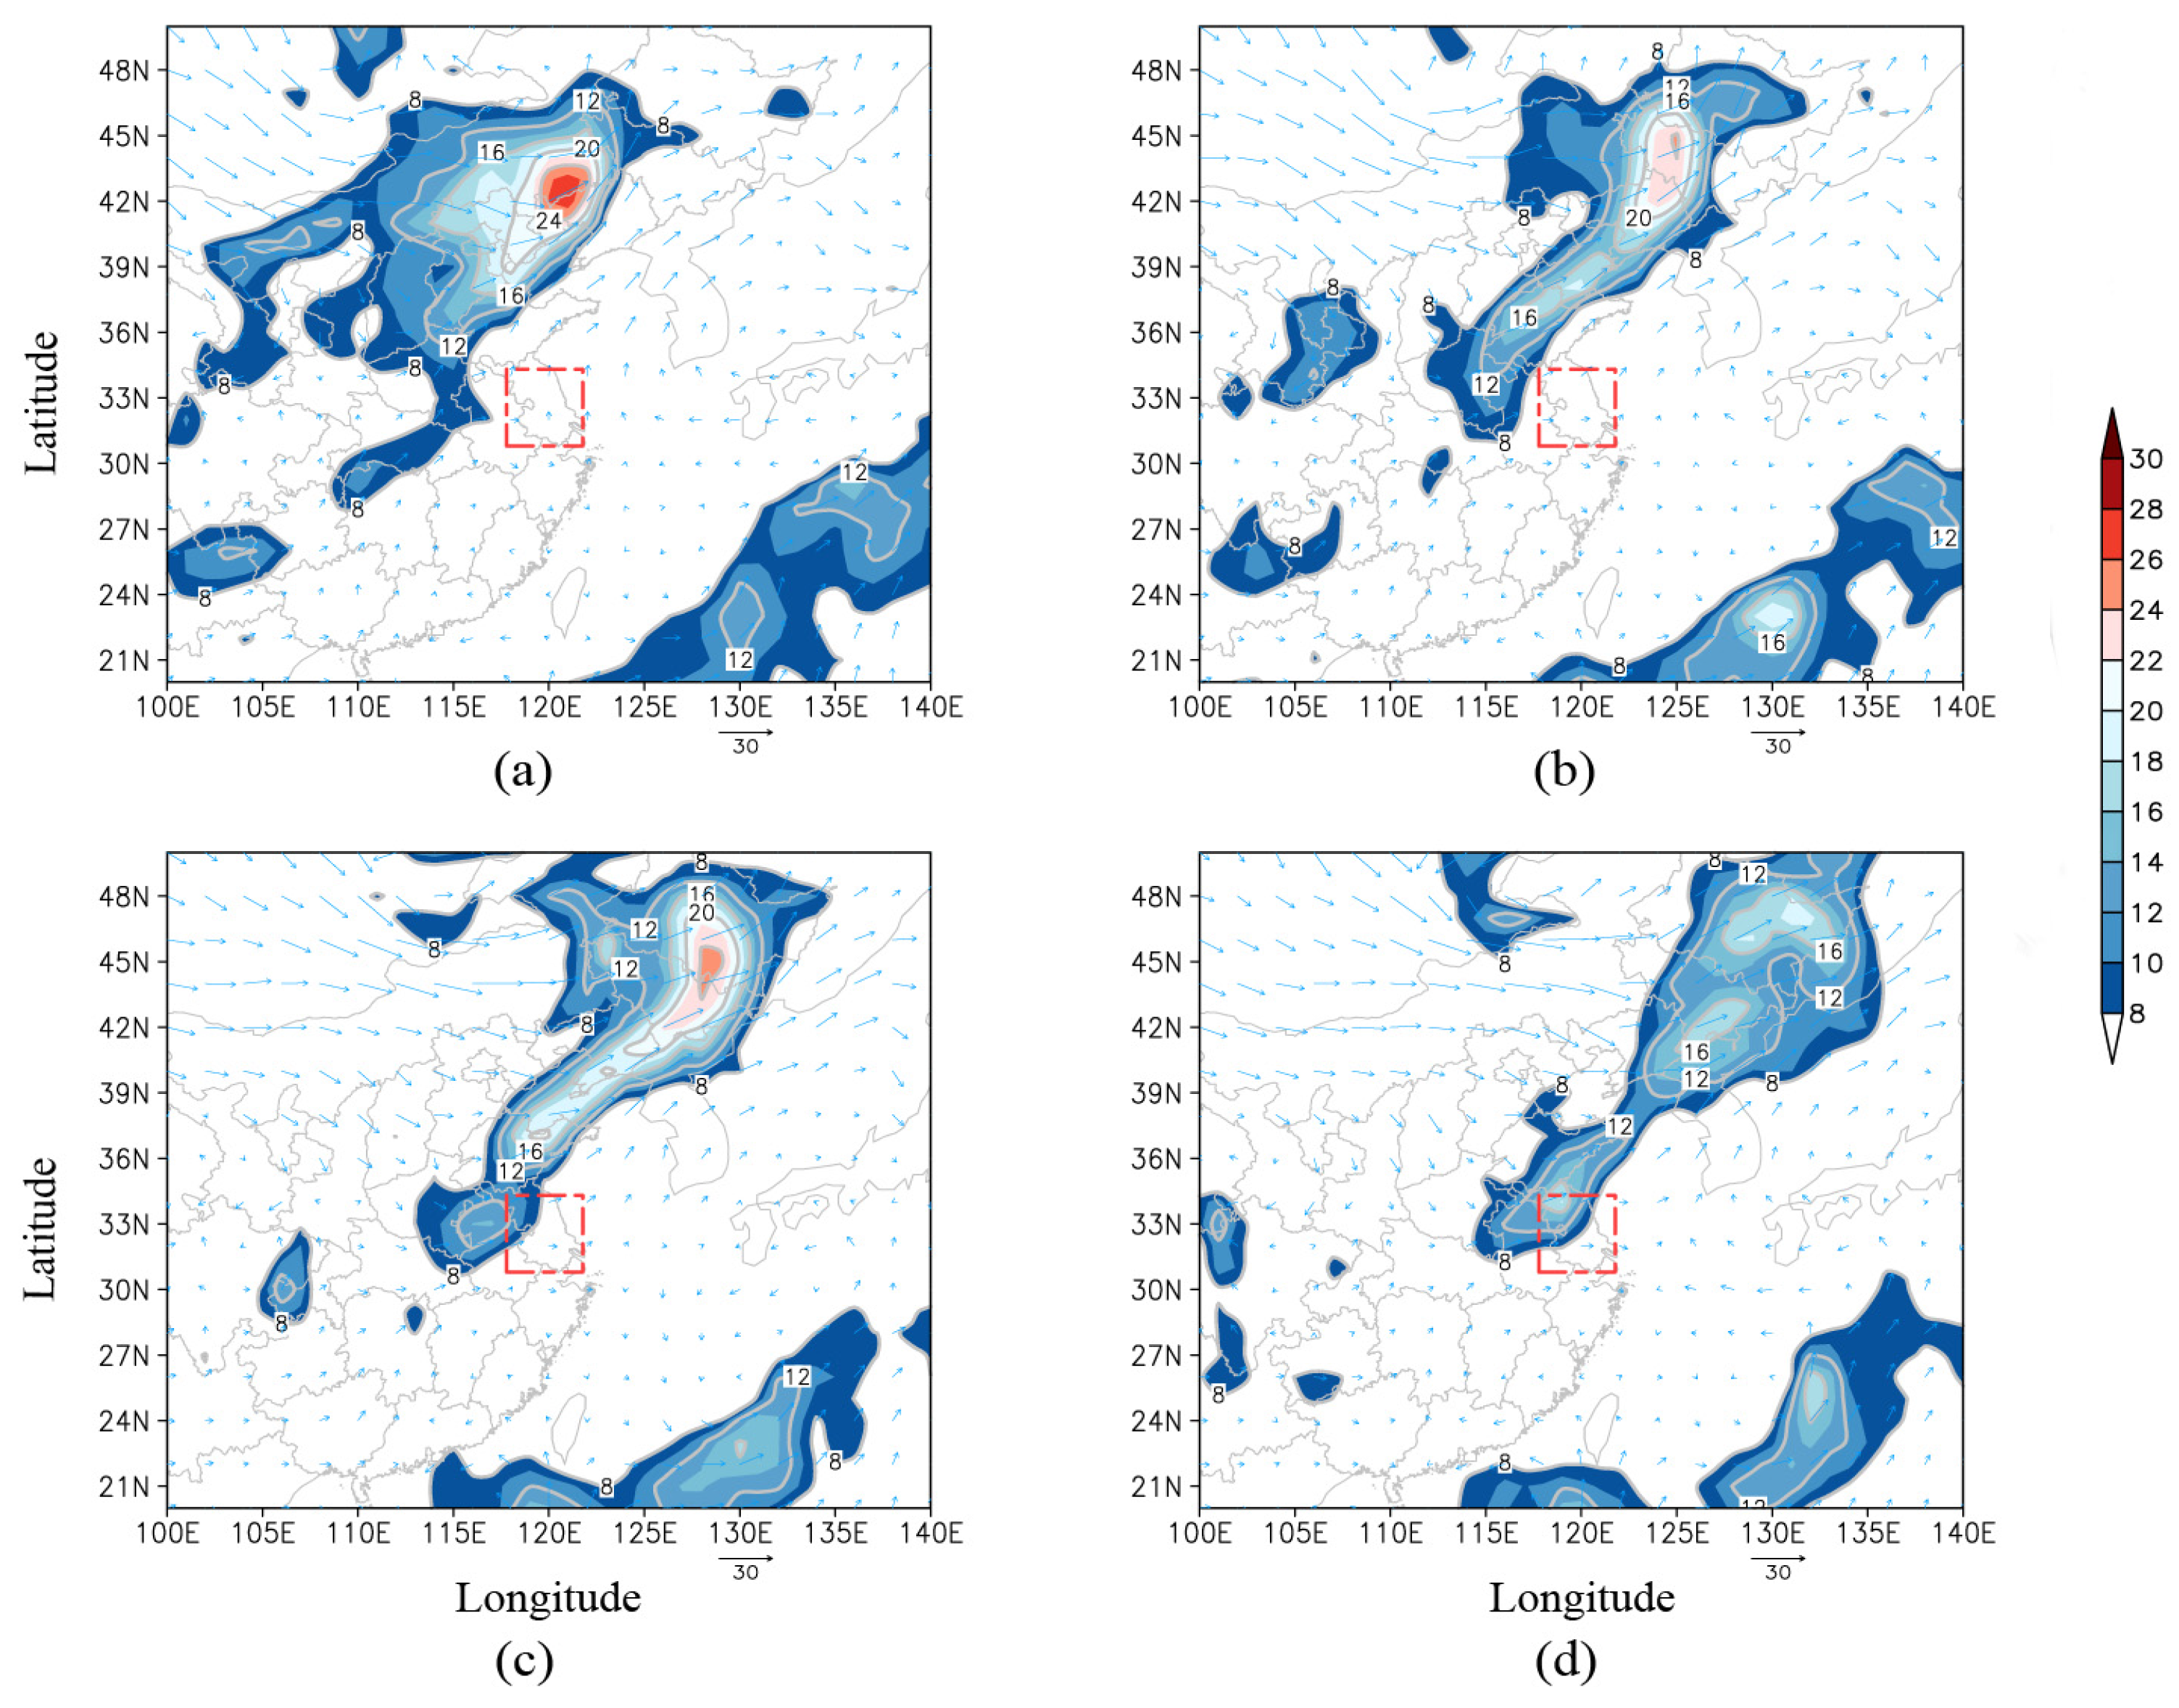
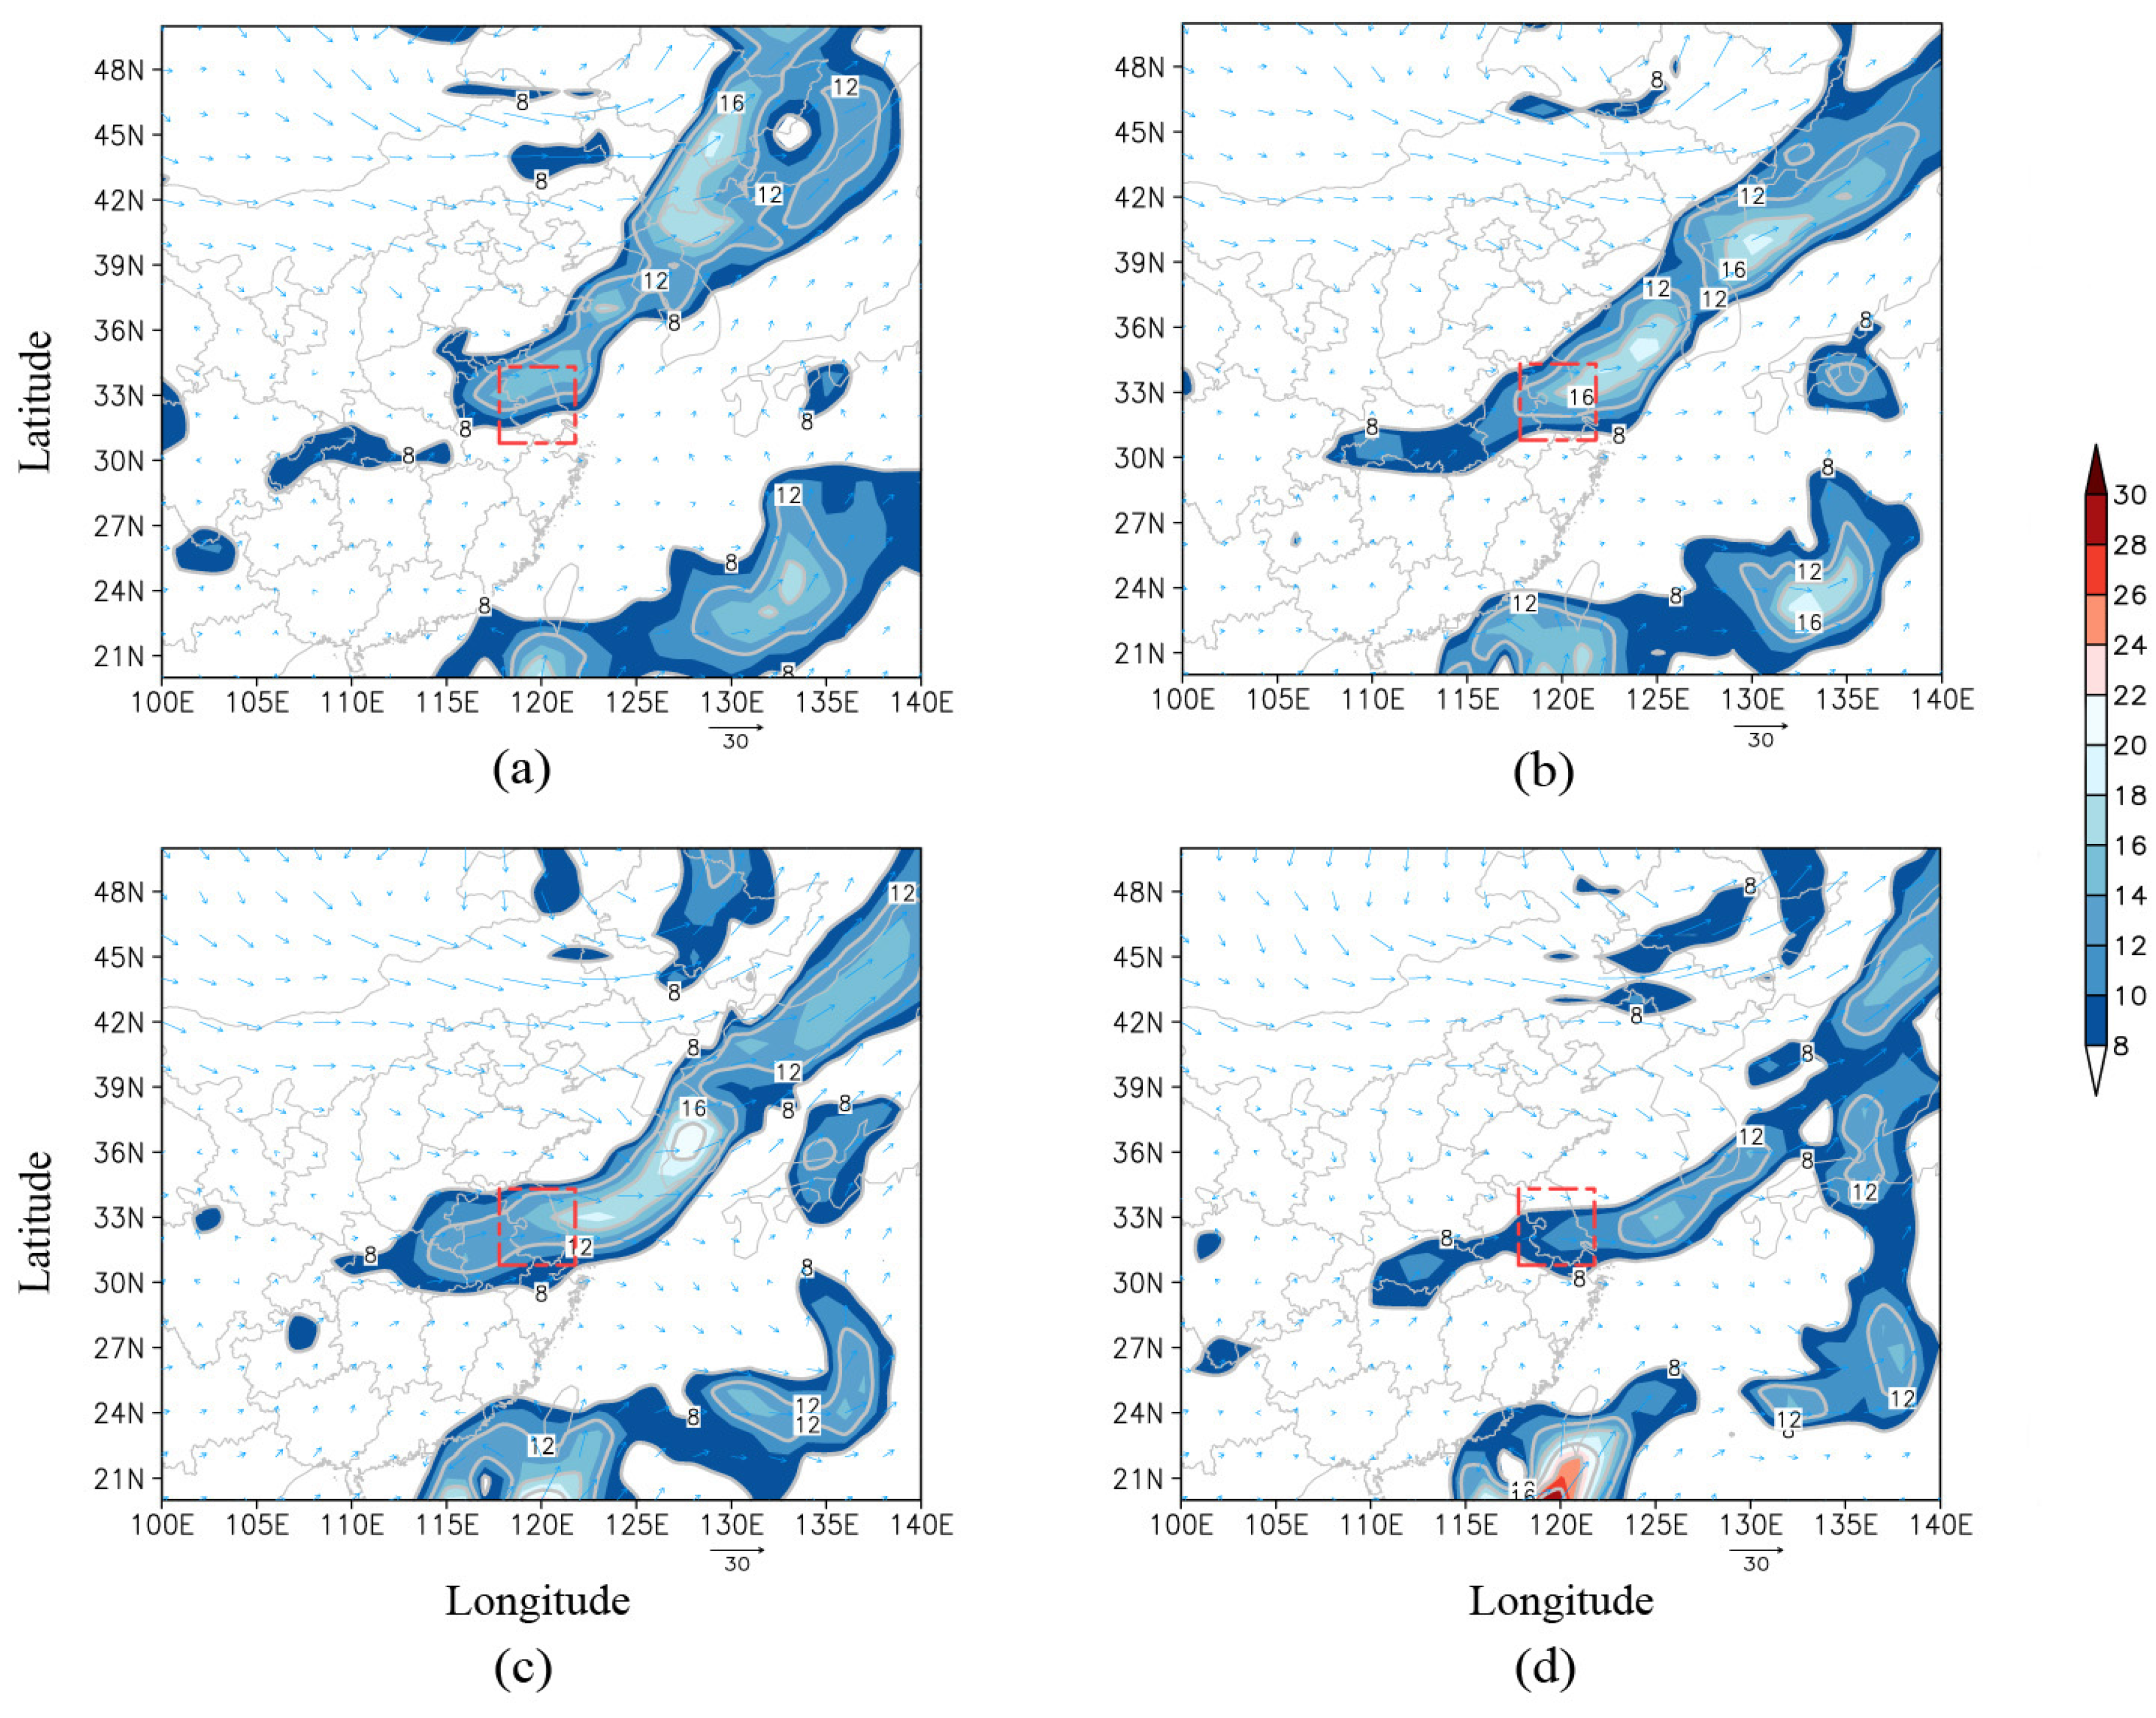
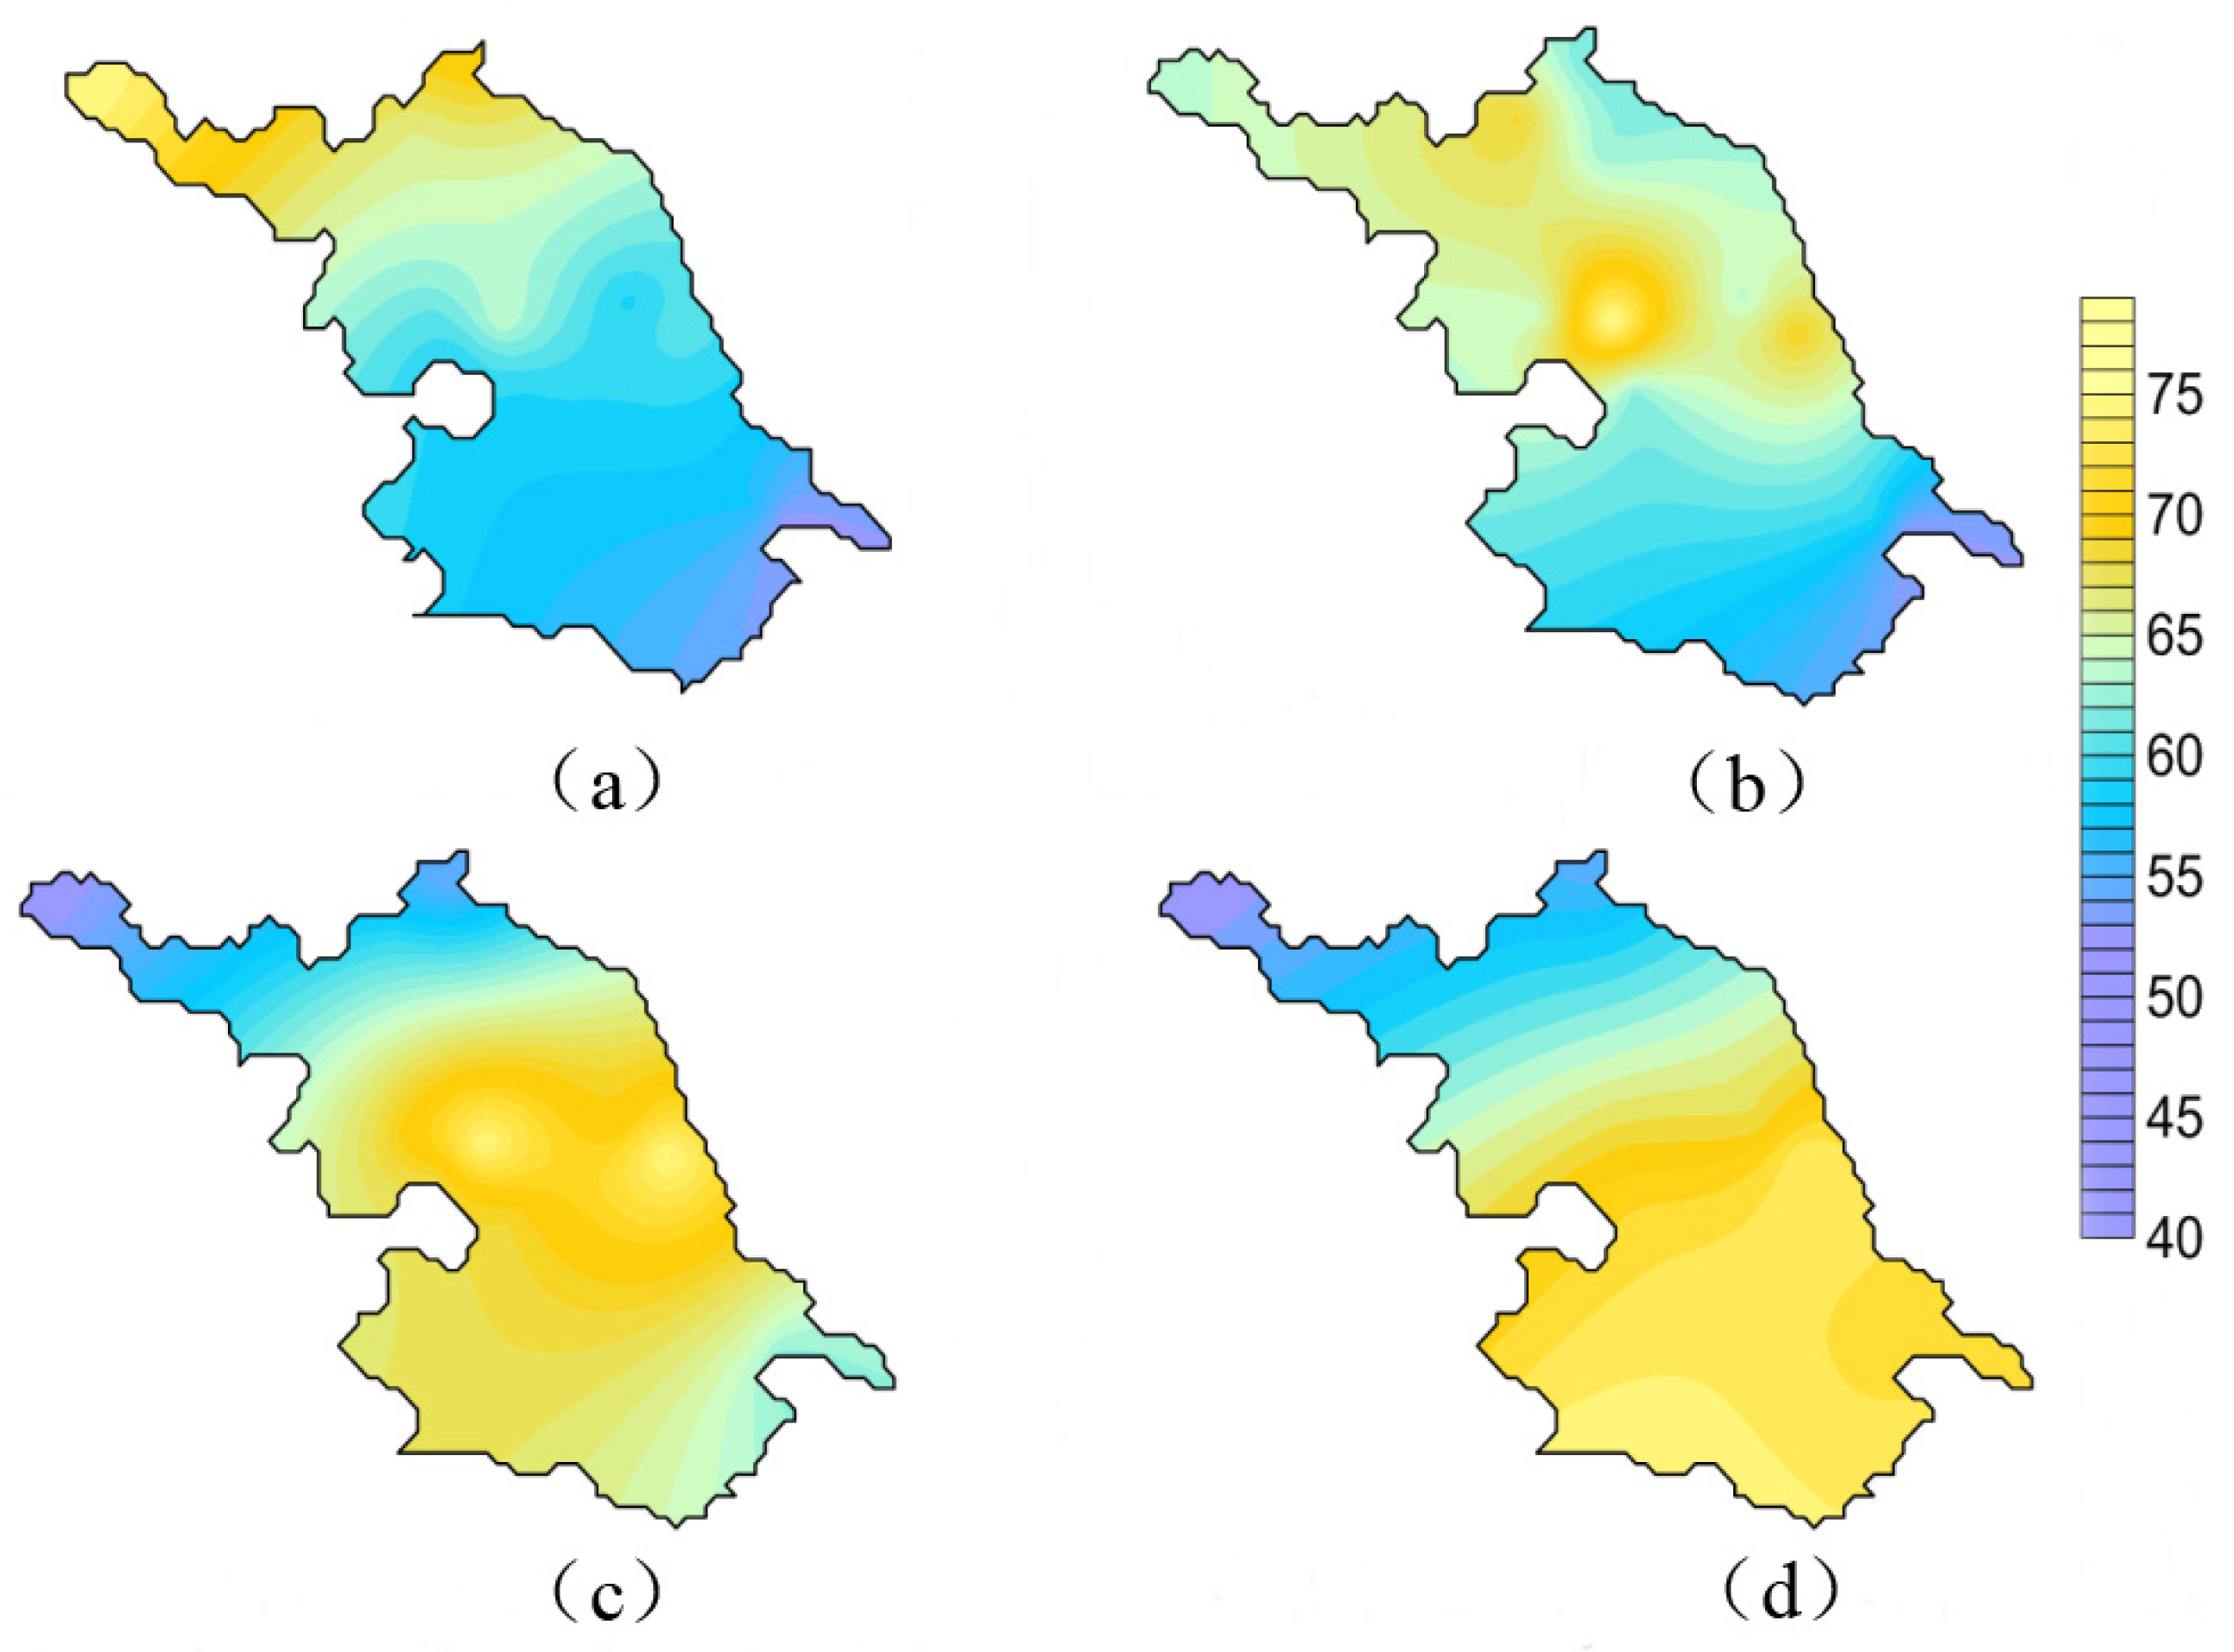
4.2.1. Water Vapor Distribution

To analyze the distribution of water vapor in the periphery of the main area before the increase in GPS-PWV, we calculated the water vapor flux [8] at 700 hPa at 6:00 p.m. on June 18, and at 12:00 a.m., 6:00 a.m., and 12:00 p.m. on 19 June, according to the NCEP reanalysis data. The Bay of Bengal, the South China Sea, and most of Jiangsu were associated with a strong water vapor transfer belt for the entire study period (Figure 6). High water vapor contents in this transfer belt were located over Hebei and Liaoning at 6:00 p.m. and 12:00 a.m. on 19 June, respectively, after which the contents decreased and became more concentrated, with clear developments in the north and south and with a gradual movement towards the east. Later, the water vapor transfer belt divided into two strong water vapor centers. One was located east of Jilin and the other was located northwest of Jiangsu (Figure 6c). This water vapor distribution agreed with the variation trend obtained for the GPS-PWV before 12:00 a.m. on 19 June.
Figure 6. Water vapor flux and wind field at 700 hPa for (a) 6:00 p.m. on 18 June 2009; (b) 12:00 a.m. on 19 June 2009; (c) 6:00 a.m. on 19 June 2009; and (d) 12:00 p.m. on 19 June 2009. Note that the water vapor flux in the shaded area is above 8 and that the water vapor flux is expressed in g∙cm−1∙h∙Pa−1∙s−1. The red area is the studied region in the Jiangsu Province, and the data in the figure were derived from the National Centers for Environmental Prediction (NCEP) 1° × 1° reanalysis data.
Atmosphere 06 00908 g006
At 12:00 p.m. on 19 June, the strong water vapor center located in the southern region of the transfer belt had already invaded the area north of Jiangsu, and then, it gradually extended over the main area (Figure 6d). By 6:00 p.m., it had completely covered the main area, with close to peak values observed for all three areas. From 12:00–6:00 p.m. on 19 June, the vapor transfer belt moved southeast, and northern and middle Jiangsu experienced sequential and relatively strong precipitation events, thus indicating that the position of the vapor transfer center was related to the timing and strength of the real precipitation. Once precipitation occurred in the three areas, the GPS-PWV gradually decreased. It is therefore clear that the variation in GPS-PWV was strongly related to the movement of the water vapor transfer belt.
The evolution of the water vapor transfer belt (Figure 7) showed further movement towards the southeast, which was indicative of future weakening of the vapor transfer stage. This was confirmed by the gradual reduction in water vapor and GPS-PWV in the main area.
Figure 7. Water vapor flux and wind field at 700 hPa for (a) 6:00 p.m. on 19 June 2009; (b) 12:00 a.m. on 20 June 2009; (c) 6:00 a.m. on 20 June 2009; and (d) 12:00 p.m. on 20 June 2009. Note that the water vapor flux in the shaded area is above 8 and that the water vapor flux is in g∙cm−1∙h∙Pa−1∙s−1. The red area is the studied region in the Jiangsu Province, and the data in the figure were derived from the National Centers for Environmental Prediction (NCEP) 1° × 1° reanalysis data.
Atmosphere 06 00908 g007

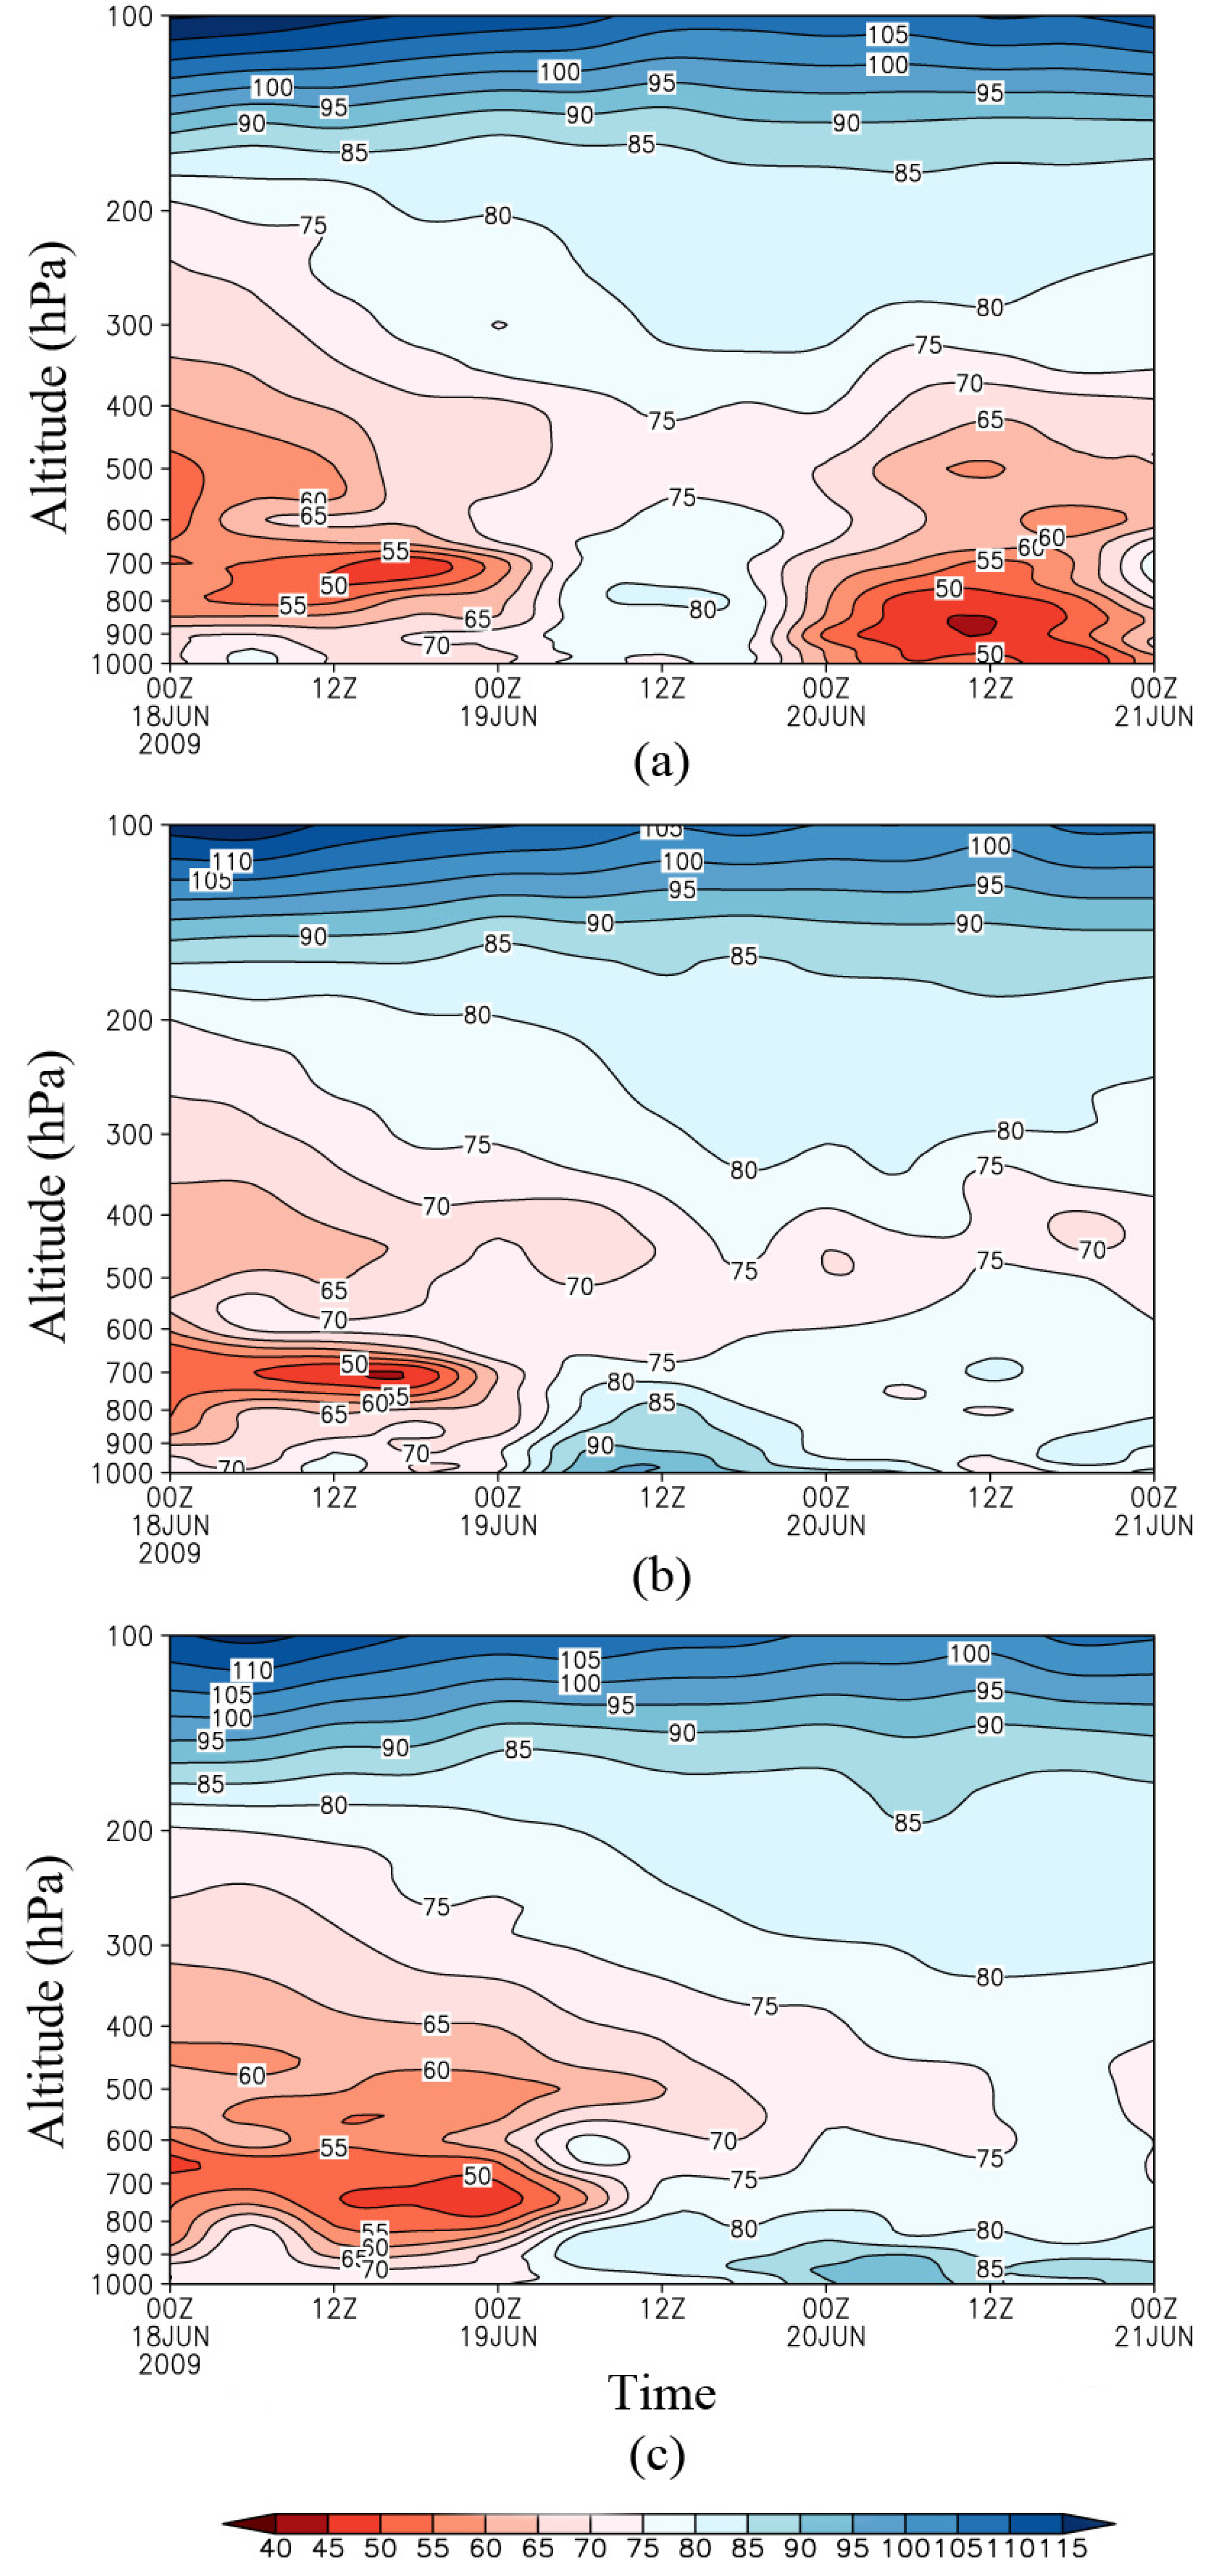
4.2.2. Thermodynamic Characteristics Stations

JSDH, JSGO, and JSNT, which reflect the changes in the three different regions, were selected for the analysis of the local thermodynamic and dynamic conditions involved in the water vapor transfer process, and to further explain the generation and development of precipitation. The atmospheric thermodynamic distribution is a key factor that affects this process, and the vertical distribution of the potential pseudo-equivalent temperature θse is an important index for analyzing the thermodynamic variation before the occurrence of strong precipitation. The vertical distribution of θse can reflect the degree of convective stability in the atmosphere. When θse decreases (∂θse/∂z < 0), the whole atmospheric level rises since it is potentially unstable. Conversely, when θse increases with height (∂θse/∂z > 0), the atmosphere tends to be stable.
For the three stations (Figure 8), the GPS-PWV moved from the low to the high value region between 12:00 a.m. on 18 June and 12:00 p.m. on 19 June. The distribution of the potential pseudo-equivalent temperature for these three stations indicated that there was an unstable atmospheric structure before the rapid increase in water vapor, which was particularly clear below 700 hPa, and this occurred along with clearly unstable convection (∂θse/∂z < 0). The unstable structure favored the accumulation of the energy necessary for convective activity and the fast increase in GPS-PWV. After 12:00 a.m., the occurrence of precipitation resulted in the release of the unstable energy and there was an increase with height of the potential pseudo-equivalent temperature. Consequently, the atmosphere gradually progressed towards stability.

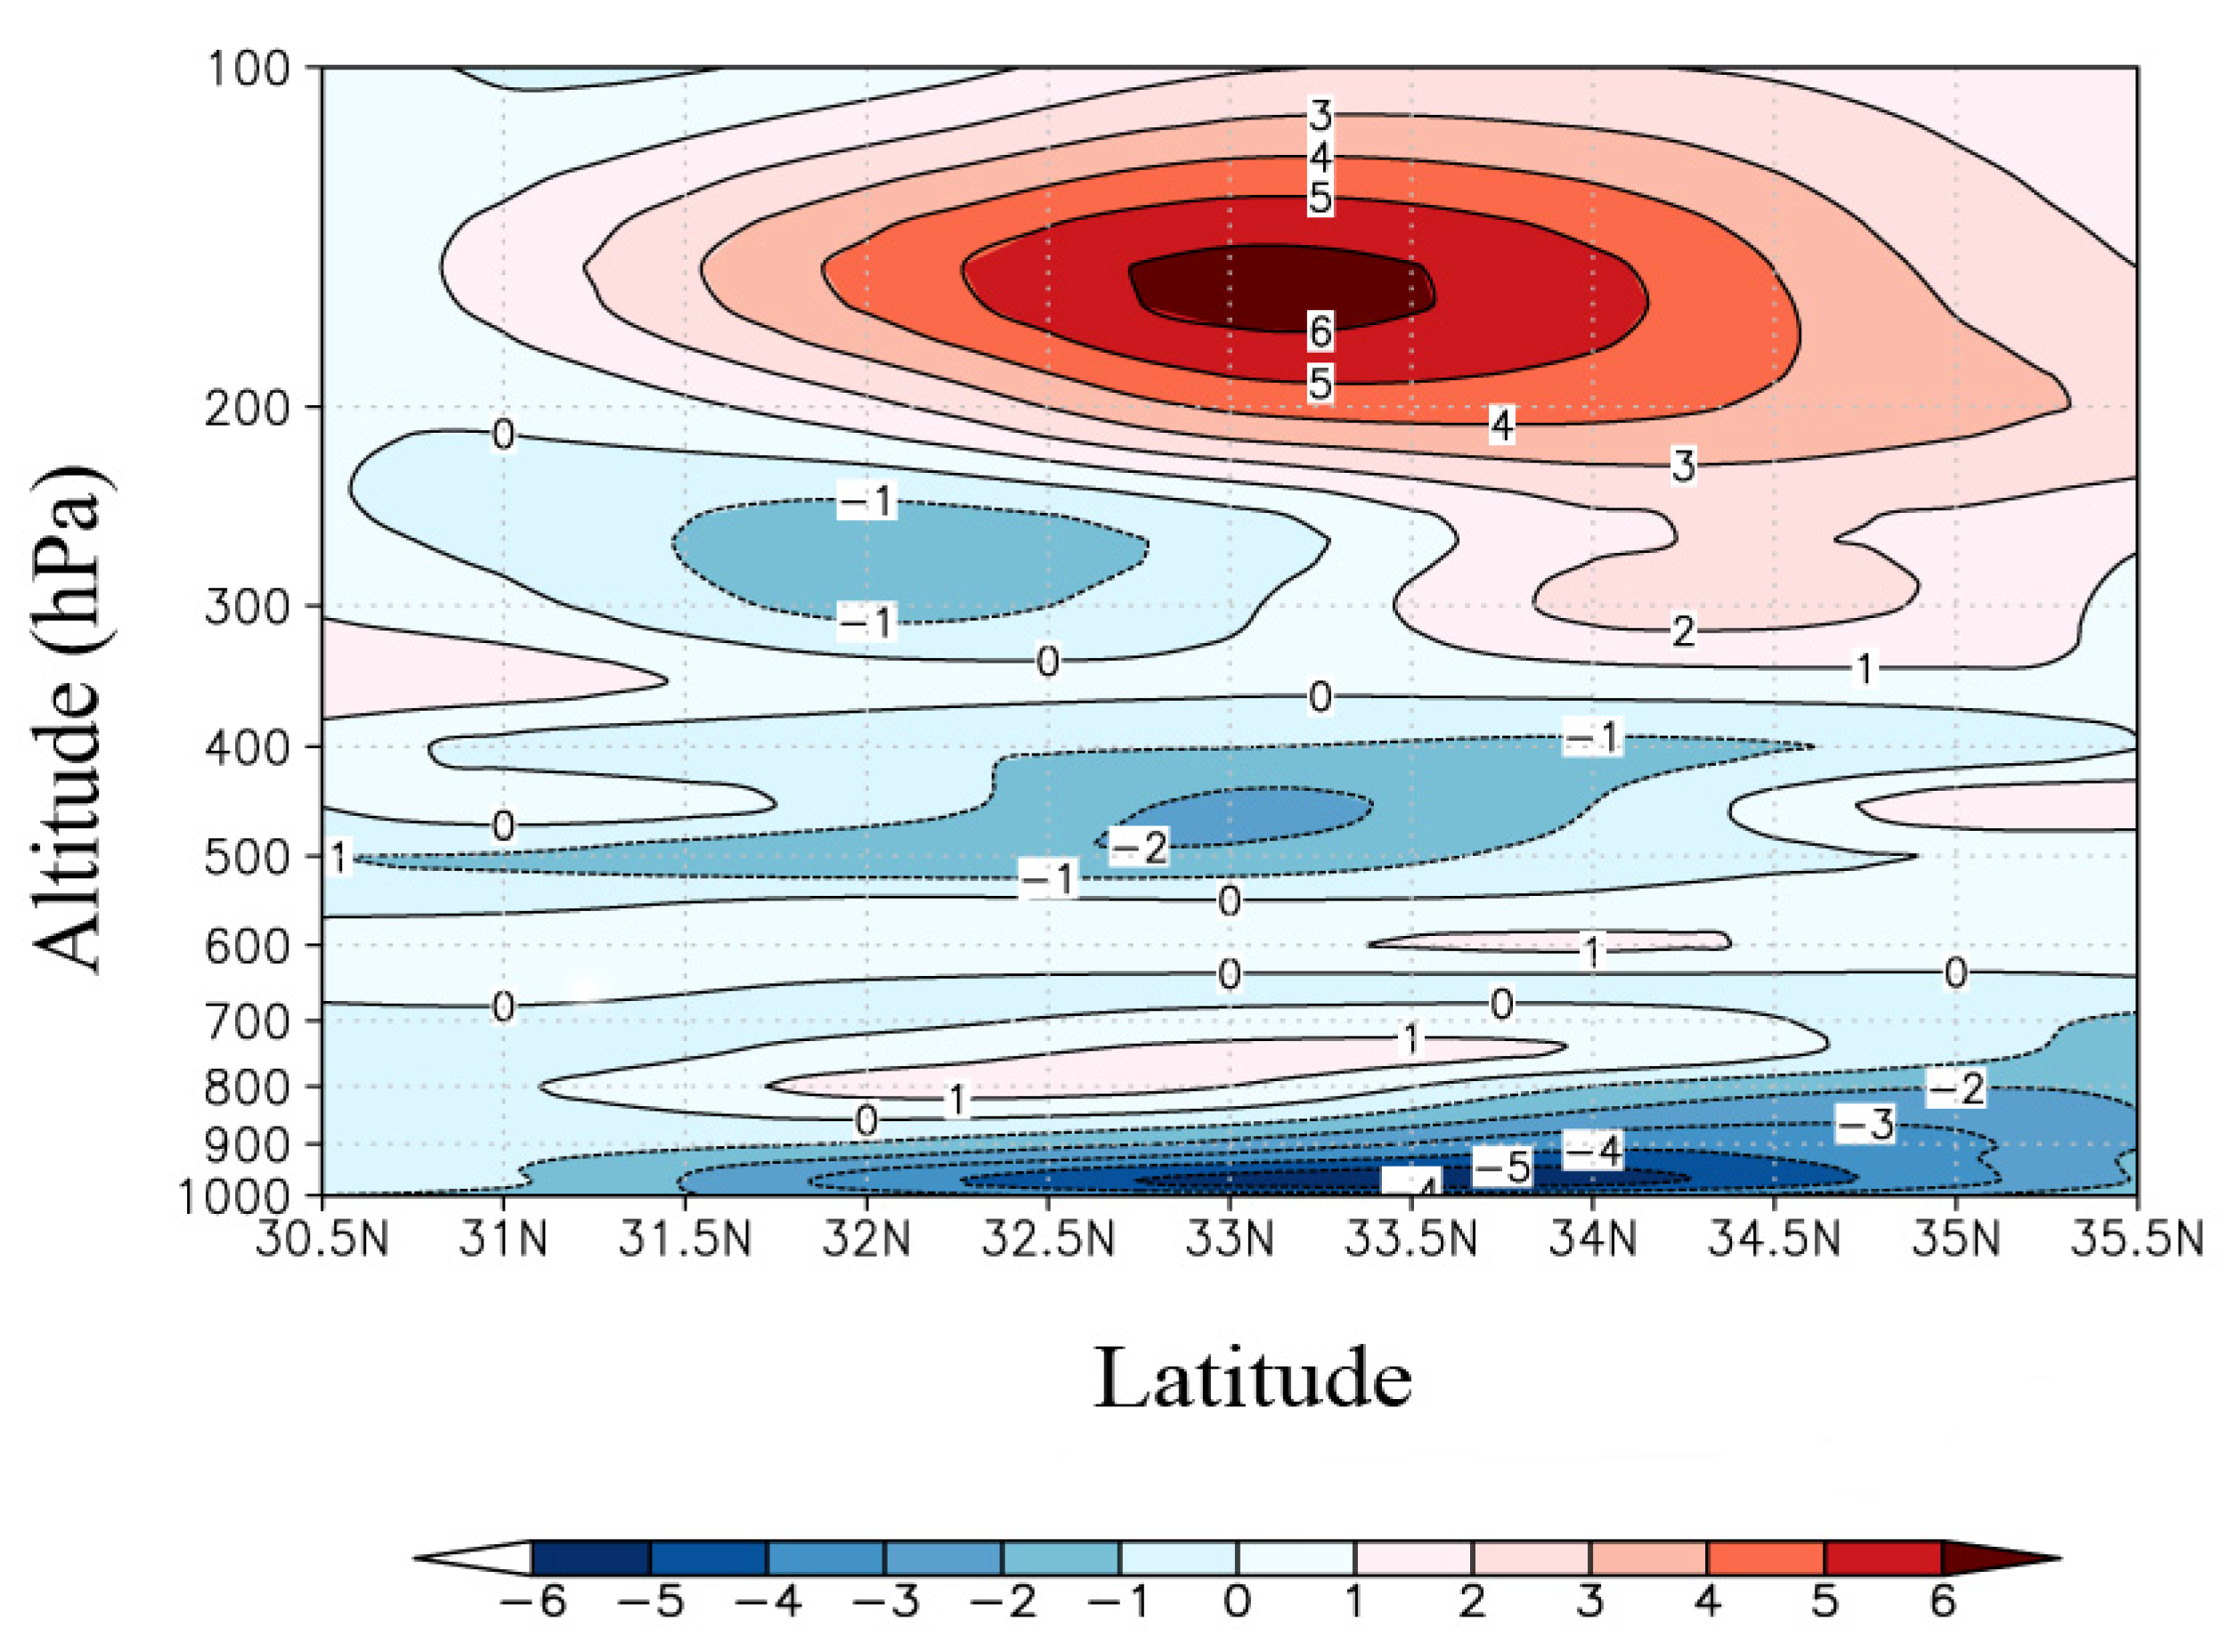
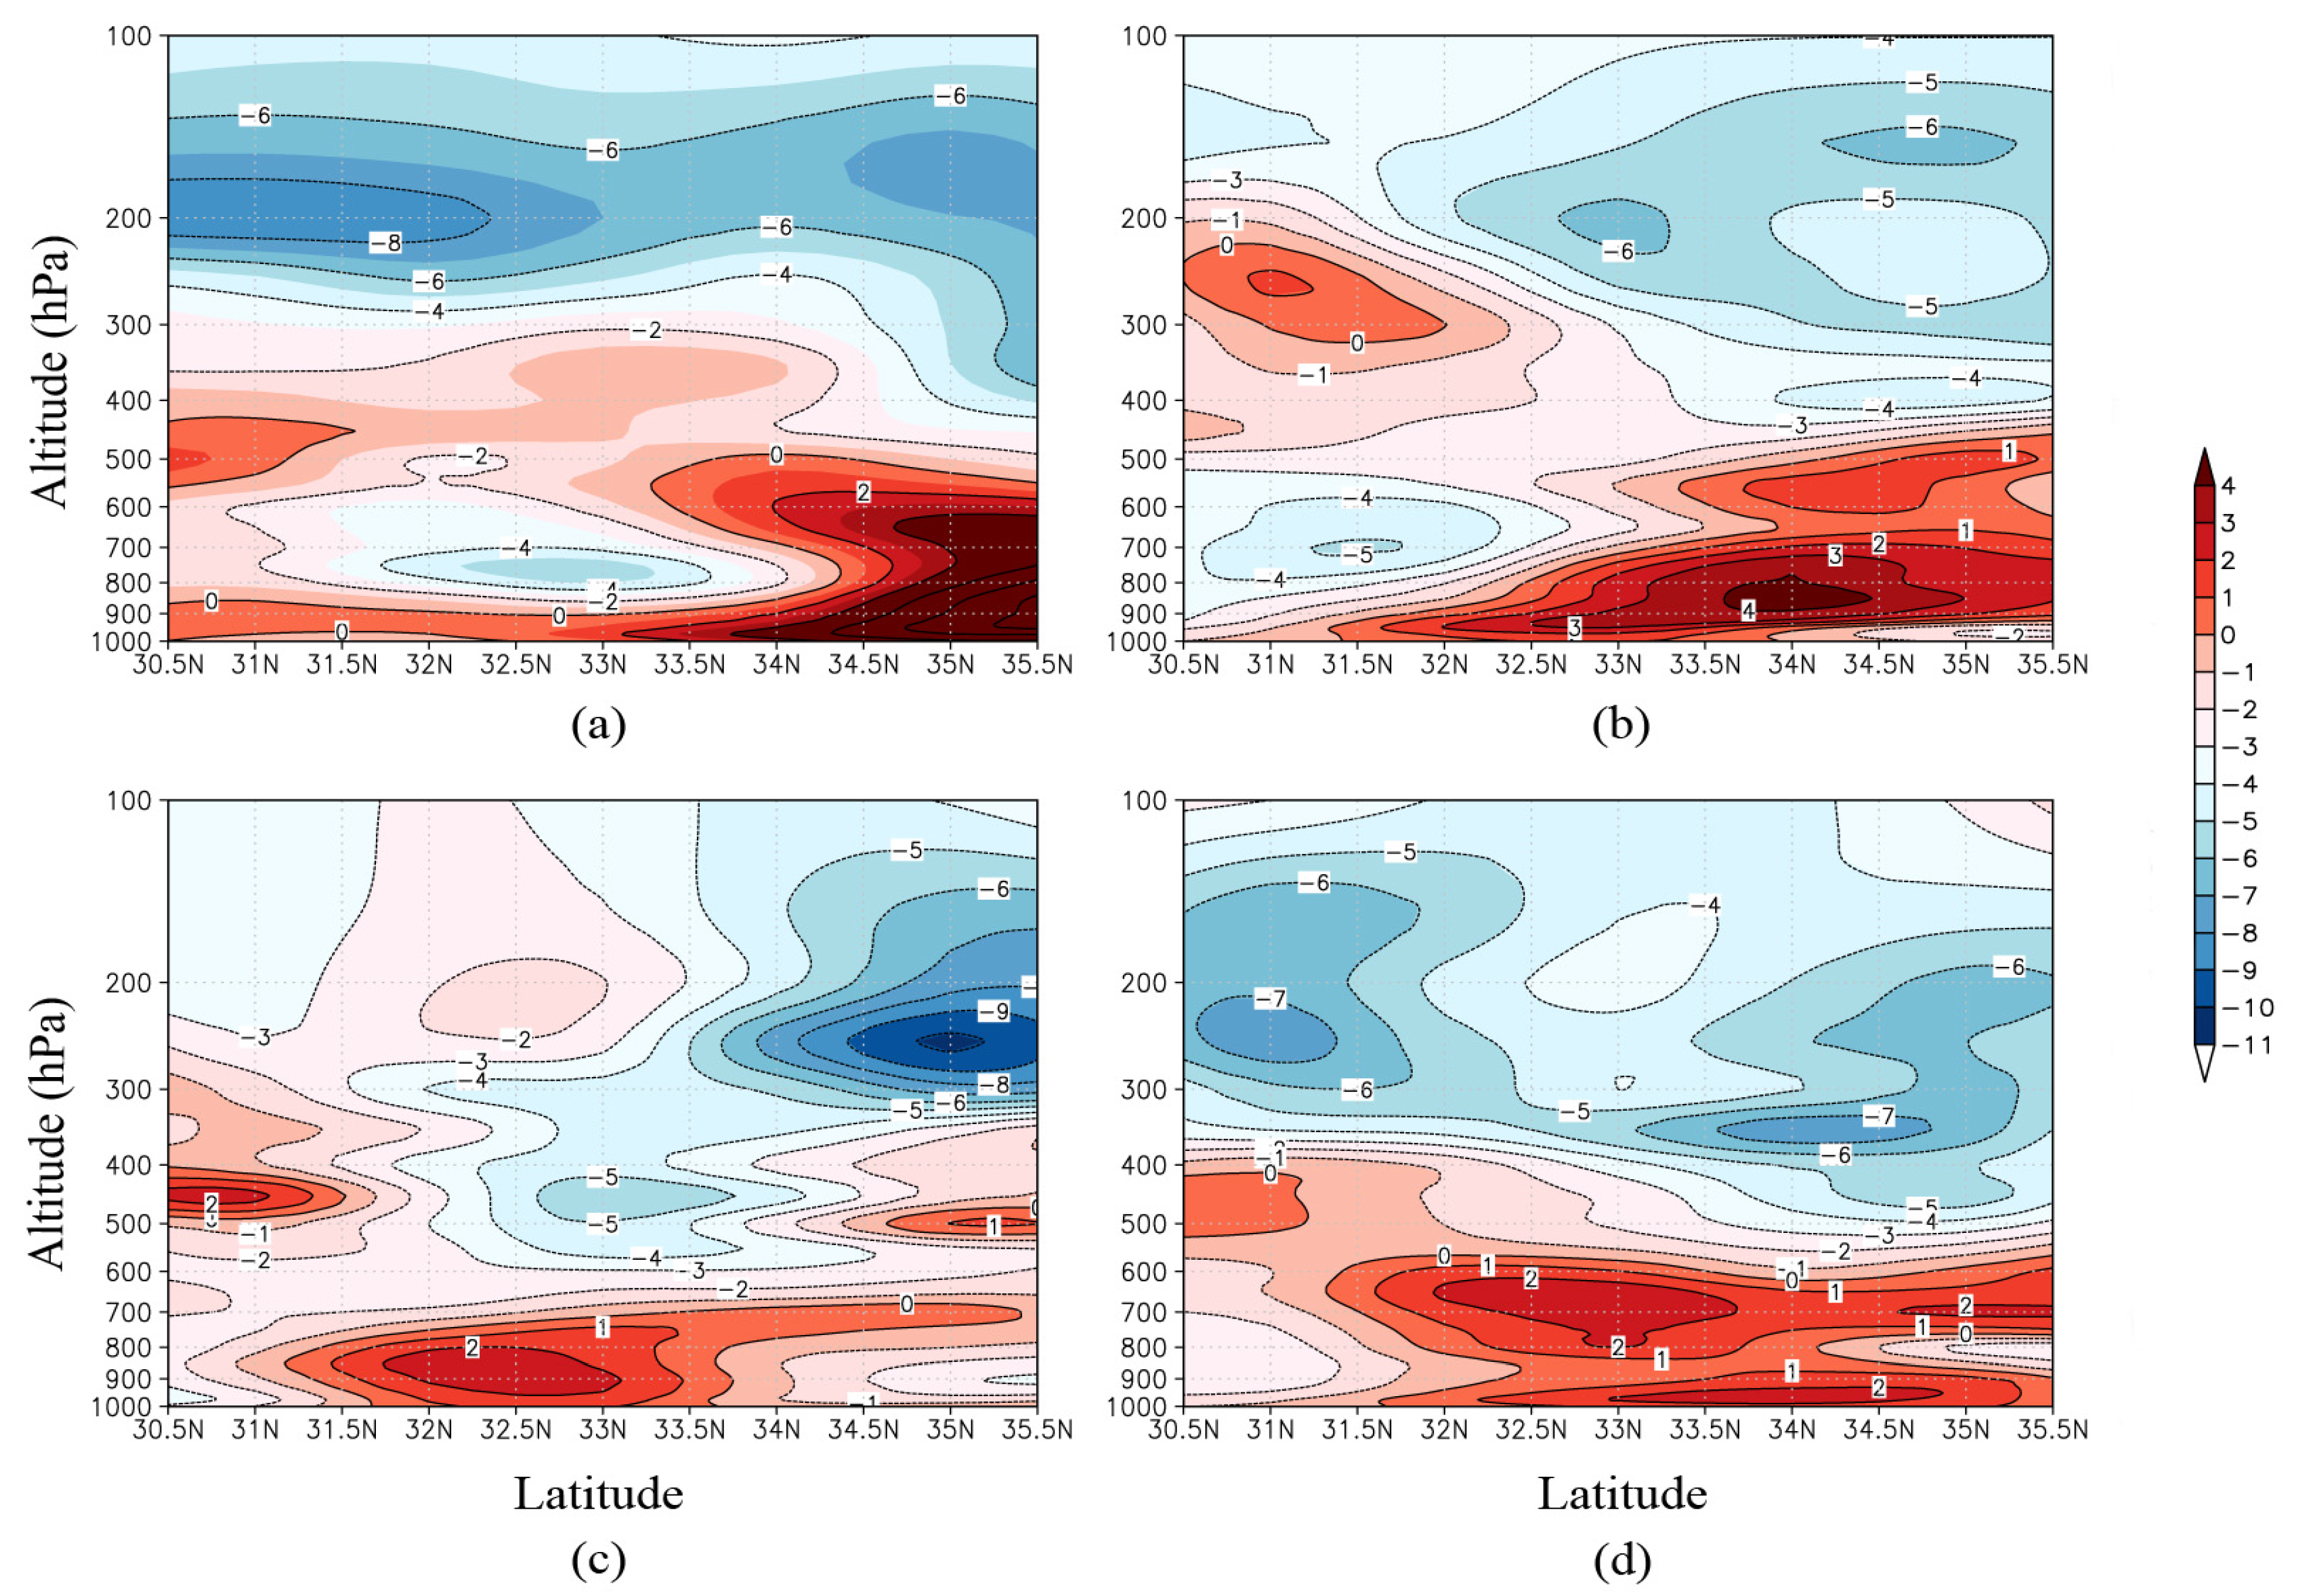
4.2.3. Dynamic Characteristics

Generally, saturated water vapor and unstable thermodynamic conditions are important factors for precipitation. However, the occurrence of precipitation is also constrained by relevant dynamic conditions. This can explain the observed sequential precipitation, even though the GPS-PWV was similar for all three areas.
The GPS-PWV of the three stations maintained a high value (more than 50 mm) at 12:00 p.m. on 19 June. In the vertical speed profile for the JSDH station (Figure 9), the air above displayed an ascending motion at that time, with a maximum value of strength of −0.6 Pa·s−1, according to the strongest time frame of PWV. As time went on, the ascending motion changed to a sinking motion in parallel with the occurrence of precipitation. However, at the same time nearby the JSGO (data not shown) and JSNT (data not shown) stations, the air was mainly ascending, thereby restraining the development of the sinking motion and hampering the precipitation. No precipitation occurred at JSGO and JSNT during this time, and precipitation only occurred after the ascending motion changed to a sinking motion around 12:00 p.m. on 19 June and 6:00 a.m. on 20 June, respectively. Thus, if the air above the station had a vertical ascending motion, it would promote the accumulation of PWV and hamper the fall of condensed water vapor to the ground. Local vertical motion was strongly related with the occurrence time of precipitation. Champollion et al. (2004) also found that rain stopped as soon as the weather circulation pattern changed [28], but they did not point out the important factor.
Figure 8. Vertical profile of the potential pseudo-equivalent temperature θse distribution with time for the (a) JSDH; (b) JSGIO; and (c) JSNT stations. θse is in K.
Atmosphere 06 00908 g008
Figure 9. Vertical air speed in Pa∙s−1 between 12:00 p.m. on 18 June 2009 and 12:00 a.m. on 21 June 2009 for the JSDH station. The black box denotes the fast GPS-PWV increasing stage corresponding to the ascending motion.
Atmosphere 06 00908 g009
At 12:00 p.m. on June 19, the atmospheric water vapor content increased to a relatively high value in all three areas (Figure 4). Combining this aspect with the divergence vertical profile with a center at 119.43° E (Figure 10), we can clearly see an obvious positive divergence center near 150 hPa north of Jiangsu, with a value above 6 × 10⁻⁵·s−1; the 950-hPa isobar had a negative divergence center with a value above −5 × 10⁻⁵·s−1. This structure of low-level convergence and high-level divergence favored the water vapor accumulation in the three areas and provided enough “material” for precipitation.
The vorticity was related to regions of divergence. This is a measure of the spin of air masses. Positive vorticity promotes the upward movement of an area, while negative vorticity strengthens its downward movement [26]. Its distribution (Figure 11) indicated that in most of the Jiangsu Province before precipitation, the low level of air above the main area had positive vorticity, while the high level had negative vorticity. This resulted in a strongly developing ascending air motion and strong pumping action of the atmosphere (because as the upper-level positive divergence moves over an area of air masses, the cyclonic circulation increases and air is forced upward). The formed structure of negative divergence and positive vorticity at the low level and positive divergence and negative vorticity at the high level favored the development and maintenance of PWV.
Figure 10. Divergence vertical profile along 119.43° E at 12:00 p.m. on 19 June 2009 in 10−5∙s−1.
Atmosphere 06 00908 g010
Figure 11. Vorticity vertical profile along 119.43° E in 10−5·s−1 at (a) 12:00 p.m. on 19 June 2009; (b) 12:00 a.m. on 20 June 2009; (c) 6:00 p.m. on 20 June 2009; and (d) 6:00 p.m. on 20 June 2009.
Atmosphere 06 00908 g011

5. Conclusions and Future Research

In this study, GPS-PWV data with high spatial and temporal resolution were obtained from ground-based GPS technology, and the derived data were used for a comprehensive analysis of a severe convection weather event that occurred on 18–20 June 2009 in the Jiangsu Province, China. The event resulted from the confluence between typical cold air from the southwest wind trough and southeastern warm air from low latitudes. According to the weather system movement path during this process, the evolution trend of the PWV at 13 stations in three areas was analyzed, and GPS-PWV variations were further expounded from the perspectives of dynamics and thermodynamics by using reanalysis data. The following conclusions were finally reached.
(1) A fast increase in GPS-PWV occurred before precipitation, and actual precipitation normally took place after GPS-PWV has reached a relatively high level. From the overall features of the 13 stations in three areas, it can be found that the fast increase and decrease in PWV normally indicated the start and end of precipitation. Abnormal increase in PWV before precipitation provides an early sign for predicting actual precipitation.
(2) There was a strong correlation between the start time of the rapid PWV increase at various stations and the location of the strong water vapor transfer belt, as evidenced by the fact that at the same location, both rapidly increased at a time point highly consistent with each other. This provides evidence that GPS-PWV data can be reliably used in water vapor monitoring. Moreover, the high temporal resolution of GPS-PWV can enable more effective determinations of the exact time of a water vapor variation event. Therefore, the water vapor flux (inflow and outflow) in a region can be accurately determined according to GPS-PWV variations.
(3) Dynamic and thermodynamic assessments at various stations in the three areas of this case study showed that during the period of rapid GPS-PWV increase, the negative divergence and positive vorticity at the low level and the positive divergence and negative vorticity at the high level played an important role in the occurrence and maintenance of precipitation. The unstable energy transformed from an unstable state to a stable state before and after precipitation, which affected the precipitation time in the three areas. Strong vertical ascending motion resulted in rapid accumulation of water vapor, but also inhibited the occurrence of precipitation. This explains why, despite the relatively high level of GSP-PWV that was maintained during certain time periods, the three areas experienced precipitation at different time points.
By analyzing the strong convection precipitation process, we concluded that ground-based GPS-PWV information and other meteorology data can effectively fill in the gaps of current detecting methods for water vapor variation, and the combination of different data can provide a deeper understanding of the processes involved. Although several important conclusions were obtained from this case study, it is not known at this time whether these conclusions are widely applicable to other strong convection weather events. Future studies of more events will be essential to confirm the conclusions drawn here. In particular, the dynamic and thermodynamic conditions behind the GPS-PWV variation features and actual precipitation need to be further studied and evaluated in accordance with the theoretical connection discovered in this study.
In summary, this analysis of strong convection weather provided us with the following insights. First, although GPS-PWV data are advantageous in terms of the high temporal and horizontal spatial resolution, weather predictions require even more comprehensive information about water vapor variation; therefore, GPS three-dimensional tomography may represent a valuable new focus for future research. Second, it is possible to effectively combine conventional meteorological detection data (such as weather radar data and ground-based observation data) with GPS-PWV data to obtain more accurate atmospheric features and thus improve prediction accuracies for short-term and imminent weather processes. This later application represents an important issue that needs additional research attention.

Acknowledgments

This work was supported by the National Natural Science Foundation of China (No. 41405036, No. 41471305, No. 41375043), the 2015 Middle-aged Academic Leaders Research Fund of Chengdu University of Information Technology (CUIT) (J201502), a Project of the Sichuan Education Office (15ZB0181), and the Scientific Research Foundation of CUIT (KYTZ201413, CRF201401). The authors would like to express their sincere thanks to the Jiangsu Meteorological Bureau for supplying the GPS-PWV data. We also thank the reviewers for their constructive comments and editorial suggestions that significantly improved the quality of the paper.

Author Contributions

Wang Hao conceived this research and designed the study. The paper was written by Wang Hao, with significant contributions from Jianxin He and Wei Ming. Zhang Zhendong analyzed the data and presented some conclusions.

Conflicts of Interest

The authors declare no conflict of interest.

References

  1. Duan, J.; Bevis, M.; Fang, P.; Bock, Y.; Chiswell, S.; Businger, S.; Rocken, C.; Solheim, F.; van Hove, T.; Ware, R.; et al. GPS meteorology: Direct estimation of the absolute value of precipitable water. J. Appl. Meteorol. 1996, 35, 830–838. [Google Scholar] [CrossRef]
  2. Wang, H.; Wei, M.; Zhou, S. A feasibility study for the construction of an atmospheric precipitable water vapor model based on the neural network technology. Desalin. Water Treat. 2014, 52, 37–39. [Google Scholar] [CrossRef]
  3. Zhai, P.; Eskridge, R. Analyses of inhomogeneities in radiosonde temperature and humidity time series. J. Clim. 1996, 9, 884–894. [Google Scholar] [CrossRef]
  4. Bevis, M.; Businger, S.; Chiswell, S.; Herring, T.; Anthes, R.; Rocken, C.; Ware, R. GPS meteorology: Mapping zenith wet delays onto precipitable water. J. Appl. Meteorol. 2004, 33, 379–386. [Google Scholar] [CrossRef]
  5. Ware, R.; Fulker, D.; Stein, S.; Anderson, D.; Avery, S.; Clark, R.; Droegemeier, K.; Kuettner, J.; Minster, J.B.; Sorooshian, S. SuomiNet: A Real-Time National GPS Network for Atmospheric Research and Education. Bull. Am. Meteorol. Soc. 2000, 81, 677–694. [Google Scholar] [CrossRef]
  6. Rocken, C.; Ware, R.; van Hove, T.; Solheim, F.; Alber, C.; Johnson, J. Sensing Atmospheric Water Vapor with the Global Positioning System. Geophys. Res. Lett. 1993, 20, 2631–2634. [Google Scholar] [CrossRef]
  7. Emardson, T.; Elegered, G.; Johansson, J. Three months of continuous monitoring of atmospheric water vapor with a network of GPS receivers. J. Geophys. Res. 1998, 103, 1807–1820. [Google Scholar] [CrossRef]
  8. Van Baelen, J.; Aubagnac, J.; Dabas, A. Comparison of near-real time estimates of integrated water vapor derived with GPS, radiosondes, and microwave radiometer. J. Atmos. Ocean. Technol. 2005, 22, 201–210. [Google Scholar] [CrossRef]
  9. Fontaine, B.; Roucou, P.; Trzaska, S. Atmospheric water cycle and moisture fluxes in the West African monsoon: Mean annual cycles and relationship using NCEP/NCAR reanalysis. Geophys. Res. Lett. 2003, 30, 11–17. [Google Scholar] [CrossRef]
  10. Wang, H.; Wei, M.; Li, G.; Zhou, S.; Zeng, Q. Analysis of precipitable water vapor from GPS measurements in Chengdu region: Distribution and evolution characteristics in autumn. Adv. Space Res. 2013, 52, 656–667. [Google Scholar] [CrossRef]
  11. Jin, S.; Li, Z.; Cho, J. Integrated water vapor field and multi-scale variations over China from GPS measurements. J. Appl. Meteorol. Climatol. 2008, 47, 3008–3015. [Google Scholar] [CrossRef]
  12. Roman, J.; Knuteson, R.; Ackerman, S.; Tobin, D.; Revercomb, H. Assessment of regional global climate model water vapor bias and trends using precipitable water vapor (PWV) observations from a network of global positioning satellite (GPS) receivers in the U.S. great plains and midwest. J. Clim. 2012, 25, 5471–5493. [Google Scholar] [CrossRef]
  13. Bennitt, G.; Jupp, A. Operational assimilation of GPS zenith total delay observations into the met office numerical weather prediction models. Mon. Weather Rev. 2012, 140, 2706–2719. [Google Scholar] [CrossRef]
  14. Poli, P.; Moll, P.; Rabier, F.; Desroziers, G.; Chapnik, B.; Berre, L.; Healy, S.B.; Andersson, E.; El Guelai, F.-Z. Forecast impact studies of zenith total delay data from European near real-time GPS stations in Meteo France 4DVAR. J. Geophys. Res. 2007, 112, D06114. [Google Scholar] [CrossRef]
  15. Means, J. GPS precipitable water as a diagnostic of the North American monsoon in California and Nevada. J. Clim. 2013, 26, 1432–1444. [Google Scholar] [CrossRef]
  16. Ryu, Y.; Smith, J.; Bou-Zeid, E. On the climatology of precipitable water and water vapor flux in the mid-Atlantic region of the United States. J. Hydrometeorol. 2015, 16, 70–87. [Google Scholar] [CrossRef]
  17. Kanda, M. Correlation between convective heavy rainfalls and GPS precipitable water. In Procedings of International Workshop on GPS Meteorology, Tsukuba, Japan, 14–17 January 2003; pp. 3–12.
  18. Liu, X.; Wang, Y.; Zhang, Z. Analysis of Harbin Area Atmosphere Precipitable Water Vapor by Using GPS Technology. Bull. Surv. Mapp. 2006, 4, 10–16. [Google Scholar]
  19. Radhakrishna, B.; Fabry, F.; Braun, J.; Hove, T. Precipitable water from GPS over the continental United States: Diurnal cycle, intercomparisons with NARR, and link with convective initiation. J. Clim. 2015, 28, 2584–2599. [Google Scholar] [CrossRef]
  20. Li, G.; Deng, J. Atmospheric water monitoring by using ground-based GPS during heavy rains produced by TPV and SWV. Adv. Meteorol. 2013. [Google Scholar] [CrossRef]
  21. Moore, A.; Small, I.; Gutman, S.; Bock, Y.; Dumas, J.; Fang, P.; Haase, J.; Jackson, M.; Laber, J. National weather service forecasters use GPS precipitable water vapor for enhanced situational awareness during the southern California summer monsoon. Bull. Am. Meteorol. Soc. 2015. [Google Scholar] [CrossRef]
  22. Wu, X. The main meteorological disasters and their spatial and temporal distribution in Jiangsu province. Sci. Meteorol. Sin. 1996, 16, 291–297. [Google Scholar]
  23. Saastamoinen, J. Atmospheric Correction for the Troposphere and Stratosphere in Radio Ranging of Satellites; American Geophysical Union: Washington, DC, USA, 1972. [Google Scholar]
  24. Boudouris, G. On the index of refraction of air, the absorption and dispersion of centimeter waves in gases. J. Res. Natl. Bur. Stand. 1963, 67, 631–684. [Google Scholar]
  25. Jie, G.; Li, G.; Huan, D. Establish local model for weighted mean temperature of the troposphere based on 40a radiosonde data in Chengdu and Chongqing region. J. Wuhan Univ. (Inf. Sci.) 2008, 33, 43–46. [Google Scholar]
  26. Wang, H.; Li, G. Construction and Application about the Monitoring System of Water Vapor Derived from Ground-based GPS in Chengdu. J. Geo-Inf. Sci. 2011, 13, 213–218. [Google Scholar] [CrossRef]
  27. Kalnay, E.; Kanamitsu, M.; Kistler, R.; Collins, W.; Deaven, D.; Gandin, L.; Iredell, M.; Saha, S.; White, G.; Woollen, J.; et al. The NCEP/NCAR 40-year reanalysis project. Bull. Am. Meteorol. Soc. 1996, 77, 437–471. [Google Scholar] [CrossRef]
  28. Champollion, C.; Masson, F.; van Baelen, J.; Walpersdorf, A.; Chery, J.; Doerflinger, E. GPS monitoring of the tropospheric water vapor distribution and variation during the 9 September 2002 torrential precipitation episode in the Cevennes (southern France). J. Geophys. Res. 2004, 109, D24102. [Google Scholar] [CrossRef]

