
Characteristics and Seasonal Variations of Carbonaceous Species in PM2.5 in Taiyuan, China


Abstract
:1. Introduction
2. Experimental Section
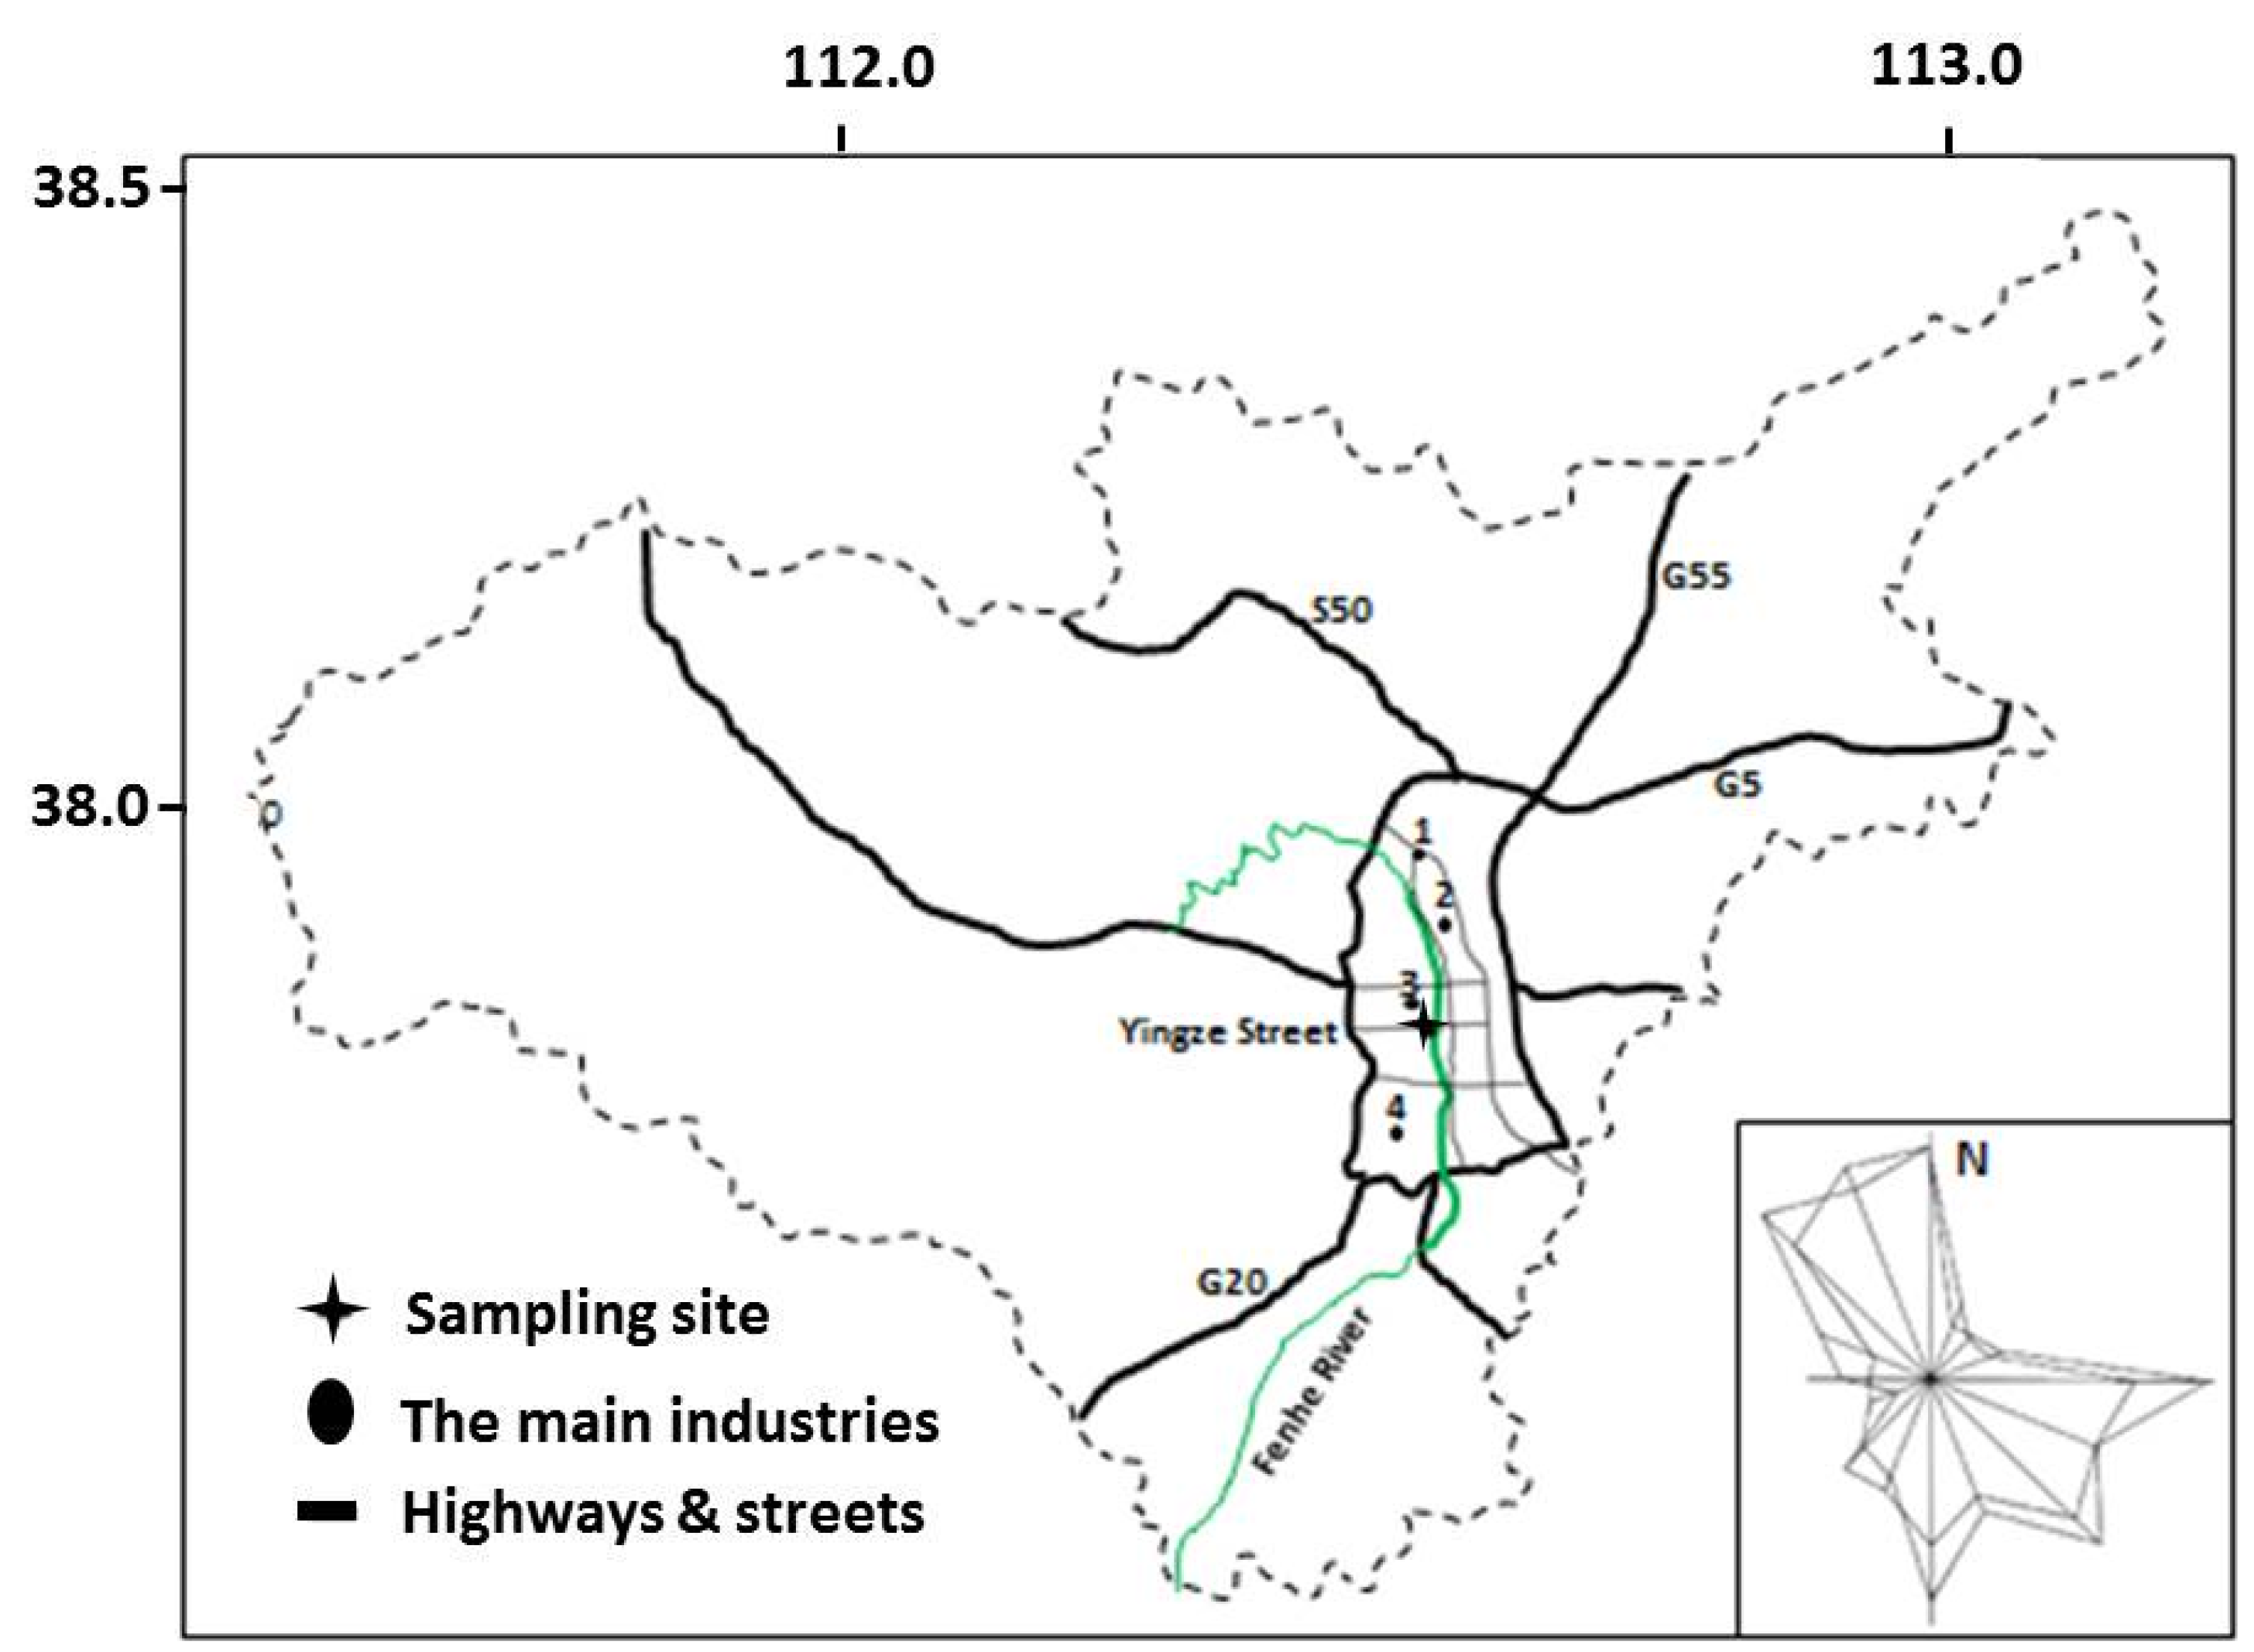
2.1. Site Description
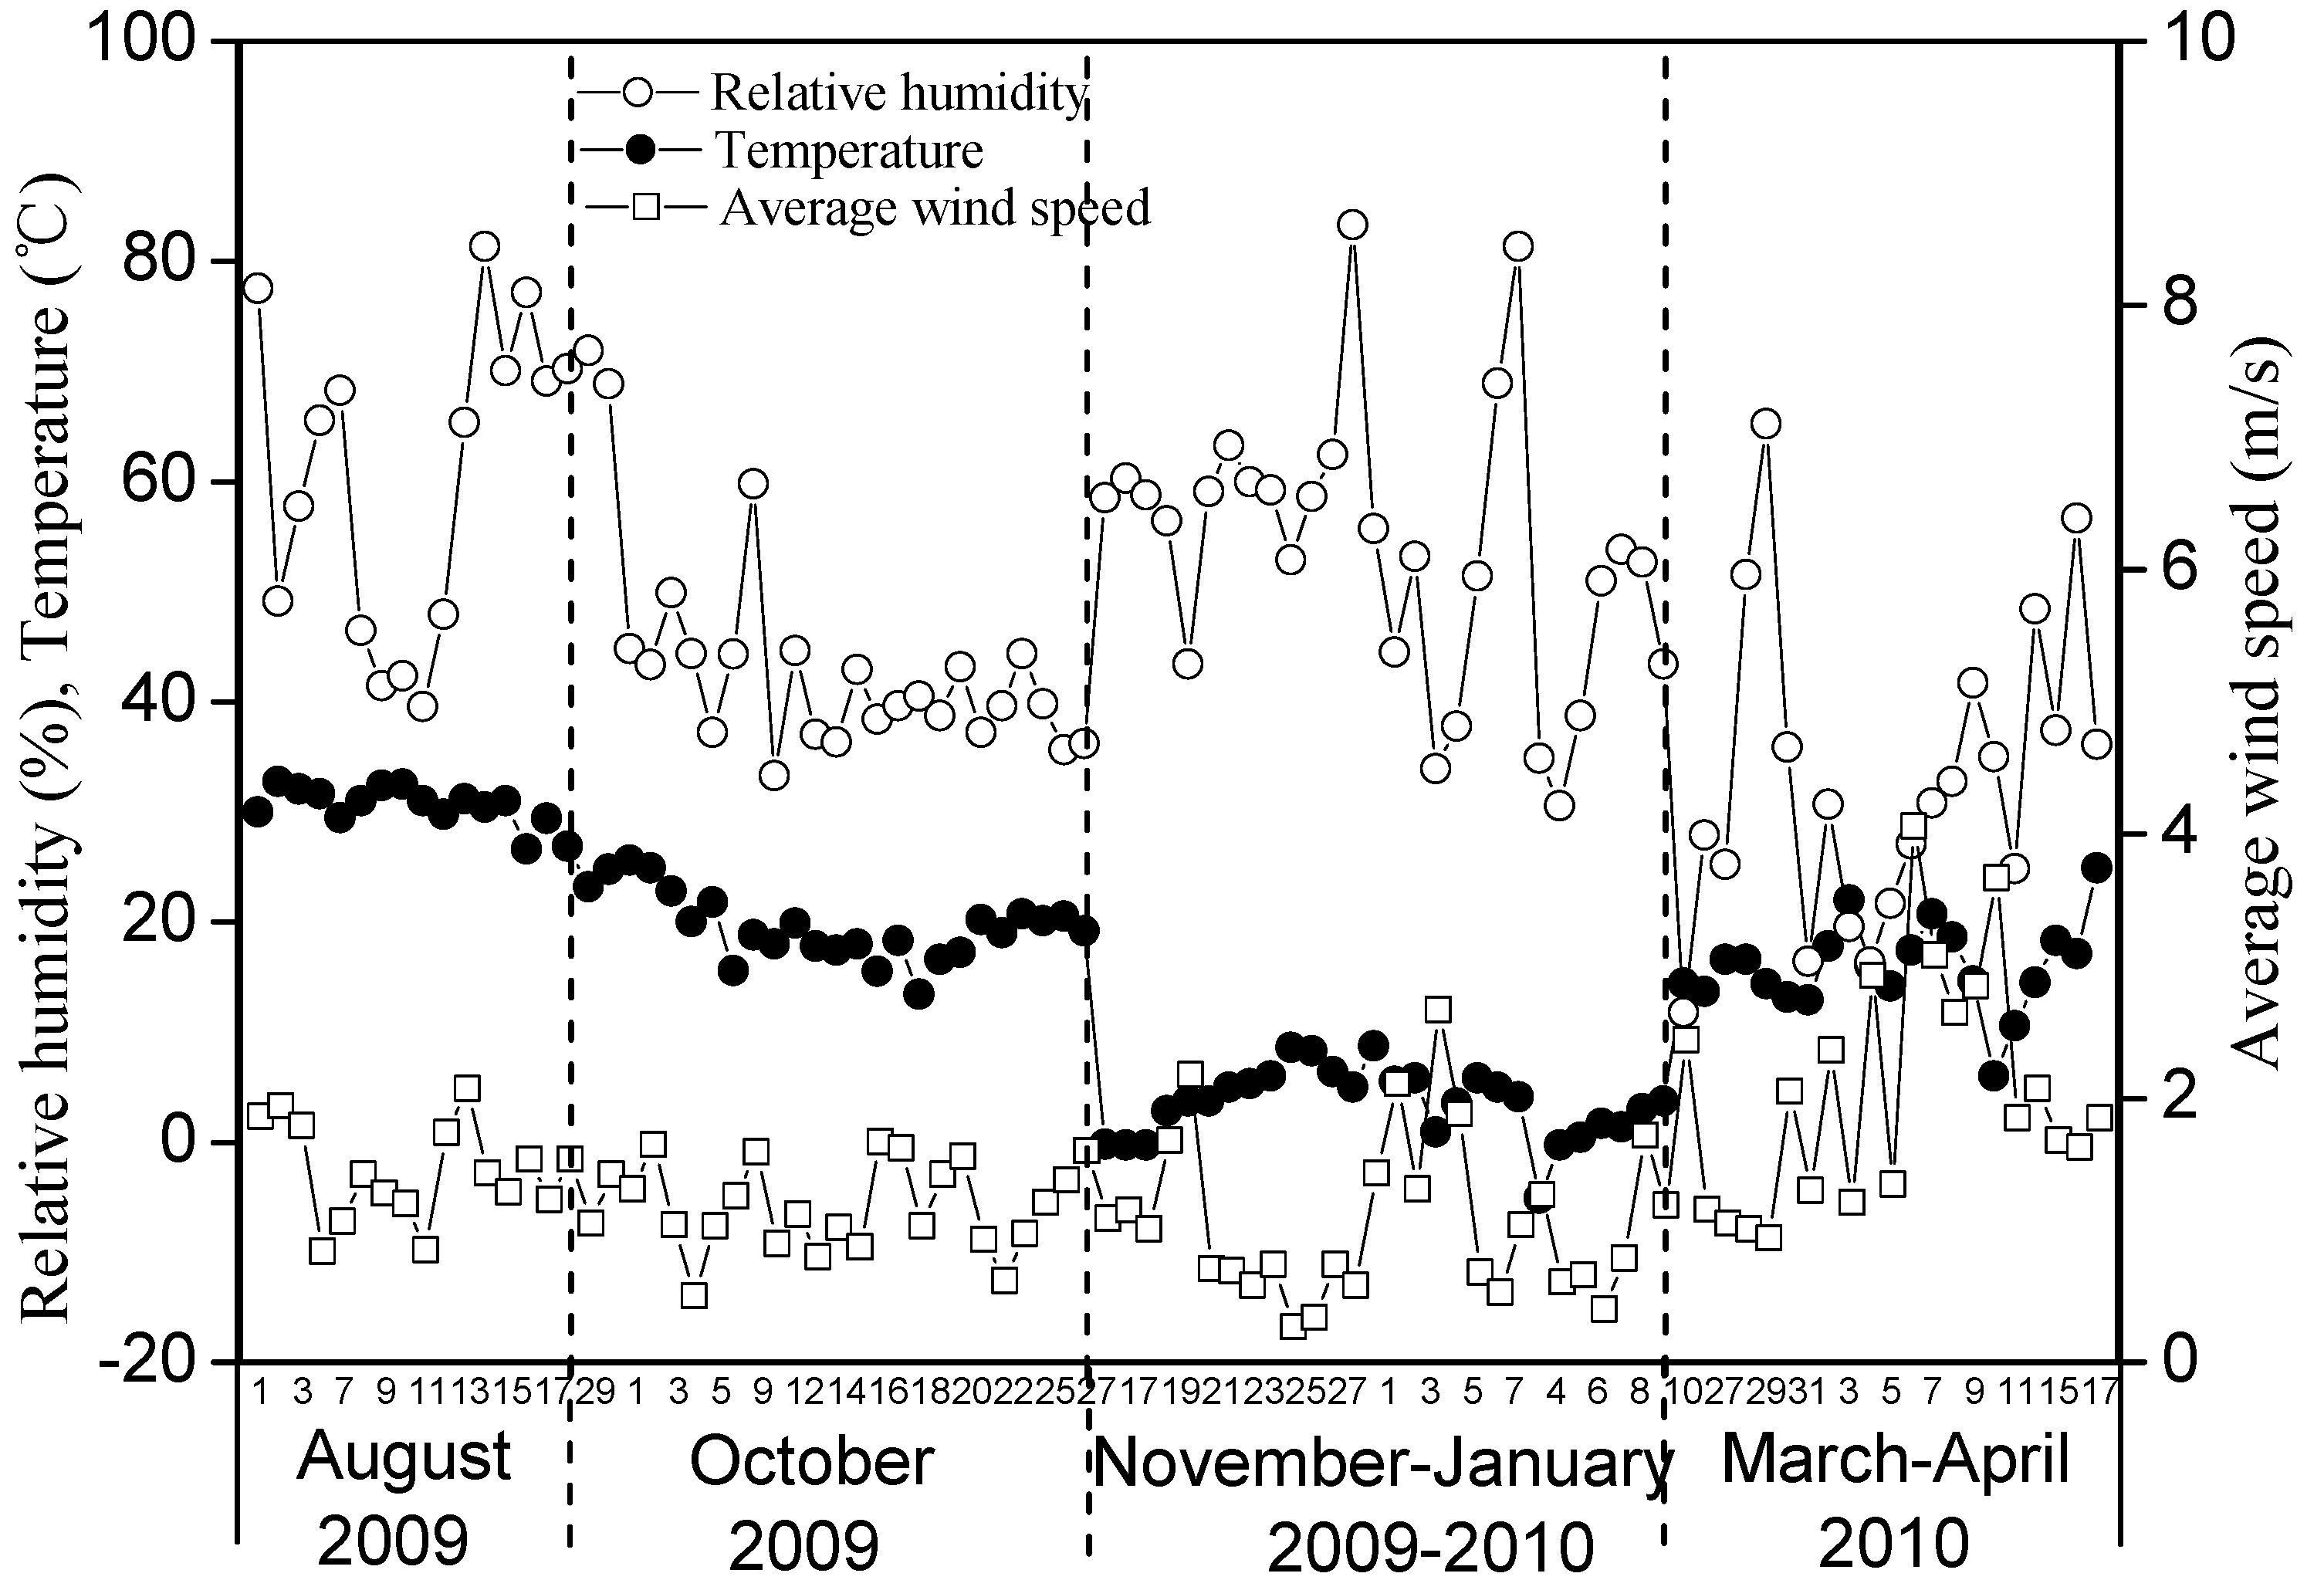
2.2. Sampling
2.3. Carbonaceous Analysis
3. Results and Discussion
3.1. PM2.5 Level


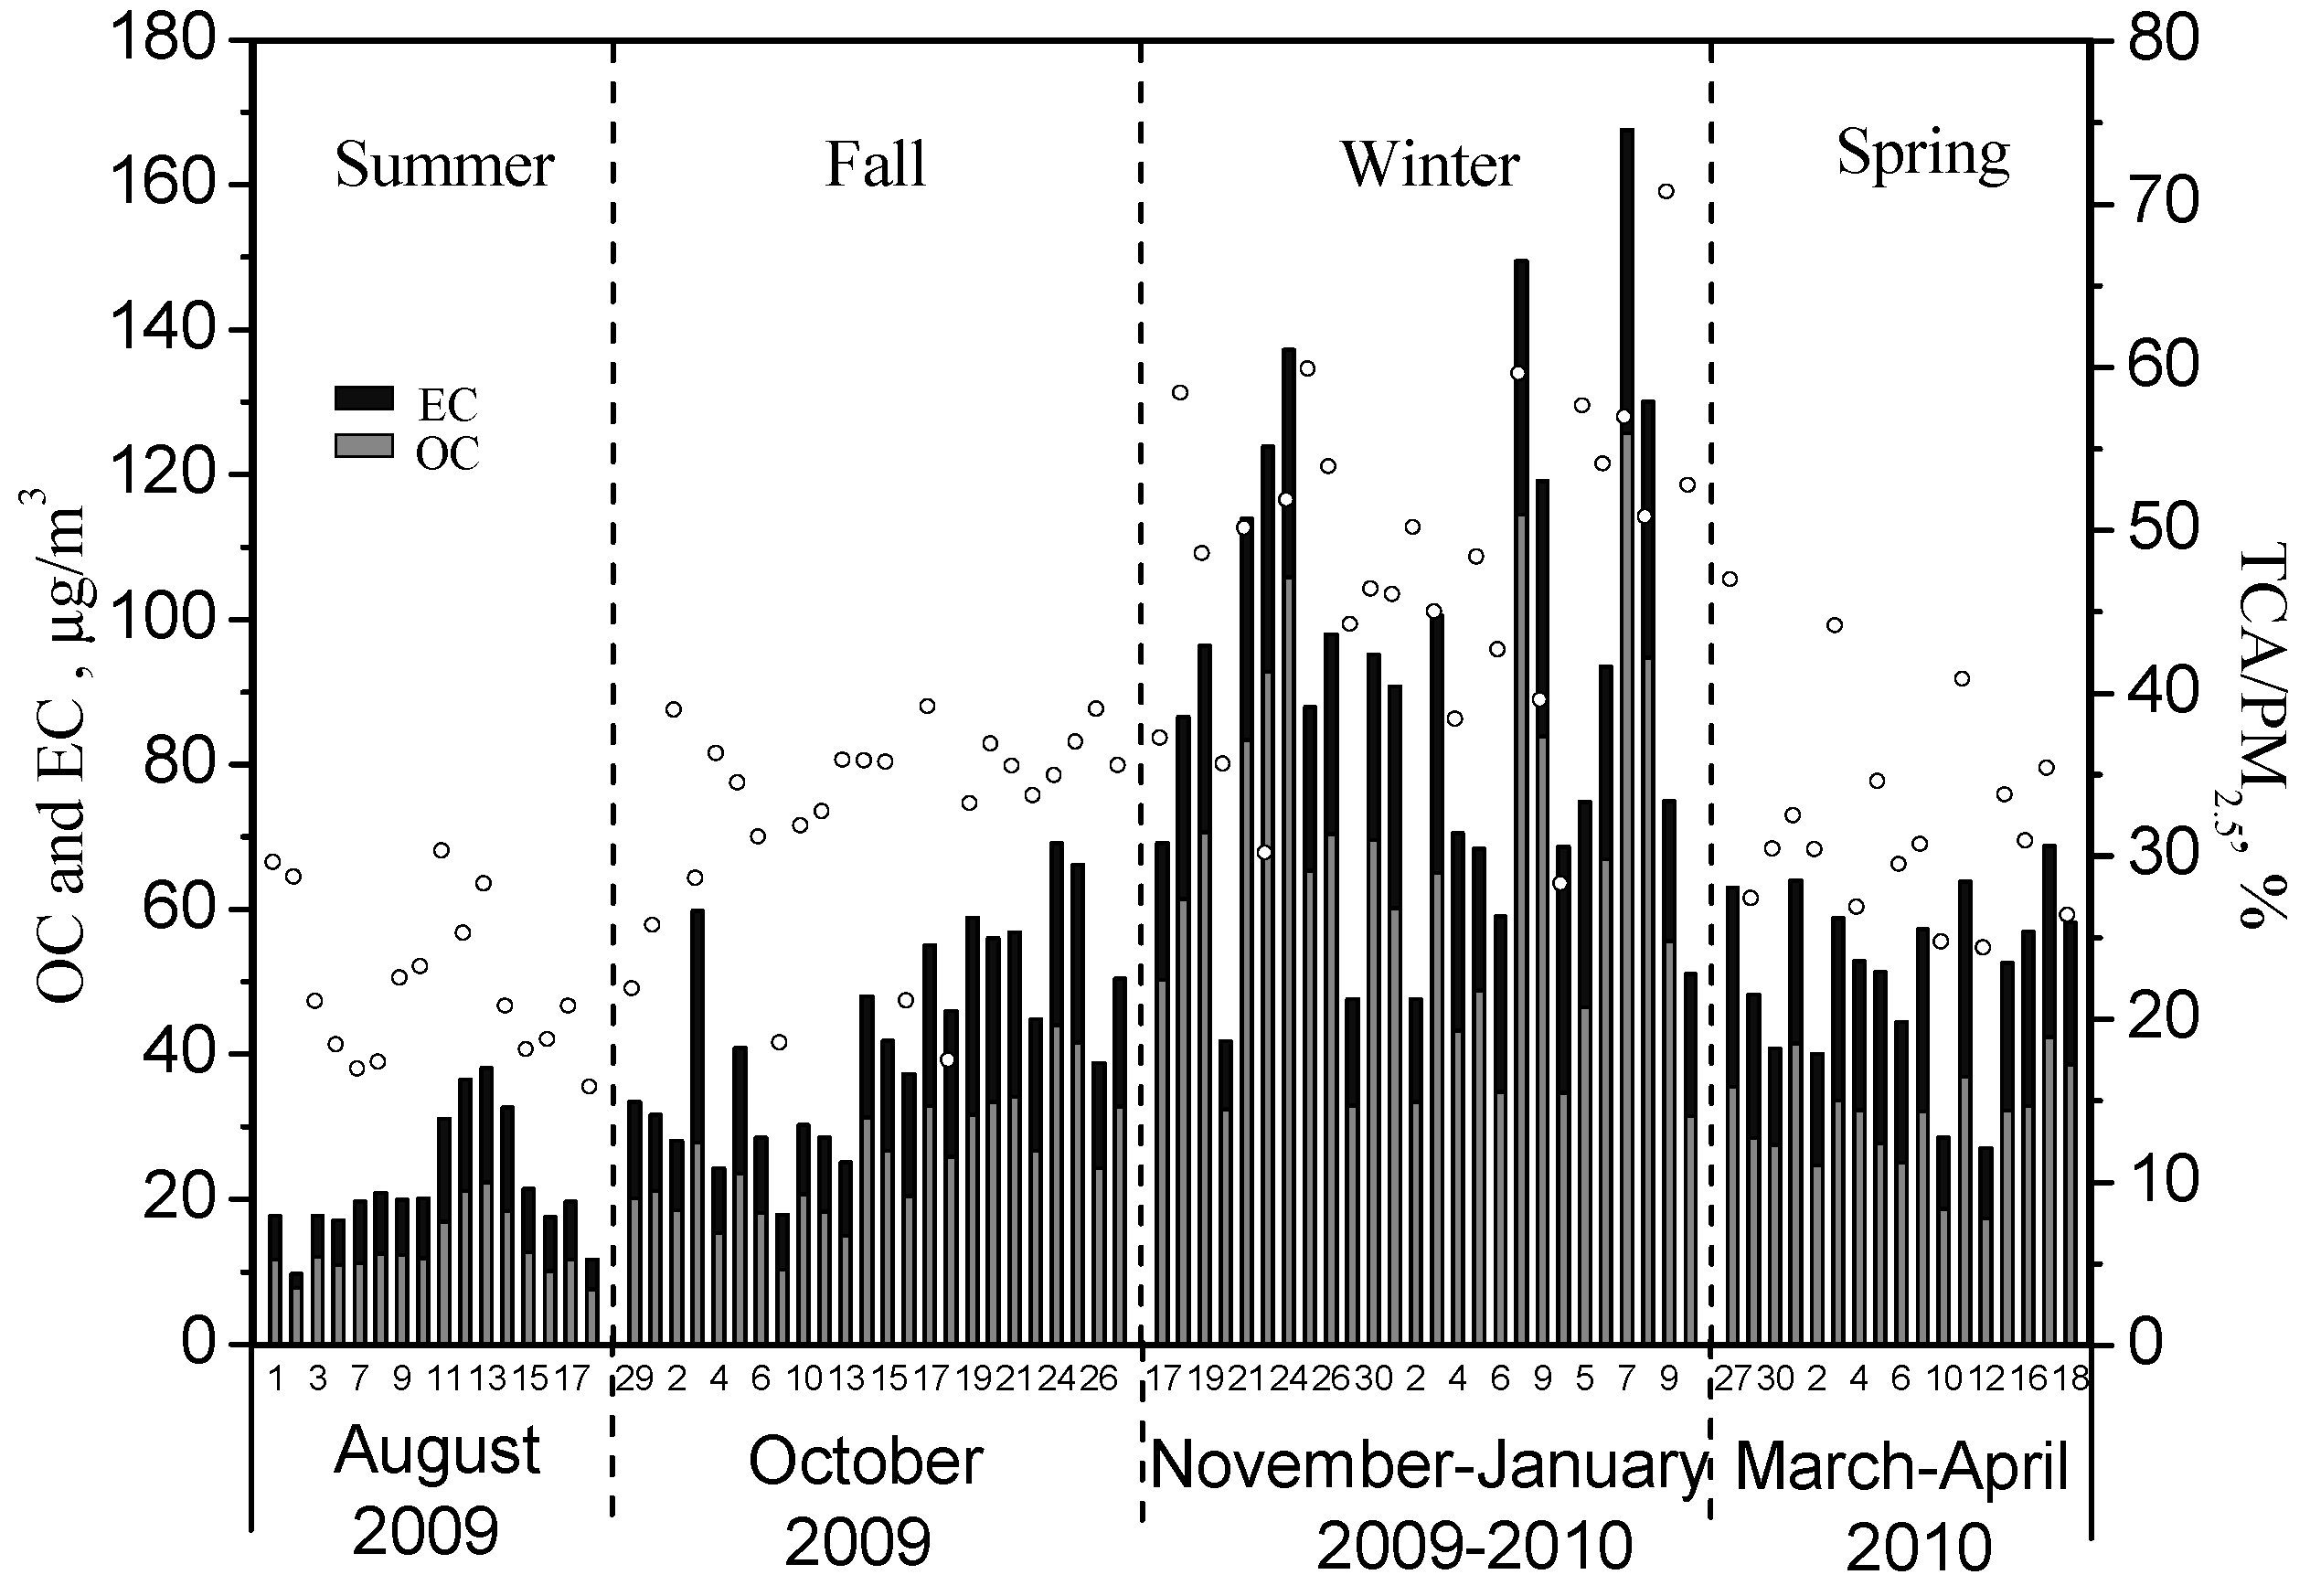
3.2. Carbonaceous Species in PM2.5

| City | Season (Period) | PM2.5 (μg/m3) | OC (μg/m3) | EC (μg/m3) | OC/EC | Reference |
|---|---|---|---|---|---|---|
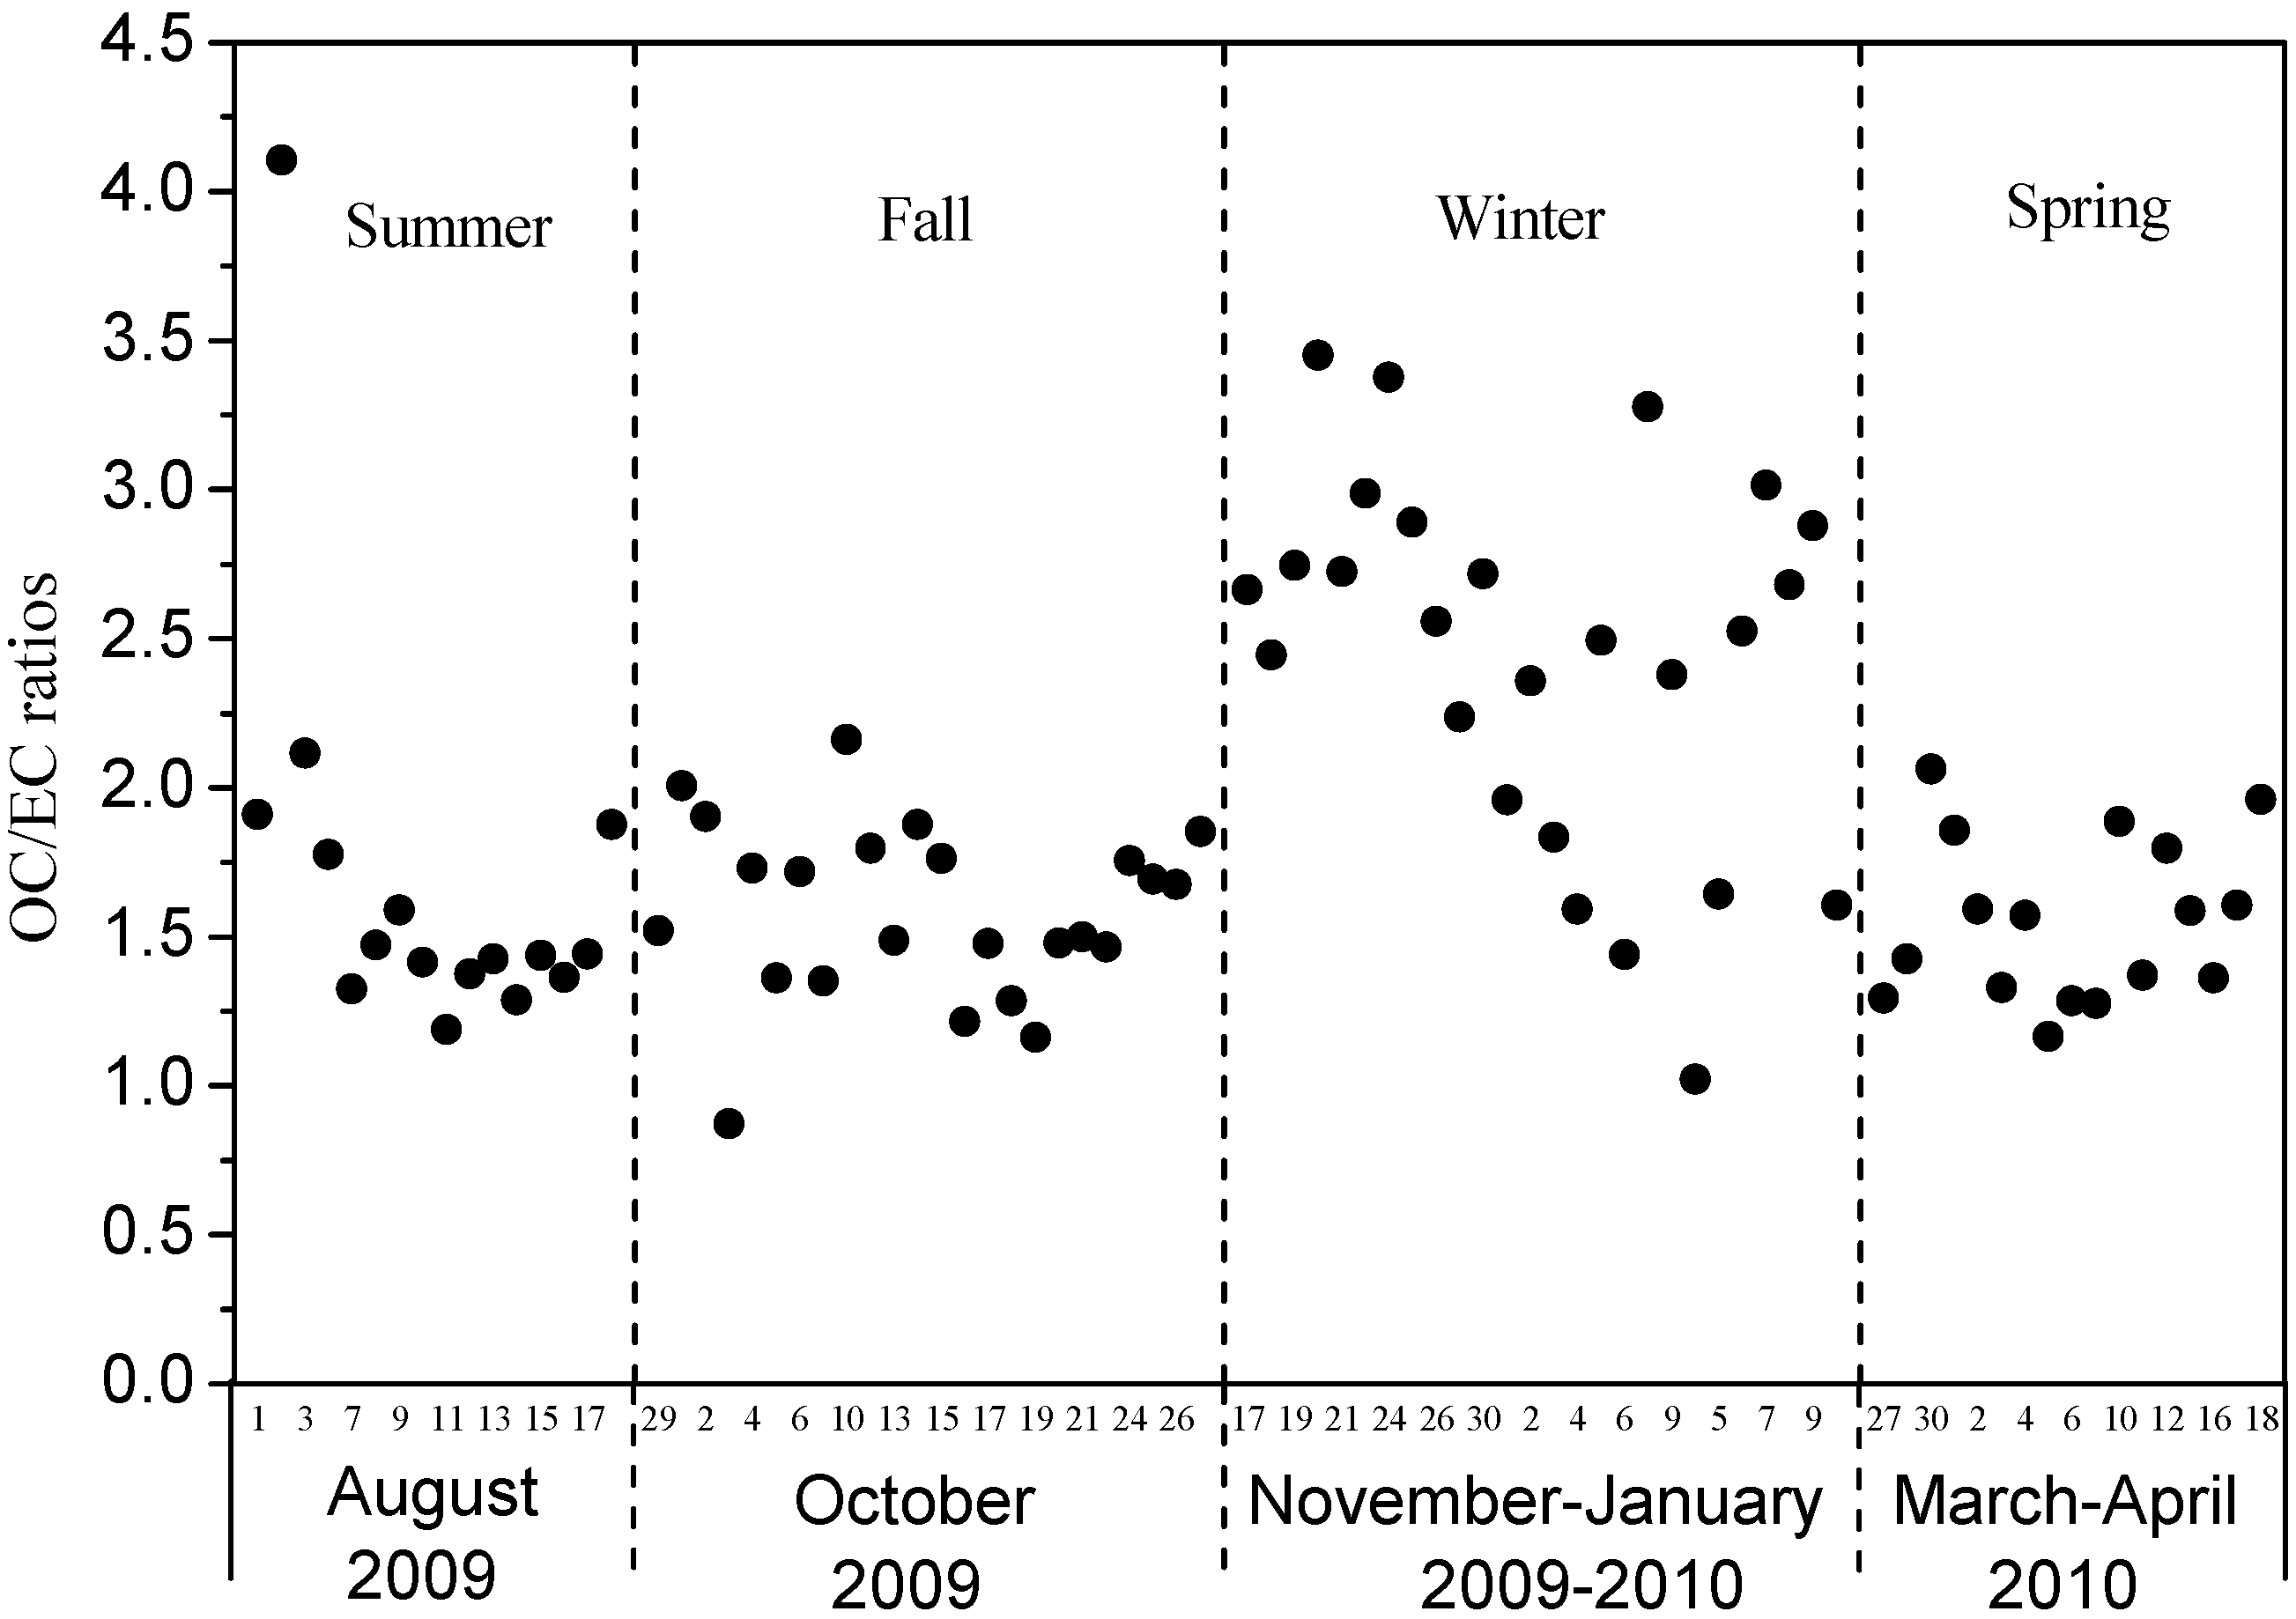
| Taiyuan | Summer (August 2009) | 135.8 ± 40.9 | 13.2 ± 4.3 | 8.8 ± 4.1 | 1.7 ± 0.7 | This study |
| Fall (September–October 2009) | 182.2 ± 63.1 | 25.7 ± 8.3 | 16.3 ± 6.9 | 1.8 ± 0.9 | ||
| Winter (November 2009–January 2010) | 260.8 ± 113.6 | 62.7 ± 27.7 | 25.4 ± 8.5 | 2.5 ± 0.6 | ||
| Spring (March–April 2010) | 248.7 ± 89.6 | 31.6 ± 8.7 | 21.6 ± 7.9 | 1.5 ± 0.3 | ||
| Hong Kong | Summer (June–July 2002) Winter (January–February 2002) | 31.0 ± 16.9 | 5.3 ± 2.1 | 3.2 ± 2.6 | 1.9 | [1,10] |
| 54.5 ± 22.9 | 9.6 ± 4.5 | 4.7 ± 2.9 | 2.3 | |||
| Guangzhou | 78.1 ± 29.7 | 15.8 ± 6.4 | 5.9 ± 2.1 | 2.7 | ||
| 105.9 ± 71.4 | 22.6 ± 18.0 | 8.3 ± 5.6 | 2.7 | |||
| Shenzhen | 47.1 ± 16.7 | 7.6 ± 4.9 | 4.2 ± 3.1 | 1.8 | ||
| 60.8 ± 18.0 | 13.2 ± 4.1 | 6.1 ± 1.8 | 2.2 | |||
| Zhuhai | 31.0 ± 20.0 | 5.4 ± 3.4 | 1.9 ± 0.9 | 2.9 | ||
| 19.3 ± 23.7 | 12.2 ± 4.4 | 5.0 ± 1.6 | 2.5 | |||
| Xi’an | Fall (September–October 2003) | ―a | 34.1 ± 18.0 | 11.3 ± 6.9 | 3.3 | [18] |
| Winter (November 2003–February 2004) | ― | 61.9 ± 33.2 | 12.3 ± 5.3 | 5.1 | ||
| Beijing | Winter (January–February 2001) | 184.5 ± 33.9 | 40.1 ± 4.4 | 9.9 ± 3.0 | 4.3 | [3] |
| Spring (March 2001) | 118.5 ± 27.3 | 21.5 ± 7.3 | 6.5 ± 0.1 | 3.3 | ||
| Summer (June–July 2001) | 94.4 ± 15.6 | 17.1 ± 2.3 | 8.0 ± 1.6 | 2.1 | ||
| Fall (September–October 2001) | 92.2 ± 18.5 | 21.0 ± 2.3 | 10.7 ± 1.8 | 2.0 | ||
| 14 cities b | Winter (January 2003) | 163.9 | 38.1 | 9.9 | 3.8 | [11] |
| Summer (June–July 2003) | 71.2 | 13.8 | 3.6 | 4.2 |
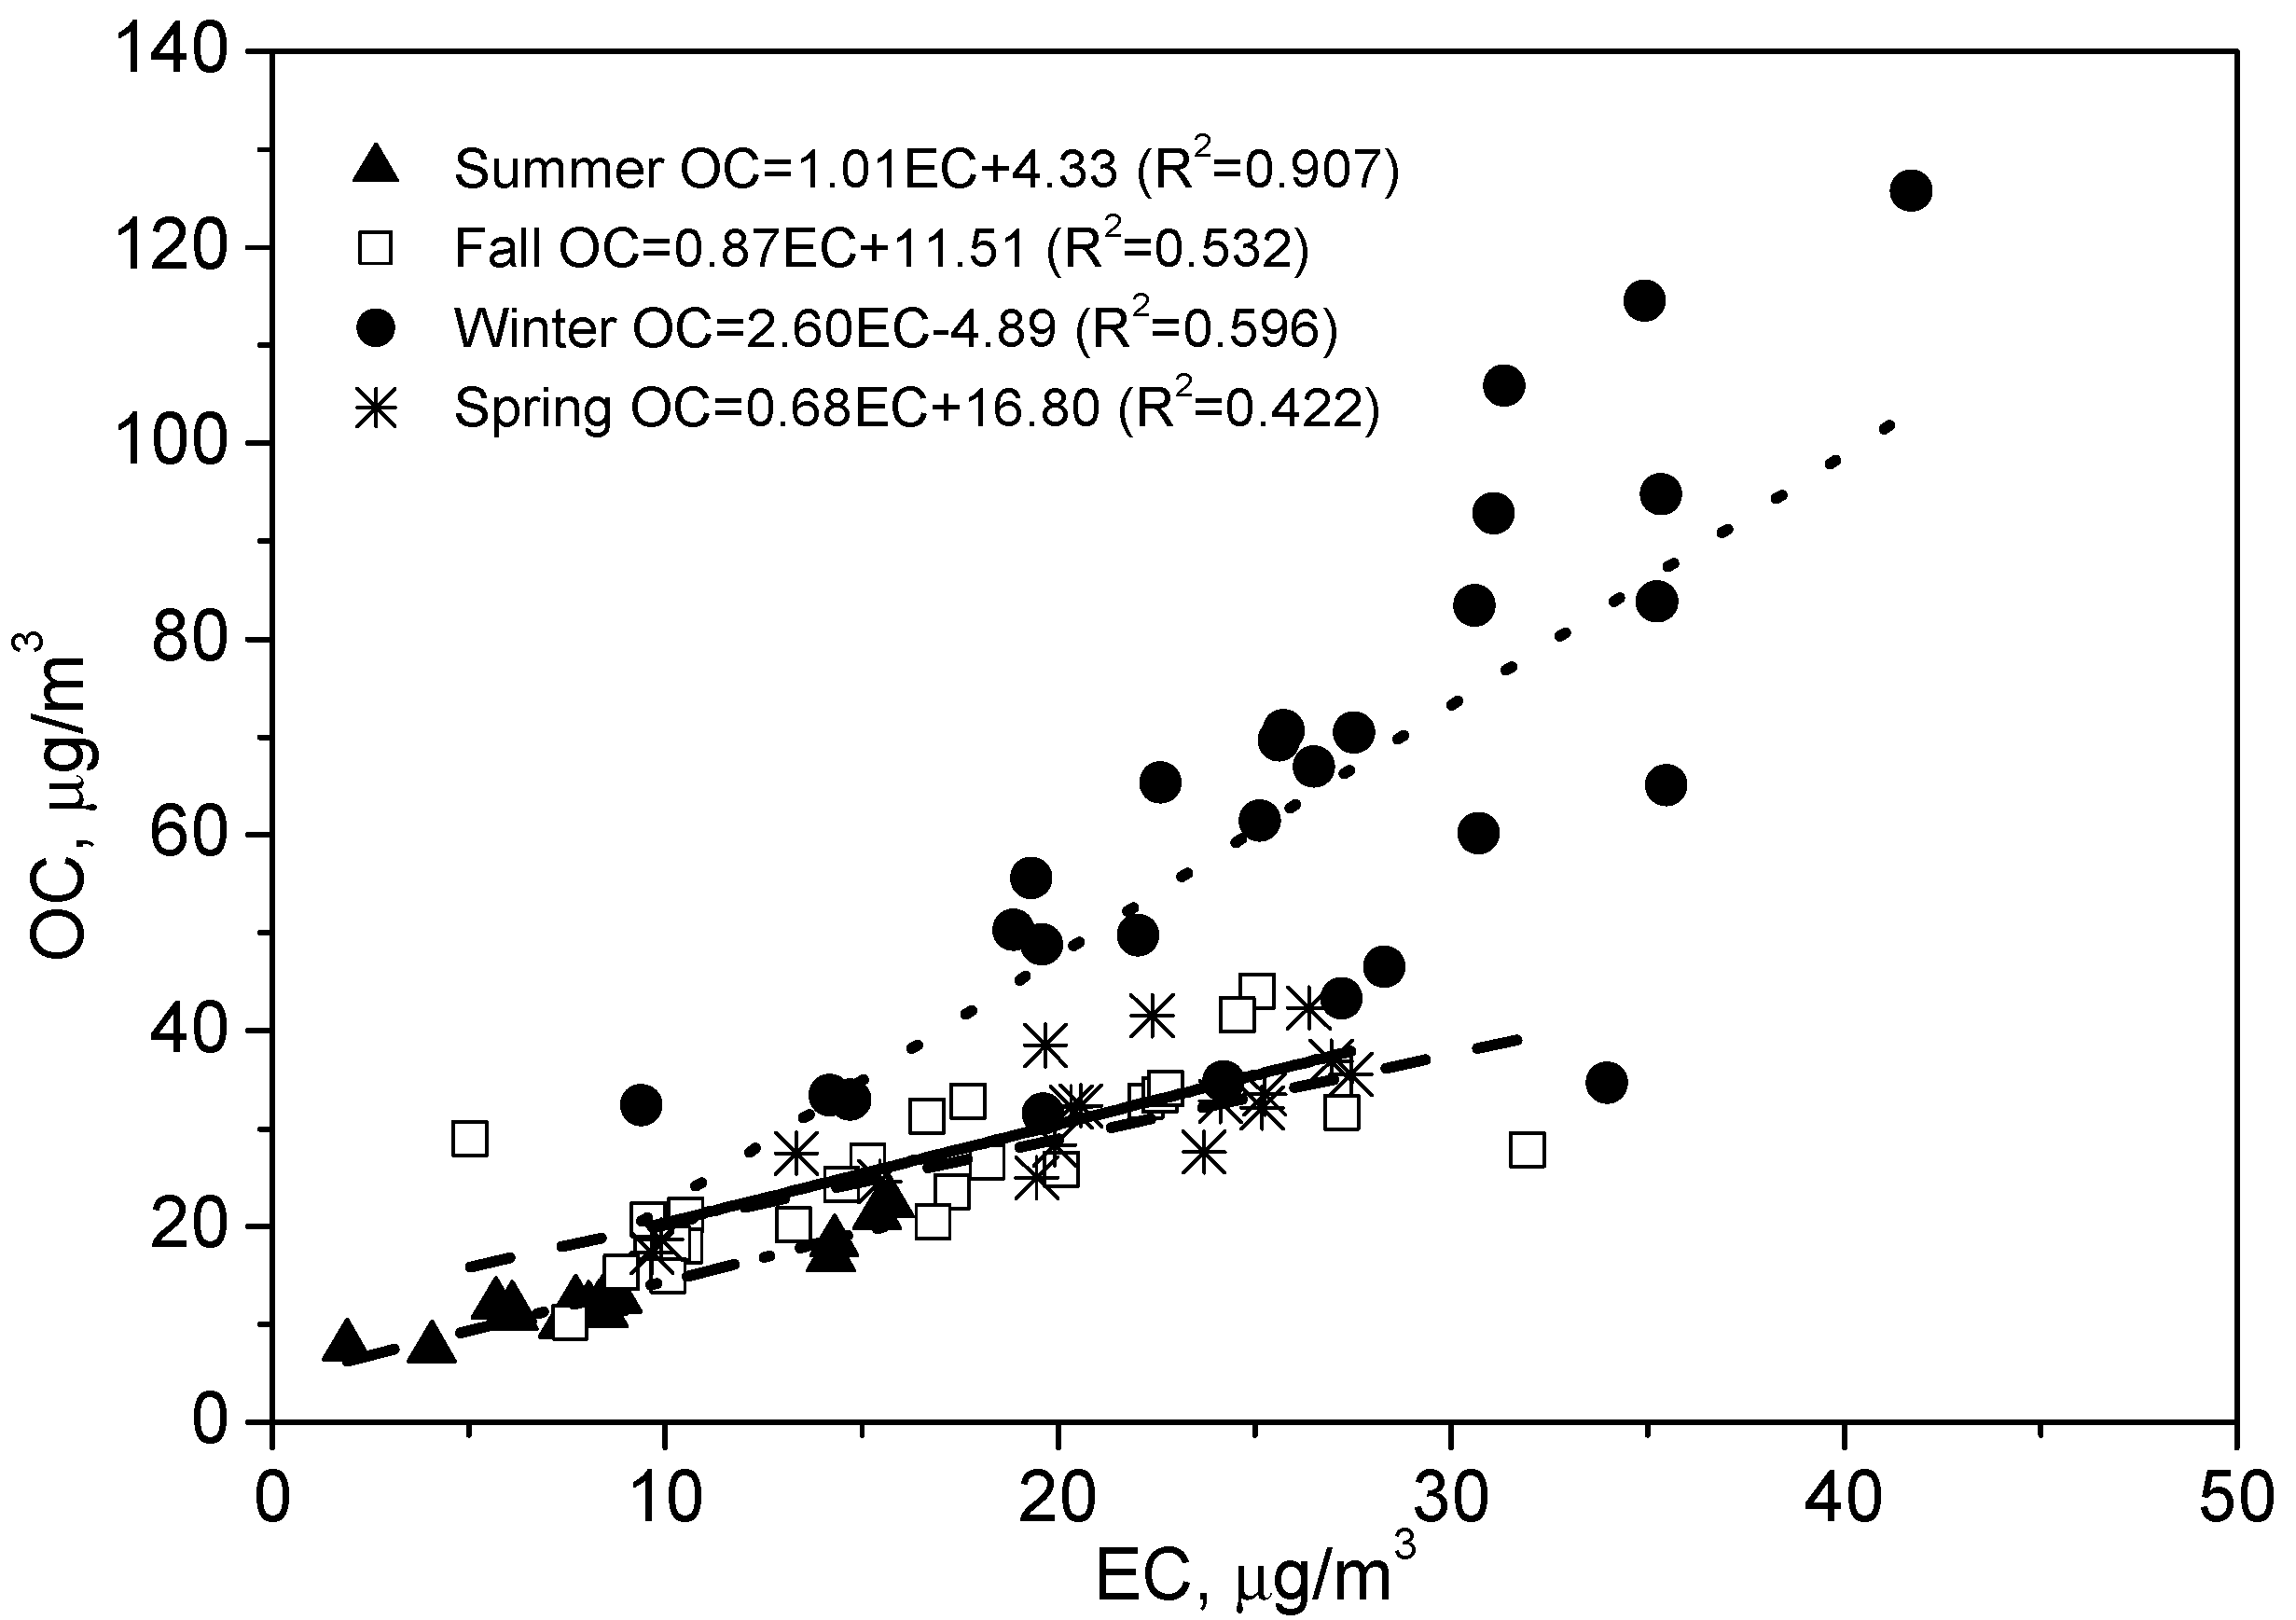
3.3. Relationship between OC and EC
3.4. Estimation of SOC and SOA Levels
| Season | (OC/EC) mina | SOC (µg/m3) | POC (µg/m3) | SOC/OC (%) | SOAb (µg/m3) | SOA/PM2.5 (%) |
|---|---|---|---|---|---|---|
| Annual | 1.1 ± 0.1 | 17.2 ± 18.9 | 20.2 ± 9.5 | 39.0 ± 20.3 | 27.5 ± 30.3 | 12.2 ± 10.9 |
| Summer | 1.2 | 2.6 ± 1.5 | 10.5 ± 4.9 | 22.9 ± 17.6 | 4.2 ± 2.5 | 4.0 ± 4.3 |
| Fall | 0.9 | 11.0 ± 5.7 | 14.7 ± 6.2 | 42.8 ± 15.5 | 17.7 ± 9.1 | 10.5 ± 5.5 |
| Winter | 1.0 | 37.4 ± 21.6 | 25.4 ± 8.5 | 56.2 ± 14.6 | 59.8 ± 34.6 | 23.7 ± 11.3 |
| Spring | 1.1 | 7.8 ± 5.0 | 23.8 ± 8.7 | 25.9 ± 14.2 | 12.5 ± 8.0 | 5.5 ± 3.0 |
4. Conclusions
Acknowledgments
Author Contributions
Conflicts of Interest
References
- Cao, J.J.; Lee, S.C.; Ho, K.F.; Zhang, X.Y.; Zou, S.C.; Fung, K.; Chow, J.C.; Watson, J.G. Characteristics of carbonaceous aerosol in Pearl River Delta Region, China during 2001 winter period. Atmos. Environ. 2003, 37, 1451–1460. [Google Scholar] [CrossRef]
- Dan, M.; Zhuang, G.S.; Li, X.X.; Tao, H.R.; Zhuang, Y.H. The characteristics of carbonaceous species and their sources in PM2.5 in Beijing. Atmos. Environ. 2004, 38, 3443–3452. [Google Scholar] [CrossRef]
- Yang, F.; He, K.; Ye, B.; Chen, X.; Cha, L.; Cadle, S.H.; Chan, T.; Mulawa, P.A. One-year record of organic and elemental carbon in fine particles in downtown Beijing and Shanghai. Atmos. Chem. Phys. Discuss. 2005, 5, 217–241. [Google Scholar] [CrossRef]
- Feng, Y.L.; Chen, Y.J.; Guo, H.; Zhi, G.R.; Xiong, S.C.; Li, J.; Sheng, G.Y.; Fu, J.M. Characterisitcs of organic and elemental carbon in PM2.5 samples in Shanghai, China. Atmos. Res. 2009, 92, 434–442. [Google Scholar] [CrossRef]
- Cao, G.L.; Zhang, X.Y.; Zheng, F.C. Inventory of black carbon and organic carbon emissions from China. Atmos. Environ. 2006, 40, 6516–6527. [Google Scholar] [CrossRef]
- Krzyzanowski, M.; Cohen, A. Update of WHO air quality guidelines. Air Qual. Atmos. Health 2008, 1, 7–13. [Google Scholar] [CrossRef]
- Kloner, R.A.; Simkhovich, B.Z. Introduction to the role of air pollution in heart disease. Air Qual. Atmos. Health 2011, 4, 1–3. [Google Scholar] [CrossRef]
- Offenberg, J.H.; Baker, J.E. Aerosol size distributions of elemental and organic carbon in urban and over-water atmospheres. Atmos. Environ. 2000, 34, 1509–1517. [Google Scholar] [CrossRef]
- Samara, C.; Voutsa, D.; Kouras, A.; Eleftheriadis, K.; Maggos, T.; Saraga, D.; Petrakakis, M. Organic and elemental carbon associated to PM10 and PM2.5 at urban sites of northern Greece. Environ. Sci. Pollut. Res. 2014, 21, 1769–1785. [Google Scholar] [CrossRef] [PubMed]
- Cao, J.J.; Lee, S.C.; Ho, K.F.; Zou, S.C.; Fung, K.; Li, Y.; Watson, J.G.; Chow, J.C. Spatial and seasonal variations of atmospheric organic carbon and elemental carbon in Pearl River Delta Region, China. Atmos. Environ. 2004, 38, 4447–4456. [Google Scholar] [CrossRef]
- Cao, J.J.; Lee, S.C.; Chow, J.C.; Watson, J.G.; Ho, K.F.; Zhang, R.J.; Jin, Z.D.; Shen, Z.X.; Chen, G.C.; Kang, Y.M.; et al. Spatial and seasonal distributions of carbonaceous aerosols over China. J. Geophys. Res. 2007, 112, 1–9. [Google Scholar] [CrossRef]
- Xie, R.K.; Seip, H.M.; Liu, L.; Zhang, D.S. Characterization of individual airborne particles in Taiyuan City, China. Air Qual. Atmos. Health 2009, 2, 123–131. [Google Scholar] [CrossRef] [PubMed]
- Meng, Z.Y.; Jiang, X.M.; Yan, P.; Lin, W.L.; Zhang, H.D.; Wang, Y. Characteristics and sources of PM2.5 and carbonaceous species during winter in Taiyuan, China. Atmos. Environ. 2007, 41, 6901–6908. [Google Scholar] [CrossRef]
- Environmental Monitoring Center of Taiyuan. Environmental Quality Report for Taiyuan, 2010–2013; Environmental Monitoring Center of Taiyuan: Taiyuan, Shanxi, China, 2014. (In Chinese) [Google Scholar]
- Zhang, Y.; Yan, Y.L.; He, Q.S. Mathematical optimization of monitoring stations for atmospheric environment in Taiyuan city, Shanxi Province, China. Adv. Mater. Res. 2012, 518–523, 1556–1560. [Google Scholar] [CrossRef]
- Duan, J.C.; Tan, J.H.; Cheng, D.X.; Bi, X.H.; Deng, W.J.; Sheng, G.Y.; Fu, J.M.; Wong, M.H. Sources and characteristics of carbonaceous aerosol in two largest cities in Pearl River Delta Region, China. Atmos Environ. 2007, 41, 2895–2903. [Google Scholar] [CrossRef]
- He, K.B.; Yang, F.M.; Ma, Y.L.; Zhang, Q.; Yao, X.H.; Chan, C.K.; Cadle, S.; Chan, T.; Mulawa, P. The characteristics of PM2.5 in Beijing, China. Atmos. Environ. 2001, 35, 4959–4970. [Google Scholar] [CrossRef]
- Ye, B.M.; Ji, X.L.; Yang, H.Z.; Yao, X.H.; Chan, C.K.; Cadle, S.H.; Chan, T.; Mulawa, P.A. Concentration and chemical composition of PM2.5 in Shanghai for 1-year period. Atmos. Environ. 2003, 37, 499–510. [Google Scholar] [CrossRef]
- Wang, M.; Cui, Y.; Yan, Y.L.; He, Q.S.; Qian, T.W.; Guo, Y.Y. Study on the Strategy for Air Pollution control in Taiyuan. Environ. Sci. Manag. 2014, 39, 18–21. (In Chinese) [Google Scholar]
- Wang, G.; Xie, M.; Hu, S.; Gao, S.; Tachibana, E.; Kawamura, K. Dicarboxylic acids, metals and isotopic compositions of C and N in atmospheric aerosols from inland China: implications for dust and coal burning emission and secondary aerosol formation. Atmos. Chem. Phys. 2010, 10, 6087–6096. [Google Scholar] [CrossRef]
- Cao, J.J.; Chow, C.J.; Lee, S.C.; Li, Y.; Chen, S.W.; An, Z.S.; Fung, K.; Watson, J.G.; Zhu, C.S.; Liu, S.X. Characterization and source apportionment of atmospheric organic and elemental carbon during fall and winter of 2003 in Xi’an, China. Atmos. Chem. Phys. Discuss. 2005, 5, 3561–3593. [Google Scholar] [CrossRef]
- Turpin, B.J.; Huntzicker, J.J. Identification of secondary organic aerosol episodes and quantization of primary and secondary organic aerosol concentrations during SCAQS. Atmos. Environ. 1995, 29, 3527–3544. [Google Scholar] [CrossRef]
- Watson, J.G.; Chow, J.C.; Houck, J.E. PM2.5 chemical source profiles for vehicle exhaust, vegetative burning, geological material, and coal burning in Northwestern Colorado during 1995. Chemosphere 2001, 43, 1141–1151. [Google Scholar] [CrossRef]
- Castro, L.M.; Pio, C.A.; Harrison, R.M.; Smith, D.J.T. Carbonaceous aerosol in urban and rural European atmospheres: Estimation of secondary organic carbon concentrations. Atmos. Environ. 1999, 33, 2771–2781. [Google Scholar] [CrossRef]
© 2015 by the authors; licensee MDPI, Basel, Switzerland. This article is an open access article distributed under the terms and conditions of the Creative Commons Attribution license (http://creativecommons.org/licenses/by/4.0/).
Share and Cite
He, Q.; Guo, W.; Zhang, G.; Yan, Y.; Chen, L. Characteristics and Seasonal Variations of Carbonaceous Species in PM2.5 in Taiyuan, China. Atmosphere 2015, 6, 850-862. https://doi.org/10.3390/atmos6060850
He Q, Guo W, Zhang G, Yan Y, Chen L. Characteristics and Seasonal Variations of Carbonaceous Species in PM2.5 in Taiyuan, China. Atmosphere. 2015; 6(6):850-862. https://doi.org/10.3390/atmos6060850
Chicago/Turabian StyleHe, Qiusheng, Wendi Guo, Guixiang Zhang, Yulong Yan, and Laiguo Chen. 2015. "Characteristics and Seasonal Variations of Carbonaceous Species in PM2.5 in Taiyuan, China" Atmosphere 6, no. 6: 850-862. https://doi.org/10.3390/atmos6060850
APA StyleHe, Q., Guo, W., Zhang, G., Yan, Y., & Chen, L. (2015). Characteristics and Seasonal Variations of Carbonaceous Species in PM2.5 in Taiyuan, China. Atmosphere, 6(6), 850-862. https://doi.org/10.3390/atmos6060850