Article

An Investigation of Atmospheric Mercury from Power Sector in Thailand

The Joint Graduate School of Energy and Environment, Centre of Excellence for Energy Technology and Environment, King Mongkut's University of Technology Thonburi, Bangkok 10140, Thailand
*
Author to whom correspondence should be addressed.
Atmosphere 2015, 6(4), 490-502; https://doi.org/10.3390/atmos6040490
Submission received: 6 January 2015 / Revised: 24 February 2015 / Accepted: 5 March 2015 / Published: 3 April 2015

Abstract

:
Mercury (Hg) is a highly toxic pollutant with a long range transport in the atmosphere resulting in both local and global concerns. Understanding of emissions is required to support an effective control strategy. In this study, atmospheric Hg emissions from power sector in Thailand in 2010 were investigated by using the bottom-up approach to improve the accuracy of the estimate by up to 50% in comparison to those provided in global inventories. The activity data of each individual source were collected and emissions factors were assessed based on local sources, well reflecting the emissions behavior of various emitters in Thailand. The atmospheric Hg emissions from power sector in 2010 amounted to 844.5 kg, in which emissions from coal and lignite power plants constituted up to 92.3% and biomass power plants constituted up to 7.4%. Spatial and temporal distribution analysis indicated high emissions in the Central and Northern regions, and from February to July. Annual trends in emissions from 2010 to 2030 were estimated and discussed.

1. Introduction

Since industrial evolution, mercury (abbreviation symbol “Hg”) has been widely-used in many industries as a metal (e.g., in extraction of gold and silver in thermometers, fluorescent lamps and dental amalgam fillings) or as a catalyst (e.g., batteries, caustic soda) [1]. It is emitted unintentionally through extraction/combustion of fossil fuels (e.g., coal), metals (e.g., copper, lead and gold), or intentionally through mines (e.g., Hg mining and primary production). Furthermore, Hg has been used as a key material or catalyst during industrial processes (e.g., caustic soda and battery production).
Anthropogenic atmospheric Hg emissions are released in three forms (elemental gaseous mercury Hg0, reactive gaseous mercury Hg2+ and particulate mercury HgP), each of which has a different atmospheric pathway from emissions to deposition. In particular, Hg0 (i.e., non-soluble with a 0.5–2-year atmospheric lifetime) is subject to long range transport while the others (i.e., more soluble and “sticky”, with hour to day atmospheric lifetimes) are subject to fast removal and deposition near emissionsources [2].
Once presented in ecosystems, Hg is persistent and bio-accumulated which results in adverse effects. According to a report from the United States Environment Protection Agency (US-EPA) [3], although it depends on several factors (e.g., chemical form of Hg, dose, age and health of exposed person, duration and route of exposure), some adverse effects of Hg in containing species include impaired neurological development of fetuses, infants and children due to accumulated levels of methyl mercury (CH3Hg) or respiratory failure and death from high exposure to Hg0. Several case studies of Hg adverse effects have been reported worldwide [4,5,6,7,8]. Since 1989, under the United States Clean Air Act Amendments 1990 [9], Hg was included in a list of 189 toxic air pollutants requiring emission reductions due to potentially significant effects on human health.
According to an estimate of the Arctic Monitoring and Assessment Program/United Nations Environment Program (AMAP/UNEP) [10] in 2010, Hg emissions from anthropogenic sources in Thailand amounted to 14,858 kg. Key sources included the refining of crude oil in oil refineries (44%), stationary combustion (21%), cement production (13%), waste and other losses due to breakage and disposal in landfills (9%), small scale gold mining (8%) and metal extraction (5%). Hg emissions from power sector in Thailand ranged from 1243 kg to 2827 kg, thereby accounting for more than 60% of those from stationary sources. This global estimation was made by using a top-down approach and not recruiting up-to-date country specific factors on Hg contained in fuel and control efficiency, leaving room for improvement in several aspects, i.e., magnitude and spatial distribution of emissions. International forums and technical reports on atmospheric Hg [11] had also emphasized that the development of detailed and country specific atmospheric Hg emissions is necessary, especially in developing and least developing countries where a dearth of systematic information has been reported.
The objective of this work was to develop a detailed characterized inventory of Hg emissions from the power sector by using the bottom-up approach. In addition, Hg annual emissions from the power sector were projected from 2010 to 2030 as presented.

2. Method and Materials

2.1. Approach

Hg emissions from power generation are due to trace quantities of naturally occurring Hg in fuels that were released during the combustion process. A main factor that influences emissions—Hg content—in fuels is varied by fuel type and region of fuel origin. It is generally high in low-quality coal (0.05–0.5 g/ton), followed by biomass as fuel (0.007–0.07 g/ton) and oil (0.001–0.1 g/ton) [12]. It is obvious that Hg content in fuels is within a wide range and the choice of Hg emissions factors (EFs) should be based on several source-specific considerations. Combustion technology (i.e., boiler configuration and air pollution control devices) affects Hg transformation in the boiler, while influencing Hg speciation and Hg reduction [13,14,15]. To account for all of the aforementioned factors, emissions from power sector were estimated by using Equation (1)
E i = k m A i , k E F i , k , m
where:
  • E i : Emissions of power plant i
  • A i , k : Fuel consumption of fuel type k for power plant i
  • E F i , k , m : Emissions factor of emissions control devices m, fuel type k, power plant i

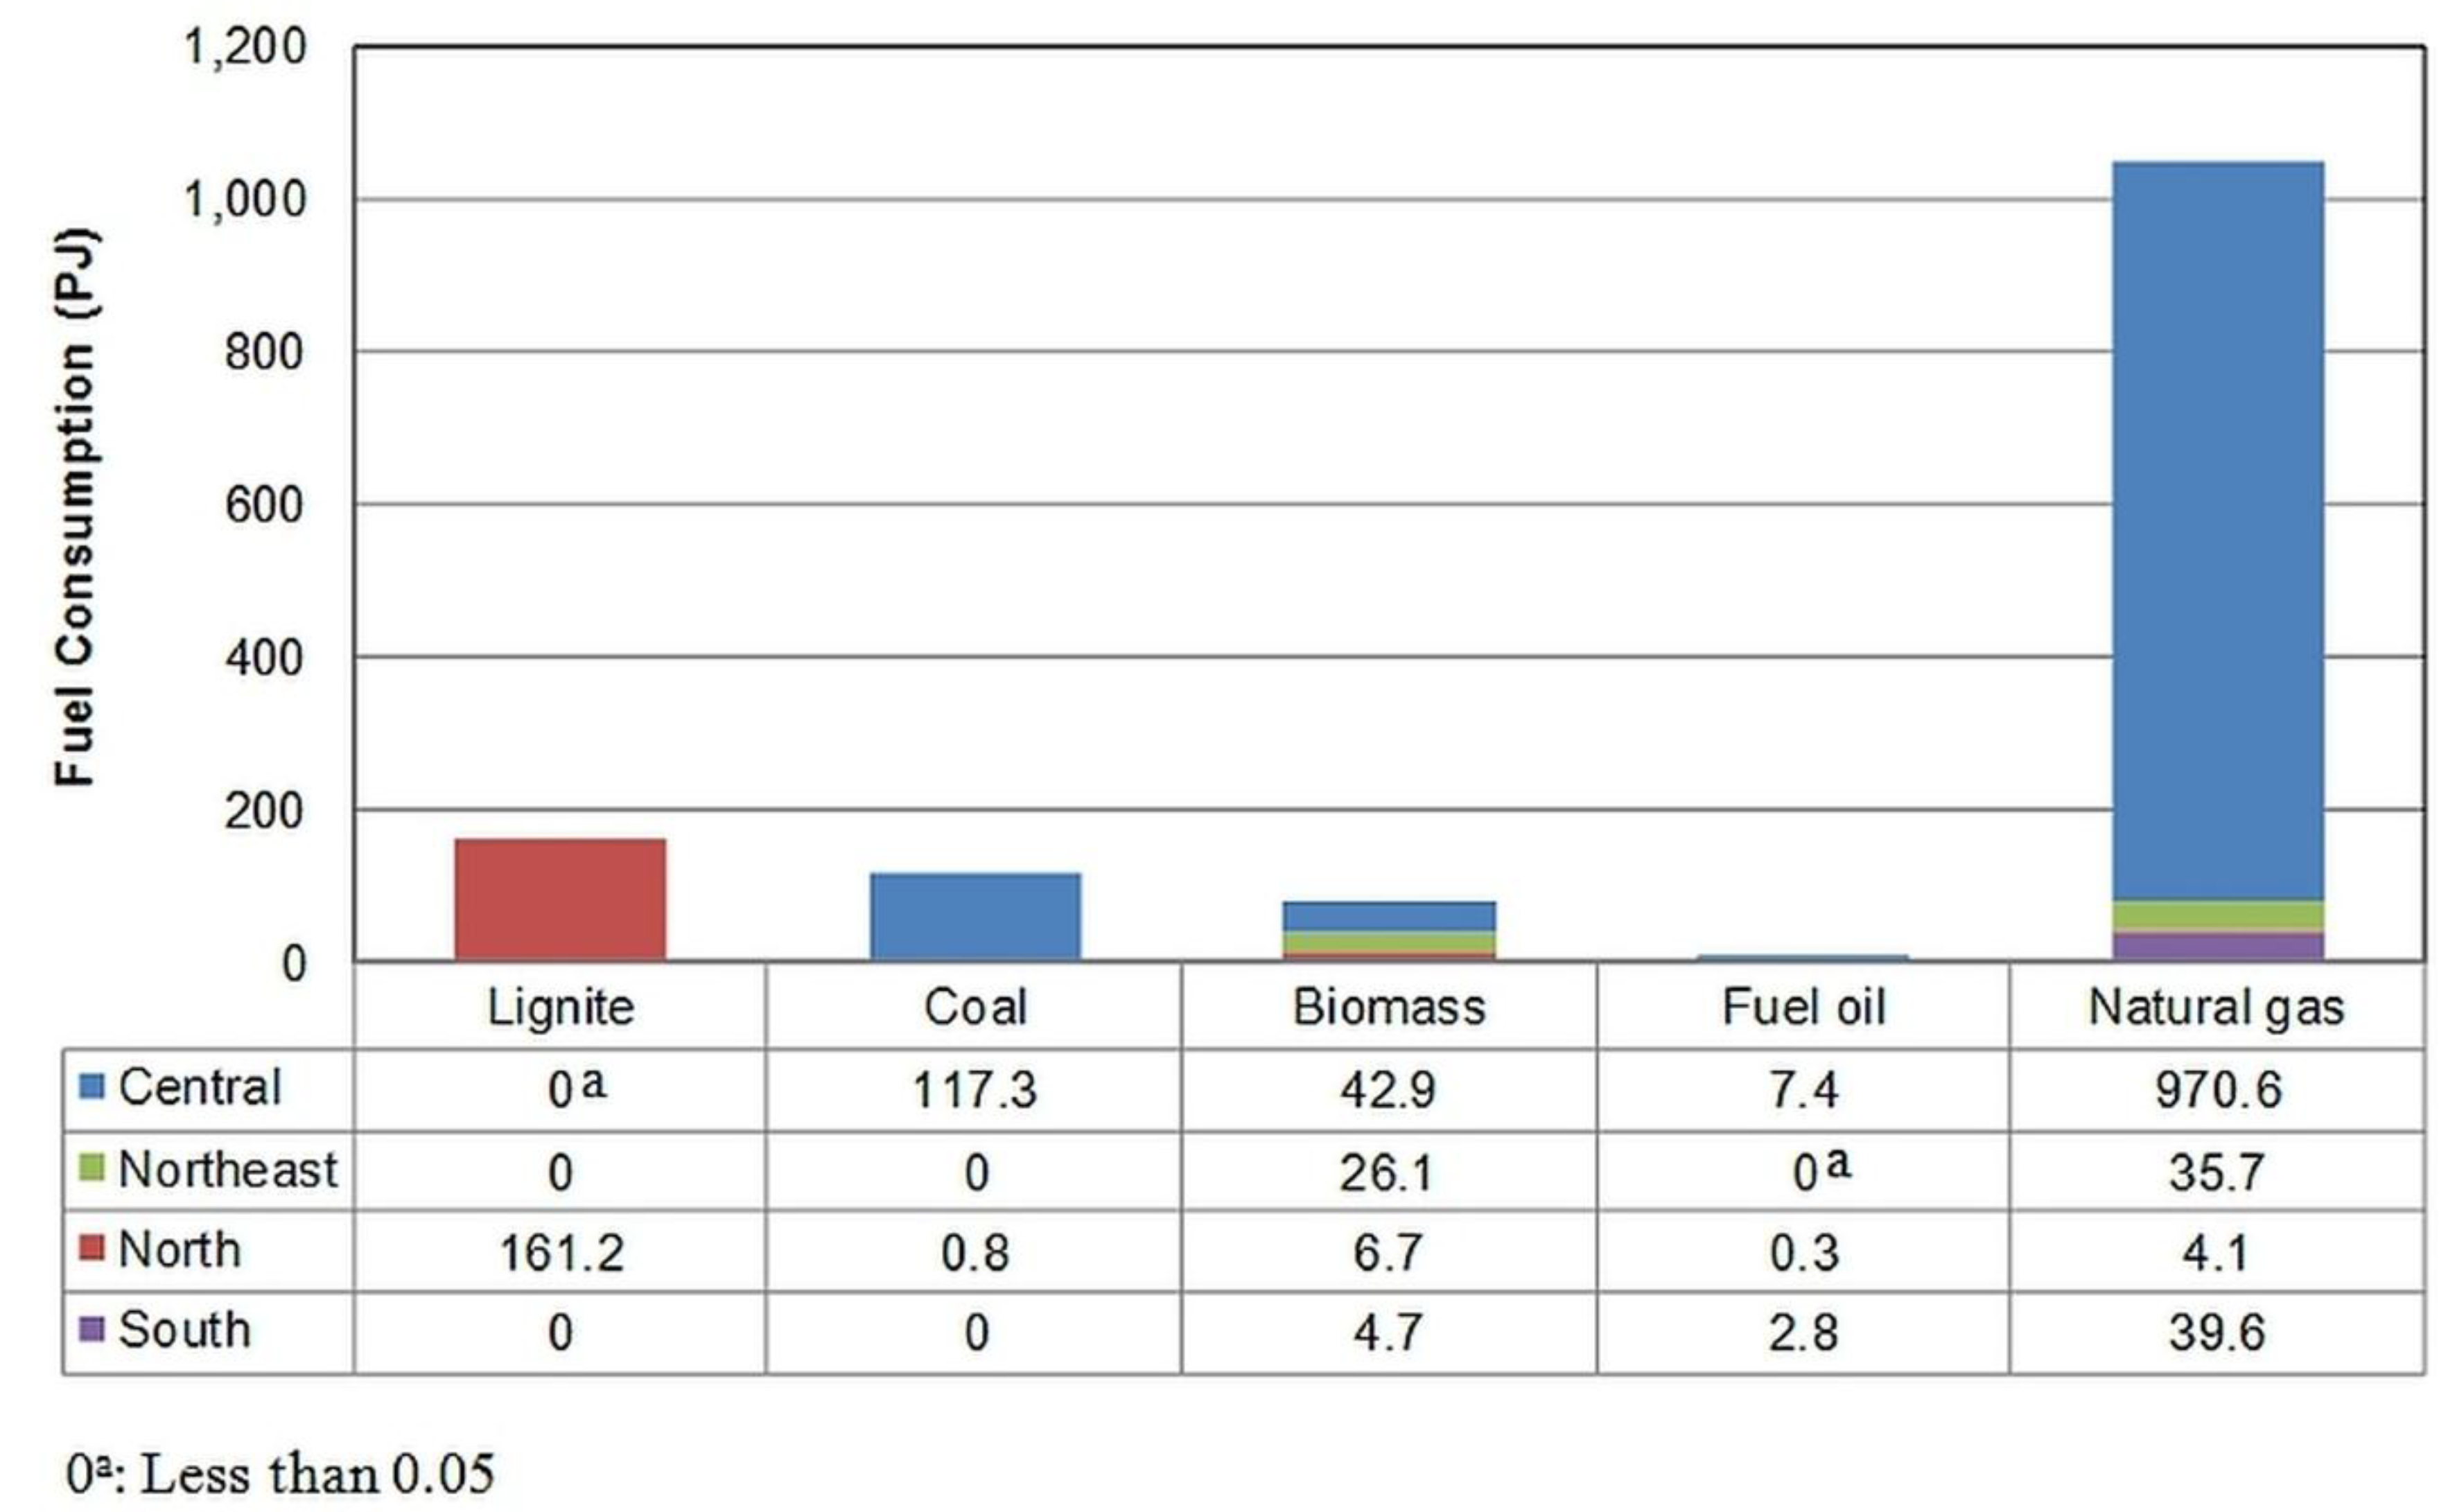
2.2. Characteristics of Atmospheric Hg Emissions from Power Sector in 2010

In this section, information on emitting processes, which determined the activity data and EFs chosen, is described. The activity data of fuel consumption in the power sector were obtained from technical reports as well as on-site surveys. The selected EFs were country-specific to realistically reflect emitting behaviors of various sources in Thailand (Table 1 [16,17,18]). Speciation split factors of Hg into Hg0, Hg2+ and HgP followed the suggestions of the literature review [11] in which the ratios of Hg0/Hg2+/HgP to the total Hg were 0.5/0.4/0.1, respectively, for combustion in power plants.
Table 1. Emissions Factors Used in Estimating Atmospheric Hg Emissions from the Power Sector in Thailand.
Fuel TypeCombustion Technology aHg Content b (g/ton)Air Pathway c (%)Control Efficiency (%)EFs d (g/ton)
LignitePulverized Coal-fired0.1299670.039
Stoker boiler0.1290400.065
AnthraciteCirculating Fluidized0.2790400.146
BituminousCirculating Fluidized0.0390400.016
Fuel oilNot specific0.0790100.058
BiomassStoker boiler0.00783100.005
a Combustion technology was obtained from Environmental Impact Assessment reports [16]; b Hg content was obtained from a local study [17]; c Air pathway was obtained from a case study in China [18]; d EFs = Hg Content ×   Air Pathway 100 × ( 1   Control Efficiency 100   ) .
The thermal power plants in Thailand contributing more than 90% of national electricity generation belong to the following four main power producers: Electricity Generating Authority of Thailand (EGAT), Independent Power Producers (IPP), Small Power Producers (SPP), and Very Small Power Producer (VSPP). The first two producers are responsible for supplying electricity to meet national demands and consist of large generating units (total installed capacity larger than 600 MW) using coal, fuel oil and natural gas as fuel. The latter two are generally considered small producers (total installed capacity smaller than 600 MW) generating electricity for personal use and partial sales to the national grid following the capacity and duration stated in purchasing contracts between the facilities with EGAT [19]. The small thermal generating units use various kinds of fuels ranging from coal and fuel oil to biomass (e.g., paddy husk, bagasse) [20].
Data collection (e.g., fuel consumption, boiler configuration, and emissions control devices) from the power sector is briefly summarized here. Annual fuel consumption was available for each EGAT and IPP plant [20] whereas this figure was only assessable by sector for each SPP and VSPP [19]. Other site-specific information and the geographic locations of each power plant are available upon request and were obtained from the EGAT and Energy Regulation Commission (ERC) databases [21]. The data on fuel consumption in thermal power plants in Thailand are presented in Figure 1.
Figure 1. Fuel Consumption in Power Plants in 2010 by Region. 0a: Less than 0.05.
Atmosphere 06 00490 g001
The fuels used in thermal power plants include lignite and coal (i.e., bituminous, anthracite), petroleum (i.e., fuel oil and diesel oil) as well as biomass. In Thailand, lignite was previously available in the following four mines: Mae Moh, Krabi, Li and Chaekhon mines. At present, however, lignite is extracted only from the Mae Moh mine. Thai lignite is considered to have low combustion quality with a net calorific value from 9.9 to 17.4 MJ/kg. On the other hand, bituminous and anthracite were imported from Australia, Indonesia and Vietnam [20]. According to fuel origins, Hg content in the Thai lignite used is 0.12 g/ton while that in imported bituminous and anthracite is 0.03 g/ton, and 0.28 g/ton, respectively [12].
Hg content in oil mines varies with geography. Hg content in crude oil in Thailand and the Asian region was 0.593 g/ton (results from a single sample) and 0.220 g/ton (results from four samples), respectively [22]. Those values, considered outliner high compared to general range of Hg content in crude oil in other regions (0.001 g/ton–0.1 g/ton) [12,22], are explainable due to secondary geological processes that enable Hg to transfer and redeposit into the petroleum reservoir [22]. According to a recent assessment of Hg release in Thailand’s ecosystem, Hg removal during the refining process in Thailand is estimated to be up to 80%–90%. Consequently, the Hg content in refined oil used in thermal power plants is about 0.070 g/ton [17]. For biomass fuel, the value of 0.007 g/ton Hg content for all kinds of biomass fuels [12] was used as suggested by local experts in the study of Hg in Thailand [17].
The design and size of the boilers installed in power plants influenced the bottom ash and fly ash composition (i.e., emission to air pathways). In this study, the percentage of emissions to air pathways for different boiler technologies was reviewed and chosen from literature most clearly reflecting the situation of Thailand. A case study from China [18] was chosen due to the similarity of boilers and technologies. As shown in Table 1, the lignite combustion using pulverized coal fired technology had relatively high efficiency (i.e., completeness) with 99% while that of stoker boilers was 90%. For this latter technology, the combustion of coal (i.e., lignite, bituminous, anthracite) had a higher efficiency (i.e., 90%) compared to that of fuel oil and biomass (i.e., 80%).
Thailand has imposed air emissions regulations in which atmospheric Hg emissions are detected by using the United States Environmental Protection Agency Method 29 (i.e., Determination of Metals Emissions from Stationary Sources) and are limited to 3 mg/m3 for non-combustion systems [23]. The emissions limits are higher than would be expected for Hg concentrations in the flue gas of the average coal-fired power plant equipped with no emission control apparatus [24]. To control other criteria involving atmospheric emissions, most of the power plants had air pollution control devices (APCDs) installed such as the Flue Gas Desulphurization (FGD) for sulfur dioxide (SO2) reduction, the Electrostatic Precipitator (ESP)/Fabric Filer (FF) for particulate matter less than 10 μm in aerodynamic diameter (PM10) reduction and the Selective Catalytic Reduction (SCR) for nitrogen oxide (NOX) reduction. The aforementioned control devices have additional or co-benefit for reducing Hg emissions [13,14,15].
The results from site survey indicated that coal fired power plants in Thailand with capacity larger than 600 MW using pulverized-coal-fired boilers are equipped with low NOX burners, ESP for PM10 control and FGD for SO2 reduction. On the other hand, the mixture of circulating-fluidized-bed boilers and pulverized-coal-fired boilers for medium to small power plants (i.e., installed capacity lesser than 600 MW), are equipped with low temperature combustion system for NOX reduction, bag filter and cyclone for controlling PM and limestone injection for SO2 reduction. Regarding removal efficiency, the value of 67% obtained from the measurement of a large lignite fired power plant [25] was used. For other coal fired power plants, taken into account their APCD and efficiency of gaseous and PM10, the average Hg emissions’ control efficiency of 40% was applied [12,15]. For biomass power plants, the stoker technology of the boilers was selected, since they were generally adapted from Chinese technology. The APCDs for PM10 in biomass power plants were the combination of multi cyclone and ESP or wet scrubbers with efficiency of up to 95%. The data on the Hg control efficiency from other fuels rather than coal was limited. Due to a shortage of reliable data, the Hg reduction efficiency of fuel oil and biomass power plants was estimated by the multiplication of a fraction of HgP/ total Hg (10%) and PM reduction (up to 95%–99%), resulting in 10% for both types of power plants. Table 1 summarizes the emissions factors used in this work.

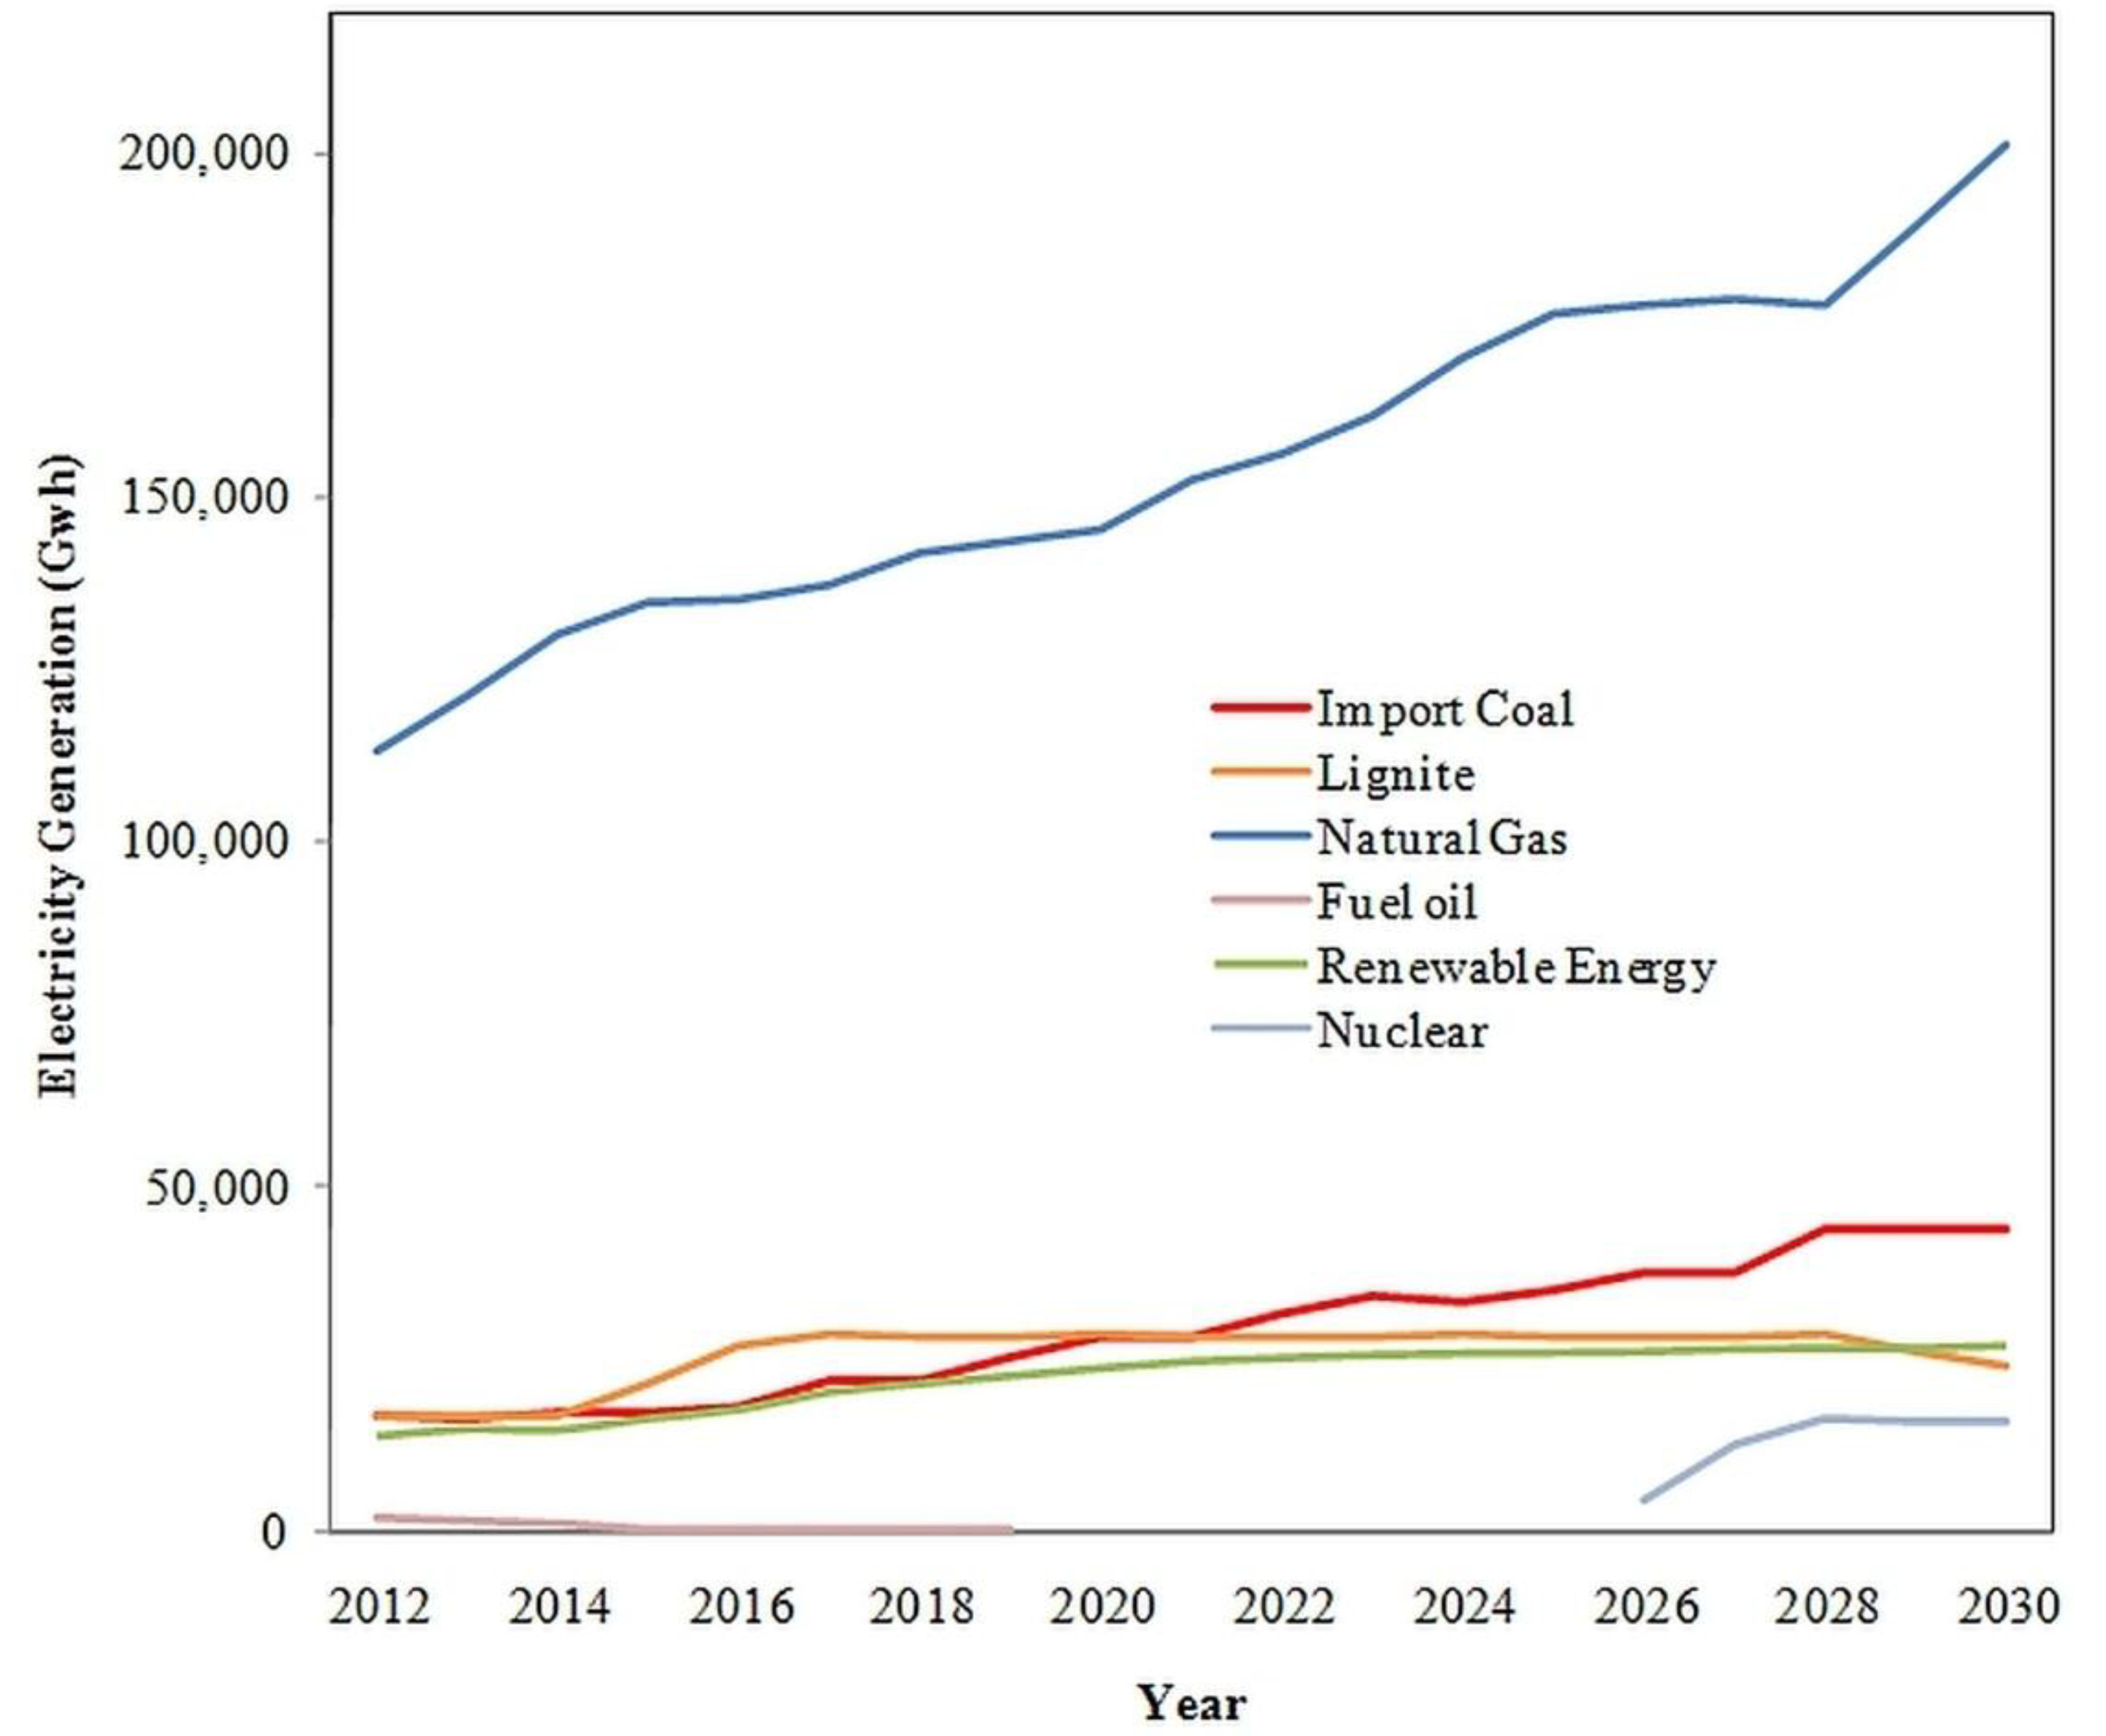
2.3. Projected Hg Emissions from Power Sector to 2030

The projection was based on the trends of fuel consumption for electricity generation reviewed from the 2010 National Power Development Plan for 2012–2030 [26]. By 2030, the use of coal, lignite, natural gas and renewable energy for electricity generation will increase to as high as 163.3%, 43.5%, 78.0%, and 92.7%, respectively (Figure 2). It should be noted that, according to the 2010 Power Development Plan, the use of fuel oil will end by 2019, and nuclear power plants will be introduced in 2026.
Figure 2. Projection of Electricity Generation by Fuel during 2012–2030.
Atmosphere 06 00490 g002

3. Results and Discussions

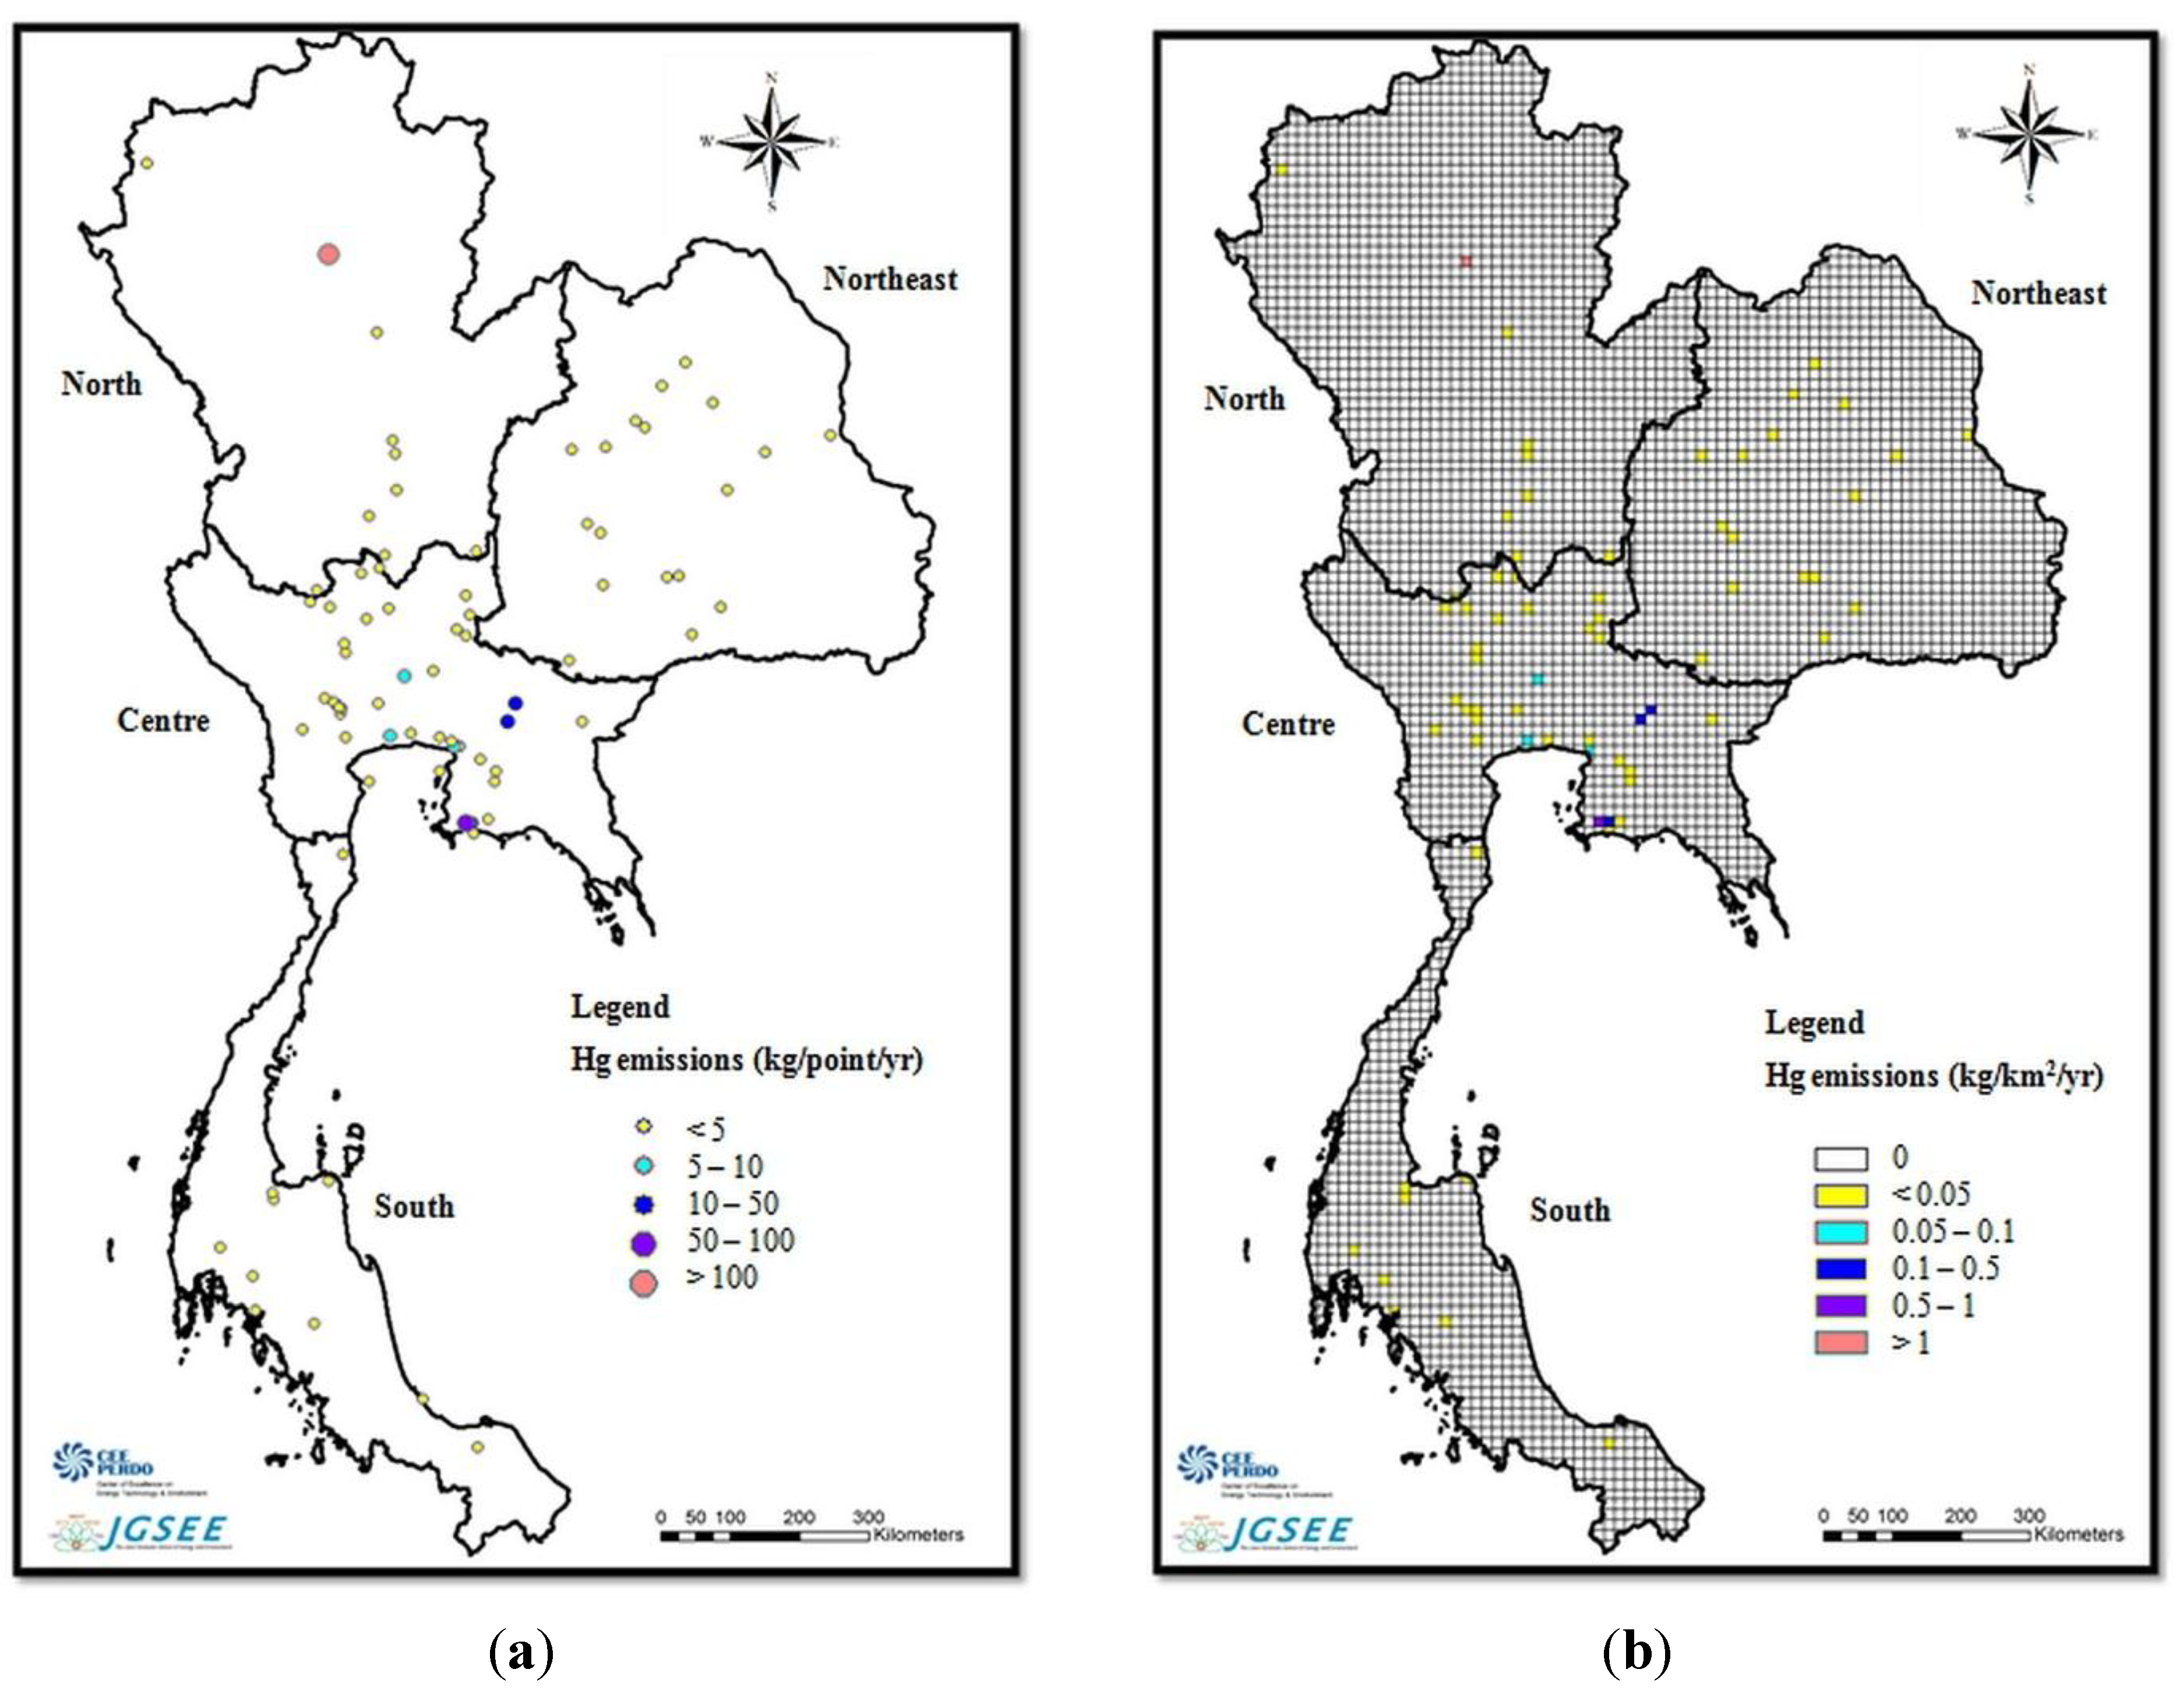
3.1. Atmospheric Hg Emissions from Thailand’s Power Sector in 2010

In 2010, the atmospheric Hg emissions from the power sector were 844.5 kg as calculated by using Equation (1) and the information stated in Section 2.2. Coal and lignite power plants emitted up to 92.3% and biomass power plants emitted 7.4% (Table 2). Using the fact that the population of Thailand in 2010 was 65.98 million [27] and electricity generation in 2010 was 159,518 Gwh [20], the emissions of atmospheric Hg in Thailand due to power generation amounted to 12.8 µg/capita or 5294 µg/Gwh. In terms of Hg speciation of the emissions, Hg0 was dominant, and Hg2+ fraction was significant, resulting in a possible risk zone of Hg deposition near sources.
In addition to the magnitude, information on the locations of sources is very important in presenting the origin of the sources. Exact coordinates (latitude/longitude) as well as the geographical terrain height of each single source are therefore highly required. However, this information is only available for large power plants in Thailand. The geographic coordinates of each power plant under EGAT and IPP were obtained from the database of the Energy Regulation Commission [21] and input into the Geographic Information System (GIS) map as points. For other power plants including SPP and VSPP, the exact locations were not obtained for all sources. In addition, the emissions of each single source under SPP and VSPP were relatively small to be considered as point. Therefore, the emissions were summed by using sub-district information and located as point at the sub-district center position. As of 2010, there were approximately 7000 sub-districts in Thailand with nationwide average areas ranging from 20 km2 to 100 km2.
Table 2. Hg Emissions from Thailand’s Power Sector in 2010.
RegionSectorFuel OilCoalLigniteBiomassTotal
CentralEGAT1.0---1.0
IPP-53.9--53.9
SPP & VSPP-101.80.329.1131.2
NorthernEGAT0.4-627.4-627.8
IPP-----
SPP & VSPP-2.2-6.68.8
NortheasternEGAT0a---0 a
IPP-----
SPP & VSPP---17.317.3
SouthernEGAT0.9---0.9
IPP-----
SPP & VSPP---3.63.6
Total2.3157.9627.756.6844.5
0a: Less than 0.05.
In addition to the geographic map of point sources, Hg emissions were then allocated to grids on the GIS maps. A resolution of 0.1 degree was chosen to reflect the spatial distribution of Hg emissions in Thailand and can be further used directly for regional scale air quality modeling to investigate Hg ambient air concentration and deposition in Thailand and the Southeast Asian (SEA) region. Moreover, a grid resolution of 0.1 degree is comparable with other up-to-date international databases of global and/or regional Hg emissions as well as criteria on gaseous and PM emissions. For example, the new emissions dataset in the 0.1 grid degree resolution of several species compiled by Hemispheric Transport of Air Pollution (HTAP) [28] and distributed to air quality modeling communities.
As shown in Figure 3, the spatial analysis indicated that the overall Hg emissions were dense in the Central region due to a high number of electricity generating activities from SPP and VSPP to serve the industrial activity in this region. Hg emissions were also highest in the Northern region due to the operations of lignite fired power plants there. High emissions in the upper part of Thailand partially helped to subsequently explain the high Hg ambient concentration (i.e., approximately 2 ng/m3) and deposition (20–50 g/km2/year) in the upper part of Thailand [29].
Figure 3. (a) A-Point-Sources-Map of Atmospheric Hg Emissions in Thailand; (b) A-0.1-Degree-Gridded-Map of Atmospheric Hg Emissions in Thailand.
Atmosphere 06 00490 g003
To assess the temporal distribution of Hg emissions, continuous measurements of emissions from stacks were required to provide exact information on emissions distribution. However, they were found to be either limited or inaccessible for the case of Thailand. Therefore, the authors sought available information as surrogates to allocate yearly emissions into finer temporal distribution. The method of using electricity production rates as surrogates for assessing the temporal distribution of emissions was reviewed [30] and chosen due to data availability. In this case, monthly, daily and hourly data on electricity production rates during 2010 were obtained for each plant and included in the analysis. The analysis of monthly electricity production implies that monthly Hg emissions varied from 7.6% to 8.7% of annual emissions (i.e., 844.5 kg). In particular, emissions were relatively high in the first half of the year (i.e., February to July with a peak in May) which is mainly due to the higher demand of electricity for the use of air conditioning in residential sector as well as the use of cooling systems in industrial production activities. To confirm the aforementioned, monthly variations of ambient air temperatures and electricity production in Thailand were analyzed and a similar trend of variation was found (Figure 4). The situation may be different and opposite in other countries located in tempered and cold zones of the globe where households require more energy consumption to run heaters during cold months (i.e., low temperature periods).
The results from the analysis of daily and hourly electricity production trends imply that higher emissions were found during weekdays (i.e., Monday to Saturday), working periods (8 am–4 pm) and at night (7 pm–10 pm). In detail, daily emissions accounted for 3.3%–3.7% of corresponding monthly emissions while hourly emissions accounted for 3.5%–4.7% of corresponding daily emissions. Higher emissions were due to higher electricity consumption to meet residential demands (e.g., to operate buildings and production processes during working periods and households at night).
Figure 4. Monthly Variations of Hg Emissions from Power Plants versus Monthly Mean Ambient Temperature in Thailand.
Atmosphere 06 00490 g004

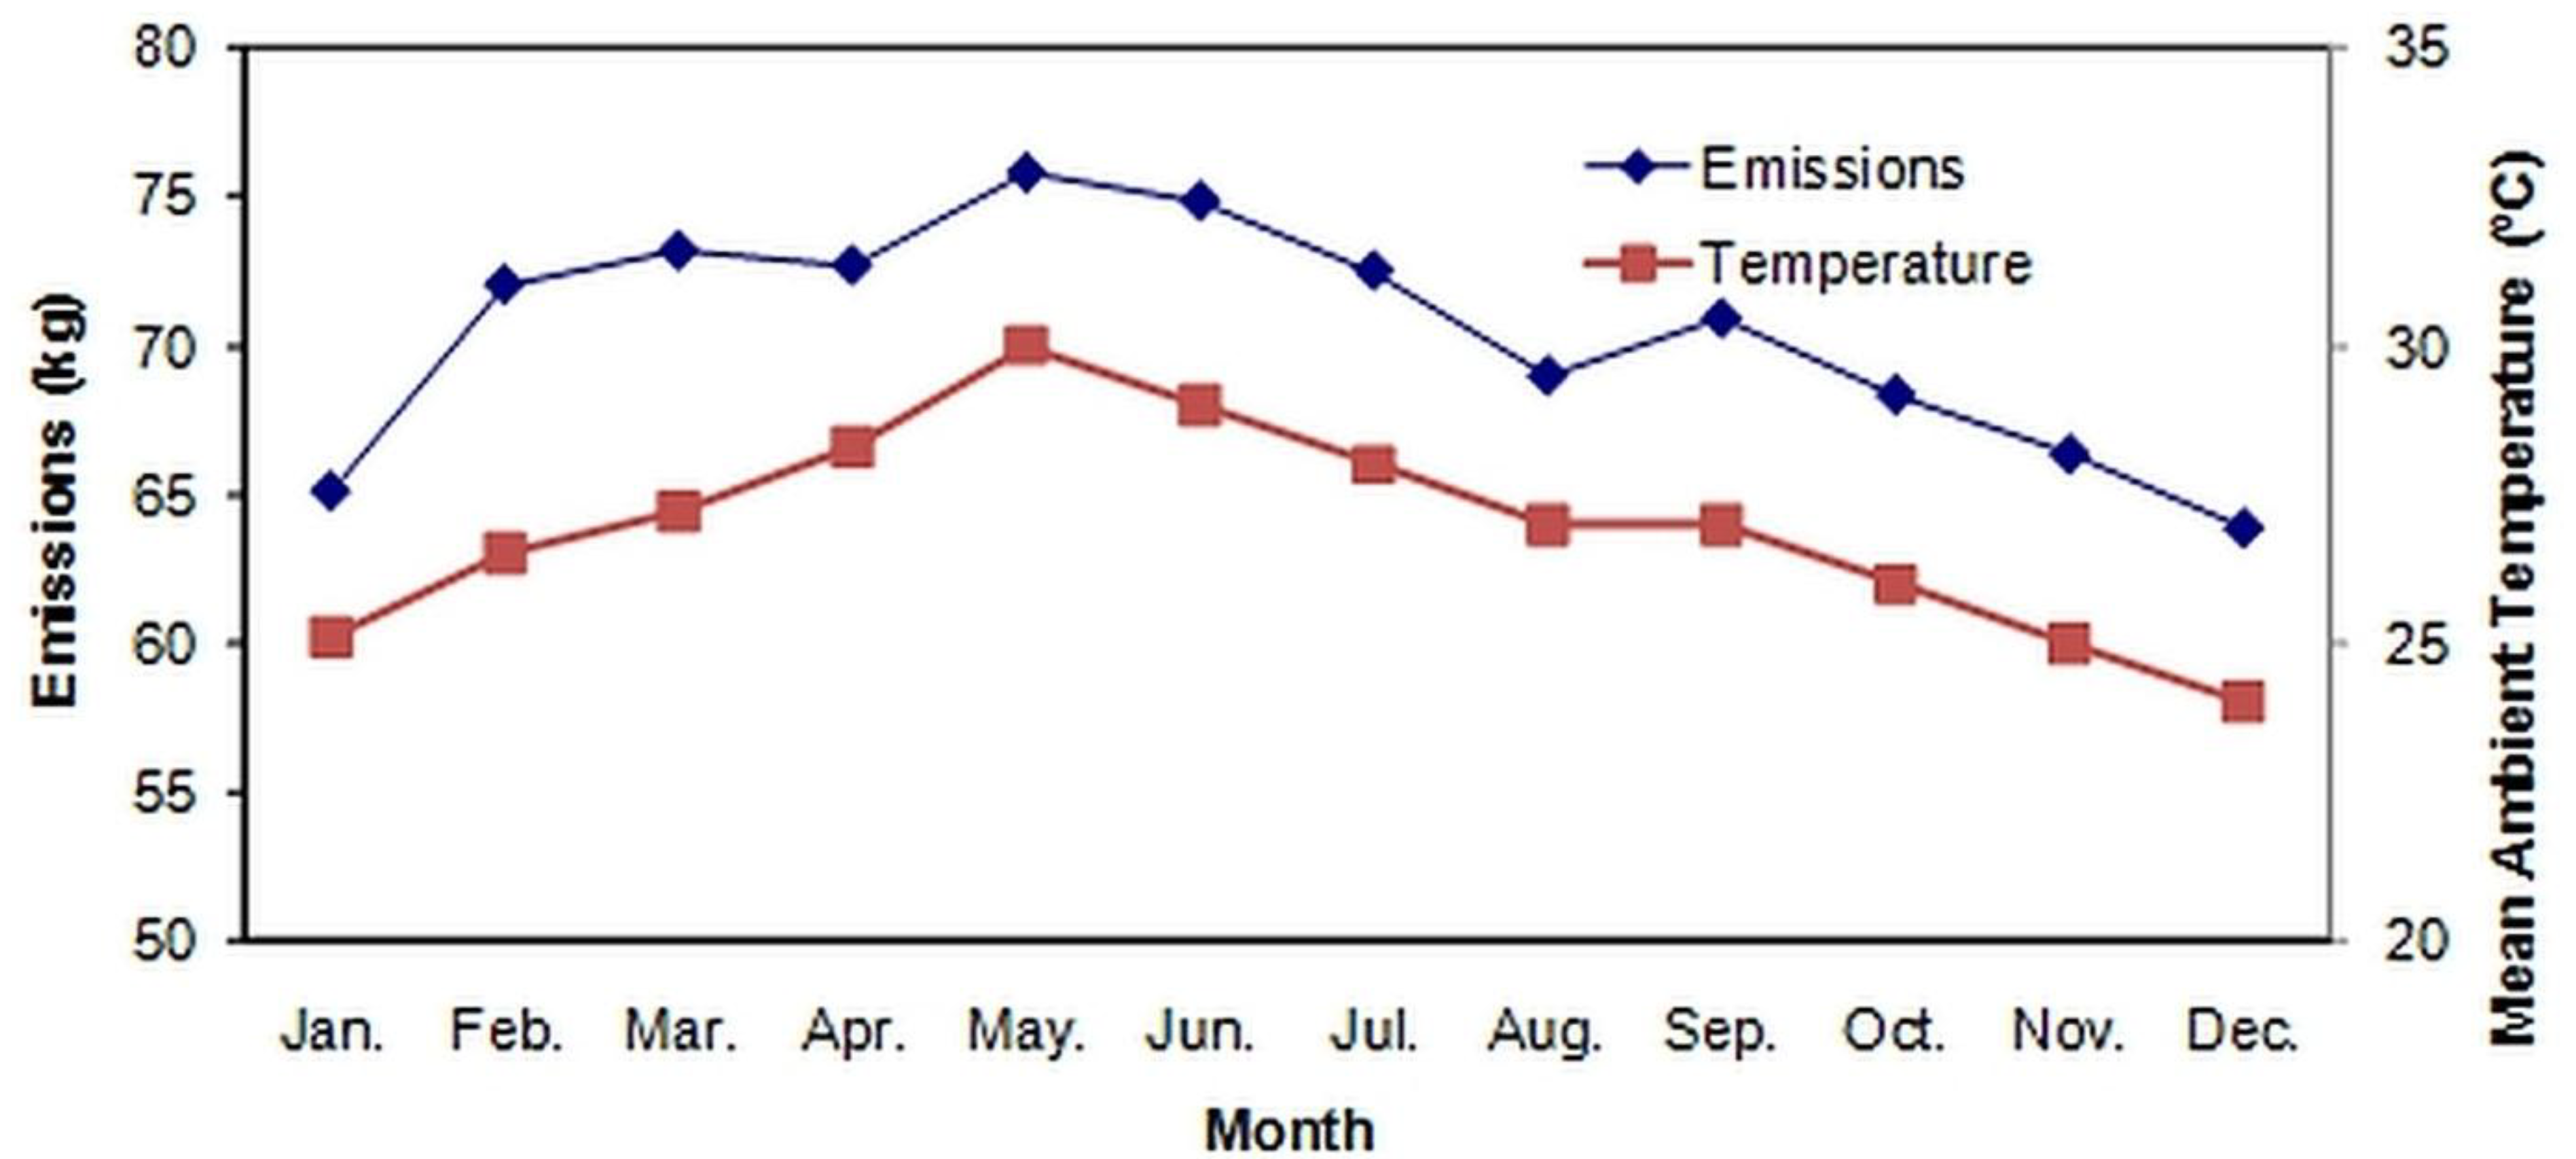
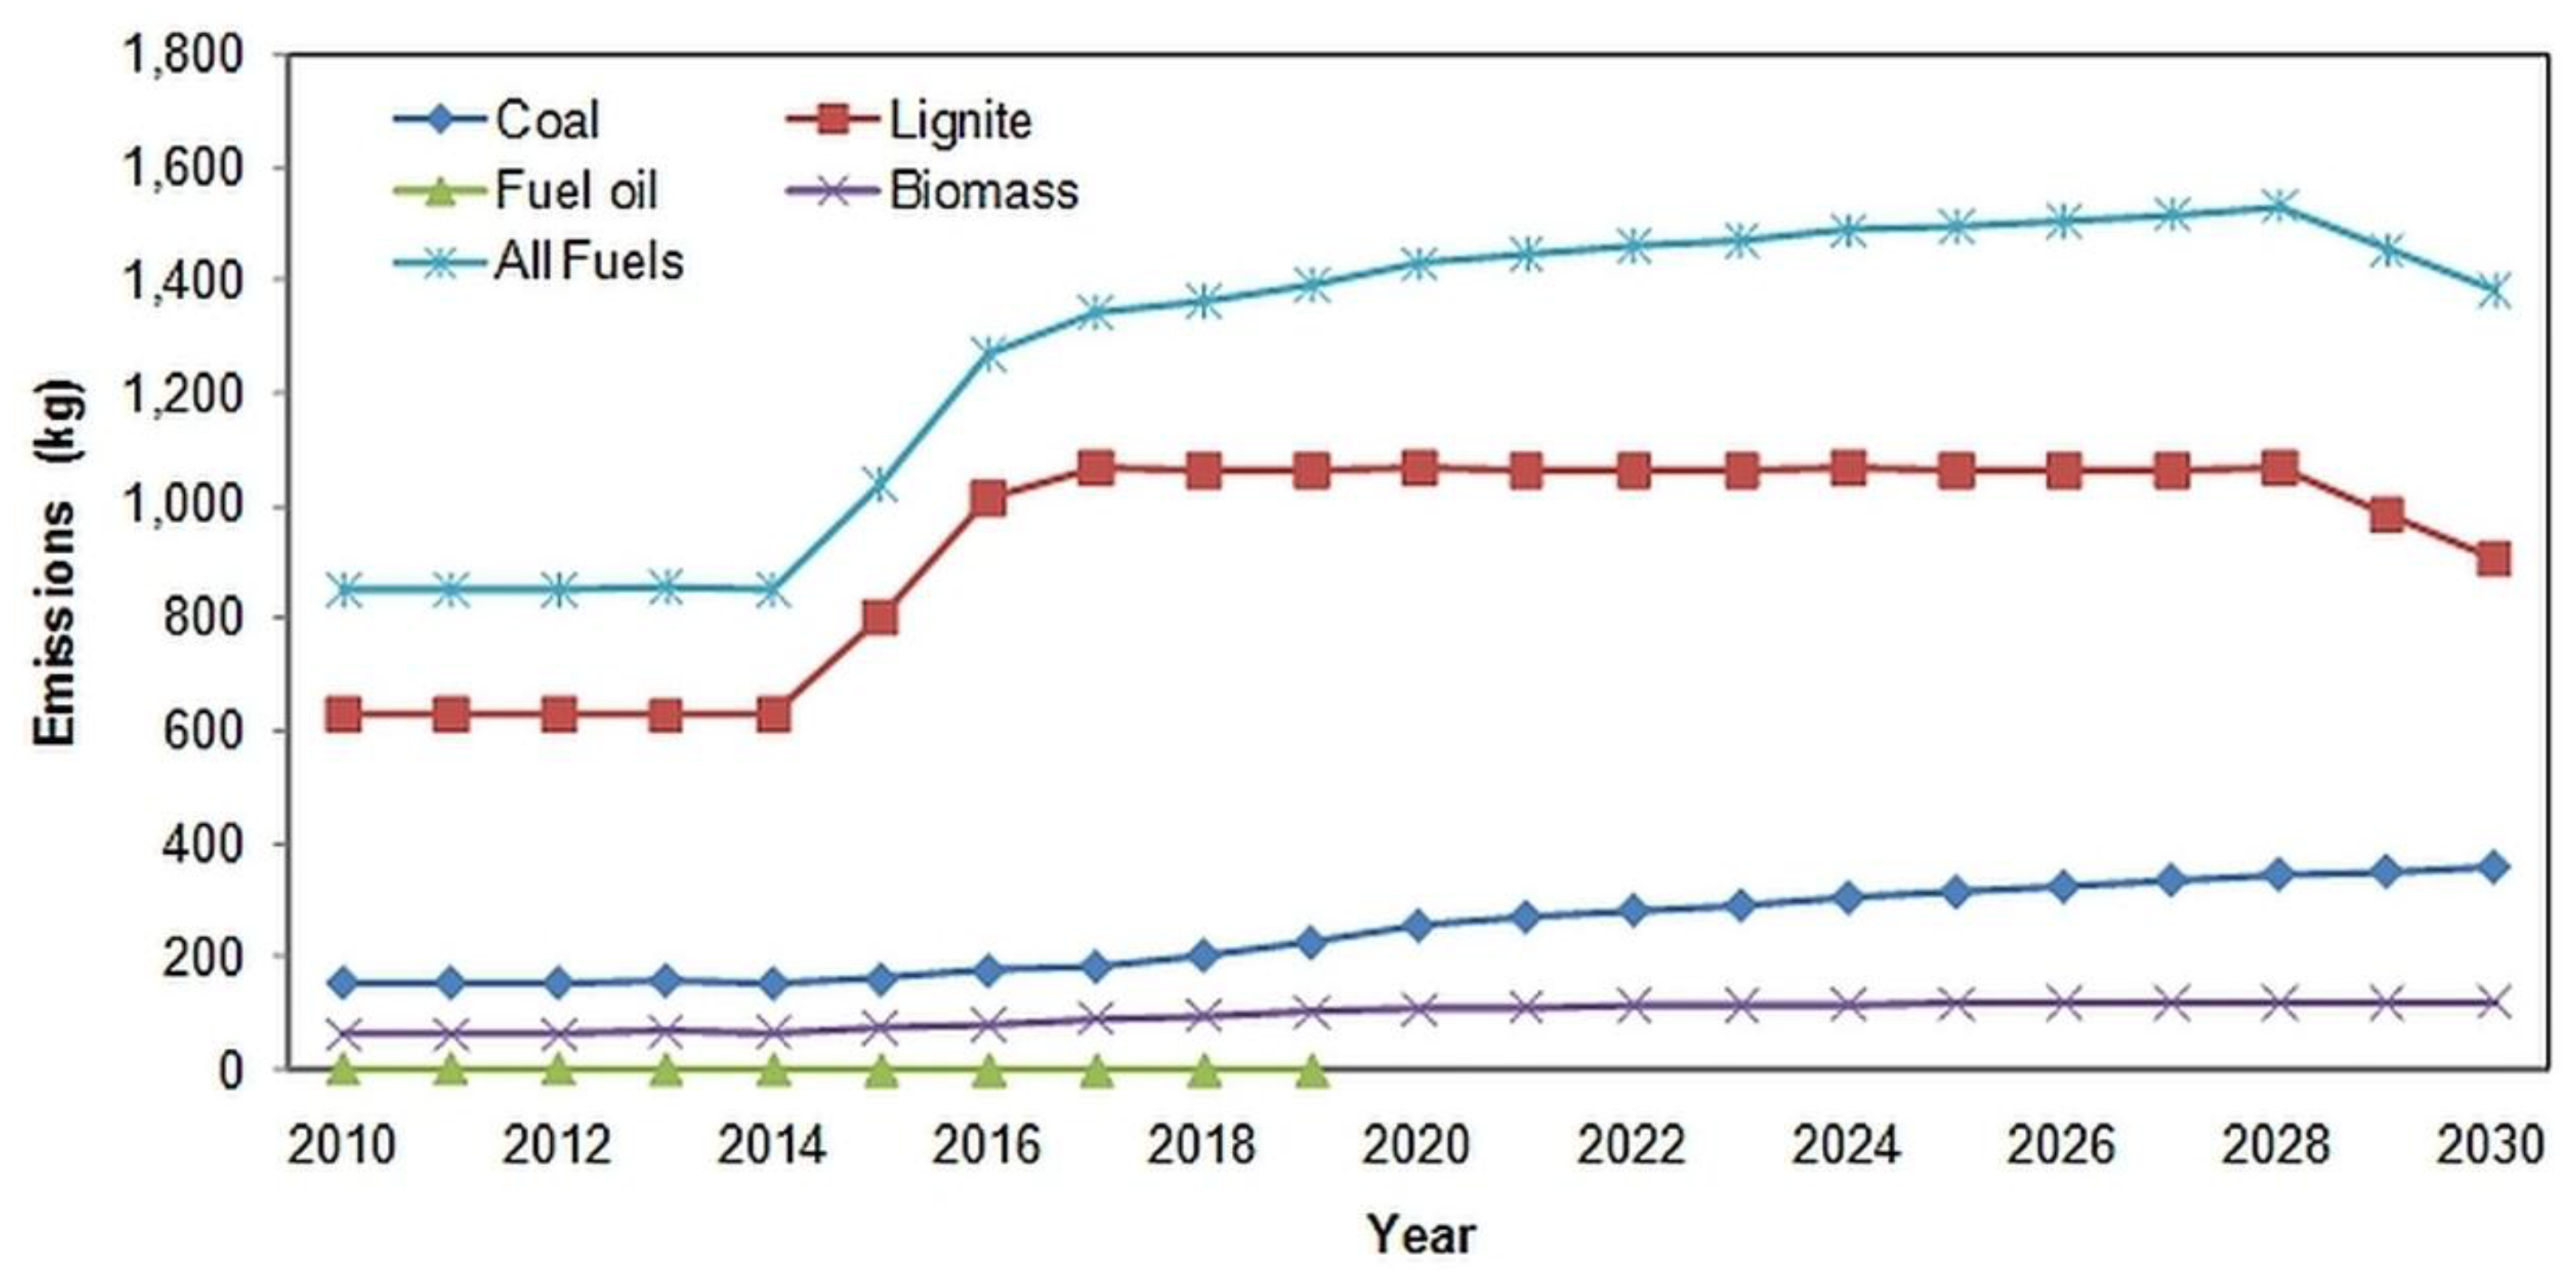
3.2. Projection of Hg Emissions in Thailand to 2030

The emissions projection from 2010 to 2030 is shown in Figure 5. The total Hg emissions from power generation to the national grid follow the variation of lignite consumption. Furthermore, the emissions in 2030 will increase by up to 62.6% as compared to the emissions in 2010.
Figure 5. Hg Emission Trends from Power Generation to National Grid during 2010–2030.
Atmosphere 06 00490 g005

3.3. Comparisons of Results of This Study and Literature

Customarily, an inventory has uncertainties due to the EFs and emissions reduction technology and its efficiency. The emissions from the combustion of thermal power plants in this study are estimated using national and local data, and thus provide to some extent better details and more representative comparatively to global and regional estimates. In addition, the Hg emissions inventory developed in this study was among one of the first local efforts for a national-scale Hg emissions inventory in Thailand. To roughly evaluate the quality of the developed inventory, the magnitude of Hg emissions from this study has been compared to other studies. The global estimate of Hg emissions from the power sector in Thailand for 2010 ranged from 1243 kg to 2827 kg [10]. The emissions estimate obtained in this study (i.e., 844.5 kg) is in the lower range of the values stated in the literature. This may be explained by the fact that the actual control technology set in Thailand was of higher efficiency than assumed in the top-down global or regional emissions inventory.

4. Conclusions

This study constitutes the first national bottom-up inventory of Hg emissions from the power sector in Thailand. The estimated atmospheric Hg emissions from the power sector in 2010 and 2030 were 844.5 kg and 1383.4 kg, respectively. Hg emissions from lignite were dominant in current and projected years. Regarding the emitted species, Hg0 was the most dominant, suggesting a high potential for long-range transport to other regions. The temporal analysis indicated that emissions in 2010 were high from February to July with a peak in May. The obtained GIS map showed emissions distribution over Thailand with a relatively high emissions density in the Central and Northern regions as expected since most of the electricity generating activities are located in these areas.
An inter-comparison with the results from other studies indicated the emissions estimate obtained in this study to be in the lower range of the values stated in the literature. This finding underlines the importance of using the bottom-up approach and country-specific information in developing an emissions inventory. These results can be used for the formulation of Hg emissions control strategy by identifying the priority zone of emissions. Furthermore, the gridded emissions inventory of this study can be directly input into atmospheric or air quality models that would investigate and assess the fate and pathway of the Hg emissions from the power sector in Thailand.

Acknowledgments

The authors would like to thank all of the organizations mentioned in the paper for their kindness in providing and sharing data during the course of the study. In particular, the authors would like to express their special thanks to Suthisa Sanguantrakool (DEDE), Kanjana Suaysom (PCD) and Pattanan Tarin (PCD) for data assistance and for expert comments. Contributions to fruitful suggestions and discussions during the execution of this work from Narisara Thongboonchoo (KMITL), Vanisa Surapipith (PCD) and Sebastien Bonnet (JGSEE) are also greatly appreciated. This study was financially supported by the Joint Graduate School of Energy and Environment (JGSEE), Center of Excellence in Energy Technology and Environment (CEE-PERDO).

Author Contributions

All the authors contributed to the research of this study, and to the elaboration of this manuscript. Pham Thi Bich Thao performed the data collection and analysis, and prepared the first draft of this paper. Agapol Junpen provided scientific insight on atmospheric mercury emissions from power sector in Thailand. Savitri Garivait supervised the overall research work, provided guidelines for the write up of the manuscript, and contributed to its editing and finalization.

Conflicts of Interest

The authors declare no conflict of interest.

References

  1. United Nations Environment Program. Global Mercury Assessment; United Nations Environment Program, 2002; p. 270. Available online: http://www.unep.org/gc/gc22/Document/UNEP-GC22-INF3.pdf (accessed on 2 November 2012).
  2. Pirrone, N.; Cinnirella, S.; Feng, X.; Finkelman, R.B.; Friedli, H.R.; Leaner, J.; Mason, R.; Mukherjee, A.B.; Stracher, G.; Streets, D.G.; et al. Global mercury emissions to the atmosphere from natural and anthropogenic sources. Atmos. Chem. Phys. 2010, 10, 4719–4752. [Google Scholar] [CrossRef]
  3. United States Environmental Protection Agency. Mercury Study Report to Congress Volume V: Health Effects of Mercury and Mercury Compounds; United States Environmental Protection Agency, 1997. Available online: http://www.epa.gov/ttn/caaa/t3/reports/volume5.pdf (accessed on 2 August 2010).
  4. Ui, J. (Ed.) Minamata disease. Industrial Pollution in Japan; The United Nations University Press: Tokyo, Japan, 1992; p. 777. Available online: http://archive.unu.edu/unupress/unupbooks/uu35ie/uu35ie00.htm#Contents (accessed on 2 August 2010).
  5. Sullivan, T.M.; Bowerman, B.; Adams, J.; Milian, L.; Lipfert, F.; Subramaniam, S.; Blake, R. Local Impact of Mercury Emissions from Coal Fired Power Plants; Brookhaven National Laboratory: United States, 2005; p. 19. Available online: http://www.bnl.gov/isd/documents/31077.pdf (accessed on 2 August 2014).
  6. Umbangtalad, S.; Parkpian, P.; Visvanathan, C.; Delaune, R.; Jugsujinda, A. Assessment of Hg contamination and exposure to miners and schoolchildren at a small-scale gold mining and recovery operation in Thailand. J. Environ. Sci. Health 2007, 42, 2071–2079. [Google Scholar] [CrossRef]
  7. Hani, A. Spatial distribution and risk assessment of As, Hg, Co and Cr in Kaveh industrial city, using geostatistic and GIS. World Academy of Science, Eng. Technol. 2010, 71, 8–13. [Google Scholar]
  8. Pollution Control Department. Mercury Assessment in Thailand; Ministry of Natural Resources and Environment, Thailand, 2001; p. 28. Available online: http://www.chem.unep.ch/mercury/2001-gov-sub/sub53gov.pdf (accessed on 17 July 2012).
  9. United States Environmental Protection Agency. Overview - the Clean Air Act Amendments of 1990; United States Environmental Protection Agency: United States, 1989. Available online: http://epa.gov/oar/caa/caaa_overview.html#titleVII (accessed on 17 June 2010).
  10. Arctic Monitoring and Assessment Program/United Nations Environment Program. Technical Background Report for the Global Mercury Assessment 2013; Arctic Monitoring and Assessment Program: Oslo, Norway/UNEP Chemicals Branch, Geneva, Switzerland, 2013; p. 263. http://www.amap.no/documents/doc/technical-background-report-for-the-global-mercury-assessment-2013/848 (accessed on 17 June 2014).
  11. Arctic Monitoring and Assessment Program/United Nations Environment Program. Technical Background Report to the Global Atmospheric Mercury Assessment; Arctic Monitoring and Assessment Program: Oslo, Norway/UNEP Chemicals Branch, Geneva, 2008; p. 159. Available online: http://www.unep.org/chemicalsandwaste/Portals/9/Mercury/Documents/Publications/Technical_background_report.pdf (accessed on 14 June 2011).
  12. United Nations Environment Program. Toolkit for Identification and Quantification of Mercury Release_ version 1.1; United Nations Environment Program, 2011; p. 312. Available online: http://www.unep.org/chemicalsandwaste/Portals/9/Mercury/Documents/Publications/Toolkit/Hg%20Toolkit-Reference-Report-rev-Jan11.pdf (accessed on 22 April 2013).
  13. Lee, S.J.; Seo, Y.-C.; Jurng, J.; Hong, J.-H.; Park, J.-W.; Hyun, J.E.; Lee, T.G. Mercury emissions from selected stationary combustion sources in Korea. Sci. Total Environ. 2004, 325, 155–161. [Google Scholar]
  14. Park, K.S.; Seo, Y.-C.; Lee, S.J.; Lee, J.H. Emission and speciation of mercury from various combustion sources. Powder Technol. 2008, 180, 151–156. [Google Scholar] [CrossRef]
  15. Pavlish, J.H.; Hamre, L.L.; Zhuang, Y. Mercury control technologies for coal combustion and gasification systems. Fuel 2010, 89, 838–847. [Google Scholar] [CrossRef]
  16. Office of Natural Resources and Environmental Policy and Planning. Environmental Impact Assessment database (in Thai). Available online: http://www.onep.go.th/ (accessed on 24 September 2011).
  17. Pollution Control Department. Development of Approach and Measures to Efficiently and Appropriately Manage Mercury in Thailand-Final Report; Ministry of Natural Resources and Environment: Bangkok, Thailand, 2013; p. 512. (in Thai) [Google Scholar]
  18. Streets, D.G.; Hao, J.; Wu, Y.; Jiang, J.; Chan, M.; Tian, H.; Feng, X. Anthropogenic mercury emissions in China. Atmos. Environ. 2005, 39, 7789–7806. [Google Scholar] [CrossRef]
  19. Energy Policy and Planning Office. IPP, SPP and VSPP in Thailand. Ministry of Energy: Thailand, 2013. Available online: http://www.eppo.go.th/power/data/ (accessed on 14 April 2014).
  20. Department of Alternative Energy Development and Efficiency. Electric Power in Thailand; Ministry of Energy: Thailand, 2011; p. 61. Available online: http://www4.dede.go.th/article_attach/ELECTRIC%20POWER%20IN%20THAILAND%202010.pdf (accessed on 14 April 2012).
  21. Energy Regulation Commissions. List of power plants in Thailand (in Thai). Available online: http://www.erc.or.th/ERCWeb2/EN/Default.aspx (accessed on 14 January 2012).
  22. Integrating Knowledge to Inform Mercury Policy. Mercury Arising from Oil and Gas Production in the United Kingdom and UK Continental Shelf; Natural Environment Research Council: United Kingdom, 2012; p. 42. Available online: http://www.mercurynetwork.org.uk/wp-content/uploads/2009/09/IKIMP-Oil-and-Gas-2012-Final-Report.pdf (accessed on 11 August 2012).
  23. Pollution Control Department. Thailand State of Pollution Report 2010; Ministry of Natural Resource and Environment: Thailand, 2012; p. 244. Available online: http://www.pcd.go.th/count/mgtdl.cfm?FileName=Report_Eng2553.pdf&BookName=ThailandStatePollutionReport2010 (accessed on 14 June 2013).
  24. Sloss, L. Mercury Emissions from India and South East Asia. International Energy Agency Clean Coal Centre, 2012; p. 42. Available online: http://www.unep.org/chemicalsandwaste/Portals/9/Mercury/Documents/coal/Lesley%20Sloss-Mercury%20Emissions%20from%20India%20and%20South%20East%20Asia.pdf (accessed on 14 April 2012).
  25. Pollution Control Department. The Study of Mercury and Metals Emission from Industrial Combustion Process-Final Report; Ministry of Natural Resource and Environment: Bangkok, Thailand, 2010; p. 250. (in Thai) [Google Scholar]
  26. Energy Policy and Planning Office. Summary of Thailand Power Development Plan 2012–2030 (Revision 3); Ministry of Energy: Thailand, 2012; p. 32. Available online: http://www.erc.or.th/ERCWeb2/Upload/Document/PDP2010-Rev3-Cab19Jun2012-E.pdf (accessed on 04 April 2014).
  27. National Statistics Office of Thailand. The 2010 Population and Housing Census; Ministry of Information and Communication Technology: Thailand, 2012; p. 235. Available online: http://popcensus.nso.go.th/upload/census-report-6–4-54-en.pdf (accessed on 28 June 2012).
  28. Hemisphere Transport Air Pollution. HTAP v2. Available online: http://edgar.jrc.ec.europa.eu/htap_v2/index.php?SECURE=123 (accessed on 23 November 2013).
  29. Holmes, C.D.; Jacob, D.J.; Corbitt, E.S.; Mao, J.; Yang, X.; Talbot, R.; Slemr, F. Global atmospheric model for mercury including oxidation by bromine atoms. Atmos. Chem. Phys. 2010, 10, 12037–12057. [Google Scholar] [CrossRef]
  30. Pham, T.B.T.; Manomaiphiboon, K.; Vongmahadlek, C. Development of an inventory and temporal allocation profiles of emissions from power plants and industrial facilities in Thailand. Sci. Total Environ. 2008, 397, 103–118. [Google Scholar] [CrossRef] [PubMed]

