Article

Summertime Spatial Variations in Atmospheric Particulate Matter and Its Chemical Components in Different Functional Areas of Xiamen, China

1
Key Lab of Global Change and Marine-Atmospheric Chemistry of State Oceanic Administration, Third Institute of Oceanography, State Oceanic Administration, Xiamen 361005, China
2
Institute of Urban Environment, Chinese Academy of Sciences, Xiamen 361021, China
3
College of Ocean and Earth Sciences and State Key Laboratory of Marine Environmental Science, Xiamen University, Xiamen 361005, China
4
Department of Mechanical and Manufacturing Engineering, University of Calgary, Calgary, AB T2N 1N4, Canada
*
Authors to whom correspondence should be addressed.
Atmosphere 2015, 6(3), 234-254; https://doi.org/10.3390/atmos6030234
Submission received: 14 October 2014 / Revised: 6 February 2015 / Accepted: 13 February 2015 / Published: 27 February 2015
(This article belongs to the Special Issue Air Quality and Climate)

Abstract

:
Due to the highly heterogeneous and dynamic nature of urban areas in Chinese cities, air pollution exhibits well-defined spatial variations. Rapid urbanization in China has heightened the importance of understanding and characterizing atmospheric particulate matter (PM) concentrations and their spatiotemporal variations. To investigate the small-scale spatial variations in PM in Xiamen, total suspended particulate (TSP), PM10, PM5 and PM2.5 measurements were collected between August and September in 2012. Their average mass concentrations were 102.50 μg∙m−3, 82.79 μg∙m−3, 55.67 μg∙m−3 and 43.70 μg∙m−3, respectively. Organic carbon (OC) and elemental carbon (EC) in PM2.5 were measured using thermal optical transmission. Based on the PM concentrations for all size categories, the following order for the different functional areas studied was identified: hospital > park > commercial area > residential area > industrial area. OC contributed approximately 5%–23% to the PM2.5 mass, whereas EC accounted for 0.8%–6.95%. Secondary organic carbon constituted most of the carbonaceous particles found in the park, commercial, industrial and residential areas, with the exception of hospitals. The high PM and EC concentrations in hospitals were primarily caused by vehicle emissions. Thus, the results suggest that long-term plans should be to limit the number of vehicles entering hospital campuses, construct large-capacity underground parking structures, and choose hospital locations far from major roads.

1. Introduction

Atmospheric particulate matter (PM) is composed of tiny solid particles or liquid droplets that are suspended in the atmosphere. Ambient PM can originate from natural or anthropogenic sources. In urban areas, the ambient PM is primarily of anthropogenic origin and typically comprises a mixture of acids, heavy metals, black carbon, organic chemicals, and soil or dust particles [1]. This pollution can adversely affect the atmospheric environment, human health, and even the global climate. Studies have found that particles can reduce visibility via scattering and absorption, resulting in regional haze pollution events [2,3], which have adverse effects on public health. Epidemiological studies have found that ambient concentrations of PM are associated with various health effects. Both short-term and long-term exposures to airborne PM can result in various respiratory and cardiovascular diseases and even lung cancer. These findings are especially related to fine PM (PM10, i.e., PM with an aerodynamic diameter less than 10 μm, and PM2.5, PM with an aerodynamic diameter less than 2.5 μm) [4,5]. Multi-city studies conducted in Europe (29 cities) and in the United States (20 cities) have reported short-term mortality effects for PM10 of 0.62% and 0.46% per 10 μg∙m−3 (24-h mean), respectively [6,7,8]. Raaschou-Nielsen et al. [9] found that smaller PM2.5 is particularly deadly, identifying a 36% increase in lung cancer per 10 μg∙m−3 increase because these fine particles can penetrate deeper into human lungs.
Environmental protection agencies in many countries have enacted air quality standards to reduce the effects of PM on the environment, human health, and climate. China issued the Ambient Air Quality Standard in 1996 to control air pollution. However, due to the rapid urbanization, population growth and increased vehicle usage, China has experienced serious atmospheric environment problems, particularly PM pollution. Recently, haze resulting from PM pollution has been a particularly acute problem in China [10,11]. Thus, the original ambient air quality standard was revised in 2011 according to the World Health Organization (WHO) air quality guidelines. The standard II (GB 3095-2012) set new limits on PM10 and PM2.5 concentrations. This regulation limits the 24-h (short-term) and annual (long-term) mean PM10 concentrations to 150 μg∙m−3 and 70 μg∙m−3, respectively, while the PM2.5 concentrations are limited to 75 μg∙m−3 and 35 μg∙m−3, respectively. Most major cities in China have established state-controlled automatic ambient air quality monitoring stations to monitor air pollution and publish daily urban air quality reports. However, the PM levels observed at one monitoring station are not representative of the entire city [12], especially in Asian countries. Studies have found that the actual exposure levels in Asian countries are much higher than suggested by the measurements collected at monitoring stations due to the special characteristics of Asian residential communities [13,14]. In Asian countries, people have different living styles from those in western countries. For example, people prefer easy access to daily activities. Therefore, residential communities are typically located near the traffic arteries, restaurants, shops, and hospitals. Hence, people spend more time near the PM sources, resulting in a high variability in pollutant levels within an urban area. Taking China as an example, because its urban areas are typically compact, each functional area is not large, although they do have dense populations. Due to the highly density of anthropogenic activities, such as widespread traffic, cooking, and other emission sources, e.g., restaurants and temples, air quality is highly variable between different functional areas. Thus, to more accurately estimate PM exposure, identify potential sources, and effectively protect public health by proposing targeted control strategies, the fine-scale spatial variations in PM pollution must be better understood.
In this study, small-scale spatial variations in PM concentrations were observed in Xiamen between August and September in 2012. Xiamen is one of the cleanest coastal cities in China. However, due to rapid urbanization, the air quality of Xiamen has gradually deteriorated. Research data has shown that hazy days increased by approximately six-fold from 2003 to 2008 [15]. Most of the studies in Xiamen have focused on long-term PM pollution in one or two specific locations [16,17,18,19,20]; no studies have addressed small-scale spatial variations of short-term PM exposure across the different functional urban areas. Thus, the objective of this study is to assess the short-term PM levels, characterize the chemical components of PM2.5, and identify the potential sources and spatial variations of PM between different functional areas in Xiamen. The results will provide a scientific foundation for assessing exposure levels and knowledge-based urban planning to protect public health.

2. Materials and Methods

2.1. Site Description

Xiamen, which is a coastal city located in southeastern China, is a modern international portal city for tourism and is one of the earliest participants in China’s opening-up policy as a special economic zone (Figure 1). Xiamen comprises Xiamen Island, Gulangyu Island, and part of the rugged mainland coastal region from the left bank of the Jiulong River in the west to the islands of Xiang’an in the northeast. Lying in the temperate and subtropical zone, Xiamen has a subtropical oceanic monsoon climate that is indicative of a mild climate, abundant rainfall, and long summers which typically last from May to October. The annual mean temperature is approximately 21 °C, the annual precipitation is approximately 1200 mm, and the prevailing wind is from the northeast. The city’s urban area includes the old urban island area and covers all six districts of Xiamen (i.e., Huli, Siming, Jimei, Tong’an, Haicang and recently Xiang’an), with a total urban population of 1,861,289. Xiamen Island is divided into two parts, the Siming and Huli districts. The Siming and Huli districts form the special economic zone. Although the area of Xiamen Island is only 7.5% of the total area of Xiamen City, it has an urban population that exceeds 884,100, and accounts for approximately 47.7% of the total population. Thus, our study focused on the urban area on Xiamen Island.
In this work, PM samples were collected from the ambient atmosphere of five different functional areas in Xiamen Island. The five different functional areas included parks, hospitals, commercial areas, industrial areas and residential areas, which are very relevant to our daily lives. To capture sufficient variability, 16 sites were selected from the Xiamen Island urban area in China. For each functional area, three or four monitoring sites were selected to collect aerosol samples to study PM characteristics. These sampling sites were selected according to their land-use types. All of the sampling sites are shown in Figure 1, and the specific latitude and longitude for each site are listed in Table 1.
Figure 1. Map of Xiamen City and sampling sites (Parks: Zhongshan Park (ZSP), Bailuzhou Park (BLZP), Zhonglun Park (ZLP), and Huli Park (HLP); Hospitals: First Affiliated Hospital of Xiamen University (FAH), Zhongshan Hospital of Xiamen University (ZSH), and Xiamen Hospital of Traditional Chinese Medicine (TCMH); Commercial areas: Zhongshan Road commercial area (ZSRC), Ruijing commercial area (RJC), and Mingfa commercial area (MFC); Industrial areas: Kaiyuan industrial area (KYI), Huli industrial area (HLI), and Heshan industrial area (HSI); and Residential areas: Xiaxi residential area (XXR), Qianpunan residential area (QPR), and Jinshang residential area (JSR)).
Atmosphere 06 00234 g001
Table 1. Description of the sampling sites and meteorological conditions.
Sampling SitesLocationsSampling DatesMeteorological Parameters
W.S. (m∙s−1)T (°C)R.H. (%)P (hPa)
ParksZSP24°27ʹ40.82ʺN 118°05ʹ04.17ʺE8–70.332.066.4995.6
BLZP24°28ʹ50ʺN 118°05ʹ35ʺE8–140.431.068.31002.7
ZLP24°29ʹ05ʺN 118°08ʹ35ʺE8–200.328.483.41001.8
HLP24°30ʹ24.65ʺN 118°06ʹ05.74ʺE8–300.229.577.51017.1
HospitalsFAH24°27ʹ16ʺN 118°05ʹ00ʺE8–80.131.667.1994.3
ZSH24°28ʹ27.34ʺN 118°05ʹ34.71"E8–130.330.273.01003.0
TCMH24°30ʹ11.39ʺN 118°08ʹ09.36ʺE8–290.60.50.028.9
Commercial areasZSRC24°27ʹ24ʺN 118°04ʹ40ʺE8–100.631.071.81000.6
RJC24°28ʹ40.78ʺN 118°09ʹ16.85ʺE8–210.231.664.31013.6
MFC24°28ʹ55ʺN 118°07ʹ2.8ʺE9–40.631.862.61023.0
Industrial areasKYI24°28ʹ50ʺN 118°10ʹ17ʺE8–220.831.959.81012.8
HLI24°30ʹ54ʺN 118°05ʹ39ʺE8–280.730.668.91014.2
HSI24°30ʹ53ʺN 118°08ʹ55ʺE9–60.930.867.21021.4
Residential areasXXR24°27ʹ33ʺN 118°04ʹ30ʺE9–50.631.862.61023.0
QPR24°28ʹ8.4ʺN 118°10ʹ43ʺE9–110.230.372.81018.3
JSR24°29ʹ44.45ʺN 118°08ʹ45.66ʺE9–120.530.372.51015.5
Notes: Parks: ZSP = Zhongshan Park, BLZP = Bailuzhou Park, ZLP = Zhonglun Park, and HLP = Huli Park; Hospitals: FAH = First Affiliated Hospital of Xiamen University, ZSH = Zhongshan Hospital of Xiamen University, and TCMH = Xiamen Hospital of Traditional Chinese Medicine; Commercial areas: ZSRC = Zhongshan Road commercial area, RJC = Ruijing commercial area, and MFC = Mingfa commercial area; Industrial areas: KYI = Kaiyuan industrial area, HLI = Huli industrial area, and HIS = Heshan industrial area; Residential areas: Xiaxi residential area (XXR), QPR = Qianpunan residential area, and JSR = Jinshang residential area.

2.2. Sample Collection

A total of 61 PM samples, including 15 TSP, 15 PM10, 15 PM5, and 16 PM2.5 samples, were collected from August to September in 2012 (the PM sample collected from Zhonglun Park was only a PM2.5 sample). The collection sites were selected not only according to their functional characteristics but also based on certain practical limitations for locating the sampling device (i.e., the topography of the ground and the availability of electrical power outlets). The sampling locations were 3 m to 12 m above ground level, where most human activities occur. In this study, PM samples were collected on quartz fiber filters (90-mm diameter, Whatman®) at a flow rate of 100 L/min for 24 h using mid-volume samplers (TH1500, Wuhan Tianhong Instrument Co., Ltd, Wuhan, China). To remove residual carbon, the quartz filters were pre-combusted at 600 °C for 4 h in a furnace before sampling. After sampling, the filters were removed from the filter holder and wrapped with baked aluminum foil, sealed within polyethylene plastic bags, and stored at 4 °C before analysis. When loading or unloading the filters, the operator wore plastic gloves to minimize contamination. No samples were collected during rain events.
An automatic weather station (Kestrel 4500, USA) was co-located with the sampler. The weather station recorded daily and hourly measurements of air temperature, wind speed and direction, air pressure, and relative humidity with measurement resolutions (including uncertainties) of 0.1 °C (±1 °C), 0.1 m/s (±3%), 1° (±5°), 0.1 hPa (±1.5 hPa), and 0.1% R.H. (±3%), respectively. The observed meteorological parameters are summarized in Table 1. Figure 2 presents the wind direction and wind speed frequencies during the sampling period. Meteorological data, such as precipitation and visibility, were obtained from the weather website Weather Underground [21]. The Air Pollution Index (API), which is a parameter used to describe air quality, was downloaded from the Ministry of Environmental Protection of the People’s Republic of China. The daily variations in these parameters during the sampling period are shown in Figure 3.
Figure 2. Wind direction and wind speed frequencies during the sampling period.
Atmosphere 06 00234 g002
Figure 3. Daily variations in visibility, API and precipitation during the sampling period in Xiamen.
Atmosphere 06 00234 g003

2.3. Sample Analyses

Quartz fiber filters were weighed with a Sartorius microbalance before and after sampling to obtain the masses of the atmospheric particulate matter. Before weighing, all filters were equilibrated for 24 h under a controlled temperature and relative humidity conditions (25 °C and 50%) in an electronic humidity chamber. The PM mass concentrations were calculated by dividing the mass by the sampling volume.

2.4. OC and EC Analysis

To determine the OC and EC concentrations in the PM2.5 samples, a 1.6-cm2 patch of filter was cut from each PM2.5 sample and analyzed with an automated semi-continuous thermal-optical transmittance (TOT) carbon analyzer (Sunset Laboratory, Model-4, USA). The TOT method follows the National Institute for Occupational Safety and Health (NIOSH) protocol [22]. The following provides a brief description of the method. First, the small piece of the filter is gradually heated in a pure helium (He) gas environment to 850 °C, at which point most organic carbon is thought to be converted into carbon dioxide (CO2), whereas small organic compounds are charred into EC. The CO2 is then swept out of the oven by He gas and detected by a self-contained non-dispersive infrared (NDIR) system. Then, after the sample oven has cooled to 550 °C, the sample is step-heated to 870 °C in an oxidizing environment of 2% oxygen-containing helium (2% O2, 98% He). At this stage, EC is oxidized into CO2 and detected by the NDIR. Finally, a standard methane gas is injected for reference. The split between OC and EC is corrected when the laser transmittance returns to the initial value. The precision of the instrument is ± 5%, and the detection limit is 0.1 μg∙cm−2.

2.5. Analysis of Water-Soluble Inorganic Ions

Another 1.6-cm2 patch of filter was cut from each PM2.5 sample to analyze the water-soluble inorganic ions. To sufficiently extract the water-soluble ions from the filters, each filter was extracted by 10 mL aliquots of ultra-deionized water for 30 min using an ultrasonic water bath device. The extracts were filtered through 0.45-μm micro-porous filters and stored in 2 mL sample vials. Subsequently, three major anions (Cl, NO3 and SO42−) of the PM2.5 samples were analyzed using a Dionex Ion Chromatograph (ICS3000, Dionex, USA). The chromatography conditions for anions were as follows: IonpacAS23 Analytical column: 4 × 250 mm, anion self-regretting suppressor ASRS 300: 4 mm, Auto suppression recycle mode, eluent: 4.5 mmol/L Na2CO3 and 0.8 mmol/L NaHCO3 flow rate: 1.0mL/min, and volume of injected sample: 20 μL.

3. Results and Discussion

3.1. Mass Concentrations of Atmospheric Particles

Within each functional area, three or four locations were selected to sample the ambient aerosols to study their PM characteristics. To provide a general description of the PM levels, the TSP, PM10, PM5 and PM2.5 mass concentrations are listed in Table 2. The PM10/TSP and PM2.5/PM10 ratios are also listed in Table 2. The TSP concentrations in Xiamen were found to range from 63.51 μg∙m−3 to 142.02 μg∙m−3, with a mean of 102.50 ± 23.14 μg∙m−3. The PM10 concentrations varied from 51.41 μg∙m−3 to 116.95 μg∙m−3, with a mean of 82.79 ± 20.79 μg∙m−3. The PM2.5 concentrations ranged from 22.49 to 70.38 μg∙m−3, with a mean of 43.70 ± 15.23 μg∙m−3. The mean PM10/TSP ratio was approximately 0.806, which indicates that most of the TSP particles were inhalable particles smaller than 10 μm. The average PM2.5/PM10 ratio was 0.528, which is higher than that stipulated by the Chinese Ambient Air Quality Standards (GB 3095-2012; in the new standard II, PM2.5 should account for no more than 50% of the ambient PM10), especially near the hospitals and parks, which were near parking lots. These observations suggest that PM2.5 in Xiamen may come from traffic vehicles. Xiamen is among the top 10 cleanest cities in China. All of the PM10 and PM2.5 mass concentrations were below the 24-hr mass-based standards of 150 μg∙m−3 and 75 μg∙m−3 set by the Chinese Ambient Air Quality Standards (GB 3095-2012, the new standard II). However, the concentrations exceeded the 24-hr mass-based standards of 50 μg∙m−3 (PM10) and 25 μg∙m−3 (PM2.5) set by the World Health Organization’s Healthy Ambient Air quality standards. The higher ambient average concentrations of small particulates (PM10 and PM2.5) suggest that inhalable particles, which have been linked to comparatively higher rates of premature mortality in many epidemiological studies, were the primary pollutants affecting human health during the study period in Xiamen.
Table 2. Mass concentrations measured from the PM samples collected at different functional areas in Xiamen.
Sampling SitesMass Concentrations (μg·m−3)Ratios (%)
TSPPM10PM5PM2.5PM10/TSPPM2.5/PM10
ParksZSP123.16106.9885.5066.0886.8661.77
BLZP79.0160.7940.4527.6476.9445.48
ZLP---52.05--
HLP119.19100.7076.1247.8784.4947.54
Means107.1289.4967.3648.4182.7651.60
HospitalsFAH142.02116.9591.6470.3882.3560.18
ZSH90.1472.1350.1634.6080.0247.97
TCMH120.48109.6186.4168.8390.9862.80
Means117.5599.5676.0757.9484.4556.98
Commercial areasZSRC126.7296.6169.1746.8476.2448.48
RJC91.3170.4749.9334.3077.1748.68
MFC101.1284.4360.3741.7883.4949.48
Means106.3883.8459.8240.9778.9748.88
Industrial areasKYI-66.5748.4933.83-50.82
HLI63.5151.4135.8222.4980.9543.74
HSI97.5277.6553.0831.6679.6240.77
Means80.5265.2145.8029.3380.2945.11
Residential areasXXR106.2684.1960.4239.2079.2346.56
QPR65.7051.7336.9827.1078.7352.39
JSR108.9091.6069.6054.5084.1159.50
Means93.6275.8455.6740.2780.6952.82
Means102.5082.7960.9443.7081.5151.07
SDs23.1420.7918.2215.234.166.84
The average PM mass concentrations for the five functional areas exhibited the following order: hospitals > parks > commercial areas > residential areas > industrial areas. Among the 16 sites, the lowest observed PM levels in Xiamen were found in the Huli industrial area, whereas the highest PM values were observed at the First Affiliated Hospital of Xiamen University (FAH). At FAH, PM2.5 accounted for approximately 60% of the PM10, which nearly reached 75 μg∙m−3. The PM2.5 concentrations in Zhongshan Park, Xiamen Hospital of Traditional Chinese Medicine (TCMH) and Jinshang residential area were also higher than in the other areas. According to the study by the authors [23], emissions from traffic vehicles are an important source of PM2.5. The selected sampling sites were as far from the pollution sources as possible as to ensure that the sites were representative of the corresponding functional areas. However, traffic vehicles cannot be avoided in urban areas, especially near hospitals, parks, and commercial and residential areas, which are closely related to people’s daily lives. Thus, one reason for the higher PM pollution in these areas is the emissions. There are no heavy industries on Xiamen Island. The existing light industries, such as the optoelectronics and software industries, emit small amounts of PM into the atmosphere. Meanwhile, these industrial areas are relatively large with relatively few vehicle emissions and other pollution sources. Thus, the lowest concentrations were found in the industrial areas.
To identify the impact on the ambient air quality, correlation coefficients between the PM, API and visibility were calculated; the results are listed in Table 3. Because the API was calculated based on the concentrations of five atmospheric pollutants, i.e., PM10, sulfur dioxide (SO2), nitrogen dioxide (NO2), carbon monoxide (CO), and ozone (O3), measured at the monitoring stations throughout the city, the API exhibited significant positive correlation coefficients with PM5 (r = 0.599 at p = 0.05), PM10 (r =0.588 at p = 0.05), and TSP (r = 0.578 at p = 0.05), although the same correlation was not identified for PM2.5. These observations indicate that the mass concentrations of PM collected at different areas in our study were similar to the results of the environmental protection departments. Because high visibility is common when the air quality is good, significant negative correlation coefficients were identified between the API and visibility (r = −0.441 at p = 0.01). Significant negative correlation coefficients were also found between visibility and PM5 (r = −0.772 at p = 0.01), PM10 (r = −0.778 at p = 0.01), and TSP (r = −0.728 at p = 0.01), although this was not true for PM2.5. These relationships suggest that visibility was primarily reduced via the scattering light due to the presence of larger particles (particulate matter with an aerodynamic diameter greater than or equal to 5.0 μm), such as PM5 and PM10, during the summertime observation period in Xiamen. Non-significant correlations between PM2.5 and both the API and visibility suggest that PM2.5 did not play a primary role in visibility and the API during the investigated period. Table 2 and Figure 3 show that the air quality was good during this period.
In this study, samples were not collected simultaneously; the meteorological conditions may be slightly different. Viability in the meteorological parameters was tested using the one-way analysis of variance (ANOVA) method. Significant (p < 0.05) differences in wind speed were found between the five functional areas (F = 3.815 at p = 0.035) during the sampling periods, whereas no significant differences for temperature (F = 0.745 at p = 0.581), relative humidity (F = 1.27 at p = 0.339), and pressure (F = 2.138 at p = 0.144) were found during the sampling periods between the five functional areas. The wind speed is usually considered to have a very significant effect on the diffusion of particles. Thus, to study the influence of the meteorological conditions on PM, we also calculated the correlations between PM and wind speed, relative humidity and temperature; the results are shown in Table 3. However, non-significant correlation coefficients were found between wind speed and PM levels in this study. 
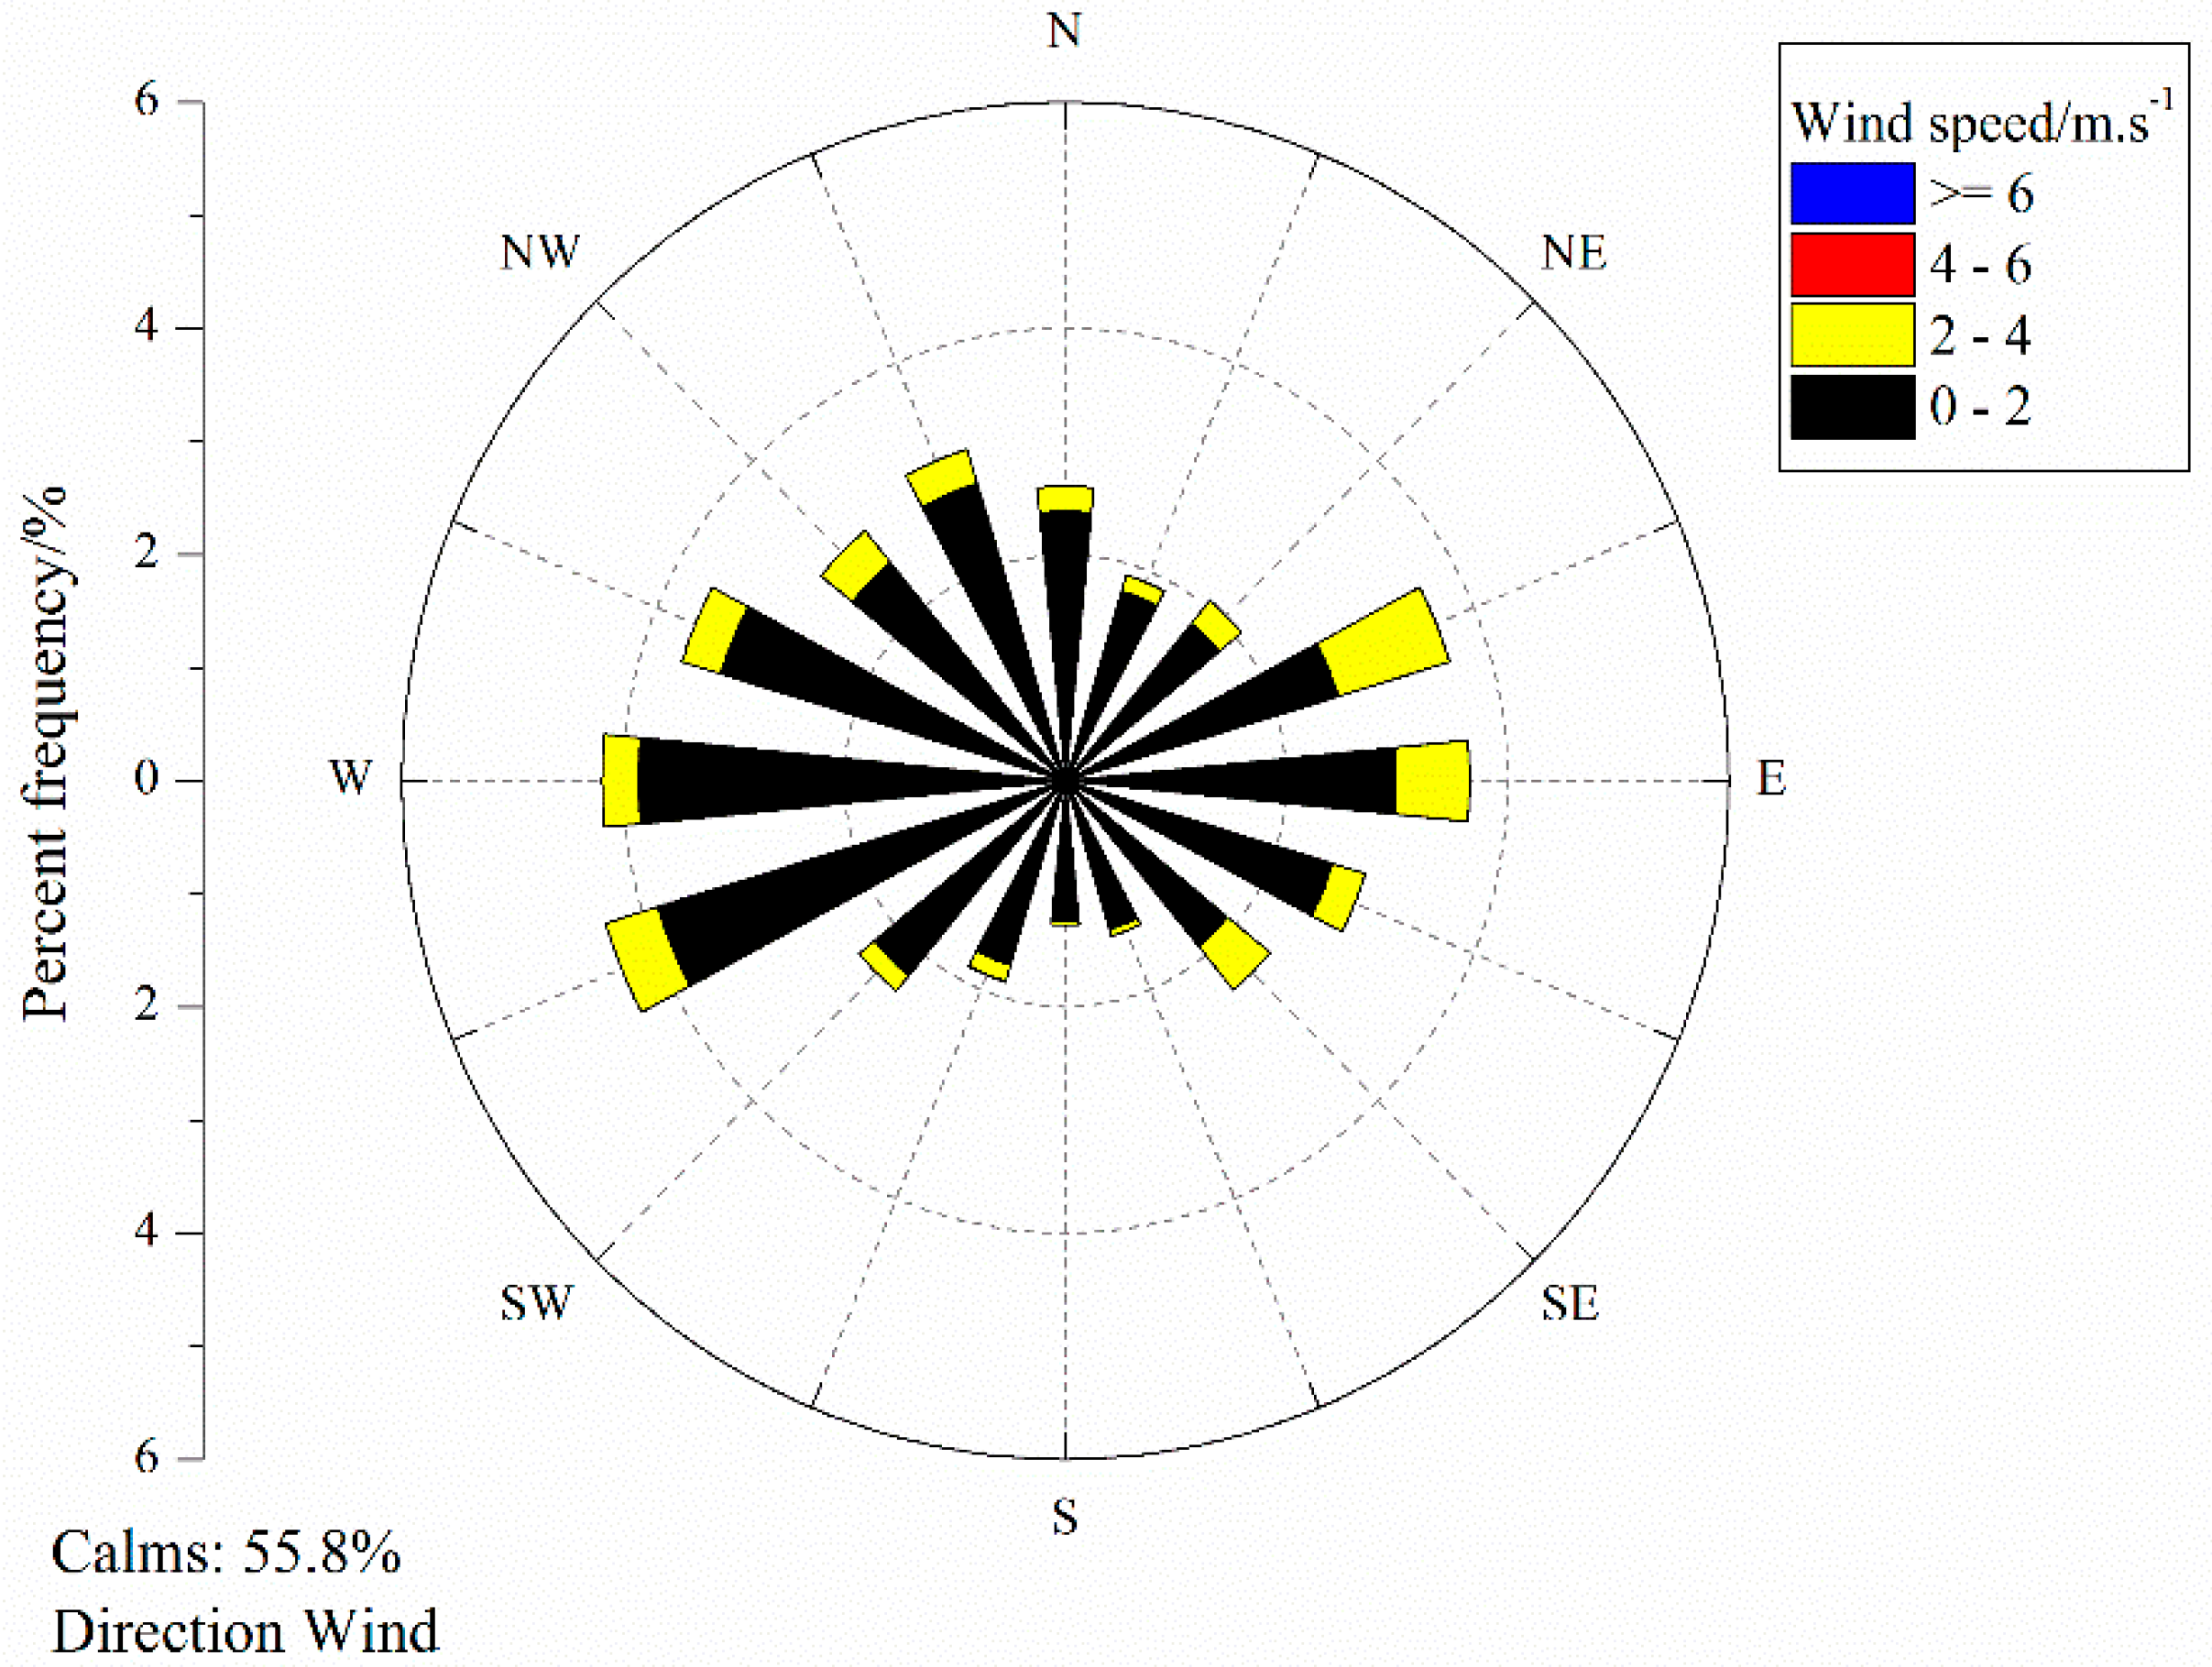
Figure 2 shows that most of the wind speeds were less than 2.0 m∙s−1 (approximately 55.8% of the measurements were calm) at different sampling sites during the sampling periods. This finding suggests that the low wind speeds resulted in weak diffusion of PM2.5; therefore, the wind had little effect on the mass concentrations of PM. Precipitation usually exerts a very significant scavenging effect on the airborne particles. Figure 3 shows that there were several precipitation events between 5 August and 12 September 2012. Although atmospheric particles were not collected on rainy days, PM (and pollutant concentrations) may be affected by the previous day’s rain. Therefore, the correlation between precipitation and PM level was also calculated. Non-significant correlation coefficients were also found between precipitation events and PM levels in this study. These findings indicate that the variations in meteorological conditions had little effect on the PM levels at the different sites, although the meteorological conditions exhibited small variations during the study period. Thus, we compared our results primarily according to the different functional areas.
Table 3. Relationships between PM, air quality and meteorological parameters during the sampling period.
PrecipR.HW.S.TVisAPIPM2.5PM5PM10TSP
Precip10.1990.155−0.188−0.162−0.1550.2820.4440.3990.277
R.H 1−0.3280.111−0.2200.083−0.2260.2510.2490.081
W.S. 1−0.927 **0.138−0.024−0.049−0.254−0.221−0.157
T 10.1280.0390.338−0.088−0.0860.100
Vis 1−0.441 **−0.146−0.772 **−0.778 **−0.728 **
API 1−0.1050.599 *0.588 *0.578 *
PM2.5 1−0.050−0.052−0.016
PM5 10.992 **0.953 **
PM10 10.979 **
TSP 1
Notes: Precip = Precipitation, Vis = Visibility, R.H. = Relative humidity, W.S. = Wind speed, T = Temperature, and API = Air Pollution Index; * p = 0.05 and ** p = 0.01.

3.2. Chemical Components in PM2.5

According to several studies [9,24], most health problems are caused by the exposure to PM2.5 rather than PM10. Thus, chemical components of this pollutant should be carefully analyzed and studied. In this study, the chemical components of PM2.5, such as organic carbon (OC) and elemental carbon (EC), were analyzed via thermal-optical transmission. To investigate the relationship between the carbonaceous components, sulfate and nitrate, the water-soluble inorganic anions in PM2.5 were also determined. The distinct characteristics are described as follows.

3.2.1. Concentrations of OC, EC and Anions in PM2.5

Carbonaceous aerosols, which are composed of OC and EC, are an important component of atmospheric particulate matter, especially PM2.5. The mass concentrations of OC and EC in PM2.5 are listed in Table 4 based on our observations. The average OC and EC concentrations were 4.79 ± 1.19 μg∙m−3 and 1.09 ± 0.55 μg∙m−3, respectively, during the sampling period. The relative standard deviations (RSD = 100% × standard deviation/average) of OC and EC were 25% and 51%, respectively, which are similar to the values reported by Cao et al. [25] for OC (36%) and EC (43%) during summer in Xiamen. The OC concentrations varied from 2.53 to 6.62 μg∙m−3, representing approximately 5%–23% of PM2.5. The EC concentrations ranged from 0.26 to 2.44 μg∙m−3, accounting for 0.8%–6.95% of the total mass of PM2.5 mass. Combined, OC and EC contributed approximately 7%-30% of the PM2.5 mass, which differs slightly from the pollution characteristics of the Pearl Delta River Region of China in summer [26]. According to Turpin and Lim [27], the ratio of organic matter (OM) to organic carbon (OC) is approximately 1.6 for urban aerosols. Thus, the OM concentrations were calculated as OM = 1.6 × OC, and carbonaceous matter (CM) was estimated as the sum of OM and EC [20,25]. As shown in Table 4, the average OM and CM concentrations in PM2.5 were 7.66 ± 1.90 μg∙m−3 and 8.75 ± 2.45 μg∙m−3, respectively, thereby representing average contributions of 19.04% and 21.69% of PM2.5, respectively. The organic pollutant levels in PM2.5 are lower than those in Guangzhou [26].
Table 4. Mass concentrations of OC, EC, and anions during the sampling period at different sites in Xiamen.
Sampling SitesMass Concentrations (μg∙m−3)Ratios (%)
OCECClSO42−NO3OMCMOC/PM2.5EC/PM2.5OM/PM2.5CM/PM2.5
ParksZSP6.621.20.169.602.2110.611.810.021.8216.0317.85
BLZP3.521.120.313.612.335.636.7512.724.0420.3624.41
ZLP4.160.430.165.532.556.657.097.990.8312.7813.61
HLP2.531.170.66.632.444.065.235.32.458.4710.92
Means4.210.980.316.342.386.737.719.012.2914.4116.7
HospitalsFAH6.542.440.1712.102.3310.4612.919.293.4714.8718.34
ZSH3.081.180.041.203.554.936.118.913.414.2517.65
TCMH4.971.950.2211.502.657.969.97.222.8311.5614.39
Means4.861.860.148.272.847.789.648.473.2313.5616.79
Commercial areasZSRC6.11.120.274.852.649.7610.8913.032.420.8523.25
RJC4.580.470.163.492.197.337.813.361.3821.3722.75
MFC5.470.970.134.602.548.769.7313.12.3220.9623.28
Means5.390.860.194.312.468.629.4813.162.0321.0623.09
Industrial areasKYI5.360.80.231.6628.589.3815.852.3725.3527.72
HLI5.191.560.136.952.338.39.8623.076.9536.9143.86
HSI5.211.090.041.781.918.339.4216.453.4426.3129.75
Means5.251.150.133.462.088.49.5518.454.2629.5233.78
Residential areasXXR4.30.930.083.101.886.887.8110.972.3817.5519.93
QPR3.660.260.242.232.125.856.1113.490.9621.5922.55
JSR5.270.720.176.512.458.449.169.681.3215.4816.80
Means4.410.640.173.952.157.067.7011.381.5518.2119.76
Means4.791.090.195.332.387.668.7511.92.6519.0421.69
SDs1.190.550.133.390.391.92.454.281.486.857.79
The highest and lowest observed EC values in Xiamen were found at the First Affiliated Hospital and Qianpunan residential area, respectively. The highest and lowest OC values were found in Zhongshan Park and Huli Park, respectively. The average EC mass concentrations in the five functional areas exhibited the following order: hospital > industrial area > park > commercial area > residential area. In contrast, OC and OM had the following order: commercial area > industrial area > hospital > residential area > park. Moreover, CM exhibited the following order: hospital > industrial area > commercial area > park > residential area. The average EC/PM2.5 ratios had the following order: industrial area > hospital > park > commercial area > residential area, whereas the CM/PM2.5 ratios were found to exhibit the following order: industrial area > commercial area > residential area > hospital > park. Based on the above analysis, it can be found that EC concentrations are lower in residential areas. As a developed city, the fuel structure for cooking has switched to natural gases and central stream, thus, EC form cooking sources contributed little at the residential areas in Xiamen. The OC/PM2.5 and OM/PM2.5 ratios had the following order: industrial area > commercial area > residential area > park > hospital, which differed from OC, EC and PM2.5. This result suggests carbonaceous aerosol pollutions cannot be ignored, although the PM pollution in the industrial area was not obviously due to the light industry in Xiamen.
Major inorganic anions (e.g., Cl, SO42−, and NO3) in PM2.5 are also shown in Table 4. Of all the identified anions, sulfate was the dominant component, followed by nitrate; the concentration of chloride was much lower. The concentrations of SO42− varied from 1.20 to 12.1 μg∙m−3, with a mean value of 5.33 ± 3.39 μg∙m−3, and the concentration of NO3 varied from 1.88 to 3.55 μg∙m−3, with a mean value of 2.38 ± 0.39 μg∙m−3. The mean concentration of Cl was approximately 0.19 ± 0.13 μg∙m−3.

3.2.2. Spatial Variations in PM and its Chemical Components

To evaluate spatial similarities and differences, the mean PM2.5, OC, EC, anions, OM and CM concentrations for the five functional areas were calculated using a multivariate general linear model (GLM). A GLM is a generalization of multiple linear regression models to accommodate more than one dependent variable. The results are listed in Table 5, in which the F statistic values and significance values are also reported. We specified a significance value (p < 0.05) as the threshold for statistically significant differences between the dependent variables, which is used in other statistic methods, such as Student’s T-tests [28,29]. Contini et al. [29] found that PM2.5 exhibited significant differences between different types of sites in Italy. PM2.5 levels increased from background sites to industrial sites and to urban sites, and the PM2.5/PM10 ratio was significantly lower (0.61) at background sites compared to industrial and urban sites. Although the PM2.5/PM10 ratio in Xiamen exhibited the following order: hospital > residential area > park > commercial area > industrial area, PM2.5 exhibited no significant differences (p = 0.200) between the five functional areas. These results demonstrate that the EC concentrations in the five functional areas exhibited significant differences during the study period (p = 0.04), whereas OC, Cl, SO42−, NO3, OM and CM had no significant differences. These results are similar to studies in European cities. Putaud et al. [30] based on numerous measurements, found that EC, SO42− and NO3 exhibited different characteristics for different site types in Italy. For example, they found that the contribution of EC to PM10 increased from rural sites to urban and curbside areas, whereas OM was remarkably similar for sites (at least when present). Sandrini et al. suggested that the more marked spatial variability for EC rather than for OC and other components is due to the primary only nature of EC emissions [28]. Table 5 shows that the OC/PM2.5 ratios exhibited significant differences (p = 0.003), although there were no significant differences between the OC concentrations in the five areas. One possible explanation for this discrepancy is that EC and OC may be correlated with the local emissions in the different functional areas, whereas other components may be from other sources with few local emissions. Additionally, because the database is limited in terms of its temporal span and number of samples, the conclusions may be influenced by these limitations.
Table 5. Results of the GLM applied to PM2.5 and its chemical components (tests of between-subjects effects) for the five functional areas in Xiamen.
SourceDependent VariableType III Sum of SquaresdfMean SquareFSig
Functional AreaPM2.51374.2304343.5571.7960.200
OC3.50640.8770.5480.705
EC2.60740.6523.6320.040
Cl0.07340.0181.0710.416
NO31.09040.2732.4230.111
SO42−49.267412.3171.0980.405
OM8.96342.2410.5470.705
CM13.49643.3740.6500.639
OC/PM2.5203.261450.8157.7970.003
EC/PM2.514.01543.5042.0390.158
Notes: p = 0.05; df = Degree of freedom; F = F statistic value; Sig = Significance (p value). The values in bold are statistically significant differences (p < 0.05).
To identify and separate the impact of various sources, correlation coefficients between OC, EC and individual ionic species were calculated and are shown in Table 6. Significant positive correlation coefficients were found between SO42− and EC (r = 0.706 at p = 0.01) which suggests that SO42− and EC may share the same sources. EC particles are emitted from incomplete combustion of biofuels, fossil fuels and biomass and are typically considered to be the primary pollutant emitted by the traffic vehicles in urban areas. The oxidation of SO2 emitted from coal burning for industries is an important source of SO42−. Heavy fuel oil, which has high sulfur consent, is commonly used for ship combustion, which may contribute to SO2 emissions and may represent a possible source of SO42−. Xiamen is a low industrial coal consumption city, but the increased shipping emissions from harbor areas are very intense during summertime. Therefore, in addition to industrial emissions, these findings suggest that a portion of EC and SO42− in Xiamen may have also been emitted by ship transportation during the study period.
Table 6. Inter-species correlation coefficients.
ClSO42−NO3OCEC
Cl10.190−0.041−0.380.009
SO42− 10.0530.4710.711 **
NO3 1−0.2710.185
OC 10.377
EC 1
Notes: * p = 0.05 and ** p = 0.01.
The relationship between OC and EC provides some indication of the origins of carbonaceous PM2.5 [25]. The non-significant correlation coefficients between OC and EC (r = 0.377 at p > 0.05) indicate that the sources of OC and EC are likely to be different and complex. Figure 4 shows the relationship between EC and OC in PM2.5 in the different functional areas of Xiamen during the summer study period. EC and OC were well correlated in the samples collected from the hospitals (R2 = 0.99) and commercial areas (R2 = 0.92), which suggests a combination of common source contributions. Poor correlations were found for samples from the parks, industrial areas and residential areas, indicating more complex emission sources over these areas.
Figure 4. Correlation between EC and OC in PM2.5 for the different functional areas of Xiamen during the summer study period; the Adj. R2 of Parks, Hospitals, Commercial areas, Industrial areas and Residential areas were −0.49, 0.99, 0.92, 0.45, −0.32 and −0.49, respectively.
Atmosphere 06 00234 g004

3.2.3. Primary and Secondary Source Contributions

Chen et al. [31] found that fossil fuel combustion produces 80% ± 6% of EC in China. Therefore, EC is typically considered to be a tracer of primary organic carbon (POC). OC may originate directly from primary emissions generated by fuel combustion or indirectly from formation processes (e.g., secondary organic carbon, SOC) via gas-to-particle chemical reactions in the atmosphere [32]. However, distinguishing between primary organic carbon (POC) and SOC generated by chemical separation processes is difficult because there is no simple, direct analytical technique that can separate and quantify POC and SOC. In this study, the amount of SOC was estimated via the commonly used minimum OC/EC ratio method [17,25]. The OC/EC ratio is used in radiative transfer models to assess particle light scattering and absorption and to identify the presence of SOC. Ratios higher than 2.0 suggest the presence of SOC [33]. In our study, the OC levels were higher than the EC levels at all of the sampling sites; the OC/EC ratios ranged from 2.16 to 14.03.The relevant equations for this analysis are described as follows:
SOC = TOC – POC
POC = EC × (OC/EC)min
Where TOC is the total OC; (OC/EC)min is the minimum observed ratio.
Figure 5. Relative contributions of primary and secondary sources to total carbon in the different functional areas in Xiamen.
Atmosphere 06 00234 g005
Figure 5 shows the relative percentages of POC, SOC and EC in the observed total carbon (TC) within the different functional areas in Xiamen. SOC accounted for 53.6%, 56.6%, 43.1% and 60% of TC in parks, commercial areas, industrial areas and residential areas, respectively, and only 12.8% in hospitals. The results indicate that SOC formation is significant in these areas in Xiamen. The highest percentages of SOC in these areas are similar to the results of PM collected in southern cities of China during summer [25,26], which may be caused by the high potential photochemistry and low contributions from coal combustion. EC and POC accounted for 27.7% and 59.5% of TC at the hospitals. Sandrini et al. found that road-traffic influenced sites were characterized by the lowest levels of the OC/EC ratio, in the case with highest EC concentrations, denoting the prevalent primary origin of OC [28]. The highest percentage of POC and EC at the hospitals is primarily from motor vehicles. Hospitals in Xiamen are located in crowed areas and are common hubs for taxies, buses, and private cars. Exhaust emissions from the transport sector is a major source of EC. The statistical data show that vehicle usage has been rapidly increasing. Vehicle emissions have become a principal source of urban air pollution [34]. To reduce the impact of vehicle emissions on urban air quality, a series of vehicle emission controls and policies have been implemented, including the implementation of the European Union emission standards. However, legislation for vehicle emission control is focused on only a few compounds, such as carbon monoxide, total hydrocarbons, nitrogen oxides and particle numbers, with the exception of EC. Several studies have predicted that EC emissions from motor vehicles will be the largest and most important anthropogenic source in the coming decades [35]. The high values found at hospitals were primarily caused by vehicle emissions. For the convenience of patients, most of the hospitals are located along main roads, which typically have many vehicles. Thus the location is one of the reasons for the high EC values of observed at hospitals in Xiamen. Additionally, most hospitals do not have sufficient underground parking, and surface parking lots are in the vicinity of the sickrooms. Emissions from vehicles entering and exiting the parking lots were another major source of PM2.5, OC, and EC at hospitals. Thus, limiting the numbers of vehicles entering the hospital campuses, constructing large-capacity underground parking structures, and locating the hospitals far from major roads in urban areas are essential steps for the long-term plans. The slightly higher contributions of EC to TC in the parks may also be attributed to the exhaust emissions from the transport sector. Many parks on Xiamen Island are not large and are commonly located near main roads. Furthermore, due to the increases in the number of vehicles in Xiamen, the limited number car parks cannot accommodate the increased motor vehicle usage; therefore, large empty areas of certain parks have been converted to parking lots. Thus, the EC concentrations in parks were slightly higher in Xiamen. Finally, the results may also be influenced by the limited dataset.

3.2.4. Comparison with Previous Studies in Other Areas

We compared our data with previous studies conducted in Xiamen, other areas in China, and other countries (see Table 7). We found that the PM2.5, OC, and EC concentrations in Xiamen were much lower than those in Beijing [36] and Guangzhou [26], which provides clear evidence that Xiamen is one of the cleanest cities in China. Lower carbonaceous concentrations occurred in Xiamen, which is consistent with the low industrial coal consumption. However, the PM2.5 concentrations in Xiamen exhibited a pronounced increased from 2003 to 2012, which may be a reason for the increasing frequency of atmospheric haze episodes in this region. Recent increase in PM levels may have been caused by increased motor vehicle usage, urban construction, and industrial combustion. The increase in traffic volume is particularly compelling. In Xiamen, the vehicle population increased from 275,000 in 2003 to 875,000 in 2012. However, due to the different analytical methods for OC and EC and different specific sampling sites, the OC and EC concentrations did not correspond with the PM2.5. Previous studies have also observed that traffic-related emissions contribute to airborne OC and EC. Cyrys et al. [23] and Samara et al. [37] found that PM2.5, OC and EC concentrations were obviously higher at the urban traffic sites than urban background areas. Sandrini et al. [28] found that OC concentrations increased by an order of magnitude from remote to traffic influenced sites and that EC concentrations increased by more than 50 times. The OC and EC concentrations in Xiamen were comparable to urban background sites in Europe, whereas the PM2.5 concentrations were nearly three times higher than those in the European sites. Table 7 shows that the OC and EC concentrations in Xiamen were similar to those in Bari, which is a coastal site in Italy [28]. The similarity between these two sites may be attributed to their similarly coastal geographic positions.
Table 7. Comparison with data from previous studies.
LocationSite TypeSampling PeriodPM2.5 (μg∙m−3)OC (μg∙m−3)EC (μg∙m−3)References
Xiamen, ChinaUrbanAugust–September 201243.70 ± 15.234.79 ± 1.191.09 ± 0.55This study
Xiamen, ChinaUrbanJune–July 200325.2 ± 15.84.8 ± 2.41.4 ± 1.3Cao et al., 2007 [25]
Xiamen, ChinaUrbanApril 2008 to February 200953.4 ± 25.07.6 ± 4.32.4 ± 0.8Chen et al., 2012 [20]
RuralApril 2008 to January 20115.7 ± 3.11.3 ± 0.7
Xiamen, ChinaUrbanJuly 200934.26 ± 5.179.90 ± 0.672.34 ± 0.52Zhang et al., 2011 [18]
Xiamen, ChinaUrbanAugust 201140.81 ± 27.896.87 ± 3.361.46 ± 0.80Niu et al., 2013 [17]
Beijing, ChinaUrbanJune–July 200973.812.54.9Liu et al., 2014 [36]
Guangzhou, ChinaUrban2006–2007 winter-8.534.81Huang et al., 2012 [26]
2006–2007 summer-5.973.46
GermanyUrban backgroundMarch 1999 and July 200013.3-2.1Cyrys et al., 2003 [23]
Urban traffic14.3-3.1
The NetherlandsUrban backgroundMarch 1999 and April 200017.8-2.1
Urban traffic19.9-3.9
SwedenUrban backgroundFebruary
1999 and March 2000
10.2-1.4
Urban traffic13.8-2.5
ThessalonikiUrban backgroundJuly–September 201123.55.720.69Samara et al., 2014 [37]
GreeceUrban trafficFebruary–April 201231.28.445.29
San Pietro Capofiume, ItalyRuralMay–July 2007-3.10.78Sandrini et al., 2014 [28]
Bari Pane e Pomodoro, ItalyUrban backgroundMarch–July 2007-4.51.7
Bari San Nicola, ItalyUrban backgroundMarch–July 2007-4.41.7
Bari Casamassima, ItalyUrban backgroundMarch–July 2007-5.81.7
Milano Lodi, ItalyUrban backgroundFebruary 2005 to June 2007 6.31.7
Milano via Messina, ItalyUrban backgroundAugust 2002 to December 2003 9.31.4
Milano Torre Sarca, ItalyTrafficJuly 2005 to March 2008 9.44.5

4. Conclusions

Intensive sampling of atmospheric PM (i.e., TSP, PM10, PM5 and PM2.5) was conducted from August to September in 2012 to provide information on fine-scale spatial variations in PM exposure in the urban area of Xiamen. The results showed that most TSP particles were inhalable particles of PM10 and that PM2.5 accounted for more than 52.8% of the total PM10. In terms of the average PM mass concentrations for all size categories, the order of the five functional area studies was as follows: hospital > park > commercial area > residential area > industrial area. OC, EC, and the major anions (i.e., Cl, SO42−, and NO3) in PM2.5 were also determined. OC contributed approximately 5%–23% of the total mass of PM2.5, whereas EC only accounted for 0.8%–6.95%. High observed OC/EC ratios indicated the formation of SOC. Due to the high potential photochemistry in summer, SOC was the major carbonaceous particle in the parks, commercial areas, industrial areas, and residential areas, (i.e., not at the hospitals). The highest percentages of POC and EC, observed at the hospitals, can be primarily attributed to motor vehicle sources. Although the results may be influenced by the limited dataset, this study has provided important insights into short-term PM exposures in the different functional areas in the urban area of Xiamen. Although the PM concentrations in Xiamen are much lower than in other cities in China, the concentrations appear to have increased significantly in recent years. Traffic vehicle emissions are a major source of the increased PM levels. Thus, it is essential to limit the numbers of vehicles in the urban area, especially near public areas, such as hospitals and parks. For the long-term future, properly locating hospitals, parks, and residential areas far from the main roads is critical.

Acknowledgements

This research was supported by the National Natural Science Foundation of China (41305133), Natural Science Foundation of Fujian Province (2013J05065), Special Fund for Marine Researches in the Public Interest (2004DIB5J178), and the open fund of Key Lab of Global Change and Marine-Atmospheric Chemistry of State Oceanic Administration (GCMAC1108). Finally, we would like to thank the reviewers and editors who have contributed valuable comments to improve the manuscript.

Author Contributions

The work presented here was carried out in collaboration with all authors. Liqi Chen and Ke Du supervised the research. Shuhui Zhao, Yanli Li, and Zhenyu Xing performed the field campaign. Shuhui Zhao involved the data analysis and wrote the manuscript. Liqi Chen and Ke Du contributed to the reviewing and revising of the manuscript.

Conflicts of Interest

The authors declare no conflict of interest.

References

  1. Barima, Y.S.S.; Angaman, D.M.; N’Gouran, K.P.; Koffi, N.G.A.; Kardel, F.; Kardel, C.; Samson, R. Assessing atmospheric particulate matter distribution based on Saturation Isothermal Remanent Magnetization of herbaceous and tree leaves in a tropical urban environment. Sci. Total Environ. 2014, 470–471, 975–982. [Google Scholar]
  2. Watson, J.G. Visibility: Science and regulation. J. Air Waste Manage. Assoc. 2002, 52, 628–713. [Google Scholar] [CrossRef]
  3. Ramanathan, V.; Crutzen, P.J. New directions: Atmospheric brown clouds. Atmos. Environ. 2003, 37, 4033–4035. [Google Scholar] [CrossRef]
  4. Ulrich, P. Atmospheric aerosols: Composition, transformation, climate and health effects. Angew. Chem. Int. Edit. 2005, 44, 7520–7540. [Google Scholar] [CrossRef]
  5. Pope, C.A.; Dockery, D.W. Health effects of fine particulate air pollution: Lines that connect. J. Air Waste Manage. Assoc. 2006, 56, 709–742. [Google Scholar] [CrossRef]
  6. Katsouyanni, K.; Touloumi, G.; Samoli, E.; Gryparis, A.; Le Tertre, A.; Monopolis, Y.; Rossi, G.; Zmirou, D.; Ballester, F.; Boumghar, A.; et al. Confounding and effect modification in the short-term effects of ambient particles on total mortality: Results from 29 European cities within the APHEA2 project. Epidemiology 2001, 12, 521–531. [Google Scholar]
  7. Samet, J.M.; Zeger, S.L.; Dominici, F.; Curriero, F.; Coursac, I.; Dockery, D.W.; Schwartz, J.; Zanobetti, A. The National morbidity, mortality, and air pollution study. Part II: Morbidity and mortality from air pollution in the United States. Res. Rep. Health. Eff. Inst. 2000, 94, 5–70. [Google Scholar]
  8. World Health Organization (WHO). Air Quality Guidelines for Particulate Matter, Ozone, Nitrogen Dioxide and Sulfur Dioxide, Global Update 2005, Summary of Risk Assessment; WHO: Geneva, Switzerland, 2006. [Google Scholar]
  9. Raaschou-Nielsen, O.; Andersen, Z.J.; Beelen, R.; Samoli, E.; Stafoggia, M.; Weinmayr, G. Air pollution and lung cancer incidence in 17 European cohorts: Prospective analyses from the European Study of Cohorts for Air Pollution Effects (ESCAPE). Lancet. Oncol. 2013, 14, 813–822. [Google Scholar] [CrossRef] [PubMed]
  10. Che, H.; Zhang, X.; Li, Y.; Zhou, Z.; Qu, J.J.; Hao, X. Haze trends over the capital cities of 31 provinces in China, 1981–2005. Theor. Appl. Climatol. 2009, 97, 235–242. [Google Scholar] [CrossRef]
  11. Zhao, P.; Zhang, X.; Xu, X.; Zhao, X. Longterm visibility trends and characteristics in the region of Beijing, Tianjin, and Hebei, China. Atmos. Res. 2011, 101, 711–718. [Google Scholar] [CrossRef]
  12. Monn, C.; Carabias, V.; Junker, M.; Waeber, R.; Karrer, M.; Wanner, H.U. Small-scale spatial variability of particulate matter <10 mu m (PM10) and nitrogen dioxide. Atmos. Environ. 1997, 31, 2243–2247. [Google Scholar]
  13. Lung, S.C.C.; Mao, I.F.; Liu, L.J.S. Residents’ particle exposures in six different communities in Taiwan. Sci. Total Environ. 2007, 377, 81–92. [Google Scholar] [CrossRef] [PubMed]
  14. Lung, S.-C.C.; Hsiao, P.-K.; Wen, T.-Y.; Liu, C.-H.; Fu, C.B.; Cheng, Y.-T. Variability of intra-urban exposure to particulate matter and CO from Asian-type community pollution sources. Atmos. Environ. 2014, 83, 6–13. [Google Scholar] [CrossRef]
  15. Fan, X.; Sun, Z. Analysis on features of haze weather in Xiamen City during 1953–2008. Trans. Atmos. Sci. 2009, 32, 604–609. (In Chinese) [Google Scholar]
  16. Niu, Z.; Zhang, F.; Kong, X.; Chen, J.; Yin, L.; Xu, L. One-year measurement of organic and elemental carbon in size-segregated atmospheric aerosol at a coastal and suburban site in Southeast China. J. Environ. Monit. 2012, 14, 2961–2967. [Google Scholar] [CrossRef] [PubMed]
  17. Niu, Z.; Wang, S.; Chen, J.; Zhang, F.; Chen, X.; He, C.; Lin, L.; Yin, L.; Xu, L. Source contributions to carbonaceous species in PM2.5 and their uncertainty analysis at typical urban, peri-urban and background sites in southeast China. Environ. Pollut. 2013, 181, 107–114. [Google Scholar]
  18. Zhang, F.; Zhao, J.; Chen, J.; Xu, Y.; Xu, L. Pollution characteristics of organic and elemental carbon in PM2.5 in Xiamen, China. J. Environ. Sci. 2011, 23, 1342–1349. [Google Scholar] [CrossRef]
  19. Zhang, F.; Xu, L.; Chen, J.; Yu, Y.; Niu, Z.; Yin, L. Chemical compositions and extinction coefficients of PM2.5 in peri-urban of Xiamen, China, during June 2009–May 2010. Atmos. Res. 2012, 106, 150–158. [Google Scholar]
  20. Chen, B.; Du, K.; Wang, Y.; Chen, J.; Zhao, J.; Wang, K.; Zhang, F.; Xu, L. Emission and transport of carbonaceous aerosols in urbanized coastal areas in China. Aerosol Air Qual. Res. 2012, 12, 371–378. [Google Scholar]
  21. Weather History & Data Archive from Weather Underground, the Weather Channel, Inc. Available online: http://www.wunderground.com (accessed on 27 January 2015).
  22. Birch, M.E.; Cary, R.A. Elemental carbon-based method for monitoring occupational exposures to particulate diesel exhaust: Methodology and exposure issues. Aerosol Sci. Tech. 1996, 121, 1183–1190. [Google Scholar]
  23. Cyrys, J.; Heinrich, J.; Hoek, G.; Meliefste, K.; Lewne, M.; Gehring, U.; Bellander, T.; Fischer, P.; Van Vliet, P.; Brauer, M.; et al. Comparison between different traffic-related particle indicators: Elemental. carbon (EC), PM2.5 mass, and absorbance. J. Expo. Anal. Environ. Epidemiol. 2003, 13, 134–143. [Google Scholar]
  24. Holgate, S.T.; Samet, J.M.; Koren, H.S.; Maynard, R.L. Air Pollution and Health; Academic Press: London, UK, 1999. [Google Scholar]
  25. Cao, J.J.; Lee, S.C.; Chow, J.C.; Watson, J.G.; Ho, K.F.; Zhang, R.J.; Jin, Z.D.; Shen, Z.X.; Chen, G.C.; Kang, Y.M.; et al. Spatial and seasonal distributions of carbonaceous aerosols over China. J. Geophys. Res. 2007. [Google Scholar] [CrossRef]
  26. Huang, H.; Ho, K.F.; Lee, S.C.; Tsang, P.K.; Ho, S.S.H.; Zou, C.W.; Zou, S.C.; Cao, J.J.; Xu, H.M. Characteristics of carbonaceous aerosol in PM2.5: Pearl Delta River Region, China. Atmos. Res. 2012, 104–105, 227–236. [Google Scholar]
  27. Turpin, B.J.; Lim, H.J. Species contributions to PM2.5 mass concentrations: Revisting common assumptions for estimating organic mass. Aerosol Sci. Tech. 2001, 35, 602–610. [Google Scholar]
  28. Sandrini, S.; Fuzzi, S.; Piazzalunga, A.; Prati, P.; Bonasoni, P.; Cavalli, F.; Bove, M.C.; Calvello, M.; Cappelletti, D.; Colombi, C.; et al. Spatial and seasonal variability of carbonaceous aerosol across Italy. Atmos. Environ. 2014, 99, 587–598. [Google Scholar]
  29. Contini, D.; Cesari, D.; Donateo, A.; Chirizzi, D.; Belosi, F. Characterization of PM10 and PM2.5 and their metals content in different typologies of sites in South-Eastern Italy. Atmosphere 2014, 5, 435–453. [Google Scholar]
  30. Putaud, J.P.; van Dingenen, R.; Alastuey, A.; Bauer, H.; Birmili, W.; Cyrys, J.; Flentje, H.; Fuzzi, S.; Gehrig, R.; Hansson, H.C.; et al. A European aerosol phenomenology-3: Physical and chemical characteristics of particulate matter from 60 rural, urban, and kerbside sites across Europe. Atmos. Environ. 2010, 44, 1308–1320. [Google Scholar]
  31. Chen, B.; Andersson, A.; Lee, M.; Kirillova, E.N.; Xiao, Q.F.; Krusa, M.; Shi, M.N.; Hu, K.; Lu, Z.F.; Streets, D.G.; et al. Source forensics of black carbon aerosols from China. Environ. Sci. Technol. 2013, 47, 9102–9108. [Google Scholar]
  32. Seinfeld, J.H.; Pandis, S.N. Atmospheric Chemistry and Physics: From Air Pollution to Climate Change; John Wiley: New York, NY, USA, 1998. [Google Scholar]
  33. Chow, J.C.; Watson, J.G.; Lu, Z.; Lowenthal, D.H.; Frazier, C.A.; Solomon, P.A.; Thuillier, R.H.; Magliano, K. Descriptive analysis of PM2.5 and PM10 at regionally representative locations during SJVAQS/AUSPEX. Atmos. Environ. 1996, 30, 2079–2112. [Google Scholar]
  34. Bond, T. Can warming particles enter global climate discussions? Environ. Res. Lett. 2007. [Google Scholar] [CrossRef]
  35. Streets, D.G.; Bond, T.C.; Lee, T.; Lang, C. On the future of carbonaceous aerosol emissions. J. Geophys. Res. 2004. [Google Scholar] [CrossRef]
  36. Liu, Y.J.; Zhang, T.T.; Liu, Q.Y.; Zhang, R.J.; Sun, Z.Q.; Zhang, M.G. Seasonal variation of physical and chemical properties in TSP, PM10 and PM2.5 at a roadside site in Beijing and their influence on atmospheric visibility. Aerosol Air Qual. Res. 2014, 14, 954–969. [Google Scholar]
  37. Samara, C.; Voutsa, D.; Kouras, A.; Eleftheriadis, K.; Maggos, T.; Saraga, D.; Petrakakis, M. Organic and elemental carbon associated to PM10 and PM2.5 at urban sites of northern Greece. Environ. Sci. Pollut. Res. 2014, 21, 1769–1785. [Google Scholar]

