Article

The Influence of Sandstorms and Long-Range Transport on Polycyclic Aromatic Hydrocarbons (PAHs) in PM2.5 in the High-Altitude Atmosphere of Southern China

1
School of Environmental Science and Engineering, Shandong University, 27 Shanda Nanlu, Jinan 250100, China
2
Institute for Climate and Global Change Research and School of Atmospheric Sciences, Nanjing University, 163 Xianlin Avenue, Nanjing 210023, China
3
Shandong Environmental Monitoring Center, 3377 Jingshi Road, Jinan 250101, China
*
Author to whom correspondence should be addressed.
Atmosphere 2015, 6(11), 1633-1651; https://doi.org/10.3390/atmos6111633
Submission received: 9 September 2015 / Revised: 21 October 2015 / Accepted: 22 October 2015 / Published: 30 October 2015
(This article belongs to the Special Issue Atmospheric Composition Observations)

Abstract

:
PM2.5 (Particulate Matter 2.5) samples were collected at Mount Heng and analyzed for polycyclic aromatic hydrocarbons (PAHs). During sampling, a sandstorm from northern China struck Mount Heng and resulted in a mean PM2.5 concentration of 150.61 μg/m3, which greatly exceeded the concentration measured under normal conditions (no sandstorm: 58.50 μg/m3). The average mass of PAHs in PM2.5 was 30.70 μg/g, which was much lower than in the non-sandstorm samples (80.80 μg/g). Therefore, the sandstorm increased particle levels but decreased PAH concentrations due to dilution and turbulence. During the sandstorm, the concentrations of 4- and 5-ring PAHs were below their detection limits, and 6-ring PAHs were the most abundant. Under normal conditions, the concentrations of 2-, 3- and 6-ring PAHs were higher, and 4- and 5-ring PAHs were lower relative to the other sampling sites. In general, the PAH contamination was low to medium at Mount Heng. Higher LMW (low molecular weight) concentrations were primarily linked to meteorological conditions, and higher HMW (high molecular weight) concentrations primarily resulted from long-range transport. Analysis of diagnostic ratios indicated that PM2.5 PAHs had been emitted during the combustion of coal, wood or petroleum. The transport characteristics and origins of the PAHs were investigated using backwards Lagrangian particle dispersion modeling. Under normal conditions, the “footprint” retroplumes and potential source contributions of PAHs for the highest and lowest concentrations indicated that local sources had little effect. In contrast, long-range transport played a vital role in the levels of PM2.5 and PAHs in the high-altitude atmosphere.

1. Introduction

Haze pollution in China has occurred frequently in recent decades, with a vital contribution from PM2.5 (Particulate Matter 2.5). Sandstorms also frequently occur in China, resulting in serious air pollution. PM2.5 and PAHs (polycyclic aromatic hydrocarbons) have become the focus of governments and researchers. Many studies have been conducted on PAHs and PM2.5 in the suburban and urban atmosphere; however, very few studies have evaluated the PAH concentrations associated with PM2.5 at high altitudes in China. Further studies of the PAH concentration distributions and sources in PM2.5 were conducted in this research. Furthermore, the influence of long-range transport on PAH concentrations in the atmosphere of a heavily polluted area is also discussed.
Regarding PM2.5 pollution, the standard established by the U.S. Environmental Protection Agency (US EPA) has been progressively tightened and is currently set at 35 μg/m3 for a 24-h period, with an annual average of 12 μg/m3. PM2.5 originates from both natural and anthropogenic sources, which can directly emit particles or emit precursor gases that subsequently form particles in the atmosphere [1]. PM2.5 can reduce visibility because its particle diameter is near the wavelength of light, in addition to exerting climate and human health effects, particularly in the form of respiratory system disease due to its diverse chemical composition. Furthermore, PM2.5 is a carrier for toxic pollutants, such as PAHs or polychlorinated biphenyls (PCBs). PM2.5 particles have a lifespan of days to weeks and can be transported over distances of thousands of kilometers due to their small size [2]. Therefore, it is important to study the distribution of PM2.5 concentrations and their emission sources.
PAHs, especially those associated with fine particles (PM2.5), are mutagenic and carcinogenic [3]. During incomplete combustion or the pyrolysis of organic materials such as wood, fossil fuels and coal, PAHs, a group of semi-volatile compounds, are formed. In terms of environmental effects, PAHs can also inhibit growth of diatoms and even affect the global carbon cycle [4,5]. In terms of human health, PAHs, especially those with high molecular weight, are associated with several pathologies and may cause acute health effects, adverse birth outcomes or higher levels of risk for lung cancer [3,6,7]. In China, the limit for the daily average concentration of BaP in ambient air is 0.01 μg/m3. In the 1970s, the US EPA designated 16 PAHs as priority pollutants. In particular, high molecular weight (HMW) PAHs (MW ≥ 202) with 4–6 aromatic rings frequently result from combustion [8]. In addition, PAHs can disperse regionally and travel to remote places through long-range atmospheric transport; the influence of this process is analyzed in this study. PAHs are primarily emitted from anthropogenic sources, including petrogenic and pyrogenic sources [9]. Petrogenic sources are introduced to the atmosphere through oil spills of crude and refined petroleum, and pyrogenic sources are released through the combustion of coal, petroleum or biomass [9,10,11]. The major sources in China are biofuel burning, domestic coal combustion, and industrial emissions [12]. Therefore, it is important to analyze the concentrations, distributions and potential emission sources of PAHs associated with PM2.5, particularly in the atmosphere, to effectively control air pollution caused by PM2.5.
Most studies on PAHs have been conducted in low-lying urban or rural areas around the world [13,14,15]. However, few studies have described PAH concentrations in PM2.5, especially concerning sandstorms and long-range transport at high mountain sites far from ground-level pollution sources. Areas such as Mount Heng (the sampling site in this study), particularly for those located in the free troposphere of heavily polluted areas, are unique environments for investigating PM2.5 PAH concentrations. Although high mountain sites are usually considered the most pristine continental areas [16], they may receive significant amounts of PAHs from the deposition of particulates after long-range atmospheric transport [17,18]. The particulate (PM2.5) samples were collected at the summit of Mount Heng (1269 m asl), located in the transition region between the boundary layer and free troposphere. The concentrations and distributions of chemical compounds at high mountain sites can provide valuable information regarding the long-range transport and accumulation of such pollutants. The objectives of this study were to determine the PM2.5 and particulate PAHs levels and to identify potential emission sources of PAHs and PM2.5 at Mount Heng during the spring of 2009.

2. Materials and Methods

2.1. Sampling

PM2.5 samples were collected at the top of Mount Heng (27.3°N, 112.7°E) continuously every day from March to May of 2009, except on rainy or very foggy days. Mount Heng is located in the Hunan province of southern China and is approximately 500 km from the East China Sea and South China Sea. Sampling was conducted at the Mount Heng Meteorological Station, which is located at an elevation of 1269 m asl near Zhurong Peak, located within the free troposphere as shown in Figure 1. Measurements were performed in 2009 on the roof of a small house that is part of the meteorological observatory. The local climate is characterized by distinct seasons and influenced by air masses that originate from various directions. Although Mount Heng is less developed than coastal cities in China, it has experienced rapid industrialization and urbanization in the last two decades [19]. Furthermore, its high elevation and geographic location are suitable for studying the long-range transport of pollutants.
A medium-volume PM air sampler (TH150A, Tianhong, Wuhan) with a PM2.5-selective inlet was used for ambient sample collection at a calibrated flow rate of 100 mL/min. PM2.5 particles were collected on quartz fiber filters (90 mm in diameter) that had been pre-baked in a muffle furnace for 24 h at 600 °C to minimize the concentration in the blank. Then, the quartz fiber filters were stored in a constant temperature and humidity incubator (WS 150 III) at 25 °C and a relative humidity of 50% for 48 h before weighing.
A sandstorm in northern China struck Mount Heng on 25 April 2009 (25-1: 8:30–20:15 and 25-2: 21:00–8:05 the next day) and 26 April 2009 (26-1: 8:30–12:30, 26-2:12:50–16:30, 26-3: 16:50–20:40 and 26-4: 20:50–8:40 the next day). During this time, six of the particulate samples were collected. As shown in Figure 1b, when the sandstorm occurred on 25 and 26 April 2009, the UV (ultraviolet) aerosol index increased. However, this index was lower when no sandstorm occurred on 19 and 20 May 2009 (Figure 1a).
Figure 1. Sampling locations and UV (ultraviolet) aerosol index under normal conditions (a) and during the sandstorm (b).
Atmosphere 06 01633 g001

2.2. Analytical Techniques

After field sampling, all filters were immediately sealed in aluminum foil and stored in a freezer at −20 °C before analysis. Next, the compounds collected on the quartz fiber filters were extracted in an accelerated solvent extractor (ASE 3000, Dionex) using a solvent mixture of acetone and n-hexane (v/v = 1:1) at an extraction temperature of 100 °C for 5 min. Perylene-D12 was added to the samples as a surrogate before extraction to estimate the extraction efficiency and losses during the sample extraction and concentration steps. The extracts were rotary evaporated to a volume of approximately 10 mL before concentrating in a concentrator (N-EVAP 112) to approximately 1 mL. Finally, each extract was diluted with 1 mL of n-hexane and spiked with phenanthrene-d10 as an internal standard for analysis by gas chromatography/mass spectrometry (GC/MS).
Sixteen priority PAH species listed by the US EPA were quantified using GC/MS (QP2010, SHIMADZU) with a capillary GC column (30 m × 0.25 mm × 0.25 µm, DB-5 ms). The ion source, injector and interface temperatures were 200.0, 300.0 and 250.0 °C, respectively. The column oven temperature was initially 45.0 °C for 1.0 min before increasing to 130.0 °C at a rate of 45.0 °C /min, to 240.0 °C at a rate of 7.0 °C /min and to 320.0 °C at a rate of 12.0 °C /min, which was then held for 8.0 min. The analytical method was based on US EPA Method 8270 [20]. Sixteen PAHs were measured and quantified. Although naphthalene is on this list, its levels are affected by many factors, and it was not investigated in this study due to its high volatility in particles and its presence in the ambient air and carrier gas. Therefore, only the sums of the other 15 PAHs were analyzed, as in many previous studies [21,22]. The fifteen priority PAH species are acenaphthene (Ace), acenaphthylene (Acy), fluorene (Flu), phenanthrene (PhA), anthracene (AnT), fluoranthene (FluA), pyrene (Pyr), benz (a) anthracene (BaA), chrysene (Chr), benzo (b) fluoranthene (BbF), benzo (k) fluoranthene (BkF), benzo (a) pyrene (BaP), indeno (1,2,3-cd) pyrene (InP), dibenz (a,h) anthracene (DbA) and benzo (g,h,i) perylene (BP).

2.3. Quality Assurance and Control

The analyses were performed in accordance with the technical specifications of the US EPA. Data were acquired in single-ion monitoring mode (SIM) and quantified using the internal standard method. For qualitative analysis, compounds were matched using the retention times and ion mass fragments of standard mixtures of PAHs from the National Institute of Standards and Technology (NIST). Calibration curves were created based on the response factors of certain PAH species in the standard solution versus phenanthrene-d10, the internal standard used to quantify the individual PAH species. A standard mixture of 16 PAHs was diluted to six concentrations and analyzed by GC/MS using the same procedure. The mean extraction recoveries for the PM2.5 surrogates varied from 83.3 to 100.3%. The field and laboratory blanks were treated in parallel with the particulate matter samples during sampling, storage and chemical analysis. The blank levels were subtracted to obtain the reported PAH concentrations in the PM2.5.

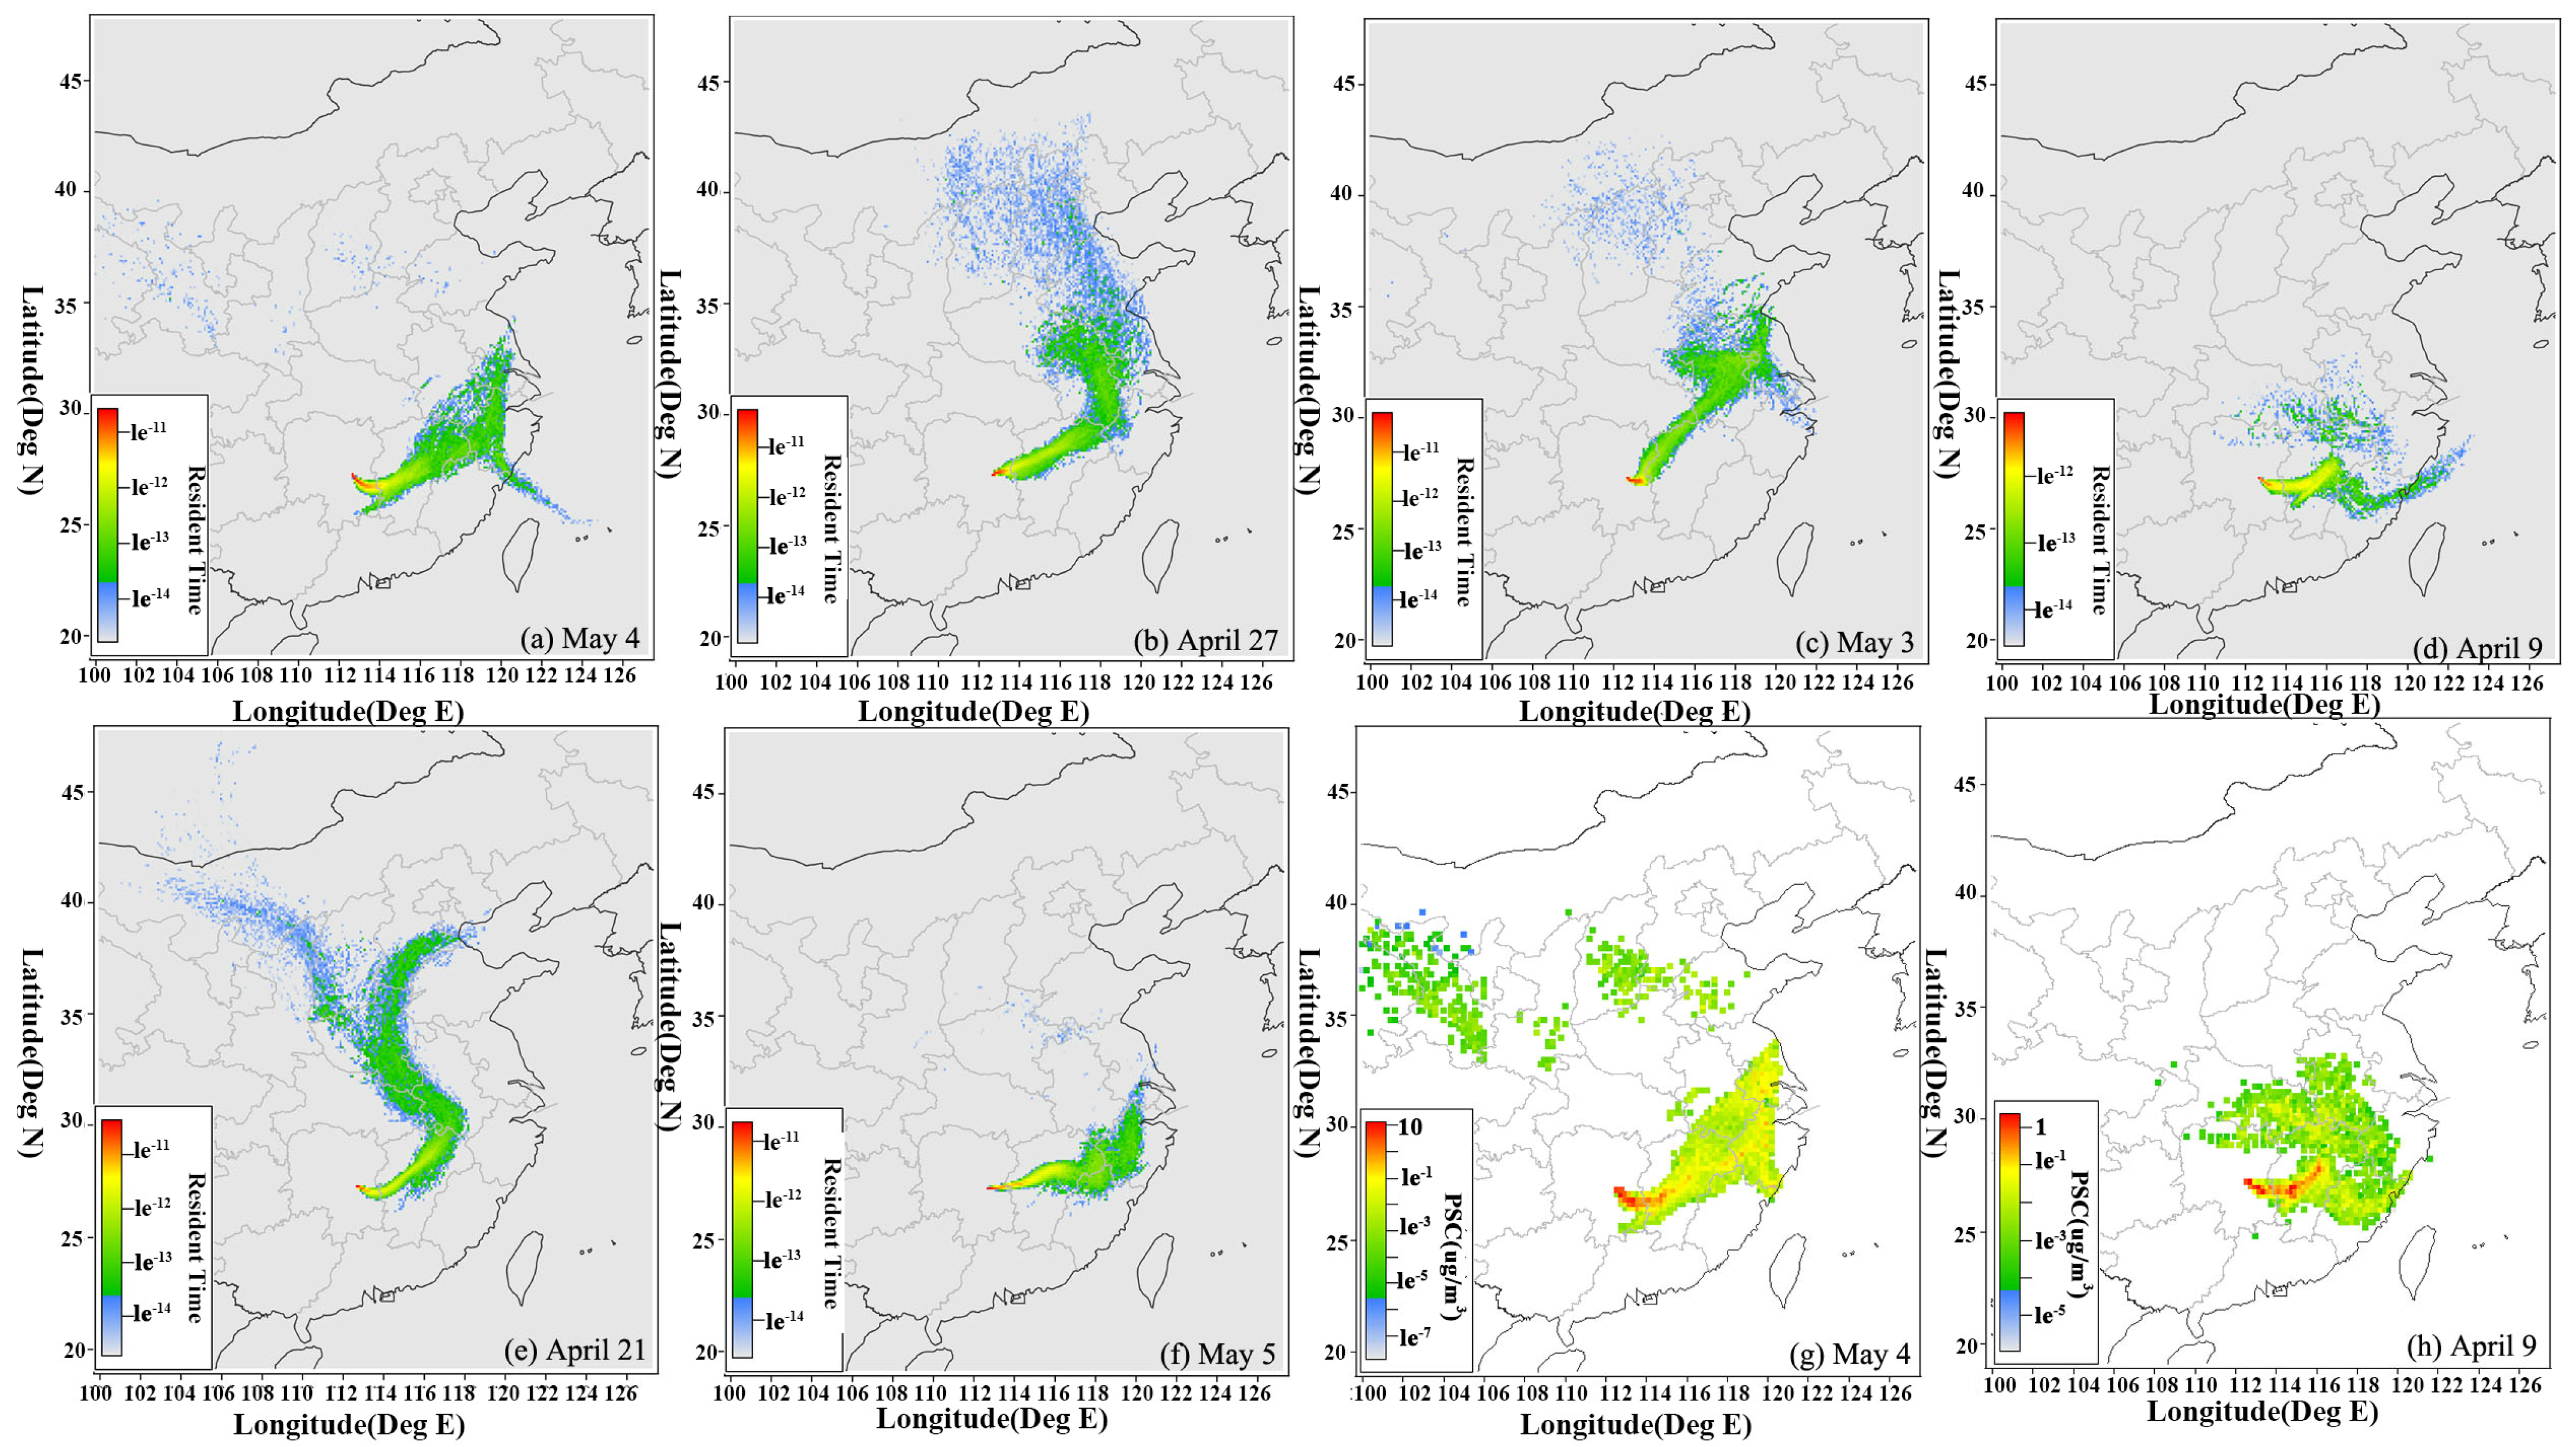
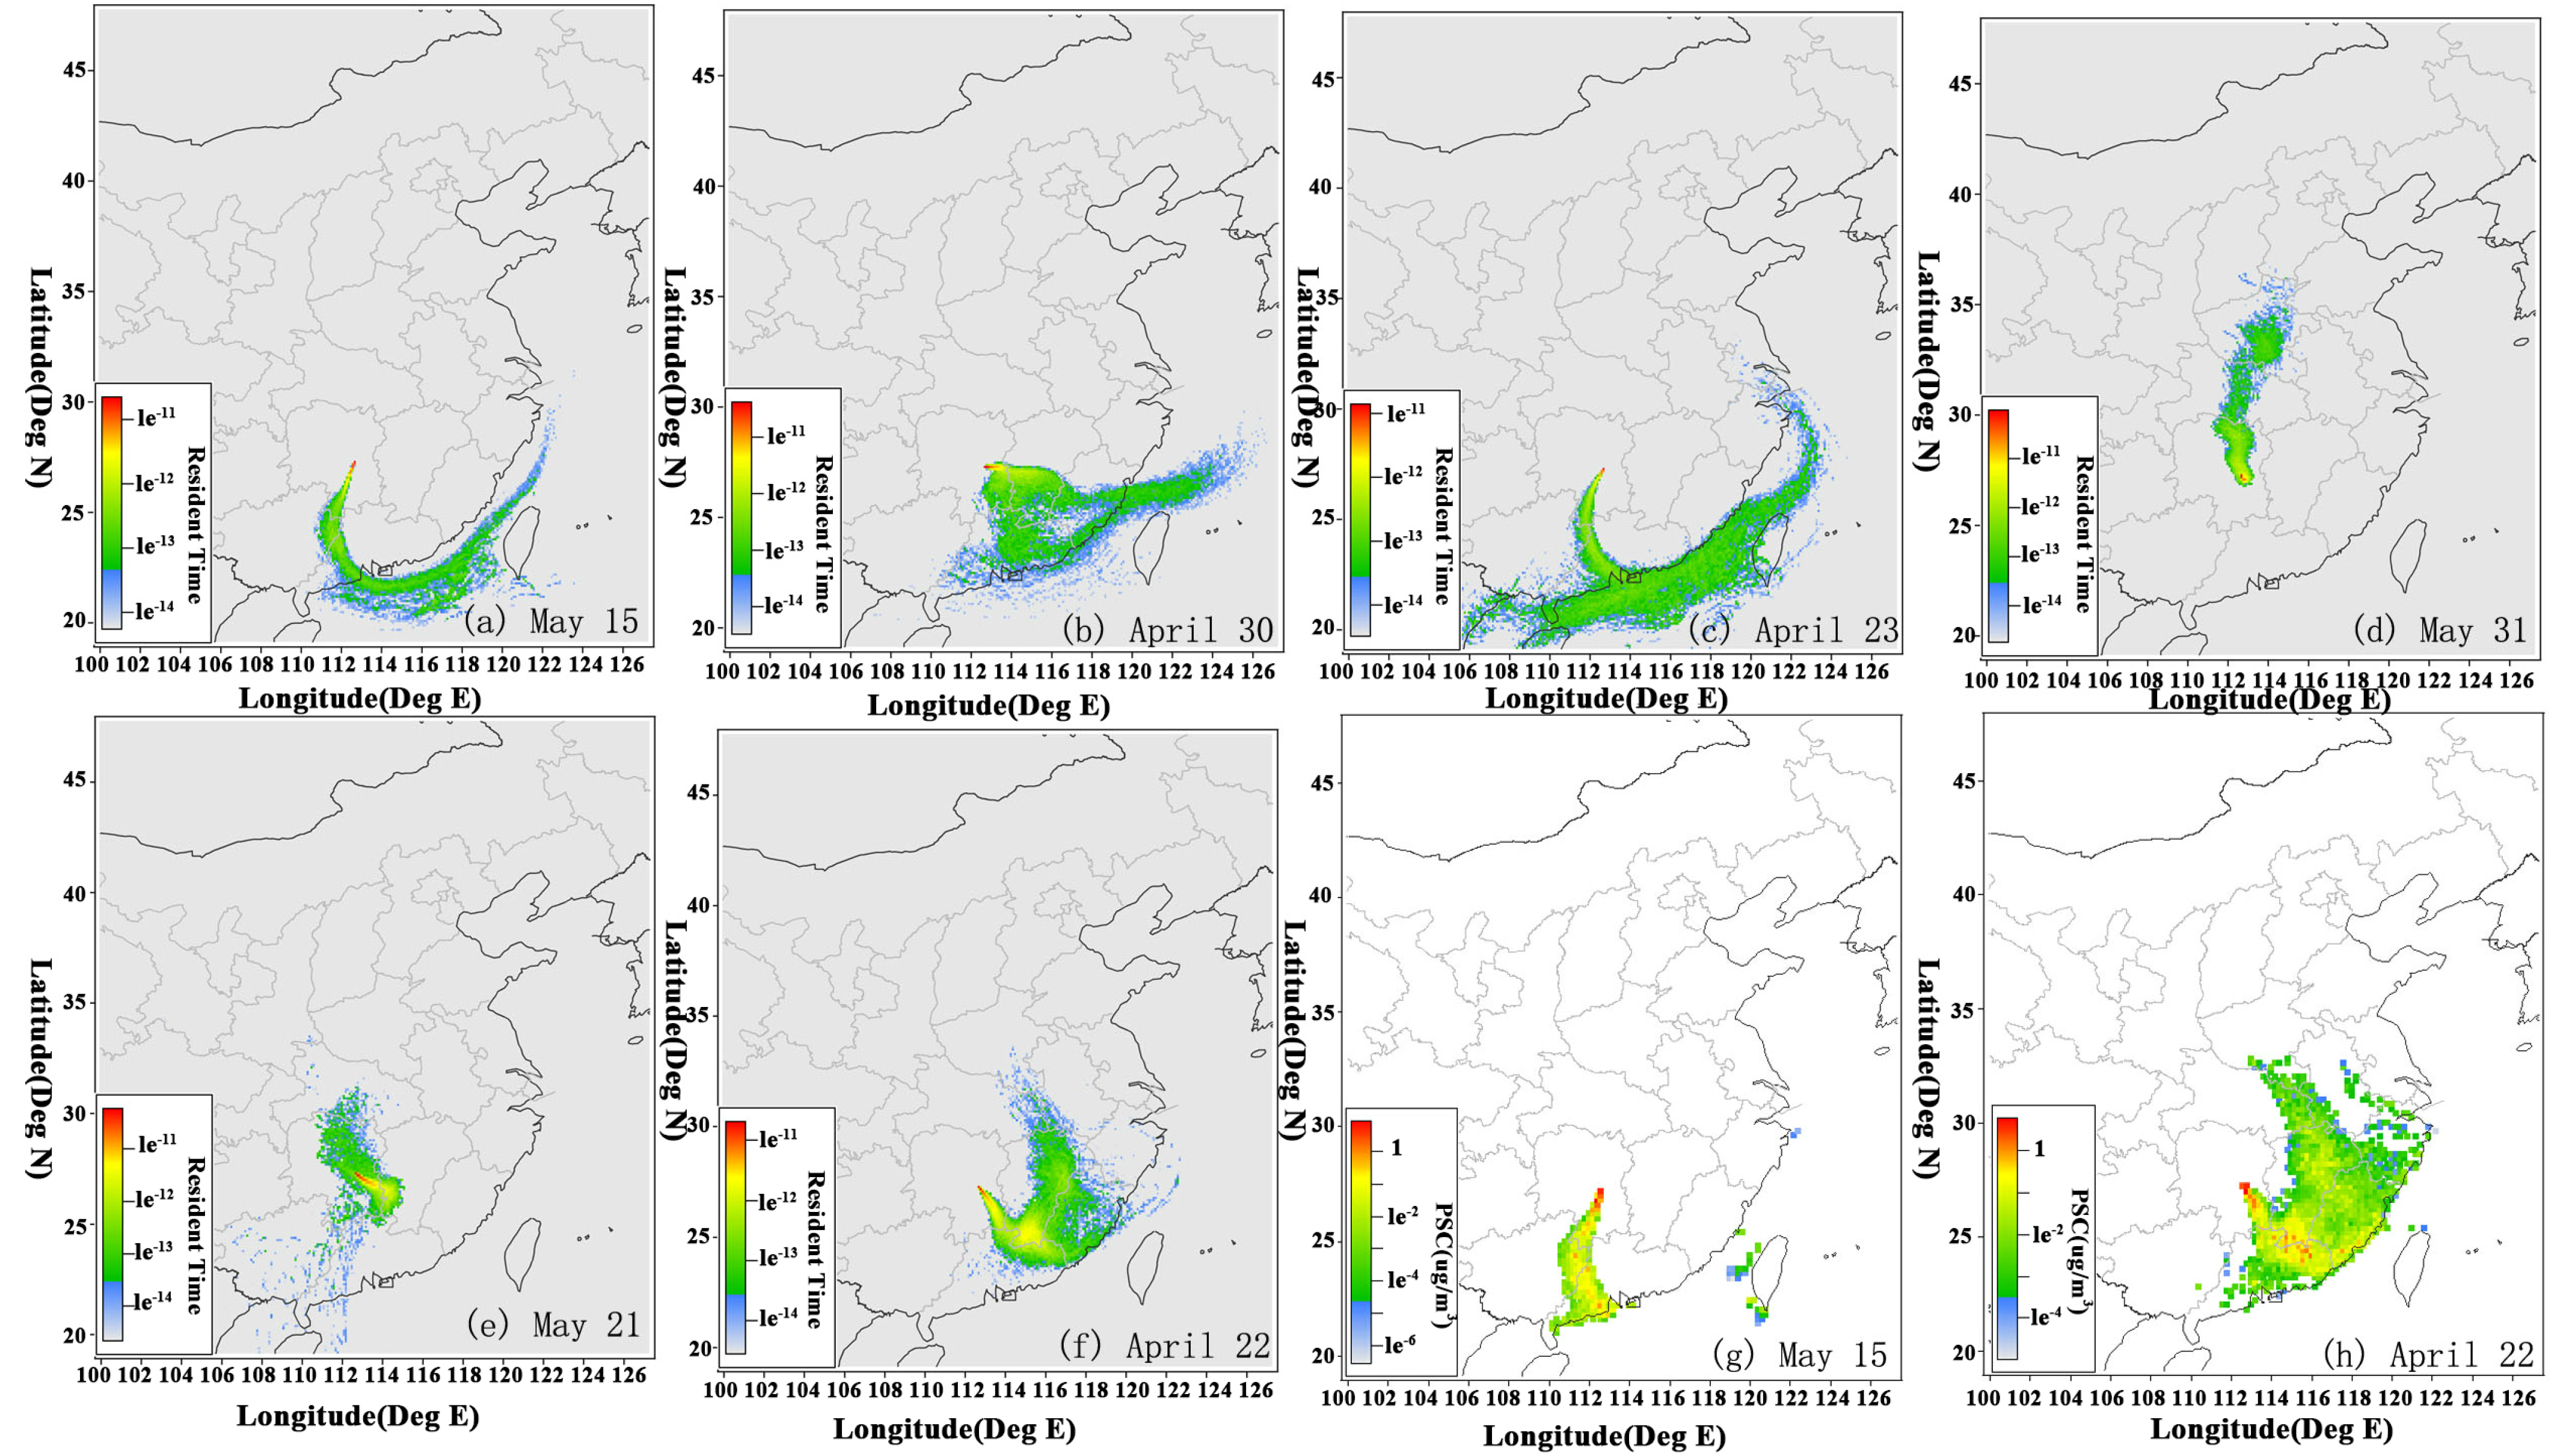
2.4. Modeling Tools and Methodology

In this study, a Lagrangian dispersion model, the hybrid single-particle Lagrangian integrated trajectory (HYSPLIT) model, was used to simulate transport and dispersion [23]. The positions of the particles were calculated based on the mean wind and turbulence transport components after their release at a receptor for backward runs [24]. Detailed information regarding this model was presented by Draxler and Hess [23] and Draxler [25]. This model was used to conduct hourly backward simulations of particle dispersion to calculate the potential source contributions (PSCs) of PM2.5 (i.e., the sources that contribute to the simulated mixing ratios at the receptor) based on the methods used by various authors [24,26,27,28]. In addition, PM2.5 was the carrier of the PAHs detected in this study and was emitted from the same potential sources. Here, the word “potential” indicates that this calculation was based on transport alone [29] and that the generation of secondary organic aerosols was not considered as a factor during transport. We calculated the residence time at an altitude of 0–100 m to obtain a “footprint” of the retroplume of the released air particles, which represented the probability distribution or residence time of a simulated air mass based on the method developed by Stohl et al. [29,30]. The gridded contributions of PM2.5 (i.e., the PSCs) to an observed air mass were calculated by multiplying the emission rate by the footprint retroplume with an emissions inventory [24] at a spatial resolution of 0.1° latitude and 0.1° longitude. The LPDM (Lagrangian Particle Dispersion Model) was developed on a horizontal grid of 0.1° × 0.1° (latitude and longitude) and was fully capable of representing the regional transport of air pollutants to the Mount Heng region. An updated PM2.5 emissions inventory (INTEX_B; 2006) was used to calculate the PSCs of PM2.5 [31] at a horizontal resolution of 0.2° × 0.2° (latitude and longitude) over China. Emissions may not significantly vary from year to year, and the same inventory was applied in this study. Details regarding the application of the LPDM were presented by Ding et al. [24].

3. Results and Discussion

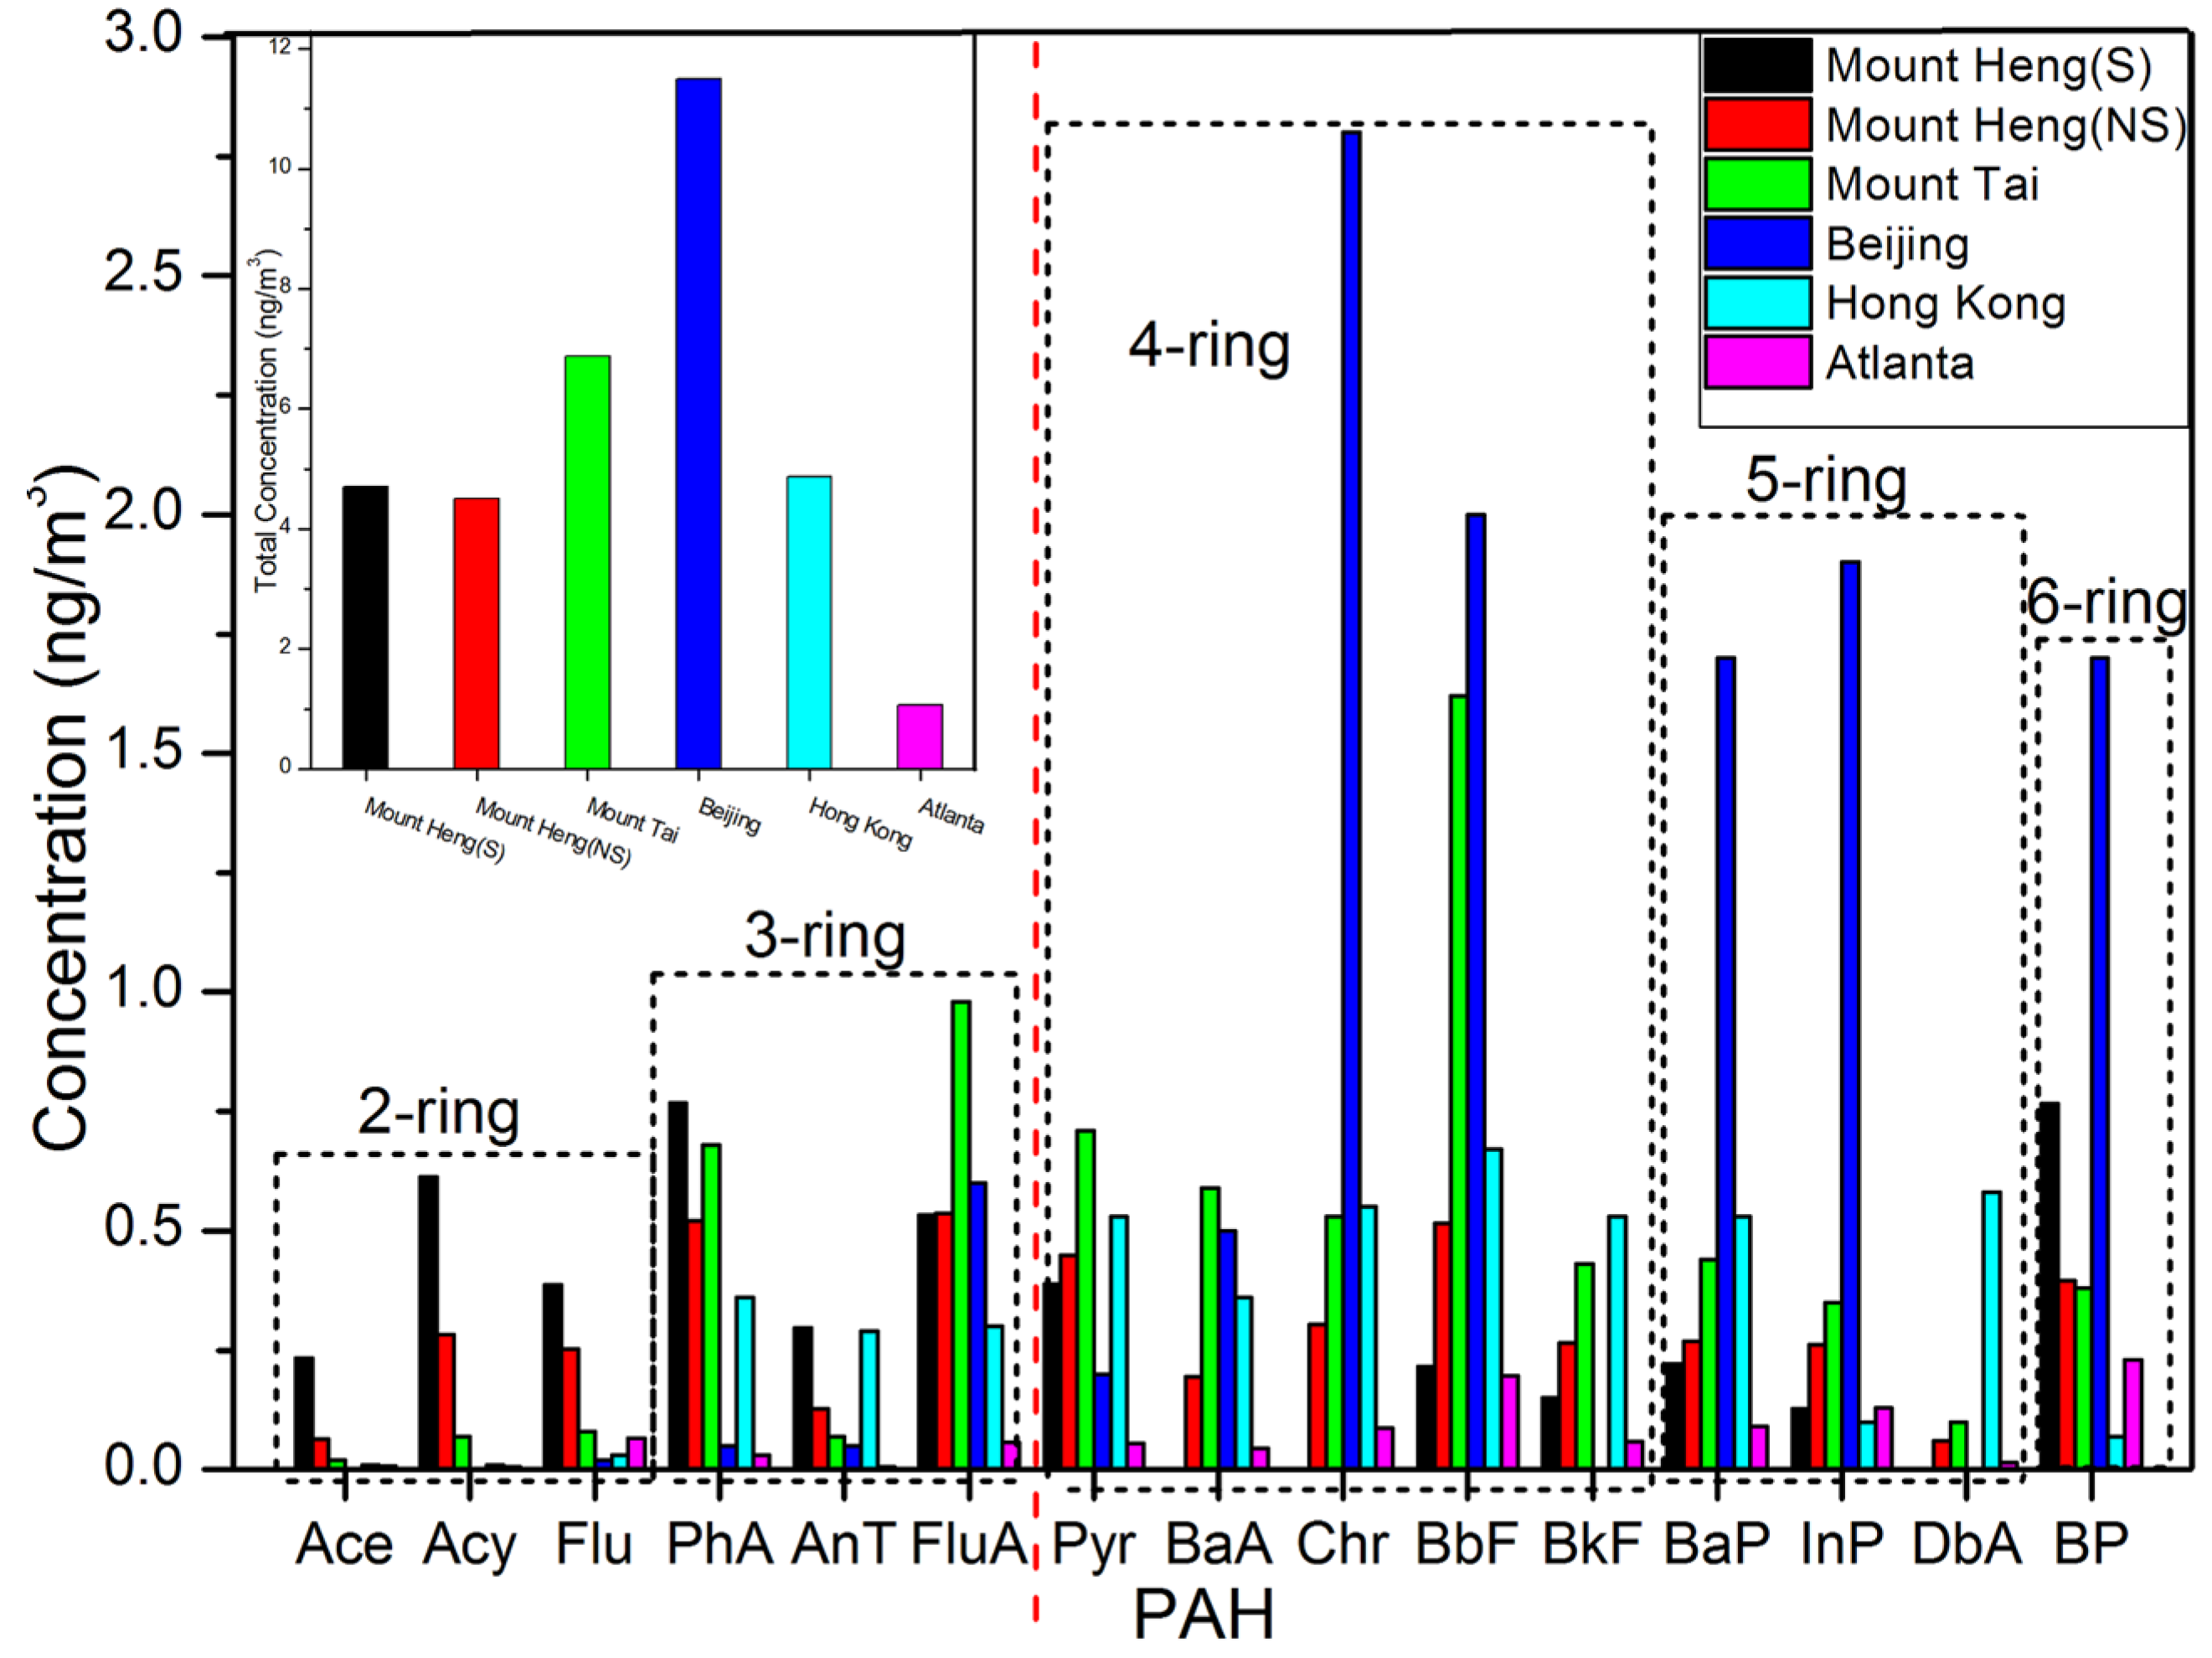
3.1. PM2.5 and PAH Concentrations and Distributions at Mount Heng

Figure 2 shows the daily PM2.5 levels measured at Mount Heng during the spring of 2009. When the sandstorm struck Mount Heng on 25 and 26 April 2009, the PM2.5 concentration ranged from 86.65 to 212.66 μg/m3 with a mean concentration of 156.61 μg/m3. In the absence of a sandstorm, the PM2.5 concentration ranged from 32.69 µg/m3 to 92.50 μg/m3 with a mean of 58.50 μg/m3. The average mass concentrations measured at Mount Heng were greater than those measured at Mount Tai, with a mean concentration of 42.24 μg/m3 in the autumn-winter of 2008 [22]. When the sandstorm struck Mount Heng, the PM2.5 concentration rapidly increased, indicating that the sandstorm largely affected the air quality.
Figure 2. PM2.5 and total daily PAH levels measured at Mount Heng.
Atmosphere 06 01633 g002
Table 1. Concentrations of the individual polycyclic aromatic hydrocarbons (PAHs) during the sandstorm (25 and 26 April 2009) and under normal conditions (no sandstorm) (µg/g).
PAHSandstormNo Sandstorm
MaxMinAverageStdevMaxMinAverageStdev
Ace1.91.141.520.32.390.31.140.58
Acy6.462.183.991.4934.911.325.25.65
Flu4.821.492.721.2630.040.674.584.81
PhA9.853.425.352.3331.691.529.596.46
AnT3.160.822.0518.120.822.241.48
FluA5.871.683.541.4771.21ND9.7414.44
Pyr5.061.222.651.3561.91ND8.1711.85
BaANDNDNDND31.08ND3.486.95
ChrNDNDNDND57.07ND5.4210.34
BbF3.6ND1.191.8482.76ND9.1415.66
BkF3.14ND0.791.3222.67ND4.645.21
BaP3.89ND1.211.8827.6ND4.766.21
InP2.47ND0.681.0937.65ND4.717.55
DbANDNDNDND12.96ND1.062.3
BP6.63.75.020.9954.01ND6.9210.2
SUM56.8315.6430.716.31566.084.6380.8109.7
ND: not detected.
The mass concentrations of the individual PAH species under the influence of the sandstorm at Mount Heng are shown in Table 1. When the sandstorm struck Mount Heng, the total PAH mass concentrations in PM2.5 ranged from 15.64 to 56.83 µg/g with a mean concentration of 30.70 µg/g. In addition, PhA was the predominant compound (5.35 µg/g), followed by BP, Acy and Pyr, which contributed nearly 60% to the total concentration during the sandstorm. Under normal conditions, the total PAH mass concentration ranged from 4.63 to 566.08 µg/g with a mean of approximately 80.15 µg/g; this variation is large and resulted from the varying meteorological conditions and emissions sources during the sampling campaign. The most abundant PAH species observed were FluA, PhA, BbF, and Pyr, which accounted for nearly 50% of the total.
Figure 3 compares the published data on PAH concentrations in PM2.5 with the values observed at Mount Heng. The volume concentrations of the total PAHs in PM2.5 were comparable under sandstorm (4.70 ng/m3) and normal (4.50 ng/m3) conditions, as shown in the top left corner of Figure 3. The total PAH concentrations at Mount Heng were much greater than those reported in southwestern urban Atlanta [3] and were generally lower than those reported at Mount Tai [22] in northern China and in the city of Beijing [15]. However, these values were comparable to the mean concentrations reported in Hong Kong [32]. In this study, PAHs with 2–6 rings were measured. Figure 3 shows that the concentrations of the 2- and 3-ring PAHs were generally higher at Mount Heng than at Mount Tai [22], except for FluA. The 6-ring PAH concentrations were comparable to the values reported at Mount Tai [22] and were much higher than those in Hong Kong [32] and Atlanta [3] under normal (no sandstorm) conditions. The concentrations of 4- and 5-ring PAHs were lower than those at the other sites, except Atlanta. In this study, 2–6 ring PAHs displayed the same distributions during the sandstorm as the 2-, 3- and 6-ring PAHs, which had greater concentrations. However, the 4- and 5-ring PAHs had lower concentrations than at the other sampling sites, and the overall PAH contamination at Mount Heng was low to medium.
Figure 3. Average concentrations of PAHs in PM2.5 at Mount Heng and other sites (S: sandstorm, NS: no sandstorm).
Atmosphere 06 01633 g003
In terms of mass concentrations, PAHs with three and six rings were the predominant compounds, accounting for 51.5% of the total under normal conditions and 66.8% during the sandstorm. In contrast, the mass concentrations of PAHs were generally lower during the sandstorm, as shown in Figure 2. The potentially carcinogenic PAHs, particularly BaA, BbF, BkF, BaP, InP and DbA (four and five rings) (according to the International Agency for Research on Cancer (IARC), were present at high concentrations and accounted for 12.0% of the total at Mount Heng.
As shown in Figure 2, the mass concentrations of PAHs were generally lower during the sandstorm. When the sandstorm struck the site on 25 and 26 April 2009, the PM2.5 volume concentrations were much greater, whereas the total PAHs were present at lower mass concentrations. Six samples were collected at various times, and the concentration profiles of the 15 PAH species and the corresponding PM2.5 levels and ring distributions are shown in Figure 3. The average daily concentrations of the individual PAH species were all higher on 26 April than on 25 April 2009, except for BaA, Chr, BbF, BkF, BaP, InP and DbA, which were below the detection limit. The concentration of Acy was greater during the night than during the day, whereas the total PAHs were present at comparable levels. Acy is generally emitted from cement [33], diesel vehicle emissions [34,35] and combustion sources [36]. As shown in Figure 3, the concentrations of the 2-ring PAHs were greater during the night than during the day. On 26 April 2009, four particle samples were collected, and the concentrations of PhA and Flu were higher in the particulate sample collected between 12:50 and 16:34. PhA primarily results from incomplete combustion and the pyrolysis of fuels [34], and Flu results from diesel and gasoline vehicle emissions, general combustion, industrial oil burning and coal combustion [33,34,35]. These sources are consistent with the findings presented in the third section. During nighttime, the 2-ring PAH concentrations were higher and equaled those on 25 April 2009. Therefore, we can conclude that the 2-ring PAH concentrations increased due to their volatility when the temperature fell at night. Furthermore, PAHs with five aromatic rings were not detected on 26 April 2009, but contributed 16.08% and 12.97% of the total on 25 April 2009.
During the sandstorm, BaA, Chr and DbA were not detected in the samples, as shown in Table 1. In general, BaA originates from the steel industry [33], and Chr primarily originates from gasoline vehicle emissions [34,35] and industrial oil burning [33,35]. Thus, the steel industry and gasoline-powered vehicles potentially did not contribute to the PAH concentrations under sandstorm conditions, which is supported by the diagnostic ratio analysis of PAHs in the third section.

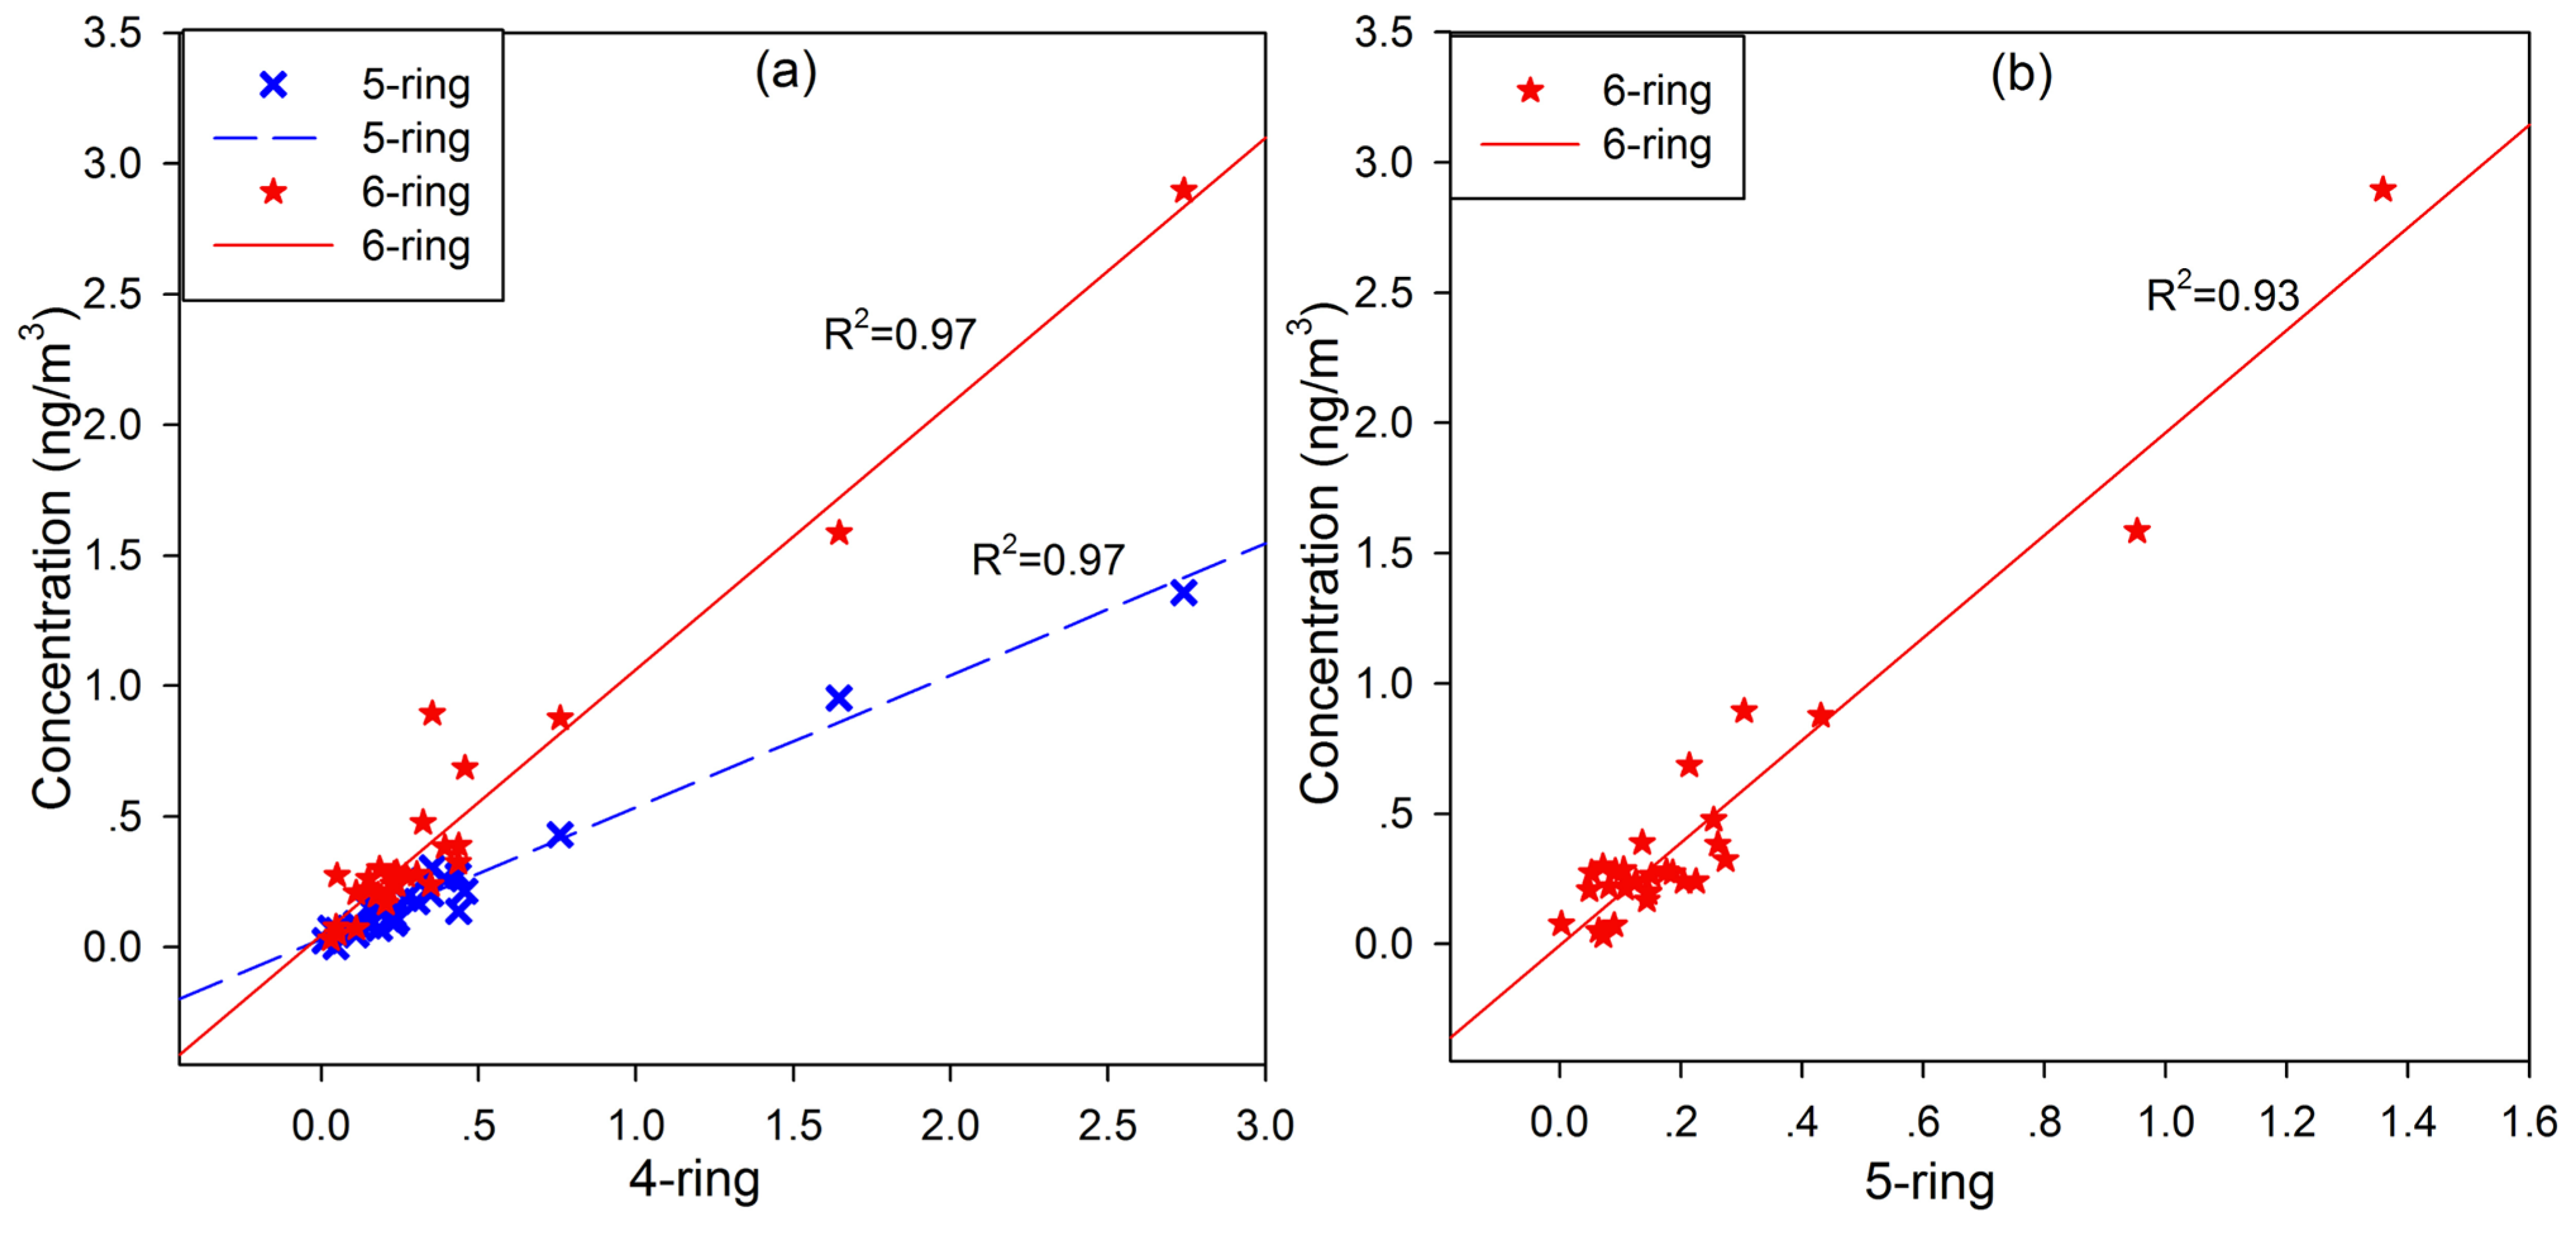
3.2. Diagnostic Ratio Analysis of PAHs

As indicated above, emission sources were estimated based on specific pollutants, and diagnostic ratios were analyzed to clarify their dominant sources. Due to high volatility of 2–3-ring PAHs, only 4–6-ring PAHs were used for source identification in this study. Linear regression analyses were conducted between various aromatic PAH concentrations to estimate their emission sources, as shown in Figure 4. Based on Figure 4a,b, the concentrations of 4-, 5- and 6-ring PAHs were strongly correlated with each other (R2 = 0.97, 0.97 and 0.93, respectively). These good correlations indicate that HMW (4-, 5- and 6-ring) PAHs could be emitted from sources that are similar and distinct from those of the 2-ring PAHs. Portions of the PAHs with three and four aromatic rings resulted from similar emissions sources with a similar transport pathway.
Figure 4. (a) Relationships between the 4-ring PAH concentrations and those of 5- and 6-ring PAHs; (b) relationship between the concentrations of the 5- and 6-ring PAHs.
Atmosphere 06 01633 g004
The concentrations of certain individual marker PAHs and their ratios have been widely used as indicators to identify PAH sources [8,22,37,38,39,40,41]. Common diagnostic ratios of LMW (low molecular weight, 2-3-ring PAHs)/HMW (4-6-ring PAHs), BaA/(BaA + Chr) and InP/(InP + BP) were calculated in this study for source evaluation. LMW/HMW ratios of less than 1.0 indicate pyrogenic sources that include incomplete combustion of fossil fuels or wood [42,43,44], and LMW/HMW ratios greater than 1.0 (indicating petrogenic sources) include refined oil or petroleum products [44]. In this study, the LMW/HMW ratios ranged from 0.45 to 8.93, which implies that pyrogenic and petrogenic sources contributed to the contamination at the site. PAH isomer pairs with similar molecular weights are further investigated to distinguish between petrogenic and pyrogenic sources. The LMW/HMW ratios were plotted against the BaA/(BaA + Chr) and InP/(InP + BP) ratios to identify the emission sources affecting Mount Heng, as shown in Figure 5. The BaA/(BaA + Chr) ratio has been used to indicate dominant fossil fuel emissions sources [15]. Petroleum combustion dominates PAH profiles when the BaA/(BaA + Chr) ratio is less than 0.2, a ratio between 0.20 and 0.35 results from a mixture of petroleum and coal combustions, and a ratio higher than 0.35 primarily result from coal combustion [8,44]. In this study, according to Figure 5a, most of the ratios are concentrated near 0.35, indicating that the dominant source was petroleum or coal combustion. The BaA and Chr concentrations were below the detection limit; thus, their ratios were not analyzed during the sandstorm. Furthermore, InP/(InP + BP) ratios smaller than 0.2 suggest a petroleum source, and this ratio ranged from 0.2 to 0.5, indicative of petroleum combustion; if this ratio is greater than 0.5, combustion of biomass, including grass, wood and coal, is inferred [8,45]. At Mount Heng, the main sources were petroleum combustion (according to Figure 5b).
The PAH compositional ratios presented above indicate that the dominant PAH sources affecting Mount Heng were coal, wood and petroleum combustion. As indicated in the correlation analysis, PAHs with 4, 5 and 6 rings were emitted from the same sources based on the correlation analysis, and the ratios of (BaA + Chr) and InP/(InP + BP) confirmed that these PAHs primarily resulted from the combustion of petroleum. No large differences were attributed to the sandstorm.
Figure 5. The ratios of LMW/HMW PAHs versus the ratios of BaA/(BaA + Chr) (a) and InP/(InP + BP) (b) in PM2.5 for source identification.
Atmosphere 06 01633 g005

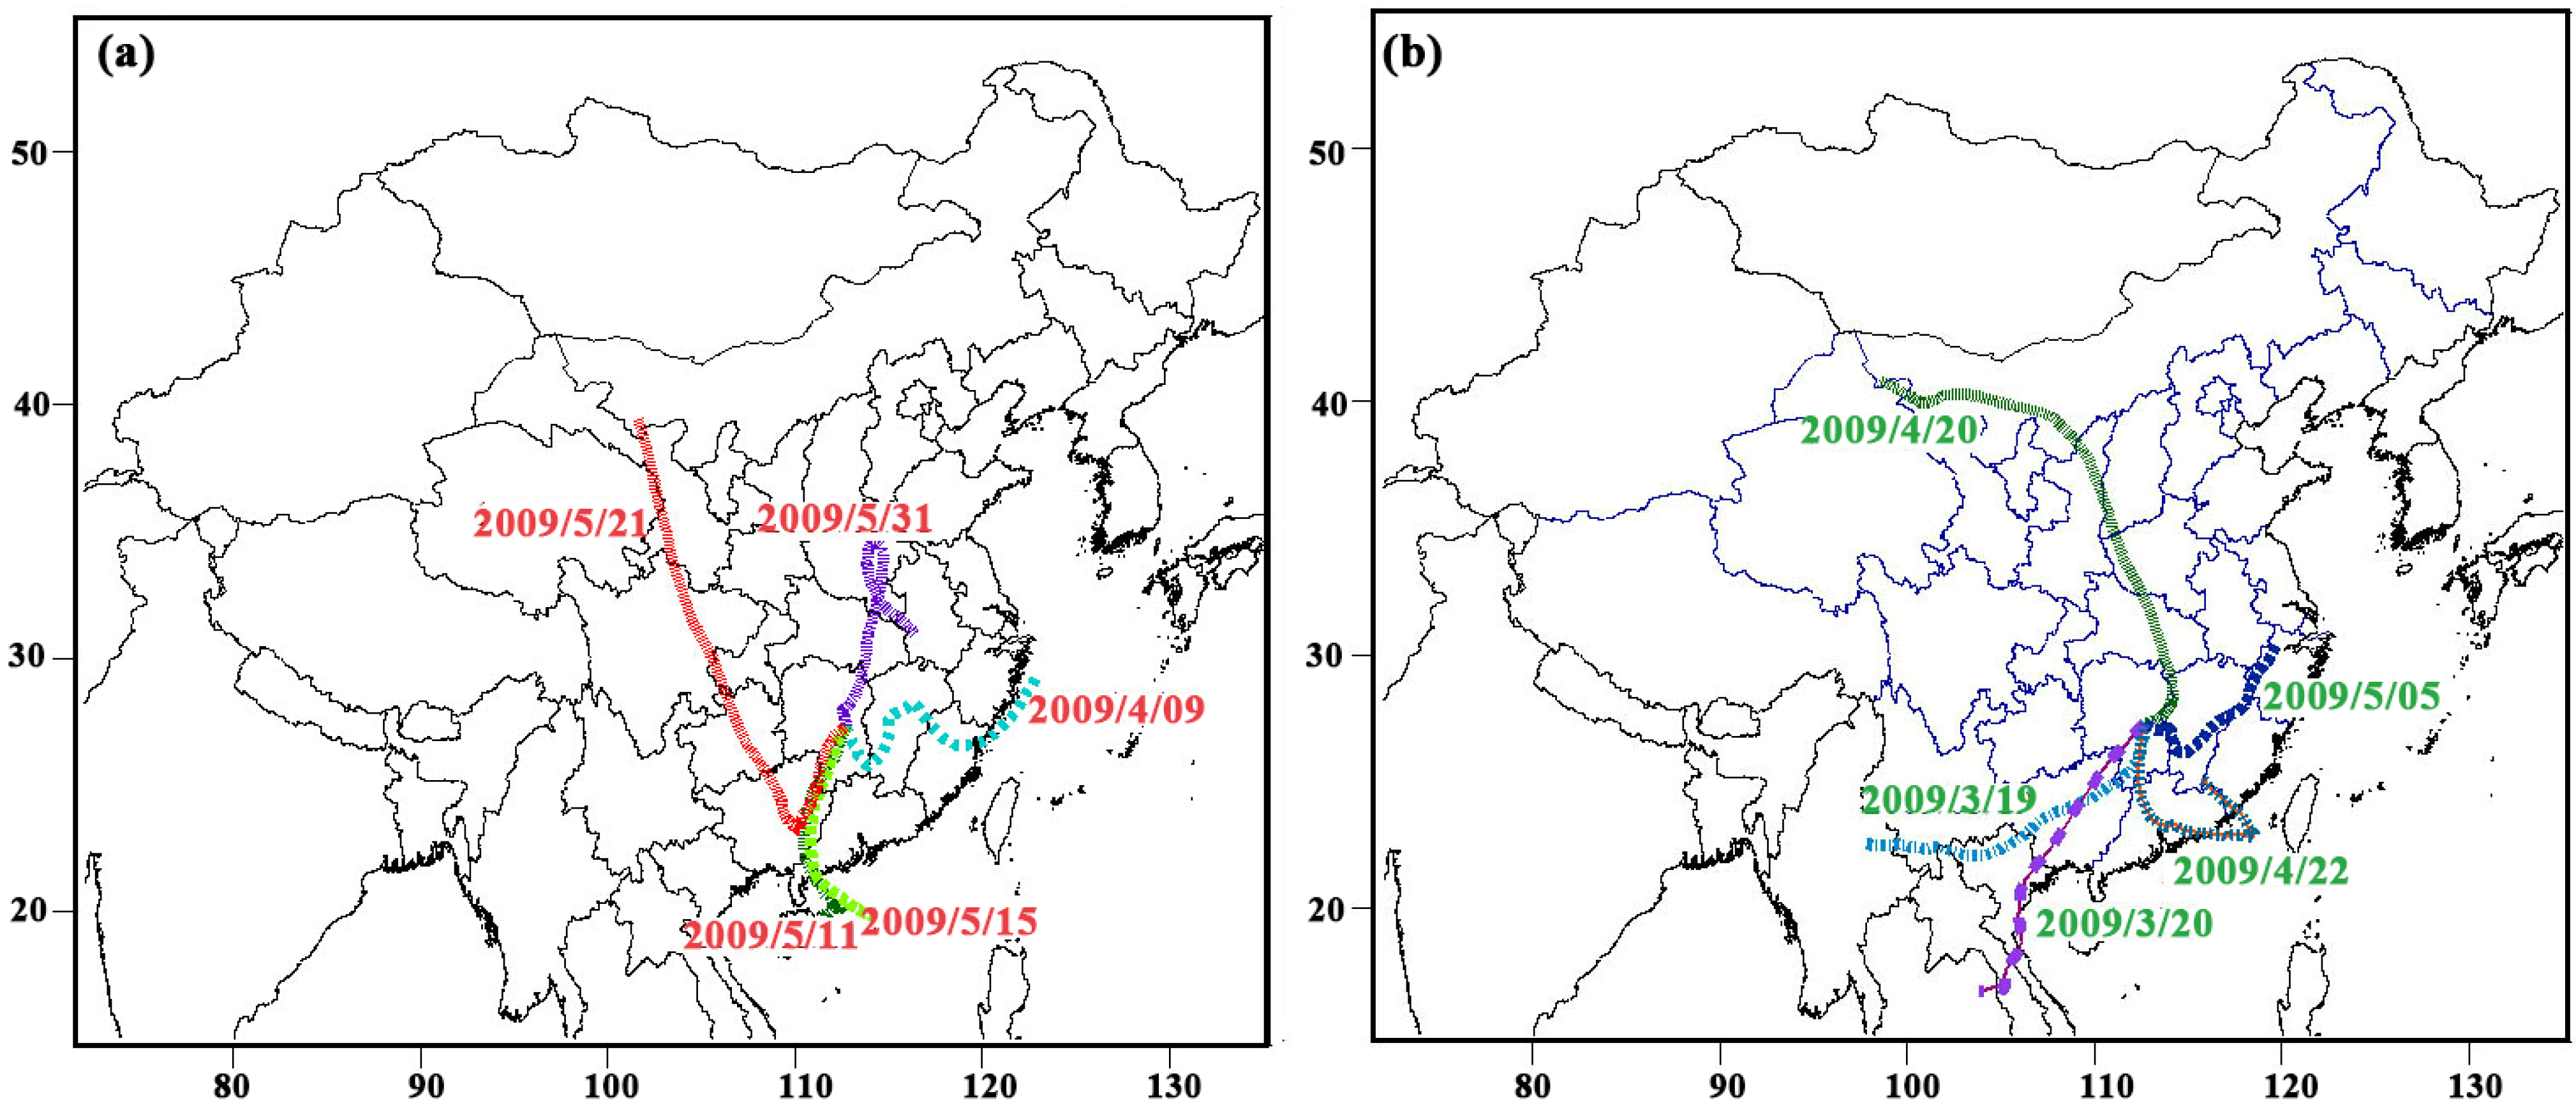
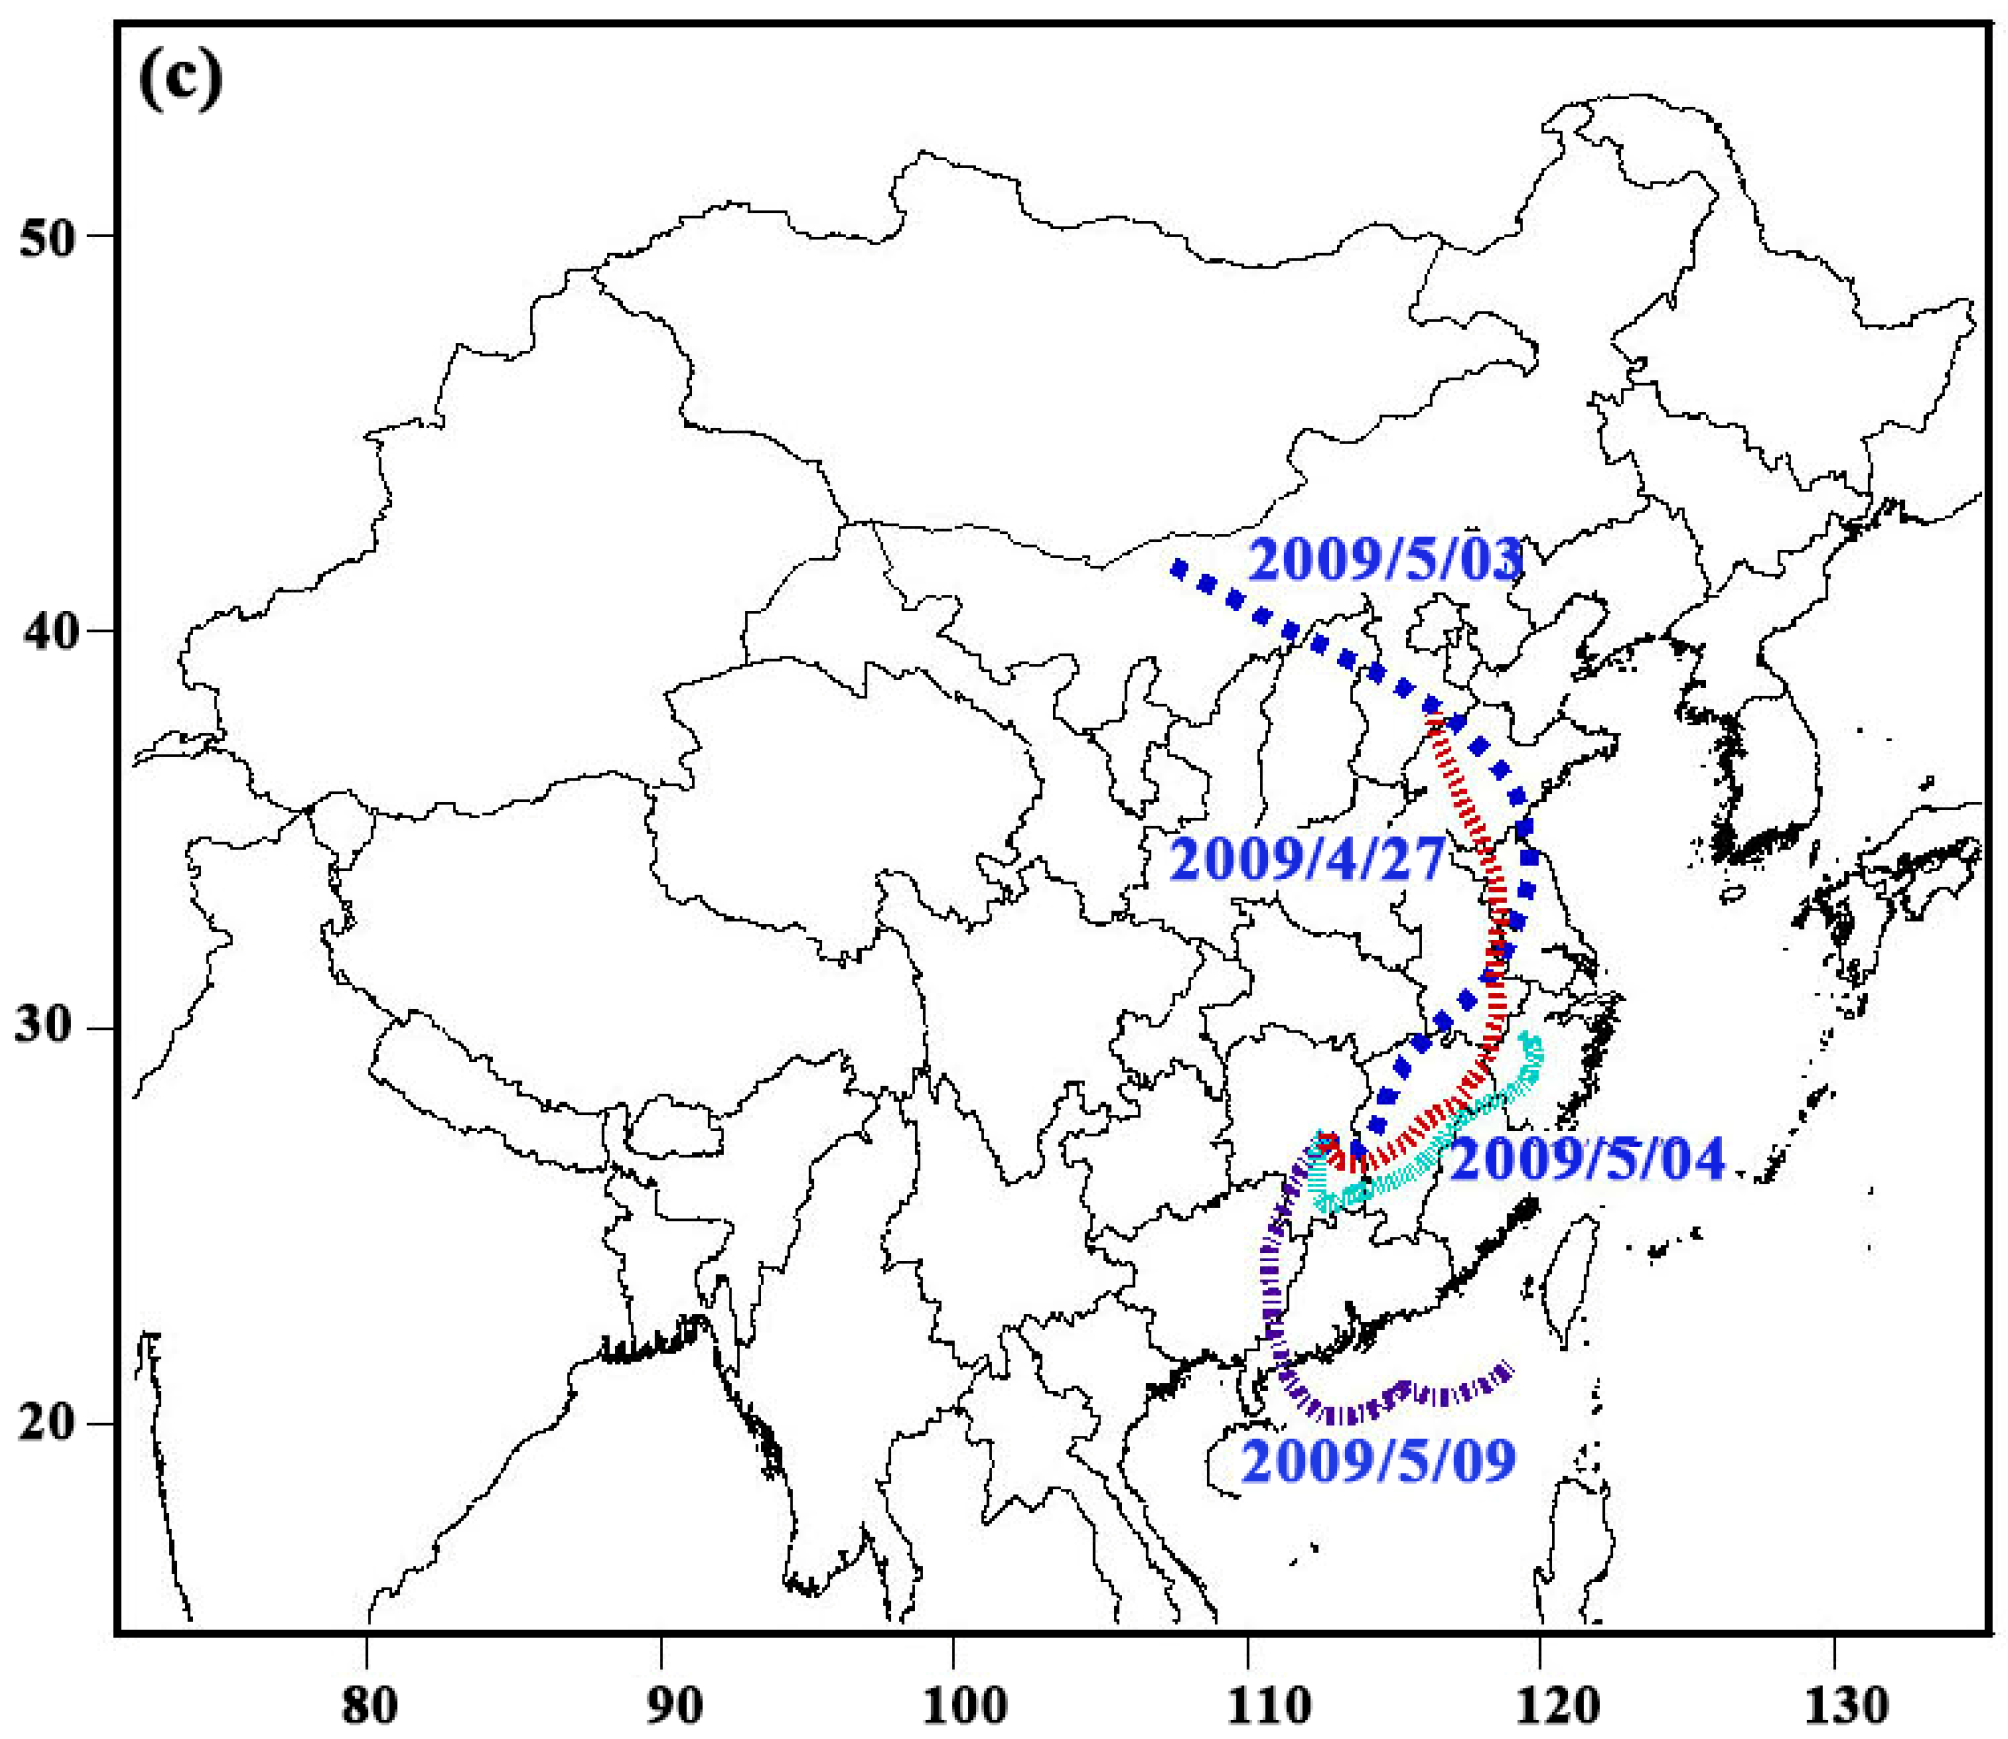
3.3. Implications of Long-Range Transport for Air Pollution

A ratio analysis was used to estimate the ages of the air masses. Generally, BaA is degraded more easily and rapidly than its isomer Chr during transport due to the higher reactivity of the former species [21,46,47,48]. The ratios of more-reactive to less-reactive PAHs can be used to estimate whether an air mass is fresh or aged [21]. A higher ratio (>0.7) indicates that the air mass underwent relatively little photochemical processing and that the major pollutants were from local emissions, whereas a lower ratio suggests that the PAHs were primarily from long-range transport. The ratios of BaA/Chr were calculated in this study. During the sandstorm, the BaA and Chr concentrations were below the detection limit, which suggests that the air masses were relatively aged. Under normal (no sandstorm) conditions, most of the ratios were below 0.70. Therefore, the sampled air masses primarily resulted from remote emissions sources.
Pollutants emitted from distant regions in the free troposphere can travel long distances and strongly influence variations in pollutant concentrations [49]. Under normal conditions, the PAH concentrations varied greatly, and several special samples were analyzed to determine their LMW (∑2–3 ring) and HMW (∑4–6 ring) PAH concentrations. The backward trajectories of the air masses were calculated using an online version of the HYSPLIT (Hybrid Single Particle Lagrangian Integrated Trajectory) model from the NOAA (National Oceanic and Atmospheric Administration) Resources Laboratory, as shown in Figure A1. The total concentrations of the LMW and HMW PAHs in the PM2.5 were calculated. The concentrations of the LMW PAHs were 4–8 times greater than those of the HMW PAHs on 21, 31, 15 and 11 May and 9 April 2009. In particular, the 2-ring PAH concentrations were higher and accounted for 52.6% of the total PAHs on 9 April 2009. The concentrations of the HMW PAHs were approximately equal to the concentrations of the LMW PAHs on 19 and 20 March 2009, 20 and 22 April 2009 and 5 May 2009. The concentrations of the LMW PAHs were approximately 50% of the HMW PAHs on 27 April and 3, 4 and 9 May 2009, These variations were potentially caused by differences in sources and air mass transport. On 9 April 2009, the particle samples were collected before a rainstorm, and the air masses were traveling from the sea to the east. The samples collected between 11 May and 15 May 2009 were collected before rainy or foggy weather. Therefore, the higher LMW PAH concentrations on these days were potentially linked to the meteorological conditions. The air masses associated with higher HMW concentrations primarily traveled from eastern coastal cities (e.g., Shanghai, Shandong, and Guangdong Province), including two of China’s main industrial regions in southern China, one centered in Shanghai and the other centered near Guangzhou. Thus, the higher HMW concentrations resulted from the transport of pollutants to the site, and the air mass that traveled from the south on 9 May 2009 had been impacted by a non-ferrous metal smelting plant in Hunan Province, which also contributed to the higher concentrations. The LMW concentrations were approximately equal to (or slightly higher than) the HMW concentrations and originated from three sources near coastal areas. On 4 May 2009, the total PAH concentrations were the highest, with the corresponding air masses originating in Shanghai three days earlier. In addition, many nearby factories also contributed to the PAH concentrations. Most of the PAH species collected on 4 May 2009 had undergone little photochemical processing, which explains their higher total concentrations. The LMW PAH concentrations were all higher than the HMW PAH concentrations during the sandstorm.
Based on the observed ratios (BaA/Chr), the PAH concentrations were primarily affected by emissions located far from the site and by some local sources. Figure 6a–h show the footprint retroplumes (residence times) and PSCs of the PM2.5 samples collected on 25 and 26 April 2009. In the simulation, particle transport was simulated backwards in time over a 72-hour period.
Figure 6. Illustrations of three-day backward retroplumes and potential source contributions (PSCs) during the sandstorm. (af) Map of the “footprint” (i.e., 100 m) retroplume (residence time) and (gh) maps of the PSCs of PM2.5 (PAHs) at Mount Heng.
Atmosphere 06 01633 g006
The residence times at an altitude of 100 m were calculated to obtain the “footprint” retroplumes of released air particles in Figure 6a–f during the sandstorm, which represent the distribution of probability or the residence time of a simulated air mass [29,30]. The longer residence time (red and yellow colors in the figure) indicates a higher probability of influence on the sampling site. In addition, PM2.5 was the primary vehicle for PAHs and was assumed to originate from the same sources discussed in this study. The air masses all originated in northern China and carried the pollutants to the site during the sandstorm. The nighttime samples collected on 26 April 2009 (Figure 6h) displayed the lowest probability influence from the surroundings. The PM2.5 concentrations in the samples on 26 April 2009 (12:50–16:30) were lower than those in the other samples collected during the sandstorm (as shown in Figure 2), which is consistent with the results of the residence time.
In addition, the PSCs of the PAHs were also calculated (Figure 6g–h) in this study. Air pollutants from northern China, including eastern Mongolia, could be transported to Mount Heng within three days, and significant source contributions in several regions were present along the route on 26 April 2009, including central eastern Hunan Province, northwestern Jiangxi Province and the nearby Shandong and Shanxi Provinces in northern China (Figure 6g). In addition, high emission source contributions on 26 April 2009 (Figure 6h) occurred along a similar route with a smaller area and lower concentrations in these regions. The emission sources were primarily in northeastern Hunan Province. Therefore, the PM2.5 concentrations were higher on 25 April than on 26 April 2009 based on the PSC of the PM2.5. The average measured concentration of PM2.5 was 180.49 µg/m3 on 25 April 2009, which was greater than the concentration of 144.67 µg/m3 on 26 April 2009. This finding is consistent with the PSC results. In addition, the total PAH concentrations were higher on 25 April 2009, and most of the individual PAH concentrations were higher on 25 April than on 26 April 2009.
Figure 7. Illustrations of three-day backward retroplumes and the potential source contributions (PSCs) of higher PAH levels. (af) Map of the “footprint” (i.e., 100 m) retroplume (residence time) and (gh) maps of the PSCs of PM2.5 (PAHs) at Mount Heng.
Atmosphere 06 01633 g007
Figure 8. Illustrations of three-day backward retroplumes and potential source contributions (PSCs) of lower PAH levels. (af) Map of the “footprint” (i.e., 100 m) retroplume (residence time) and (gh) maps of the PSCs of PM2.5 (PAHs) at Mount Heng.
Atmosphere 06 01633 g008
The highest total PAH concentrations were measured on 4 May, 27 April, 3 May, 9 April, and 21 April 2009 and the lowest on 15 May, 30 April, 23 April, 31 May and 21 May 2009 in the absence of sandstorm conditions, as shown in Figure 2. Their “footprint” retroplumes (residence times) of released air particles and the PSCs of the PM2.5 (PAHs) are shown in Figure 7 and Figure 8. The air masses associated with higher concentrations evidently all originated east of the site and passed over urban areas, particularly the air mass of 4 May 2009, which is shown as a large yellow area and extends across Jiangxi Province from west to east. Therefore, the total concentration was the highest on 4 May 2009 (as shown in Figure 2), which is consistent with the simulation results. The influences of emissions from the coastal cities of eastern China were able to reach the site within three days, and the dominant pollutants traveled from eastern Hunan Province and western Jiangxi Province, as indicated by Figure 7a–h. The large amounts of pollution emitted from the coastal cities of eastern China were carried to the site via atmospheric transport and resulted in higher PM2.5 (PAH) concentrations. In contrast, to demonstrate the influences of the transport of lower concentrations, their “footprint” retroplumes (residence times) of released air particles and the PSCs of PM2.5 (PAHs) are shown in Figure 8a–h. The air masses associated with the two lowest concentrations all originated from the ocean to the south, and their corresponding areas depicted in red and yellow are clearly smaller, which indicates that almost no pollutants were carried to this site. The paths of the last three air masses (31 and 21 May, 22 April 2009) originated from near the site, which indicates that the pollutants were primarily from local emissions sources. Their concentrations were lower than those of the other samples. Therefore, the air masses originating from the ocean and carrying few pollutants resulted in lower PM2.5 (PAHs) concentrations, and the local emission sources contributed little to the pollutant concentrations. The pollutants from long-range transport contributed more to the site.
Regardless of the presence of the sandstorm, the combination of backward simulation dispersion via the PSCs of the PM2.5 (PAHs) revealed the importance of transport for the pollutant concentrations. During the sandstorm, the air masses all originated from northern China, and the distribution of the PSCs affected the PM2.5 (PAHs) concentrations. Under normal (no sandstorm) conditions, the air masses associated with higher or lower concentrations originated from the same respective directions, and their variations in route resulted in higher or lower concentrations. The higher and lower concentrations demonstrate that the atmospheric transport significantly influenced the pollutant concentrations at Mount Heng.

4. Conclusions

A study of PAHs in PM2.5 was conducted in northern China between March and May in 2009. A sandstorm from northern China struck Mount Heng on 25 and 26 April 2009 during the sampling campaign, and the sandstorm greatly affected the PM2.5 and particulate PAH concentrations. During the sandstorm, the PM2.5 levels rapidly increased to 156.61 μg/m3, whereas before or after the sandstorm, the normal value was 58.50 μg/m3. The mean mass concentration of the PAHs in PM2.5 was 30.70 μg/g, and those of BaA, Chr and DbA were below the detection limits during the sandstorm. Overall, PhA, BP, Acy and Pyr were the predominant compounds, which together accounted for approximately 60% of the total PAH concentration. The mass PAH concentration at Mount Heng varied greatly around a mean of 80.15 μg/g, and the most abundant compounds were FluA, PhA, BbF and Pyr, which accounted for nearly 50% of the total under normal (no sandstorm) conditions. The individual PAH species were present at low to medium concentrations at Mount Heng. The 4- and 5-ring PAH concentrations were lower at Mount Heng than at the other sites during the sandstorm. In addition, the 3- and 6-ring PAHs were the most abundant, accounting for 66.8% of the total PAH concentration during the sandstorm and 51.5% under normal conditions. Under normal conditions, special samples were selected for analysis of the LMW and HMW PAH concentrations. Higher LMW PAH concentrations were linked to meteorological conditions, and the higher HMW concentrations were primarily affected by the transport of pollutants.
Linear regression analyses were performed between the total PAH concentrations and the corresponding PM2.5 levels, and no clear relationship existed between these values. The relationships among the various-ring PAH concentrations suggested that 4-, 5- and 6-ring PAHs were potentially emitted from a similar source. The ratios of LMW/HMW, BaA/(BaA + Chr) and InP/(InP + BP) were used to identify the emissions sources, and indicated that the PAHs had primarily been emitted from the combustion of wood, coal or petroleum. The isomer pair of BaA/Chr suggested that most of the air masses collected at Mount Heng resulted from long-range transport. The combination of “footprint” retroplumes of released air particles (residence time) and the PSCs of the PM2.5 (PAHs) with higher and lower concentrations indicated that local emission sources had little effect on the PAH concentrations (i.e., the concentrations in the air masses that were primarily collected from local sources were much lower) and that long-range transport played a vital role in the pollutant concentrations at Mount Heng under normal conditions.

Acknowledgments

This study is based on work supported by funding from the National Natural Science Foundation of China (grants 21177073) and the China National Basic Research Program (2005CB422203). We are grateful to the Mount Heng Meteorological Station for providing access to the experimental site, to Jinan Academy of Environmental sciences (Zaifeng Wang and Houyong Zhang) for providing experimental instruments, and to AJE (American Journal Experts) for editing the paper.

Author Contributions

Minmin Yang and Yan Wang wrote the article and design the study, Qiang Liu and Aijun Ding provided the figures of resident time and PSCs. Yuhua Li helped perform the statistical analysis.

Conflicts of Interest

The authors declare no conflict of interest.

Appendix

In this appendix, concentrations of HMW (4-6 ring) and LMW (2-6 ring) PAHs were compared and the backward trajectories of the air masses collected were presented in Figure A1. The HYSPLIT model was used to calculate backward trajectories for each day. The air masses were categorized into three categories based on concentrations. Figure A1a presented the backward trajectories that the concentrations of LMW PAHs were much higher than those of HMW and the backward trajectories that concentrations of HMW PAHs were approximately equal to the concentrations of LMW PAHs were presented in Figure A1b. Backward trajectories of HMW PAH concentrations smaller than the LMW PAH concentrations were shown in Figure A1c. The aim of this section is to indicate that the potential influence on concentrations of HMW and LMW PAHs respectively, including meteorological conditions and long range transport.
Figure A1. The backward trajectories of the selected air masses based on the LMW and HMW PAH concentrations, (a) LMW » HMW, (b) LMW ≈ HMW, (c) LMW « HMW.
Atmosphere 06 01633 g009aAtmosphere 06 01633 g009b

References

  1. Wang, Y.; Hopke, P.K.; Xia, X.; Rattigan, O.V.; Chalupa, D.C.; Utell, J.E. Source apportionment of airborne particulate matter using inorganic and organic species as tracers. Atmos. Environ. 2012, 55, 525–532. [Google Scholar] [CrossRef]
  2. Pui, D.Y.H.; Chen, S.-C.; Zuo, Z. PM2.5 in China: Measurements, sources, visibility and health effects and mitigation. Particuology 2013, 13, 1–26. [Google Scholar] [CrossRef]
  3. Li, Z.; Porter, E.N.; Sjödin, A.; Needham, L.L.; Lee, S.; Russell, A.G.; Mulholland, J.A. Characterization of PM2.5 bound polycyclic aromatic hydrocarbons in Atlanta—Seasonal variations at urban, suburban, and rural ambient air monitoring sites. Atmos. Environ. 2009, 43, 4187–4193. [Google Scholar] [CrossRef]
  4. Neff, J. Polycyclic aromatic hydrocarbons in the aquatic environment and cancer risk to aquatic organisms and man. Am. Environ. Prot. Agency Rep. 1982, 600, 9–82. [Google Scholar]
  5. Bopp, S.K.; Lettieri, T. Gene regulation in the marine diatom thalassiosira pseudonana upon exposure to polycyclic aromatic hydrocarbons (PAHs). Gene 2007, 396, 293–302. [Google Scholar] [CrossRef] [PubMed]
  6. Wilhelm, M.; Ghosh, J.K.; Su, J.; Cockburn, M.; Jerrett, M.; Ritz, B. Traffic-related air toxics and preterm birth: A population-based case-control study in Los Angeles County, California. Environ. Health 2011, 10, 89–89. [Google Scholar] [CrossRef] [PubMed]
  7. Straif, K.; Baan, R.; Grosse, Y.; Secretan, B.; El Ghissassi, F.; Cogliano, V. Carcinogenicity of household solid fuel combustion and of high-temperature frying. Lancet Oncol. 2006, 7, 977–978. [Google Scholar] [CrossRef]
  8. Yunker, M.B.; Macdonald, R.W.; Vingarzan, R.; Mitchell, R.H.; Goyette, D.; Sylvestre, S.; Mitchelld, D. PAHs in the Fraser River basin: A critical appraisal of PAH ratios as indicators of PAH source and composition. Org. Geochem. 2002, 33, 489–515. [Google Scholar] [CrossRef]
  9. Zakaria, M.P.; Takada, H.; Tsutsumi, S.; Ohno, K.; Yamada, J.; Kouno, E.; Kumata, H. Distribution of polycyclic aromatic hydrocarbons (PAHs) in rivers and estuaries in Malaysia: A widespread input of petrogenic PAHs. Environ. Sci. Technol. 2002, 36, 1907–1918. [Google Scholar] [CrossRef] [PubMed]
  10. Zhang, Y.; Tao, S. Global atmospheric emission inventory of polycyclic aromatic hydrocarbons (PAHs) for 2004. Atmos. Environ. 2009, 43, 812–819. [Google Scholar] [CrossRef]
  11. Chang, K.-F.; Fang, G.-C.; Chen, J.-C.; Wu, Y.-S. Atmospheric polycyclic aromatic hydrocarbons (PAHs) in Asia: A review from 1999 to 2004. Environ. Pollut. 2006, 142, 388–396. [Google Scholar] [CrossRef] [PubMed]
  12. Wang, Y.; Li, P.H.; Li, H.L.; Liu, X.H.; Wang, W.X. PAHs distribution in precipitation at Mount Taishan China. Identification of sources and meteorological influences. Atmos. Res. 2010, 95, 1–7. [Google Scholar] [CrossRef]
  13. Liu, F.; Xu, Y.; Liu, J.; Liu, D.; Li, J.; Zhang, G.; Li, X.; Zou, S.; Lai, S. Atmospheric deposition of polycyclic aromatic hydrocarbons (PAHs) to a coastal site of Hong Kong, South China. Atmos. Environ. 2013, 69, 265–272. [Google Scholar] [CrossRef]
  14. Tian, F.; Chen, J.; Qiao, X.; Wang, Z.; Yang, P.; Wang, D.; Ge, L. Sources and seasonal variation of atmospheric polycyclic aromatic hydrocarbons in Dalian, China: Factor analysis with non-negative constraints combined with local source fingerprints. Atmos. Environ. 2009, 43, 2747–2753. [Google Scholar] [CrossRef]
  15. Wu, Y.; Yang, L.; Zheng, X. Characterization and source apportionment of particulate PAHs in the roadside environment in Beijing. Sci. Total. Environ. 2014, 470, 76–83. [Google Scholar] [CrossRef] [PubMed]
  16. Arellano, L.; Fernández, P.; Tatosova, J.; Stuchlik, E.; Grimalt, J.O. Long-range transported atmospheric pollutants in snowpacks accumulated at different altitudes in the Tatra Mountains (Slovakia). Environ. Sci. Technol. 2011, 45, 9268–9275. [Google Scholar] [CrossRef] [PubMed]
  17. Carrera, G.; Fernández, P.; Grimalt, J.O.; Ventura, M.; Camarero, L.; Catalan, J.; Nickus, U.; Thies, H.; Psenner, R. Atmospheric deposition of organochlorine compounds to remote high mountain lakes of Europe. Environ. Sci. Technol. 2002, 36, 2581–2588. [Google Scholar] [CrossRef] [PubMed]
  18. Fernández, P.; Carrera, G.; Grimalt, J.O.; Ventura, M.; Camarero, L.; Catalan, J.; Nickus, U.; Thies, H.; Psenner, R. Factors governing the atmospheric deposition of polycyclic aromatic hydrocarbons to remote areas. Environ. Sci. Technol. 2003, 37, 3261–3267. [Google Scholar] [CrossRef] [PubMed]
  19. Sun, M.; Wang, Y.; Wang, T.; Fan, S.; Wang, W.; Li, P.; Guo, J.; Li, Y. Cloud and the corresponding precipitation chemistry in south China: Water‐soluble components and pollution transport. J. Geophys. Res.: Atmos. 2010, 115, D22. [Google Scholar] [CrossRef]
  20. Techniquesb, A.P. Method 8270c Semivolatile Organic Compounds by Gas Chromatography/Mass Spectrometry (Gc/Ms). 1996. Available online: http://mx.gemc.gov.cn/upload/20120201035748.pdf (accessed on 22 October 2015). [Google Scholar]
  21. Ding, X.; Wang, X.-M.; Xie, Z.-Q. Atmospheric polycyclic aromatic hydrocarbons observed over the North Pacific Ocean and the Arctic area: Partial distribution and source identification. Atmos. Environ. 2007, 41, 2061–2072. [Google Scholar] [CrossRef]
  22. Li, P.H.; Wang, Y.; Li, Y.H.; Wang, Z.F.; Zhang, H.Y. Characterization of polycyclic aromatic hydrocarbons deposition in PM2.5 and cloud/fog water at Mount Taishan (China). Atmos. Environ. 2010, 44, 1996–2003. [Google Scholar] [CrossRef]
  23. Draxler, R.R.; Hess, G.D. An overview of the HYSPLIT_4 modelling system for trajectories dispersion, and deposition. Aus. Meteorol. Maga. 1998, 47, 295–308. [Google Scholar]
  24. Ding, A.; Wang, T.; Fu, C. Transport characteristics and origins of carbon monoxide and ozone in Hong Kong, South China. J. Geophys. Res.: Atmos. 2013, 118, 9475–9488. [Google Scholar] [CrossRef]
  25. Draxler, R.R. Demonstration of a global modeling methodology to determine the relative importance of local and long-distance sources. Atmos. Environ. 2007, 41, 776–789. [Google Scholar] [CrossRef]
  26. Custódio, D.; Ferreira, C.; Alves, C.; Duarte, M.; Nunes, T.; Cerqueira, M.; Pio, C.; Frosini, D.; Colombi, C.; Gianelle, V. Urban aerosol in Oporto, Portugal: Chemical characterization of PM10 and PM2.5. Available online: http://adsabs.harvard.edu/abs/2014EGUGA.16.2454C (accessed on 22 October 2015).
  27. Ding, A.; Fu, C.; Yang, X.; Sun, J.; Zheng, L.; Xie, Y.; Herrmann, E.; Nie, W.; Petäjä, T.; Kerminen, V.-M. Ozone and fine particle in the western Yangtze River Delta: An overview of 1 year data at the SORPES station. Atmos. Chem. Phys. 2013, 13, 5813–5830. [Google Scholar] [CrossRef]
  28. Nie, W.; Ding, A.; Wang, T.; Kerminen, V.-M.; George, C.; Xue, L.; Wang, W.; Zhang, Q.; Petäjä, T.; Qi, X. Polluted dust promotes new particle formation and growth. Sci. Rep. 2014, 4. [Google Scholar] [CrossRef] [PubMed]
  29. Ding, A.; Wang, T.; Xue, L.; Gao, J.; Stohl, A.; Lei, H.; Jin, D.; Ren, Y.; Wang, X.; Wei, X. Transport of north China air pollution by midlatitude cyclones: Case study of aircraft measurements in summer 2007. J. Geophys. Res.: Atmos. 2009, 114, D8. [Google Scholar]
  30. Stohl, A.; Forster, C.; Eckhardt, S.; Spichtinger, N.; Huntrieser, H.; Heland, J.; Schlager, H.; Wilhelm, S.; Arnold, F.; Cooper, O. A backward modeling study of intercontinental pollution transport using aircraft measurements. J. Geophys. Res.: Atmos. 2003, 108, 4370–4370. [Google Scholar] [CrossRef]
  31. Zhang, Q.; Streets, D.G.; Carmichael, G.R.; He, K.; Huo, H.; Kannari, A.; Klimont, Z.; Park, I.; Reddy, S.; Fu, J. Asian emissions in 2006 for the NASA INTEX-B mission. Atmos. Chem. Phys. 2009, 9, 5131–5153. [Google Scholar] [CrossRef]
  32. Guo, H.; Lee, S.C.; Ho, K.F.; Wang, X.M.; Zou, S.C. Particle-associated polycyclic aromatic hydrocarbons in urban air of Hong Kong. Atmos. Environ. 2003, 37, 5307–5317. [Google Scholar] [CrossRef]
  33. Yang, H.-H.; Lee, W.-J.; Chen, S.-J.; Lai, S.-O. PAH emission from various industrial stacks. J. Hazard. Mater. 1998, 60, 159–174. [Google Scholar] [CrossRef]
  34. Ho, K.F.; Lee, S.C.; Chiu, G.M. Characterization of selected volatile organic compounds, polycyclic aromatic hydrocarbons and carbonyl compounds at a roadside monitoring station. Atmos. Environ. 2002, 36, 57–65. [Google Scholar] [CrossRef]
  35. Kulkarni, P.; Venkataraman, C. Atmospheric polycyclic aromatic hydrocarbons in Mumbai, India. Atmos. Environ. 2000, 34, 2785–2790. [Google Scholar] [CrossRef]
  36. Park, S.S.; Kim, Y.J.; Kang, C.H. Atmospheric polycyclic aromatic hydrocarbons in Seoul, Korea. Atmos. Environ. 2002, 36, 2917–2924. [Google Scholar] [CrossRef]
  37. Brown, J.N.; Peake, B.M. Sources of heavy metals and polycyclic aromatic hydrocarbons in urban stormwater runoff. Sci. Total. Environ. 2006, 359, 145–155. [Google Scholar] [CrossRef] [PubMed]
  38. Budzinski, H.; Jones, I.; Bellocq, J.; Pierard, C.; Garrigues, P.H. Evaluation of sediment contamination by polycyclic aromatic hydrocarbons in the Gironde estuary. Mar. Chem. 1997, 58, 85–97. [Google Scholar] [CrossRef]
  39. Dunbar, J.C.; Lin, C.-I.; Vergucht, I.; Wong, J.; Durant, J.L. Estimating the contributions of mobile sources of PAH to urban air using real-time PAH monitoring. Sci. Total. Environ. 2001, 279, 1–19. [Google Scholar] [CrossRef]
  40. Feng, J.; Hu, M.; Chan, C.K.; Lau, P.S.; Fang, M.; He, L.; Tang, X. A comparative study of the organic matter in PM2.5 from three Chinese megacities in three different climatic zones. Atmos. Environ. 2006, 40, 3983–3994. [Google Scholar] [CrossRef]
  41. Zhang, W.; Zhang, S.; Wan, C.; Yue, D.; Ye, Y.; Wang, X. Source diagnostics of polycyclic aromatic hydrocarbons in urban road runoff, dust, rain and canopy throughfall. Environ. Pollut. 2008, 153, 594–601. [Google Scholar] [CrossRef] [PubMed]
  42. Mai, B.; Qi, S.; Zeng, E.Y.; Yang, Q.; Zhang, G.; Fu, J.; Sheng, G.; Peng, P.; Wang, Z. Distribution of polycyclic aromatic hydrocarbons in the coastal region of Macao, China: Assessment of input sources and transport pathways using compositional analysis. Environ. Sci. Technol. 2003, 37, 4855–4863. [Google Scholar] [CrossRef] [PubMed]
  43. Mai, B.-X.; Fu, J.-M.; Sheng, G.-Y.; Kang, Y.-H.; Lin, Z.; Zhang, G.; Min, Y.-S.; Zeng, E.Y. Chlorinated and polycyclic aromatic hydrocarbons in riverine and estuarine sediments from Pearl River Delta, China. Environ. Pollut. 2002, 117, 457–474. [Google Scholar] [CrossRef]
  44. Soclo, H.H.; Garrigues, P.H.; Ewald, M. Origin of polycyclic aromatic hydrocarbons (PAHs) in coastal marine sediments: Case studies in Cotonou (Benin) and Aquitaine (France) areas. Mar. Pollut. Bull. 2000, 40, 387–396. [Google Scholar] [CrossRef]
  45. Ravindra, K.; Sokhi, R.; van Grieken, R. Atmospheric polycyclic aromatic hydrocarbons: Source attribution, emission factors and regulation. Atmos. Environ. 2008, 42, 2895–2921. [Google Scholar] [CrossRef] [Green Version]
  46. Butler, J.D.; Crossley, P. Reactivity of polycyclic aromatic hydrocarbons adsorbed on soot particles. Atmos. Environ. 1981, 15, 91–94. [Google Scholar] [CrossRef]
  47. Kamens, R.M.; Guo, Z.; Fulcher, J.N.; Bell, D.A. The influence of humidity, sunlight, and temperature on the daytime decay of polyaromatic hydrocarbons on atmospheric soot particles. Environ. Sci. Technol. 1988, 22, 103–108. [Google Scholar] [CrossRef] [PubMed]
  48. Schauer, J.J.; Rogge, W.F.; Hildemann, L.M.; Mazurek, M.A.; Cass, G.R.; Simoneit, B.R. Source apportionment of airborne particulate matter using organic compounds as tracers. Atmos. Environ. 1996, 30, 3837–3855. [Google Scholar] [CrossRef]
  49. Gao, J.; Wang, T.; Ding, A.; Liu, C. Observational study of ozone and carbon monoxide at the summit of mount Tai (1534m asl) in central-eastern China. Atmos. Environ. 2005, 39, 4779–4791. [Google Scholar] [CrossRef]

