Short Note

Vertical and Horizontal Polarization Observations of Slowly Varying Solar Emissions from Operational Swiss Weather Radars

MeteoSwiss, via ai Monti 146, Locarno Monti CH-6605, Switzerland
*
Author to whom correspondence should be addressed.
Atmosphere 2015, 6(1), 50-59; https://doi.org/10.3390/atmos6010050
Submission received: 9 September 2014 / Accepted: 21 November 2014 / Published: 24 December 2014

Abstract

:
The electromagnetic power that arrives from the Sun in the C-band has been used to check the quality of the polarimetric, Doppler weather radar network that has recently been installed in Switzerland. The operational monitoring of this network is based on the analysis of Sun signals in the polar volume data produced during the MeteoSwiss scan program. It relies on a method that has been developed to: (1) determine electromagnetic antenna pointing; (2) monitor receiver stability; and (3) assess the differential reflectivity offset. Most of the results from such a method had been derived using data acquired in 2008, which was a period of quiet solar flux activity. Here, it has been applied, in simplified form, to the currently active Sun period. This note describes the results that have been obtained recently thanks to an inter-comparison of three polarimetric operational radars and the Sun’s reference signal observed in Canada in the S-band by the Dominion Radio Astrophysical Observatory (DRAO). The focus is on relative calibration: horizontal and vertical polarization are evaluated versus the DRAO reference and mutually compared. All six radar receivers (three systems, two polarizations) are able to capture and describe the monthly variability of the microwave signal emitted by the Sun. It can be concluded that even this simplified form of the method has the potential to routinely monitor dual-polarization weather radar networks during periods of intense Sun activity.

1. Introduction

The idea of using the solar signal detected by ground-based radars during the operational weather scan program has been presented in a series of papers: Huuskonen and Holleman [1] presented the use of Sun signals to determine antenna pointing, which is the residual offset in the angle of elevation and azimuth. Holleman et al. [2] extended the method towards quantitative electromagnetic power measurements, in order to monitor radar receiving chain stability. In the case of dual-polarization radars, which are able to measure both horizontal (H) and vertical (V) polarization, the same technique can be used to monitor the presence (and stability) of a residual differential reflectivity offset, as shown, for instance, by Holleman et al. [3], who investigated the stability of differential radar reflectivity over three months during periods of quiet Sun emissions. Here, we show recently acquired results from three operational weather radars in Switzerland taken during intense solar activity in the first seven months of 2014. Section 2 presents the operational Swiss approach and a simplification of the Holleman et al. [2,3] method. The available data, as well as the main radar features, are described in Section 3. The results are given in Section 4, together with a possible interpretation of the main features observed.

2. Operational Observations of Solar Spectral Power at the Antenna Feed

A complete description of the automated detection of Sun signatures in polar volume data of weather radar can be found in [1]. A similar approach is currently used at MeteoSwiss: a continuous, non-coherent, noise-like power signal from a non-polarized radio-frequency source is sought at long ranges in consecutive radar bins (75 m long and 1° wide); such a signal is expected to be between 5 and 12 dB stronger than the background noise. Eight-bit, “uncorrected” reflectivity data are used in this study. The pulse repetition frequency and rotation speed are optimized in the operational MeteoSwiss radar scan program as a function of the angle of elevation. Therefore, the number of pulses involved in each 1° half power beam width (HPBW) bin ranges from 28 to 42. In the MeteoSwiss approach, only the last 5 km (60 gates) of each radar bin are averaged for Sun power retrieval. Hence, each reflectivity value corresponding to a Sun hit is the linear average of a few thousand samples. Several tens of hits are found per day, depending on the scan program, latitude and season.
In order to retrieve the solar spectral power, daily radar reflectivity values were analyzed by Holleman et al., in single [2] and dual-polarization [3] receiving chains using the five-parameter linear model fitting procedure described in detail in [1,4]. It is worth noting that a correction factor has been introduced in the recent paper by Huuskonen et al. [4] (Equation (3), page 1705) to characterize the residual bias between the true Sun azimuth from ephemeris and the value “read” using the antenna encoder: such a term, which is basically the sine of the Sun zenith angle, is more important in mid-latitude and equatorial regions, where the Sun reaches lower zenith angles. Once the five parameters are derived, for instance by means of the least squares method, the peak solar power that the radar would have received if the beam had hit the Sun’s center can be estimated. At MeteoSwiss, the focus of the operational Sun check method is on a relative calibration between horizontal and vertical channels, as well as on an inter-comparison of different radars. Since the focus is not on absolute calibration, the median of the strongest 21 hits in a given day is taken in order to obtain a robust estimate of the Sun’s apparent reflectivity. One important implication of this choice is that an accurate assessment of the absolute calibration of the receivers cannot be pursued: such a daily median value is of the order of 2 dB (or more) smaller than the true peak solar power value. However, the method allows an accurate monitoring to be made of the differential bias between the horizontal and vertical channels. Furthermore, assuming that the convolution between the antenna radiation pattern and the Sun’s disk will on average lead to approximately the same amount of “underestimation”, the stability of radar receiving chains can also be monitored. Section 4 will show that not only is this the case, but also that the monthly variability of the Sun’s microwave signals is captured well by the Swiss radars.

3. Description of Acquired Data and Instruments

MeteoSwiss has recently renewed its weather radar network: antenna-mounted, fully-digital receivers have been introduced into the current network; each system is equipped with two orthogonal receiving channels, which are able to measure vertical and horizontal linear polarizations. Three radar systems have already passed the extensive acceptance tests (test readiness review, factory acceptance test, integration and site adaptation test, system equipment acceptance test; see, for instance, [5,6]) and have been operating for more than two years. These three radar sites are: Lema (162 m altitude, near Lugano; Lat 46.04°; Lon 8.83°), Albis (935 m, near Zurich; Lat 46.29°; Lon 8.51°) and Dole (1681 m, near Geneva; Lat 46.43°; Lon 6.10°). From an operational Sun check method viewpoint, probably one of the most relevant aspects to emerge from such acceptance tests was the necessity of a modification of the original calibration unit (CU); updated, new generation calibration units [7] were installed on both the Albis and Lema radars at the end of 2013. Hence, the data shown in this note (from the beginning of 2014 up to mid-August 2014) refer to the new concept CU in two out of three radars.
The solar flux at a 10.7-cm wavelength (S-band) is continuously monitored at the Dominion Radio Astrophysical Observatory (DRAO). This observatory is located near Penticton, British Columbia, Canada, and is characterized by low interference levels at the decimeter and centimeter wavelengths; the quality of the environment is maintained through strong local, provincial and federal protection [8]. Observations of the daily solar flux were started in 1946 and have continued to the present day. The current solar flux at 10.7 cm, F10.7, can be obtained from the DRAO observatory website (ftp://ftp.geolab.nrcan.gc.ca/data/solar_flux/daily_flux_values/fluxtable.txt). Such values are corrected for atmospheric attenuation. In particular, they refer to precise measurements acquired three times a day. In summer, this takes place at 17, 20 (local noon) and 23 UTC. The hilly horizon and 50°N latitude cause the Sun to be too low for the first and last timings during the “winter season”; as a consequence, the flux determinations are made at 18, 20 and 22 UTC during “darker months”.
The 10.7 cm solar flux measurements can be converted to other wavelengths with some uncertainty (approximately 1 dB according to [8]). This is possible thanks to the remarkable stability of the blackbody spectrum of the slowly varying component of solar activity. However, it should be recalled that the spectral component can be distorted by superimposed contributions from flares, especially for “short” sampling periods, like radar “hits during operational weather radar scanning”. In short, on the basis of Equation (13) in Section 5 of [8], the estimated solar flux in solar flux units (sfu) used in this note for the Swiss wavelength (5.5 cm) is:
F5.5 = 0.7155 × (F10.7 − 64) + 113.
If the receiver bandwidth (in Hz), the effective antenna area (in m2) and the receiver and transmitter losses (dimensionless) are known, then the radar received power can be converted into sfu (see Section 2 in [2] for details); this is also the approach that has been followed in this paper (see the next section). Because of the multiplicative nature of the errors that affect radar measurements, radar-related results are often presented using decibels (dB). In the present case, s = 10 log(S/S0) is used, where S0 = 1 sfu = 10−19 mW∙m−2∙Hz−1 and [s] = dBsfu.

4. Results and Discussion

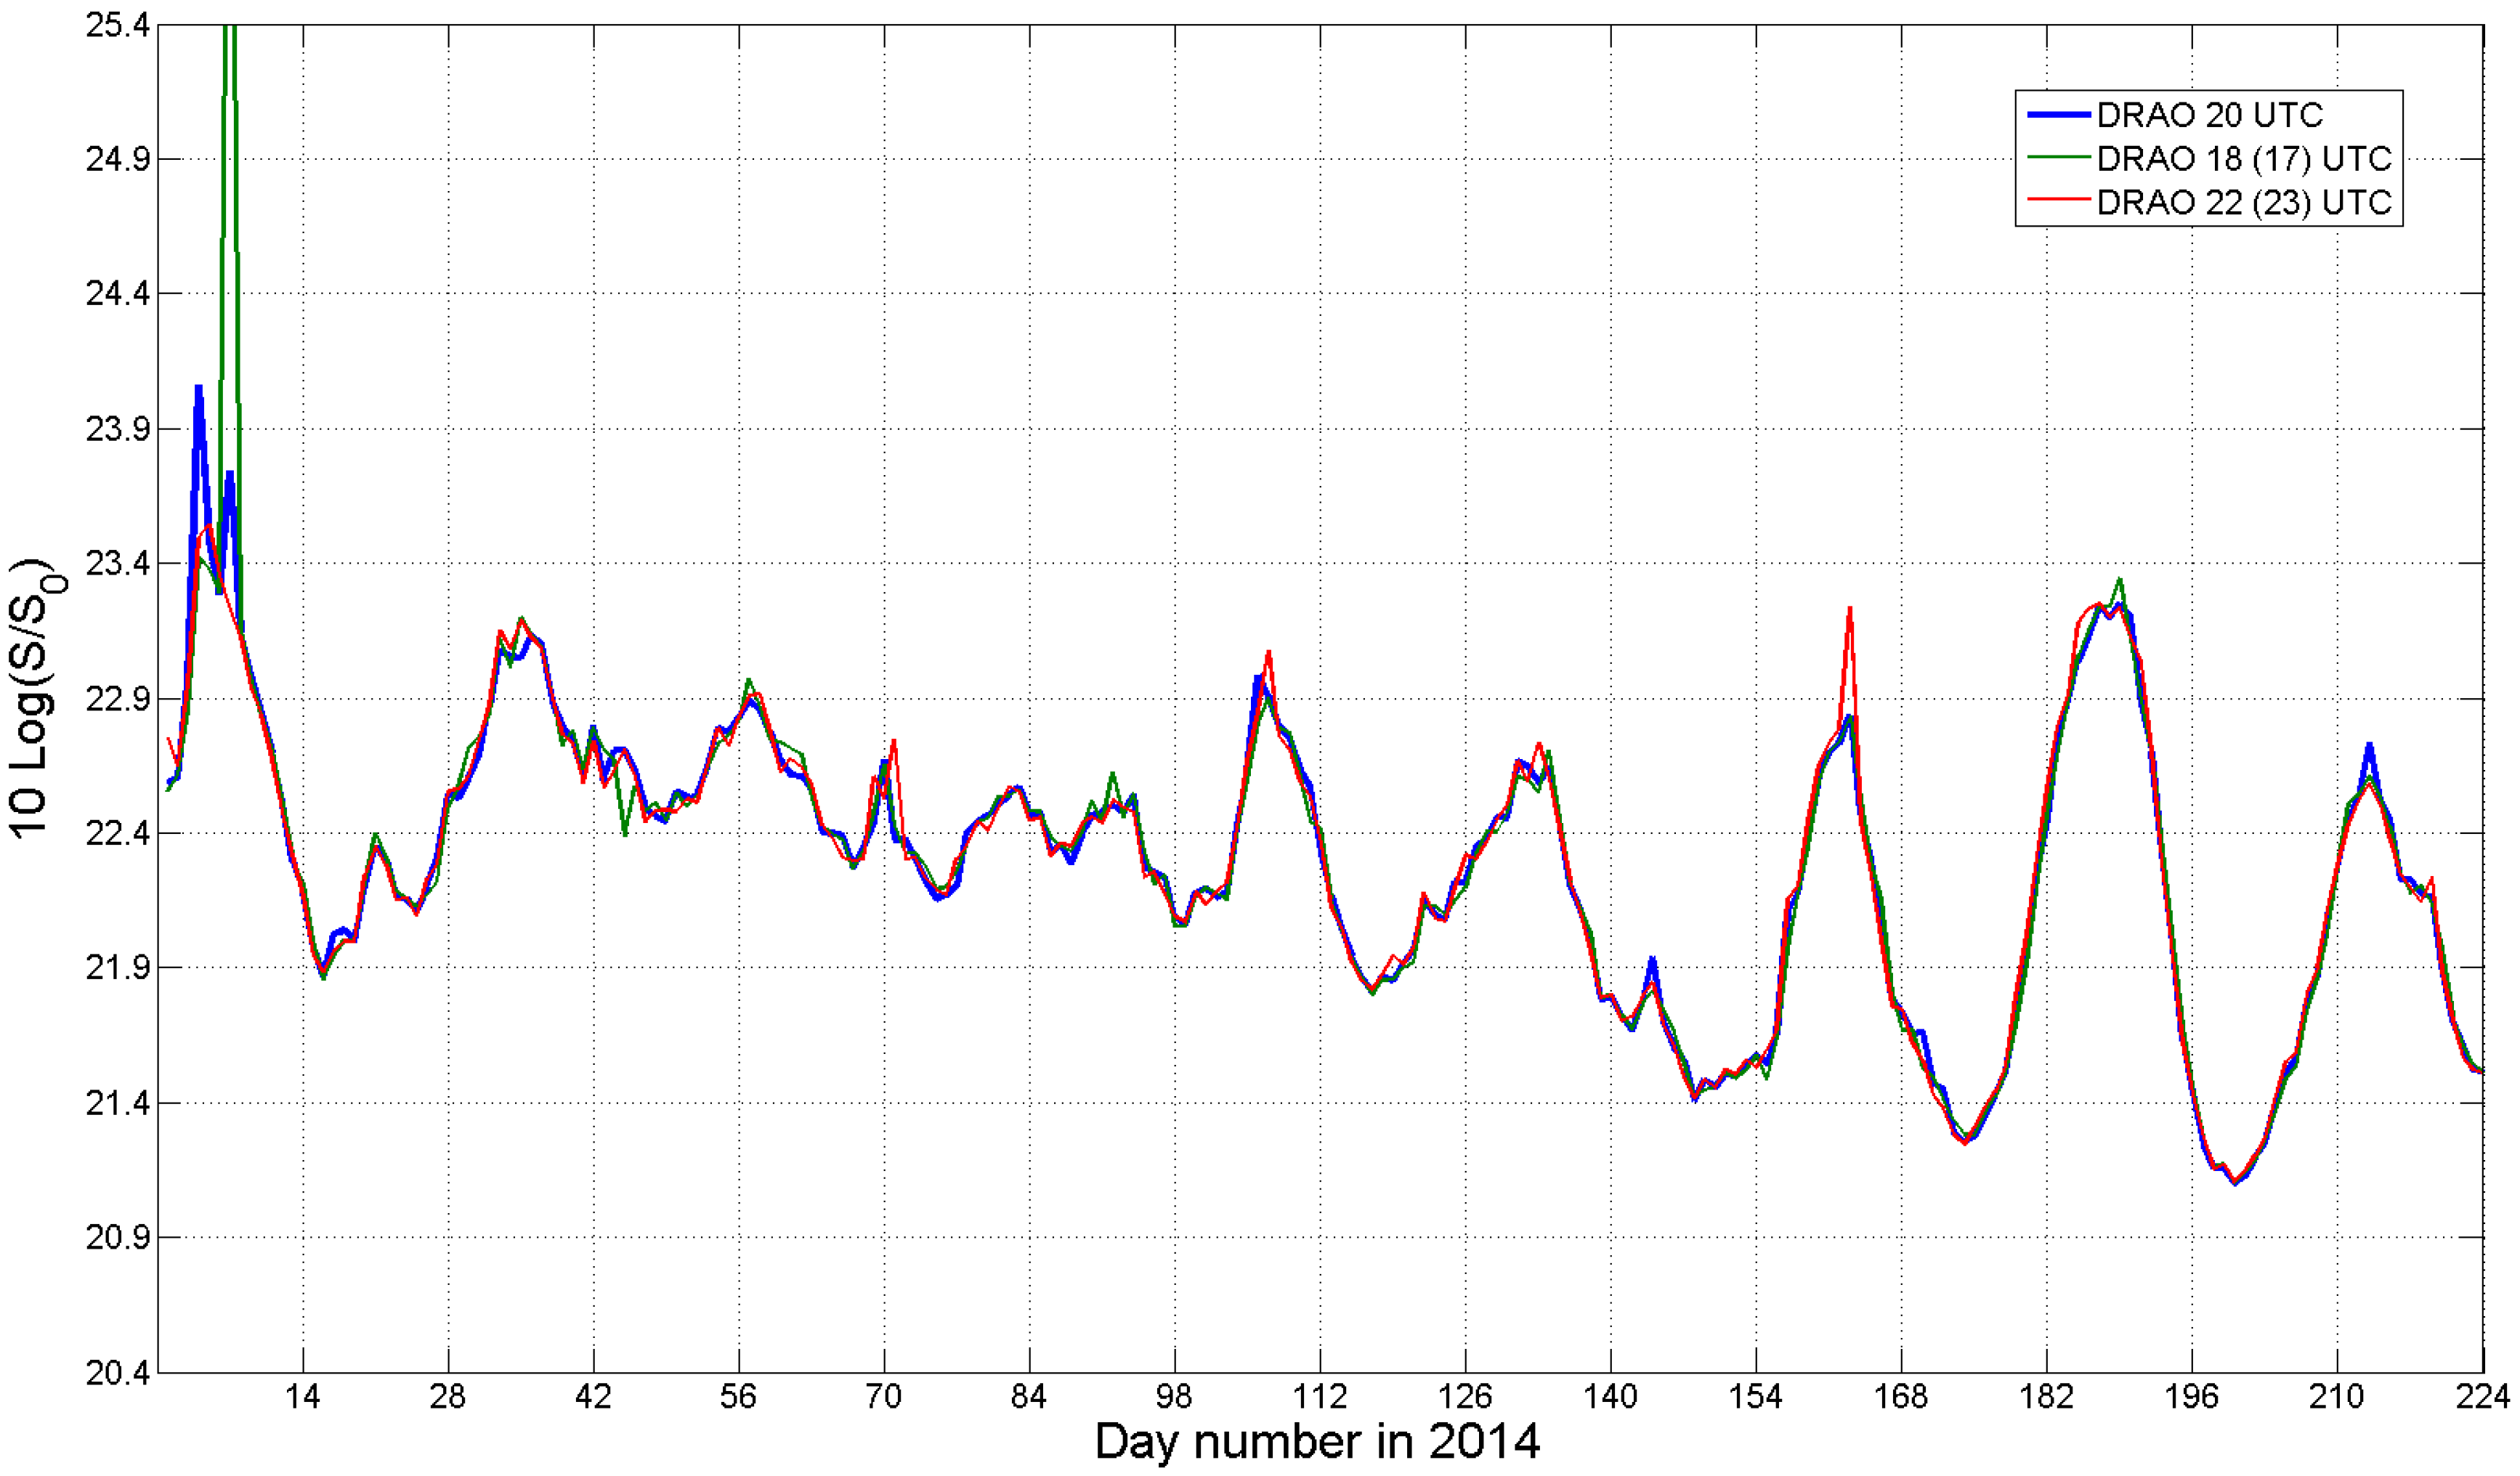
4.1. Choice of the Reference Solar Signal and Scores for the Assessment of the Agreement

As stated in the Introduction, the focus of the present analysis is on the relative agreement and not on the absolute calibration of each receiver. In other words, emphasis is on the variation of the error around the mean; it is not on the mean error itself. The error is defined in Section 4.2 and Section 4.3 as the ratio between the value measured by the radar receiver and the reference (DRAO measurements); in Section 4.4, the error is the ratio between the horizontal and vertical polarization values. As a consequence, the selected scores emphasize the agreement between oscillations around the mean value. The first selected score is the explained variance, which is the square of the correlation coefficient (multiplied by a hundred). The second score is named “scatter” [9] and is measured in decibels (dB). It has the advantage of being conceived of to be robust, informative and independent of any multiplicative factor that could affect the measurements. The error distribution is expressed as the cumulative weighted contribution to the normalized total amount, which is the reference (y-axis) as a function of the log-transformed estimate/reference ratio (x-axis). Alternatively, it is possible to simply use the standard deviation of the log-transformed radar-to-DRAO solar flux value ratio, as shown, for instance, by Holleman et al. [2].
Figure 1 shows the daily variability of the three series of daily precise measurements acquired in 2014 by DRAO at 10.7 cm and extrapolated to the Swiss radar wavelength using Equation (1): the blue curve is for 20 UTC measured data; the green one is for the 18 (17) UTC data; while the red one is for the 22 (23) UTC data. Because of the Sun’s rotation on its axis (variable, as a function of latitude), the number of active regions that enhances the radio emission with respect to the quiet (background) component, as seen from the Earth, varies. The result is an oscillation with an amplitude of approximately 1 dB and a period of ~27 days. In January, there were a few episodes when radiation was outshone; for instance, up to 26.9 dBsfu on 7 January between 17 and 18 UTC. Apart from these few days in January, the three curves are almost indistinguishable. It should be noted that the flux values were log-transformed before being displayed and are shown on the y-axis in dBsfu. Let us now evaluate the agreement between the three series using the above-presented scores: the blue vs. green explained variance is 87%; the blue vs. red one is 98%; and the red vs. green one is 82%.
Figure 1. Daily solar flux values measured by the Dominion Radio Astrophysical Observatory (DRAO) in Canada at 10.7 cm and extrapolated to the C-band. Each flux determination takes an hour. Note that S0 = 1 sfu = 10−22 W∙m−2∙Hz−1.
Atmosphere 06 00050 g001
Because of the rapidly varying solar component that consists of bursts (second and minute duration) produced by flares and other transient activity, which caused two extreme variability cases on 4 and 7 January, the explained variance, based on linear values of solar fluxes, is significantly smaller: 66%, 97% and 58%, respectively. As far as the scatter is concerned, the results are listed in Table 1 (the reference measurement is shown along the columns). According to the scatter values, the dataset acquired at 20 UTC again shows better agreement than the other two sets. For this reason, the radar derived data in Section 4.2 will be evaluated against a reference using the 20 UTC dataset.
Table 1. Agreement in terms of scatter (in dB) between the three 1-h long Sun measurements acquired by the DRAO in Canada.
DRAO 20 UTCDRAO 18 (17) UTCDRAO 22 (23) UTC
DRAO 20 UTC0 dB0.041 dB0.044 dB
DRAO 18 (17) UTC0.040 dB0 dB0.056 dB
DRAO 22 (23) UTC0.044 dB0.057 dB0 dB

4.2. Results of the Daily Online Analysis (Horizontal Polarization)
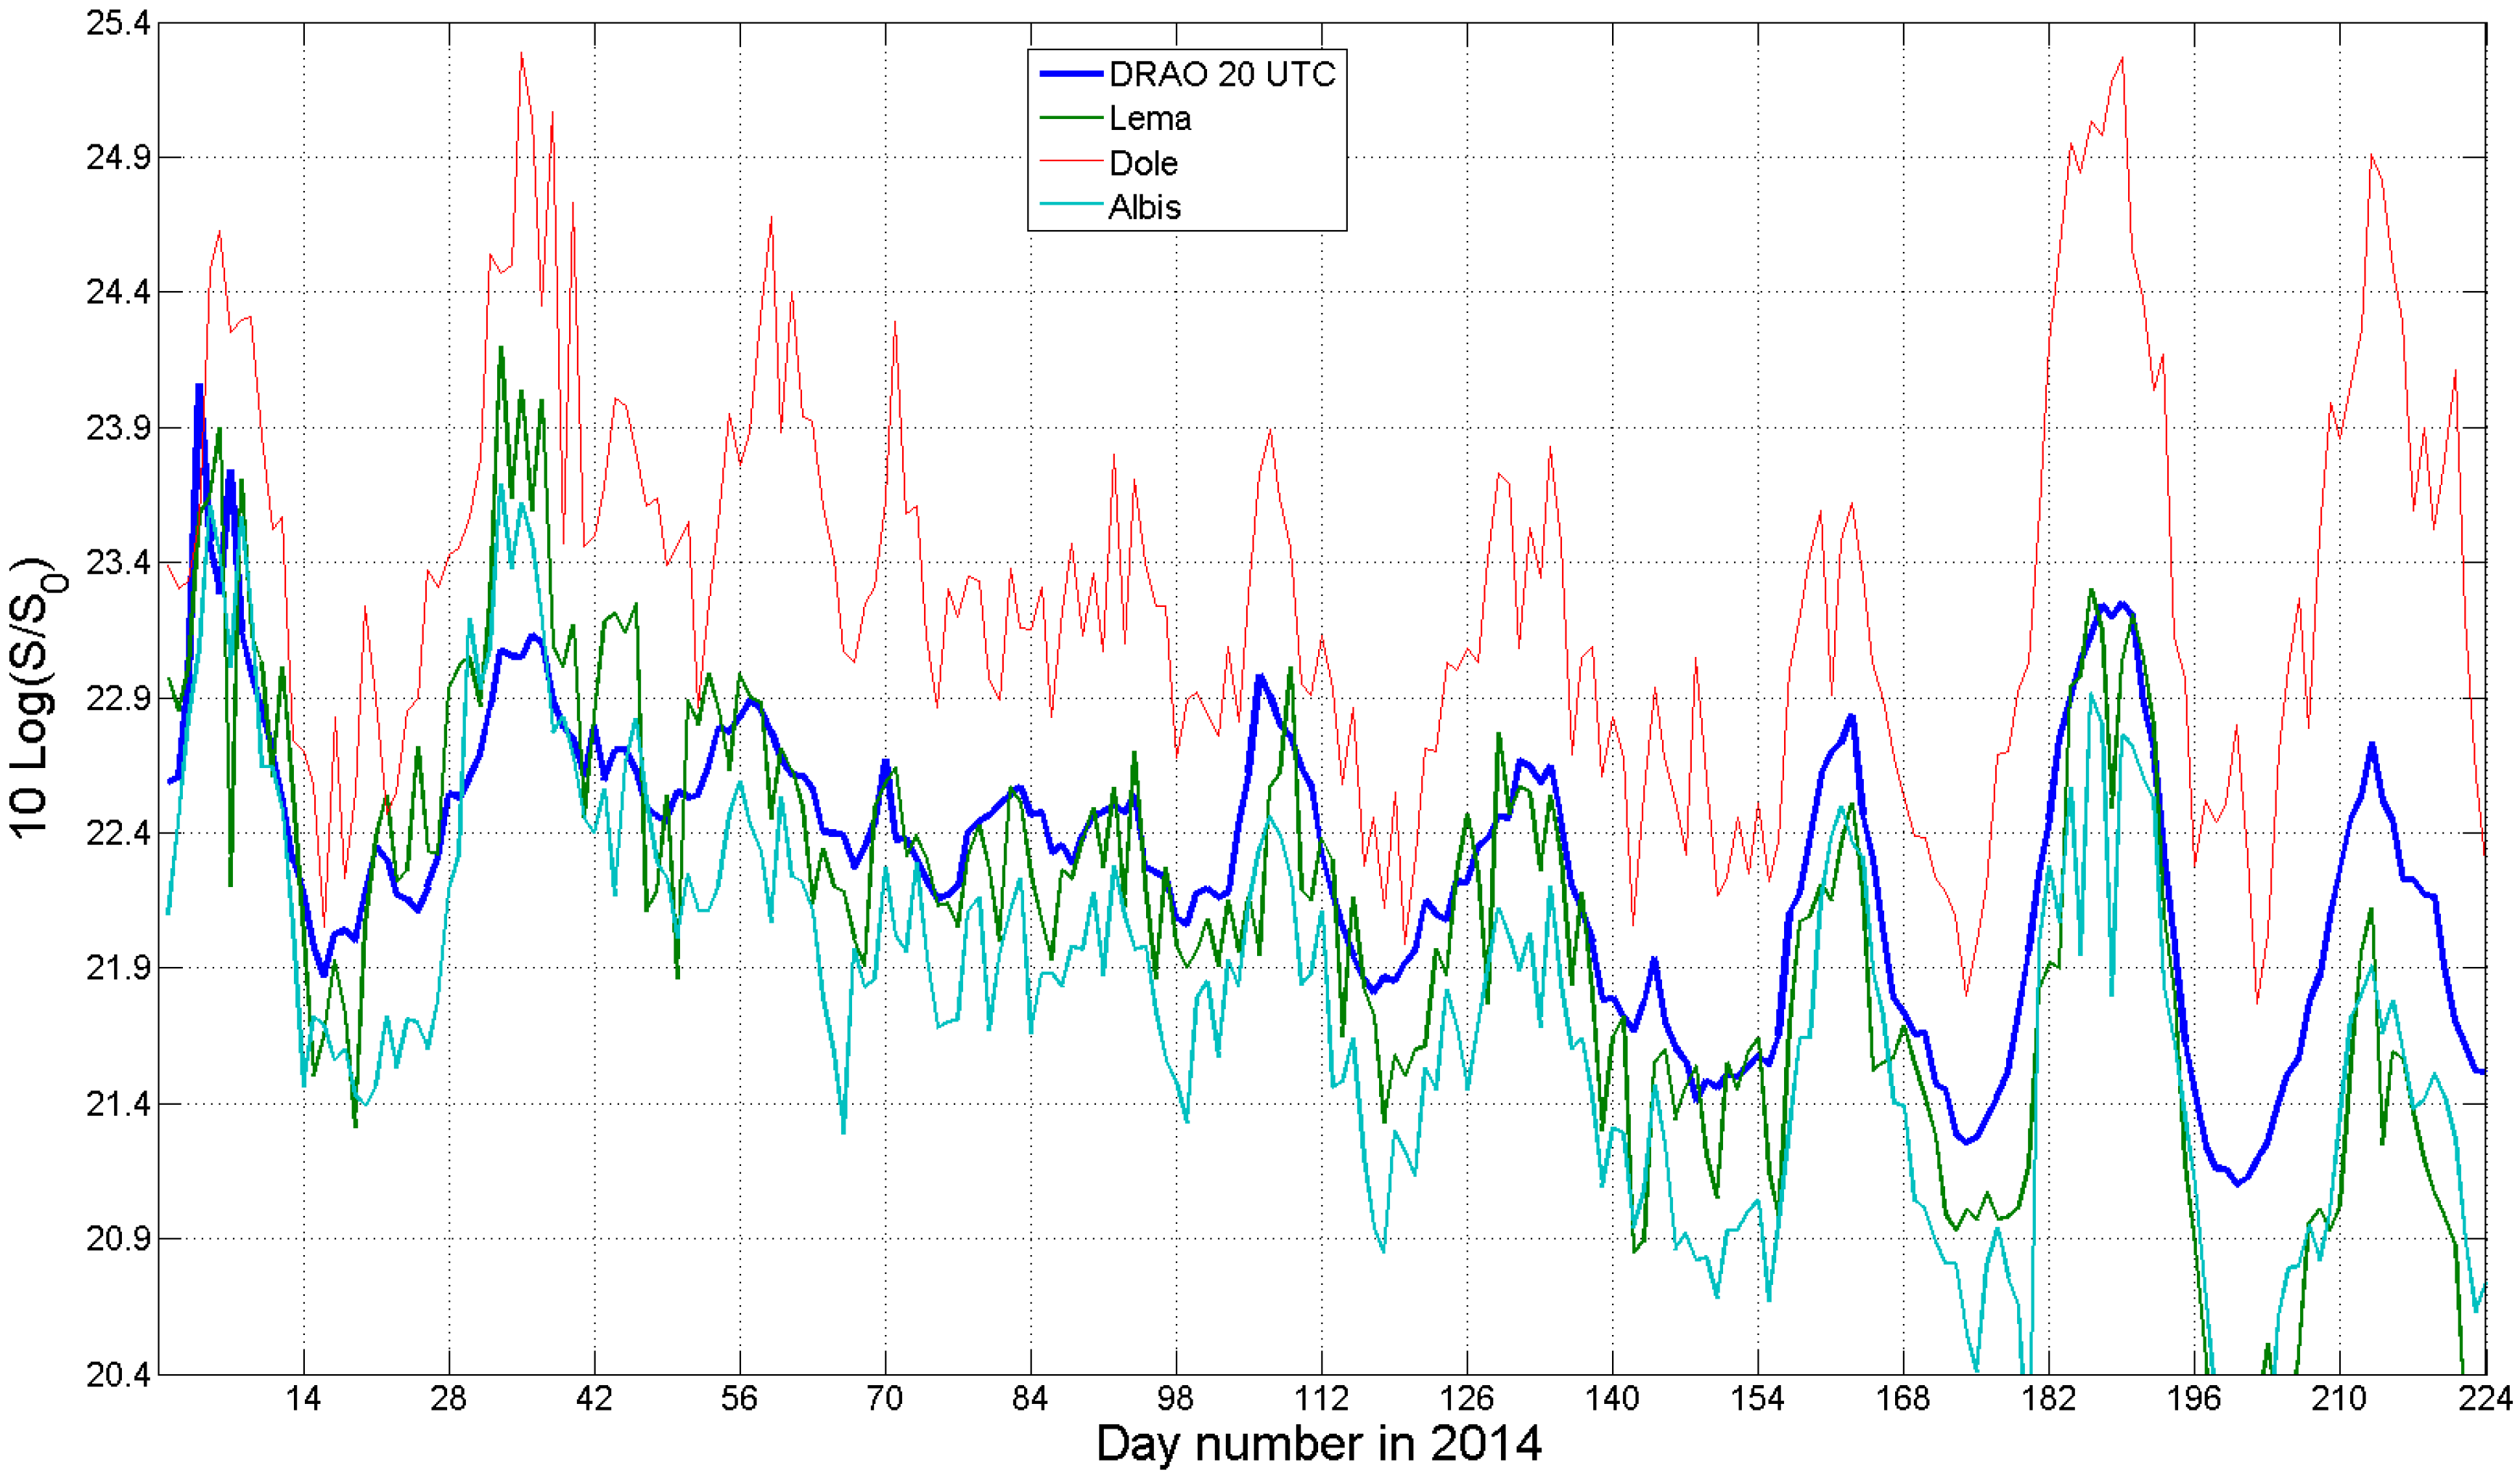
Figure 2 shows the daily analysis of the Sun’s signals detected during the operational scan program by the new generation MeteoSwiss meteorological radars operating at the C-band. As in Figure 1, the results are shown from 1 January until 12 August 2014 (Julian Day 224); the retrieved solar flux values in sfu are also transformed to decibels. The solar “monthly” oscillation is clearly visible in all of the radar systems and shows good correlation (see the first line of Table 2) to the reference (DRAO at 20 UTC, as described in the previous section): the Albis radar shows the best agreement with the highest correlation and lowest scatter. A random component (daily fluctuations) seems to affect the radar estimates: a three-day median average (smoothing) is able to make the radar curves more similar to the reference and improve the correlation (see Section 4.3).
Figure 2. Daily variability of the Sun’s emission retrieved from the MeteoSwiss weather radars in Lema, Dole and Albis. The values from DRAO (20 UTC) are plotted for reference purposes.
Atmosphere 06 00050 g002
Table 2. Agreement between the Swiss radar horizontal channel and the DRAO reference (20 UTC).
Albis RadarLema RadarDole Radar
Explained variance in %83%74%62%
Scatter in dB0.28 dB0.42 dB0.44 dB
Standard deviation in dB0.35 dB0.48 dB0.48 dB
The same agreement and similar scores are obtained when the 22 (23) and 18 (17) UTC time series are used: our interpretation is that the two selected scores are robust and can be used effectively for a quantitative evaluation of the radar versus reference (DRAO) agreement. When using the (less robust) standard deviation of the log-transformed ratios, the Albis radar again shows the best agreement (last line in Table 2). A possible explanation for the better results of the Albis radar could be the use of the stable, new generation calibration unit.
Such values can be compared with those obtained for the Dutch De Bilt radar by Holleman et al. [2] in 2005 using DRAO 22 UTC as a reference: the standard deviation is 0.44 dB for the whole year (excluding three days with flares) and is 0.58 dB and 0.44 dB for the first nine months of the year, with (272 days) and without (269 days) the above-mentioned three flares, respectively. As expected, the scatter values are much less sensitive to the three flares: such values are 0.27 dB (272 days) and 0.26 dB (269 days), respectively. Another interesting benchmark is the value shown by Huuskonen et al. [4] for the Finnish Anjalankoski radar over a period of two months at the end of 2011: the standard deviation is as small as 0.24 dB.
Why is the amplitude of the oscillation of the DRAO reference signal smaller than those retrieved by radars? A possible explanation could be related to the transposition formula (Equation (1)) from the S-band to the C-band, which is less accurate when solar activity increases. For instance, applying a slope coefficient of 0.8 instead of 0.7155 in Equation (1) causes a reduction of both the scatter and standard deviation for all three Swiss radars.

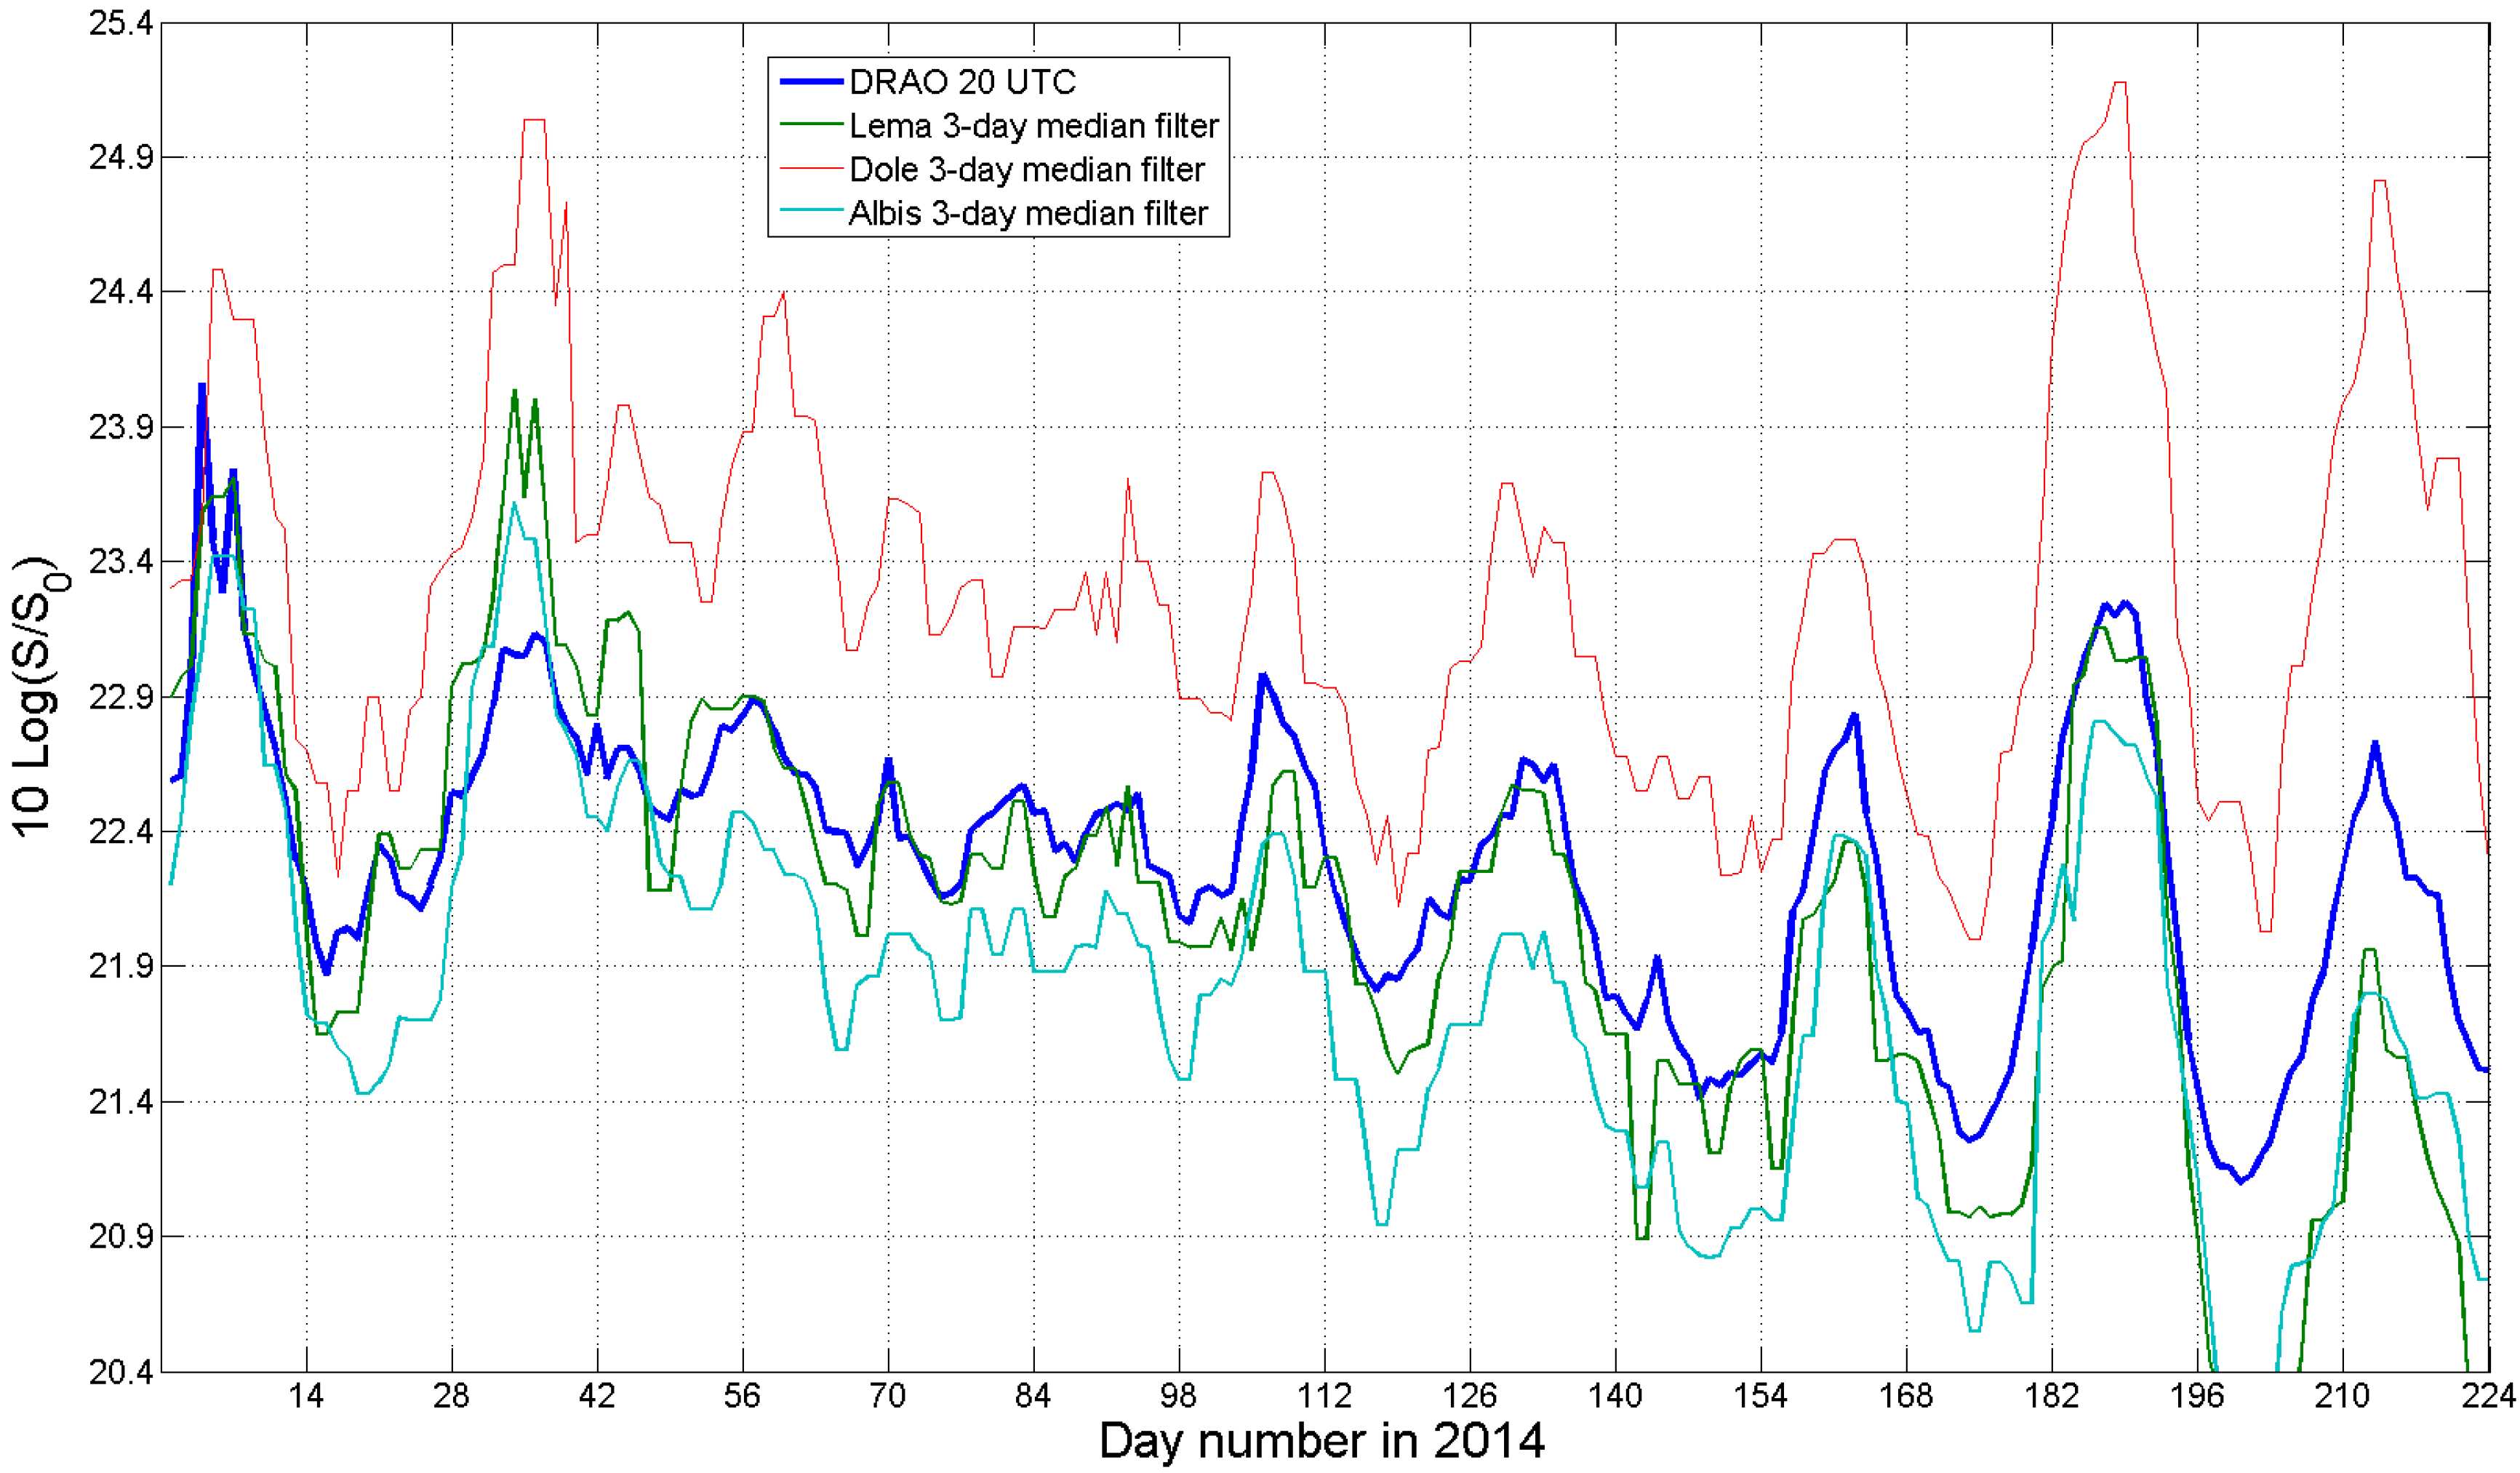
4.3. Improvement Obtained When the Random Error Component That Affects Radar Estimates Is Smoothed

The presence of the random error component that affects radar estimates can be pointed out through a simple low-pass (smoothing) filtering. Even a (“short-window”) three-day running median is able to significantly reduce daily radar fluctuations, and this results in an improvement in the explained variance and, most of all, in the scatter in dB (see Table 3).
Table 3. Agreement between the DRAO reference (20 UTC) and the Swiss radar horizontal channel after having applied a three-day running median filter.
Albis RadarLema RadarDole Radar
Explained variance in %88%80%66%
Scatter in dB0.05 dB0.07 dB0.07 dB
Standard deviation in dB0.29 dB0.41 dB0.43 dB
Figure 3. Daily variability of the Sun’s emission retrieved from the MeteoSwiss weather radars after having applied a three-day running median to the radar data. The reference measurements acquired by DRAO are also plotted in blue.
Atmosphere 06 00050 g003
From a visual comparison, a fair agreement can be observed between the DRAO reference value and the values retrieved from radar observations after the three-day median filter. Figure 3 shows the corresponding results: the solar rotation, which can be observed in the radio frequency flux during active periods, can clearly be seen in the signatures of all three radar systems.

4.4. Operational Monitoring of Radar Differential Reflectivity Using the Sun

The issue of differential reflectivity calibration is crucial for successful applications of polarimetric weather radar [10]. Offline Sun measurements, in which operational scanning is stopped and the radar antenna is pointing towards the Sun, are generally employed to calibrate the polarimetric receiving chain ([10,11]). Illingworth [12] has shown that ZDR should be estimated within 0.2 dB for improved rainfall estimates based on Z and ZDR. In the present paper, the approach introduced by Holleman et al. [3] is followed. The same volume data available from the Swiss weather radars described in Section 4.2 have been analyzed on a daily basis, and the corresponding solar-related results are presented in Table 4.
Table 4. Daily agreement between the horizontal and vertical channel Sun measurements.
Albis RadarLema RadarDole Radar
Number of median daily values used220204203
Median value in dB−0.65 dB0.17 dB−0.40 dB
Average value in dB−0.66 dB0.18 dB−0.40 dB
Standard deviation in dB0.05 dB0.06 dB0.06 dB
Twenty values (from 6 June to 25 June) have been discarded for the Lema radar, because of a problem with the calibration of the vertical channel: a residual, positive bias of approximately +0.2 dB is clearly evident. The daily differential reflectivity values from the solar monitoring in fact are consistently positive; only some minor random fluctuations are present, and as a result, the dispersion is as small as 0.06 dB. For the Albis radar, 220 (out of 224) observations are available; the system did not work over two weekends in July. Unfortunately, despite the new-generation calibration unit, a significant negative Bias can be observed: the daily differential reflectivity values from the solar monitoring are systematically negative. However, a positive fact is offered by the limited dispersion: both the standard deviation and spread are 0.05 dB, the smallest value of the three radars. The Dole radar also shows a negative bias of approximately −0.4 dB (21 values have been discarded because of a problem with the calibration of the vertical channel). The dispersion is as small as 0.06 dB.
The limited dispersion found for all three radars is an important result: it underlines the stability of the relative calibration between the horizontal and vertical receivers. It also makes it feasible to plan an adjustment of one channel with respect to the other in order to eventually reach a residual bias as close as possible to the ideal value of 0.0 dB.

5. Summary and Conclusions

The electromagnetic power from the Sun can be used to check the quality of the polarimetric receivers of any weather radar network [9]. In recent years, the Dutch (KNMI) and Finnish (FMI) Meteorological Institutes have developed an ‘‘online’’ Sun method, in which the Sun’s signals are automatically detected in polar volume data generated during operational scan programs. This method has proved to be successful for the daily monitoring of antenna electromagnetic pointing [1], of single polarization radar receiving chain stability [2], as well as for assessing the accuracy of the differential reflectivity of polarimetric weather radars [3]. Accurate estimates of the solar flux have been presented during a quiet period of the roughly 11-year slowly varying radio emission Sun cycle. This note describes results that have recently been obtained during the current, very active Sun period.
As far as the relative agreement between the horizontal polarization receiving chain and the DRAO reference is concerned, Holleman et al. [2] presented results for the first 46 days in 2008 for the Dutch De Bilt and Den Helder radars and for 44 days (from 1 July to 13 August 2008) for the Finnish Vimpeli and Luosto radars: the standard deviations of the log-transformed radar-to-DRAO daily ratios resulted in being 0.14, 0.17, 0.16 and 0.20 dB, respectively (quiet Sun period). As far as the MeteoSwiss weather radars are concerned, this note presents results obtained for the first 224 days of 2014. Despite the very active Sun period, satisfactory results have been obtained, as pointed out in Section 4.3 and shown in Figure 3. The Albis radar shows the best performance: the standard deviation of the log-transformed daily ratios is 0.35 dB (0.27 dB in case of the seven-day median filter). The values is 0.48 dB for the Lema and Dole radars (0.40 dB and 0.38 dB, respectively, in the case of the seven-day median filter).
As far as the stability of differential reflectivity is concerned, Holleman et al. [3] have presented results for a three-month quiet Sun period (March, April and May) in 2008 for the MeteoFrance radar located in Trappes: they obtained a standard deviation of the daily differential reflectivity that is slightly larger than 0.2 dB. Albis shows the best performance of the Swiss radars for the first seven months of 2014 (active Sun period): the standard deviation of the daily differential reflectivity is as small as 0.05 dB. The Lema and Dole radars also show good results (0.06 dB). It is possible to conclude that the method presented in this note, despite its simplified form, has the potential to routinely monitor dual-polarization weather radar networks, even during periods of intense Sun activity.

Acknowledgments

The authors would like to thank Peter Gölz and Dennis Vollbracht for the stimulating discussions and helpful hints regarding the Sun’s observations. Special thanks are due to: Andrea Lombardi for helping the algorithm implementation; Ken Tapping for the kind and helpful suggestions via email in August 2014; Iwan Holleman for having provided the De Bilt radar data for 2005, another active Sun period. The valuable and helpful comments from the three anonymous reviewers are greatly appreciated.

Author Contributions

Marco Gabella, Maurizio Sartori and Marco Boscacci conceived and designed the experiment; Marco Boscacci conceived and programmed the automatic, real-time Sun detection and monitoring algorithm; Urs Germann conceived the score named scatter; Marco Gabella analyzed the data and presented the results; after extensive feedback and comments by Maurizio Sartori and Urs Germann, Marco Gabella wrote the original and revised version of this note.

Conflicts of Interest

The authors declare no conflict of interest.

References

  1. Huuskonen, A.; Holleman, I. Determining weather radar antenna pointing using signals detected from the Sun at low antenna elevations. J. Atmos. Oceanic Technol. 2007, 24, 476–483. [Google Scholar] [CrossRef]
  2. Holleman, I.; Huuskonen, A.; Kurri, M.; Beekhuis, H. Operational monitoring of weather radar receiving chain using the Sun. J. Atmos. Oceanic Technol. 2010, 27, 159–166. [Google Scholar] [CrossRef]
  3. Holleman, I.; Huuskonen, A.; Gill, R.; Tabary, P. Operational monitoring of radar differential reflectivity using the Sun. J. Atmos. Oceanic Technol. 2010, 27, 881–887. [Google Scholar] [CrossRef]
  4. Huuskonen, A.; Kurri, M.; Hohti, H.; Beekhuis, H.; Leijnse, H.; Holleman, I. Radar performance monitoring using the angular width of the solar image. J. Atmos. Oceanic Technol. 2014, 31, 1704–1712. [Google Scholar] [CrossRef]
  5. Gabella, M.; Sartori, M.; Progin, O.; Germann, U.; Boscacci, M. An innovative instrumentation for checking electromagnetic performances of operational meteorological radar. In Proceedings of the Sixth European Conference on Radar in Meteorology and Hydrology (ERAD2010), Sibiu, Romania, 6–10 September 2010; pp. 263–269.
  6. Gabella, M.; Sartori, M.; Progin, O.; Germann, U. Acceptance tests and monitoring of the next generation polarimetric weather radar network in Switzerland. In Proceedings of the 2013 International Conference on Electromagnetics in Advanced Applications (ICEAA), Torino, Italy, 9–13 September 2013. ISBN: 978-1-4673-5678-9.
  7. Vollbracht, D.; Sartori, M.; Gabella, M. Absolute dual-polarization radar calibration: Temperature dependence and stability with focus on antenna-mounted receivers and noise source-generated reference signal. In Proceedings of the 8th European Conference on Radar in Meteorology and Hydrology (ERAD2014), Garmisch-Partenkirchen, Germany, 1–5 September 2014; pp. 91–102.
  8. Tapping, K. Antenna Calibration Using the 10.7 cm Solar Flux. Available online: http://www.k5so.com/RadCal_Paper.pdf (accessed on 25 September 2014).
  9. Germann, U.; Galli, G.; Boscacci, M.; Bolliger, M.; Gabella, M. Quantitative precipitation estimation in the Alps: where do we stand? In Proceedings of the Third European Conference on Radar in Meteorology and Hydrology (ERAD2004), Visby, Sweden, 6–10 September 2004; pp. 2–6.
  10. Ryzhkov, A.V.; Giangrande, S.E.; Melnikov, V.M.; Schuur, T.J. Calibration issues of dual-polarization radar measurements. J. Atmos. Oceanic Technol. 2005, 22, 1138–1155. [Google Scholar] [CrossRef]
  11. Pratte, J.F.; Ferraro, D.G. Automated solar gain calibration. In Proceedings of the 24th Conference on Radar Meteorology, Tallahassee, FL, USA, 27–31 March 1989; pp. 619–622.
  12. Illingworth, A. Improved precipitation rates and data quality by using polarimetric measurements. In Advanced Applications of Weather Radar; Meischner, P., Ed.; Springer Verlag: Heidelberg, Germany, 2004; Chapter 5; pp. 130–166. [Google Scholar]

