Article

Meteorological Influences on Trace Gas Transport along the North Atlantic Coast during ICARTT 2004

1
Institute for the Study of Earth, Ocean, and Space, University of New Hampshire, Durham, NH 03824, USA
2
Department of Physical Oceanography, Woods Hole Oceanographic Institution, Woods Hole, MA 02543, USA
3
Department of Earth and Atmospheric Sciences, University of Houston, Houston, TX 77204, USA
4
Department of Chemistry, SUNY-College of Environmental Sciences and Forestry, Syracuse, NY 13210, USA
5
Cooperative Institute for Research in Environmental Sciences, University of Colorado Boulder, and NOAA Earth System Research Laboratory, Boulder, CO 80305, USA
*
Author to whom correspondence should be addressed.
Atmosphere 2014, 5(4), 973-1001; https://doi.org/10.3390/atmos5040973
Submission received: 27 February 2014 / Revised: 7 October 2014 / Accepted: 30 October 2014 / Published: 4 December 2014
(This article belongs to the Special Issue Air Quality and Climate)

Abstract

:
An analysis of coastal meteorological mechanisms facilitating the transit pollution plumes emitted from sources in the Northeastern U.S. was based on observations from the International Consortium for Atmospheric Research on Transport and Transformation (ICARTT) 2004 field campaign. Particular attention was given to the relation of these plumes to coastal transport patterns in lower tropospheric layers throughout the Gulf of Maine (GOM), and their contribution to large-scale pollution outflow from the North American continent. Using measurements obtained during a series of flights of the National Oceanic & Atmospheric Administration (NOAA) WP-3D and the National Aeronautics and Space Administration (NASA) DC-8, a unique quasi-Lagrangian case study was conducted for a freshly emitted plume emanating from the New York City source region in late July 2004. The development of this plume stemmed from the accumulation of boundary layer pollutants within a coastal residual layer, where weak synoptic conditions allowed for its advection into the marine troposphere and transport by a mean southwesterly flow. Upon entering the GOM, analysis showed that the plume layer vertical structure evolved into an internal boundary layer form, with signatures of steep vertical gradients in temperature, moisture and wind speed often resulting in periodic turbulence. This structure remained well-defined during the plume study, allowing for the detachment of the plume layer from the surface and minimal plume-sea surface exchange. In contrast, shear driven turbulence within the plume layer facilitated lateral mixing with other low-level plumes during its transit. This turbulence was periodic and further contributed to the high spatial variability in trace gas mixing ratios. Further influences of the turbulent mixing were observed in the impact of the plume inland as observed by the Atmospheric Investigation, Regional Modeling, Analysis and Prediction (AIRMAP) air quality network. This impact was seen as extreme elevations of surface ozone and CO levels, equaling the highest observed that summer.

1. Introduction

The composition and dynamics associated with pollution plumes released from coastal source regions are of eminent importance to regional air quality and larger scale continental outflow. Over the northeastern coast of the U.S., this is especially true, where pollution plumes are regularly emitted from urban/industrial sources along the East Coast that directly impact downwind locations in coastal New England and Eastern Canada [1,2,3,4,5]. It has further been observed that frequently these plumes contribute to large scale pollution outflow, traveling hundreds to thousands of kilometers in stable lower tropospheric layers over the Atlantic Ocean, eventually adding to aggregated flows of pollutants that comprise North American continental outflow. Like the upper level forms of outflow (e.g., that facilitated by warm conveyor belts), these flows can measurably influence the composition of the marine atmosphere, as well as surface conditions in Western and Central Europe [6,7,8,9,10].
Low level outflow (LLO) is a form of continental outflow which is achieved within the lower tropospheric layers and occasionally the marine atmospheric boundary layer (MABL) itself. In previous studies, LLO has been identified as pollutant flow leaving the continent and traveling below 3 km in altitude [10,11]. Such cases of outflow can result from a variety of forcing mechanisms. Cooper et al. [12] identified the post-cold front air stream as one common mechanism of ventilation into shallow layers of the troposphere during the passage of weaker low pressure systems and full mid-latitude cyclones. Case studies of lower tropospheric transport over the North Atlantic during the summer of 2003 by Owen et al. [11] suggested a range of meteorological conditions may lead to the onset of LLO events. Employing Lagrangian model simulations in support of observations at the Pico Mountain observatory in the Azores (PICO-NARE), Owen et al. [11] analyzed cases of LLO in response to forcing of North American pollution into the lower free troposphere (0–2 km) by weak synoptic activity and the maintenance of shallow detached layers across the Atlantic.
Most similar instances of LLO begin as regional scale processes where pollutant laden continental air masses undergo significant transformations at the coastal boundary as they move into the marine atmosphere. These transformations are forced by abrupt land-sea differences in roughness lengths, vertical moisture and heat fluxes, as well as surface temperature gradients present along the coastline [3,11,13,14]. Numerous efforts have described such scenarios, including Owen et al. [11] who found that along the North American Atlantic coast, “exported continental plumes produce pollutant layers in a statically stable atmosphere with weak vertical mixing”. Dacre et al. [15] added that these polluted coastal layers are generally shallow residual layers of the continental boundary layer which are eventually advected into the lower marine troposphere. The authors continue that this advection can be a function of local mesoscale processes, such as the sea-breeze and coastal land-sea flow patterns, which, in their study, facilitated shallow ventilation and boundary layer trace gas transport over the Atlantic and North Sea. Once coastal plumes enter the lower marine troposphere, Owen et al. [11] advanced that “over time, as the continental air mass travels over the ocean, an internal boundary layer develops”. Details of this transformation of the continental/plume layer into a stable internal boundary layer (IBL) above the marine boundary layer have been established in the literature [16,17]. Importantly, this evolution of coastal plumes further implies that LLO and the shallow ventilation of boundary layer pollutants may then occur in the absence of strong, synoptic scale forcing events.
Recent efforts have shown that influence of LLO events on regional, as well as intercontinental, surface conditions has been significant. In regional analyses, Chen et al. [5] employed principal component analysis in determining that 58% of the variance of the airmasses influencing Northern New England was associated with emissions from nearby coastal source regions, such as Boston and New York City (NYC). Over larger scales, Li et al. [18] showed that 30% of the North American CO exported in the summertime occurs below 3 km in altitude based on extensive global model simulations.
The focus of this study centers on atmospheric conditions over the Gulf of Maine (GOM) region during the summer of 2004, with specific focus on LLO event case study whose evolution was tied to regional coastal processes. Through the extensive observations and modeling efforts made in conjunction with the International Consortium for Atmospheric Research on Transport and Transformation (ICARTT) campaign, this event has become one of the more well studied instances of LLO in the literature. Beginning on 20 July 2004, a low level plume (hereafter the 7/20 plume) was observed emanating from the New York City (NYC) source region and flowing along a mean southwesterly flow into the Gulf of Maine (GOM). Neuman et al. [19] employed aircraft observations to present the 7/20 plume’s detachment from the surface which facilitated the transport of reactive nitrogen and other chemical species over extensive distances. Mao et al. [4] and Riddle et al. [20] provided further Lagrangian observations of the plume and influences of the lower atmospheric winds on its transit from Long Island Sound LIS and across the GOM. Methven et al. [21] advanced a novel Lagrangian method of tracking observed plumes across the North Atlantic (including the 7/20 case study) through the use of whole air samples from the aircraft intercepts to construct hydrocarbon footprints in conjunction with trajectory model forecasts. Real et al. [22] and Cain et al. [23] added to this Lagrangian approach, advancing new insights into the processes influencing the plume’s chemical transformation and ozone production in particular based upon photochemical model simulations. In addition, these authors advanced that potential errors in their Lagrangian analyses may have derived from uncertainties in the lower tropospheric wind fields used to force the trajectory forecasts and diagnose mixing and transport in their simulations. Riddle et al. [20] added that discrepancies in the global European Centre for Medium-Range Weather Forecasts (ECMWF) wind analyses were particularly large over the GOM while Mao et al. [4] presented regional model simulations that indicated that divergence in the lower altitude winds may have been significant during the 7/20 event. Lee et al. [24] advanced model simulations that further confirmed the thermal structure of the atmospheric layers above LIS and the GOM were essential to the plume transport.
These works provide motivation for the present study which builds upon previous efforts to better understand LLO and the dynamics of the coastal circulation as transport pathways of the North American continental outflow. The National Oceanic & Atmospheric Administration (NOAA) WP-3D flights in particular during the ICARTT campaign yielded invaluable observations of the composition and structure associated with low-level pollution transport from the Eastern U.S. during the summer of 2004. Three sequential flights between 20 July and 22 July provided the unique opportunity to observe flow of a freshly emitted plume along the northeast coast, into the GOM and its eventual outflow into the Western North Atlantic. Specific objectives of our study were to employ these observations in a quasi-Lagrangian manner to investigate the composition and dynamics of such regional plumes, influences of the local marine atmospheric boundary layer (MABL) on plume transport, and the contribution of such plumes to North American continental outflow.

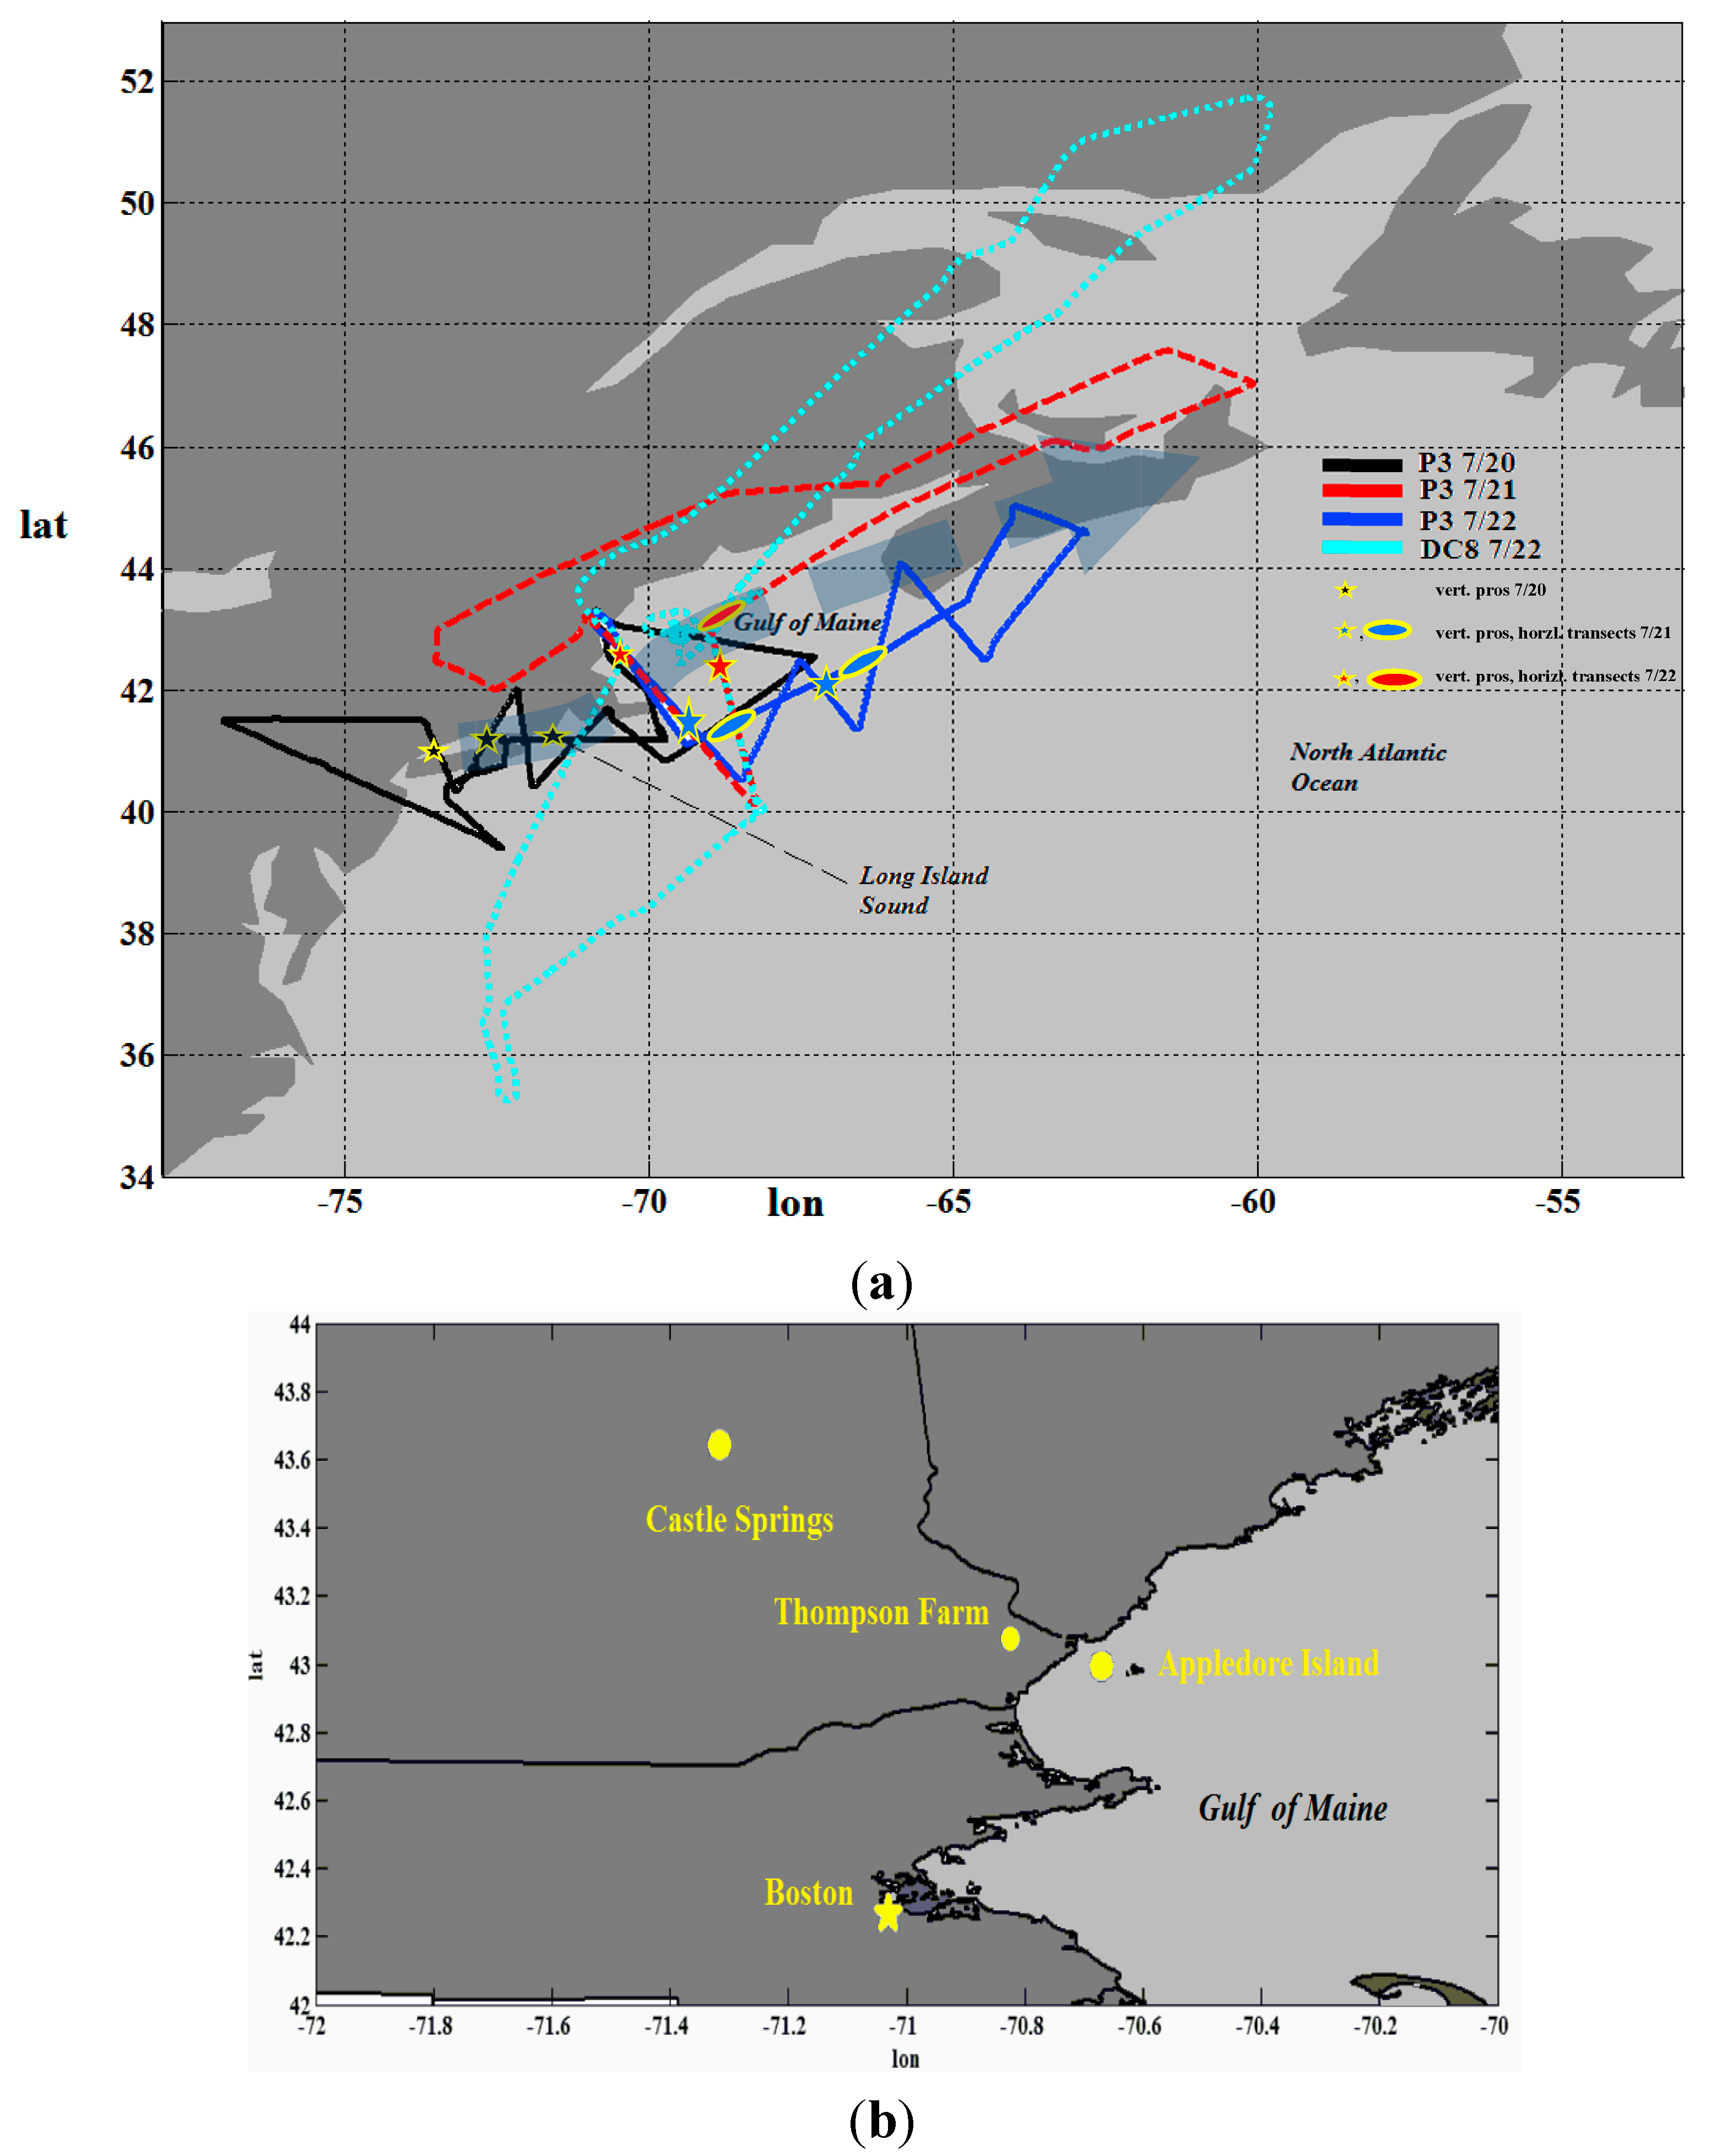
2. Methods, Data, and Campaign Details

The primary airborne trace gas observations in the coastal and marine atmosphere investigated were obtained onboard the National Oceanic & Atmospheric Administration (NOAA) WP3-D Orion research aircraft (P3) [25]. During the campaign flights, O3, NO2, and NO, were measured by chemiluminescence methods and SO2 measured by pulsed UV fluorescence [26]. Additional reactive nitrogen species (e.g., HNO3, and Peroxyacetylnitrate (PAN) species were measured by chemical ionization mass spectrometry [27], and NOy was determined from the sum of its individually measured constituents. In situ volatile organic carbon compounds (VOCs) were sampled using a proton transfer reaction mass spectrometer with additional can samples measured using a gas chromatograph-mass spectrometer [28]. CO measurements were obtained by vacuum ultraviolet (VUV) resonance fluorescence [29]. Typical vertical ascent and descent rates of the aircraft were on the order of 5–6 m/s resulting in an approximate vertical resolution of 5 m while mean horizontal speeds centered around 100 m/s yielding 100 m horizontal resolution. Corresponding observations of additional physical and chemical parameters taken onboard the NASA DC-8 flying in the same region were also used in the analyses. Flight tracks for the missions conducted during the period of interest are shown in Figure 1a. These data sets are available and described further at the NOAA Earth System Research Laboratory site: http://www.esrl.noaa.gov/csd/projects/2004/ and the NASA Earth Missions webpage: http://www.espo.nasa.gov/intex-na/. Whole air samples (WASs) obtained onboard the P3 and DC-8 provided insight into 74 additional chemical species within the 7/20 plume (Table 1). Halocarbons in these samples were of particular interest, since they are generally found well mixed in the troposphere except in close proximity to source regions [30]. Many halocarbons also have relatively long lifetimes compared to plume transport, with their primary removal mechanism being their reaction with OH [1]. As described in previous works [30,31], halocarbon species function well as urban industrial tracers and as seen in this analysis, are a means of tracking the 7/20 polluted airmass. Hence, tracking of the plume was achieved through the analysis of the WASs obtained during the three P3 flights and one overlapping National Aeronautics and Space Administration (NASA) DC-8 flight in that period with a high correlation between CO and selected anthropogenic halocarbons (as well as other long lived anthropogenic tracers, such as ethyne) enabling its location to be determined. This determination was also made in conjunction with visual inspection of the aircraft vertical profiles made and numerous Hybrid Single Particle Lagrangian Integrated Trajectory Model (HYSPLIT) model trajectories.
Figure 1. The region of interest with flight tracks of the NOAA P3 and NASA DC-8 on 7/20, 7/21, and 7/22 is shown in (a); A highlighted sub-region encompassing the three AIRMAP surface stations used is presented in (b). A grey arrow marks the path of the plume as described in previous works.
Atmosphere 05 00973 g001
Table 1. Analysis of selected Whole Air Samples taken within the plume layer over NYC on 7/20, as well as over the GOM on 7/21 and 7/22. Included are maximum and mean values for each species, and correlations with CO calculated to the 95% confidence level in each case.
Sample Species720 Correlations720 Max720 Means721 Correlations721 Max721 Means722 Correlations722 Max722 Means
CH2Cl20.893264.10082.7730.92663.60043.8500.80223.77021.478
CHCl30.97928.78017.2970.91622.31016.4320.79822.68020.525
CH3CCL30.97628.60025.0550.95225.70024.4830.77316.01012.640
CCl40.55098.00096.0910.16798.00096.3330.1624.9004.398
C2Cl40.950188.00049.3600.96240.20018.0470.76225.00024.100
C2HCl30.85928.0008.9450.9535.8003.0220.69796.00095.667
Halon_12110.9536.0204.7440.9074.8504.5100.7041.4000.853
DMS0.41015.510803.5950.4340.3900.2400.4780.9600.480
MeONO20.9955.4703.5260.4340.3900.2400.4780.9600.480
EthONO20.9196.5604.2760.8687.4805.2050.7151.3100.635
ETHANE0.9602840.0001693.2730.5012423.0001591.2000.5872.2401.533
ETHYNE0.9861062.400472.0360.954493.900313.6800.8242.3501.568
PROPANE_MSD0.9561694.000721.0000.8921029.000620.6700.774383.000272.830
I_BUTANE0.969519.500162.2180.851193.10096.7000.45513.0007.167
N_BUTANE0.974670.500225.7550.964255.100122.1800.781374.000269.170
I_PENTANE0.985811.200279.9090.966182.10088.8500.83043.20024.550
N_PENTANE0.980338.300111.9450.96587.00043.1500.82748.30033.900
ISOPRENE0.173800.800218.5550.9150.8000.4670.18537.70018.117
BENZENE0.980268.200108.7450.905111.00069.6170.82317.2009.517
TOLUENE0.964797.800230.2090.781120.40043.6000.7561.7000.583
Ethyl_benzene0.962115.62031.3950.76516.2805.7250.73354.30041.700
DICHLOROETHANE0.8595.374.7620.7314.444.2630.3543.973.05
CH40.9611950.0001856.8180.8071904.0001858.5000.460287.000200.500
Based on the aircraft observations of wind speed, wind direction, water vapor mixing ratio, and potential temperature, further useful parameters were determined to gain insight into the stability and turbulent properties of the plume transport layers. These included virtual potential temperature, θv, based on observed values of potential temperature and water mixing ratio. Vertical gradients of the virtual potential temperature were employed to provide information in the stratification stability and combined with observations of vertical shear in the horizontal wind vectors to determine the gradient Richardson number, Ri,, based on solutions to the Taylor-Goldstein form of the linearized Navier-Stokes equations for quasi two-dimensional flows. Commonly, Ri is a nondimensional ratio that relates the buoyant production or consumption of turbulence to the shear production of turbulence within atmospheric layers. In this study, Ri was used to gauge dynamic stability and the formation of turbulence within a layer. A value of Ri = 0.25 has been established as a critical value separating laminar from turbulent behavior in most geophysical flows. For Ri < 0.25, shear driven Kelvin-Helmholtz instability is manifested forcing turbulent characteristics in the flow [32]. Instantaneous and 5 s averages of wind speed and direction were further used to calculate the turbulent kinetic energy (TKE) within layers. This quantity reflects the mean kinetic energy per unit mass associated with eddies and turbulent motion within a given layer.
Surface observations from the Atmospheric Investigation, Regional Modeling, Analysis and Prediction (AIRMAP) measurement network (http://airmap.unh.edu) as shown in Figure 1b were used in the assessment of the out-flowing plume impact across northern New England. One minute averages of CO, O3, and NOy from the AIRMAP observatories at Appledore Island (AIS), Thompson Farm (TFR), and Castle Springs (CSP) during the ICARTT campaign were the primary surface data sets used with additional canister observations incorporated in the evaluation of halocarbon species. The Appledore Island site is situated 15 km offshore at (42.97°N, 70.62°W), thereby provided insight into coastal surface conditions. Thompson Farm is located at 43.11°N, 70.95°W and is a rural location situated 20 km from the coast. Castle Springs is similarly rural, located 160 km from the coast at 43.75°N, 71.35°W, and was used in the characterization of plume impacts further inland. The period of 1 May to 1 September 2004, was used in the statistical description of seasonal surface conditions at each site.

3. Results and Discussion

A total of sixteen research flights were conducted by the NOAA P3 aircraft between 5 July and 14 August 2004, in conjunction with the ICARTT campaign. Three of these flights were flown between 20 July and 22 July (hereafter flights 7/20, 7/21, and 7/22, respectively) to provide a quasi-Lagrangian vantage point of a fresh plume (the 7/20 plume) emitted from the NYC source region as it transited through the GOM and into the Western North Atlantic.

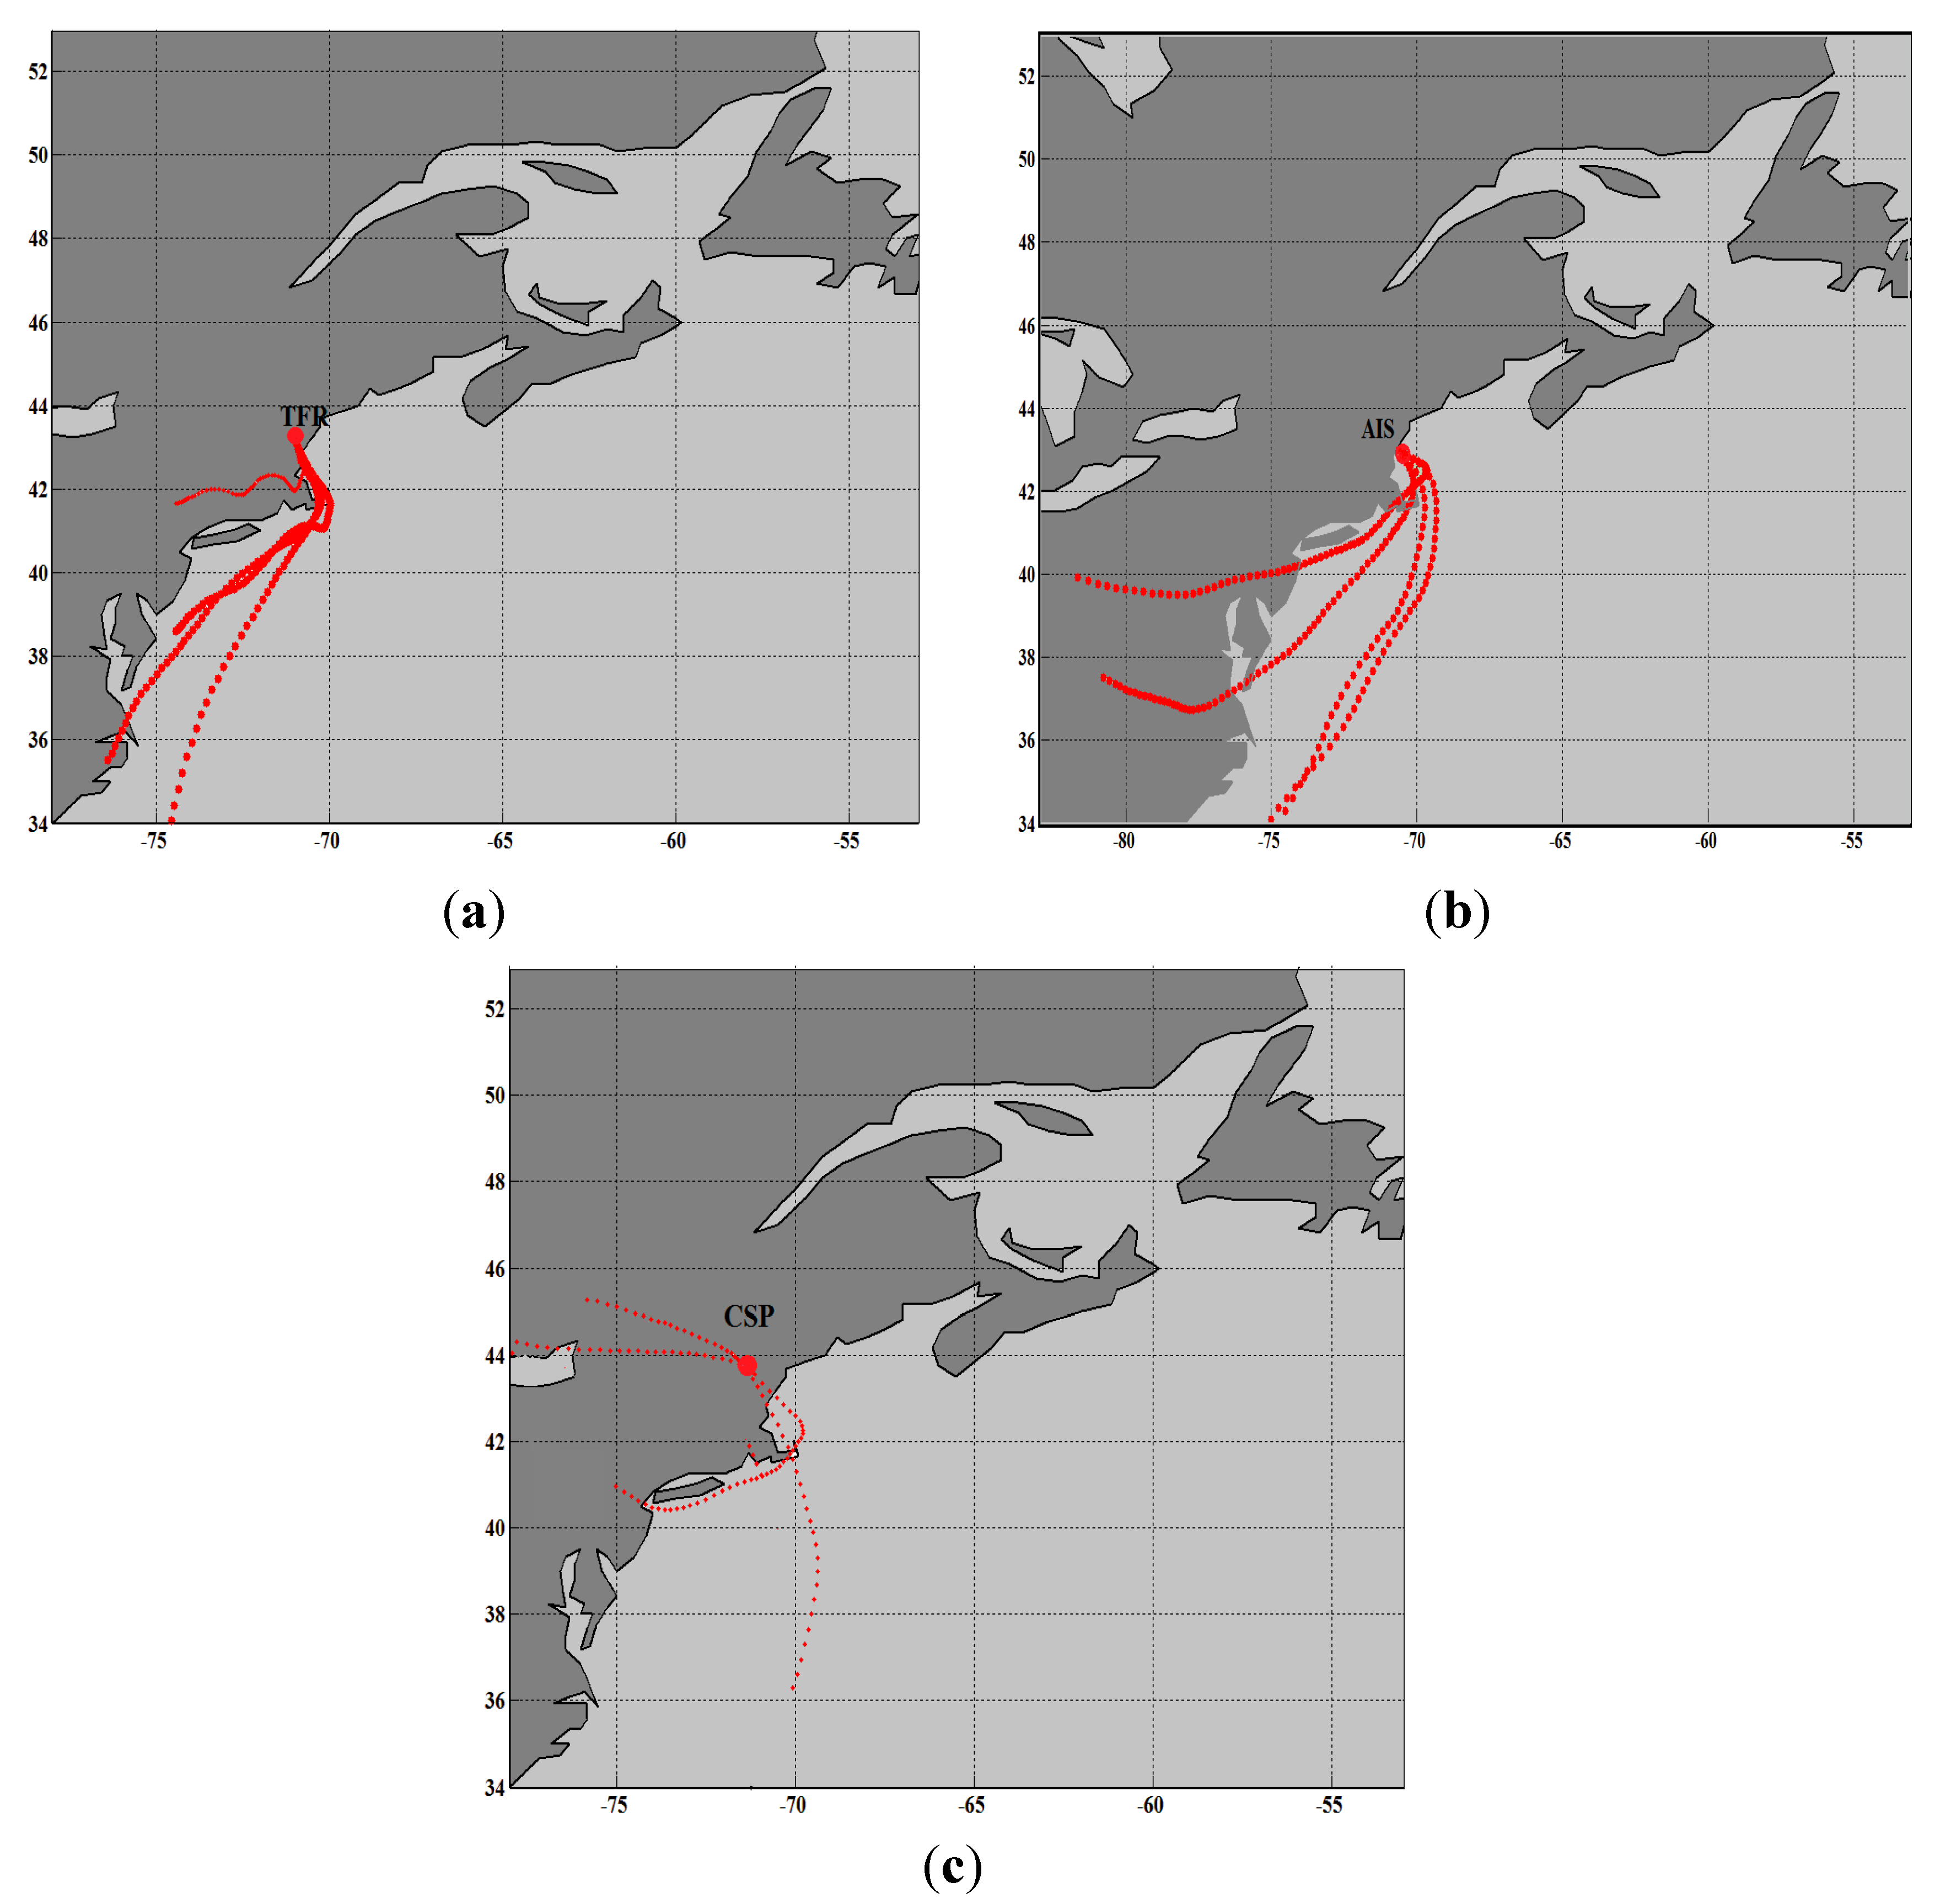
3.1. Development of the Plume

The 7/20 plume case study was characteristic of a low-flowing fresh plume, detached from the surface and ventilated into shallow tropospheric layers under mild synoptic conditions. Regional lower tropospheric conditions captured by the National Center for Environmental Prediction (NCEP) analyses of surface pressure, and 10 m wind speed during the Lagrangian experimental timeframe reflect a slow southwesterly flow parallel to the East Coast from Virginia to Newfoundland (Figure 2).
As discussed in related studies [5,20,21] this flow was established primarily under the influences of the Bermuda High to the southeast of the source region and the Canadian low-pressure system initially centered to the northwest along the northern edge of Hudson Bay. Upper level patterns similarly depicted the influence of these large-scale features within the region with the jet stream maintained northwest of the Great Lakes supplying a relative northeasterly flow aloft. The ventilation of the plume coincided the development of a mild mesoscale low-pressure trough between these larger synoptic features over the Mid-Atlantic states developing near the surface (Figure 2). Over the 21st and 22nd, the Canadian Low translated progressively eastward and strong southwesterly flow was maintained off the North American coast (not shown).

3.2. Day 1: Initial Characterization of the Low-Level Plume

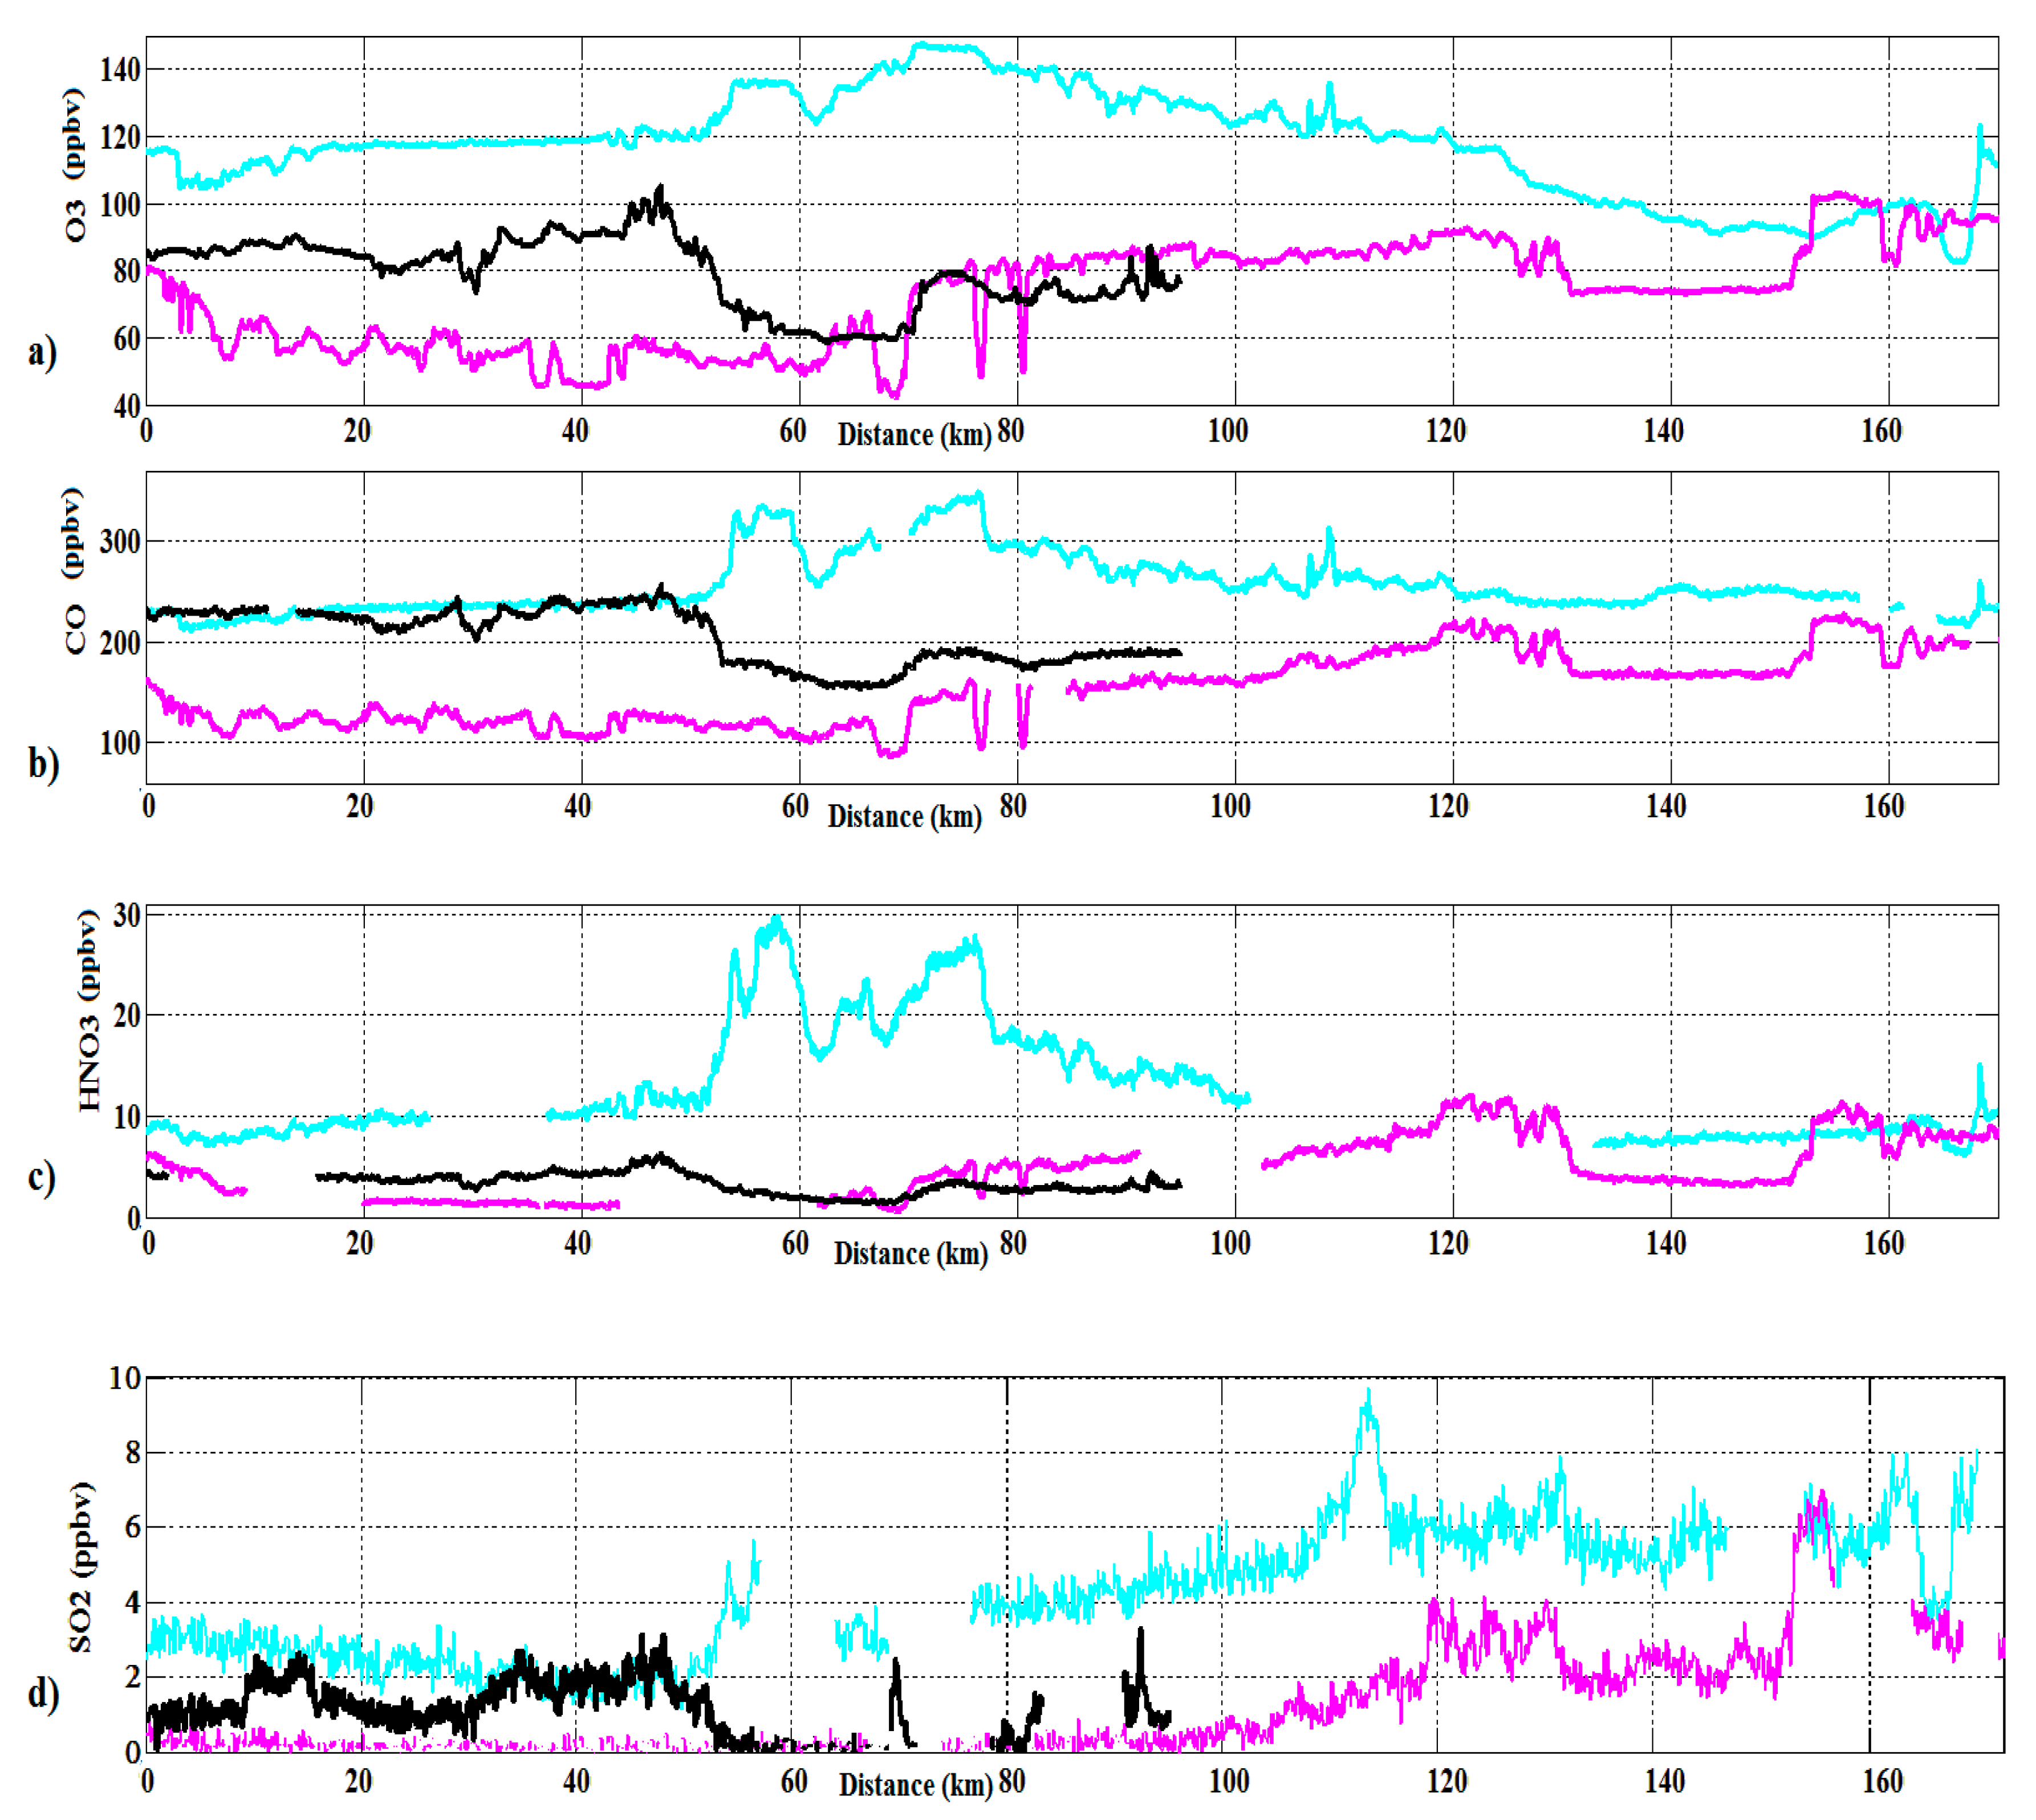
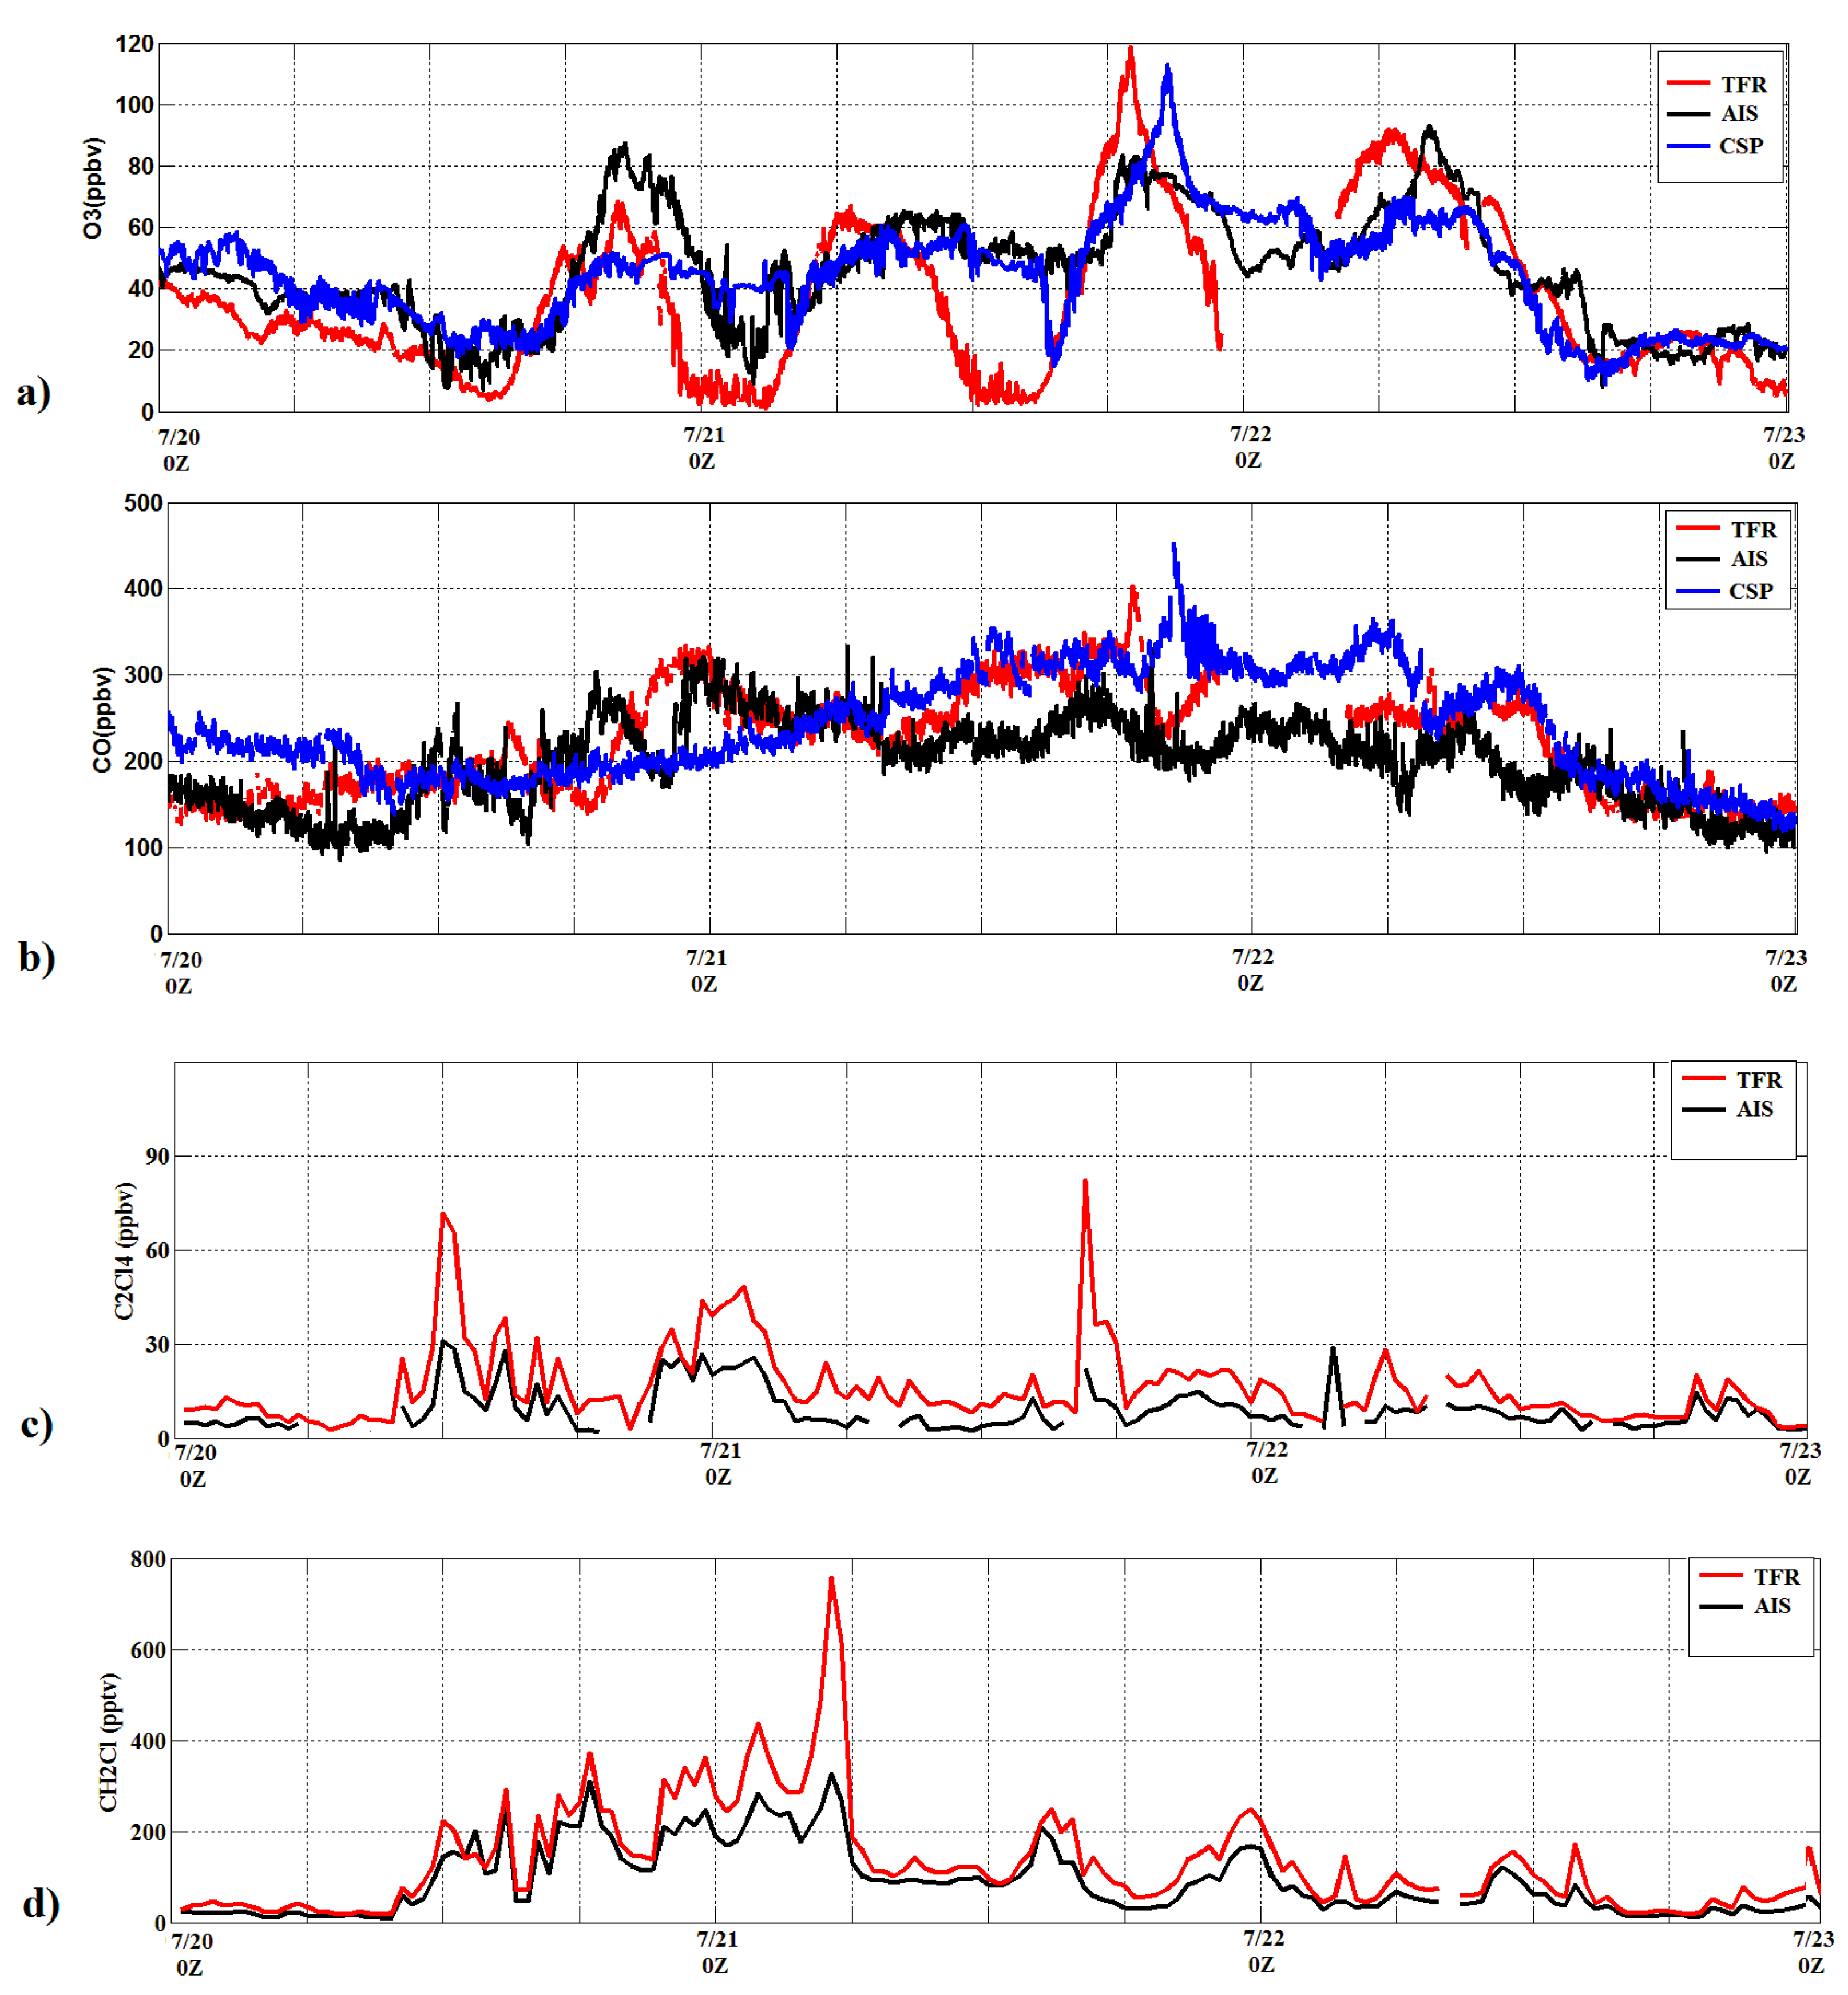
3.2.1. Chemical Composition near Long Island Sound

Initial encounters by the P3 with the plume occurred on 20 July. Departing at 14:00 UTC, this first mission in the three day experiment conducted an eight hour survey of the plume, making multiple crossings between LIS and the southern GOM as depicted in Figure 1a (black line). During the flight, the physical and chemical signatures of the plume were distinct near the NYC source region and coastal atmosphere surrounding LIS. Above these waters and throughout the immediate Atlantic coastline, a series of vertical profiles between 15:30 UTC and 18:30 UTC observed the plume as a polluted airmass residing within a 1500 m thick layer at a mean altitude of 1000 m above the surface and flowing with a southwesterly trajectory.
Figure 2. A daily composite from the NCEP Reanalysis of mean sea level pressure (grey contours) and surface wind speed (color contours) during the initial observation of the plume on 20 July.
Atmosphere 05 00973 g002
Figure 3 shows the structure of the 7/20 plume near the NYC source region as distinguished in the 18:30 UTC vertical profile of its leading constituent species: O3, CO, SO2, and HNO3 (black lines). The plume exhibited detachment from the surface with a vertical center were observed at this altitude, including pronounced enhancements in toluene (798 pptv), methyl ethyl ketone (MEK) (1268 pptv), and benzene (268 pptv) (Table 1), which are characteristically emitted from heavy industry (solvent use) and automobile emissions. An elevation to 2.9 ppbv in SO2 in the plume’s vertical center was also observed and likely derived from regional power plant emissions and local shipping.
Figure 3. Vertical profiles of primary trace gas species and physical parameters observed near the NYC source region on 7/20. Shown are mixing ratios for (a) O3; (b) CO; (c) SO2; (d) HNO3 (all in ppbv) along with (e) theta (K) (f) horizontal wind speed (m/s); (g) turbulent kinetic energy (J/kg); and (h) Richardson number. Black lines correspond to the observations directly over the NYC region at 18:30 UTC; green lines designate the evolution observed 130 km downwind of NYC at 19:20 UTC; and Blue lines mark observations 250 km downwind at 20:00 UTC.
Atmosphere 05 00973 g003
Observations of enhanced mixing ratios of reactive nitrogen were similarly made in the plume’s core over NYC, with NOy measuring 3.0 ppbv and predominantly comprised of HNO3 (2.8 ppbv) (black line, Figure 3d). Following the method set forth in Kleinman et al. [33] and more recently pursued in Slowik et al. [34], the photochemical age of the plume was estimated in terms of these observations. Specifically, the NOx-NOy ratio was employed in the relation:
a g e log ( [ N O x ] / [ N O y ]
As detailed in the reference works, a value of 0 is indicative of fresh emissions while 1 represents photochemical aging of one day or more. For the 7/20 plume, mean mixing ratios of NO and NO2 (not shown) were 0.035 ppbv and 0.16 ppbv respectively in the plume’s vertical center over NYC. Mean NOx levels were then 0.195 ppbv establishing a mean NOx/NOy ratio of 0.068 and a corresponding approximate photochemical age of one to two days. Two-day NOAA HYSPLIT Lagrangian model back trajectories supported this conclusion, indicating that the plume followed a shallow recirculation over coastal and eastern New York, Pennsylvania, and New Jersey during the two days prior to the initial P3 intercept as shown in Figure 4a (red line).
Figure 4. NOAA HYSPLIT Lagrangian model simulations showing the probable (a) back trajectories for two days prior to the initial encounter with the 7/20 plume by the WP-3D and (b) forward trajectories for five days following the same encounter.
Atmosphere 05 00973 g004
The relationships between the primary trace gas constituents in the plume were further examined to provide additional insight into its origins and relative background mixing ratios of the species in the lower troposphere over LIS, and reference levels for determining the evolution of the plume during the remaining period of the study. CO is often considered a general indicator of combustion, and its correlation with O3 was employed here to gauge photochemical processing within polluted airmasses. Recent studies of outflow processing, and which in related studies, have shown to be high in the summer season over the East Coast region of North America [35]. Encounters with the plume in close proximity to the NYC source region above LIS on the 20th suggested that O3 and CO were well correlated. As shown in Figure 5a (black markers), O3/CO ratios within the plume profile near the source region displayed a strong linear relationship, with a regression with a regression slope of 0.205 and corresponding r2 of 0.83.
Figure 5. Selected trace gas relationships with the plume layer and parameters for corresponding linear fits. Shown in (a) and (b) are O3/CO observations by P3 aircraft over the coastal ocean GOM regions respectively. Observations of O3/NOy over the (c) coastal and (d) open ocean are also shown. Corresponding observed CO/NOy over the coastal GOM and open ocean are presented in (e) and (f). Black marks designate observations within the plume over the NYC source region on 7/20, blue markers designate observations over the GOM on 7/21 and green markers designate observations over the GOM on 7/22 with all values being in ppbv.
Atmosphere 05 00973 g005
Recently Zhang et al. [36], Yokelson et al. [37], and Caine et al. [23] have advanced that the use of O3/CO slopes, particularly in in the case of O3 production/destruction, may lead to inaccurate interpretations of enhancement ratios in plume air masses. As Yokelson et al. [37] point out however, distortion in such cases depends on the concentration of the plume and the vertical gradient of mixing ratios surrounding it (or the degree of vertical mixing achieved). For concentrated plumes with strong gradients and little mixing, as observed in the 7/20 plume over LIS and the GOM, distortion is less. Here, the correlations are examined to assess mixing and chemical slope of 0.21 and corresponding r2 of 0.83. This slope is less than the range for surface values over the Eastern USA, which range for 0.3 to 0.5 as reported by Kim et al. [35], in lower tropospheric layers above summertime North America. The O3/CO over LIS slope was considerably greater than that measured at remote downwind locations like Pico NARE (~0.1) values closer to the 0.26 values observed by Daum et al. [10] in similar low flying plumes emanating from the Northeastern US and tracked over the Atlantic during the 1993 North Atlantic Regional Experiment (NARE). The near-source region values sere similarly less than the mean 0.36 values reported in plumes over Sable Island (Canada) [38] which compared well with those presented by Mao and Talbot [4] who observed mean summertime O3/CO slopes of 0.37 using three years of data from AIRMAP surface sites and a mean 0.3 slope reported by Chin et al. [39], for photochemically aged airmasses over the northeastern U.S. In this sense, this finding maintains a pattern of O3/CO slopes being less in plumes over the North Atlantic than over coastal and inland locations.
The O3/NOy relationships derived from the same source region profiles similarly exhibited correlation between the species. However, some variability resulted from probable depositional losses of NOy and possible mixing of aged and fresher emissions within the plume given its two day history. In the 18:30 UTC intercepts, it was seen that a linear relationship (r2 = 0.56) was observed between O3 and NOy, (Figure 5c, black markers) with further analysis suggesting that a mixture of airmasses may have been intercepted during initial plume encounters. At higher NOy levels (>8 ppbv), the correlation was higher (0.68), and reflective of recent emissions, while at lower mixing ratios of NOy (<5 ppbv), the correlation was less (0.49), more suggestive of photochemically aged airmasses and loss of NOy through deposition (not shown). The CO/NOy relationship exhibited clear linearity, with a fitted slope of 9.583 (r2 = 0.96) as seen in Figure 5e. Such close correspondence between CO and NOy is indicative of a common combustion source such as automobiles [10].
Analysis of the WASs obtained during the near-source region vertical profiles provided additional insight into the chemical species within the 7/20 plume (Table 1). Anthropogenic halocarbons observed in the 7/20 plume included the industrial solvent dichloroethane (C2H4Cl2), observed at 5.37 pptv within the plume layer, relative to a background mean of 3.1 pptv observed throughout the remaining flight. Similar enhancements in the level of the dry cleaning agent tetrachloroethylene (C2Cl4) were observed at 188 pptv near the source region. These levels can be compared to a background of 22 pptv determined in other segments of the flight. The heavily used industrial rubber/plastic chloromethane (CH3Cl) also had an enhanced mixing ratio of 531 pptv. Other non-halocarbon anthropogenic indicators were also present in the NYC WASs, including the refining byproducts ethane (~2840 pptv) and ethene (~936 pptv), along with industrial fuel tracers such as propane (~1650 pptv). Acetylene/ethyne, another indicator of incomplete combustion in urban plumes and an excellent tracer for long-range pollution [30], was also present (~1063 pptv) and maintained a high correlation with CO throughout aircraft encounters with the plume over the next two days.
Further correlations between the anthropogenic tracers in the plume WASs and CO were determined near the source region as well during encounters with the plume over the GOM as shown in Table 1. At the 95% confidence level, the correlation coefficients from samples taken over LIS calculated between the two of the most abundant anthropogenic halocarbons within the plume (CH2Cl2, C2Cl4) and CO were 0.95 and 0.89 respectively. Within the same confidence interval, correlation coefficients between tracer ethane, benzene, and propane and CO also exceeded 0.95, further reflecting the anthropogenic origin of the plume and the close proximity to the source region. Mixing ratios of non-anthropogenic indicators near the source region in the WASs also supplied insight in terms of plume history and structure. Isoprene, an indicator of air mass exchange with continental vegetation was observed at 800 pptv while dimethyl sulfide (DMS), an indicator of contact with marine surfaces, was detected at a mean of only 12 pptv within the plume. These observations suggest that during the previous days prior to the aircraft intercept, the plume air mass likely experienced some level of exchange with the land surfaces it passed over while only having limited contact or exchange with the sea surface during the same period. This detachment from the ocean surface was more apparent in the vertical profiles of the physical parameters as discussed below.

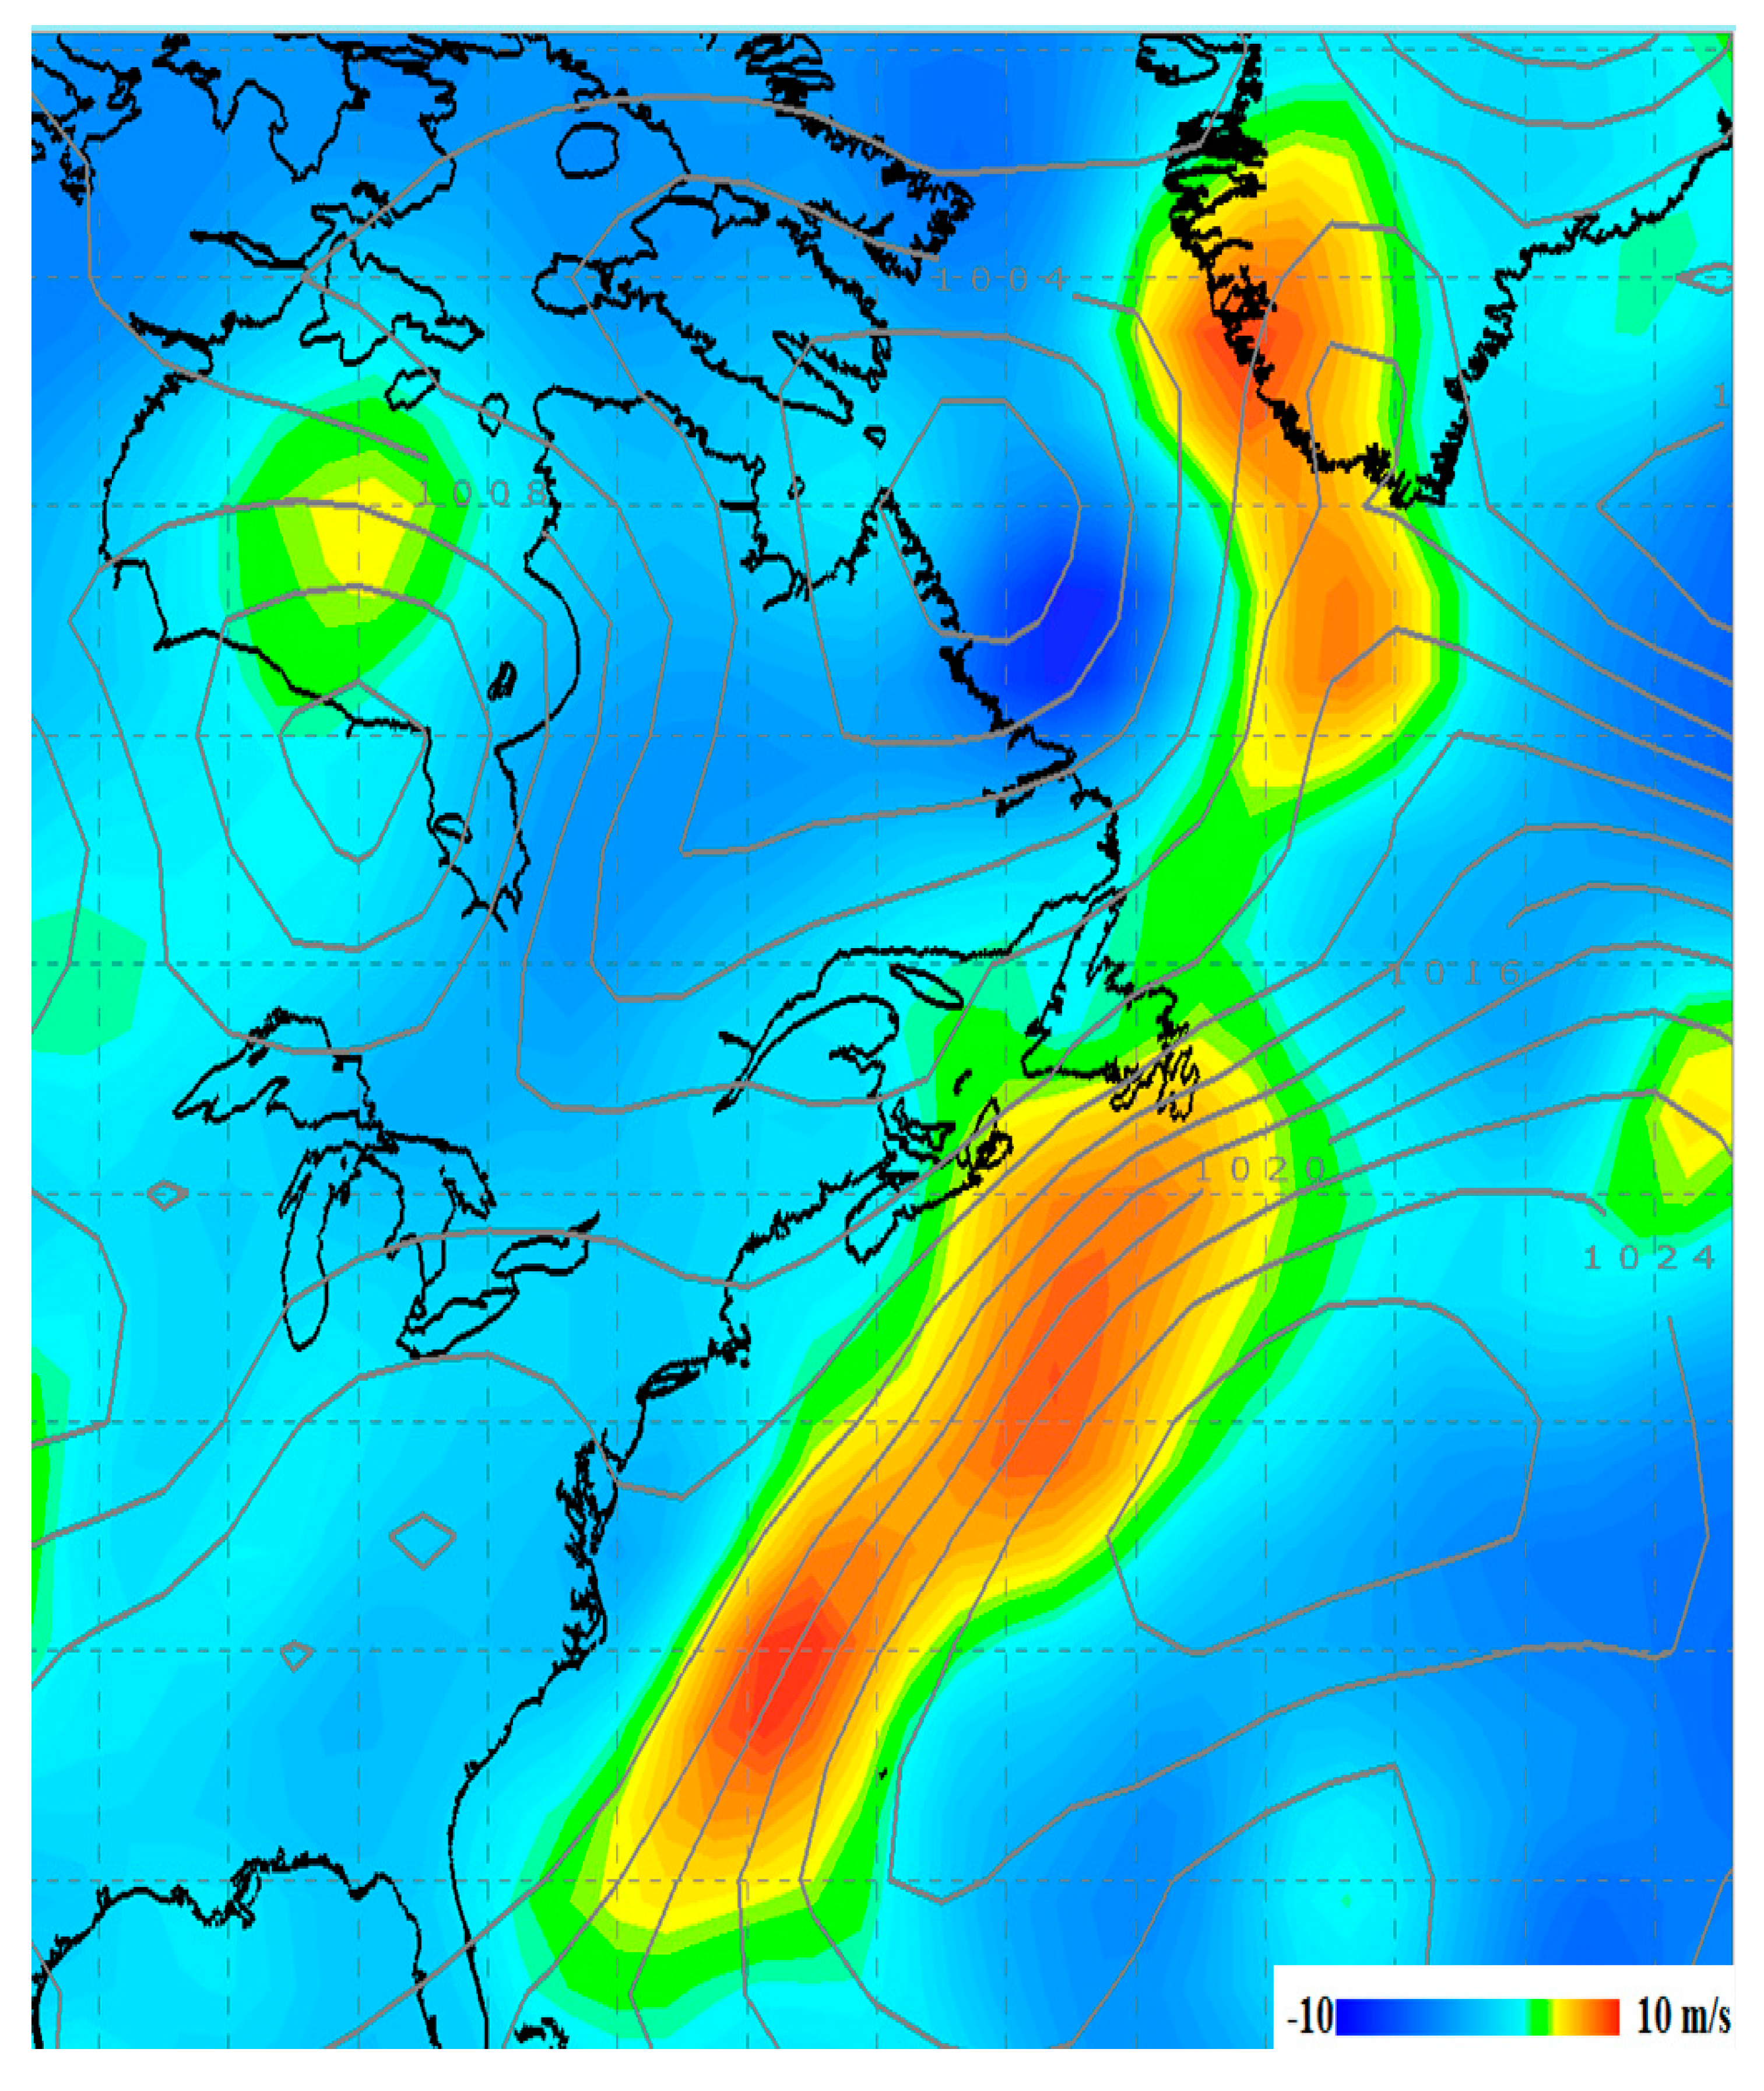
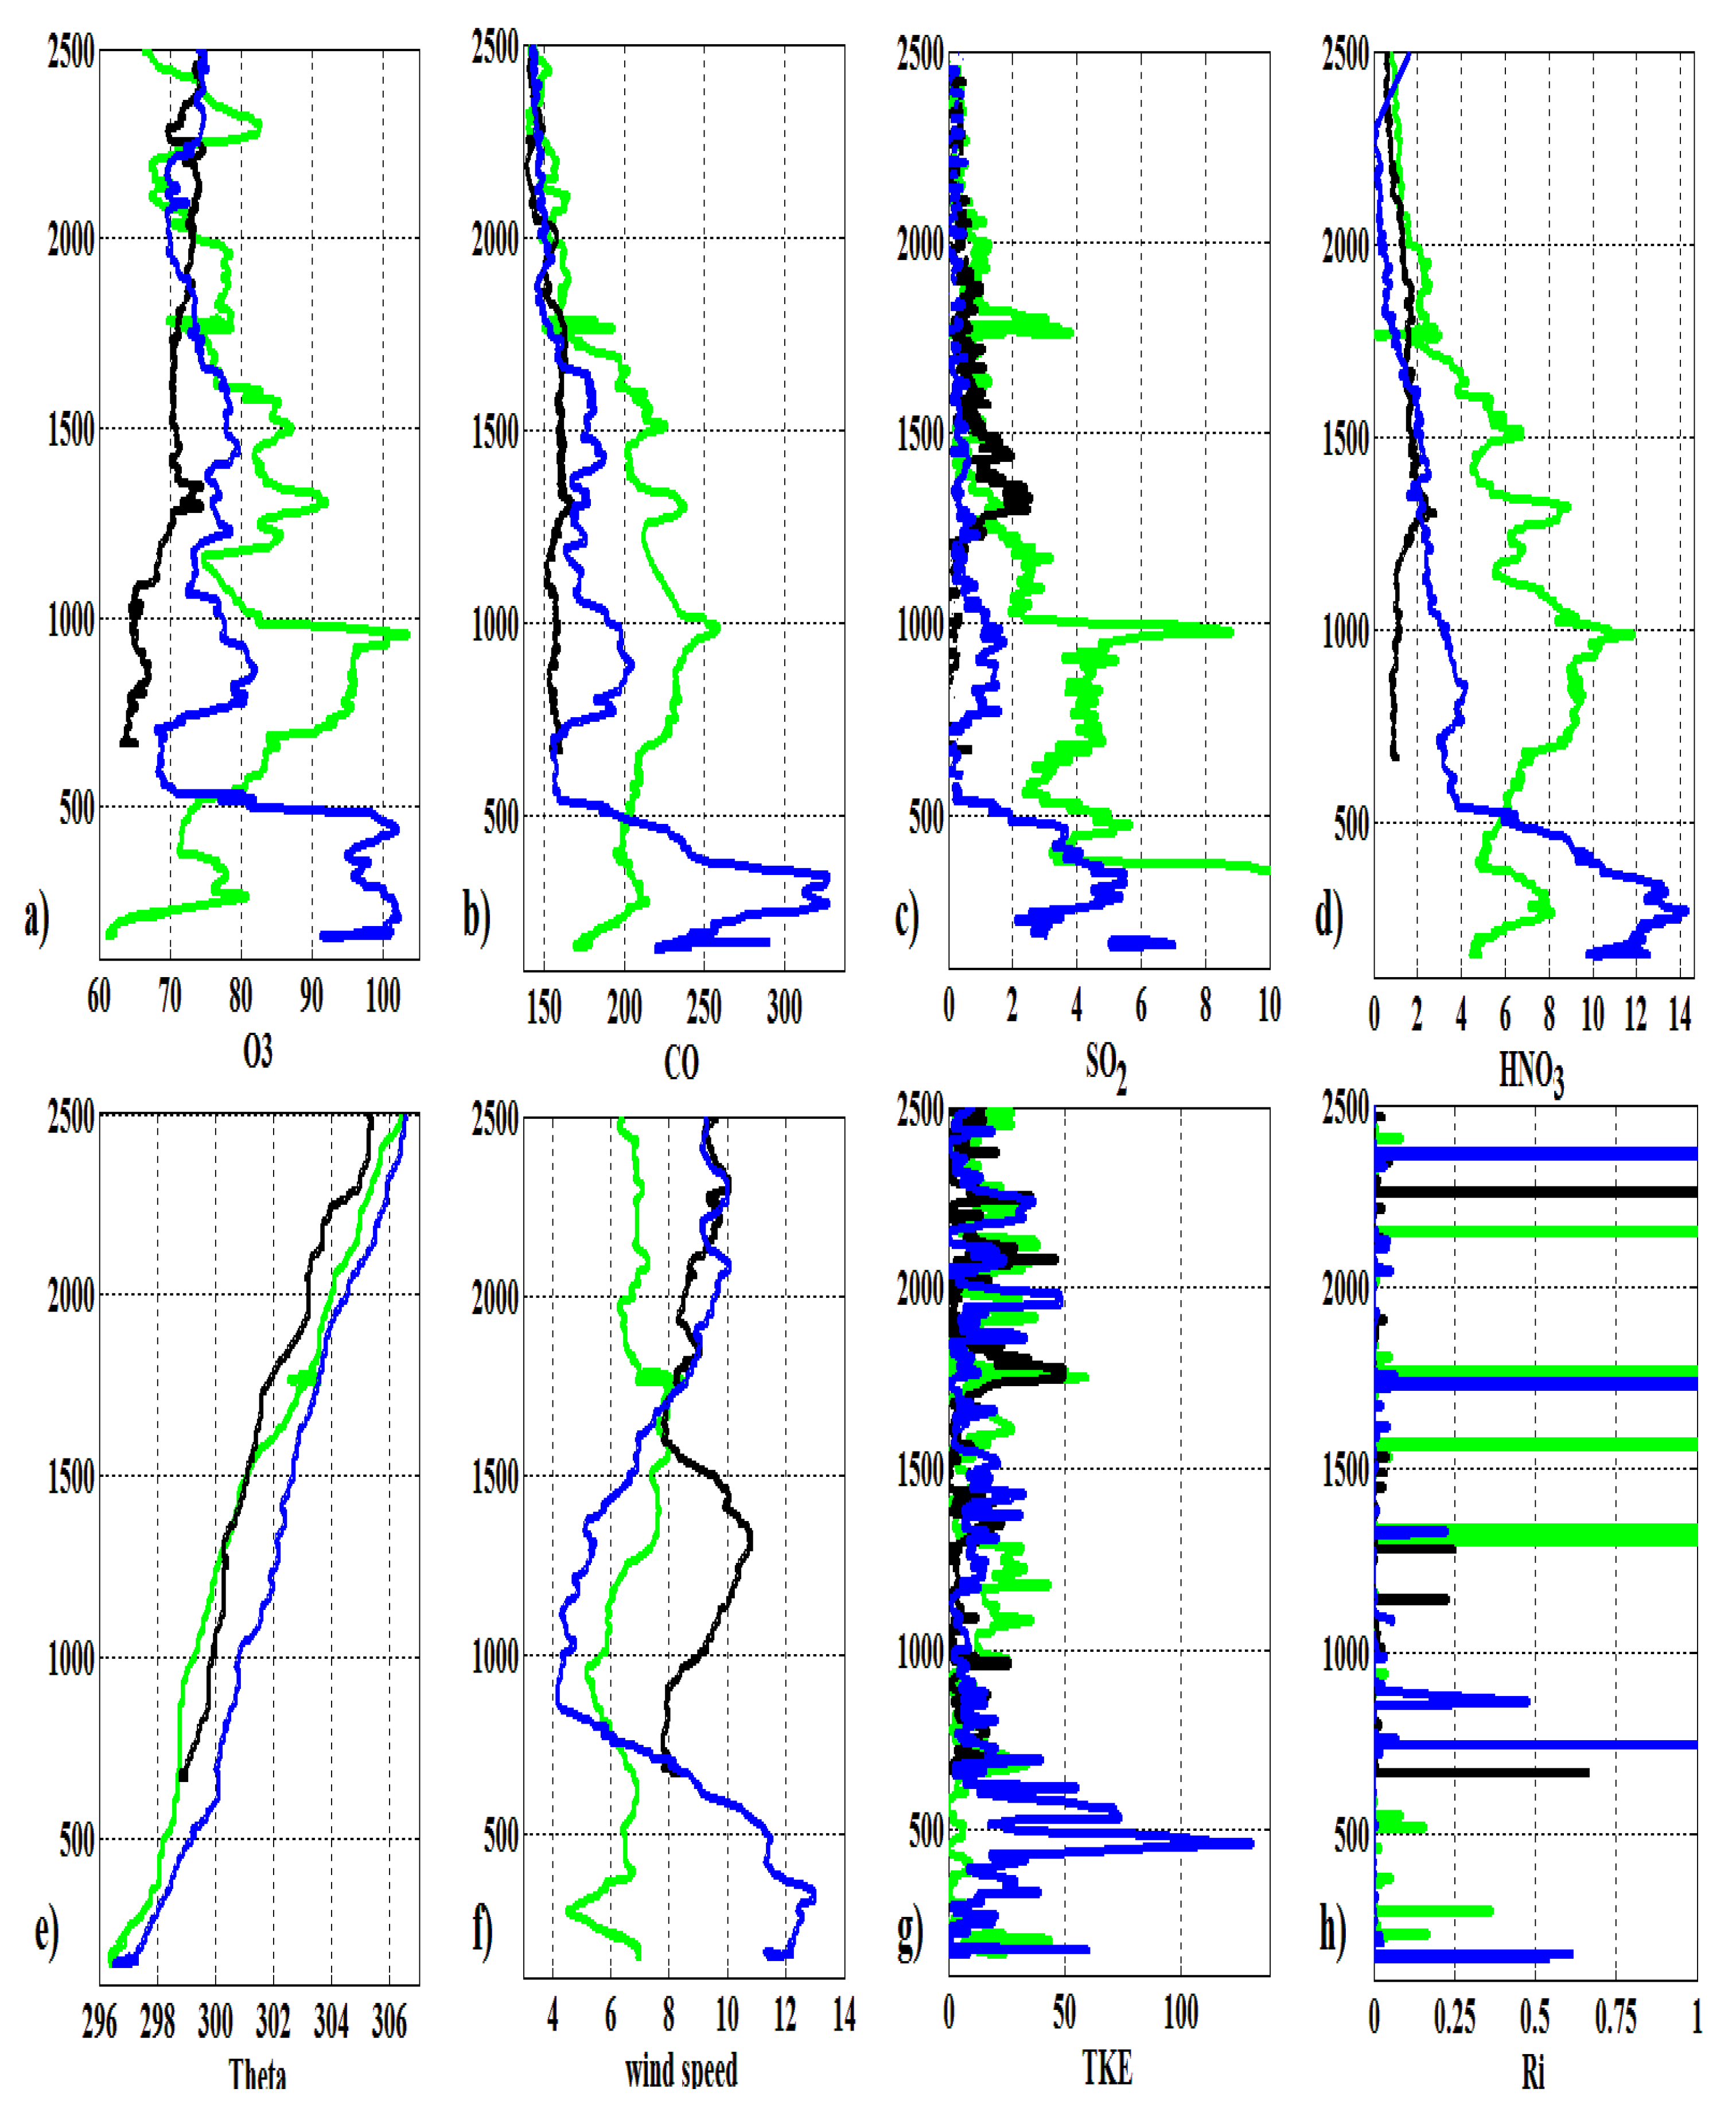
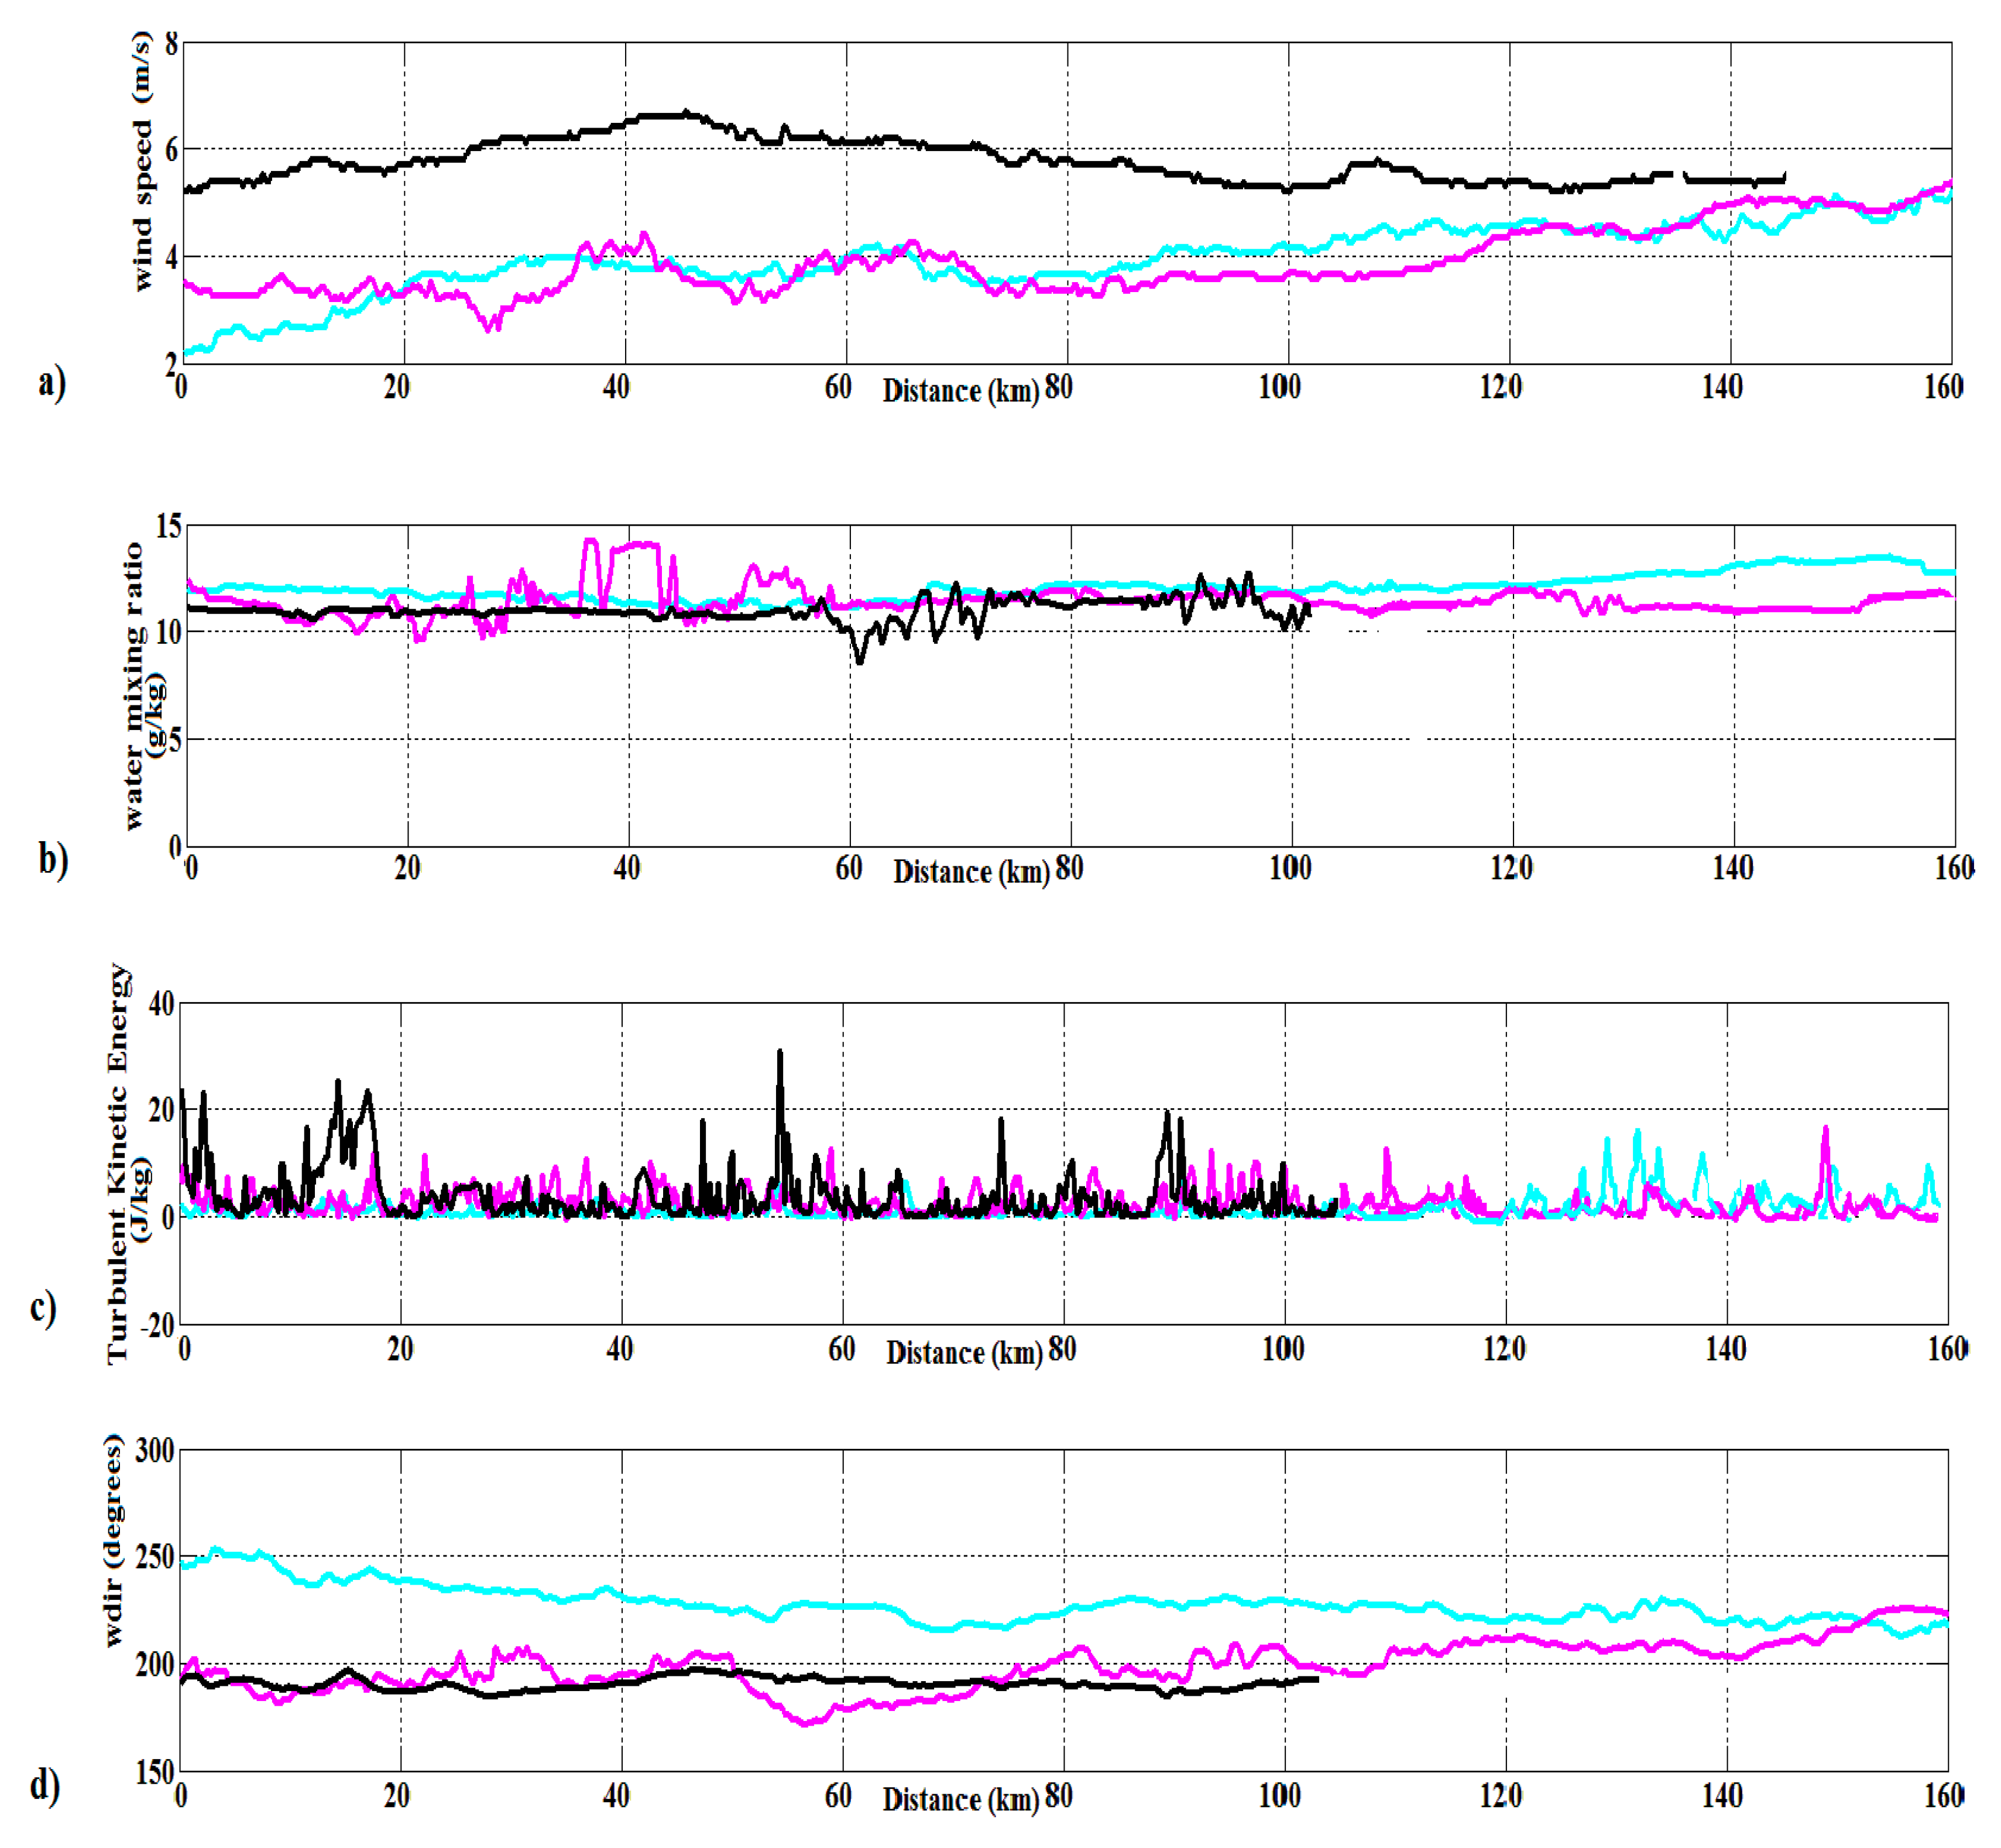
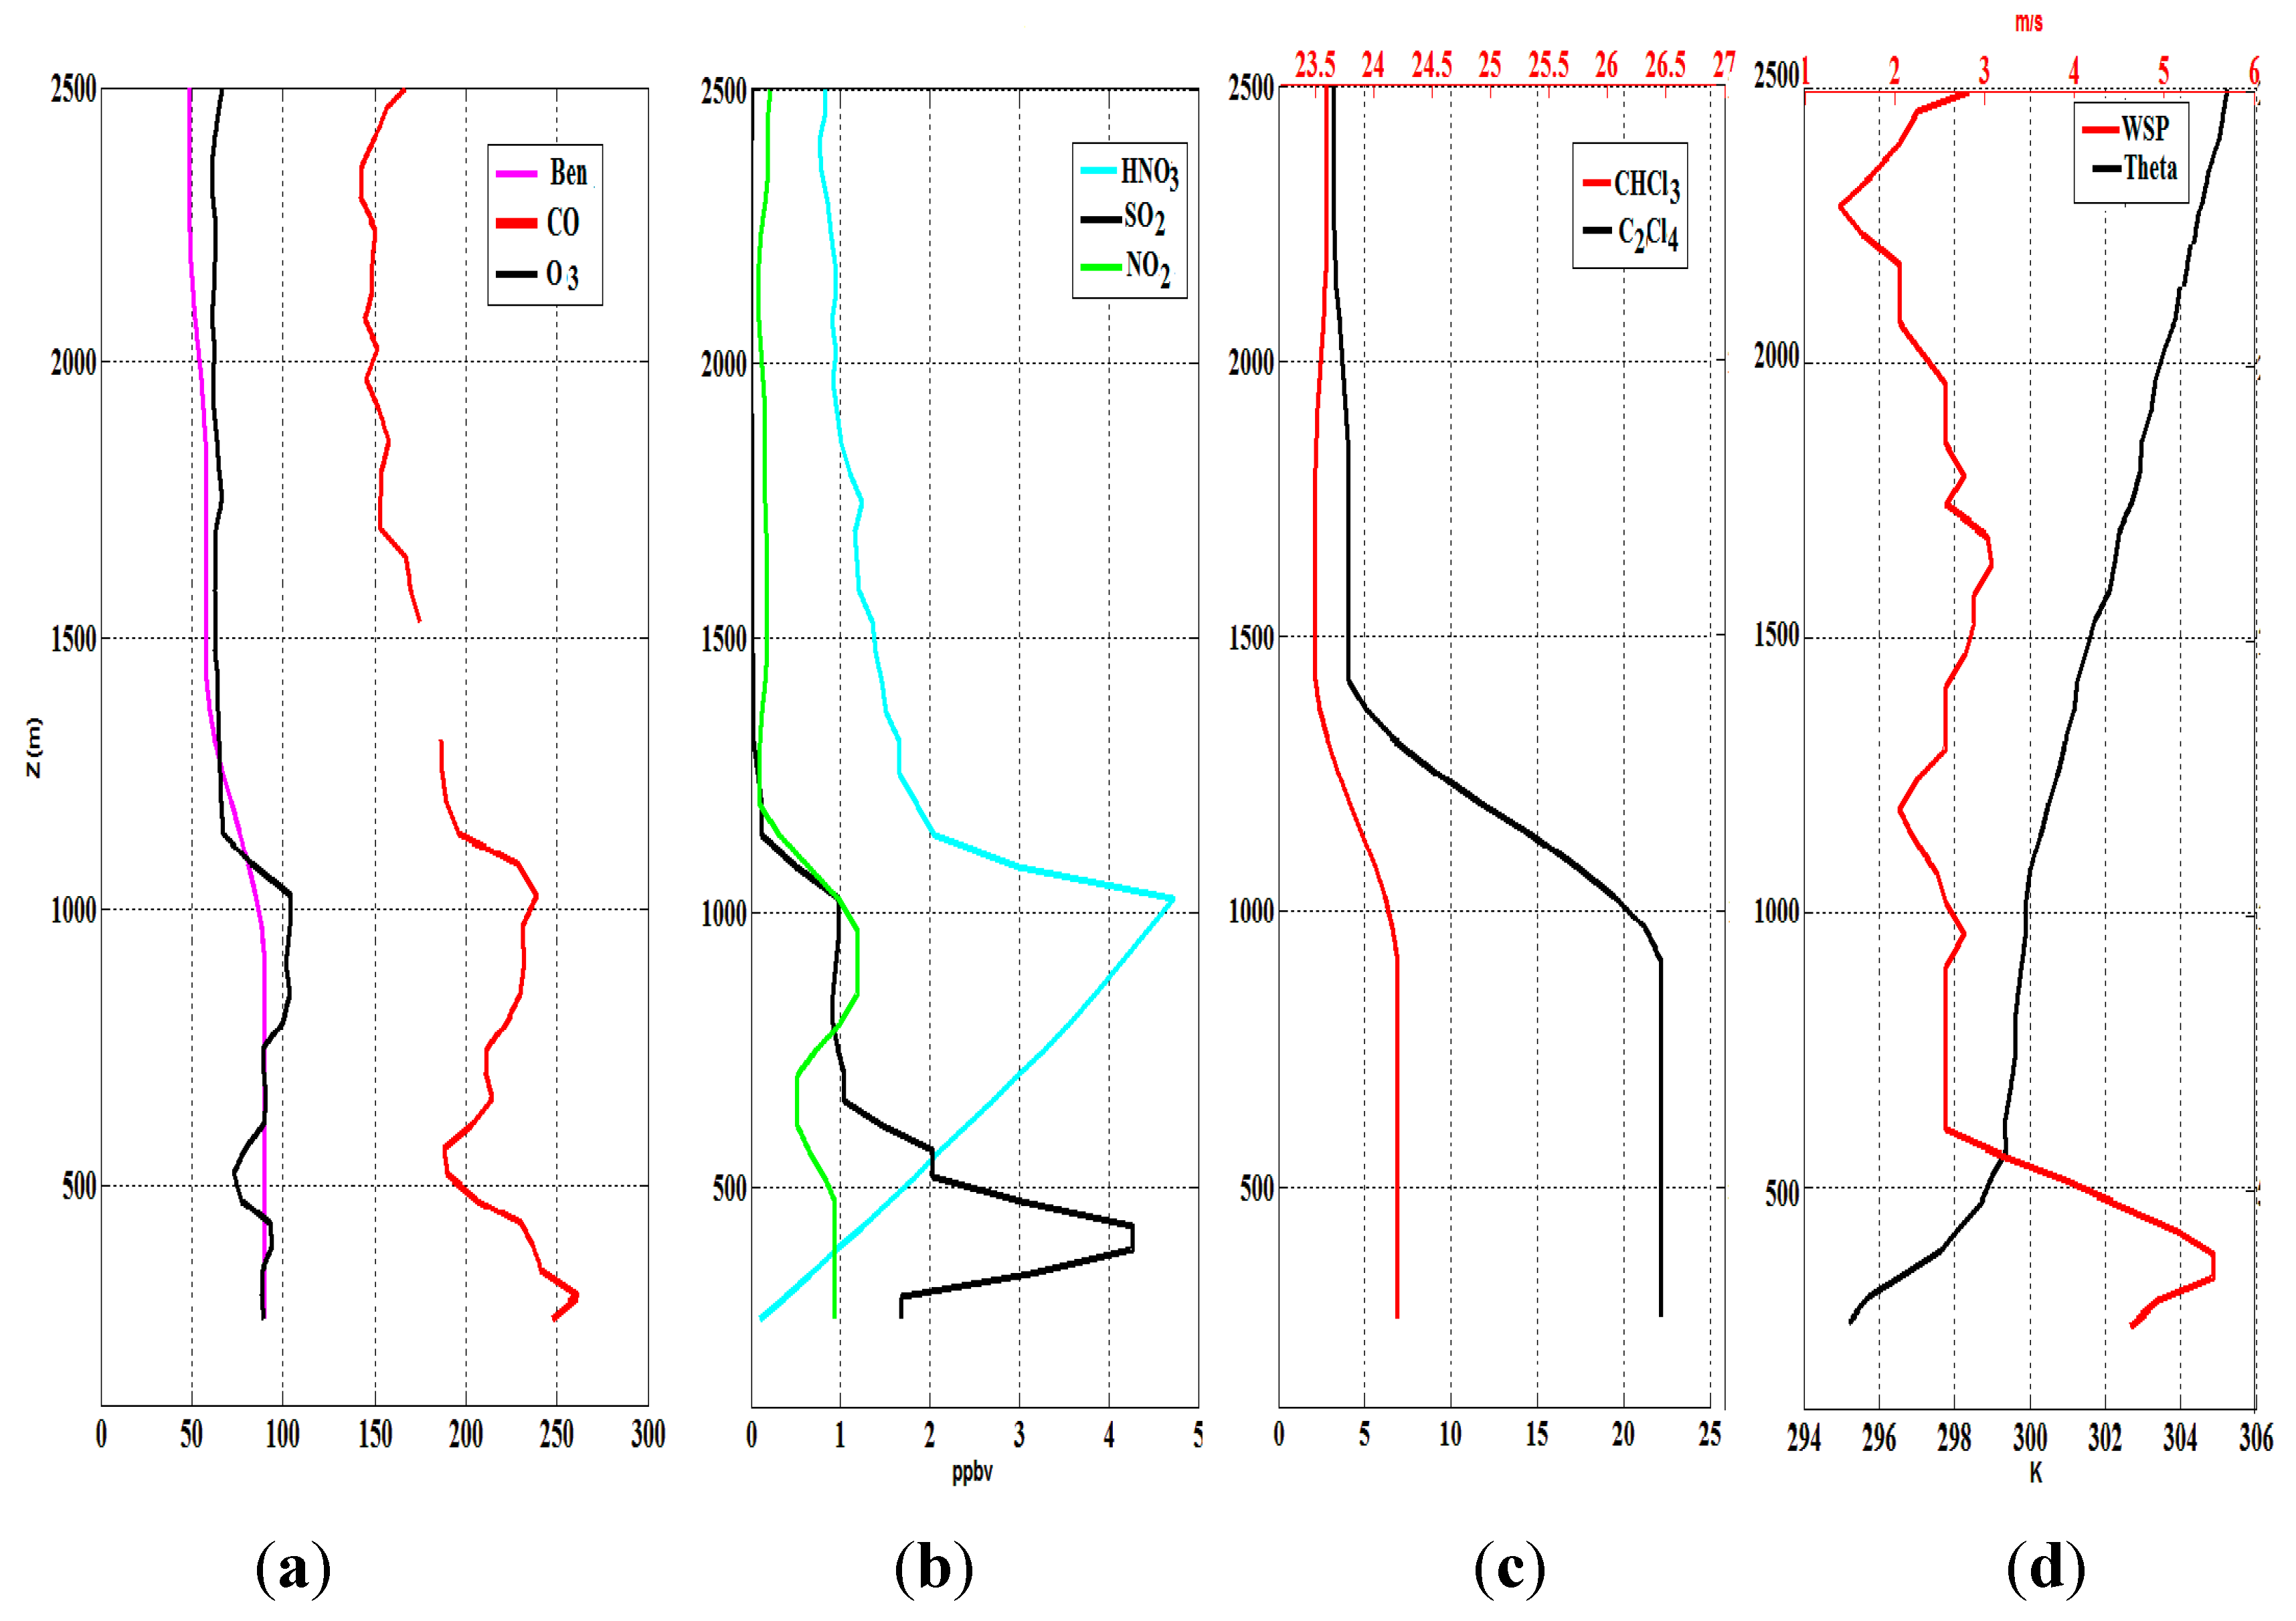
3.2.2. Physical Structure of the Plume Layer

The noticeable detachment of the 7/20 plume from adjacent vertical layers as it flowed away from the source region and towards the GOM was a key aspect to its observed behavior as well as its evolution as a low level flow. Model back trajectories (Figure 4a) and previous studies support the hypothesis that the detachment and release of the 7/20 plume was linked to the accumulation of continental boundary layer pollutants in a coastal residual layer formed in the lower troposphere rather than through the forcing of a single weather event. In this, the residual layer served as a shallow reservoir for continental pollutants and facilitated their outflow above the marine boundary layer in a detached plume-like fashion over LIS on 7/20. Similar observations of residual layer influences have been established in previous studies, particularly near land-sea transition regions, where buoyancy driven flows such as the land/sea breeze contribute to their development in the coastal atmosphere [40]. Over LIS, residual layers have frequently been found in summer months, when land-sea temperature contrasts are larger [41] and observed as reservoirs for boundary layer trace gas pollutants during air quality episodes along the East Coast [42]. In the study conducted here, data further suggested that the residual layer facilitated the long-range transport achieved by the plume through its advection into the lower troposphere and over the marine boundary layer, thus, detaching it from surface interactions in a similar fashion to that described by Dacre et al. [15] and Fochesatto et al. [43].
Directly above the source region, the physical state of the atmosphere surrounding the plume was characterized by well-stratified structure with stability evidenced by the profiles of θ (Figure 3e, solid black line). The plume containing the residual layer itself was distinguished by a jet-like increase in wind speed centered about a vertical peak of the plume (1300 m), with a maximum of 10.9 m∙s−1 (Figure 3f, solid black line). This jet exerted considerable influence on the flow and was observed clearly in the Lagrangian balloon launches analyzed by Riddle et al. [20]. Enhanced wind speed from this feature was observed in conjunction with a ~30° shift in wind direction and a 20% increase in the water vapor mixing ratio compared to the layers surrounding the plume. The mean dew point temperature of the layer reached 19.3 °C. Despite this near saturation of the plume layer, shear produced by the sharp vertical gradient in wind speed and direction appeared to also give rise to clear instances of turbulence within it.
A value of 0.25 is considered to be the critical point for the Ri separating turbulent and non-turbulent regimes in the atmosphere [44,45]. Conditions favoring turbulence in the plume layers were observed in the near source region profiles, as indicated by values of Ri between 0.16 and 0.30 between 600 m and 1300 m in altitude (Figure 3h, solid black line). Coupled with this, an increase in vertical velocities was observed, ranging from 0.3 to 0.5 m∙s−1 (not shown). The enhanced vertical motion was also observed within the plume layer, which coupled with the vertical gradient in the horizontal wind speed, contributed to increases in TKE at the upper and lower bounds of the plume layer (1700 m and 980 m, respectively) (Figure 3g). These observations were further consistent with the diagnosis of mechanically driven turbulence in the layer, often taking the form of overturning motions associated with Kelvin-Helmholtz instability and leading to the development of small sub-grid scale eddies. The presence of this turbulence is inherent in residual layers, and has been seen to influence air quality, via the down-mixing of pollutants during the growth of the mixing layer in the morning [46]. Mahrt et al. [47] further suggested that transport within the residual layer is ensured by similar sporadic bursts of turbulence.
Additional aircraft intercepts on 7/20 captured the plume’s downwind transformation from an airmass residing in a residual layer to a shallow defined flow en route to the GOM. Influenced by the intense wind shear observed in the lower marine troposphere, and radiative cooling by the underlying sea surface, initial stages of this transformation were observed at 19:20 UTC, 130 km downwind of the NYC profile. Subsidence of the plume’s vertical center down to 980 m was evident in the profiles of O3, CO, SO2, and HNO3 (Figure 3a–d, green lines). While horizontal wind speeds were reduced from their NYC magnitudes, significant rises in TKE were recorded in the plume profile and corresponding drops in the Ri values between 500 m and 1500 m (Figure 3e–h, green lines) marked episodes of shear driven turbulence as seen earlier. Continued evolution was observed 300 km downwind as seen in profiles of trace gases and physical parameters observed at 20:00 UTC (Figure 3a–h, blue lines). Between Narragansett Bay and Buzzards Bay, the aircraft observed the 7/20 plume as a distinct low level flow, detached from the surface layer and moving steadily out of the southwest. In this new configuration, the plume exhibited a 500 m thickness, as distinguished in the trace gas profiles. The vertical center could be seen between 250 and 300 m above the sea surface, where peaks of O3, CO, SO2, and HNO3 reached 103 ppbv, 337 ppbv, 6 ppbv, and 14 ppbv, respectively. A further distinguishable characteristic was a jet-like increase in horizontal wind speed, with maximum amplitudes reaching 12–13 m/s. Resulting horizontal shear contributed greatly to increased TKE (130 J/kg) as well as the persisting low Ri values (0–0.3) within the layer, strongly suggesting the continued presence of turbulent motion during the plume’s transit.

3.3. Low-Level Plume Transit and Evolution on 7/21 and 7/22

Previous analyses of the 7/20 plume have established that its mean path was northeastward into the GOM, across Nova Scotia, Newfoundland, and then across the North Atlantic towards the United Kingdom [4,20,21,22,23]. This southwesterly track was evident in an ensemble of 48 hour forward trajectories computed following the P3 encounters with the plume over LIS on 7/20 (Figure 4b). Further verification of this trajectory and a survey of its expanse over the GOM region was also achieved by multiple intercepts by the P3 and DC-8 aircraft on 7/21 and 7/22, which additionally provided observations for the assessment of the plumes transformation. As discussed further below, differences in the plume’s characteristics and its transformation were seen over the coastal as well as the “open ocean” waters of the GOM observed in these intercepts.
Figure 6. Aircraft profiles over the coastal GOM of (a) O3; (b) CO; (c) SO2 and (d) HNO3; Corresponding observations of the same trace gas species over the western Atlantic/eastern GOM are shown in (eh). Blue lines represent observations on 7/20, red 7/21 and black 7/22 with all trace gas observations measured in in ppbv.
Atmosphere 05 00973 g006

3.3.1. 7/21~Day 2

The NYC plume was readily identifiable during the flights on 7/21 through the analysis of the WASs obtained in the lower marine troposphere. As seen in Table 1, the signature of a high correlation between anthropogenic halocarbons and CO observed near the NYC source region was retained in the samples taken within the plume layer over the GOM on 7/21 and 7/22. The CH2Cl2-CO, C2Cl4-CO, and C2HCl3-CO correlations remained nearly unchanged on 7/21, each exceeding 0.9 at the 95% confidence level and facilitated tracking the plume while over the GOM region. Additional correlations determined between ethyne, propane, butane, and benzene were similarly high, within a range of 0.8 to 0.9 with the same confidence interval. However, while this signature of the NYC plume was clear in the WASs as it entered the GOM, aircraft intercepts made on 7/21 revealed that the plume structure continued to evolve significantly during the preceding 24 h of its continued transit, with distinct differences in its characteristics over the coastal GOM versus the open North Atlantic. Some of these differences appeared to be driven by coastal atmospheric influences while others could have derived from significant divergence in the MABL winds.
As the plume was intercepted on 7/21 over the coastal GOM, it was observed at one-quarter its near-source region thickness. Enhancements in the primary species’ mixing ratios still distinguished the plume layer between the surface and 500 m, as CO levels peaked in the coastal profile at 246 ppbv, O3 at 83 ppbv, SO2 at 4.2 ppbv, HNO3 at 5.8 ppbv, and benzene at 109 pptv (Figure 6a,d, red lines). A subsequent profile made 5 h later to the northeast revealed the full lateral expanse of the plume as well as significant differences in its characteristics farther out to sea. As seen in Figure 6e–h (red lines), peak mixing ratios in the primary species over the open North Atlantic were similar to those observed nearer the coast, as CO reached 337 ppbv, O3 103 ppbv, SO2 7.2 ppbv, and HNO3 12.9 ppbv. This difference appeared to be linked to reduced cooling (i.e., slightly warmer temperatures) of the plume layer further out to sea as well as the presence of more vigorous turbulent motion indicated by the larger amplitudes (roughly 2 ×) of TKE (Figure 7g, red lines).
Turbulent characteristics remained apparent throughout the majority of the vertical profiles over the GOM with Ri values persisting well below the 0.25 (Figure 7d,h, red lines) indicative of instances of dynamic instability. A ~130 J/kg intensification in TKE (Figure 7g, red line) was evident throughout the plume layer in much the same way that was observed near the source region; However, with the subsidence of the plume to a near surface altitude, the physical characteristics of plume layer over the GOM more closely resembled those of a coastal internal boundary layer than the residual layer encountered over NYC.
Classical references describe internal boundary layers as frequently being generated in the lower atmosphere and primarily arising from discontinuities in surface properties [44,45]. Within the coastal atmosphere, IBLs result from air masses advected across the coastline, where large differences in surface roughness and surface buoyancy (heat and moisture) fluxes are present on either side. In the literature, different works have identified coastal IBLs over the ocean as the mixed layer overlying the marine surface layer [48,49,50] while others identify it as the thin boundary between the advected continental airmass and the marine surface layer [24]. Despite this minor confusion, a much more developed understanding of coastal IBLs has evolved over recent decades, largely due to increased field observations such as those in the ICARTT campaign. While Craig [48] made the earliest measurements of IBLs over the GOM, Raynor et al. [49] conducted the most extensive observations of the IBLs in the regional marine atmosphere and advanced insights that were directly applicable to the observations of the 7/20 plume. Specifically, these authors determined that the slope of IBLs over the coastal North Atlantic is sharpest near the coastline, and determined primarily by the turbulence within the layer. This finding was confirmed in the analysis of coastal IBLs over the Irish Sea by Rogers et al. [50]. In this work, it was shown that shear driven turbulence contributes to the IBL thickness and the maintenance of the IBL overall. As the author stated, “the growth of a stable internal boundary layer has been found to be dependent upon a balance between the mixing of cool air by turbulence generated by shear-driven turbulent kinetic energy (TKE) and an increase in the stable stratification of the layer due to buoyancy-driven heat loss to the surface”. This was similarly apparent in the aircraft observations over the GOM between 7/20 and 7/22, where increased TKE manifested within the plume layer, particularly over the open ocean as shown in (Figure 7g) where a corresponding cooling (Figure 7e) and eventual reduction of TKE was observed on 7/21 and 7/22 indicating the plume layer was progressing equilibrium with underlying ocean surface.
Figure 7. Aircraft profiles over the coastal GOM of (a) potential temperature (K); (b) horizontal wind speed (m/s); (c) turbulent kinetic energy (TKE, J/kg); and (d) Richardson number values; Corresponding observations of the same parameters over the Western Atlantic/Eastern GOM are shown in (eh). Blue lines represent observations on 7/20, red 7/21 and black 7/22.
Atmosphere 05 00973 g007
In the case of the NYC plume, IBL characteristics of the transport layer developed as the plume airmass residing in a residual layer of the continental boundary layer was advected over the coastal waters of Long Island Sound, overrunning the MABL in the process. Distinct stages of plume layer’s evolution towards the IBL-like structure were clearly discernible during the aircraft intercepts, as shown in Figure 3. From these, it was seen that, the plume was initially encountered in a residual layer of the continental atmospheric boundary layer near the NYC source region (Figure 3a–d, black lines). Subsequent transformations were evident in the downwind encounters (moving from northeastward from NYC to the GOM). As seen in the mixing ratio profiles of O3, CO, SO2, and HNO3 presented in Figure 3a–d, adjustment of the plume airmass to its new surroundings was manifested in its subsidence towards the surface.
The observed changes in the 7/20 plume layer closely resembled that IBL described by Skyllingstad et al. [17] with its evolution from a coastal IBL into a near-neutral layer with a shallow mixed layer above over time and distance being similar to the observations reported by Smedman et al. [51]. Understanding of this layer transformation has become a key to the analysis of LLO across the Atlantic. Despite the absence of significant forcing, Owen et al. [11] observed the transport of North American plumes from the Eastern U.S. to the Azores in detached layers just above the MABL. In this, decoupling of the continental airmass, usually through the formation of a residual layer following the diurnal fluctuation of the daytime boundary layer, is the ventilation mechanism for the plume’s release. Very similar scenarios have recently detailed in the coastal atmospheric study by Dacre et al. [15] and observed during previous field campaigns in the North Atlantic, as reported by Gong et al. [52].
Figure 8. Physical characteristics of the NYC plume layer observed during transects by the P3 on 7/21 and 7/22 over the GOM. Shown are (a) horizontal wind speed (m/s); (b) water vapor mixing ratio (g/kg); (c) turbulent kinetic energy (J/kg); and (d) wind direction (degrees). Cyan lines designate observations from the coastal GOM transect on 7/21, magenta lines the oceanic GOM transect on 7/21, and black lines the central GOM transect on 7/22.
Atmosphere 05 00973 g008
As these and other related studies have pointed out, the coastal IBL structure can play a significant role in low-altitude regional transport, particularly over the GOM [3,9,13,14,52]. While these efforts have illuminated the significant bearing IBL’s manifest on vertical exchange and mixing, a unique quality of this study was the direct observation of physical and chemical properties influenced by this structure and resulting impacts on trace gas processing and transport. In terms of physical characteristics, horizontal transects made by the P3 on 7/21 and 7/22 observed that many properties of the plume layer/IBL were remarkably constant over extensive distances across the GOM. As shown in Figure 8a,b (cyan lines), wind speed and potential temperature each exhibited smooth gradients within the plume layer, during a 160 km transect within the plume at 250 m in altitude above the southeastern GOM. A second 160 km transect performed within the plume at 350 m in altitude over the northeast along the GOM-open North Atlantic transition region provided observations that similar structure persisted further out to sea (Figure 8a,b, magenta lines). In each case, winds within the IBL/plume layer were consistently southwesterly, ranging from 2 to 5 m∙s−1. Temperatures of the layer were similar as well, with a mean of 297.2 K, while the water vapor mixing ratio ranged from 10 to 14 g/kg.
Figure 9. Trace gas observations of (a) O3; (b) CO; (c) HNO3; (d) SO2 within the NYC plume layer as observed in horizontal transect performed by the P-3 on 7/21 and 7/22. Cyan lines designate the coastal GOM transects and magenta lines the open ocean GOM transects on 7/21. Black lines designate observations made during a transect over the central GOM on 7/22.
Atmosphere 05 00973 g009
In contrast, trace gas observations made during the same transects exhibited high degrees of spatial variability and with two distinct regimes being apparent over the coastal and open ocean waters. As shown in Figure 9a,b, O3 and CO of the 7/20 plume varied significantly, even over short spatial intervals. Within the same southern GOM transect discussed earlier, CO mixing ratios oscillated 160 ppbv about a mean value of 205 ppbv, and O3 ranged ±70 ppbv about a mean value of 117 ppbv (cyan lines). Similar behavior was observed in HNO3, SO2 (Figure 9c,d, cyan lines). In comparison, wide fluctuations in trace gas mixing ratios over the western GOM-open Atlantic suggested lower values but characterized similar behavior (magenta lines). Mixing ratios of CO were generally below 200 ppbv with O3 and HNO3 correspondingly less than 100 ppbv and 12 ppbv, respectively.
The high degree of spatial heterogeneity in the mixing ratios appeared to be a direct result of the persistent turbulence inherent to the IBL structure. Despite this near static appearance of the physical state of the plume layer observed on 7/21, frequent variations in vertical wind velocities (not shown) were recorded in each of the transects made in the plume as well as isolated spikes in TKE, indicating instances of turbulent activity. To some extent this was expected, with previous works firmly establishing that similar turbulent features and inherent characteristics of the growth of an IBL as a balance between the mixing of cool air by turbulence generated through shear driven TKE and an increase in the stable stratification due to buoyancy driven heat-loss to the surface is ultimately achieved [53]. As previously mentioned, the impacts of an IBL on surface mixing ratios of O3 around the GOM has been explored in a number of works, yet none have captured the full magnitude and scale of the IBL-turbulence impact on a passing airmass as seen in the aircraft observations of the 7/20 plume.

3.3.2. 7/22~Day 3

In the absence of new synoptic influences entering the GOM, stability maintained the IBL-like structure facilitating the plumes transit throughout day 3 of the plume study. As seen in Figure 8 (black lines), horizontal transects made within the plume layer on 7/22 observed that the majority of its physical characteristics remained unchanged. As on 7/21, winds maintained a southwesterly flow (a mean 230° in direction) within the layer, with the only exception being an average 2 m/s increase in wind speed on the 22nd. This increase contributed to increased vertical shear in wind speed within the plume and adjacent lower tropospheric layers, and facilitated the continued low Ri values (Figure 7f,l, black lines) well below the critical level, thus indicating frequent shear-driven turbulence and a higher probability of enhanced mixing on 7/22.
These conditions continued to have considerable impact on trace gas mixing ratios and chemical processing rates within the plume that day. As suggested in Mahrt et al. [47] and Dacre et al. [15], the overturning motion is pervasive throughout similar low altitude plumes/IBL layers and contributes significantly to the transit of the plume as well as mixing within it. On 7/22, this appeared to be realized as more concentrated elements of the plume arrived from upwind. Aircraft observations also provided evidence of mixing with recent emissions over the GOM, particularly in the coastal region. As seen in horizontal transects of the plume on 7/22 (Figure 9, black lines), the primary trace gas species retained their high spatial variability. On average, 20% higher mixing ratios were observed in the coastal transect versus that towards the open ocean, as CO mixing ratios approached 400 ppbv and O3 exceeded 100 ppbv. However, NOy remained relatively unchanged at ~6 ppbv with fresh emissions mixing into the plume and reduced deposition resulting from the detached nature of the plume’s transit.
The third day of the plume study also provided a unique cross-platform look at the plume with both the P3 and DC-8 intercepting it over the GOM. These encounters observed the trace gas enhancements clearly in relation to the plume’s vertical structure. Profiles by the DC-8 over the western GOM at 21:00 UTC on 7/22 are shown in Figure 10, and compared closely with the corresponding profiles by the P3 presented in Figure 6 and Figure 7. The vertical distribution of the halocarbon species used in tracking the plume was further seen in the DC-8 observations as well. Particularly evident were the enhancements in CHCl3 (6 pptv), CH3CCl3 (24 pptv, not shown), C2Cl4 (22 pptv), and CH2Cl2 (53 pptv, not shown). However, it should be noted that the apparent homogeneity of the mixing ratios reflects the nature of the species sampling method (i.e., canisters) with repeated values were recorded in the datasets between sampling intervals.
Figure 10. Cross-platform observations of the plume by the NASA DC-8, Shown are profiles of (a) primary trace gases Benzene; CO and O3, as well as (b) HNO3, SO2 and NO2; Profiles of signature halocarbons CHCl3 and C2Cl4 are shown in (c) With physical parameters of wind speed (m/s) and potential temperature (K) in (d).
Atmosphere 05 00973 g010
Some of the increase in key species mixing ratios resulted from processing within the plume and mixing with fresher emissions. In particular, the enhancement in ozone mixing ratios appeared to be a function of the sustained reduction in O3 loss facilitated by the IBL structure. As seen in Figure 5a–f, the plume O3/CO ratios increased substantially from their source region values on 7/20 and particularly on 7/21 where the O3/CO ratios exhibited best fitted slopes of 0.376 and 0.413, respectively (Figure 5a,b). While these slopes were constant over the coastal waters on both days, a decrease from 0.413 to 0.344 was observed farther out to sea. This difference was one indication that lateral mixing may have occurred between the plume and local airmasses over the coastal region between 7/21 and 7/22. This was further suggested from significant changes in the O3/NOy ratios which, over the same period, showed a significant rise over the coastal region and a substantial decrease towards the open ocean and elevation of SO2 over the coastal waters, most likely from nearby power plant emissions and shipping. This conclusion is consistent with the characterization of local emissions over the GOM advanced in previous works [54] and the hypothesis by Millet et al. [2] who posed that shear driven turbulent exchange may be necessary to explain the impact of similar plumes on surface conditions observed at Chebogue Point, Nova Scotia.
Figure 11. Surface observations from the AIRMAP stations during the transit of the NYC plume. Shown are measurements of (a) O3 and (b) CO at three AIRMAP stations: TFR (red), AIS (black), and CSP (blue). Canister observations of (c) C2Cl4 and (d) CH2Cl taken at TFR and AIS are also shown for the same time period.
Atmosphere 05 00973 g011

3.4. Inland Impacts of NYC Plumes

The impact of the plume’s passage on surface conditions around New England evolved over the course of three days (7/21–7/23) as seen in the times series of trace gas observations made at the three AIRMAP stations (Figure 11). As shown, initial detection was made along the coast, where elements from the plume airmass were measured at AIS (black lines) and TFR (red lines) in a sequence of significant elevations in mixing ratios between 7/21 and 7/22. The first of these was sharp rise to 88 ppbv in O3 at AIS between 18:00 UTC on 7/20 and 06:00 UTC on 7/21 with a coincident elevation to 63 ppbv at TFR. These were accompanied over the same interval by a similar enhancement of the CO mixing ratios, reaching 301 ppbv and 310 ppbv at AIS and TFR respectively. It appeared that the influence of the greater stability in the marine atmosphere over AIS, inhibited the down mixing of airmass longer that at the more inland location of TFR in this period. Further analysis of hourly canister observations at AIS and TFR showed that these enhancements coincided with elevations in halocarbon species used to track the NYC plume (Figure 11c,d).
Figure 12. Lagrangian back trajectories from the NOAA HYSPLIT model for 36 h prior to the plume mixing inland on 7/21. Shown are trajectories for (a) TFR; (b) AIS; and (c) CSP AIRMAP stations used in the inland analysis.
Atmosphere 05 00973 g012
Further inland, a lag of 3–6 h in the detection of the plume was observed at CSP (Figure 11a,b, blue line). The inland arrival of CO from the plume manifested as monotonic increase until the morning of the 22nd when levels at CSP peaked at 395 ppbv. Ozone at the CSP showed a similar phase lag with the coastal observations, while the influence of the plume on the observed O3 mixing ratios at CSP was seen as a significant enhancement in its diurnal cycle. O3 mixing ratios observed at 12:00 UTC on 22 July at CSP equaled the highest observed that summer, representing the regional impact of the plume. During the plume’s passage, CO mixing ratios at AIS, TFR, and CSP exceeded the 90th percentile of levels measured between 1 May 2004, and 1 September 2004. This was also the case for the observations of O3 and SO2.
Back trajectories calculated on 7/22 for the three surface stations are shown in Figure 12 and are consistent with the analysis of elements of the plume being mixed inland. The trajectories also support the hypothesis that divergence in the marine troposphere over the GOM on 7/21 and 7/22 as shown in Mao et al. [4] may have occurred. It is further possible that that this divergence, coupled with the observations of turbulent characteristics shown here may have led to the significant errors in the large scale wind analyses used in previous Lagrangian studies [20,21,22,23].
Further evaluation of relationships between the leading trace gas species measured at the surface further enabled detection of the plume inland, as well as determination of transformations in its chemical structure. Linear correlations between O3/CO, O3/NOy, and CO/NOy were evident in the TFR observations made during the height of the plume’s impact and 5.38 towards the open ocean. These reductions in fitted slopes were tied to reductions in the observed O3 mixing ratios inland and consistent with the negative gradient of O3 mixing on 7/22. However, O3/CO ratios measured at TFR during this time exhibited a reduced fitted slope of 0.289 relative to the values of 0.376 and 0.344 observed onboard the P3 over the coastal and ocean waters respectively. The relationship between O3 and NOy exhibited a similarly reduced fitted slope of 2.89 versus the aircraft observed 8.37 in the coastal region ratios observed within the plume moving from the ocean to coastal regions.

4. Summary and Conclusions

In this work, focus has been devoted to a distinct case of LLO that was observed in the GOM region by airborne and surface platforms beginning on 20 July 2004. This event occurred under weak synoptic conditions, and was initially seen as a plume of concentrated industrial and urban pollution vented into shallow tropospheric layers above LIS. In a quasi-Lagrangian manner, multiple intercepts of the plume by the P3 were made on subsequent days enabling it to be tracked during transit over the GOM and open western Atlantic waters.
Over the course of a three day quasi-Lagrangian experiment, the 7/20 plume was seen to evolve, with clear linear correlations developing between signature species CO, O3 and NOy. More specifically, increases in the O3/CO slopes were suggestive of efficient photochemical production of O3 during the plume transit. O3/NOy relationships near the source region showed signs of fresh emissions mixed with photochemically aged air. As the plume arrived in the coastal and oceanic regions of the GOM on the 21st and 22nd, only the signature of fresh emissions was retained. The close correlation of CO/NOy contributes to the argument that the plume experienced minimal interaction with the surface over the course of its transit into the GOM and Western Atlantic. Much of this detached transit was facilitated by IBL-like properties of the plume containing layer.
Our work complements other studies [45,46] of the 7/20 plume, in that we have explored the meteorological adjustment processes in the coastal atmosphere in detail which enabled the plume’s flow into the GOM and across the North Atlantic. A key aspect to the analysis presented was the examination of observations directly within the IBL-like/plume layer. It was through this that distinct physical and chemical characteristics defined the plume layer in both the coastal and outflow regions and explained much of the efficiency of the 7/20 plume’s transport and its eventual impact around the GOM. On both days of the plume’s transit across the GOM, the IBL structure maintained nearly constant temperature, wind speed, and wind direction within the layer despite large gradients of each both above and below it. This facilitated widespread observations of periodic turbulence with the plume layer. Such turbulence appeared to drive the high levels of spatial heterogeneity in trace gas mixing ratios observed in the plume layer, and promote mixing with fresh emissions over the coastal GOM, as well as contributing to its signature inland.
The 7/20 plume exerted significant influence upon surface observations in New England. During its passage, mixing ratios of O3 and CO equaled the maximum values measured throughout the summer of 2004 at each of the AIRMAP stations. This impact ranged from just off the coast on Appledore Island to the near coastal location of Thompson farm and the far inland station at Castle Springs. A periodic series of pulses in these mixing ratios marked the advance of the plume to the inland locations, further indicating possible influences of shear driven turbulence. Relationships between O3 and CO in particular supported the theory that enhanced mixing was experienced by the plume in the coastal and inland atmosphere and the contemporary hypothesis presented in related studies that the existence of such turbulence is required to explain the down-mixing and eventual impact of similar plumes on surface conditions.
Future studies which are fortunate to gather similar Lagrangian data from a transiting plume within an IBL would benefit with micrometeorological measurements more capable of resolving the fine spatial scales of the inherent turbulent structures within them. Such observations would also facilitate analysis of other features that also influence low-level transport in the marine atmosphere in conjunction with IBLs, including low level coastal jets, internal gravity waves and turbulent eddies. Thus, the observations of the 7/20 plume further motivate efforts to better understand the complex lower atmospheric influences that facilitate and shape plume transport over extended distances.

Acknowledgments

Financial support for this work was from the NOAA Office of Oceanic and Atmospheric Research under grant #NA07OAR4600514. We thank the NASA and NOAA investigators on the DC-8 and P3 aircrafts for use of their high quality data sets. Particular thanks are also given to Thomas Ryerson, John Holloway, Elliot Atlas, and Joost de Gouw for their contributions to the aircraft observations.

Author contributions

This study was completed and submitted for publication with cooperation between the authors.

Conflict of Interest

The authors declare no conflict of interest.

References

  1. Mao, H.; Talbot, R. Relationship of surface O3 to large-scale circulation patterns during two recent winters. Geophys. Res. Lett. 2004. [Google Scholar] [CrossRef]
  2. Millet, D.B.; Goldstein, A.H.; Holzinger, R.; Williams, B.J.; Allan, J.D.; Jimenez, J.L.; Worsnop, D.R.; Roberts, J.M.; White, A.B.; Hudman, R.C.; et al. Chemical characteristics of North American surface layer outflow: Insights from Chebogue Point Nova Scotia. J. Geophys. Res.: Atmos. 2006. [Google Scholar] [CrossRef]
  3. Angevine, W.M.; Hare, J.E.; Fairall, C.W.; Wolfe, D.E.; Hill, R.J.; Brewer, W.A.; White, A.B. Structure and formation of the highly stable marine boundary layer over the Gulf of Maine. J. Geophys. Res.: Atmos. 2006. [Google Scholar] [CrossRef]
  4. Mao, H.; Talbot, R.; Troop, D.; Johnson, R.; Businger, S.; Thompson, A.M. Smart balloon observations over the North Atlantic: O3 data analysis and modeling. J. Geophys. Res.: Atmos. 2006. [Google Scholar] [CrossRef]
  5. Chen, M.; Talbot, R.; Mao, H.; Sive, B.; Chen, J.; Griffin, R.J. Air mass classification in coastal New England and its relationship to meteorological conditions. J. Geophys. Res.: Atmos. 2007. [Google Scholar] [CrossRef]
  6. Stohl, A.; Trickl, T. A textbook example of long-range transport: Simultaneous observation of ozone maxima of stratospheric and North American origin in the free troposphere over Europe. J. Geophys. Res.: Atmos. 1999, 104, 30445–30462. [Google Scholar] [CrossRef]
  7. Stohl, A. A one-year Lagrangian “climatology” of air streams in the northern hemisphere troposphere and lowermost stratosphere. J. Geophys. Res.: Atmos. 2001, 106, 7263–7279. [Google Scholar] [CrossRef]
  8. Eckhardt, S.; Stohl, A.; Beirle, S.; Spichtinger, N.; James, P.; Forster, C.; Junker, C.; Wagner, T.; Platt, U.; Jennings, S.G.; et al. The North Atlantic Oscillation controls air pollution transport to the Arctic. Atmos. Chem. Phys. 2003, 3, 1769–1778. [Google Scholar] [CrossRef]
  9. Simmonds, P.G.; Derwent, R.G.; Manning, A.L.; Spain, G. Significant growth in surface ozone at Mace Head, Ireland, 1987–2003. Atmos. Environ. 2003, 38, 4769–4778. [Google Scholar] [CrossRef]
  10. Daum, P.H.; Kleinman, L.I.; Newman, L.; Luke, W.T.; Weinstein-Lloyd, J.; Berkowitz, C.M.; Busness, K.M. Chemical and physical properties of plumes of anthropogenic pollutants transported over the North Atlantic during the North Atlantic Regional Experiment. J. Geophys. Res.: Atmos. 1996, 101, 29029–29042. [Google Scholar] [CrossRef]
  11. Owen, R.C.; Cooper, O.R.; Stohl, A.; Honrath, R.E. An analysis of the mechanisms of North American pollutant transport to the central North Atlantic lower free troposphere. J. Geophys. Res.: Atmos. 2006. [Google Scholar] [CrossRef]
  12. Cooper, O.R.; Moody, J.L.; Parrish, D.D.; Trainer, M.; Ryerson, T.B.; Holloway, J.S.; Hubler, G.; Fehsenfeld, F.C.; Evans, M.J. Trace gas composition of midlatitude cyclones over the western North Atlantic Ocean: A conceptual model. J. Geophys. Res.: Atmos. 2002. [Google Scholar] [CrossRef]
  13. Angevine, W.M.; Buhr, M.P.; Holloway, J.S.; Trainer, M.; Parrish, D.; MacPherson, J.I.; Kok, G.L.; Dchillawski, R.D.; Bowlby, D.H. Local meteorological features affecting chemical measurements at a North Atlantic coastal site. J. Geophys. Res.: Atmos. 1996, 101, 28935–28946. [Google Scholar] [CrossRef]
  14. Angevine, W.M.; Senff, C.J.; White, A.B.; Williams, E.J.; Koermer, J.; Miller, S.T.K.; Talbot, R.; Johnston, P.E.; McKeen, S.A.; Downs, T.; et al. Coastal boundary layer influence on pollutant transport in New England. J. Appl. Meteorol. 2004, 43, 1425–1437. [Google Scholar] [CrossRef]
  15. Dacre, H.F.; Gray, S.L.; Belcher, S.E. A case study of boundary layer ventilation by convection and coastal processes. J. Geophys. Res.: Atmos. 2007. [Google Scholar] [CrossRef]
  16. Garratt, J.R. The internal boundary-layer—A review. Bound. Layer Meteorol. 1990, 50, 171–203. [Google Scholar] [CrossRef]
  17. Skyllingstad, E.; Samelson, R.; Mahrt, L.; Barbour, P. A numerical modeling study of warm offshore flow over cool water. Mon. Weather Rev. 2005, 133, 345–361. [Google Scholar] [CrossRef]
  18. Li, Q.; Jacob, D.J.; Bey, I.; Palmer, P.I.; Duncan, B.N.; Field, B.D.; Martin, R.V.; Fiore, A.M.; Yantosca, R.M.; Parrish, D.D.; et al. Transatlantic transport of pollution and its effects on surface ozone in Europe and North America. J. Geophys. Res.: Atmos. 2002. [Google Scholar] [CrossRef]
  19. Neuman, J.A.; Parrish, D.D.; Trainer, M.; Ryerson, T.B.; Holloway, J.S.; Nowak, J.B.; Swanson, A.; Flocke, F.; Roberts, J.M.; Brown, S.S.; et al. Reactive nitrogen transport and photochemistry in urban plumes over the North Atlantic Ocean. J. Geophys. Res.: Atmos. 2006. [Google Scholar] [CrossRef]
  20. Riddle, E.E.; Voss, P.B.; Stohl, A.; Holcomb, D.; Maczka, D.; Washburn, K.; Talbot, R.W. Trajectory model validation using newly developed altitude-controlled balloons during the International Consortium for Atmospheric Research on Transport and Transformations 2004 campaign. J. Geophys. Res.: Atmos. 2006. [Google Scholar] [CrossRef]
  21. Methven, J.; Arnold, S.R.; Stohl, A.; Avery, M.; Law, K.; Lewis, A.; Parrish, D.; Reeves, C.; Schlager, H.; Atlas, E.; et al. Establishing Lagrangian connections between observations within air masses crossing the Atlantic during the ICARTT experiment. J. Geophys. Res.: Atmos. 2006. [Google Scholar] [CrossRef]
  22. Real, E.; Law, K.S.; Schlager, H.; Roiger, A.; Huntrieser, H.; Methven, J.; Cain, M.; Holloway, J.; Neuman, J.A.; Ryerson, T.; et al. Lagrangian analysis of low altitude anthropogenic plume processing across the North Atlantic. Atmos. Chem. Phys. 2008, 8, 7737–7754. [Google Scholar] [CrossRef] [Green Version]
  23. Cain, M.; Methven, J.; Highwood, E.J. Quantification of chemical and physical processes influencing ozone during long-range transport using a trajectory ensemble. Atmos. Chem. Phys. 2012, 12, 7015–7039. [Google Scholar] [CrossRef]
  24. Lee, S.-H.; Kim, S.-W.; Trainer, M.; Frost, G.J.; McKeen, S.A.; Cooper, O.R.; Flocke, F.; Holloway, J.S.; Neuman, J.A.; Ryerson, T.; et al. Modeling ozone plumes observed downwind of New York City over the North Atlantic Ocean during the ICARTT field campaign. Atmos. Chem. Phys. 2011, 11, 7375–7397. [Google Scholar] [CrossRef]
  25. Fehsenfeld, F.C.; Ancellet, G.; Bates, T.S.; Goldstein, A.H.; Hardesty, R.M.; Honrath, R.; Law, K.S.; Lewis, A.C.; Leaitch, R.; McKeen, S.; et al. International Consortium for Atmospheric Research on Transport and Transformation (ICARTT): North America to Europe—Overview of the 2004 summer field study. J. Geophys. Res.: Atmos. 2006. [Google Scholar] [CrossRef]
  26. Ryerson, T.B.; Buhr, M.P.; Frost, G.J.; Goldan, P.D.; Holloway, J.S.; Hubler, G.; Jobson, B.T.; Kuster, W.C.; McKeen, S.A.; Parrish, D.D.; et al. Emissions lifetimes and ozone formation in power plant plumes. J. Geophys. Res.: Atmos. 1998, 103, 22569–22583. [Google Scholar] [CrossRef]
  27. Neuman, J.A.; Huey, L.G.; Dissly, R.W.; Fehsenfeld, F.C.; Flocke, F.M.; Holecek, J.C.; Holloway, J.S.; Hübler, G.; Jakoubek, R.; Nicks, D.K.; et al. Fast-response airborne in situ measurements of HNO3 during the Texas 2000 Air Quality Study. J. Geophys. Res.: Atmos. 2002. [Google Scholar] [CrossRef]
  28. De Gouw, J.A.; Goldan, P.D.; Warneke, C.; Kuster, W.C.; Roberts, J.M.; Marchewka, M.; Bertman, S.B.; Pszenny, A.A.P.; Keene, W.C. Validation of proton transfer reaction-mass spectrometry (PTR-MS) measurements of gas-phase organic compounds in the atmosphere during the New England Air Quality Study (NEAQS) in 2002. J. Geophys. Res.: Atmos. 2003. [Google Scholar] [CrossRef]
  29. Holloway, J.S.; Jakoubek, R.O.; Parrish, D.D.; Gerbig, C.; Volz-Thomas, A.; Schmitgen, S.; Fried, A.; Wert, B.; Henry, B.; Drummond, J.R.; et al. Airborne intercomparison of vacuum ultraviolet fluorescence and tunable diode laser absorption measurements of tropospheric carbon monoxide. J. Geophys. Res.: Atmos. 2000, 105, 24251–24261. [Google Scholar] [CrossRef]
  30. Blake, N.J.; Blake, D.R.; Simpson, I.J.; Meinardi, S.; Swanson, A.L.; Lopez, J.P.; Katzenstein, A.S.; Barletta, B.; Shirai, T.; Atlas, E.; et al. NMHCs and halocarbons in Asian continental outflow during the Transport and Chemical Evolution over the Pacific (TRACE-P) Field Campaign: Comparison with PEM-West B. J. Geophys. Res.: Atmos. 2003. [Google Scholar] [CrossRef]
  31. Blake, N.J.; Blake, D.R.; Sive, B.C.; Katzenstein, A.S.; Meinardi, S.; Wingenter, O.W.; Atlas, E.L.; Flocke, F.; Ridley, B.A.; Rowland, F.S.; et al. The seasonal evolution of NMHCs and light alkyl nitrates at mid to high northern latitudes during TOPSE. J. Geophys. Res.: Atmos. 2003. [Google Scholar] [CrossRef]
  32. Kundu, P.K.; Cohen, I.M. Fluid Mechanics, 2nd ed.; Academic Press: San Diego, CA, USA, 1990. [Google Scholar]
  33. Kleinman, L.I.; Springston, S.R.; Daum, P.H.; Lee, Y.-N.; Nunnermacker, L.J.; Senum, G.I.; Wang, J.; Weinstein-Lloyd, J.; Alexander, M.L.; Hubbe, J.; et al. The time evolution of aerosol composition over the Mexico City plateau. Atmos. Chem. Phys. 2008, 8, 1559–1575. [Google Scholar] [CrossRef]
  34. Slowik, J.G.; Brook, J.; Chang, R.Y.-W.; Evans, G.J.; Hayden, K.; Jeong, C.-H.; Li, S.-M.; Liggio, J.; Liu, P.S.K.; McGuire, M.; et al. Photochemical processing of organic aerosol at nearby continental sites: Contrast between urban plumes and regional aerosol. Atmos. Chem. Phys. 2011, 11, 2991–3006. [Google Scholar] [CrossRef]
  35. Kim, P.S.; Jacob, D.J.; Liu, X.; Warner, J.X.; Yang, K.; Chance, K.; Thouret, V.; Nedelec, P. Global ozone–CO correlations from OMI and AIRS: constraints on tropospheric ozone sources. Atmos. Chem. Phys. 2013, 13, 9321–9335. [Google Scholar] [CrossRef]
  36. Zhang, B.; Owen, R.C.; Perlinger, J.A.; Kumar, A.; Wu, S.; Kramer, M.L.; Helmig, D.; Honrath, R.E. A Lagrangian view of ozone production tendency in North American outflow in summers 2009 and 2010. Atmos. Chem. Phys. 2014, 14, 2267–2287. [Google Scholar] [CrossRef]
  37. Yokelson, R.J.; Andreae, M.O.; Akagi, S.K. Pitfalls with the use of enhancement ratios or normalized excess mixing ratios measured in plumes to characterize pollution sources and aging. Atmos. Meas. Tech. 2013, 6, 2155–2158. [Google Scholar] [CrossRef]
  38. Honrath, R.E.; Owen, R.C.; Val Martín, M.; Reid, J.S.; Lapina, K.; Fialho, P.; Dziobak, M.P.; Kleissl, J.; Westphal, D.L. Regional and hemispheric impacts of anthropogenic and biomass burning emissions on summertime CO and O3 in the North Atlantic lower free troposphere. J. Geophys. Res.: Atmos. 2004. [Google Scholar] [CrossRef]
  39. Chin, M.; Jacob, D.J.; Munger, J.W.; Parrish, D.D.; Doddridge, B.G. Relationship of ozone and carbon monoxide over North America. J. Geophys. Res.: Atmos. 1994, 99, 14565–14573. [Google Scholar] [CrossRef]
  40. Hsu, S.-A. Coastal Meteorology; International Geophysics Series Academic Press: New York, NY, USA, 1988; p. 260. [Google Scholar]
  41. Tardif, R.; Rasmussen, R.M. Process-oriented analysis of environmental conditions associated with precipitation fog events in the New York City region. J. Appl. Meteorol. Climatol. 2007, 47, 1681–1703. [Google Scholar] [CrossRef]
  42. Zhang, J.; Rao, S.; Daggupaty, S. Meteorological processes and ozone exceedances in the Northeastern United States during the 12–16 July 1995 episode. J. Appl. Meteorol. 1998, 37, 776–789. [Google Scholar] [CrossRef]
  43. Fochesatto, G.J.; Drobinski, P.; Flamant, C.; Guedalia, D.; Sarrat, C.; Flamant, P.H.; Pelon, J. Evidence of dynamical coupling between the residual layer and the developing convective boundary layer. Bound. Layer Meteorol. 2001, 99, 451–464. [Google Scholar] [CrossRef]
  44. Garratt, J.R.; Ryan, B.F. The structure of the stably stratified internal boundary layer in offshore flow over the sea. Bound. Layer Meteorol. 1989, 47, 17–40. [Google Scholar] [CrossRef]
  45. Stull, R.B. An Introduction to Boundary Layer Meteorology; Kluwer Academic: Dordrech, The Netherlands, 1988. [Google Scholar]
  46. Neu, U. A parameterization of the nocturnal ozone reduction in the residual layer by vertical downward mixing during summer smog situations using sodar data. Bound. Layer Meteorol. 1995, 73, 189–193. [Google Scholar] [CrossRef]
  47. Mahrt, L. Stratified atmospheric boundary layers. Bound. Layer Meteorol. 1999, 90, 375–396. [Google Scholar] [CrossRef]
  48. Craig, R.A. Measurements of temperature and humidity in the lowest 1000 ft of the atmosphere over Massachusetts Bay, Pap. Phys. Oceanogr. Meteorol. 1946, 10, 6–47. [Google Scholar]
  49. Raynor, G.S.; Sethuraman, S.; Brown, R.M. Formation and characteristics of coastal internal boundary layers during onshore flows. Bound. Layer Meteorol. 1979, 16, 487–514. [Google Scholar] [CrossRef]
  50. Rogers, D.P.; Johnson, D.W.; Friehe, C.A. The stable internal boundary layer over a coastal sea I: Airborne measurements of the mean and turbulence structure. J. Atmos. Sci. 1995, 52, 667–683. [Google Scholar] [CrossRef]
  51. Smedman, A.-S.; Bergström, H.; Grisogono, B. Evolution of stable internal boundary layers over a cold sea. J. Geophys. Res.: Ocean 1997, 102, 1091–1099. [Google Scholar] [CrossRef]
  52. Gong, W.; Mickle, R.E.; Bottenheim, F.F.; Beauchamp, S.; Waugh, D. Marine/coastal boundary layer and vertical structure of ozone observed at a coastal site in Nova Scotia during the 1996 NARSTO-CE field campaign. Atmos. Environ. 2000, 34, 4139–4154. [Google Scholar] [CrossRef]
  53. Garratt, J.R. The stably stratified internal boundary-layer for steady and diurnally varying offshore flow. Bound. Layer Meteorol. 1987, 38, 369–394. [Google Scholar] [CrossRef]
  54. Darby, L.S.; McKeen, S.A.; Senff, C.J.; White, A.B.; Banta, R.M.; Post, M.J.; Brewer, W.A.; Marchbanks, R.; Alvarez, R.J., II; Peckham, S.E.; et al. Ozone differences between near-coastal and offshore sites in New England: Role of meteorology. J. Geophys. Res.: Atmos. 2007. [Google Scholar] [CrossRef]

