1. Introduction
The emission of halogenated compounds from human activity can cause stratospheric ozone depletion and climate change. Recently, the first atmospheric detection of a further four such halogenated compounds has been reported [
1]. The four compounds are CFC-112 (CFCl
2CFCl
2) (with concentrations measured at Cape Grim, Tasmania of 0.44 ppt in late-2012), CFC-112a (CF
2ClCCl
3) (0.07 ppt), CFC-113a (CF
3CCl
3) (0.48 ppt) and HCFC-133a (CF
3CH
2Cl) (0.37 ppt). CFC-113a concentrations increased between 1978 and 2012. HCFC-133a in general increased, with an interruption in the increase between 2008 and 2010. CFC-112 concentrations peaked in 1997, and have been falling slowly since then; CFC-112a concentrations (measured since 1999) are believed to have behaved in a similar way. These compounds continue to be emitted as a result of human activity (possibly contravening the United Nations Montreal Protocol on Substances that Deplete the Ozone Layer) [
1]. The emission sources are uncertain.
On a molecule-per-molecule basis, such halocarbons are potent greenhouse gases (e.g., [
2]). Although at existing concentrations these particular CFCs and HCFCs contribute insignificantly to radiative forcing of climate change, it is necessary to quantify this contribution, particularly for those whose concentrations are increasing, and may become significant in the future. It is also necessary to provide values for metrics such as the Global Warming Potential (GWP) which is used within the Kyoto Protocol to the United Nations Framework Convention on Climate Change for placing emissions of different greenhouse gases on a CO
2-equivalent scale.
This work presents, for the first time, quantitative spectrally-resolved infrared spectra for these new molecules, and the radiative efficiencies and GWPs that result from using these spectra in a radiative transfer model. Although some infrared measurements of these molecules have been published [
3,
4,
5,
6], these were not reported in the detailed spectrally-resolved form which is required for their incorporation into radiative transfer models.
This paper reports new laboratory measurements of the infrared absorption cross-sections of three of these four compounds (
Section 2,
Section 3 and
Section 4), and presents for the first time calculations of radiative efficiencies (
Section 5) and GWPs (
Section 6) using these cross-sections together with atmospheric lifetimes recently reported by Laube
et al. [
1].
2. Experimental Setup
Spectra were measured at the Rutherford Appleton Laboratory Molecular Spectroscopy Facility using a Bruker IFS 125 HR Fourier transform spectrometer. Measurements were performed over the wavenumber range of 600–1730 cm
−1. The gas was contained in a 5 cm path length stainless-steel coolable cell with potassium bromide windows. Four platinum resistance thermometers were attached to the outside of the cell and a National Instruments data logger (NI4351) recorded the temperature. A mercury-cadmium-telluride (MCT) detector measured the spectra of sample gas. The spectral resolution of measurements was 0.01 cm
−1 at some pressures, and 0.015 cm
−1 at others. Measurements were performed with a pure sample at various gas pressures at 250 K and 295 K. At least two cycles of freeze-pump-thaw were performed to remove any atmospheric contamination from the liquid samples of CFC-112, CFC-112a and CFC-113a; the gas sample of HCFC-133a was used without further purification. Measurements were also made at 295 K in the presence of a broadening gas (artificial air—Air Products zero air, 79.1% nitrogen, and 20.9% oxygen) at different pressures. For these measurements, the required amount of pure gas was admitted to a mixing bulb and artificial air was added up to 1000 Torr. The bulb was left overnight to mix well; the next day the mixture was introduced into the cell for measurements. Pressure was measured by one of three MKS Baratron type 690 (1000, 10 or 1 Torr full scale) with readings logged once a second. The measurements presented here focus on the highest pressure pure gas cases where measurements were made at 0.01 cm
−1, as these were the most detailed and the least contaminated by noise (particularly at lower wavenumbers where the MCT detector response decreases). The lower pressure measurements were mostly used to ensure that the peak absorption varied linearly with absorber amount, to ensure that saturation of signal was not a problem for these higher pressure cases. The maximum value of the optical depth (at 1227 cm
−1) of CFC-113a for different sample gas pressure is examined (
Figure 1) which confirms a linear increase with zero intercept and demonstrates there is no saturation during the experiments.
Figure 1.
Maximum value of optical depth of CFC-113a versus pressure at 1227 cm−1.
Figure 1.
Maximum value of optical depth of CFC-113a versus pressure at 1227 cm−1.
3. Data Analysis
The absorption spectrum was measured in two steps: the background spectrum was obtained using a cell which was evacuated to less than 10
−3 Torr and then the cell was filled with the sample gas up to the specified pressure and the second spectrum was obtained. This method has been widely used in the past (e.g., [
7,
8]). From the measured value of
I(ν) (background intensity with the evacuated cell) and
I0(ν) (intensity with sample), where ν is wavenumber, and using the Beer-Lambert-Bouguer Law
I(ν) =
I0(ν)exp[−τ(ν)], the optical depth (absorbance) τ(ν) can be derived using
The absorption cross-section can then be derived using
where
L is the path length in (cm), σ(ν) is the absorption cross-section in (cm
2∙molecule
−1) and
n is the number density of the absorbing molecule in (molecule∙cm
−3). The value of
n is obtained from
where
P is the pressure of the absorber in hPa,
T is the gas temperature in Kelvin and
L0 is Loschmidt’s number 2.69 × 10
19 molecule∙cm
−3. The integrated absorption cross-section
S is derived by integration of the absorption cross-section σ over the whole range of wavenumbers ν
Measurement uncertainties are estimated for the higher pressure cases which are of most importance here: path length (less than ±0.1%), temperature (±0.5%), pressure (±2%), sample purity (±1%) and noise in the spectra (±1.5%). A baseline correction was not necessary. The overall root-sum-square error is ±2.7%. For lower pressures, the smaller absorption increases the relative contribution of the noise significantly; these measurements are less reliable for deriving S. The absorption between the main bands was set to zero to exclude contamination of S from noise in these regions.
Absorption cross-sections for each gas are provided in digital form in the supplementary information.
5. Radiative Efficiency
Radiative efficiencies (RE) (W∙m
−2∙ppbv
−1) are calculated using an updated version of a narrow-band radiative transfer model (NBM) [
12], broadly following the methodology of Sihra
et al. [
13]. Three cloudy-sky atmospheres (see Appendix B of Freckleton
et al. [
14]) are used to represent the tropics and extratropics, and stratospheric temperature adjustment is applied (which increases RE by about 10% for the molecules presented here). The halocarbon cross-sections are averaged onto the NBM’s 10 cm
−1 grid. Calculations are performed for halocarbon mixing ratios of 0.1 ppb, to ensure they are in their linear limit; these are multiplied by 10 to yield RE. HITRAN2004 [
15] provides the spectral line data for water vapour, ozone, carbon dioxide, methane and nitrous oxide. Water vapour, ozone and cloud profiles are specified for each atmosphere [
14]. Other gases are assumed to be well-mixed using 2010 concentrations of 389 ppm for CO
2, 1800 ppb for CH
4, and 323 ppb for N
2O. The 2010 concentration of main greenhouse gases is obtained from [
16]. A fast method for calculating instantaneous RE has recently been presented [
2], based on line-by-line calculations, which is an update to a previously-available method [
17] but at finer spectral resolution. Using this fast method the instantaneous RE for CFC-113a and CFC-112 is within 0.5%, and HCFC-133a is within 1.5%, of the instantaneous RE calculated using the NBM.
Table 1.
Radiative efficiencies, mixing ratios in late-2012, present-day radiative forcings, atmospheric lifetimes, GWPs (for time horizons of 20, 100 and 500 years) and the GTP for a time horizon of 50 years, for the 3 gases considered here.
Table 1.
Radiative efficiencies, mixing ratios in late-2012, present-day radiative forcings, atmospheric lifetimes, GWPs (for time horizons of 20, 100 and 500 years) and the GTP for a time horizon of 50 years, for the 3 gases considered here.
| Gas | Radiative Efficiency (W∙m−2∙ppbv−1) | Mixing Ratio (pptv) | Radiative Forcing (W∙m−2) | Lifetime (years) | GWP (20) | GWP (100) | GWP (500) | GTP (50) |
|---|
| CFC-113a | 0.23 | 0.48 | 1.10 × 10⁻⁴ | 51 | 4590 | 3310 | 1100 | 3920 |
| CFC-112 | 0.29 | 0.44 | 1.28 × 10⁻⁴ | 51 | 5320 | 3840 | 1270 | 4540 |
| HCFC-133a | 0.15 | 0.37 | 5.60 × 10⁻⁵ | 4.3 | 1220 | 340 | 96 | 74 |
Halocarbons are not well-mixed in the atmosphere because of stratospheric and tropospheric removal processes. There is no unique way of accounting for the effect of this on RE, especially for shorter lived species such as HCFC-133a, as the inhomogeneity depends on emission location. We applied the steady-state correction factors derived by Hodnebrog
et al. [
2] which assume the same geographical distribution as current emissions of CFC-11, using the lifetimes derived by Laube
et al. [
1] (see
Table 1). The multiplicative factors to account for the inhomogeneity are 0.95 for the three CFCs and 0.91 for HCFC-133a, but the uncertainty in the correction factor for the shorter-lived HCFC-133a is greater, as it is more dependent on assumptions as to where it is emitted.
Table 1 presents the final RE values. It also shows that the radiative forcing for current (2012) concentrations given by Laube
et al. [
1] is trivially small (of order 0.1 mW∙m
−2), although, as noted earlier, the concentrations of CFC-113a and HFC-133a were found to be still increasing [
1] and so could become significant if this growth were to be sustained.
We adopt the Hodnebrog
et al. [
2] uncertainties (5%–95% confidence range) which are about 13% for CFC-113a and CFC-112 and approximately 23% for HCFC-133a because of its less certain lifetime correction.
6. Global Warming Potentials
The GWP is one method for placing the climate effect of emissions of different gases on a common CO
2-equivalent scale (e.g., [
18]). It is the time-integrated radiative forcing of a pulse emission of a unit mass of gas, integrated over a time horizon H, divided by the same quantity for a pulse emission of the same mass of CO
2. The GWP for H = 100 years (GWP (100)) is used by the Kyoto Protocol. The absolute GWP for CO
2 used here are from [
2] and are 2.495 × 10
−14, 9.171 × 10
−14 and 32.17 × 10
−14 W∙m
−2∙year (kgCO
2)
−1 for the horizons of 20, 100 and 500 years, respectively, and are based on emissions with a 2011 background of CO
2 and the impulse response function of Joos
et al. [
19].
Table 1 presents the GWP for H = 20, 100 and 500 years. An alternative emission metric, the Global Temperature change Potential (GTP) [
20] computes the temperature change at some time H after a pulse emission (relative to an emission of the same mass of CO
2). To calculate the GTP it is necessary to represent the surface temperature response to the radiative forcing pulse, and values are sensitive to this representation (e.g., [
20]). We use the methodology in Hodnebrog
et al. [
2] and present the GTP for H = 50 years for illustration.
The GWP and GTP values in
Table 1 are typical of similar molecules, with HCFC-133a being the smallest, mostly on account of its much shorter lifetime, but also because of its lower RE. The GTP (50) is similar to the GWP (100) for the two CFCs, but much smaller for HCFC-133a, on account of the short lifetime (the climate system retains relatively little memory of the short-lived pulse of radiative forcing following the emission). The GWP (100) and GTP (50) for CFC-113a are only 65%–70% of the values found for its isomer CFC-113 [
2] on account of both the larger RE for CFC-113 (0.3 W∙m
−2∙ppbv
−1) and its longer lifetime (85 years).
Hodnebrog
et al. [
2] estimated the GWP uncertainties (5%–95% confidence range) for CFC-11 (which has a lifetime of 45 years) to be about 25%, 40% and 50% for a H = 20, 100, and 500 years respectively, and these uncertainty estimates are appropriate for CFC-113a and CFC-112. They did not present detailed error estimates for shorter-lived species, but noted that gases with lifetimes of less than 5 years (and hence HCFC-133a is in this category) would have errors approximately double those estimated for CFC-11.
Using estimates of the 2012 emissions [
1] of CFC-113a, CFC-112, and HCFC-133a, which are 2, 0.01, and 3.10 Gg∙year
−1 respectively, yields CO
2-equivalent emissions of 6620, 38, and 1050 Gg∙year
−1 respectively, using the GWP (100) given in
Table 1. The time variation of the CO
2-equivalent emissions is shown in
Figure 3. For comparison, the estimated 2010 CO
2-equivalent global emissions of the most-abundant HFC in the atmosphere, HFC-134a, are 195,000 Gg∙year
−1 using the emission estimates and GWP (100) from [
18]; hence the emissions of the new species considered here constitute, in CO
2-equivalent terms, about 4% of global HFC-134a emissions and about 0.02% of the global CO
2 emissions from fossil-fuels and other industrial sources [
18]. At their peak in 1992 [
1], the estimated emissions of CFC-112 were about 2.2 Gg∙year
−1, or 8640 Gg∙year
−1 in CO
2-equivalent terms.
Figure 3.
Time series of CO
2 equivalent emissions of the CFC-113a, HFC-133a, CFC-112 and CFC-112a, using the emission values in [1] and the GWP (100) values given in
Table 1.
Figure 3.
Time series of CO
2 equivalent emissions of the CFC-113a, HFC-133a, CFC-112 and CFC-112a, using the emission values in [1] and the GWP (100) values given in
Table 1.
7. Conclusions
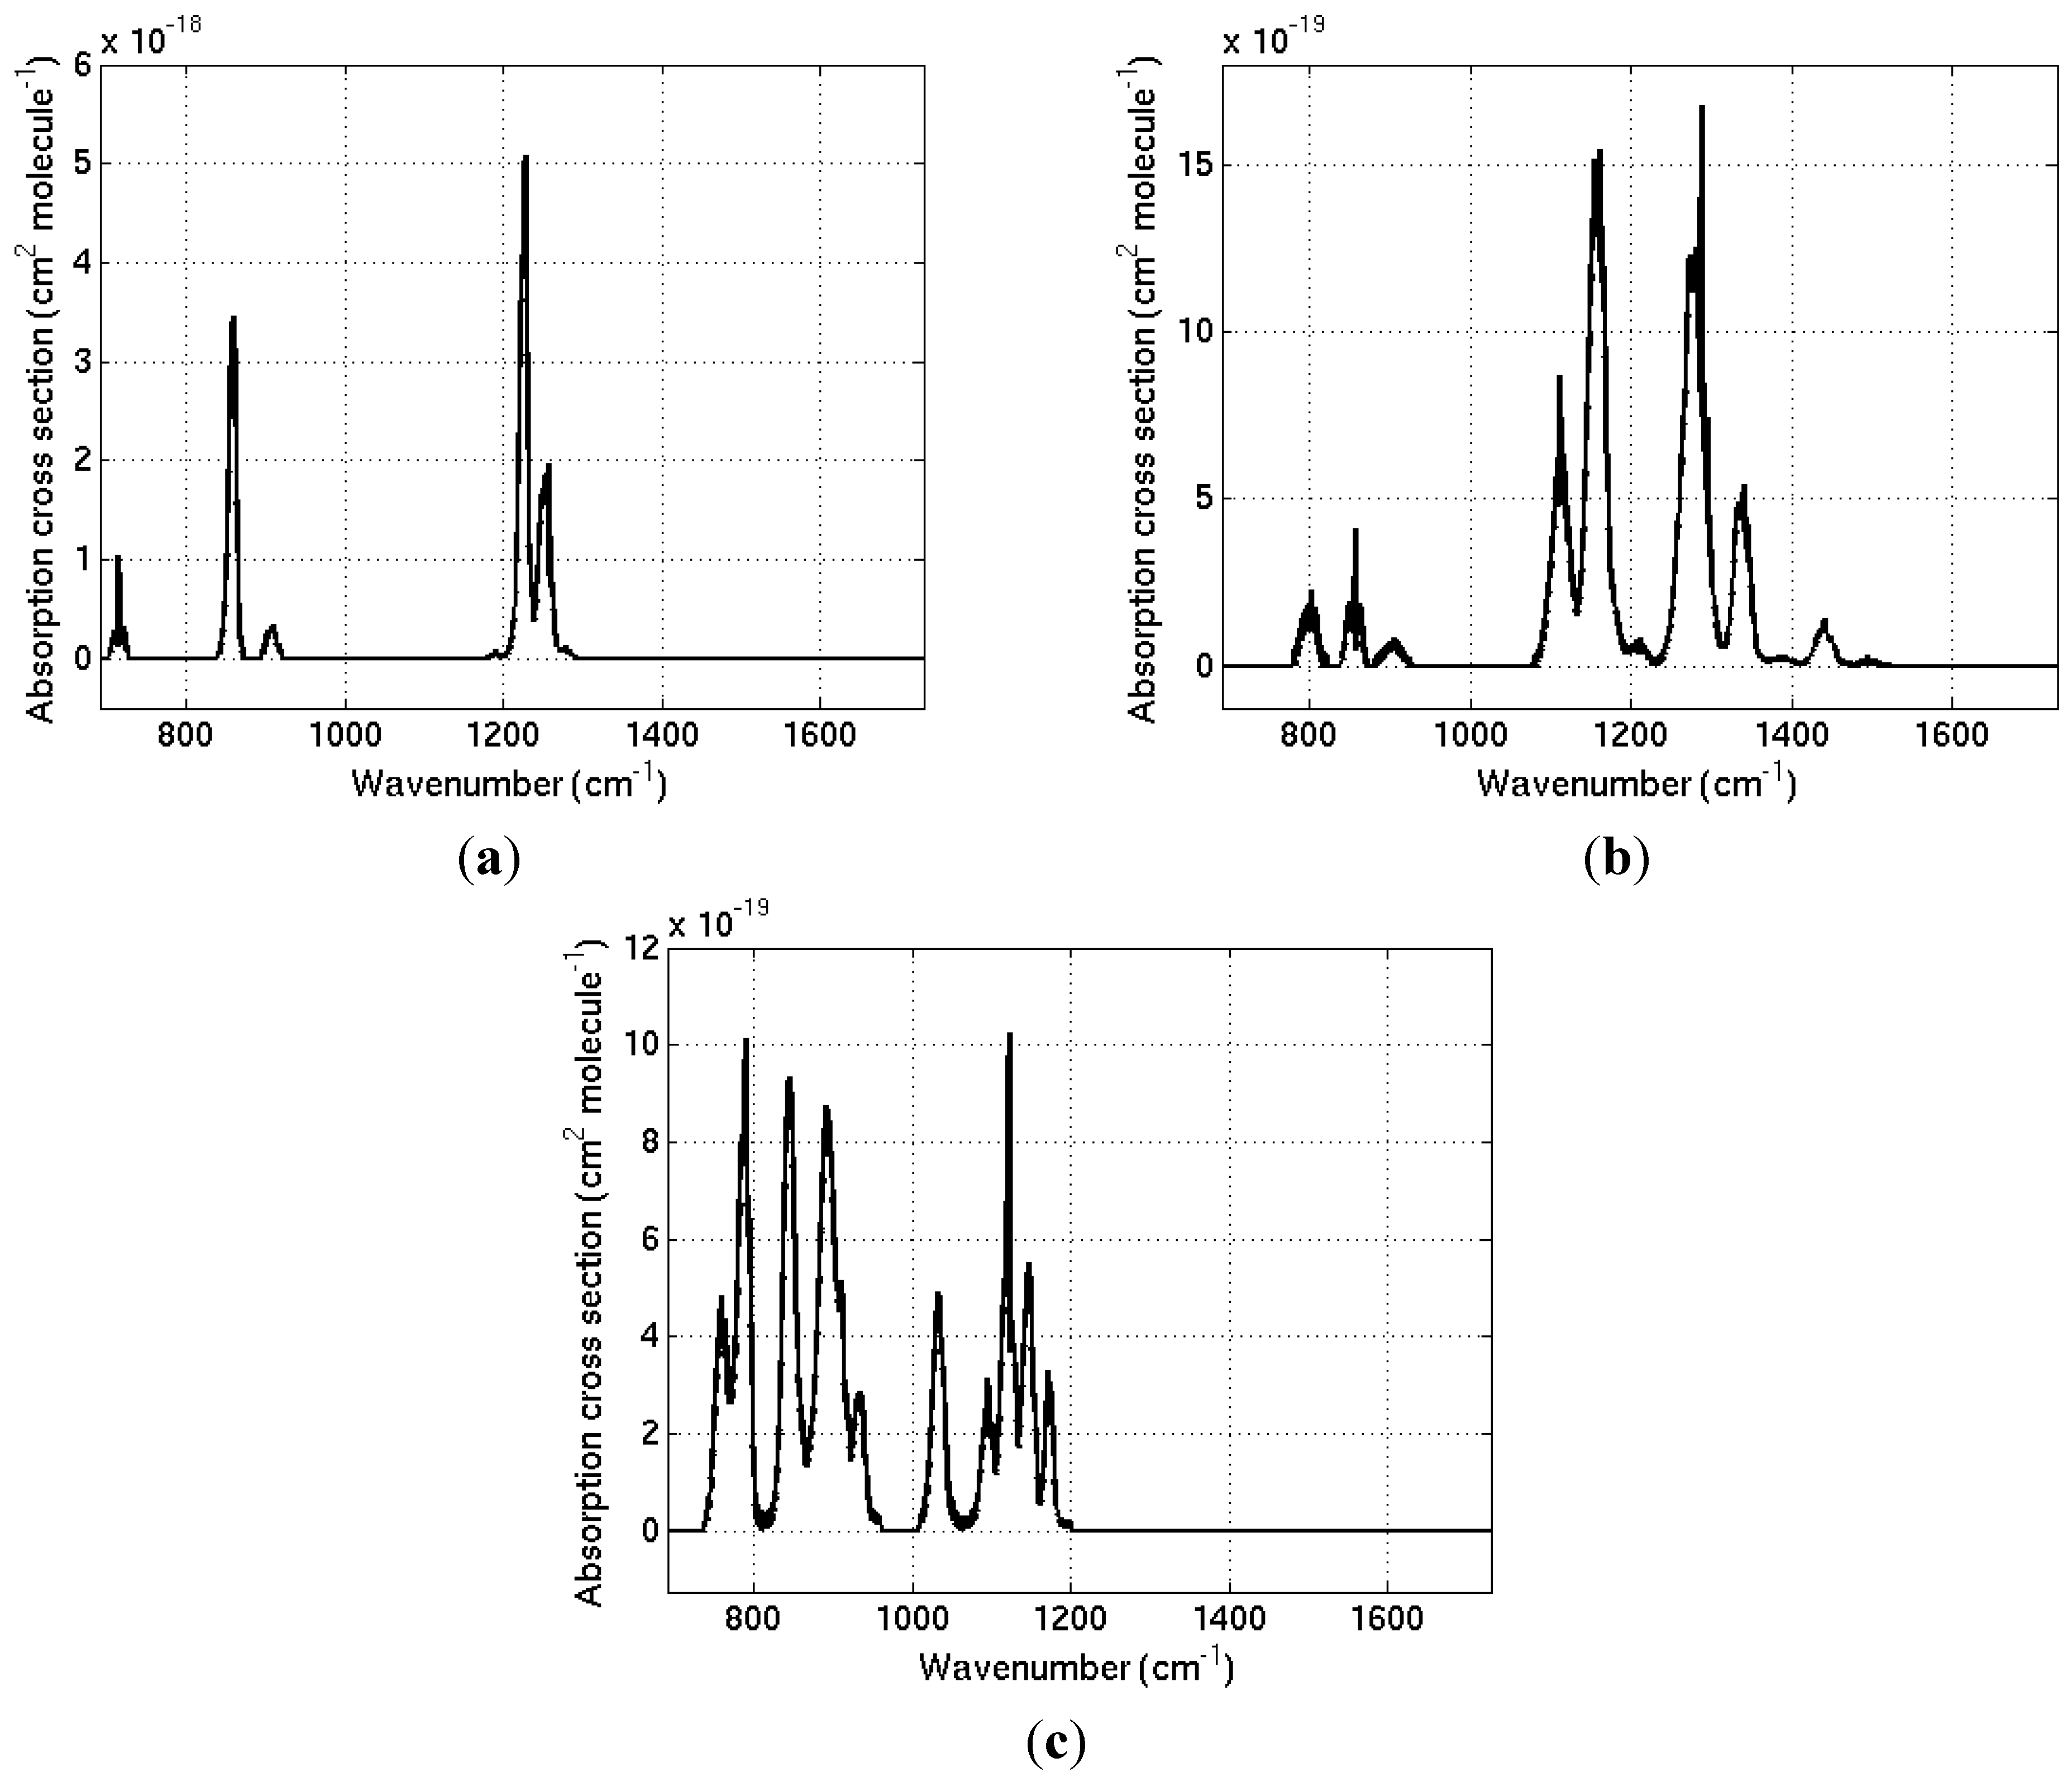
Detailed absorption cross-sections of three newly detected gases in the atmosphere, CFC-113a, HCFC-133a and mixture of CFC-112/CFC-112a (predominantly CFC-112), are presented at 295 K over the wavenumber range of 690–1730 cm−1. These are used to calculate, for the first time, radiative efficiencies and global warming potentials for the three gases. This allows the quantification of the radiative forcing due to these gases and the CO2-equivalence of their emissions. Although their current contribution to radiative forcing is trivial, they are nevertheless powerful greenhouse gases on a molecule-per-molecule basis and their GWP (100) values range from 340 to 3380. It would be desirable to produce separate values of absorption cross-section, radiative efficiency and GWP for CFC-112a, if a pure sample of that gas becomes available.

 and
and 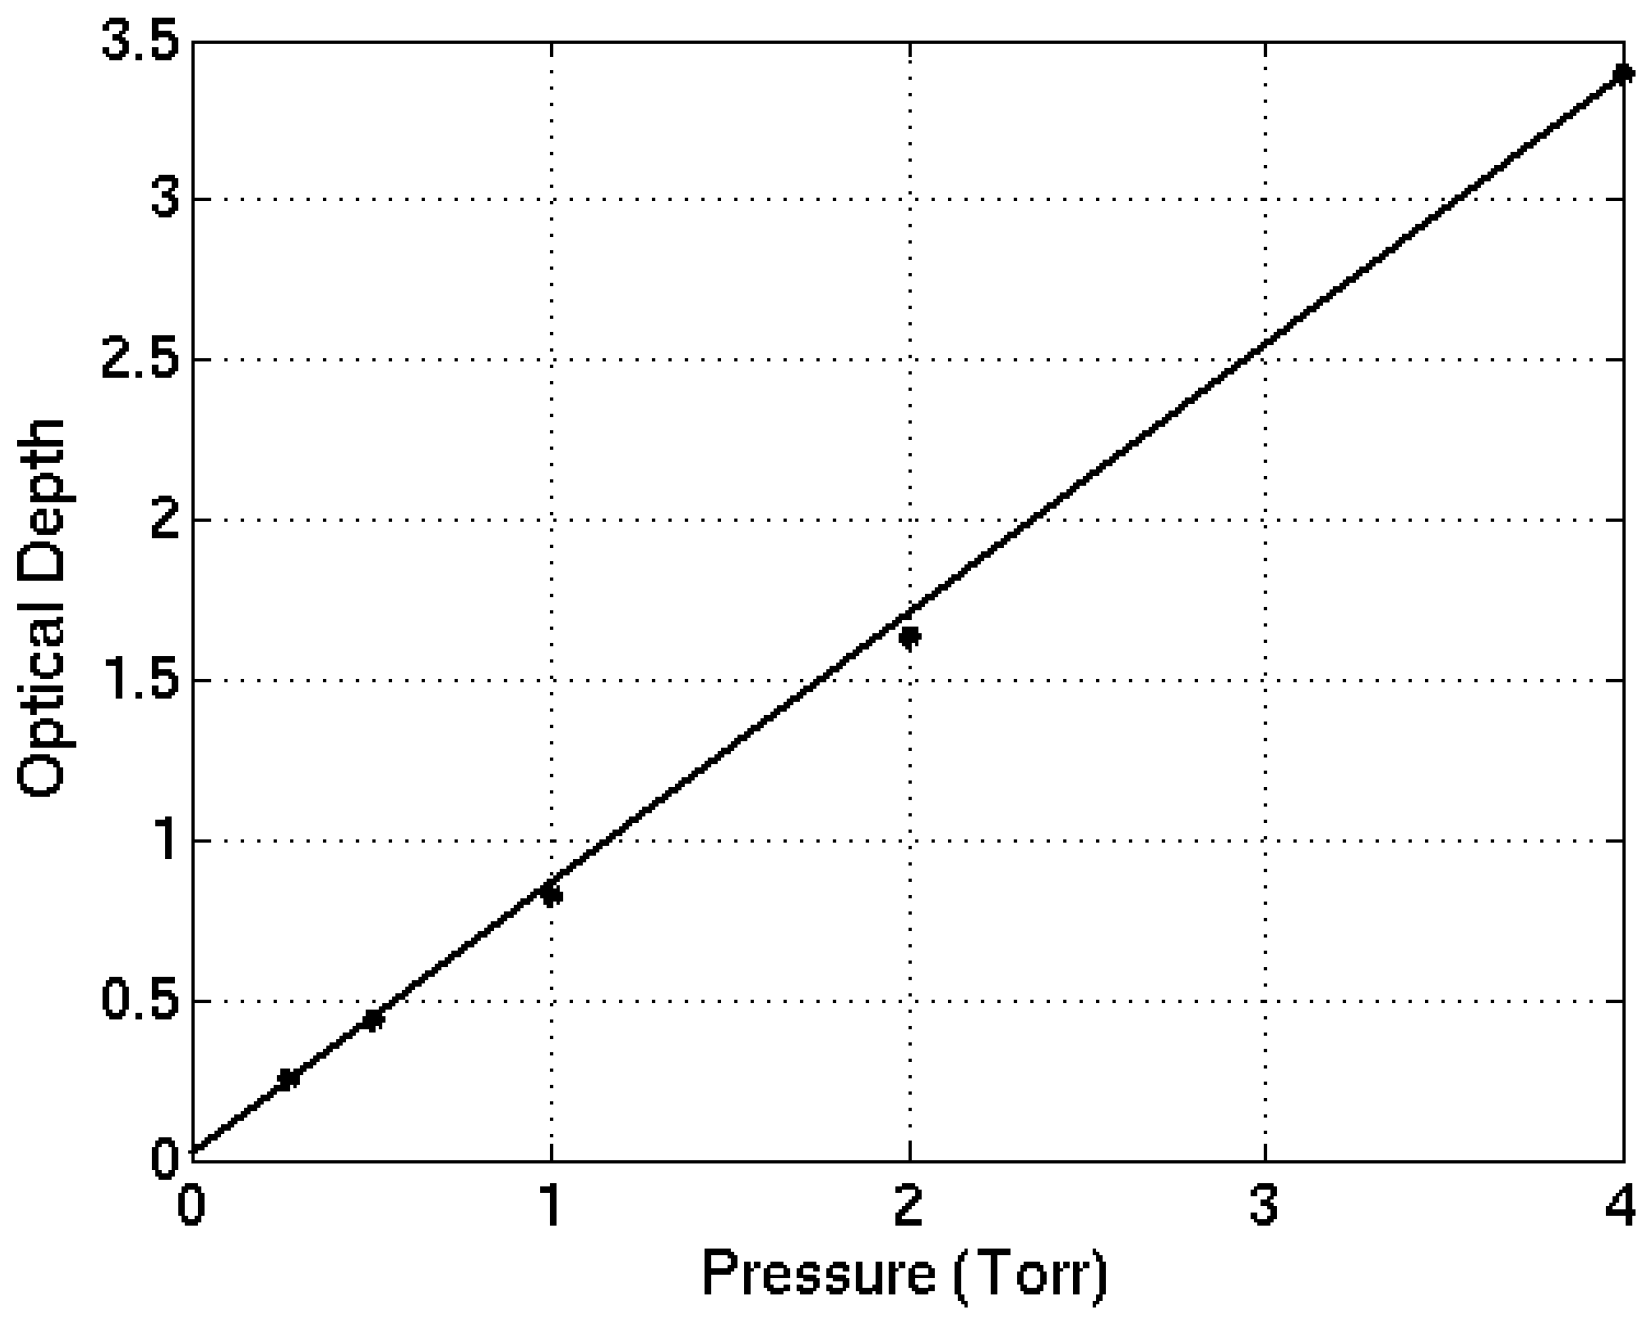
