Article

Designation of Environmental Impacts and Damages of Turbojet Engine: A Case Study with GE-J85

Faculty of Aeronautics and Astronautics, Anadolu University, Eskisehir 26470, Turkey
Atmosphere 2014, 5(2), 307-323; https://doi.org/10.3390/atmos5020307
Submission received: 3 January 2014 / Revised: 7 February 2014 / Accepted: 15 May 2014 / Published: 23 May 2014

Abstract

:
Between the troposphere and stratosphere layers of the atmosphere is a critical zone for collecting emissions and negative effects on the Earth (ecological, humanity, and resources). Aircrafts are the main causes of the impacts in this layer. In this study, environmental effects (Damages, Specific Fuel Consumption Impact-SFCI and Thrust Environmental Impact-TEI) of different fueled (Jet-A and Liquid Hydrogen-H2) jet engines (a case study with GE-J85) are investigated. This comparison was made between 7000–10,000 m altitude and 0.7–1.0 Mach. The maximum damages were found to be 82.44 PDF∙m2∙yr (Potentially Disappeared Fraction from one m2 area during one year), 1.75 × 10⁻³ DALY (disability-adjusted life years), and 8100 MJ Surplus for Ecosystem Quality, Human Health and Resources, respectively, at Jet-A fueled aircraft, 1 Mach, and 7000 m altitude. Additionally, the maximum SFCI was calculated as 344.03 mPts/kg at H2-fueled, 0.7 Mach, and 10,000 m; the minimum TEI was calculated as 13.78 mPts/N at H2-fueled aircraft, 0.7 Mach, and 9000 m. The best environmental (low specific fuel consumption and thrust impacts) flight situations were found in this study at a high altitude and a low Mach number.

1. Introduction

Gas turbine engines became an acceptable prime mover for transportation in aircraft, including military aircraft, in the 1950s. Since then, there have been many improvements for the gas turbine engines of aircrafts. Today, gas turbine engines are widely used in all areas related to aviation, such as for trains, tanks, marine, industrial, etc. The jet engine is the most common and basic type of the gas turbine engine. The jet engine optimizes the exhaust gases to produce thrust. The velocity of exhaust gases creates an impulse, causing the aircraft to move forward. The military jet engines can be fabricated with an afterburner, which significantly increases the thrust. The increase in the number of aircrafts directly effects manufacturing and restoring operations. Accordingly, some critical input parameters added optimizing performance of engines, such as fuel consumption for energy production due to increasing oil prices, as well as exhaust gases related to environmental concerns [1,2,3].
Many studies (including energetic (flight performance), economical (energy-related), environmentally (also energy and cost-related), safety, and controls) have been conducted to evaluate the jet engines, aircraft engines, and propulsion systems of aircrafts. In this study, in particular, environmental impact studies were examined. Although aviation-related emissions contribute to a small proportion of the total global emissions (CO2 is approximately 2.6% and is approximately 3% for NOx, etc.) the application of cost, energy, and environmental analysis in aviation is important because of the increase in today’s air traffic (increasing by approximately 5%–6% per year) [2,4,5,6,7]. To determine the right steps for environmental-related analysis, all emissions should be determined first. Then, the approach of the study should be specified. Herein, carbon dioxide (CO2), nitrogen oxides (NOx), unburned hydrocarbons (UHC), carbon monoxide (CO), water vapor (H2O), and other pollutants are important in environmental-related analysis. Moreover, the ozone creates negative effects on both the ecosystem and the health of humans; CO and small particles negatively affect the health of humans as well. In particular, CO2 located in the atmosphere causes global warming and climate changes. CO2 is produced as a result of demolishing and burning forests and plant cover, as well as burning fossil fuels, such as coal, petrol, and natural gas. A change in the quantity of CO2 causes changes in the atmospheric temperature and changes in global warming. Nowadays, the quantity of CO2 is 385 ppm (parts per million), compared to the amount of 280 ppm in the 1750s. Since that era (about 105 ppm CO2 increasing), the atmospheric temperature has increased by approximately one degree. Thus, the quantity of CO2 is an important factor in the increase of global warming. According to the International Civil Aviation Organization (ICAO), the rate of CO2 production from aviation has increased from 2.5% to 3% in recent years. There was a 4% increase in scheduled air traffic from 2001 to 2008, and this is expected to continue at a rate of 4.6% per year until 2025. The production of CO2 from aviation has increased each year with the population growth. The assumption in the simple linear regression, which is approximately 90%, indicates that aviation CO2 production will be the equivalent of 137.98 kg of CO2 per person in 2012, and the average annual increase will be 2.19 kg [8,9,10,11,12,13,14,15,16]. NOx and UHC bring ozone and smog into the atmosphere. Although NOx emissions cause a minimal level of damage, when compared with other emissions, they are major contributors to the overall emitted mass. As a result, these emissions cause the second-most health impacts. The global emission of NOx from aircrafts in the 1990s is estimated to be 0.71 Tg(N)∙yr−1 [15]. Beck et al. [17] examined the effects of aircraft engine emissions on the ozone layer; the authors found that NOx (Nitrogen oxides) emissions are important factors and that the ozone layer increased by 16% at flight altitudes. Schumann [5] studied air quality in the upper section of flight altitude and investigated the effects of NOx emissions on air quality. The study of Schumann concluded that the negative impact of air traffic on air quality is measured at only 3%; other pollutant sources are responsible for the rest of the damage. Mazaheri et al. [18] reported that NOx emission from large aircraft operations during LTO and ground-based operations at Brisbane Airport are measured at 13.5 ton/yr. Farias and ApSimon [19] also calculated the NOx emission values at Heathrow Airport.
Aircraft operations can be discussed in two categories, (i) ground-based (fuel and passenger service, baggage handling, maintenance activities, etc.) and (ii) flight-based (Landing and Takeoff–LTO– and Cruise) [8]. While other equipment causes environmental effects in ground-based operations, the only environmental effects in flight-based operations were created by aircrafts. The effects of the aircraft-induced emissions on the environment are categorized for on-ground emissions (LTO-taxi, takeoff, climb out, and approach) and off-ground emissions (cruise or non-LTO). Both operations were performed in the troposphere. This layer of the atmosphere is a region that collects various greenhouse gases that cause global warming. Aircraft exhaust emissions, which occur as a result of combustion, directly affect this region. Global warming is caused by greenhouse gases (GHGs), which are trapped in the atmosphere [20]. The layers of these two emissions can be divided by 915 m altitude from the surface of land. Cruise emissions take place above the 915 m altitude in the atmosphere. The only upper limit to the cruise operation is the aircraft model and specifications [21,22].
Environmental impacts, such as the noise, air quality, and climate change of aircrafts and other forms of aviation are important for both operations (LTO and cruise) [23]. The exhaust emissions of an aircraft engine can be listed as; CO, CO2, H2O, HC, NOx, sulfur oxides (SOx), particulate matter (PM), volatile organic compounds, and other trace compounds. Many parameters, such as the air quality, health of humans and environment, are affected by most of these compounds directly or indirectly. Many studies were applied in many airports to detect aircraft-induced emissions (PM, BC, CO, NOx, VOCs, SO2, Pb, CO2, HC) and their effects [24,25,26,27,28,29,30,31,32,33,34,35,36,37,38,39,40,41,42,43,44,45]. Some researchers [46,47,48,49,50,51,52,53] have studied the effects of aircraft emissions on the atmosphere. Lee et al. [48] examined the effects of subsonic aircraft emissions on the upper layers of the troposphere at 10.5 km flight altitude and Mach 0.85 speed. Research of the effects of emissions from Chinese aviation found that the emissions caused by wide-bodied aircraft affected residential areas [53]. Carr et al. [25] investigated the impact of emissions from aircraft engines on residential areas that were located near airports. This study revealed that residential areas are directly affected by emissions, especially lead. Nikoleris et al. [52] concluded that high fuel consumption and high emissions were related to flight maneuvers. Wulff and Hourmouziadis [46] indicated that alternative fuel activities and technological developments directly reduced emissions by 50%. The study of Kinsey et al. [51] focused on the rate of fuel flow in relation to particle emissions and identified areas affected by air pollution. Mazaheri et al. [18] calculated the emission and particle indices for all flight operations. This study indicated that more than 97% of the annual emissions at the airport occurred during landing and takeoff for other individual operational modes, especially the contribution of the climb-out mode. Kesgin [49] made emission calculations at 40 different airports in Turkey. According to this study, a two-minute reduction in aircraft taxiing operations would provide a 6% decrease in emissions. Kaygusuz [47] acknowledged that an important part of the total NOx and CO emissions in Turkey, designated as 0.25%–0.3%, was produced during the landing and takeoff (LTO). Altuntas and Karakoc [50] expected that the effects of aircraft emission during the LTO phase would decrease to 62.72% for human health and 68.10% for ecosystem quality, respectively, if domestic routes began actively using regional jets to the present narrow-bodied and large aircraft. It is anticipated that passengers will prefer airlines that attempt to minimize the environmental impacts of their aircrafts. Ahmadi and Dincer [54] analyzed a gas turbine power plant, developed a simulation code and validated this code by comparing actual data obtained from a running gas turbine power plant; after optimization studies, they reported an approximate 50.50% decrease in the environmental impacts of the plant. Altuntas et al. [55] investigated a piston-prop aircraft engine for four different flight phases (takeoff, climb, approach, and taxi). They proposed a best air-to-fuel ratio/altitude/power setting option that minimizes the environmental impacts. Atilgan et al. [56] investigated a turboprop engine by using exergo-environmental method. The results show that a compressor, combustion chamber, gas generator turbine, power turbine and exhaust nozzle create 9%, 69%, 13%, 7%, and 2% of total environmental impacts of the engine, respectively. According to these rates, the compressor and gas turbine can be considered as the first to improve in the case of component-related environmental impacts. Ahmadi and Dincer [57] modeled a combined heat and power (CHP) plant and performed exergoenvironmental optimization of the plant. Results showed that higher isentropic efficiency of compressor and gas turbine causes less exergy destruction in compressor and gas turbine. This means lower fuel consumption, thus lower environmental impact and lower operating cost.
The determination of emission levels is not the only adequate tool for making changes. Some obligations and sanctions must be applied to emission reduction operations; laws should encourage everyone, from producers to users, to reduce the environmental impacts. Vlek and Vogels [58] indicated that some improvements should be made to existing laws in order to address the environmental effects of aircraft emissions.
Emissions are directly affected by some specific parameters, such as fuel and operation. In this study, two different fuels, Jet-A and Liquid Hydrogen (H2), were compared with environmental values in the jet engine (a case study with GE-J85). This comparison was performed separately for different aircraft operations.
This was the prime motivation for conducting this study, which differs from previously conducted studies, according to the following:
  • Damages are devised for the turbojet engines.
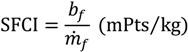
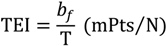
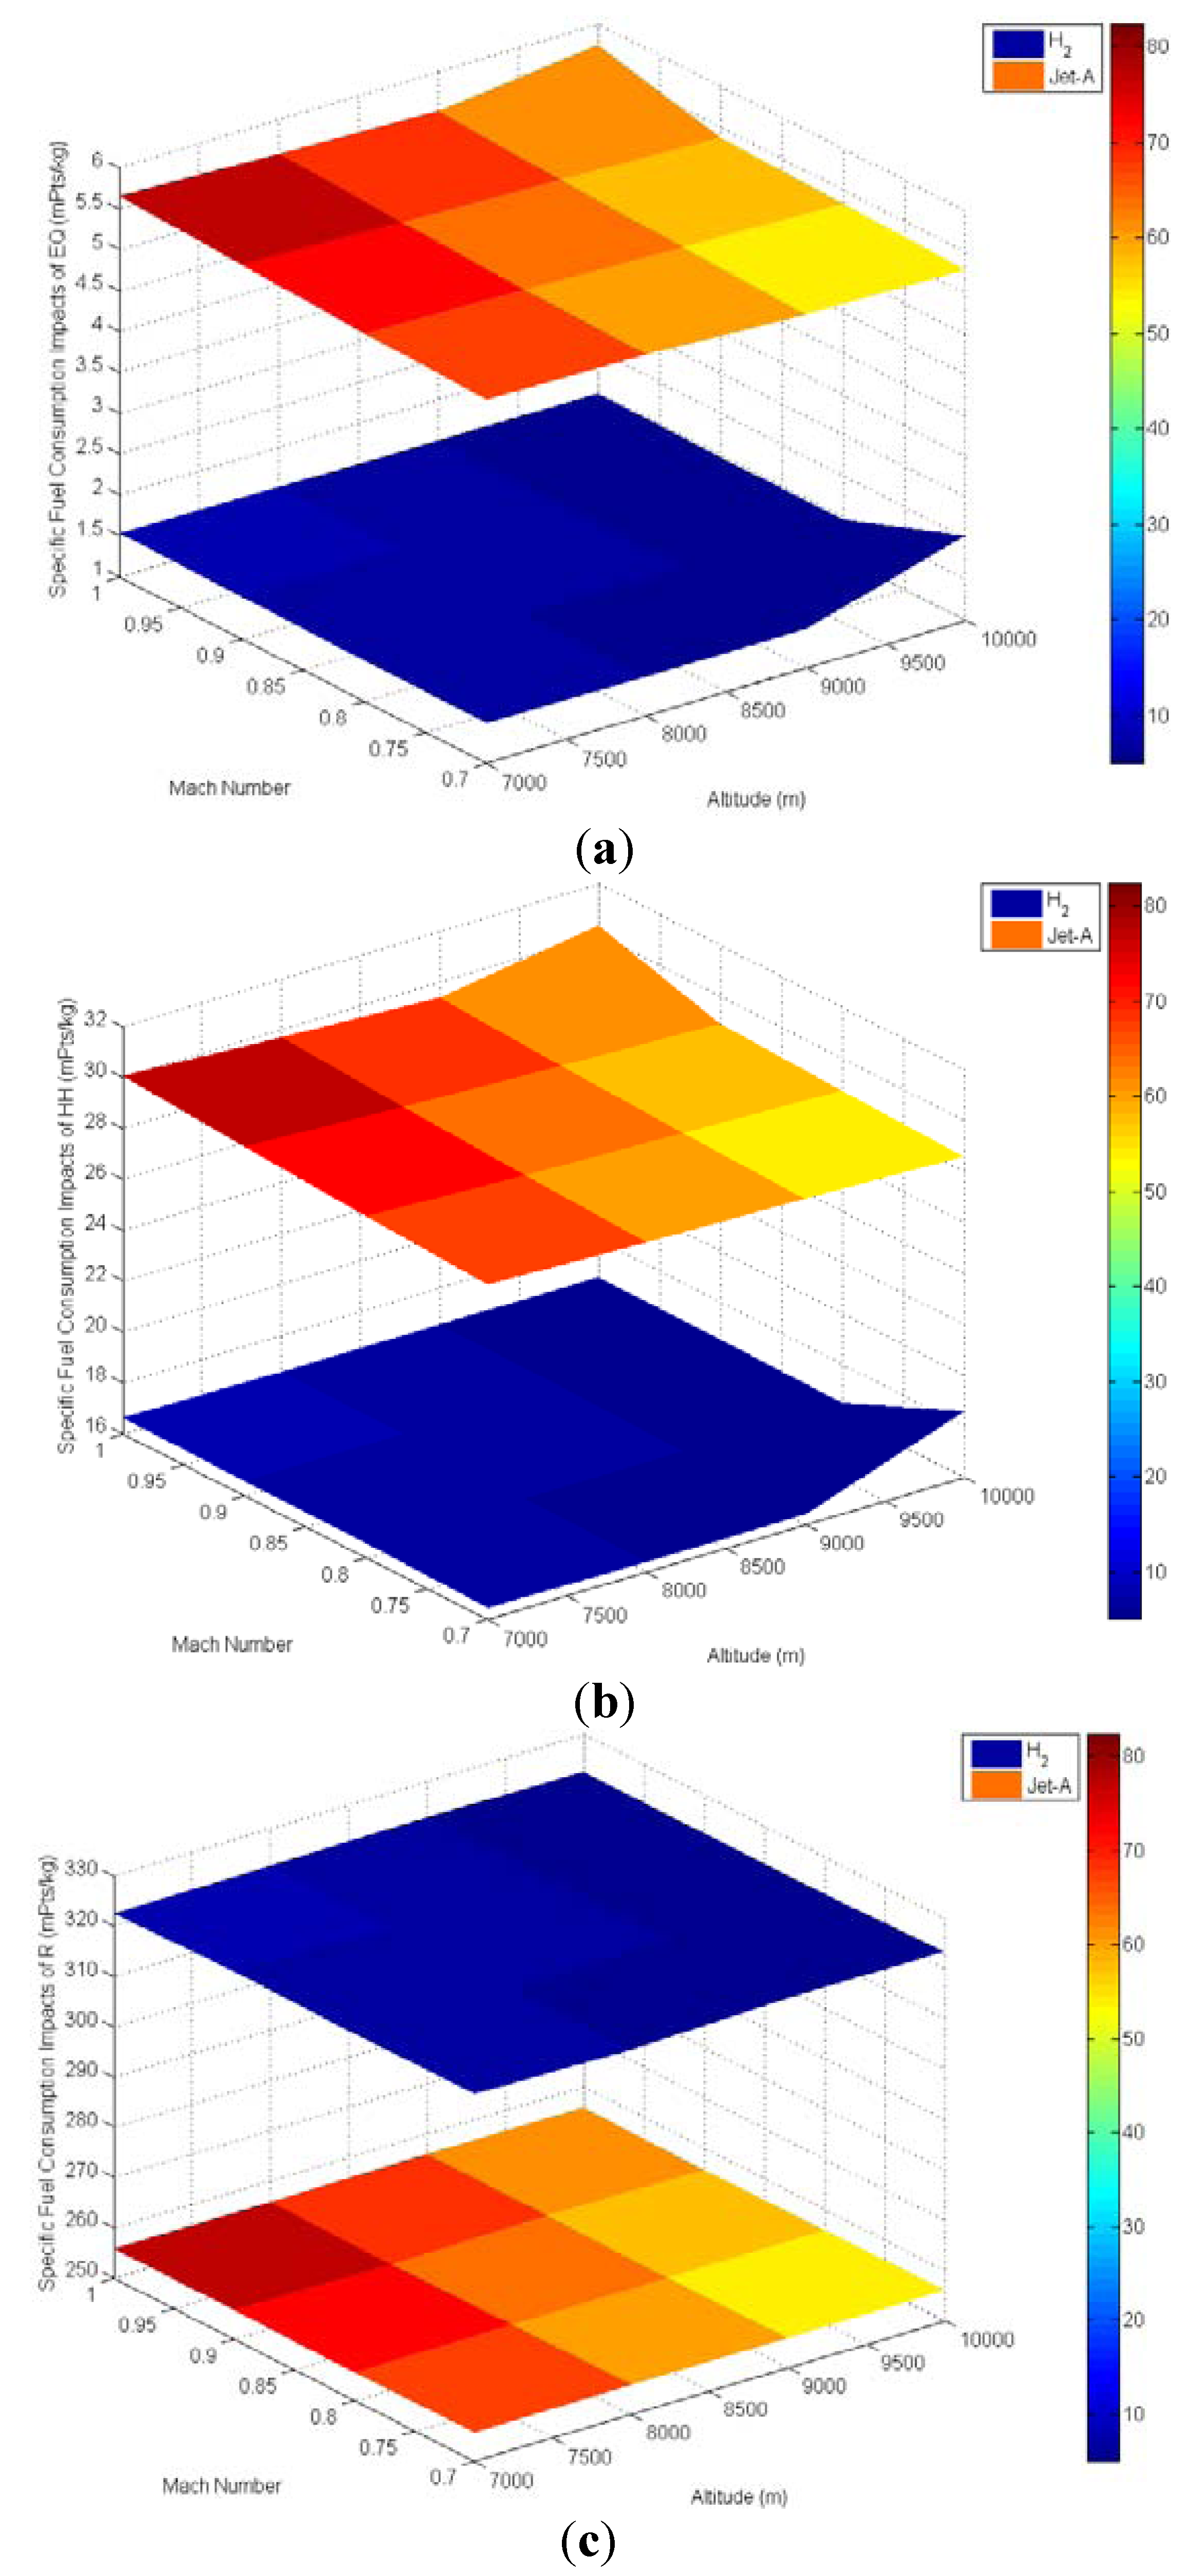
  • Specific fuel consumption impacts are found for total and each damage categories.
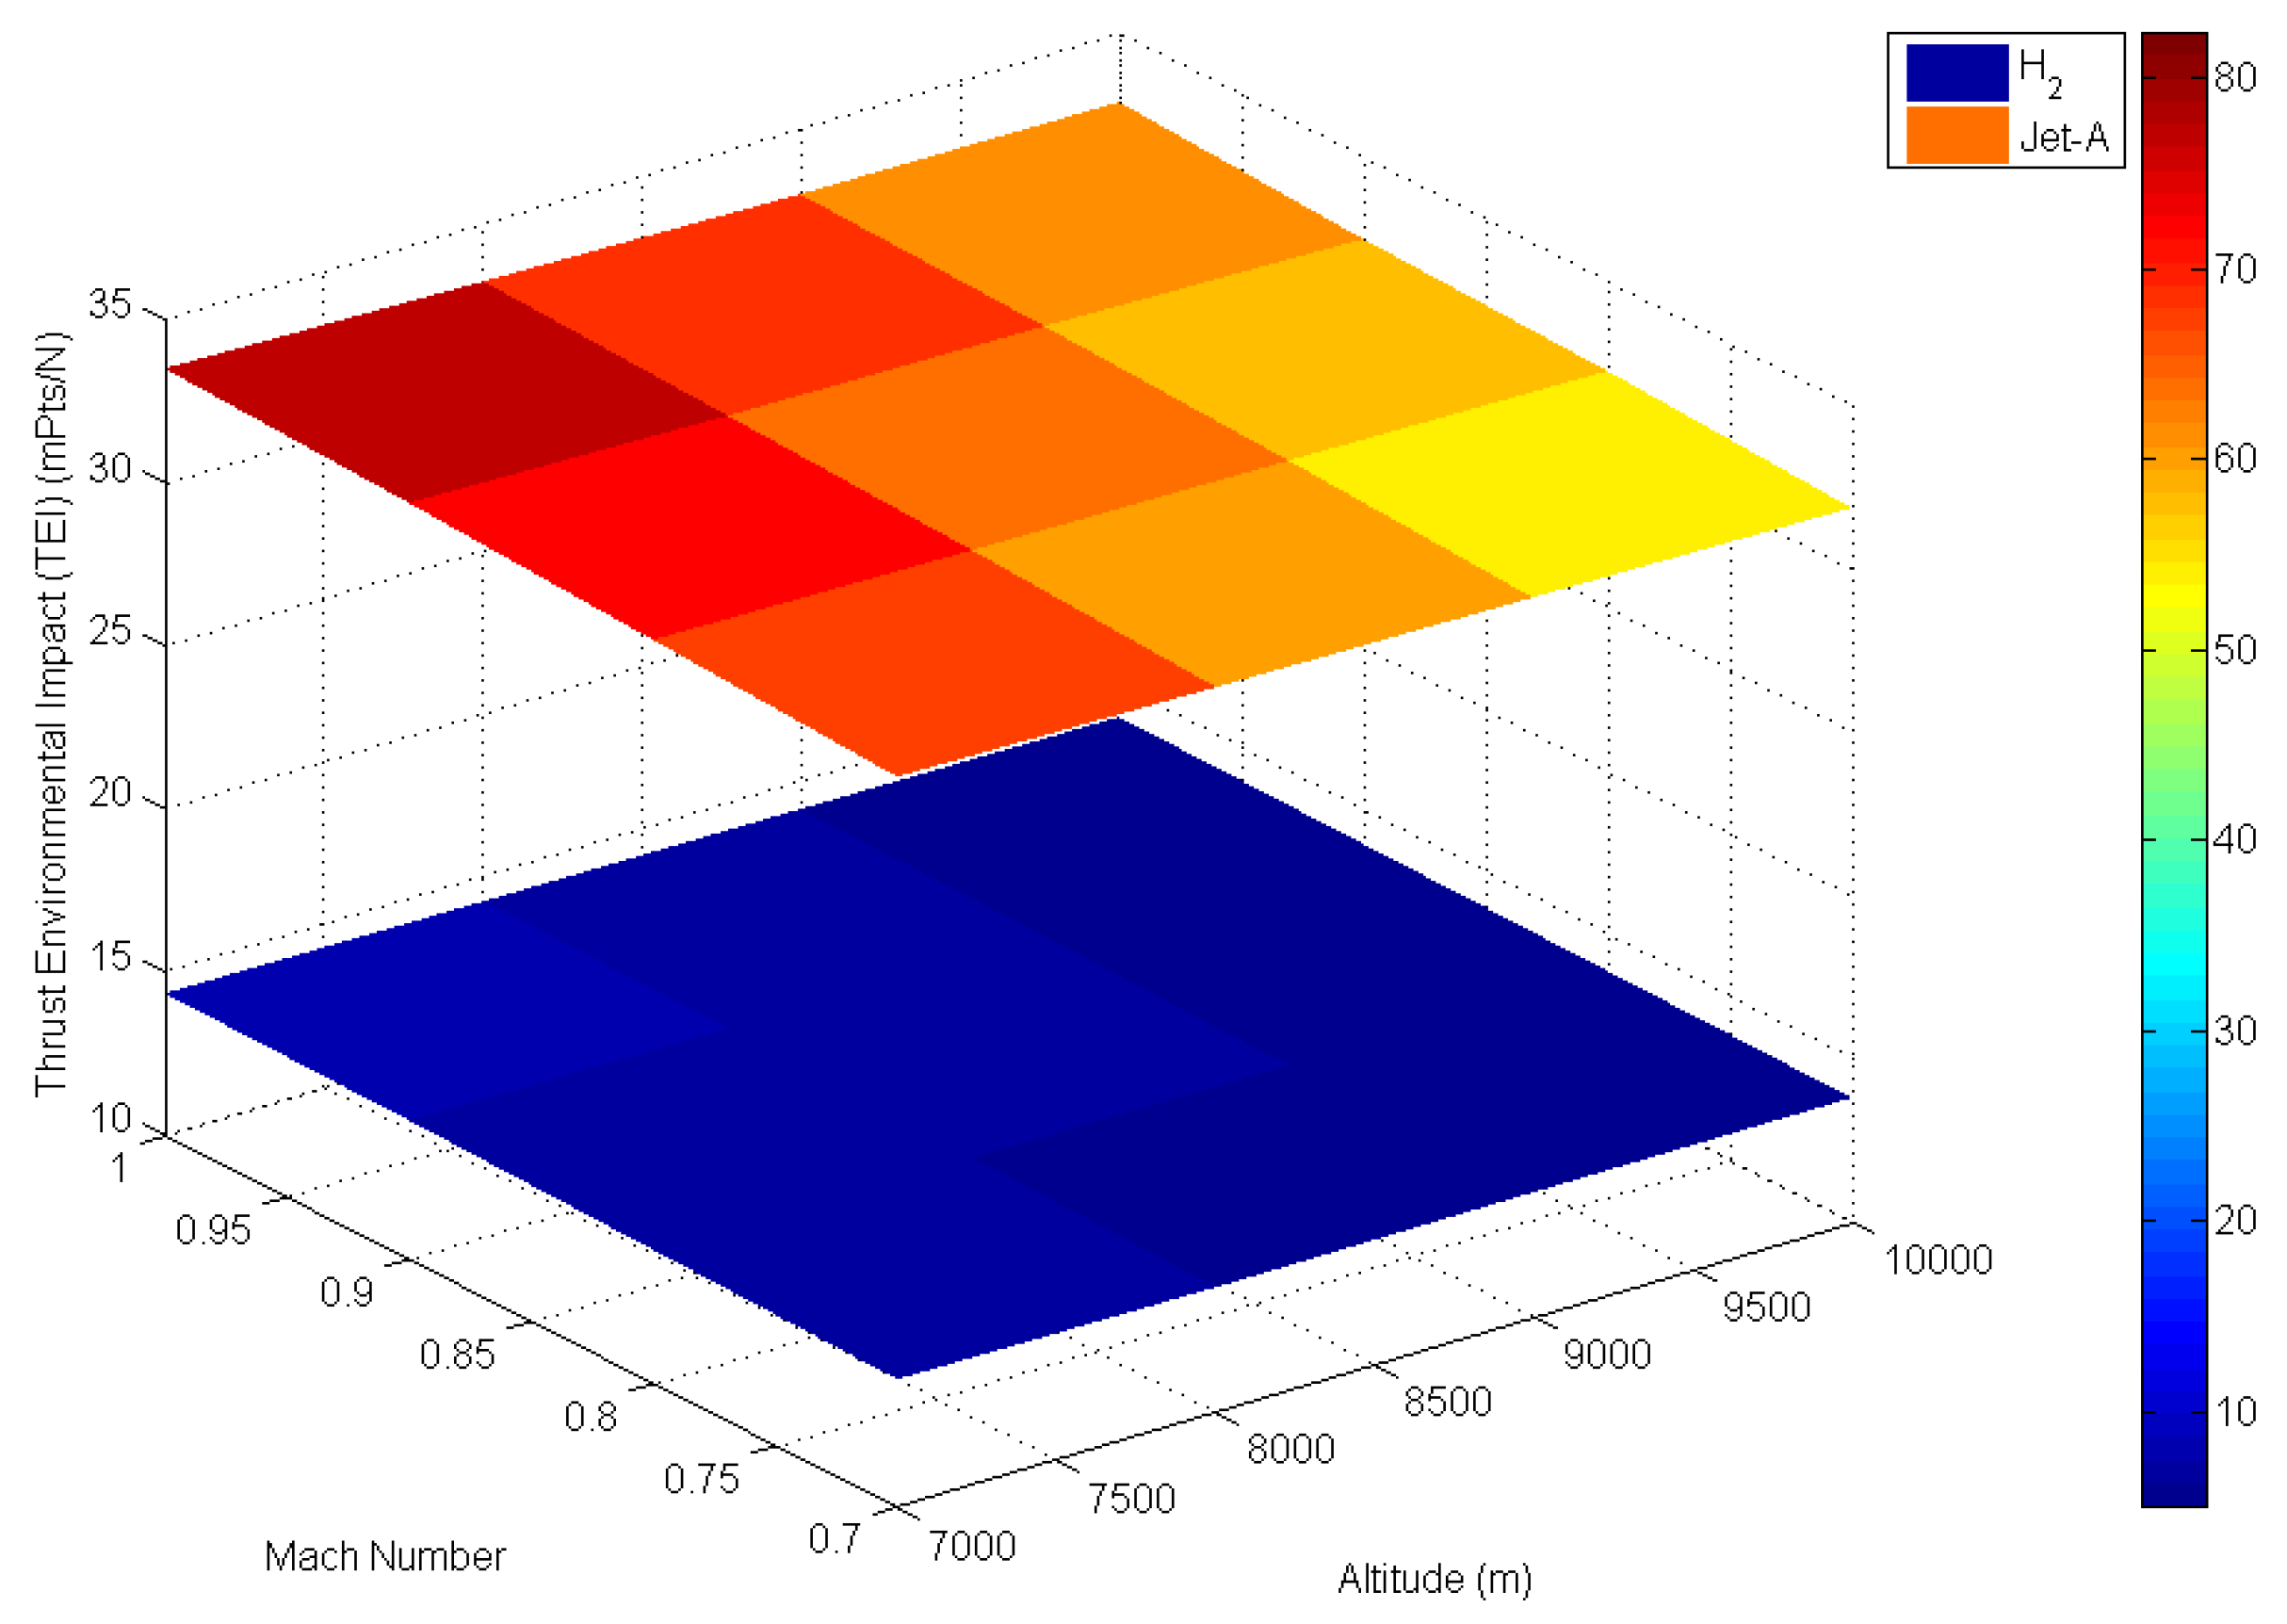
  • The Thrust Environmental Impact (TEI), described for first time in the literature, is calculated.
  • For all damages and impacts are calculated for different altitudes and Mach numbers.

2. System Modeling and Methods

2.1. Description of Aircraft Engines

GE-J85 engine (a turbojet engine) was selected for this study because of the widely used area (for high performance trainers and tactical aircraft), high experience rate (more than 75 million flight hours experience on military and commercial models), having too many aircraft engines (more than 6000 engines have been flying in a number of applications remain in active service in 35 countries since 1960), previous environmental studies (such as noise [59]), and alternative fueled production [60,61]. Current plans for the U.S. Air Force (USAF) call for J85-powered aircrafts to be in service through 2040 [62].
In addition to the Mach number, altitude is a critical performance parameter because of constantly changing environmental conditions. For this reason, the critical altitude was selected between 7000 and 10,000 m, actual cruise altitude.
Because the turbojet engines were examined, the descriptions of the structures and properties of these types of engines are important. A schematic diagram of a simple turbojet engine (without afterburner) is shown in Figure 1. The thrust of a turbojet is developed by compressing air in the inlet section (between Sections 0 and 2) and the compressor section (between Sections 2 and 3); this mixes the air-fuel, burns in the combustor chamber section (between Sections 3 and 4), and expands the gas stream through the turbine section (between Sections 4 and 5) and the nozzle section (between Sections 5 and 8). The expansion of gas through the turbine supplies the power to turn the compressor. The net thrust, delivered by the engine, is the result of converting internal energy to kinetic energy [2].
Figure 1. Schematic diagram of a basic turbojet engine.
Atmosphere 05 00307 g001
While some GE-J85 type engine values, such as energy equations, exhaust values, etc., were obtained from [1,63,64,65,66,67], others were provided by sample turbojet engine performance software [68,69].
Some engine specifications, accepted for calculations, were listed below:
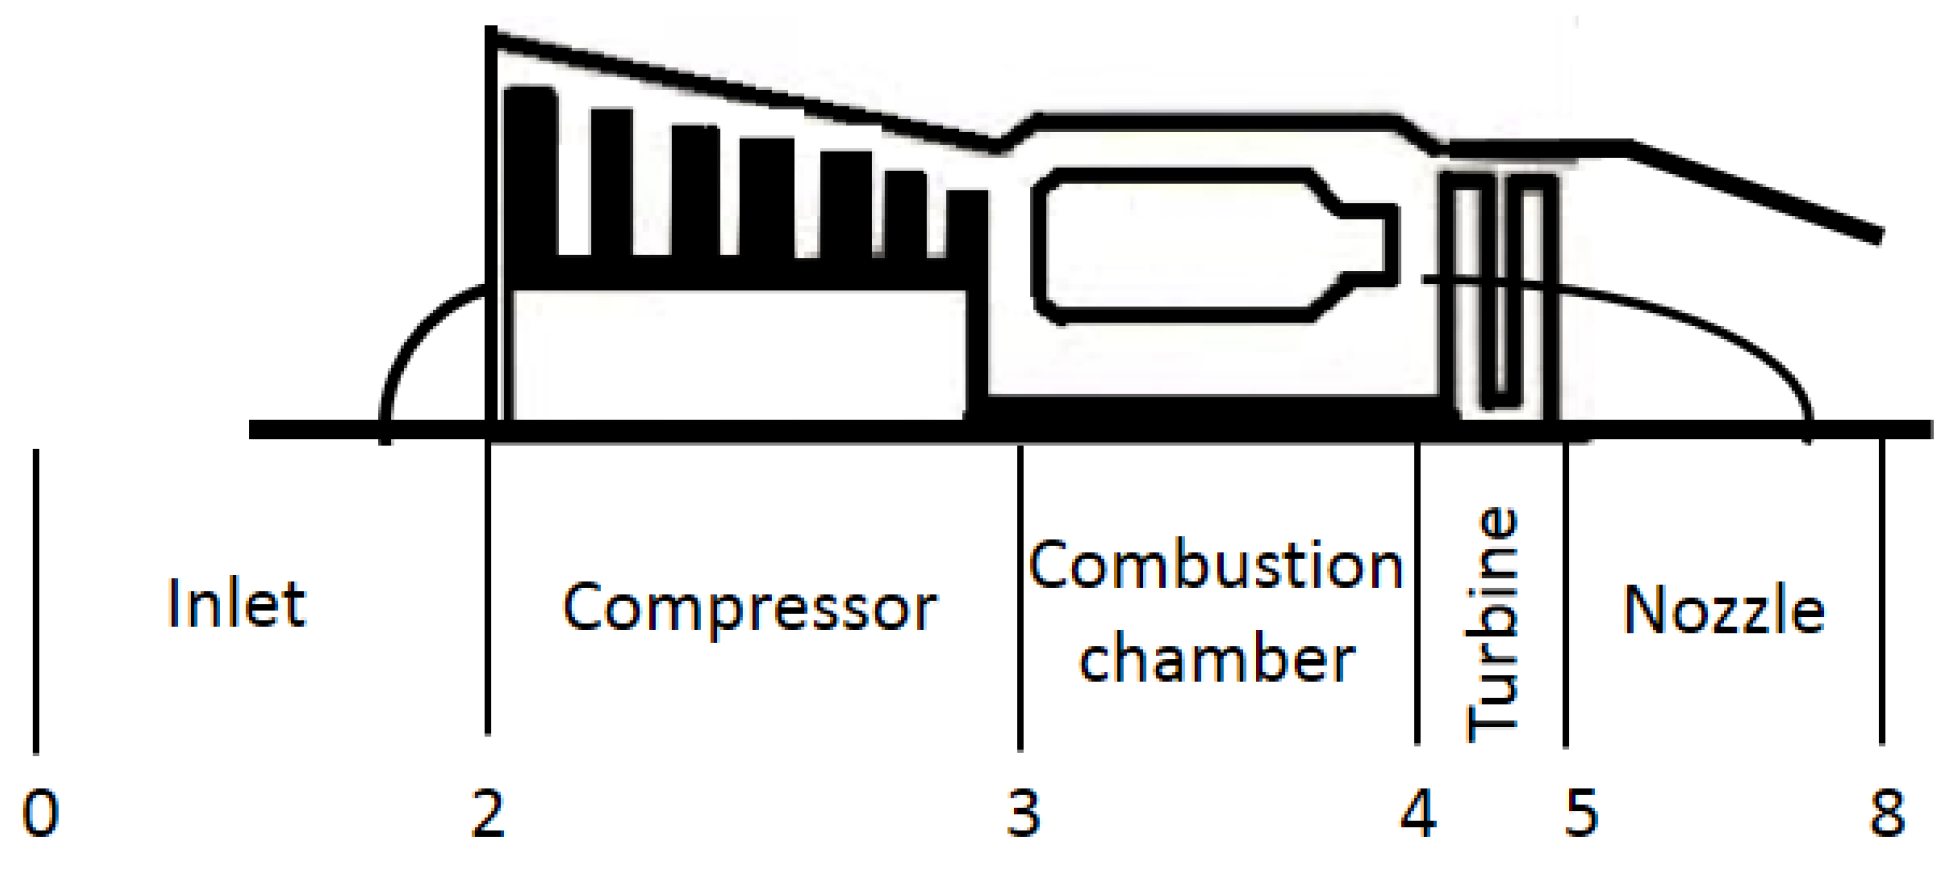
  • Inlet section has a one pressure recovery value.
  • Compressor section has six stages. The pressure ratio is 8.3, and the compressor efficiency is 82.2%.
  • The burning efficiency of the combustor chamber is 98.2%, and the maximum temperature value is approximately 1260 K. In this study, besides Jet-A fuel, liquid hydrogen was used for calculation parameters. Meanwhile, Jet-A has a 43,260 kJ/kg LHV, 790 kg/m3 density, Liquid Hydrogen has a 116,059 kJ/kg LHV, 76.39 kg/m3 density.
  • The turbine section has two stages, and the turbine efficiency is 88.2%.
  • The outlet of the nozzle section is approximately two times higher than the outlet of the inlet section. In addition, the nozzle efficiency is 97%.

2.2. Atmospheric Implications

As previously mentioned, aircrafts fly between the troposphere and the stratosphere. This layer of the atmosphere is a critical zone for collecting greenhouse gases that may create negative effects on the earth. Aircraft exhaust emissions that are created in this region cause global warming at the cruise phase [20].
The basic important parameters of GE-J85 engine performance for this study can be listed as:
  • Engine thrust
  • Fuel specifications and consumption
  • Stationary pressure and temperature, especially inlet and outlet of combustor chamber
After the calculation of fuel flow and pressure and temperature of combustor chamber for both inlet and outlet section is made, the emission of production can be calculated. Due to the fact that CO2, H2O, CO, SO2, UHC, and N2 are directly proportional to the production of combustion, modeling of them can be done with fuel consumption and fuel-specific emission indexes. For jet kerosene, while the emissions indexes are accepted as 3160 g CO2/kg fuel, 1260 g H2O/kg fuel, 0.8 g SO2/kg fuel, 0.6 g CO/kg fuel, 0.01 g UHC/kg fuel, N2 values can be calculated with weight of air. The NOx formation is evaluated with a series of chemical reactions. For the NOx information (emission index), the combustor entry and outlet are sufficient. The correlation for the NOx emission index (g/kg) for the next generation of jet engines is written as [70,71,72]:
Atmosphere 05 00307 i001
In this equation, P3 and T3 are the burner entrance pressure and temperature, and T4 is the burner exit temperature (units are kPa and K and Equation (1) was adapted from [71]). While the T3 range was between 495 K and 690 K, T4 was accepted between 1225 K and 1255 K.
The main negative effect on atmosphere—such as increasing temperature, causing greenhouse effects—is caused by basic burning emissions, CO2 and H2O, as discussed in introduction section. In addition, SO2, created with oxidation of Sulfur, exists in trace amounts in atmosphere, and this emission is primarily as a pollutant. High temperature burning leads to generate NOx (NO, NO2 and N2O) with oxidation of N2 in atmosphere. The increase in amount of these emissions is directly reflected on the total amount in atmosphere. In this regard, it is important to determine both the amount and the effects of all emissions on atmosphere.
After the detection of emission, the impact and damages of these emissions were found with SimaPro 7.2.4. The effects and results of various environmental pollutants differ. Identifying the effects in equality can be effective for the decision-making process in regards to the system operation. Therefore, the life cycle assessment (LCA) will be an important tool that considers all of the effects and offers results that can be helpful for making decisions. Environmental impact assessment, a phase of the LCA, characterizes and evaluates the impacts of the environmental inputs. These impacts may be listed as abiotic and biotic resources, use of space, global warming, stratospheric ozone destruction, ecotoxicology, toxicological effects on human health, formation of oxidation photochemistry, and eutrophication [73,74].
These environmental damages are evaluated with the Eco-indicator-99 software [75], an impact assessment method for the LCA. In the Eco-indicator 99 method, all impact categories that refer to human health damages are expressed as disability-adjusted life years (DALY). DALY is expressed as the number of years lost due to problems with health, disability, or early death. One DALY essentially can be thought of as one lost year of healthy life. Human health damages consist of respiratory and carcinogenic damages, global exchange, and increasing radiation rains, all causes of ozone layer depletion. Ecosystem quality damages are not a homogeneous distribution as the human health effect and are specified as PDF∙m2∙yr (PDF: Potentially Disappeared Fraction). In this case, a damage of one means all species disappear from one m2 area during one year. Ecosystem quality damages are the result of ecotoxic emissions, the combined effect of acidification and eutrophication, land occupation, and land conversion. The damages to resources are specified as MJ surplus energy. In short, the results of these damages indicate the future generational effects of today’s bad energy sources [76].
In addition, Eco-indicator 99 has a damage assessment step: This means that the impact category indicator results that are calculated in the “characterization” step are added to form the damage categories. Addition without weighting is justified here because all of the impact categories that refer to the same damage type (such as human health) have the same unit (for instance, DALY). This procedure can also be interpreted as grouping. The damage categories (and not the impact categories) are normalized on a European level (damage caused by one European per year), mostly based on 1993 as a base year, with some updates for the most important emissions [75,76].
Beside damages, the impacts of these emissions are calculated with SimaPro 7.2.4. Impacts are worked up into a single number (this value can be displayed as b, and also its unit is mPts) called the Standard ECO-indicator showing the environmental load of each process and making a comparison between them possible. The unit of measurement is the ECO-Indicator millipoint, defined as “one thousandth of the yearly environmental load of the average European citizen” [76,77].
Two new definitions have first been described with this study, (i) specific fuel consumption impact and (ii) thrust environmental impacts. Specific fuel consumption, defined with Equation (2), is the normalized impacts of per kg fuel consumption.
Atmosphere 05 00307 i002
where bf is the weighted environmental impact of fuel and this unit is calculated by entering the desired points values at SimaPro 7.2.4., and ṁf is fuel flow. Thrust environmental impacts, defined with Equation (3), are the normalized impacts of thrust.
Atmosphere 05 00307 i003
where T is thrust of the aircraft.

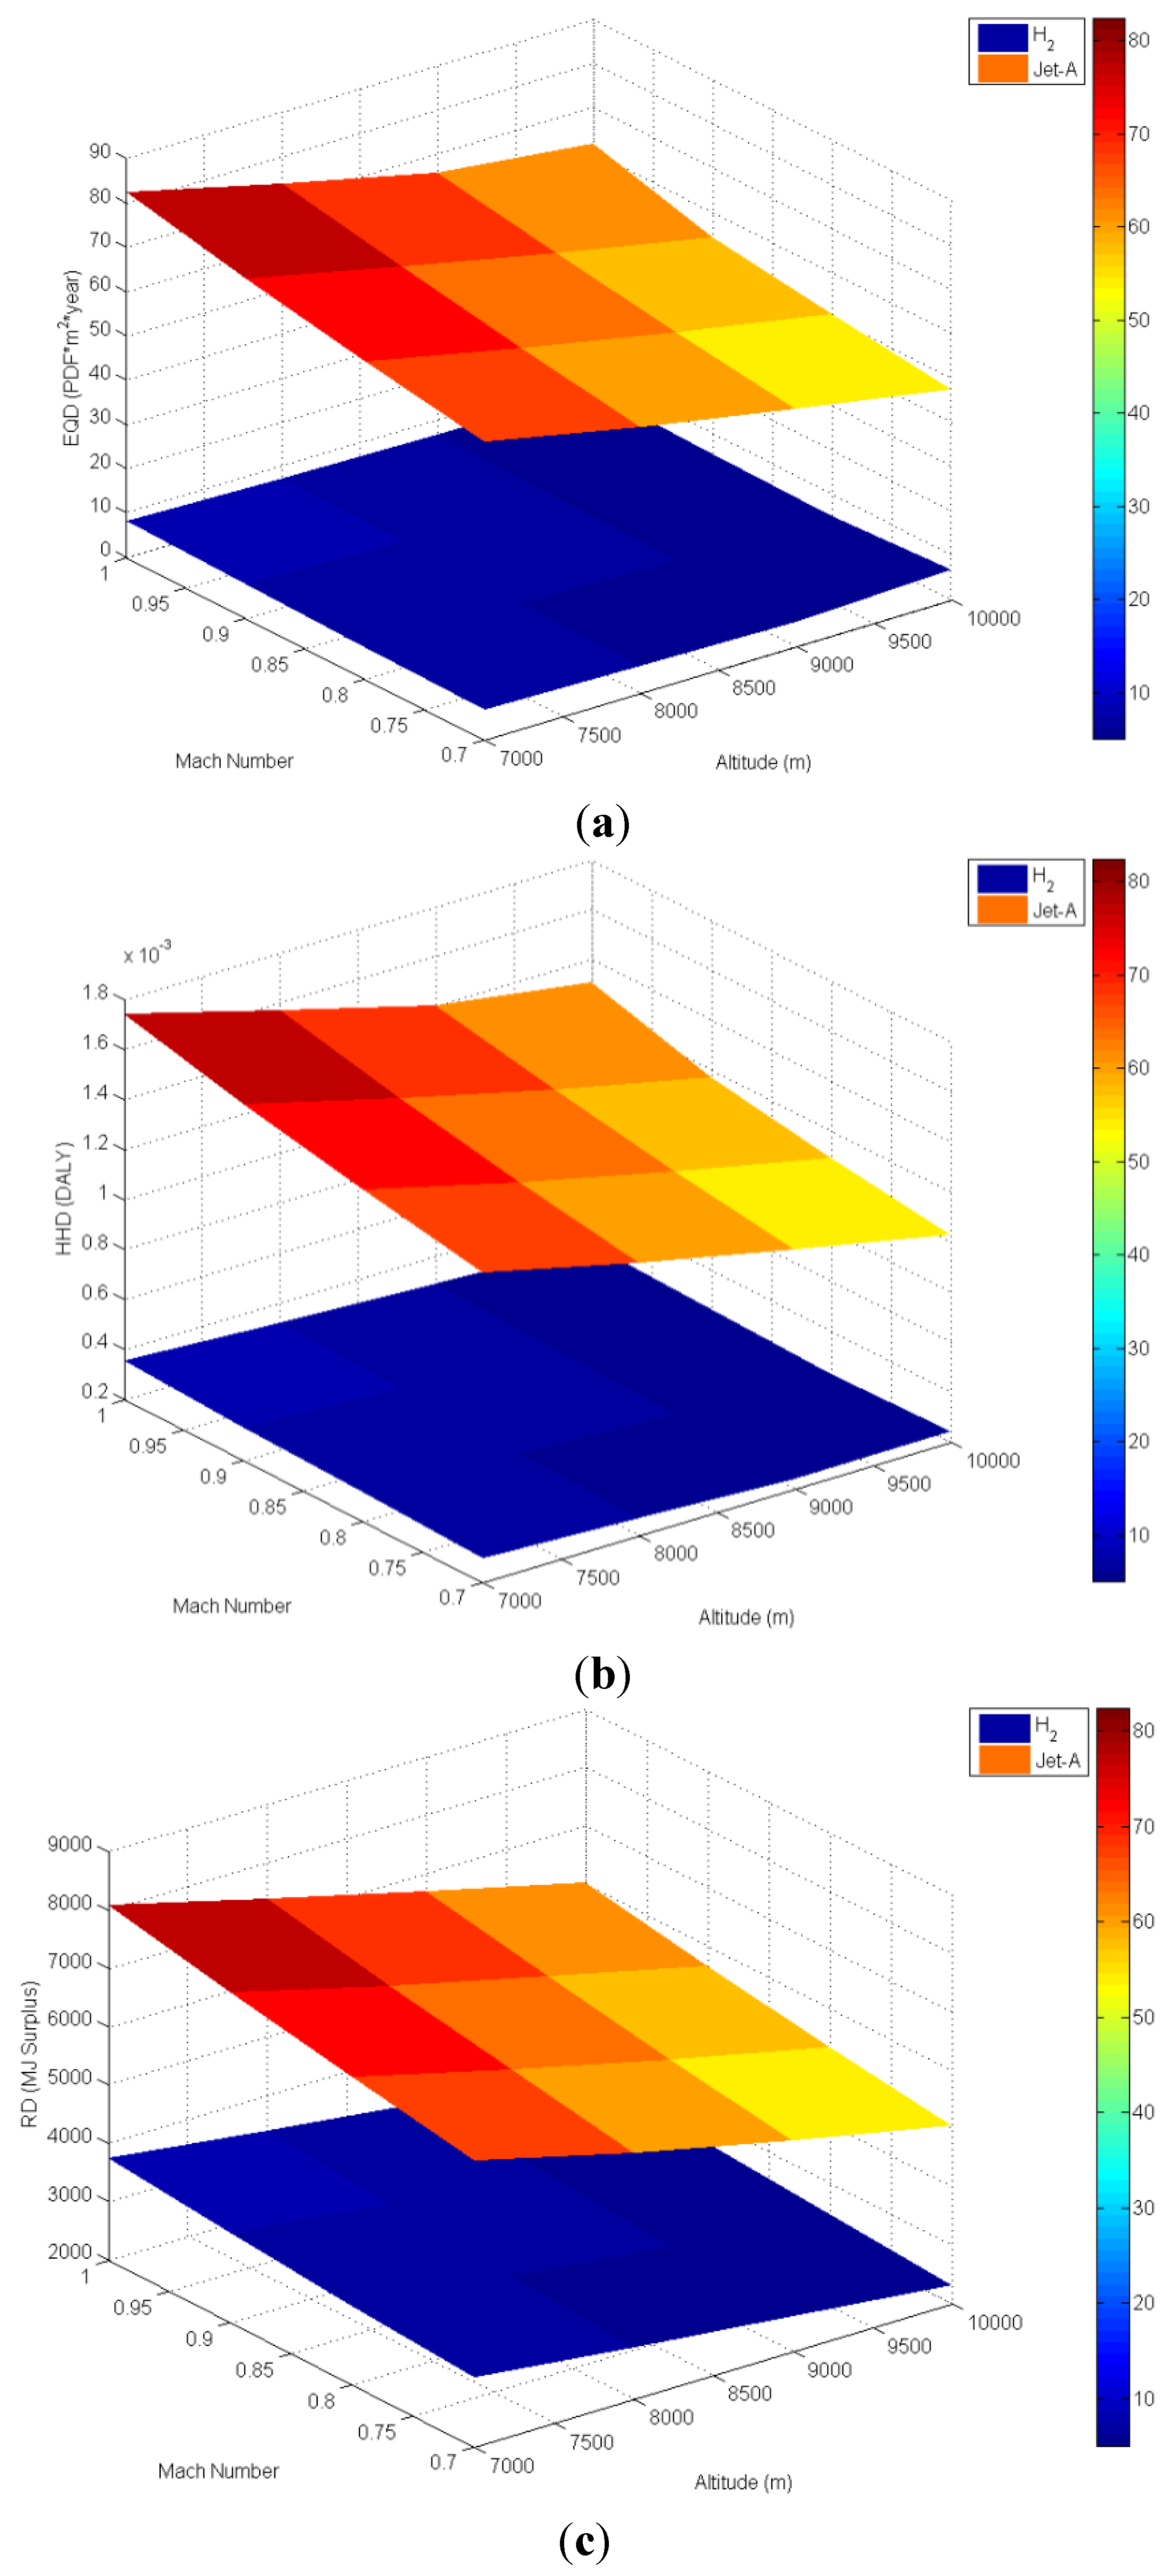
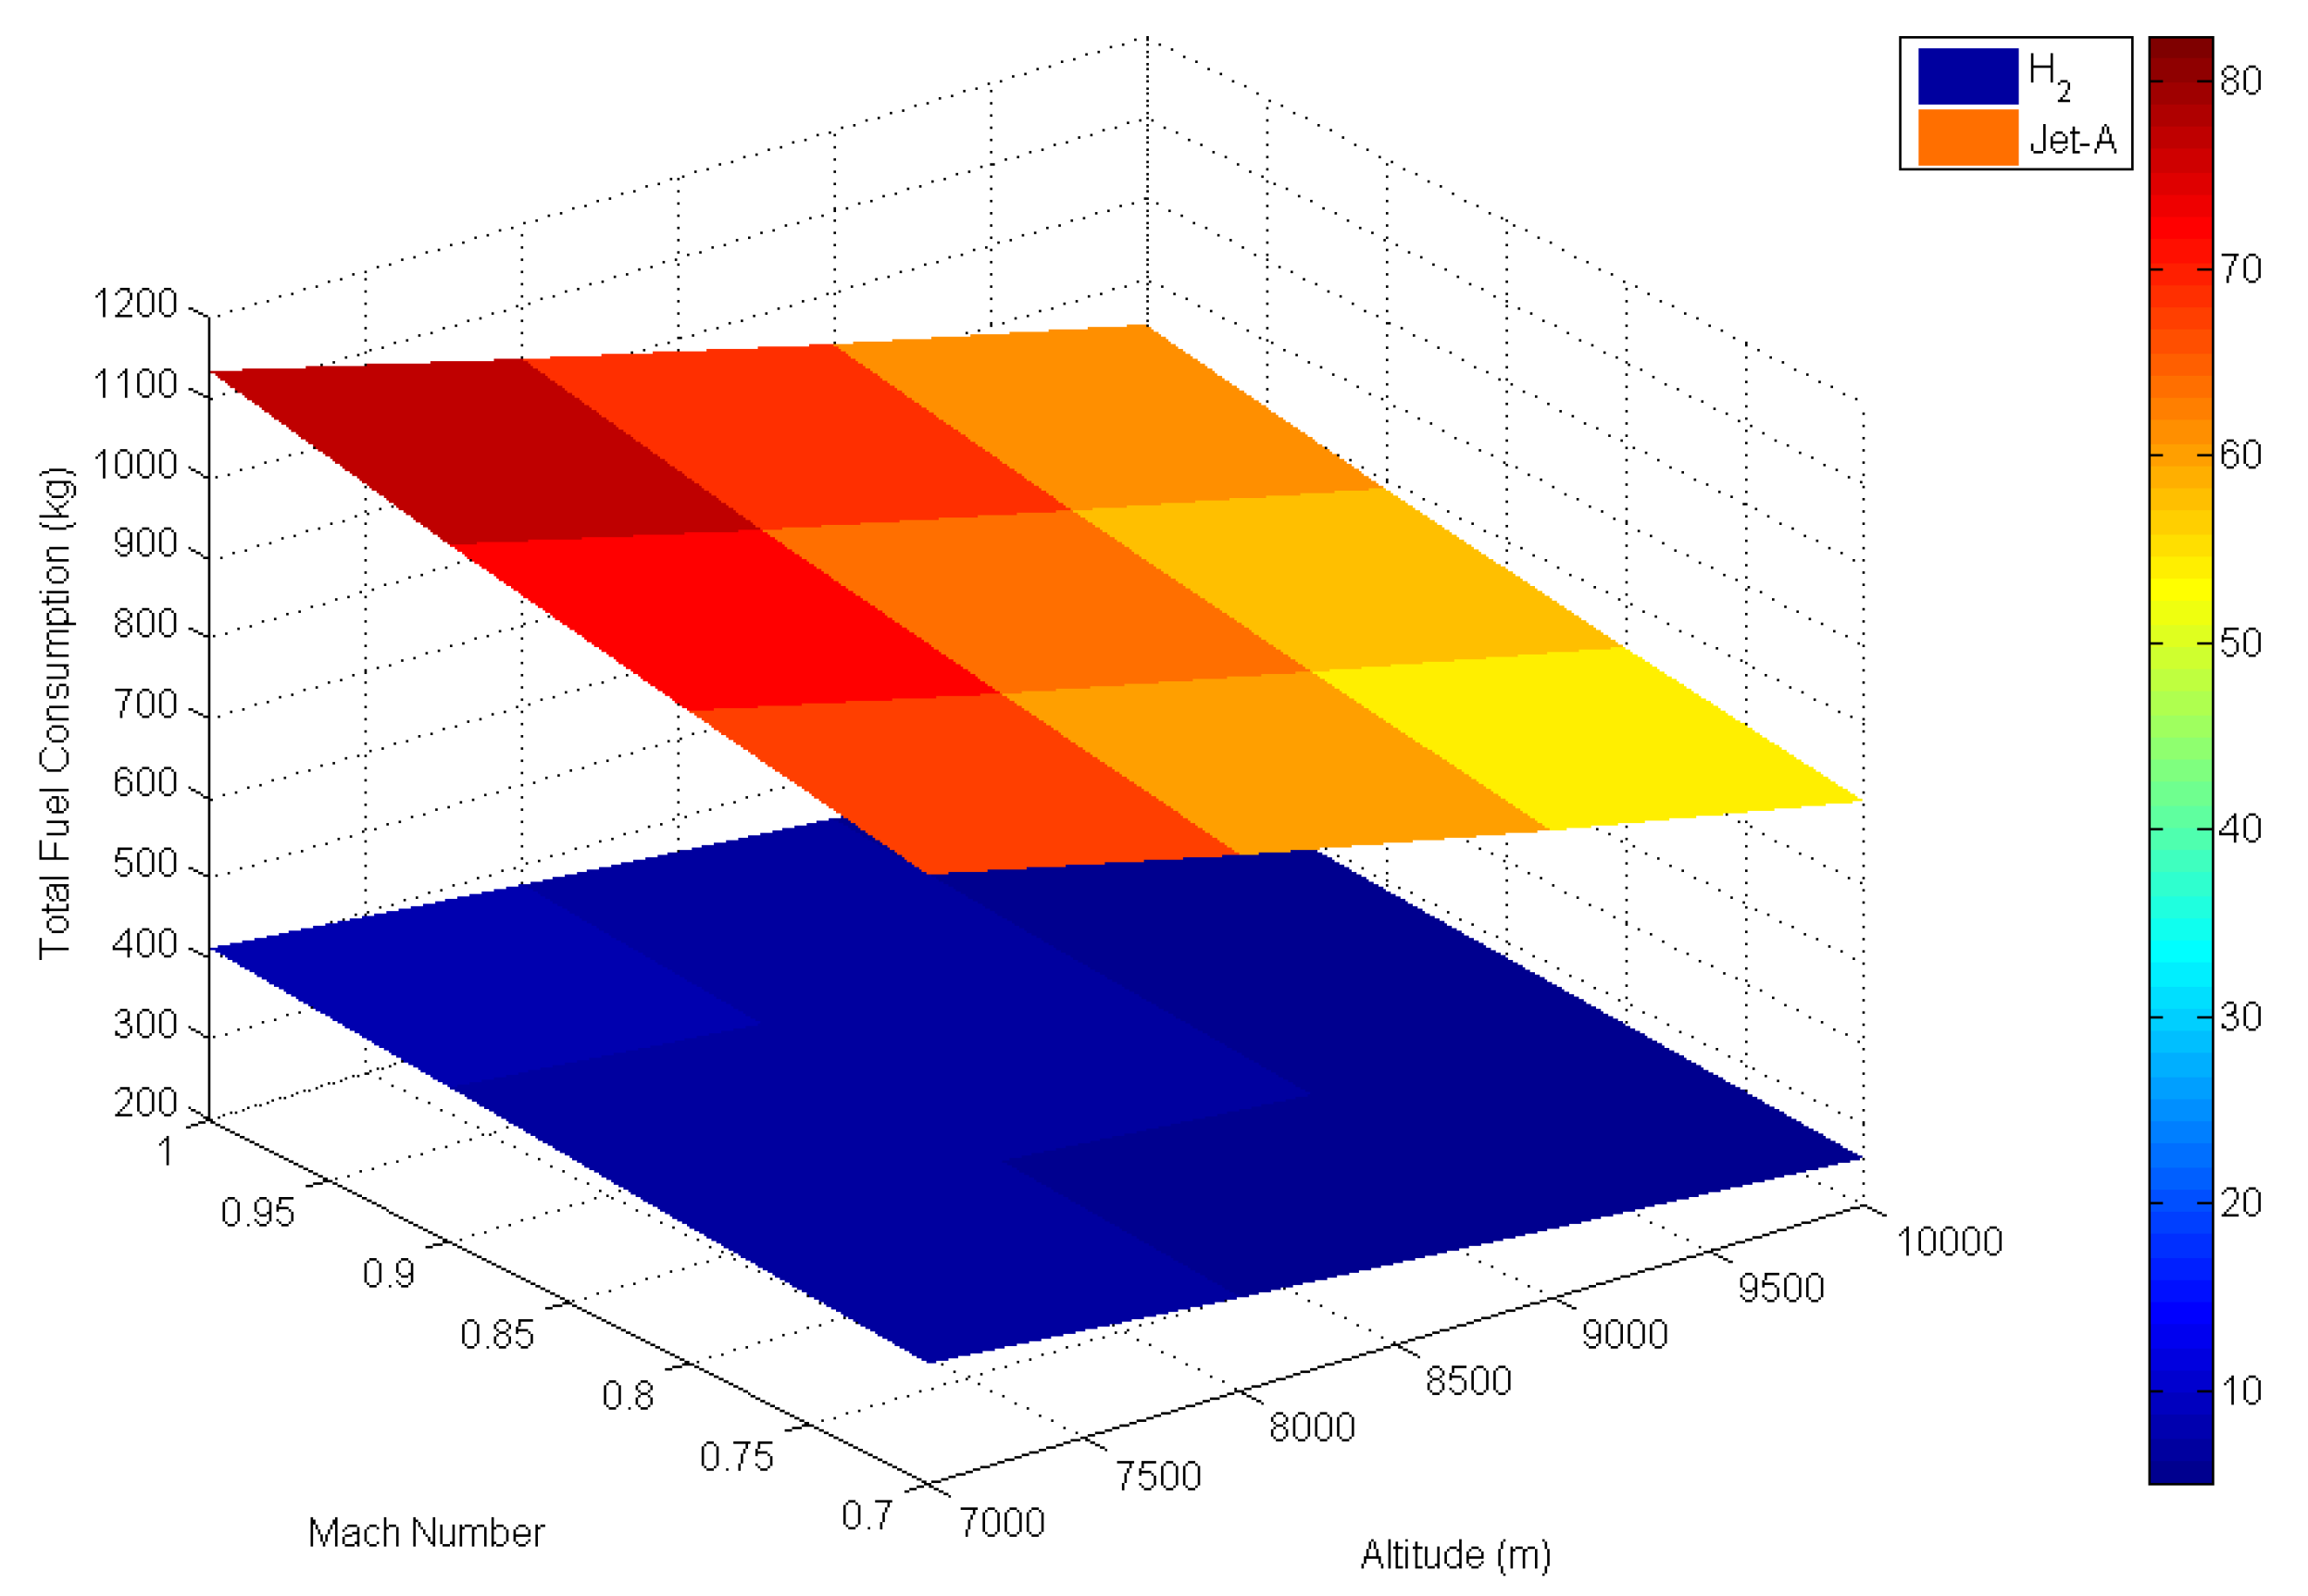
3. Results and Discussion

First, damages (ecosystem quality, human health, and resources) of both fuel types (Jet-A and Hydrogen) have been found and drawn with variation with Mach number and altitude. All results are calculated for an hour flight situation. Ecosystem quality damages (EQD) were calculated and shown in Figure 2a. Damages of Jet-A were higher than H2–fueled. While maximum EQD damage was calculated 82.44 PDF∙m2∙yr at Jet-A fueled, 1 Mach, and 7000 m, minimum EQD damage was found to be 5.08 PDF∙m2∙yr at H2, 0.8 Mach, and 10,000 m. Human health damages (HHD) were calculated and shown in Figure 2b. Damages of Jet-A were higher than those of H2–fueled. While maximum HHD damage was calculated 1.75 × 10⁻³ DALY at Jet-A fueled, 1 Mach, and 7000 m, minimum HHD damage was found to be 0.228 × 10⁻³ DALY at H2, 0.8 Mach, and 10,000 m. Resources damages (RD) were calculated and shown in Figure 2c. Damages of Jet-A were higher than those of H2–fueled. While maximum RD damage was calculated 8100 MJ Surplus at Jet-A fueled, 1 Mach, and 7000 m, minimum RD damage was found to be 2314.80 MJ Surplus at H2, 0.7 Mach, and 10,000 m. As Jet-A has a higher environmental and human effects, the maximum HHD, EQD, and RD was found in the Jet-A-fueled aircrafts.
Fuel demand and consumption increase with Mach number increasing, for this reason more fuel consumption causes more damages for all categories. Altitude is different from Mach number. As discussed in ref [21], irregularities are decrease with altitude, therefore damages are decrease.
Total fuel consumptions were found and shown in Figure 3. Damages of Jet-A were higher than those of H2–fueled. While maximum total fuel consumption was calculated 1133 kg at Jet-A fueled, 1 Mach, and 7000 m, minimum total fuel consumption was found to be 256 kg H2, 0.7 Mach, and 10,000 m. H2 should be burnt 2.74 times less than Jet-A, during an hour cruise flight. Because the total volume of fuel storage will be 3.77 times, there is a need for an additional fuel area (minimum 2.46 m3, maximum 3.98 m3) in addition to the existing fields in the aircraft.
Figure 2. (a) Ecosystem Quality Damages (EQD) variation with Altitude and Mach number; (b) Human Health Damages (HHD) variation with Altitude and Mach number; (c) Resources Damages (RD) variation with Altitude and Mach number.
Atmosphere 05 00307 g002
Figure 3. Total fuel consumption variation with Altitude and Mach number.
Atmosphere 05 00307 g003
After determining all damages, Specific Fuel Consumption Impacts (SFCI) of both fuel type (Jet-A and Hydrogen) for all categories (ecosystem quality, human health, and resources) separately have been found and drawn with variation with Mach number and altitude. All results are calculated for an hour flight situation as the same of damages. SFCI of EQ was calculated and shown in Figure 4a. Impacts of Jet-A were higher than those of H2–fueled. While maximum SFCI of EQ was calculated 5.74 mPts/kg at Jet-A fueled, 1 Mach, and 10,000 m, minimum SFCI of EQ was found to be 1.46 mPts/kg at H2, 0.8 Mach, and 10,000 m. SFCI of HH was calculated and shown in Figure 4b. Impacts of Jet-A were higher than those of H2–fueled. While maximum SFCI of HH was calculated 30.39 mPts/kg at Jet-A fueled, 1 Mach, and 10,000 m, minimum SFCI of HH was found to be 16.36 mPts/kg at H2, 0.7 Mach, and 9000 m. SFCI of R was calculated and shown in Figure 4c. Impacts of H2–fueled were higher than those of Jet-A. While maximum SFCI of R was calculated 323.50 mPts/kg at H2-fueled, 1 Mach, and 7000 m, minimum SFCI of R was found to be 255.51 mPts/kg at Jet-A, 0.9 Mach, and 10,000 m.
Specific Fuel Consumption Impacts (SFCI) of both fuel types (Jet-A and Hydrogen) have been found and drawn with variation with Mach number and altitude. SFCI was calculated and shown in Figure 5. Impacts of H2–fueled was higher than Jet-A. While maximum SFCI was calculated 344.03 mPts/kg at H2-fueled, 0.7 Mach, and 10,000 m, minimum SFCI was found to be 289.79 mPts/kg at Jet-A, 0.7 Mach, and 10,000 m. The reason for the higher SFCI of resources with the H2-fueled aircraft is the greater energy use in the production, transportation, and storage of H2. Determining which parameter (in ecosystem quality, human health, and resources) is more significant is very important.
Thrust Environmental Impacts (TEI) of both fuel types (Jet-A and Hydrogen) have been found and drawn with variation with Mach number and Altitude. TEI was calculated and shown in Figure 6. Impacts of Jet-A were higher than those of H2–fueled. While maximum TEI was calculated 33.52 mPts/N at Jet-A fueled, 1 Mach, and 7000 m, minimum TEI was found to be 13.78 mPts/N at H2-fueld aircraft, 0.7 Mach, and 9000 m.
Figure 4. Variation of Mach number and Altitude with (a) Specific Fuel Consumption Impact of EQ; (b) Specific Fuel Consumption Impact of HH; (c) Specific Fuel Consumption Impact of R.
Atmosphere 05 00307 g004
Figure 5. Variation of Mach number and Altitude with total Specific Fuel Consumption Impact.
Atmosphere 05 00307 g005
Figure 6. Variation of Mach number and Altitude with Thrust Environmental Impact (TEI).
Atmosphere 05 00307 g006

4. Conclusions

Change of the cruise altitude and Mach number directly affect damage and total impact parameters. For all damage categories, the maximum damage on human health, ecosystem quality, and resources was found in the Jet-A-fueled aircrafts. In addition to damages, Jet-A-fueled aircrafts only had maximum SFCI values in ecosystem quality and human health, as opposed to the H2-fueled aircrafts, which had maximum SFCI values in the resources category. The maximum number of SFCI resources was obtained in H2-fueled aircrafts because of more action in the duration of production, transportation, and storage. Jet-A-fueled aircrafts had a higher Thrust Environmental Impact (TEI) than the H2-fueled aircrafts. TEI increases with altitude and a decreasing Mach number. High altitude and low Mach number should be chosen for the best environmental (low specific fuel consumption and thrust impacts) flight situation. Before selection of fuel type, parameters (selection in ecosystem quality, human health, and resources), which are so important for the user, must be selected. TEI, SFCI, and Damages should be used in jet engine design and flight planning as sustainable parameter. Some enforcement should be applied by aviation authorities to the airline companies for improving sustainable aviation.

Acknowledgments

This study was supported by Anadolu University Scientific Research Projects Commission.

Conflicts of Interest

The author declares no conflict of interest.

References

  1. Balli, O.; Aras, H.; Aras, N.; Hepbasli, A. Exergetic and exergoeconomic analysis of an Aircraft Jet Engine (AJE). Int. J. Exergy 2008, 5, 567–581. [Google Scholar] [CrossRef]
  2. Mattingly, J.D. Aircraft Gas Turbine Engine. In Elements of Gas Turbine Propulsion; McGraw-Hill: Singapore, 1996; pp. 1–96. [Google Scholar]
  3. Torenbeek, E. Synthesis of Subsonic Airplane Design: An Introduction to the Preliminary Design of Subsonic General Aviation and Transport Aircraft, with Emphasis on Layout, Aerodynamic Design, Propulsion and Performance; Springer: Dordrech, The Netherlands, 1982. [Google Scholar]
  4. Köhler, I.; Sausen, R.; Reinberger, R. Contributions of aircraft emissions to the atmospheric NOx content. Atmos. Environ. 1997, 31, 1801–1818. [Google Scholar] [CrossRef]
  5. Schumann, U. The impact of nitrogen oxides emissions from aircraft upon the atmosphere at flight altitudes-results from the aeronox project. Atmos. Environ. 1997, 31, 1723–1733. [Google Scholar] [CrossRef]
  6. Stevenson, D.S.; Collins, W.J.; Johnson, C.E.; Derwent, R.G. The impact of aircraft nitrogen oxide emissions on tropospheric ozone studied with a 3-D Lagrangian model including fully diurnal chemistry. Atmos. Environ. 1997, 31, 1837–1850. [Google Scholar] [CrossRef]
  7. Tsague, L.; Tatietse, T.T.; Ngundam, J.; Tsogo, J. Prediction of emissions in turbojet engines exhausts: relationship between nitrogen oxides emission index (EINOx) and the operational parameters. Aerosp. Sci. Technol. 2007, 11, 459–463. [Google Scholar] [CrossRef]
  8. International Civil Aviation Organization (ICAO). Airport Air Quality Guidance Manual; Report No. Doc 9889; ICAO: Montreal, QC, Canada, 2007; pp. 1–114. [Google Scholar]
  9. Gonzalez, R.K. Annual Report of the Council 2008; Report No. Doc-9916; ICAO: Montreal, QC, Canada, 2009; pp. 1–146. [Google Scholar]
  10. Garrett, P.; Casimiro, E.; Pulquério, M.; Santos, F.D. Statistical approach to estimate the impact of climate change on daily ozone concentrations. Int. J. Glob. Warm. 2012, 4, 273–286. [Google Scholar] [CrossRef]
  11. Hansen, J.; Sato, M.; Kharecha, P.; Beerling, D.; Berner, R.; Masson-Delmotte, V.; Raymo, M.; Royer, D.L.; Zachos, J.C. Target atmospheric CO2: Where should humanity aim? Open Atmos. Sci. J. 2008, 2, 217–231. [Google Scholar] [CrossRef]
  12. Houghton, J.T.; Ding, Y.; Griggs, D.J.; Noguer, M.; van der Linden, P.J.; Dai, X.; Maskell, K.; Johnson, C.A. Climate Change 2001: The Scientific Basis. In Intergovernmental Panel on Climate Change (IPCC); Cambridge University Press: Cambridge, UK, 2001; pp. 1–94. [Google Scholar]
  13. Solomon, S.; Qin, D.; Manning, M.; Chen, Z.; Marquis, M.; Averyt, K.B.; Tignor, M.; Miller, H.L. Climate Change 2007: The Physical Science Basis, Contribution of Working Group I to the Fourth Assessment Report of the Intergovernmental Panel on Climate Change. In Intergovernmental Panel on Climate Change (IPCC); Cambridge University Press: Cambridge, UK/New York, NY, USA, 2007; pp. 1–1007. [Google Scholar]
  14. Lynas, M. 6 Derece: Isınan. Dünyadaki. Geleceğimiz. (Turkish of “Six Degrees: Our Future on a Hotter Planet”); NTV publications: Istanbul, Turkey, 2008. [Google Scholar]
  15. Tarrason, L.; Eiof Jonson, J.; Berntsen, T.K.; Rypdal, K. Study on Air Quality Impacts of Non-LTO Emissions from Aviation; Report to the European Commission under contract B4–3040/2002/343093/MAR/C1. 2004. Available online: http://www.europa.nl/environment/air/pdf/air_quality_impacts_finalreport.pdf (accessed on 25 September 2013).
  16. Whitt, D.B.; Jacobson, M.Z.; Wilkerson, J.T.; Naiman, A.D.; Lele, S.K. Vertical mixing of commercial aviation emissions from cruise altitude to the surface. J. Geophys. Res. 2011, 116. [Google Scholar] [CrossRef]
  17. Beck, J.P.; Reeves, C.E.; de Leeuw, F.; Penkett, S.A. The effect of aircraft emissions on tropospheric ozone in the northern Hemisphire. Atmos. Environ. 1992, 26, 17–29. [Google Scholar]
  18. Mazaheri, M.; Johnson, G.R.; Morawska, L. An inventory of particle and gaseous emissions from large aircraft thrust engine operations at an airport. Atmos. Environ. 2011, 45, 3500–3507. [Google Scholar] [CrossRef]
  19. Farias, F.; ApSimon, H. Relative contributions from traffic and aircraft NOx emissions to exposure in west London. Environ. Model. Softw. 2006, 21, 477–485. [Google Scholar] [CrossRef]
  20. Cleveland, C.J. Encyclopedia of Energy; Elsevier Academic Press: Waltham, MA, USA, 2004. [Google Scholar]
  21. Altuntas, O. Calculation of domestic flight-caused global warming potential from aircraft emissions in Turkish airports. Int. J. Glob. Warm. 2014, in press. [Google Scholar]
  22. Kurniawan, J.S.; Khardi, S. Comparison of methodologies estimating emissions of aircraft pollutants, environmental impact assessment around airports. Environ. Impact Assess. Rev. 2011, 31, 240–252. [Google Scholar] [CrossRef]
  23. Mahashabde, A.; Wolfe, P.; Ashok, A.; Dorbian, C.; He, Q.; Fan, A.; Lukachko, S.; Mozdzanowska, A.; Wollersheim, C.; Barrett, S.R.H.; et al. Assessing the environmental impacts of aircraft noise and emissions. Prog. Aeros. Sci. 2011, 47, 15–52. [Google Scholar] [CrossRef]
  24. Zhu, Y.; Fanning, E.; Yu, R.C.; Zhang, Q.; Froines, J.R. Aircraft emissions and local air quality impacts from takeoff activities at a large International Airport. Atmos. Environ. 2011, 45, 6526–6533. [Google Scholar] [CrossRef]
  25. Carr, E.; Lee, M.; Marin, K.; Holder, C.; Hoyer, M.; Pedde, M.; Cook, R.; Toumac, J. Development and evaluation of an air quality modeling approach to assess near-field impacts of lead emissions from piston-engine aircraft operating on leaded aviation gasoline. Atmos. Environ. 2011, 45, 5795–5804. [Google Scholar] [CrossRef]
  26. Schürmann, G.; Schäfer, K.; Jahn, C.; Hoffmann, H.; Bauerfeind, M.; Fleuti, E.; Rappenglück, B. The impact of NOx, CO and VOC emissions on the air quality of Zurich airport. Atmos. Environ. 2007, 41, 103–118. [Google Scholar] [CrossRef]
  27. Unal, A.; Hu, Y.; Chang, M.E.; Odman, M.T.; Russell, A.G. Airport related emissions and impacts on air quality: Application to the Atlanta international airport. Atmos. Environ. 2005, 39, 5787–5798. [Google Scholar] [CrossRef]
  28. Ratliff, G.; Sequeira, C.; Waitz, I.; Ohsfeldt, M.; Thrasher, T.; Graham, M.; Thompson, T. Aircraft Impacts on Local and Regional Air Quality in The United States; Final Report of PARTNER Project 15, Report No. PARTNER-COE-2009–002; Massachusetts Institute of Technology: Cambridge, MA, USA, 2009. [Google Scholar]
  29. Celikel, A.; Duchene, N.; Fuller, I.; Fleuti, E.; Hofmann, P. Airport local air quality modelling: Zurich airport emissions inventory using three methodologies. 2005. Available online: http://www.eurocontrol.int/eec/public/standard_page/DOC_Conf_2005_007.html (accessed on 23 May 2013).
  30. Yim, S.H.L.; Stettler, M.E.J.; Barrett, S.R.H. Air quality and public health impacts of UK airports. Part II: Impacts and policy assessment. Atmos. Environ. 2013, 67, 184–192. [Google Scholar] [CrossRef]
  31. Stettler, M.E.J.; Eastham, S.; Barrett, S.R.H. Air quality and public health impacts of UK airports. Part I: Emissions. Atmos. Environ. 2011, 45, 5415–5424. [Google Scholar] [CrossRef]
  32. Lee, H.I. The Air Quality and Health Impacts of Aviation in Asia. Ph.D. Thesis, Massachusetts Institute of Technology, Cambridge, MA, USA, 2012. [Google Scholar]
  33. Garnier, F.; Baudoin, C.; Woods, P.; Louisnard, N. Engine emission alteration in the near field of an aircraft. Atmos. Environ. 1997, 31, 1767–1781. [Google Scholar] [CrossRef]
  34. Herndon, S.C.; Onasch, T.B.; Frank, B.P.; Marr, L.C.; Jayne, J.T.; Canagaratna, M.R.; Grygas, J.; Lanni, T.; Anderson, B.E.; Worsnop, D.; et al. Particulate emissions from in-use commercial aircraft. Aerosol Sci. Technol. 2005, 39, 799–809. [Google Scholar] [CrossRef]
  35. Yu, K.N.; Cheung, Y.P.; Cheung, T.; Henry, R.C. Identifying the impact of large urban airports on local air quality by nonparametric regression. Atmos. Environ. 2004, 38, 4501–4507. [Google Scholar] [CrossRef]
  36. Leibensperger, E.M.; Mickley, L.J.; Jacob, D.J.; Barrett, S.R.H. Intercontinental influence of NOx and CO emissions on particulate matter air quality. Atmos. Environ. 2011, 45, 3318–3324. [Google Scholar] [CrossRef]
  37. Heathrow Air Quality Strategy, 2011–2020. Available online: http://www.heathrowairport.com/static/Heathrow/Downloads/PDF/air-quality-strategy_LHR.pdf (accessed on 08 March 2013).
  38. Vedantham, A.; Oppenheimer, M. Long-term scenarios for aviation: Demand and emissions of CO2 and NOx. Energy Policy 1998, 26, 625–641. [Google Scholar] [CrossRef]
  39. Geelen, L.M.J.; Hujibregts, M.A.J.; Hollander, H.D.; Ragas, A.M.J.; Jaarsveld, H.A.V.; Zwart, D.D. Confronting environmental pressure, environmental quality and human health impact indicators of priority air emissions. Atmos. Environ. 2009, 43, 1613–1621. [Google Scholar] [CrossRef]
  40. Lee, D.S.; Fahey, D.W.; Forster, P.M.; Newton, P.J.; Wit, R.C.N.; Lim, L.L.; Owen, B.; Sausen, R. Aviation and global climate change in the 21st century. Atmos. Environ. 2009, 43, 3520–3537. [Google Scholar]
  41. Lee, D.S.; Pitari, G.; Grewe, V.; Gierens, K.; Penner, J.E.; Petzold, A.; Prather, M.J.; Schumann, U.; Bais, A.; Berntsen, T.; et al. Transport impacts on atmosphere and climate: Aviation. Atmos. Environ. 2010, 44, 4678–4734. [Google Scholar]
  42. Dorbian, C.S.; Wolfe, P.J.; Waitz, I.A. Estimating the climate and air quality benefits of aviation fuel and emissions reductions. Atmos. Environ. 2011, 45, 2750–2759. [Google Scholar] [CrossRef]
  43. Koo, J.; Wang, Q.; Henze, D.K.; Waitz, I.A.; Barrett, S.R.H. Spatial sensitivities of human health risk to intercontinental and high-altitude pollution. Atmos. Environ. 2013, 71, 140–147. [Google Scholar] [CrossRef]
  44. Zachary, D.S.; Gervais, J.; Leopold, U. Multi-impact optimization to reduce aviation noise and emissions. Transp. Res. D 2010, 15, 82–93. [Google Scholar] [CrossRef]
  45. Pham, V.V.; Tang, J.; Alam, S.; Lokan, C.; Abbass, H.A. Aviation emission inventory development and analysis. Environ. Model. Softw. 2010, 25, 1738–1753. [Google Scholar] [CrossRef]
  46. Wulff, A.; Hourmouziadis, J. Technology review of aeroengine pollutant emissions. Aerosp. Sci. Technol. 1997, 1, 557–572. [Google Scholar] [CrossRef]
  47. Kaygusuz, K. Energy policy and climate change in Turkey. Energy Conversat. Manag. 2003, 44, 1671–1688. [Google Scholar] [CrossRef]
  48. Lee, S.H.; le Dilosquer, M.; Singh, R.; Rycroft, M.J. Further considerations of engine emissions from subsonic aircraft at cruise altitude. Atmos. Environ. 1996, 30, 3689–3695. [Google Scholar] [CrossRef]
  49. Kesgin, U. Aircraft emissions at Turkish airports. Energy 2006, 31, 372–384. [Google Scholar] [CrossRef]
  50. Altuntas, O.; Karakoc, T.H. Investigation of the environmental concern in aircraft selection for domestic flights in some Turkish airports (In Turkish). J. Aeronaut. Space Technol. 2010, 5, 11–18. [Google Scholar]
  51. Kinsey, J.S.; Yong, D.; Williams, D.C.; Logan, R. Physical characterization of the fine particle emissions from commercial aircraft engines during the aircraft particle emissions experiment. Atmos. Environ. 2010, 44, 2147–2156. [Google Scholar] [CrossRef]
  52. Nikoleris, T.; Guptab, G.; Kistler, M. Detailed estimation of fuel consumption and emissions during aircraft taxi operations at Dallas/Fort worth international airport. Transp. Res. D 2011, 16, 302–308. [Google Scholar]
  53. Fan, W.; Sun, Y.; Zhu, T.; Wen, Y. Emissions of HC, CO, NOx, CO2 and SO2 from civil aviation in China in 2010. Atmos. Environ. 2012, 56, 52–57. [Google Scholar] [CrossRef]
  54. Ahmadi, P.; Dincer, I. Thermodynamic and exergoenvironmental analyses, and multi-objective optimization of a gas turbine power plant. Appl. Thermal Eng. 2011, 31, 29–40. [Google Scholar]
  55. Altuntas, O.; Karakoc, T.H.; Hepbasli, A. Exergoenvironmental analysis of pistonprop aircrafts. Exergy. Int. J. 2012, 10, 290–298. [Google Scholar]
  56. Atilgan, R.; Turan, O.; Altuntaş, O.; Aydın, H.; Synylo, K. Environmental impact assessment of a turboprop engine with the aid of exergy. Energy 2013, 58, 664–671. [Google Scholar] [CrossRef]
  57. Ahmadi, P.; Dincer, I. Exergoenvironmental analysis and optimization of a cogeneration plant system using Multimodal Genetic Algorithm (MGA). Energy 2010, 35, 5161–5172. [Google Scholar]
  58. Vlek, S.M.; Vogels, M. AERO—Aviation emissions and evaluation of reduction options. Air Space Eur. 2000, 2, 41–44. [Google Scholar] [CrossRef]
  59. Hoch, R.G.; Berthelot, M. Use of the bertin aérotrain for the investigation of flight effects on aircraft engine exhaust noise. J. Sound Vib. 1977, 54, 153–172. [Google Scholar] [CrossRef]
  60. Brewer, G.D. Aviation usage of liquid hydrogen fuel—Prospects and problems. Int. J. Hydrog. Energy 1976, 1, 65–88. [Google Scholar] [CrossRef]
  61. Jarymowycz, T.A.; Mellor, A.M. Effects of alternative fuels on ignition limits of the J85 annular combustor. J. Propuls. Power 1987, 3, 283–288. [Google Scholar] [CrossRef]
  62. General Electric. Available online: http://www.geaviation.com/engines/military/j85/ (accessed on 15 September 2013).
  63. Seitchek, G.D. Aircraft Engine Emissions Estimator; No. afesc/esl-tr-85–14; Air Force Engineering and Services Center Tyndall Afb Fl Engineering and services lab: Virginia, USA, 1985; pp. 1–101. [Google Scholar]
  64. Anderson, B.E.; Branham, H.S.; Hudgins, C.H.; Plant, J.V.; Ballenthin, J.O.; Miller, T.M.; Canagaratna, M. Experiment to Characterize Aircraft Volatile Aerosol and Trace-species Emissions (EXCAVATE); Report (NASA/TM-2005-213783); National Aeronautics and Space Administration: Virginia, VA, USA, 2005; pp. 1–178. [Google Scholar]
  65. German, R.C.; High, M.D.; Robinson, C.E. Measurement of Exhaust Emissions from a 185-GE-5B Engine at Simulated High-Altitude Supersonic Free-Stream Flight Conditions; No. AEDC-TR-73–103; Arnold Engineering Development Center Arnold Afs Tn: Springfield, MA, USA, 1973; pp. 1–140. [Google Scholar]
  66. Roth, B.; Mavris, D. Method for propulsion technology impact evaluation via thermodynamic work potential. J. Aircr. 2003, 40, 56–61. [Google Scholar] [CrossRef]
  67. Roth, B.A. A Theoretical Treatment of Technical Risk in Modern Propulsion System Design. Ph.D. Thesis, Georgia Institute of Technology, Atlanta, GA, USA, 2000. [Google Scholar]
  68. NASA Glenn EngineSim, Version 1.6e (online application); Available online: http://www.grc.nasa.gov/WWW/K-12/airplane/ngnsim.html (accessed on 2 December 2004).
  69. Kurzke, J. Manual GasTurb 12.0 for Windows-A Program to Calculate Design and Off-design Performance of Gas Turbines. Technical Report. 2012. Available online: http://www.gasturb.de/Gtb12Manual/GasTurb12.pdf (accessed on 15 September 2013).
  70. Heywood, J.B. Internal Combustion Engine Fundamentals; McGraw-Hill: New York, NY, USA, 1988. [Google Scholar]
  71. Antoine, N.E. Aircraft Optimization for Minimal Environmental Impact. Ph.D. Thesis, Stanford University, Cardinal, CA, USA, 2004. [Google Scholar]
  72. Faber, J.; Greenwood, D.; Lee, D.; Mann, M.; de Leon, P.M.; Nelissen, D.; van de Vreede, G. Lower NOx at Higher Altitudes Policies to Reduce the Climate Impact of Aviation NOx Emission; Technical Report; CE Delft: Delft, The Netherlands, 2008. [Google Scholar]
  73. Altuntas, O.; Karakoc, T.H.; Hepbasli, A. Investigation of environmental impact caused by aircraft engines. Int. J. Glob. Warm. 2013, 5, 282–295. [Google Scholar] [CrossRef]
  74. Environmental Protection Agency (EPA). Implications of the EU Climate Protection Target for Ireland; EPA: Johnstown Castle, Wexford, Ireland, 2006. Available online: http://www.epa.ie/downloads/pubs/research/climate/erc%20report%205.pdf (accessed on 15 April 2012).
  75. PRé Consultants. SimaPro End User License Agreement (EULA) and Service Level Agreement (SLA). 2006. Available online: www.pre.nl (accessed on 20 May 2014).
  76. Goedkoop, M.; Spriensma, R. The Eco-indicator 99—A Damage Oriented Method for Life Cycle Assessment; Methodology Report; PRé Consultants b.v.: Amersfoort, The Netherlands, 2000. [Google Scholar]
  77. Kantardgi, I.; Purvis, M.R.I.; Cherviakov, L.; Khudoshina, M. Approaches to the modelling of energy utilisation in product life cycles. Clean Techn. Environ. Policy 2006, 8, 77–84. [Google Scholar] [CrossRef]

