Spatio-Temporal Analysis of Droughts in Semi-Arid Regions by Using Meteorological Drought Indices

Abstract
:1. Introduction
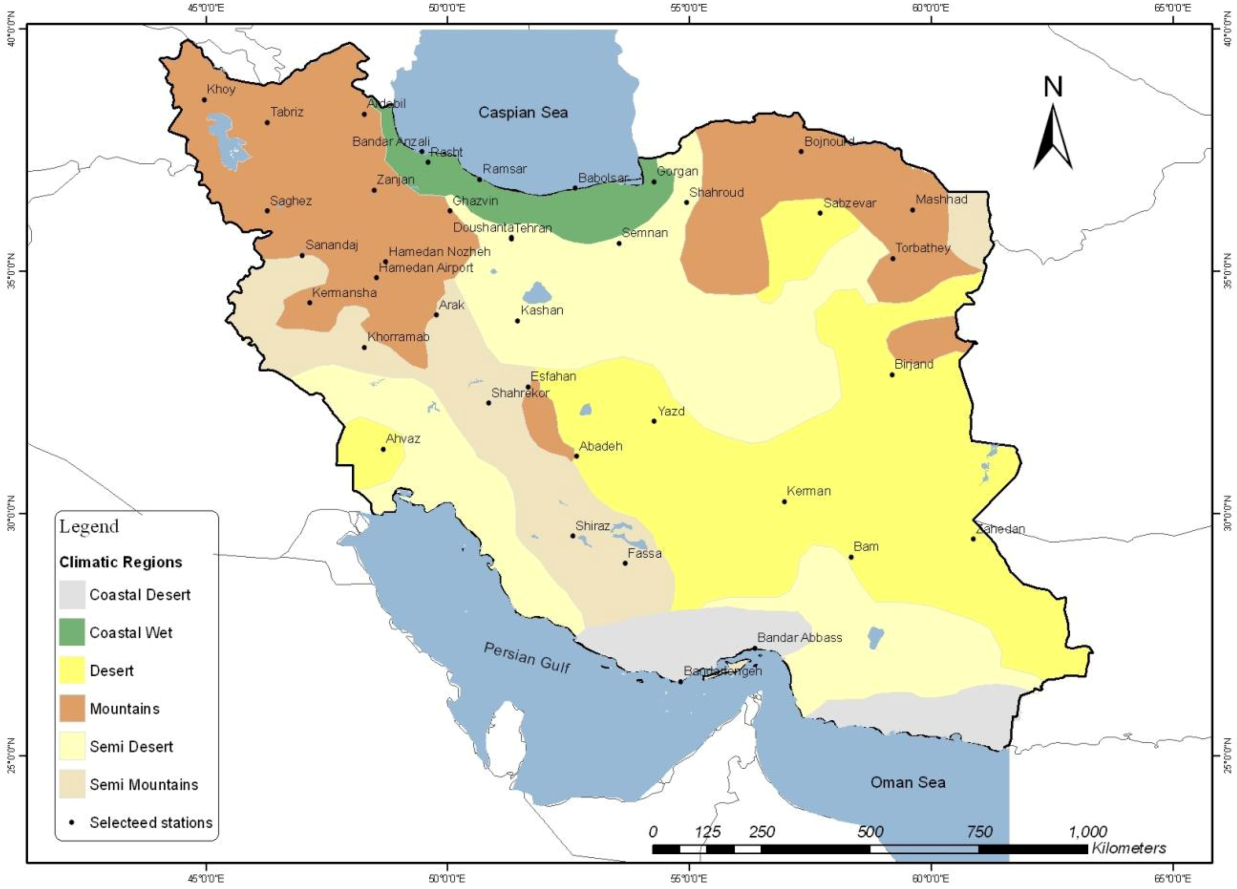
2. Study Area


| Disaster | Killed | Total Affected | Damage US$(000’s) | |
|---|---|---|---|---|
| Drought | Drought | - | 37,625,000 | 3,300,000 |
| Earthquake | Earthquake | 147,100 | 2,579,024 | 10,518,628 |
| Epidemic | Diarrhoeal/Enteric | 372 | 2500 | - |
| Extreme Temperature | Heat wave | 158 | - | - |
| Flood | Unspecified | 1,281 | 1,374,034 | 6,002,028 |
| Flash Flood | 60 | 4453 | 28,000 | |
| Flood | 6,404 | 2,272,567 | 1,622,500 | |
| Slides | Avalanche | 73 | 44 | - |
| Landslide | 43 | 100 | - | |
| Wild Fires | Scrub | - | - | - |
| Wind Storm | Cyclone | 12 | 160,009 | - |
| Storm | 217 | 11,700 | 15,240 | |
| Winter | 91 | 8,085 | 13,300 |

| Name | Latitude (Decimal Degree) | Longitude (Decimal Degree) | Elevation (m) | WMO Code |
|---|---|---|---|---|
| Abadeh | 31.18 | 52.67 | 2,030 | 40818 |
| Ahwaz | 31.33 | 48.67 | 23 | 40811 |
| Arak | 34.10 | 49.77 | 1,708 | 40769 |
| Ardebil | 38.25 | 48.28 | 1,332 | 40708 |
| Babolsar | 36.72 | 52.65 | −21 | 40736 |
| Bam | 29.10 | 58.35 | 1,067 | 40854 |
| Bandar Abass | 27.22 | 56.37 | 10 | 40875 |
| Bandar Anzali | 37.47 | 49.47 | −26 | 40718 |
| Bandar Lengeh | 26.53 | 54.83 | 23 | 40883 |
| Birjand | 32.87 | 59.20 | 1,491 | 40809 |
| Bojnurd | 37.47 | 57.32 | 1,091 | 40723 |
| Doushan Tappeh | 35.70 | 51.33 | 1,209 | 40753 |
| Esfahan | 32.62 | 51.67 | 1,550 | 40800 |
| Fassa | 28.97 | 53.68 | 1,288 | 40859 |
| Ghazvin | 36.25 | 50.05 | 1,279 | 40731 |
| Gorgan | 36.85 | 54.27 | 13 | 40738 |
| Hamedan Noyheh | 35.20 | 48.72 | 1,680 | 40767 |
| Hamedan−Airport | 34.87 | 48.53 | 1,741 | 40768 |
| Kashan | 33.98 | 51.45 | 982 | 40785 |
| Kerman | 30.25 | 56.97 | 1,754 | 40841 |
| Kermanshah | 34.35 | 47.15 | 1,319 | 40766 |
| Khorramabad | 33.43 | 48.28 | 1,148 | 40782 |
| Khoy | 38.55 | 44.97 | 1,103 | 40703 |
| Mashhad | 36.27 | 59.63 | 999 | 40745 |
| Noushahr | 36.65 | 51.50 | −21 | 40734 |
| Ramsar | 36.90 | 50.67 | −20 | 40732 |
| Rasht | 37.25 | 49.60 | −7 | 40719 |
| Sabzevar | 36.20 | 57.72 | 978 | 40743 |
| Saghez | 36.25 | 46.27 | 1,523 | 40727 |
| Sanandaj | 35.33 | 47.00 | 1,373 | 40747 |
| Semnan | 35.58 | 53.55 | 1,131 | 40757 |
| Shahre Kord | 32.28 | 50.85 | 2,049 | 40798 |
| Shahroud | 36.42 | 54.95 | 1,345 | 40739 |
| Shiraz | 29.53 | 52.60 | 1,484 | 40848 |
| Tabriz | 38.08 | 46.28 | 1,361 | 40706 |
| Tehran Mehrabad | 35.68 | 51.32 | 1,191 | 40754 |
| TorbateHeydarieh | 35.27 | 59.22 | 1,451 | 40762 |
| Yazd | 31.90 | 54.28 | 1,237 | 40821 |
| Zahedan | 29.47 | 60.88 | 1,370 | 40856 |
| Zanjan | 36.68 | 48.48 | 1,663 | 40729 |
3. Drought Indices and Methods
3.1. Standardized Precipitation Index (SPI)
3.2. China-Z index (CZI), Modified CZI (MCZI) and Z-Score


3.3. Aridity Index of E. de Martonne (I)

3.4. The Percent of Normal (PN)
 )—typically considered to be a 30-year mean—and multiplying by 100%.
3.5. Data Processing
4. Results and Discussion
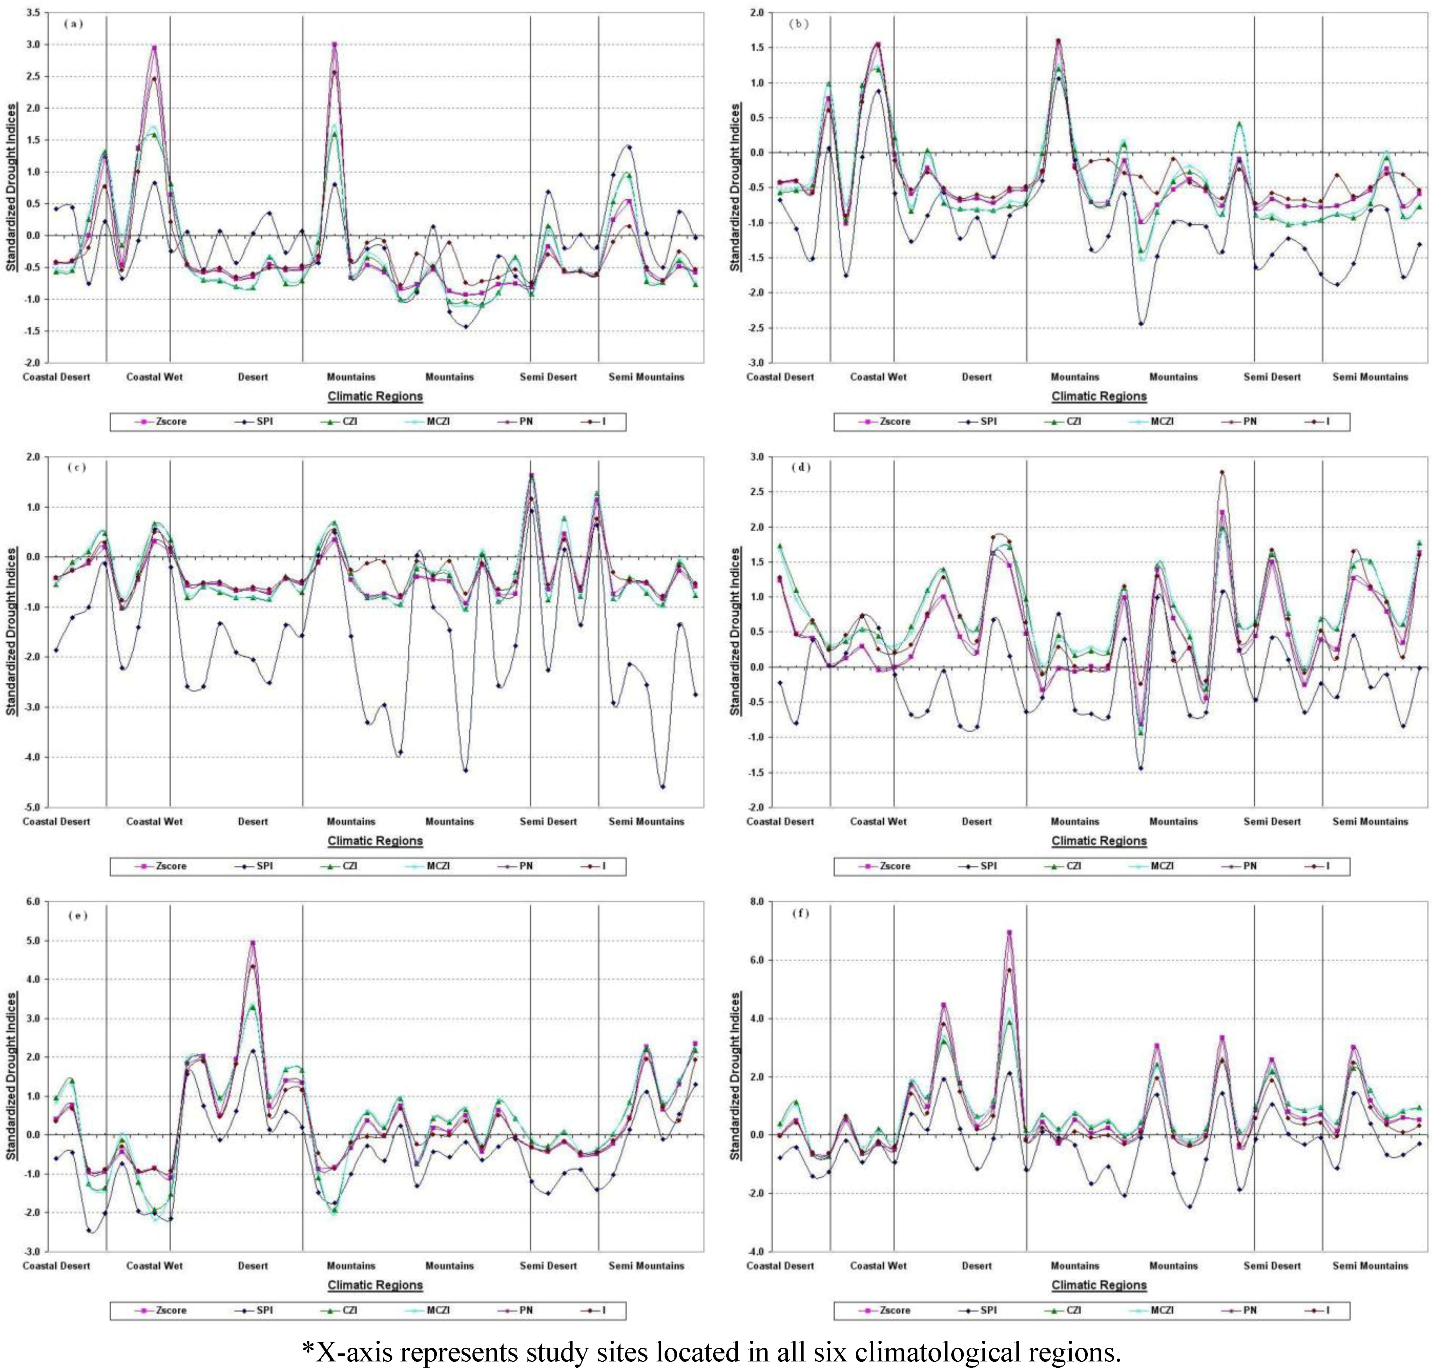
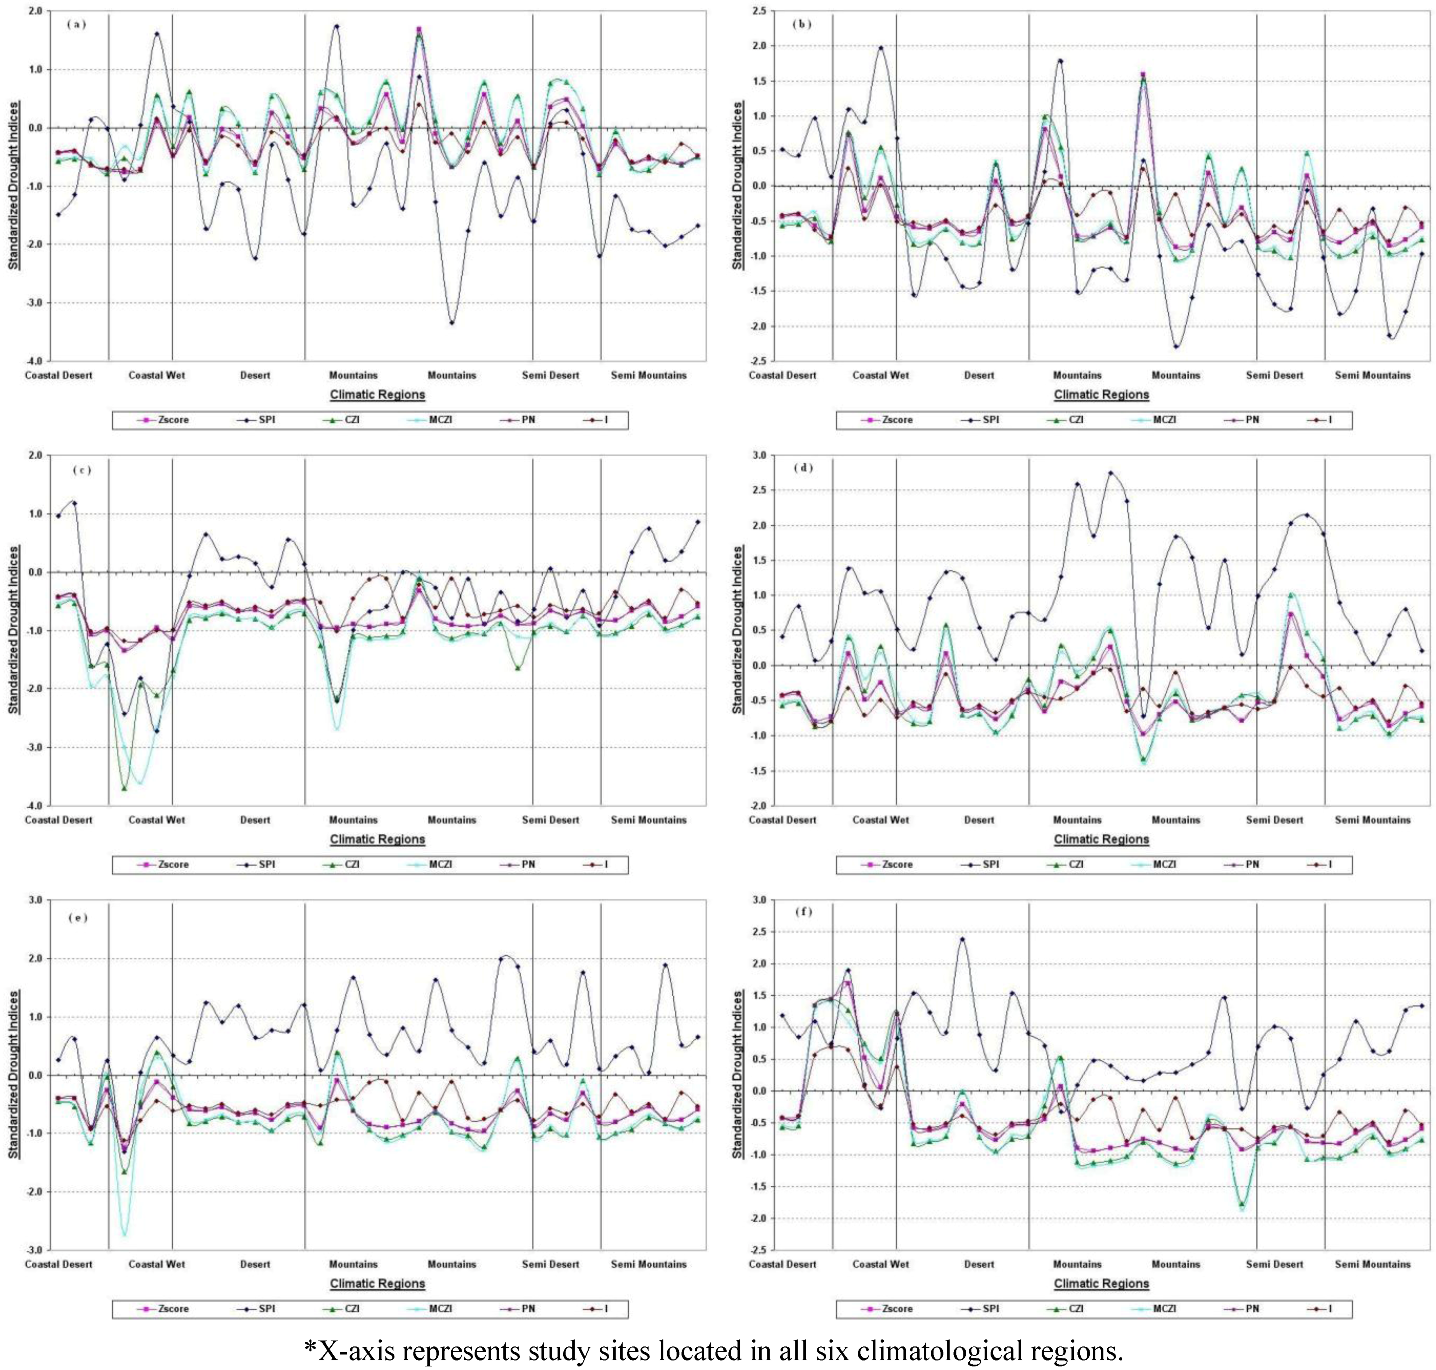
4.1. Temporal Analysis of Drought Indices
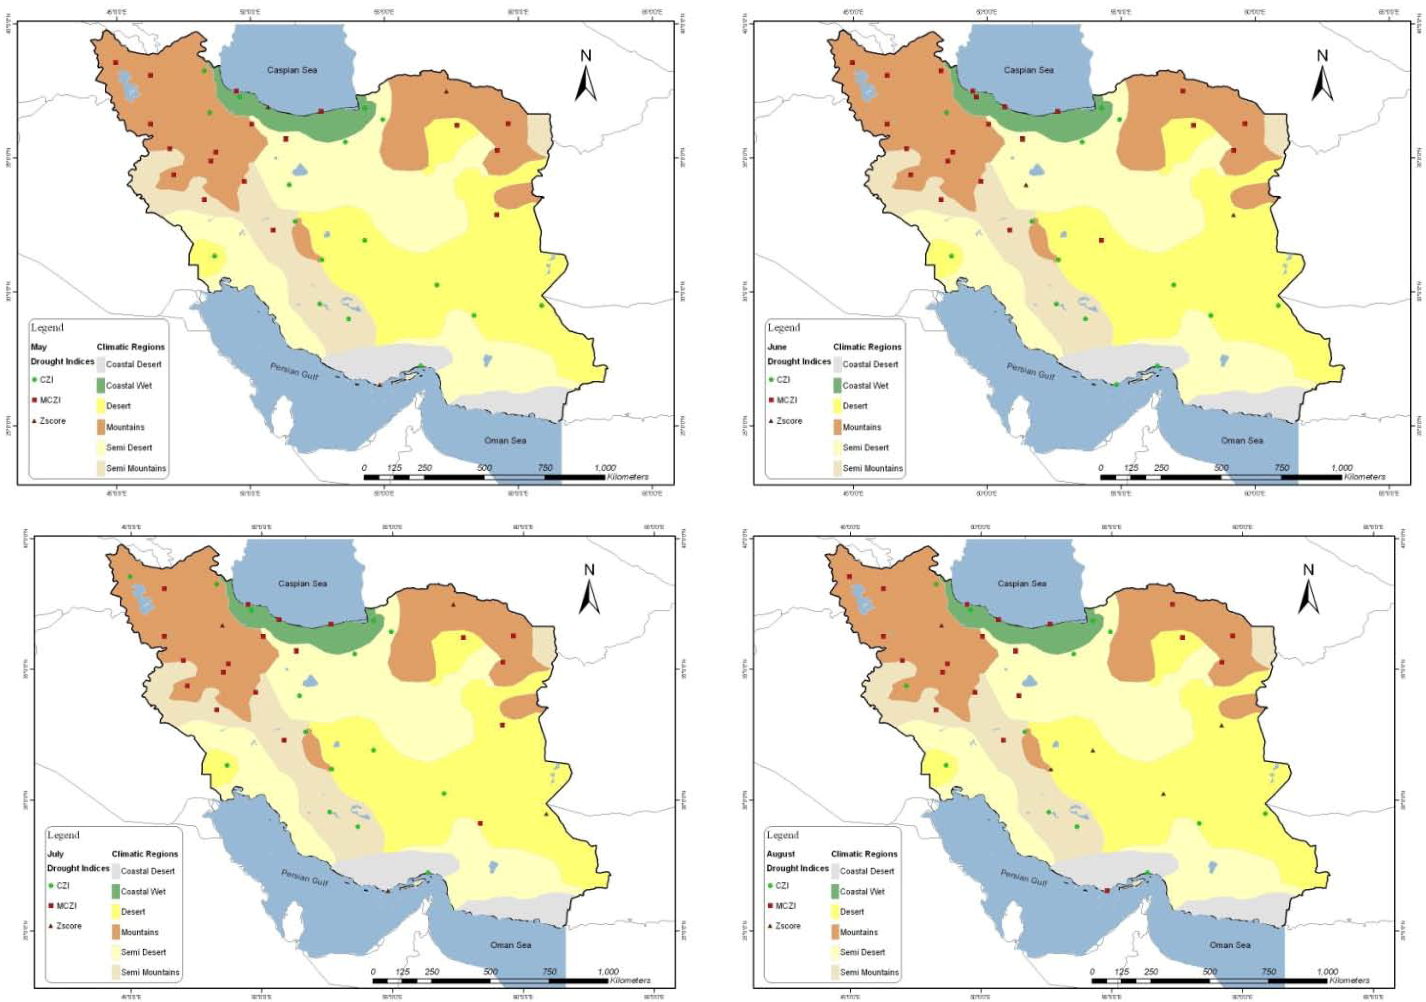
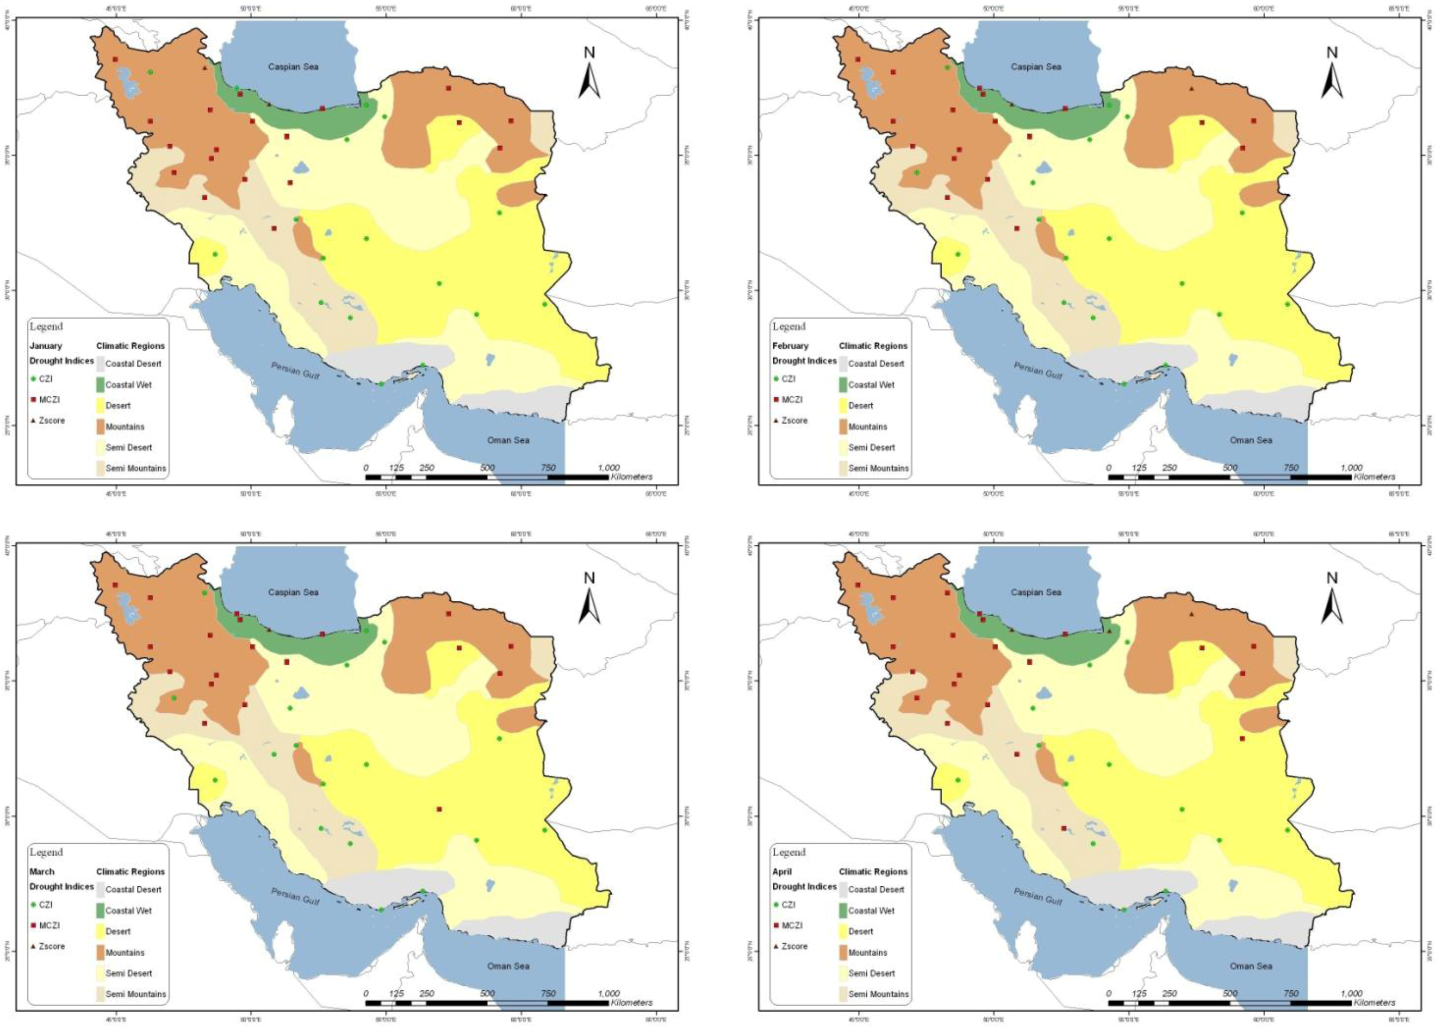
4.1.1. Results of Monthly Analysis
| Climatic Regions | |||||||
|---|---|---|---|---|---|---|---|
| Coastal Desert | Coastal Wet | Desert | Semi Desert | Mountain | Semi Mountain | ||
| Month | January | CZI (3/3) R = 98–99 | MCZI (2/5) R = 100 CZI (2/5) R = 100 Zscore (1/5) R = 97 | CZI (7/8) R = 99–100 MCZI (1/8) R = 99 | MCZI (3/5) R = 99–100 CZI (2/5) R = 98–99 | MCZI (11/13) R = 86–100 CZI (1/13) R = 99 Zscore (1/13) R = 98 | MCZI (3/6) R = 98–99 CZI (3/6) R = 98–99 |
| February | CZI (3/3) R = 99 | MCZI (3/5) R = 99–100 CZI (1/5) R = 99 Zscore·(1/5) R = 95 | CZI (7/8) R = 99–100 MCZI (1/8) R = 99 | CZI (3/5) R = 99–100 MCZI (2/5) R = 97–99 | MCZI (10/13) R = 98–100 CZI (1/13) R = 99 Zscore (1/13) R = 95 | MCZI (3/6) R = 96–99 CZI (3/6) R = 98–100 | |
| March | CZI (3/3) R = 98–99 | MCZI (3/5) R = 94–100 CZI (1/5) R = 100 Zscore (1/5) R = 95 | CZI (6/8) R = 98–100 MCZI (2/8) R = 98–99 | CZI (3/5) R = 99–100 MCZI (2/5) R = 98–99 | MCZI (11/13) R = 95–100 CZI (2/13) R = 95–99 | CZI (4/6) R = 98–100 MCZI (3/6) R = 98–99 | |
| April | CZI (3/3) R = 91–93 | MCZI (3/5) R = 99–100 Zscore (2/5) R = 96–97 | CZI (6/8) R = 97–100 MCZI (2/8) R = 98–99 | CZI (3/5) R = 99–100 MCZI (2/5) R = 98–99 | MCZI (12/13) R = 98–100 Zscore (1/13) R = 96 | MCZI (4/6) R = 98–99 CZI (2/6) R = 99–100 | |
| May | CZI (2/3) R =99–100 Zscore (1/3) R = 96 | MCZI (2/5) R = 99–100 CZI (2/5) R = 98–99 Zscore (1/5) R = 97 | CZI (5/8) R = 99–100 MCZI (3/8) R = 98–99 | CZI (3/5) R = 99–100 MCZI (2/5) R = 98–99 | MCZI (10/13) R = 91–96 CZI (2/13) R = 99–100 Zscore (1/13) R = 98 | MCZI (3/6) R = 94–99 CZI (3/6) R = 97–99 | |
| June | CZI (3/3) R = 99–100 | MCZI (4/5) R = 95–99 CZI (1/5) R = 98 | CZI (5/8) R = 99–100 MCZI (2/8) R = 98–100 Zscore (1/8) R = 99 | CZI (2/5) R = 99–100 MCZI (2/5) R = 98–99 Zscore (1/5) R = 99 | MCZI (12/13) R = 96–100 CZI (1/13) R = 99 | MCZI (3/6) R = 98–100 CZI (3/6) R = 99–100 | |
| July | CZI (2/3) R = 98–100 Zscore (1/3) R = 100 | MCZI (3/5) R = 94–99 CZI (2/5) R = 95–98 | CZI (4/8) R = 99–100 MCZI (3/8) R = 97–100 Zscore ( 1/8) R = 99 | CZI (3/5) R = 99–100 MCZI (2/5) R = 99–100 | MCZI (9/13) R = 98–100 CZI (2/13) R = 98–99 Zscore (2/13) R = 95–97 | MCZI (3/6) R = 96–98 CZI (3/6) R = 98–99 | |
| August | CZI (2/3) R = 98–99 MCZI (1/3) R = 99 | MCZI (3/5) R = 94–99 CZI (2/5) R = 98–99 | Zscore( 4/8) R = 94–100 CZI (3/8) R = 99–100 MCZI (1/8) R = 99 | MCZI (3/5) R = 99–100 CZI (2/5) R = 99–100 | MCZI (10/13) R = 92–100 CZI (2/13) R = 95–100 Zscore (1/13) R = 96 | MCZI (3/6) R = 97–100 CZI (3/6) R = 98–100 | |
| September | CZI (3/3) R = 100 | MCZI (3/5) R = 96–100 CZI (2/5) R = 97–99 | CZI (3/8) R = 98–100 MCZI (3/8) R = 98–100 Zscore ( 2/8) R = 99–100 | CZI (2/5) R = 99–100 MCZI (2/5) R = 98–100 Zscore (1/5) R = 99 | MCZI (7/13) R = 97–100 CZI (5/13) R = 99–100 Zscore (1/13) R = 99 | MCZI (2/6) R = 98–99 CZI (2/6) R = 97–100 Zscore (2/6) R = 98–100 | |
| October | CZI (2/3) R = 98–99 MCZI (1/3) R = 99 | MCZI (3/5) R = 98–99 Zscore (2/5) R = 95–98 | CZI (5/8) R = 99–100 MCZI (3/8) R = 99–100 | CZI (3/5) R = 98–99 MCZI (2/5) R = 98 – 99 | MCZI (12/13) R = 97–100 CZI (1/13) R = 95 | MCZI (3/6) R = 97–99 CZI (3/6) R = 99–100 | |
| November | CZI (3/3) R = 96–97 | MCZI (4/5) R = 99–100 Zscore (1/5) R = 97 | CZI (6/8) R = 98–100 MCZI (2/8) R = 98–99 | CZI (3/5) R = 99–100 MCZI (2/5) R = 97–99 | MCZI (13/13) R = 97–100 | MCZI (3/6) R = 99–100 CZI (3/6) R = 98–99 | |
| December | CZI (3/3) R = 92–94 | MCZI (2/5) R = 100 CZI (2/5) R = 100 Zscore (1/5) R = 97 | CZI (6/8) R = 97–100 MCZI (2/8) R = 99–100 | MCZI (3/5) R = 99–100 MZI (2/5) R = 99–100 | MCZI (13/13) R = 96–100 | MCZI (3/6) R = 97–99 CZI (3/6) R = 96–100 | |

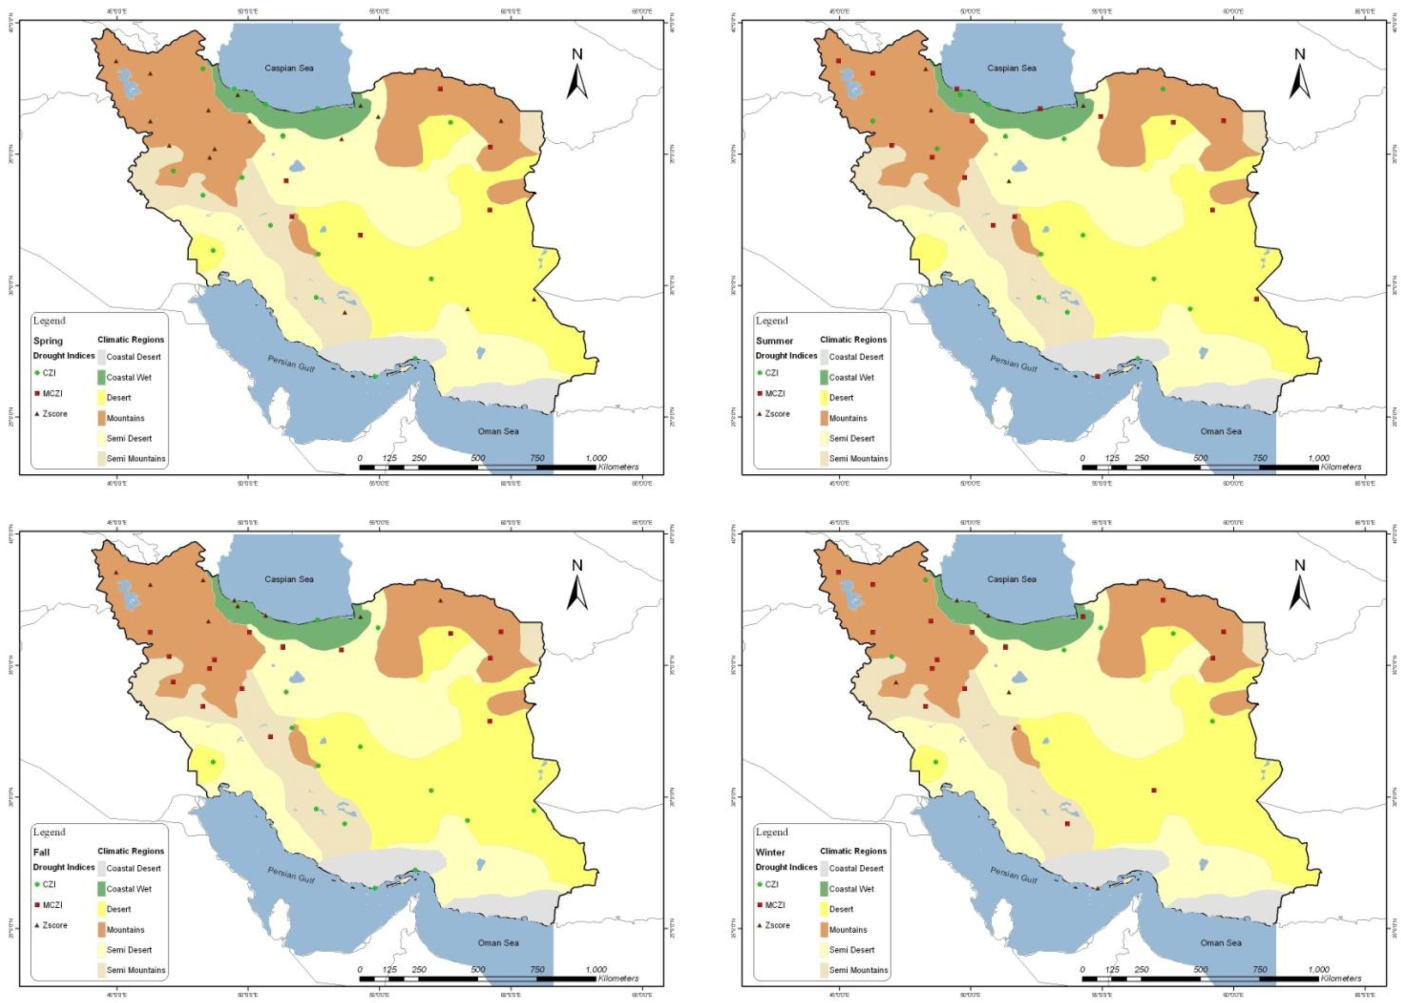
4.1.2. Results of Seasonal Analysis
| Climatic Regions | |||||||
|---|---|---|---|---|---|---|---|
| Coastal Desert | Coastal Wet | Desert | Semi Desert | Mountain | Semi Mountain | ||
| Season | Spring | CZI (3/3) R = 43–53 | CZI (3/5) R = 52–63 Zscore (2/5) R = 64–75 | CZI (4/8) R = 58–78 MCZI (2/8) R = 63–73 Zscore ( 2/8) R = 73–75 | CZI (2/5) R = 77–86 Zscore ( 2/5) R = 77–81 MCZI (1/5) R = 83 | Zscore (9/13) R = 77–82 MCZI (2/13) R = 50–73 CZI (2/13) R = 74–80 | CZI (4/6) R = 57–88 MCZI (1/6) R = 75 Zscore ( 1/5) R = 40 |
| Summer | CZI (2/3) R = 86–98 MCZI (1/3) R = 85 | MCZI (2/5) R = 52–67 CZI (2/5) R = 50–55 Zscore (1/5) R = 56 | CZI (4/8) R =76 – 90 MCZI (3/8) R = 51–76 N/A (1/8) | CZI (2/5) R = 67–77 Zscore (2/5) R = 58–78 MCZI (1/5) R = 52 | MCZI (6/13) R = 45–89 CZI (3/13) R = 43–65 Zscore (2/13) R = 44–52 N/A (2/13) | MCZI (3/6) R = 67–84 CZI (2/6) R = 88–94 N/A 81/6) | |
| Fall | CZI (2/3) R = 77–83 N/A (1/3) | Zscore (4/5) R = 69–87 CZI (1/5) R = 75 | CZI (6/8) R = 67–73 MCZI (2/8) R = 68–75 | MCZI (3/5) R = 75–83 CZI (2/5) R = 70–83 | MCZI (8/13) R = 63–84 Zscore (5/13) R = 75–86 | MCZI (3/6) R = 79–82 CZI (3/6) R = 62–84 | |
| Winter | Zscore (2/3) R = 63–83 N/A (1/3) | MCZI (1/5) R = 84 Zscore (2/5) R = 54 – 64 N/A ( 2/5) | CZI (3/8) R = 62–78 MCZI (1/8) R = 59 Zscore( 1/8) R = 84 N/A (3/8) | CZI (2/5) R = 62–68 MCZI (2/5) R = 64–68 Zscore ( 1/5) R = 72 | MCZI (10/13) R = 61- 78 CZI (2/13) R = 75–83 Zscore (1/13) R = 60 | MCZI (3/6) R = 53–71 Zscore (2/6) R = 65–67 N/A (1/6) | |
| Annual | Annual | MCZI (3/3) R = 91–96 | Zscore (5/5) R = 97–100 | Zscore (8/8) R = 97–99 | Zscore ( 5/5) R = 97–100 | Zscore (13/13) R = 95–100 | Zscore (2/6) R = 97–99 |

4.1.3. Results of Annual Analysis

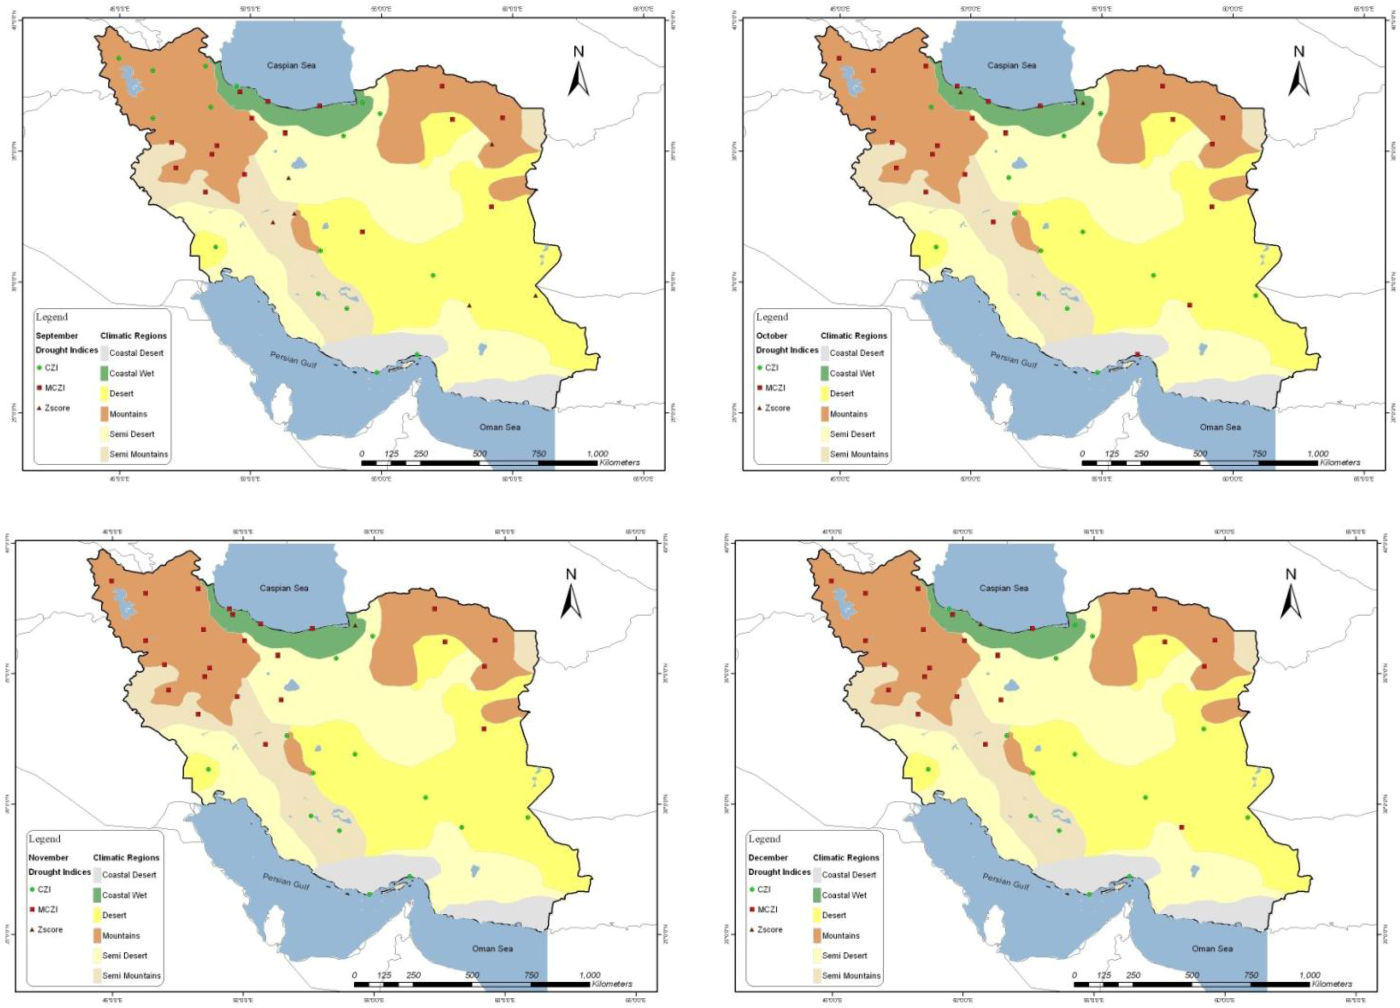
4.2. Spatial Analysis of Droughts Indices
5. Conclusions
5.1. Conclusions for Operational Applications
5.2. Conclusions for Research Applications
Acknowledgements
References
- Wilhite, D.A.; Glantz, M.H. Understanding the drought phenomenon: The role of definitions. Water Int. 1985, 10, 111–120. [Google Scholar] [CrossRef]
- Livada, I.; Assimakopoulos, V.D. Spatial and temporal analysis of drought in Greece using the Standardized Precipitation Index (SPI). Theor. Appl. Climatol. 2007, 89, 143–153. [Google Scholar] [CrossRef]
- Palmer, W.C. Meteorological Drought; Research Paper No. 45; US Department of Commerce Weather Bureau: Washington, DC, USA, 1965.
- Gibbs, W.J.; Maher, J.V. Rainfall Deciles as Drought Indicators; Bureau of Meteorology bulletin No. 48; Commonwealth of Australia: Melbourne, VIC, Australia, 1967.
- Wu, H.; Hayes, M.J.; Welss, A.; Hu, Q. An evaluation the standardized precipitation index, the China-z index and the statistical Z-Score. Int. J. Climatol. 2001, 21, 745–758. [Google Scholar] [CrossRef]
- Mckee, T.B.; Doesken, N.J.; Kleist, J. The relationship of drought frequency and duration to time scales. In Proceeding of the 8th American Meteorological Society (AMS) Conference on Applied Climatology, Anaheim, CA, USA, 17–22 January 1993; pp. 179–184.
- Edwards, D.C.; Mckee, T.B. Characteristics of 20th Century Drought in the United States at Multiple Time Scales; Climatology Report 97-2. Department of Atmospheric Science-Colorado State University: Fort Collins, CO, USA, 1997. [Google Scholar]
- Hayes, M.J.; Svoboda, M.D.; Wilhite, D.A.; Vanyarkho, O.V. Monitoring the 1996 drought using the standardized precipitation index. Bull. Amer. Meteor. Soc. 1999, 80, 429–438. [Google Scholar]
- Alley, W.M. The Palmer Drought Severity Index: limitations and assumptions. J. Clim. Appl. Meteorol. 1984, 23, 1100–1109. [Google Scholar] [CrossRef]
- Guttmann, N.B. Comparing the palmer drought index and the standardized precipitation index. J. Am. Water Resour. Assoc. 1998, 34, 113–121. [Google Scholar] [CrossRef]
- Morid, S.; Smakhtinb, V.; Moghaddasi, M. Comparison of seven meteorological indices for drought monitoring in Iran. Int. J. Climatol. 2006, 26, 1149–1165. [Google Scholar] [CrossRef]
- Alijani, B.; Ghohroudi, M.N.; Arabi, N. Developing a climate model for Iran using GIS. Theor. Appl. Climatol. 2008, 92, 103–112. [Google Scholar] [CrossRef]
- Iran Meteorological Organization (IRIMO), The Climatological Normal of Synoptic Stations in Iran; IRIMO: Tehran, Iran, 2005.
- Dai, A. Drought under global warming: A review. WIRES Clim. Change 2011, 2, 45–65. [Google Scholar] [CrossRef]
- OFDA/CRED. International Disaster Database; Université Catholique de Louvain: Brussels, Belgium, 2013. Available online: http://www.emdat.be (accessed on 5 February 2013).
- Raziei, T.; Saghafian, B.; Paulo, A.A.; Pereira, L.S.; Bordi, I. Spatial patterns and temporal variability of drought in western Iran. Water Resour. Manag. 2009, 23, 439–455. [Google Scholar] [CrossRef]
- Rahimzadeh, B.P.; Darvishsefatb, A.A.; Khalili, A.; Makhdoum, M.F. Using AVHRR-based vegetation indices for drought monitoring in the Northwest of Iran. J. Arid. Environ. 2009, 72, 1086–1096. [Google Scholar]
- Tabari, H.; Abghani, H.; Talaee, P.H. Temporal trends and spatial characteristics of drought and rainfall in arid and semi-arid regions of Iran. Hydrol. Process. 2012, 26, 3351–3361. [Google Scholar] [CrossRef]
- Rezaeian-Zadeh, M.; Tabari, H. MLP-based drought forecasting in different climatic regions. Theor. Appl. Climatol. 2012, 109, 407–414. [Google Scholar] [CrossRef]
- Capra, A.; Consoli, S.; Scicolone, B. Long-term climatic variability in Calabria and effects on drought and agrometeorological parameters. Water Resour. Manage. 2013, 27, 601–617. [Google Scholar] [CrossRef]
- Kendall, M.G.; Stuart, A. The Advanced Theory of Statistics; Charles Griffin & Company-High Wycombe: London, UK, 1997; pp. 400–401. [Google Scholar]
- World Meteorological Organization (WMO), Drought and Agriculture; WMO Note 138 Pub. WMO-392; Geneva, Switzerland, 1975; p. 127.
- Nastos, P.T.; Politi, N.; Kapsomenakis, J. Spatial and temporal variability of the aridity index in Greece. Atmos. Res. 2013, 119, 140–152. [Google Scholar] [CrossRef]
- Shahabfar, A.; Ghulam, A.; Eitzinger, J. Drought monitoring in Iran using the perpendicular drought indices. Int. J. Appl. Earth Obs. 2012, 18, 119–127. [Google Scholar] [CrossRef]
- Shahabfar, A.; Eitzinger, J. Agricultural drought monitoring in semi-arid and arid areas using MODIS data. J. Agr. Sci. 2011, 149, 403–414. [Google Scholar] [CrossRef]
- Shahabfar, A.; Reinwand, M.; Conrad, C. A re-examination of perpendicular drought indices over Central and Southwest Asia. Proc. SPIE 2012, 8531, 24–27. [Google Scholar]
- Ziaei, A.N.; Sepaskhah, A.R. Model for simulation of winter wheat yield under dryland and irrigated conditions. Agr. Water Manage. 2003, 58, 1–17. [Google Scholar] [CrossRef]
© 2013 by the authors; licensee MDPI, Basel, Switzerland. This article is an open access article distributed under the terms and conditions of the Creative Commons Attribution license (http://creativecommons.org/licenses/by/3.0/).
Share and Cite
Shahabfar, A.; Eitzinger, J. Spatio-Temporal Analysis of Droughts in Semi-Arid Regions by Using Meteorological Drought Indices. Atmosphere 2013, 4, 94-112. https://doi.org/10.3390/atmos4020094
Shahabfar A, Eitzinger J. Spatio-Temporal Analysis of Droughts in Semi-Arid Regions by Using Meteorological Drought Indices. Atmosphere. 2013; 4(2):94-112. https://doi.org/10.3390/atmos4020094
Chicago/Turabian StyleShahabfar, Alireza, and Josef Eitzinger. 2013. "Spatio-Temporal Analysis of Droughts in Semi-Arid Regions by Using Meteorological Drought Indices" Atmosphere 4, no. 2: 94-112. https://doi.org/10.3390/atmos4020094
APA StyleShahabfar, A., & Eitzinger, J. (2013). Spatio-Temporal Analysis of Droughts in Semi-Arid Regions by Using Meteorological Drought Indices. Atmosphere, 4(2), 94-112. https://doi.org/10.3390/atmos4020094