<?xml version="1.0" encoding="UTF-8"?>
<!DOCTYPE article PUBLIC "-//NLM//DTD Journal Publishing DTD v2.3 20070202//EN" "journalpublishing.dtd">
<article xmlns:mml="http://www.w3.org/1998/Math/MathML" xmlns:xlink="http://www.w3.org/1999/xlink" xml:lang="en" article-type="research-article">
  <front>
    <journal-meta>
      <journal-id journal-id-type="publisher-id">atmosphere</journal-id>
      <journal-title>Atmosphere</journal-title>
      <abbrev-journal-title abbrev-type="publisher">Atmosphere</abbrev-journal-title>
      <abbrev-journal-title abbrev-type="pubmed">Atmosphere</abbrev-journal-title>
      <issn pub-type="epub">2073-4433</issn>
      <publisher>
        <publisher-name>MDPI</publisher-name>
      </publisher>
    </journal-meta>
    <article-meta>
      <article-id pub-id-type="doi">10.3390/atmos3040573</article-id>
      <article-id pub-id-type="publisher-id">atmosphere-03-00573</article-id>
      <article-categories>
        <subj-group>
          <subject>Article</subject>
        </subj-group>
      </article-categories>
      <title-group>
        <article-title>Continuous Cropping and Moist Deep Convection on the Canadian Prairies</article-title>
      </title-group>
      <contrib-group>
        <contrib contrib-type="author">
          <name>
            <surname>Shrestha</surname>
            <given-names>Bharat M.</given-names>
          </name>
          <xref rid="af1-atmosphere-03-00573" ref-type="aff">1</xref>
        </contrib>
        <contrib contrib-type="author">
          <name>
            <surname>Raddatz</surname>
            <given-names>Richard L.</given-names>
          </name>
          <xref rid="af2-atmosphere-03-00573" ref-type="aff">2</xref>
        </contrib>
        <contrib contrib-type="author">
          <name>
            <surname>Desjardins</surname>
            <given-names>Raymond L.</given-names>
          </name>
          <xref rid="af1-atmosphere-03-00573" ref-type="aff">1</xref>
          <xref rid="c1-atmosphere-03-00573" ref-type="corresp">*</xref>
        </contrib>
        <contrib contrib-type="author">
          <name>
            <surname>Worth</surname>
            <given-names>Devon E.</given-names>
          </name>
          <xref rid="af1-atmosphere-03-00573" ref-type="aff">1</xref>
        </contrib>
      </contrib-group>
      <aff id="af1-atmosphere-03-00573"><label>1 </label>Eastern Cereal and Oilseed Research Center, Agriculture and Agri-Food Canada, 960 Carling Avenue, K. W. Neatby Building, Ottawa, ON K1A 0C6, Canada; E-Mails: <email>bharat.shrestha@agr.gc.ca</email> (B.M.S.); <email>devon.worth@agr.gc.ca</email> (D.E.W.) </aff>
      <aff id="af2-atmosphere-03-00573"><label>2 </label>Centre for Earth Observation Science, University of Manitoba, Winnipeg, MB R3T 2N2, Canada; E-Mail: <email>rick.raddatz@shaw.ca</email> </aff>
      <author-notes>
        <corresp id="c1-atmosphere-03-00573"><label>*</label> Author to whom corresponding should be addressed; E-Mail: <email>ray.desjardins@agr.gc.ca</email>; Tel: +1-613-759-1522; Fax: +1-613-759-1432. </corresp>
      </author-notes>
      <pub-date pub-type="epub">
        <day>12</day>
        <month>12</month>
        <year>2012</year>
      </pub-date>
      <pub-date pub-type="collection">
        <month>12</month>
        <year>2012</year>
      </pub-date>
      <volume>3</volume>
      <issue>4</issue>
      <fpage>573</fpage>
      <lpage>590</lpage>
      <history>
        <date date-type="received">
          <day>29</day>
          <month>08</month>
          <year>2012</year>
        </date>
        <date date-type="rev-recd">
          <day>27</day>
          <month>11</month>
          <year>2012</year>
        </date>
        <date date-type="accepted">
          <day>04</day>
          <month>12</month>
          <year>2012</year>
        </date>
      </history>
      <permissions>
        <copyright-statement>© 2012 by the authors; licensee MDPI, Basel, Switzerland.</copyright-statement>
        <copyright-year>2012</copyright-year>
        <license xmlns:xlink="http://www.w3.org/1999/xlink" license-type="open-access" xlink:href="http://creativecommons.org/licenses/by/3.0/">
          <p>This article is an open-access article distributed under the terms and conditions of the Creative Commons Attribution license (http://creativecommons.org/licenses/by/3.0/).</p>
        </license>
      </permissions>
      <abstract>
        <p>Summerfallow is cropland that is purposely kept out of production during a growing season to conserve soil moisture. On the Canadian Prairies, a trend to continuous cropping with a reduction in summerfallow began after the summerfallow area peaked in 1976. This study examined the impact of this land-use change on convective available potential energy (CAPE), a necessary but not sufficient condition for moist deep convection. All else being equal, an increase in CAPE increases the probability-of-occurrence of convective clouds and their intensity if they occur. Representative Bowen ratios for the Black, Dark Brown, and Brown soil zones were determined for 1976: the maximum summerfallow year, 2001: our baseline year, and 20xx: a hypothetical year with the maximum-possible annual crop area. Average mid-growing-season Bowen ratios and noon solar radiation were used to estimate the reduction in the lifted index (LI) from land-use weighted evapotranspiration in each study year. LI is an index of CAPE, and a reduction in LI indicates an increase in CAPE. The largest reductions in LI were found for the Black soil zone. They were −1.61 ± 0.18, −1.77 ± 0.14 and −1.89 ± 0.16 in 1976, 2001 and 20xx, respectively. These results suggest that, all else being equal, the probability-of-occurrence of moist deep convection in the Black soil zone was lower in 1976 than in the base year 2001, and it will be higher in 20xx when the annual crop area reaches a maximum. The trend to continuous cropping had less impact in the drier Dark Brown and Brown soil zones. </p>
      </abstract>
      <kwd-group>
        <kwd>Bowen ratio</kwd>
        <kwd>convective available potential energy</kwd>
        <kwd>moist deep convection</kwd>
        <kwd>land-use change</kwd>
        <kwd>summerfallow </kwd>
      </kwd-group>
    </article-meta>
  </front>
  <body>
    <sec sec-type="intro">
      <title>1. Introduction</title>
      <p>Summerfallow is cropland that is purposely kept out of production during a growing season. Traditionally farmers used this practice as a risk management strategy to improve their chances of growing a crop the following year. This practice reached a maximum in 1976, but as soil conservation practices improved, this management practice decreased and the annual crop area increased. As the demand for bioenergy crops as well as the demand for food from the increasing population increases [<xref ref-type="bibr" rid="B1-atmosphere-03-00573">1</xref>], a further increase in annual crop land is anticipated. </p>
      <p>Land-use change in agriculture such as reduction in summerfallow area is also an option to mitigate climate change [<xref ref-type="bibr" rid="B2-atmosphere-03-00573">2</xref>]. However, land-use change influences regional climates by altering the partitioning of surface net radiation (<italic>Rn</italic>) between latent heat flux, <italic>Q<sub>E</sub></italic><sub>,</sub> and sensible heat flux, <italic>Q<sub>H</sub></italic> [<xref ref-type="bibr" rid="B3-atmosphere-03-00573">3</xref>,<xref ref-type="bibr" rid="B4-atmosphere-03-00573">4</xref>,<xref ref-type="bibr" rid="B5-atmosphere-03-00573">5</xref>,<xref ref-type="bibr" rid="B6-atmosphere-03-00573">6</xref>,<xref ref-type="bibr" rid="B7-atmosphere-03-00573">7</xref>,<xref ref-type="bibr" rid="B8-atmosphere-03-00573">8</xref>,<xref ref-type="bibr" rid="B9-atmosphere-03-00573">9</xref>,<xref ref-type="bibr" rid="B10-atmosphere-03-00573">10</xref>,<xref ref-type="bibr" rid="B11-atmosphere-03-00573">11</xref>]. In some cases, human alterations to the earth's surface that modify the surface energy budget can be as impactful as the greenhouse gas (GHG) emissions arising from the land disturbances [<xref ref-type="bibr" rid="B12-atmosphere-03-00573">12</xref>,<xref ref-type="bibr" rid="B13-atmosphere-03-00573">13</xref>,<xref ref-type="bibr" rid="B14-atmosphere-03-00573">14</xref>]. Higher concentration of GHGs changes snow-albedo feedback and increases precipitation in many regions [<xref ref-type="bibr" rid="B15-atmosphere-03-00573">15</xref>]. Along with the plant-available soil moisture, the ratio of <italic>Q<sub>H</sub></italic> to <italic>Q<sub>E</sub></italic>, the Bowen ratio (<italic>Bo</italic>), is determined, in large part, by the type of vegetation and stage of growth which control physiological parameters such as leaf area, stomatal conductance, and rooting depth. </p>
      <p>Alterations to the vegetative cover that modify the partitioning of surface net radiation, <italic>Rn</italic>, influence the heating and moistening of the convective boundary layer (CBL). While upward sensible heat flux (<italic>Q<sub>H</sub></italic>) determines the depth of the CBL [<xref ref-type="bibr" rid="B16-atmosphere-03-00573">16</xref>] and modifies its temperature profile, upward latent heat flux (<italic>Q<sub>E</sub></italic>), <italic>i.e.</italic>, evapotranspiration (<italic>ET</italic>), moistens the CBL. Both increase the convective available potential energy (CAPE), if conditions above the CBL remain unchanged. CAPE is a necessary but not sufficient condition for moist deep convection. A lifting mechanism (e.g., cold front, daytime heating) is required to initiate the buoyant or free rise of CBL air parcels that convert CAPE into the kinetic energy of convective clouds. Succinctly, CAPE is the energy available to a CBL air parcel rising freely through the atmosphere [<xref ref-type="bibr" rid="B17-atmosphere-03-00573">17</xref>,<xref ref-type="bibr" rid="B18-atmosphere-03-00573">18</xref>]. All else being equal, an increase in CAPE increases the probability-of-occurrence of moist deep convection (convective cloud with associated rainfall and severe weather), and its severity if it occurs [<xref ref-type="bibr" rid="B9-atmosphere-03-00573">9</xref>,<xref ref-type="bibr" rid="B19-atmosphere-03-00573">19</xref>]. </p>
      <p>Advection generally sets the base specific humidity of the CBL while <italic>ET</italic> from the land surface incrementally modifies its moisture level. For example, if the entrainment of air from above is small, <italic>ET</italic> produces an equivalent increase in the specific humidity of a well-mixed 1,000 m deep CBL, or an increase equal to one-half of <italic>ET</italic> for a 2,000 m deep CBL [<xref ref-type="bibr" rid="B20-atmosphere-03-00573">20</xref>]. Above the lifting condensation level (LCL), a positively buoyant air parcel follows the saturated adiabat defined by the wet-bulb potential temperature at the LCL, and an increase in the specific humidity of the CBL increases this wet-bulb potential temperature. Thus, <italic>ET</italic> (equivalently <italic>Q<sub>E</sub></italic>) generally produces a large increase in CAPE, especially if the CBL is already moist [<xref ref-type="bibr" rid="B19-atmosphere-03-00573">19</xref>]. In contrast, sensible heat flux, <italic>Q<sub>H</sub></italic> deepens the CBL, which may lead to the entrainment of drier air from above. It warms the CBL and this may spawn the widespread development of shallow non-precipitating convective clouds (<italic>i.e.</italic>, fair-weather cumulus clouds), which also dries the CBL [<xref ref-type="bibr" rid="B21-atmosphere-03-00573">21</xref>]. Thus, <italic>Q<sub>H</sub></italic> usually produces only a small increase in CAPE [<xref ref-type="bibr" rid="B22-atmosphere-03-00573">22</xref>,<xref ref-type="bibr" rid="B23-atmosphere-03-00573">23</xref>]. </p>
      <p>Pielke [<xref ref-type="bibr" rid="B15-atmosphere-03-00573">15</xref>] reported that Nair and Welch examined the sensitivity of CAPE to a small increase in near surface temperature and humidity over the continental United States. A 1 °C increase in the surface dew point temperature produced a large increase in CAPE, particularly in southern regions where the absolute humidity of the lower atmosphere was already high. However, a 1 °C increase in air temperature had a much smaller impact on CAPE. Their analysis clearly demonstrated the high sensitivity of CAPE to regional <italic>ET</italic> as it increases the surface dew-point temperature (<italic>T<sub>d</sub></italic>). </p>
      <p>Segal <italic>et al.</italic> [<xref ref-type="bibr" rid="B19-atmosphere-03-00573">19</xref>] showed that for the same value of noon global shortwave radiation, the smaller the Bowen ratio, the higher the thermodynamic potential for moist deep convection due to an increase in CAPE. Zawadzki <italic>et al.</italic> [<xref ref-type="bibr" rid="B24-atmosphere-03-00573">24</xref>] correlated convective rainfall rates with CAPE and found that it explained about 60% of the observed storm-to-storm variability. The lifted index (LI) is often used to indicate the magnitude of CAPE. LI = T<sub>A</sub> − T<sub>P</sub>, where T<sub>A</sub> is the temperature of the ambient air at 50 kPa, and T<sub>P</sub> is the temperature of a CBL air parcel after it has risen to that level [<xref ref-type="bibr" rid="B23-atmosphere-03-00573">23</xref>,<xref ref-type="bibr" rid="B25-atmosphere-03-00573">25</xref>]. LI is generally scaled as follows [<xref ref-type="bibr" rid="B26-atmosphere-03-00573">26</xref>]: LI &gt; 6 very stable, 6 ≥ LI ≥ 1 stable, 0 ≥ LI ≥ −2 slightly unstable (thunderstorms are possible with a lifting mechanism), −2 ≥ LI ≥ −6 unstable (thunderstorms are likely—some severe with a lifting mechanism), and LI &lt; −6: very unstable (severe thunderstorms are likely with a lifting mechanism). While LI is primarily determined by the synoptic situation, regional <italic>ET</italic> reduces the LI by moistening the CBL. </p>
      <p>Raddatz [<xref ref-type="bibr" rid="B27-atmosphere-03-00573">27</xref>] examined the impact of agricultural cultivation on surface energy partitioning on the Canadian Prairies. Representative growing-season Bowen ratio curves, based on modeled <italic>ET</italic> [<xref ref-type="bibr" rid="B28-atmosphere-03-00573">28</xref>] for native perennial grasses and for annual field crops, were derived. Prior to the emergence of annual crops, and again during their senescence and in the post-harvest period, Bowen ratios are generally higher now (<italic>i.e.</italic>, <italic>ET</italic> rates are lower) than they would have been if the Prairies had remained in perennial grasses. Thus in the early and late portions of the growing season, widespread agricultural cultivation has reduced the CAPE, and this reduction in CAPE has likely reduced the frequency of thunderstorms. In contrast, during the mid-growing season, a period of rapid foliar expansion and seed production for annual crops, Bowen ratios are generally lower now (<italic>i.e.</italic>, <italic>ET</italic> rates are higher) than they would have been without cultivation. Thus, it is likely that thunderstorms are now more frequent in the middle of the growing season, and the increase in CAPE may have made them more intense. </p>
      <p>The influence of the relatively homogeneous agro-ecosystem of the Canadian Prairies, comprised primarily of annual field crops, on CBL moisture has been related to the seasonal pattern of tornado days by Raddatz and Cummine [<xref ref-type="bibr" rid="B29-atmosphere-03-00573">29</xref>]. Average (1988–2000) wheat (<italic>Triticum</italic> spp.) phenology curves, at representative sites, were plotted along with the average number of tornado days per week for the entire Prairie region. Wheat phenology was depicted by the average weekly water-use fraction (actual <italic>ET</italic> as a fraction of potential <italic>ET</italic>) which increases through the foliar expansion stage of annual crops, peaking at 1.0 with full vegetative cover during the reproductive stage then drops as the crop ripens [<xref ref-type="bibr" rid="B28-atmosphere-03-00573">28</xref>]. The average weekly fractional water-use at representative sites explained about 80% of the variance in the average weekly number of tornado days for the region. It was concluded that the moisture flux from the Prairie agro-ecosystem translates directly into changes in CBL moisture, which subsequently affects the magnitude of the potential energy available for moist deep convection, and the seasonal pattern of tornado days. </p>
      <p>Gameda <italic>et al.</italic> [<xref ref-type="bibr" rid="B7-atmosphere-03-00573">7</xref>] reported that the widespread change-over from a crop rotation, which included summerfallow to continuous cropping on the Canadian Prairies has influenced the regional climate during the foliar expansion period from mid-June to mid-July. The area under summerfallow generally increased until 1976, peaking at 11 Mha. It decreased to 4.3 Mha in 2010 [<xref ref-type="bibr" rid="B30-atmosphere-03-00573">30</xref>]. Gameda <italic>et al.</italic> [<xref ref-type="bibr" rid="B7-atmosphere-03-00573">7</xref>] found a decrease of 1.7 °C∙decade<sup>−1</sup> in the daily maximum temperature, as well as an increase in precipitation of 10.3 mm∙decade<sup>−1</sup> from 1976 to 2001. This negative trend in maximum temperatures is opposite to what would be expected from anthropogenic greenhouse warming. Dow and DeWalle [<xref ref-type="bibr" rid="B31-atmosphere-03-00573">31</xref>] reported that, due to urbanization, there has been a significant decrease in <italic>ET</italic> and a significant increase in <italic>Q<sub>H</sub></italic> between 1920 and 1990 in some eastern watersheds of the United States, and this change has effected near surface temperatures. Increasing correlation between CAPE and precipitation extreme were found indicating the storm intensification in impounded basins of Mediterranean and arid climes due to large dams [<xref ref-type="bibr" rid="B32-atmosphere-03-00573">32</xref>]. On the Canadian Prairies, the reduction of the summerfallow area in recent decades has increased <italic>ET</italic> and decreased <italic>Q<sub>H</sub></italic> [<xref ref-type="bibr" rid="B7-atmosphere-03-00573">7</xref>,<xref ref-type="bibr" rid="B9-atmosphere-03-00573">9</xref>]. However, an examination of the impact of this change on near surface temperatures is beyond the scope of this study. </p>
      <p>This study examined the impact of the trend to continuous cropping (reduced summerfallow area) on CAPE on the Canadian Prairies. All else being equal, an increase in CAPE increases the probability-of-occurrence of convective clouds and their intensity if they occur. Representative Bowen ratios for the Black, Dark Brown, and Brown soil zones were determined for 1976: the maximum summerfallow year, 2001: our baseline year, and 20xx: a hypothetical year with the maximum-possible annual field crop area. Mean mid-growing-season Bowen ratios, mean solar noon global radiation values and Segal <italic>et al.</italic>’s [<xref ref-type="bibr" rid="B23-atmosphere-03-00573">23</xref>] relationship were used to estimate the reduction in the LI, indicative of an increase in CAPE, associated with the land-use weighted <italic>ET</italic> in each study year. </p>
    </sec>
    <sec sec-type="methods">
      <title>2. Data and Methodology</title>
      <p>
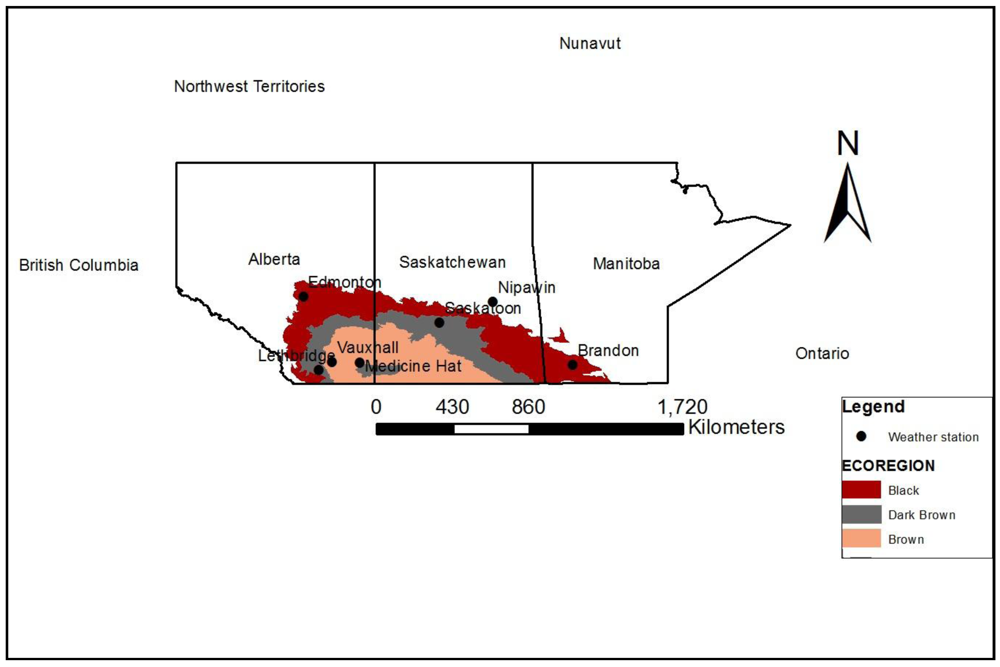
On the Canadian Prairies, about 21% of the cultivated land is in the Brown soil zone, 22% is in the Dark Brown soil zone, with most of the remaining cultivated land in the more humid Black soil zone [<xref ref-type="bibr" rid="B33-atmosphere-03-00573">33</xref>]. At least one weather station in each soil zone of each province was selected based on data availability (<xref ref-type="fig" rid="atmosphere-03-00573-f001">Figure 1</xref>). Edmonton, Nipawin and Brandon were selected to represent the Black soil zone, Lethbridge and Saskatoon to represent the Dark Brown soil zone, and Medicine Hat and Vauxhall to represent the Brown soil zone (<xref ref-type="table" rid="atmosphere-03-00573-t001">Table 1</xref>). Meteorological data for these sites were obtained from the Meteorological Service, Environment Canada [<xref ref-type="bibr" rid="B34-atmosphere-03-00573">34</xref>], or from Agriculture and Agri-Food Canada [<xref ref-type="bibr" rid="B35-atmosphere-03-00573">35</xref>]. Surface-specific mean daily growing season values for each term of the surface energy budget for spring wheat (<italic>Triticum aestivum</italic> L.), representing all annual crops, perennial forages, and for summerfallow were determined as outlined in the following sections.</p>
      <fig id="atmosphere-03-00573-f001" position="anchor">
        <label>Figure 1</label>
        <caption>
          <p>Map of the study area showing the three major soil zones with representative weather stations. </p>
        </caption>
        <graphic xmlns:xlink="http://www.w3.org/1999/xlink" xlink:href="atmosphere-03-00573-g001.tif"/>
      </fig>
      <table-wrap id="atmosphere-03-00573-t001" position="float">
        <object-id pub-id-type="pii">atmosphere-03-00573-t001_Table 1</object-id>
        <label>Table 1</label>
        <caption>
          <p>Representative weather stations for the three major soil zones in the Canadian Prairies <sup>†</sup>. </p>
        </caption>
        <table>
          <thead>
            <tr>
              <th align="center" valign="middle">SN</th>
              <th align="center" valign="middle">Station name</th>
              <th align="center" valign="middle">Latitude (° N)</th>
              <th align="center" valign="middle">Longitude (° W)</th>
              <th align="center" valign="middle">Elevation (m)</th>
              <th align="center" valign="middle">Province <sup>†</sup></th>
              <th align="center" valign="middle">Soil zone</th>
            </tr>
          </thead>
          <tbody>
            <tr>
              <td align="center" valign="middle">1</td>
              <td align="center" valign="middle">Edmonton</td>
              <td align="center" valign="middle">53.3</td>
              <td align="center" valign="middle">113.58</td>
              <td align="center" valign="middle">723.3</td>
              <td align="center" valign="middle">AB</td>
              <td align="center" valign="middle">Black</td>
            </tr>
            <tr>
              <td align="center" valign="middle">2</td>
              <td align="center" valign="middle">Nipawin</td>
              <td align="center" valign="middle">53.33</td>
              <td align="center" valign="middle">104.0</td>
              <td align="center" valign="middle">371.9</td>
              <td align="center" valign="middle">SK</td>
              <td align="center" valign="middle">Black</td>
            </tr>
            <tr>
              <td align="center" valign="middle">3</td>
              <td align="center" valign="middle">Brandon</td>
              <td align="center" valign="middle">49.91</td>
              <td align="center" valign="middle">99.9</td>
              <td align="center" valign="middle">409.4</td>
              <td align="center" valign="middle">MB</td>
              <td align="center" valign="middle">Black</td>
            </tr>
            <tr>
              <td align="center" valign="middle">4</td>
              <td align="center" valign="middle">Lethbridge</td>
              <td align="center" valign="middle">49.63</td>
              <td align="center" valign="middle">112.79</td>
              <td align="center" valign="middle">928.7</td>
              <td align="center" valign="middle">AB</td>
              <td align="center" valign="middle">Dark Brown</td>
            </tr>
            <tr>
              <td align="center" valign="middle">5</td>
              <td align="center" valign="middle">Saskatoon</td>
              <td align="center" valign="middle">52.16</td>
              <td align="center" valign="middle">106.72</td>
              <td align="center" valign="middle">504.1</td>
              <td align="center" valign="middle">SK</td>
              <td align="center" valign="middle">Dark Brown</td>
            </tr>
            <tr>
              <td align="center" valign="middle">6</td>
              <td align="center" valign="middle">Medicine hat</td>
              <td align="center" valign="middle">50.02</td>
              <td align="center" valign="middle">110.72 </td>
              <td align="center" valign="middle">716.9</td>
              <td align="center" valign="middle">AB</td>
              <td align="center" valign="middle">Brown</td>
            </tr>
            <tr>
              <td align="center" valign="middle">7</td>
              <td align="center" valign="middle">Vauxhall</td>
              <td align="center" valign="middle">50.05</td>
              <td align="center" valign="middle">112.13</td>
              <td align="center" valign="middle">779.0</td>
              <td align="center" valign="middle">AB</td>
              <td align="center" valign="middle">Brown</td>
            </tr>
          </tbody>
        </table>
		<table-wrap-foot>
			<fn>
      <p><sup>†</sup> AB = Alberta, SK = Saskatchewan, MB = Manitoba.</p>
			</fn>
			</table-wrap-foot>
      </table-wrap>
      <sec>
        <title>2.1. Mean Daily Net Radiation</title>
        <p>Observations of daily net radiation, <italic>Rn,</italic> were only available at Lethbridge. For all of the other sites, daily <italic>Rn</italic> values were estimated using the method described in the FAO (Food and Agriculture Organization of the United Nations) Irrigation and Drainage, Paper No. 56 [<xref ref-type="bibr" rid="B36-atmosphere-03-00573">36</xref>]. In brief, net shortwave radiation (<italic>Rns</italic>) was estimated as a function of the incoming shortwave radiation (<italic>Rs</italic>), and the albedo (<italic>α</italic>) of the surface, which varies with the type and the stage of the vegetation. Net longwave radiation (<italic>Rnl</italic>) was estimated as a function of vapor pressure, maximum and minimum temperatures, and the ratio of the solar radiation from a clear sky to the observed solar radiation. <italic>Rn</italic> was then estimated as the sum of <italic>Rns</italic> and <italic>Rnl</italic>.</p>
        <p>To account for the fact that the radiation observations at Lethbridge were made over a short grass surface, and to adjust for the difference in albedo between annual field crops, summerfallow and perennial forages, the <italic>Rn</italic> values calculated by the FAO method were modified by an adjustment factor. The adjustment factor was based on the difference between the monthly average albedo at Lethbridge over grass, and the monthly average albedo for annual crops, perennial forage and summerfallow determined from Moderate Resolution Imaging Spectroradiometer (MODIS) satellite image analysis from 2000 to 2003 for the province of Saskatchewan (Wang S., unpublished data). This adjustment increased the average <italic>Rn</italic> value by 2% for areas under fallow, 2.5% for annual field crops, and 4% for perennial forage.</p>
        <p>
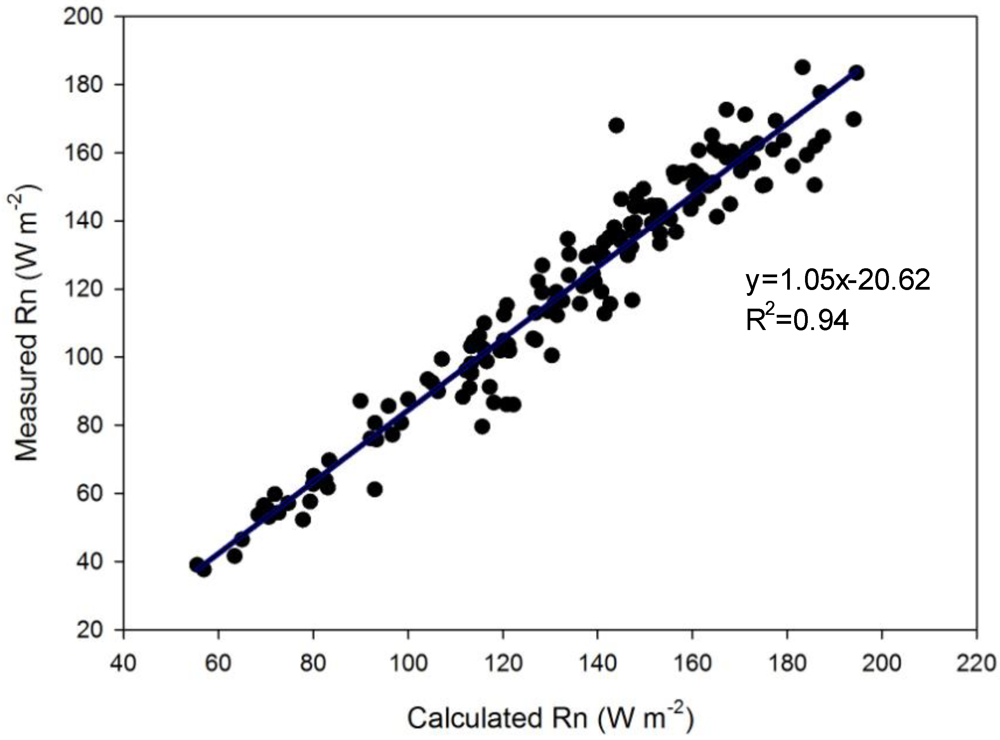
To verify the accuracy of the FAO method, daily <italic>Rn</italic> values were calculated for Lethbridge, and compared with the observed values for the growing seasons from 1991 to 1995. The measured and calculated daily <italic>Rn</italic> values were highly correlated with a small offset (<xref ref-type="fig" rid="atmosphere-03-00573-f002">Figure 2</xref>). A similar result for correlation between the measured and calculated <italic>Rn</italic> for data from Ottawa (data not shown) showed reliability of the method. The relationship between the observed and calculated daily <italic>Rn</italic> values at Lethbridge was subsequently used to adjust the calculated <italic>Rn</italic> values for the other study sites. </p>
        <fig id="atmosphere-03-00573-f002" position="anchor">
          <label>Figure 2</label>
          <caption>
            <p>Comparison of daily calculated and observed net radiation at Lethbridge during the growing seasons of 1991 to 1995. </p>
          </caption>
          <graphic xmlns:xlink="http://www.w3.org/1999/xlink" xlink:href="atmosphere-03-00573-g002.tif"/>
        </fig>
      </sec>
      <sec>
        <title>2.2. Mean Daily Latent Heat Flux</title>
        <p>Archived modeled weekly growing season <italic>ET</italic> values for spring wheat (representing all annual crops), for summerfallow, and for perennial forages were available for the 1997–2004 growing seasons at the study sites. For each growing season, the weeks were numbered from 1 to 14 (week #1 = last week of May, week #2 = first week of June, and so on with week #14 = first week of September), and average weekly <italic>ET</italic> values for the 1997–2004 period encompassing our base year, 2001, were calculated. Mean daily
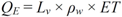
 <italic>ET</italic> values were interpolated from the average weekly values. Mean daily latent heat flux values, <italic>Q<sub>E</sub></italic> (W·m<sup>−2</sup>), were then calculated with Equation (1):
		<disp-formula id="atmosphere-03-00573-i001">
          <inline-graphic xmlns:xlink="http://www.w3.org/1999/xlink" xlink:href="atmosphere-03-00573-i001.tif"/>
          <label>(1)</label>
          </disp-formula>
		where, <italic>L<sub>v</sub></italic> is the latent heat of vaporization, and ρ<sub>w</sub> is the density of water.</p>
        <p>A model had been used to simulate the daily <italic>ET</italic> values that were summed and archived as weekly estimates. This model [<xref ref-type="bibr" rid="B24-atmosphere-03-00573">24</xref>] simulated the phenological development of spring wheat from planting date, daily temperatures and photoperiods using the biometeorological time scale developed by Robertson [<xref ref-type="bibr" rid="B37-atmosphere-03-00573">37</xref>]. For perennial forages, growth was assumed to begin after April 1st following the first occurrence of 5 consecutive days with mean air temperatures ≥5 °C. Potential daily <italic>ET</italic> was estimated using a linear relationship with daily climatological observations, and the incident solar radiation at the top of the atmosphere [<xref ref-type="bibr" rid="B38-atmosphere-03-00573">38</xref>]. The water demand of spring wheat at the various stages of development was estimated by multiplying potential <italic>ET</italic> by a consumptive-use factor (pre-emergence and post-senescence = 0.3; the factor peaks at 1.0 during the reproductive stage) [<xref ref-type="bibr" rid="B39-atmosphere-03-00573">39</xref>]. To obtain the water demand of perennial forages, the consumptive-use factor was increased from 0.3 to 1.0 after the active growth date and it was kept constant until the first killing frost in the fall. Available moisture in the root zone was used to limit <italic>ET</italic>. The actual <italic>ET</italic> as a percentage of water demand dropped linearly when the soil moisture was &lt;50% of the root zone’s available water-holding capacity, and it became zero when there was no available soil moisture. This simulated the closing of stomata in response to depleted soil moisture. For spring wheat, the root zone depth (5–120 cm), and thus the size of the soil moisture reservoir, was a function of the crop stage [<xref ref-type="bibr" rid="B40-atmosphere-03-00573">40</xref>]. For perennial forages, an established root system was assumed, and the root zone depth was kept at 120 cm. Water budget accounting was used to track the addition of infiltrating precipitation and the loss of moisture from the root zone by <italic>ET</italic> and deep percolation as in Baier [<xref ref-type="bibr" rid="B38-atmosphere-03-00573">38</xref>]. The wheat model was also used to simulate evaporation from summerfallow by simply keeping the crop at the pre-emergence stage. </p>
      </sec>
      <sec>
        <title>2.3. Mean Daily Heat Conducted into the Soil</title>
        <p>The mean (1997–2004) heat conducted into the soil, <italic>Q<sub>G</sub></italic>, at Lethbridge was derived from average daily soil temperatures, rough soil moisture estimates, and the average daily changes to the heat stored in the soil during the growing season. Average daily <italic>Q<sub>G</sub></italic> values were calculated as the sum of heat conducted between the 5 and 10 cm soil depths (first term on right side of Equation (2)), and the change in heat stored in the top 5 cm of the soil (second term on right hand side of Equation (2)):
		<disp-formula id="atmosphere-03-00573-i002">
          <inline-graphic xmlns:xlink="http://www.w3.org/1999/xlink" xlink:href="atmosphere-03-00573-i002.tif"/>
          <label>(2)</label>
          </disp-formula>
		where, k<sub>s</sub> = thermal conductivity (W∙m<sup>−1</sup>∙K<sup>−1</sup>), T<sub>10</sub> = soil temperature at 10 cm soil depth (°K), T<sub>5</sub> = soil temperature at 5 cm soil depth (°K), T<sub>t+1</sub> = soil temperature at time t+1 (°K), T<sub>t</sub> = soil temperature at time t (°K), ∆t = time interval (s), ∆z = effective soil depth (m) and C<sub>v</sub> = soil heat capacity (J∙m<sup>−3</sup>∙K<sup>−1</sup>).</p>
        <p>As the <italic>Q<sub>G</sub></italic> is generally much less than the <italic>Q<sub>E</sub></italic> and <italic>Q<sub>H</sub></italic> terms, soil drying over the growing season was approximated by assuming that k<sub>s</sub> decreased linearly from 1.89 on 1 May to 0.28 on 31 August, and simultaneously C<sub>v</sub> decreased linearly from 3.03 × 10<sup>6</sup> to 1.35 × 10<sup>6</sup> J∙m<sup>−3</sup>∙K<sup>−1</sup> [<xref ref-type="bibr" rid="B16-atmosphere-03-00573">16</xref>]. In order to estimate heat storage in the first 5 cm, the soil temperature at 2.5 cm was estimated by extrapolating from the temperatures measures at the 5, 10 and 20 cm soil depths. </p>
        <p>
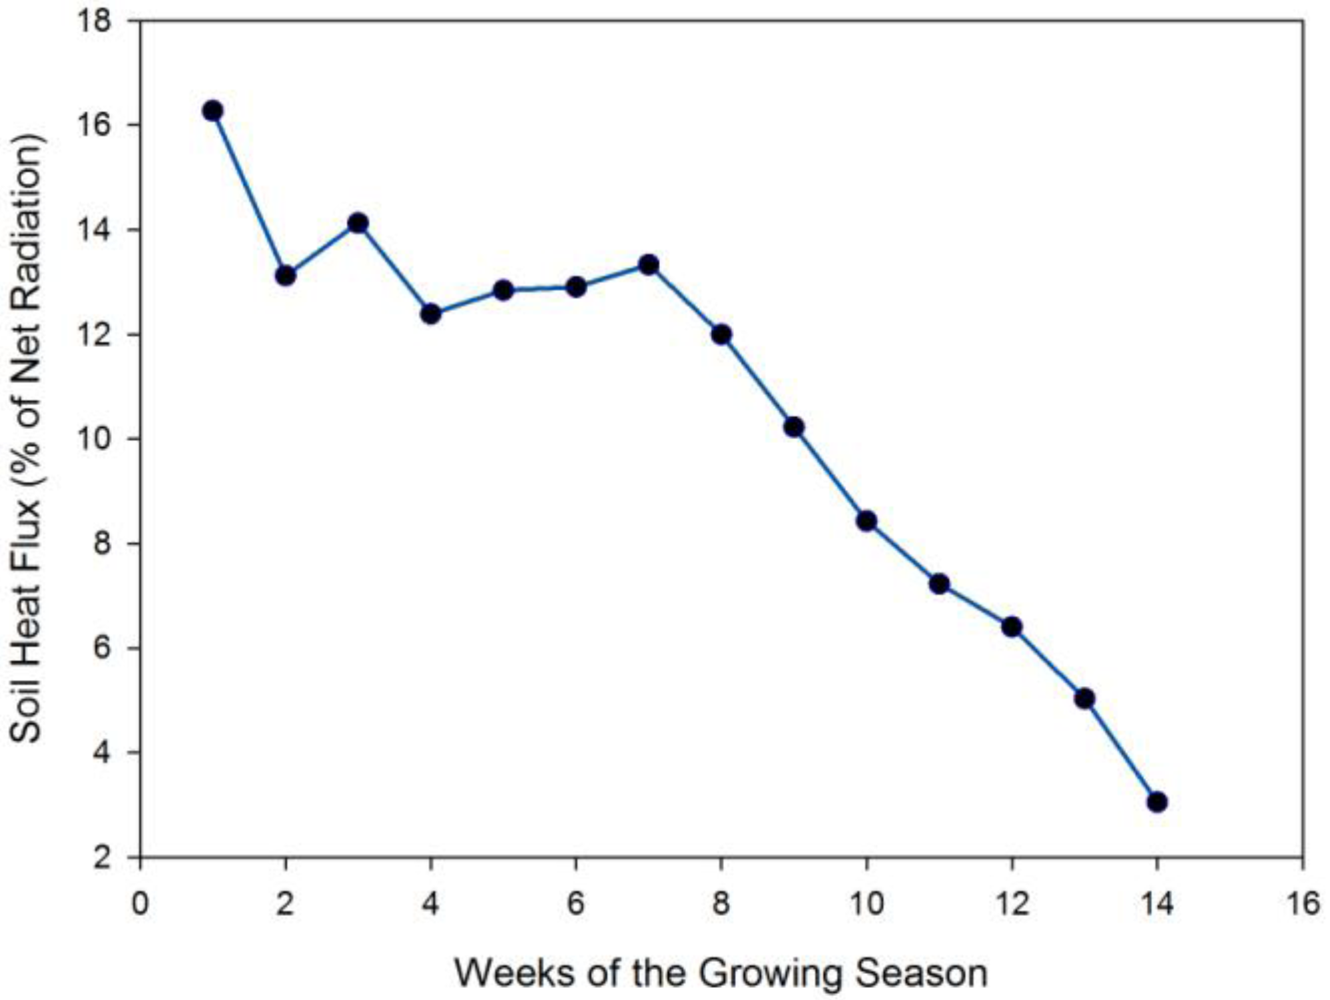
The mean daily heat transferred to the soil, <italic>Q<sub>G</sub></italic>, as a percentage of the observed <italic>Rn</italic> at Lethbridge was plotted against the week number through the growing season (<xref ref-type="fig" rid="atmosphere-03-00573-f003">Figure 3</xref>). The linear fit of <italic>Q<sub>G</sub> versus</italic> week number at Lethbridge was then used to estimate <italic>Q<sub>G</sub></italic> at the other sites in this study. <italic>Q<sub>G</sub></italic> was assumed to be similar for annual crops and perennial forages at all locations. The percentage was the highest in week 1, and it remained around 13% until week 7. It decreased continuously to &lt;5% during the foliar expansion period of the annual field crops. For summerfallow, <italic>Q<sub>G</sub></italic> was assumed to be 13% throughout the growing season, the mean value observed at Lethbridge from week 2 to week 7. Our <italic>Q<sub>G</sub></italic>:<italic>Rn</italic> ratios are similar to the lower level of the range found in the literature. Clothier <italic>et al.</italic> [<xref ref-type="bibr" rid="B41-atmosphere-03-00573">41</xref>] reported that, depending on the vegetation and soil moisture level, the ratio between the heat transferred to the soil and the net radiation (<italic>Q<sub>G</sub></italic>:<italic>Rn</italic>) can range from 0.10 to 0.50. From a literature survey, Santanello and Friedl [<xref ref-type="bibr" rid="B42-atmosphere-03-00573">42</xref>] found that this ratio varies from 0.15 to 0.40 depending on the vegetation cover.</p>
        <fig id="atmosphere-03-00573-f003" position="anchor">
          <label>Figure 3</label>
          <caption>
            <p>Mean soil heat flux conducted into the soil as a percentage of the net radiation during the growing season at Lethbridge. </p>
          </caption>
          <graphic xmlns:xlink="http://www.w3.org/1999/xlink" xlink:href="atmosphere-03-00573-g003.tif"/>
        </fig>
      </sec>
      <sec>
        <title>2.4. Mean Daily Sensible Heat Flux</title>
        <p>The mean daily sensible heat flux values, <italic>Q<sub>H</sub></italic>, for the growing season were determined from the surface energy budget (Equation (3)) by deducting <italic>Q<sub>G</sub></italic> and <italic>Q<sub>E</sub></italic> from <italic>Rn:</italic>
		<disp-formula id="atmosphere-03-00573-i003">
          <inline-graphic xmlns:xlink="http://www.w3.org/1999/xlink" xlink:href="atmosphere-03-00573-i003.tif"/>
          <label>(3)</label>
          </disp-formula>
		</p>
      </sec>
      <sec>
        <title>2.5. Land-use Weighted Mean Daily Energy Terms and Bowen Ratios</title>
        <p>Land-use data for each Census Agricultural Region (CAR) in the Canadian Prairies were obtained for agricultural census years 2001 and 2006 [<xref ref-type="bibr" rid="B43-atmosphere-03-00573">43</xref>]. These data were allocated to the major soil zones using the method employed by Campbell <italic>et al.</italic> [<xref ref-type="bibr" rid="B33-atmosphere-03-00573">33</xref>]. Land-use data were grouped into annual field crops, summerfallow, improved pasture, unimproved pasture and other lands (<xref ref-type="table" rid="atmosphere-03-00573-t002">Table 2</xref>). Land-use data for 1976 were only available at the Census Division level, and two additional land-use categories were included, namely other improved lands and woodlands [<xref ref-type="bibr" rid="B44-atmosphere-03-00573">44</xref>,<xref ref-type="bibr" rid="B45-atmosphere-03-00573">45</xref>,<xref ref-type="bibr" rid="B46-atmosphere-03-00573">46</xref>]. Thus, the Census Division land-use data for 1976 were first allocated to CARs, and then allocated to soil zones. The other improved land area was combined with the improved pasture category, and the woodlands area was added to the other lands category to be consistent with the census data for 2001 and 2006 (<xref ref-type="table" rid="atmosphere-03-00573-t002">Table 2</xref>). The potential-maximum annual field crop area for the hypothetical year 20xx was created by adding the 2006 areas in summerfallow and in improved pasture to the area in annual field crops (<xref ref-type="table" rid="atmosphere-03-00573-t002">Table 2</xref>). </p>
        <table-wrap id="atmosphere-03-00573-t002" position="float">
          <object-id pub-id-type="pii">atmosphere-03-00573-t002_Table 2</object-id>
          <label>Table 2</label>
          <caption>
            <p>Area (Mha) covered by annual crops, summerfallow, improved pasture, unimproved pasture and other lands in 1976, 2001 and 20xx for the three soil zones of the Canadian Prairies.</p>
          </caption>
          <table>
            <thead>
              <tr>
                <th align="center" valign="middle">Census Year</th>
                <th align="center" valign="middle">Soil Zone</th>
                <th align="center" valign="middle">Annual Crops</th>
                <th align="center" valign="middle">Summer Fallow</th>
                <th align="center" valign="middle">Improved Pasture</th>
                <th align="center" valign="middle">Unimproved Pasture</th>
                <th align="center" valign="middle">Other Lands <sup>†</sup></th>
                <th align="center" valign="middle">Total</th>
              </tr>
            </thead>
            <tbody>
              <tr>
                <td align="center" valign="middle">1976</td>
                <td align="center" valign="middle">Black</td>
                <td align="center" valign="middle">13.1</td>
                <td align="center" valign="middle">4.6</td>
                <td align="center" valign="middle">2.1</td>
                <td align="center" valign="middle">9.2</td>
                <td align="center" valign="middle">1.4</td>
                <td align="center" valign="middle">30.4</td>
              </tr>
              <tr>
                <td align="center" valign="middle"> </td>
                <td align="center" valign="middle">Dark Brown</td>
                <td align="center" valign="middle">5.2</td>
                <td align="center" valign="middle">3.2</td>
                <td align="center" valign="middle">0.6</td>
                <td align="center" valign="middle">3.4</td>
                <td align="center" valign="middle">0.1</td>
                <td align="center" valign="middle">12.5</td>
              </tr>
              <tr>
                <td align="center" valign="middle"> </td>
                <td align="center" valign="middle">Brown</td>
                <td align="center" valign="middle">3.7</td>
                <td align="center" valign="middle">2.9</td>
                <td align="center" valign="middle">0.5</td>
                <td align="center" valign="middle">5.6</td>
                <td align="center" valign="middle">0.0</td>
                <td align="center" valign="middle">12.7</td>
              </tr>
              <tr>
                <td align="center" valign="middle">2001</td>
                <td align="center" valign="middle">Black</td>
                <td align="center" valign="middle">17.1</td>
                <td align="center" valign="middle">1.4</td>
                <td align="center" valign="middle">2.5</td>
                <td align="center" valign="middle">6.3</td>
                <td align="center" valign="middle">2.4</td>
                <td align="center" valign="middle">29.7</td>
              </tr>
              <tr>
                <td align="center" valign="middle"> </td>
                <td align="center" valign="middle">Dark Brown</td>
                <td align="center" valign="middle">7.0</td>
                <td align="center" valign="middle">1.1</td>
                <td align="center" valign="middle">0.7</td>
                <td align="center" valign="middle">2.0</td>
                <td align="center" valign="middle">0.4</td>
                <td align="center" valign="middle">11.4</td>
              </tr>
              <tr>
                <td align="center" valign="middle"> </td>
                <td align="center" valign="middle">Brown</td>
                <td align="center" valign="middle">6.7</td>
                <td align="center" valign="middle">1.5</td>
                <td align="center" valign="middle">0.7</td>
                <td align="center" valign="middle">3.2</td>
                <td align="center" valign="middle">0.5</td>
                <td align="center" valign="middle">12.7</td>
              </tr>
              <tr>
                <td align="center" valign="middle">20xx <sup>‡</sup></td>
                <td align="center" valign="middle">Black</td>
                <td align="center" valign="middle">20.5</td>
                <td align="center" valign="middle">0.0</td>
                <td align="center" valign="middle">0.0</td>
                <td align="center" valign="middle">6.0</td>
                <td align="center" valign="middle">3.0</td>
                <td align="center" valign="middle">29.5</td>
              </tr>
              <tr>
                <td align="center" valign="middle"> </td>
                <td align="center" valign="middle">Dark Brown</td>
                <td align="center" valign="middle">8.9</td>
                <td align="center" valign="middle">0.0</td>
                <td align="center" valign="middle">0.0</td>
                <td align="center" valign="middle">2.0</td>
                <td align="center" valign="middle">0.6</td>
                <td align="center" valign="middle">11.5</td>
              </tr>
              <tr>
                <td align="center" valign="middle"> </td>
                <td align="center" valign="middle">Brown</td>
                <td align="center" valign="middle">8.9</td>
                <td align="center" valign="middle">0.0</td>
                <td align="center" valign="middle">0.0</td>
                <td align="center" valign="middle">3.2</td>
                <td align="center" valign="middle">0.6</td>
                <td align="center" valign="middle">12.7</td>
              </tr>
            </tbody>
          </table>
		  <table-wrap-foot>
			<fn>
        <p><sup>†</sup> Other lands = Forest, swamps, sloughs and other non-agricultural uses, “other lands” in 1976 is forest (woodlands) only. <sup>‡</sup> 20xx = Hypothetical future scenario if all summerfallow and improved pasture areas are seeded with annual crops. </p>
			</fn>
			</table-wrap-foot>
        </table-wrap>
      </sec>
    </sec>
    <sec sec-type="results">
      <title>3. Results</title>
      <p>
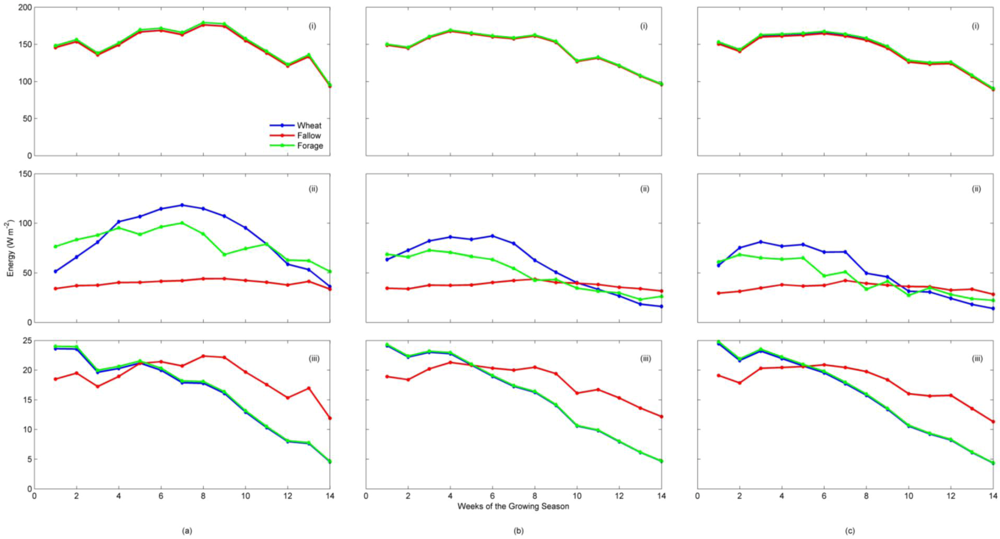
Vegetation or surface-specific mean daily values for each term on the right-hand side of Equation (3), the surface energy budget, for spring wheat (representing all annual field crops), for perennial forages, and for summerfallow at representative weather stations were plotted to illustrate growing season curves for the Black, Dark Brown and Brown soil zones (<xref ref-type="fig" rid="atmosphere-03-00573-f004">Figure 4</xref>). Land-use weighted growing season curves for <italic>Rn</italic>, <italic>Q<sub>E</sub></italic>, <italic>Q<sub>G</sub></italic> and <italic>Q<sub>H</sub></italic> (not shown) were calculated using the surface-specific mean daily values, and the land-use data for 1976 (maximum summerfallow area), for 2001 (baseline year near the mid-point of our primary data period), and 20xx (a hypothetical year when all arable lands have been seeded to annual crops). Year 20xx, assumes an extreme demand for food, fiber and biofuel. In this scenario, only unimproved pasture and other lands have been left uncultivated. </p>
      <p>In the Black soil zone, the mean daily <italic>Q<sub>E</sub></italic> accounted for 70–80% of the total convective heat flux, <italic>Q<sub>A</sub></italic>, during the foliar expansion and reproductive period (<italic>i.e.</italic>, weeks 5 to 10) for annual crops in 1976, 2001 and 20xx. In the same period, <italic>Q<sub>E</sub></italic> accounted for about 50% of <italic>Q<sub>A</sub></italic> for perennial forages in the Black soil zone, and about 25–30% for land in summerfallow. In weeks 5 to 10 in the Dark Brown soil zone, the <italic>Q<sub>E</sub></italic> of annual crops accounted for 55–60% of <italic>Q<sub>A</sub></italic>, whereas it accounted for 30–40% for perennial forages, and for 30% for land in summerfallow. For the Brown soil zone, <italic>Q<sub>E</sub></italic> accounted for 50–60%, 45%, and 30% of <italic>Q<sub>A</sub></italic>, respectively.</p>
      <fig id="atmosphere-03-00573-f004" position="anchor">
        <label>Figure 4</label>
        <caption>
          <p>Mean (1997–2004) daily energy fluxes over specified vegetation covers: (i) net radiation, (ii) latent heat, and (iii) soil heat at representative weather stations (<bold>a</bold>) Brandon-Black soil zone, (<bold>b</bold>) Lethbridge-Dark Brown soil zone, and (<bold>c</bold>) Vauxhall-Brown soil zone during the growing season. Week #1 is the last week of May.
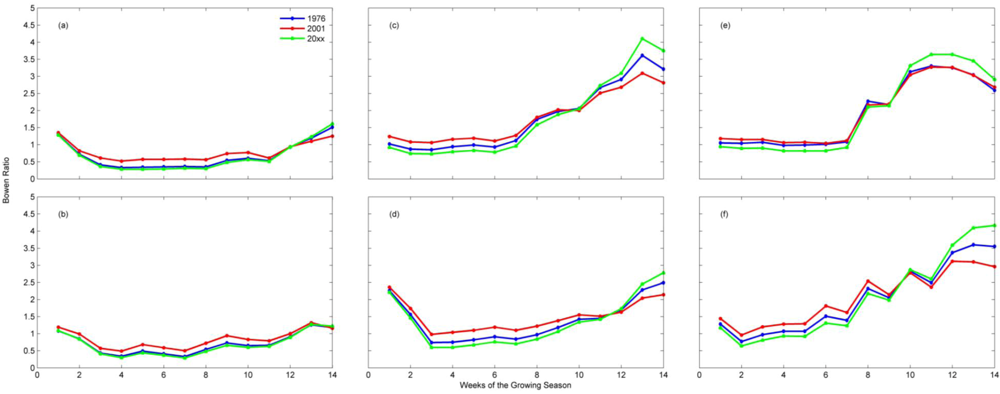
 </p>
        </caption>
        <graphic xmlns:xlink="http://www.w3.org/1999/xlink" xlink:href="atmosphere-03-00573-g004.tif"/>
      </fig>
      <fig id="atmosphere-03-00573-f005" position="anchor">
        <label>Figure 5</label>
        <caption>
          <p>Mean daily land-use-weighted growing-season Bowen ratios in 1976, 2001 and 20xx at representative weather stations; (<bold>a</bold>) Nipawin, (<bold>b</bold>) Brandon, (<bold>c</bold>) Lethbridge, (<bold>d</bold>) Saskatoon, (<bold>e</bold>) Medicine Hat, and (<bold>f</bold>) Vauxhall. Stations (a) and (b) represent Black soil zone, (c) and (d) represent Dark Brown soil zone and (e) and (f) represent Brown soil zone. Year 20xx is a hypothetical year for which all arable lands are assumed to be covered by annual crops. Week #1 is the last week of May.
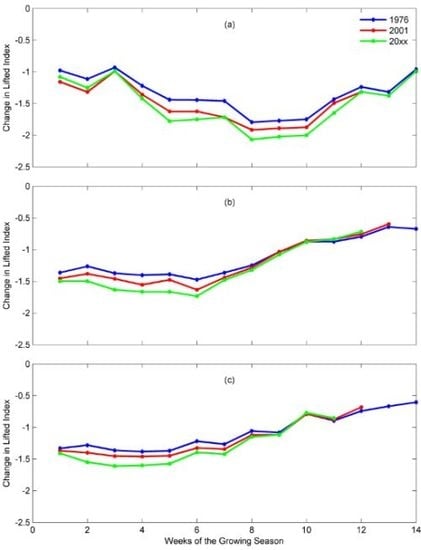
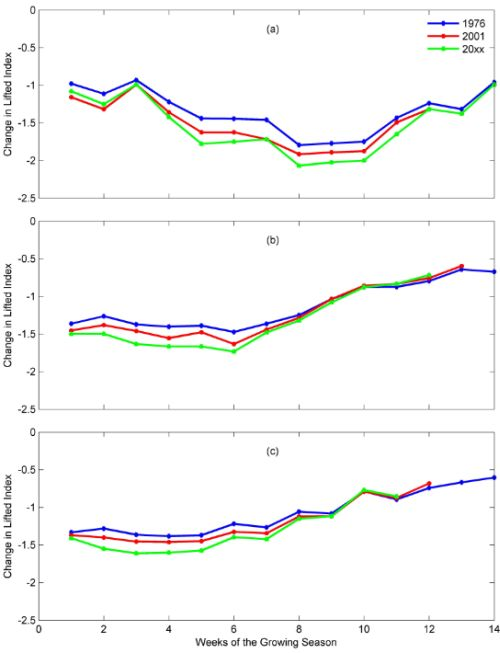
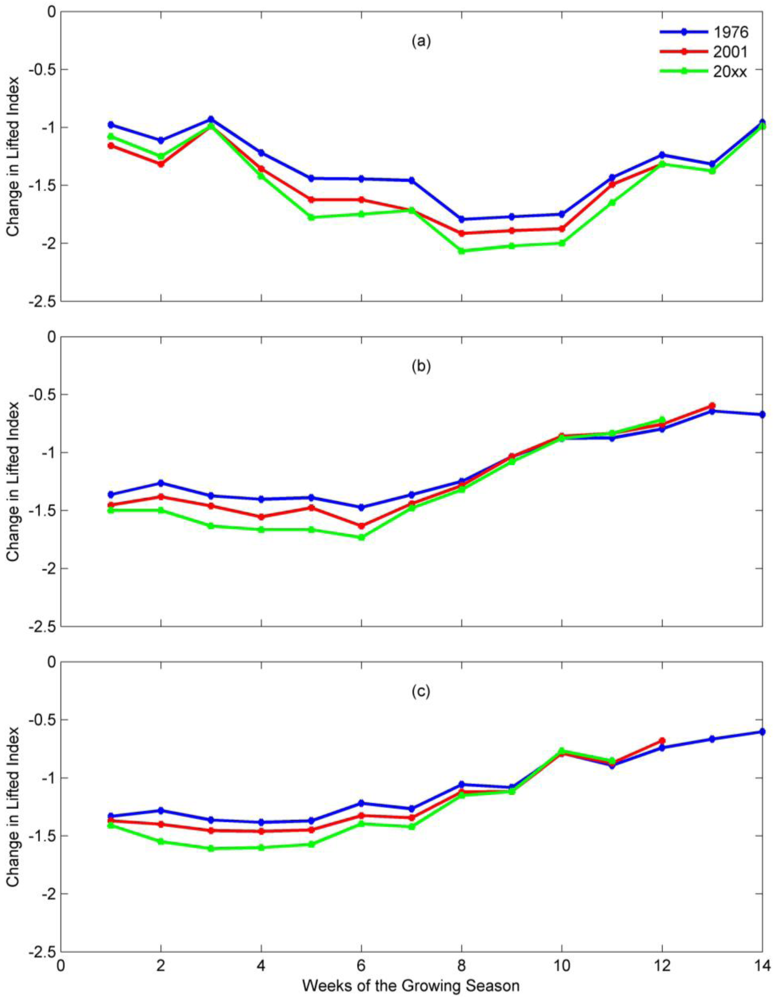
 </p>
        </caption>
        <graphic xmlns:xlink="http://www.w3.org/1999/xlink" xlink:href="atmosphere-03-00573-g005.tif"/>
      </fig>
      <fig id="atmosphere-03-00573-f006" position="anchor">
        <label>Figure 6</label>
        <caption>
          <p>Mean change in lifted index for 1976, 2001 and 20xx during the growing season at representative weather stations for three soil zones; (<bold>a</bold>) Edmonton-Black soil zone, (<bold>b</bold>) Lethbridge-Dark Brown soil zone, and (<bold>c</bold>) Vauxhall -Brown soil zone. Week #1 is the last week of May.</p>
        </caption>
        <graphic xmlns:xlink="http://www.w3.org/1999/xlink" xlink:href="atmosphere-03-00573-g006.tif"/>
      </fig>
      <p>For each land-use scenario year, mean daily growing season Bowen ratio values at sites representing each of the three soil zones were calculated (<xref ref-type="fig" rid="atmosphere-03-00573-f005">Figure 5</xref>), and along with mean solar noon global radiation values, were used to estimate the daily reductions in the LI (<xref ref-type="fig" rid="atmosphere-03-00573-f006">Figure 6</xref>) due to land-use weighted <italic>ET</italic> [<xref ref-type="bibr" rid="B19-atmosphere-03-00573">19</xref>]. In applying this relationship, it was assumed that the <italic>ET</italic> modified the absolute humidity of an afternoon CBL that averaged 2,000 m in depth [<xref ref-type="bibr" rid="B47-atmosphere-03-00573">47</xref>]. In the Black soil zone, the mean Bowen ratios for weeks 5 to 10 averaged 0.68 ± 0.04, 0.50 ± 0.07 and 0.44 ± 0.06 for 1976, 2001 and 20xx, respectively. In the Dark Brown soil zone, they averaged 1.55 ± 0.02, 1.25 ± 0.32 and 1.23 ± 0.16, and they averaged 1.90 ± 0.18, 1.82 ± 0.06 and 1.72 ± 0.04 in the Brown soil zone for 1976, 2001 and 20xx, respectively. The average solar-noon global radiation values were around 780, 850, 860 W·m<sup>−2</sup> in the Black, Dark Brown and Brown soil zones, respectively. The corresponding average daily reductions in LI (ΔLI ± sd) during this foliar expansion and reproductive period for annual field crops were −1.61 ± 0.18 in 1976, −1.77 ± 0.14 in 2001 and −1.89 ± 0.16 in 20xx in the Black soil zone; −1.23 ± 0.23, −1.29 ± 0.29, and −1.36 ± 0.3 in the Dark Brown soil zone, and −1.13 ± 0.20, −1.19 ± 0.24, and −1.24 ± 0.29, respectively in the Brown soil zone. These results indicate that in all soil zones, during the foliar expansion and reproductive period for annual crops (mid-growing season weeks 5 to 10), the probability-of-occurrence of moist deep convection, and its intensity if it occurred, would be the lowest in 1976 (maximum summerfallow area), and the highest in 20xx when all of the potential agricultural areas have been seeded to annual crops. </p>
    </sec>
    <sec sec-type="discussion">
      <title>4. Discussion and Conclusions</title>
      <p>Our results are consistent with earlier land-use studies conducted for the Canadian Prairies. Raddatz [<xref ref-type="bibr" rid="B27-atmosphere-03-00573">27</xref>] reported that 60–75% of the <italic>Rn</italic> was partitioned into <italic>Q<sub>E</sub></italic> by perennial forages, and 75–85% by annual crops in wetter areas, and about 60% for both perennial forages and annual crops in drier areas. Gameda <italic>et al.</italic> [<xref ref-type="bibr" rid="B7-atmosphere-03-00573">7</xref>] reported a shift in the energy budget from <italic>Q<sub>H</sub></italic> to <italic>Q<sub>E</sub></italic> with a decrease in summerfallow area. In our study, land-use weighted <italic>ET</italic> was the highest in the Black soil zone followed by the Dark Brown and Brown soil zones. In 2001, <italic>ET</italic> in the Black soil zone was, on averaged, 10% higher than in 1976; in 20xx it was 13% higher than 1976. The increases were slightly less in the Dark Brown soil zone and even less for the Brown soil zone (<xref ref-type="table" rid="atmosphere-03-00573-t003">Table 3</xref>). </p>
      <table-wrap id="atmosphere-03-00573-t003" position="float">
        <object-id pub-id-type="pii">atmosphere-03-00573-t003_Table 3</object-id>
        <label>Table 3</label>
        <caption>
          <p>Land-use weighted evapotranspiration (mm) during the growing season <sup>†</sup> in the three soil zones of the Canadian Prairies. </p>
        </caption>
        <table>
          <thead>
            <tr>
              <th rowspan="2" align="center" valign="middle">Soil zone</th>
              <th colspan="3" align="center" valign="middle">Year</th>
              <th align="center" valign="middle"/>
              <th colspan="2" align="center" valign="middle">% Change compared to 1976</th>
            </tr>
            <tr>
              <th align="center" valign="middle" style="border-top: solid thin">1976</th>
              <th align="center" valign="middle" style="border-top: solid thin">2001</th>
              <th align="center" valign="middle" style="border-top: solid thin">20xx</th>
              <th align="center" valign="middle"/>
              <th align="center" valign="middle" style="border-top: solid thin">2001</th>
              <th align="center" valign="middle" style="border-top: solid thin">20xx</th>
            </tr>
  </thead>
          <tbody>
            <tr>
              <td align="center" valign="middle">Black</td>
              <td align="center" valign="middle">244</td>
              <td align="center" valign="middle">269</td>
              <td align="center" valign="middle">277</td>
              <td align="center" valign="middle"/>
              <td align="center" valign="middle">10</td>
              <td align="center" valign="middle">13</td>
            </tr>
            <tr>
              <td align="center" valign="middle">Dark Brown</td>
              <td align="center" valign="middle">169</td>
              <td align="center" valign="middle">182</td>
              <td align="center" valign="middle">191</td>
              <td align="center" valign="middle"/>
              <td align="center" valign="middle">8</td>
              <td align="center" valign="middle">13</td>
            </tr>
            <tr>
              <td align="center" valign="middle">Brown</td>
              <td align="center" valign="middle">159</td>
              <td align="center" valign="middle">166</td>
              <td align="center" valign="middle">173</td>
              <td align="center" valign="middle"/>
              <td align="center" valign="middle">4</td>
              <td align="center" valign="middle">9</td>
            </tr>
          </tbody>
        </table>
		<table-wrap-foot>
			<fn>
      <p><sup>†</sup> Growing season was 14 weeks from the last-week of May to the first-week of September (week #1 is the last week of May, week #2 is the first week of June and so on with week #14 the first week of September).</p>
			</fn>
			</table-wrap-foot>
      </table-wrap>
      <p>The land-use weighted mean Bowen ratios values were generally the largest in 1976, and the smallest in 20xx throughout the growing season at all locations. This illustrates the influence that the relative areas of the three vegetation types had on surface energy partitioning. During the foliar expansion and reproductive period for annual field crops, the mean Bowen ratios were around 0.5 in the Black soil zone (<xref ref-type="fig" rid="atmosphere-03-00573-f005">Figure 5</xref>). In the Dark Brown soil zone, the average Bowen ratio was around 1.0 during the same period. In contrast, the Bowen ratios in the Brown soil zone were higher than 1.0 during the entire growing season indicating that <italic>Q<sub>E</sub></italic> was always equal to or less than <italic>Q<sub>H</sub></italic> in this soil zone. Soils in the Black soil zone are usually the wettest and in the Brown soil zone soils are usually the driest [<xref ref-type="bibr" rid="B48-atmosphere-03-00573">48</xref>,<xref ref-type="bibr" rid="B49-atmosphere-03-00573">49</xref>]. Thus, differences in available water for <italic>ET</italic> likely led to the differences in land-use weighted mean Bowen ratios between soil zones. A change in land-use from the maximum summerfallow area in 1976 to a potential future maximum crop area in 20xx, where all except the unimproved grasslands have been seeded to annual crops, had a greater impact on the ΔLI, and in turn, on the probability-of-occurrence and intensity of moist deep convection in the generally wetter Black soil zone than in either the Dark Brown or the Brown soil zones. </p>
      <p>A multi-model assessment of land-atmosphere coupling strength, the Global Land-Atmosphere Coupling Experiment [<xref ref-type="bibr" rid="B50-atmosphere-03-00573">50</xref>], identified regions where soil moisture anomalies have a substantial impact on summer rainfall. These ‘‘hot spots’’ include portions of the Canadian Prairies. Hot spots are generally areas where adding moisture to the atmospheric boundary layer can lead to moist deep convection, and where <italic>ET</italic> is relatively high but still sensitive to soil moisture. Our results support this assessment. Our conclusion about reduce summerfallow area leading to lower Bowen ratios and increased CAPE, especially in the Black soil zone, are consistent with the observed increase in the frequency of lightning during the growing season from 1999 to 2008 [<xref ref-type="bibr" rid="B51-atmosphere-03-00573">51</xref>] at Edmonton and Brandon (Black soil zone). The increase was two to three times greater than the increase at Lethbridge (Dark Brown soil zone) [<xref ref-type="bibr" rid="B51-atmosphere-03-00573">51</xref>]. </p>
      <p>Raddatz and Hanesiak [<xref ref-type="bibr" rid="B52-atmosphere-03-00573">52</xref>] evaluated significant summer rain events on the Canadian Prairies from 2000 to 2004, and found that 79% of the events were solely or partially convective. Gameda <italic>et al.</italic> [<xref ref-type="bibr" rid="B53-atmosphere-03-00573">53</xref>] found a significant increase in daytime cloud cover between 1972 and 2002, a period corresponding to declining summerfallow area. Several researchers have reported an increase in precipitation, and the frequency of rainfall events [<xref ref-type="bibr" rid="B54-atmosphere-03-00573">54</xref>,<xref ref-type="bibr" rid="B55-atmosphere-03-00573">55</xref>,<xref ref-type="bibr" rid="B56-atmosphere-03-00573">56</xref>,<xref ref-type="bibr" rid="B57-atmosphere-03-00573">57</xref>] on the Canadian Prairies. Cutforth [<xref ref-type="bibr" rid="B58-atmosphere-03-00573">58</xref>] found that the annual rainfall amount and frequency-of-occurrence have increased since the 1970s in the Brown soil zone. Our findings suggest that the recent changes in the rainfall regime of the Canadian Prairies may be due, in part, to the land-use change from a crop rotation that includes summerfallow to continuous cropping. While larger CAPE due to increased land-use weighted <italic>ET</italic> does not guarantee more precipitation, all else being equal, it does increase its probability-of-occurrence, and larger CAPE may increase the intensity of moist deep convection, if it occurs. </p>
      <p>There are several potential sources of uncertainties associated with our results. The FAO method of estimating net radiation, and the adjustment factor derived from the observed and the calculated net radiation at Lethbridge is inexact. Lethbridge is in the Dark Brown soil zone, and the adjustment factor may not be appropriate for the Black and Brown soil zones. The assumptions regarding both the physical and the biological parameters (soil moisture, soil heat capacity, thermal conductivity, surface albedo, and the water demand of plants at different stages of crop growth) may have influenced the accuracy of our Bowen ratio estimates. More detailed site-specific information about the vegetation and the soil moisture parameters would have improved the modeling of <italic>ET</italic> [<xref ref-type="bibr" rid="B59-atmosphere-03-00573">59</xref>]. Further analysis with more spatial and temporal resolution might help to fine tune our results. </p>
      <p>In summary, this analysis has shown that the trend to continuous cropping (reduction in summerfallow acreage) on Canadian Prairies has already had an impact on land-use weighted <italic>ET</italic>. By lowering the Bowen ratios, this land-use change has and will influence the probability-of-occurrence of moist deep convection and its intensity when it occurs (<italic>i.e.</italic>, convective clouds with associated rainfall and severe weather). The impact of reduced summerfallow area was greater in the wetter Black soil zone than in the drier Dark Brown and Brown soil zones. In 1976 (maximum summerfallow area), Bowen ratios were the highest, thus the probability-of-occurrence of moist deep convection was the lowest. In 2001, the trend to continuous cropping had increased the land-use weighted <italic>ET</italic> and lowered the Bowen ratios, thereby increasing the probability-of-occurrence of moist deep convection, and possibly its intensity. <italic>ET</italic> would increase further, and the Bowen ratios would be even smaller if all of the arable land in the Canadian Prairies were planted to annual crops. This could further increase the probabilities-of-occurrence and intensity of moist deep convection. </p>
    </sec>
  </body>
  <back>
    <ack>
      <title>Acknowledgements</title>
      <p>We acknowledge Dirk Anderson, AAFC Ottawa for technical assistance. Similarly, we would like to thank Elizabeth Pattey for providing data to test the FAO method. The senior author acknowledges the NAHARP program for the opportunity given to work as a NSERC visiting fellow at Agriculture and Agri-food Canada, Ottawa.</p>
    </ack>
    <ref-list>
      <title>References</title>
      <ref id="B1-atmosphere-03-00573">
        <label>1.</label>
        <citation citation-type="book">
          <person-group person-group-type="author">
            <name>
              <surname>Msangi</surname>
              <given-names>S.</given-names>
            </name>
            <name>
              <surname>Sulser</surname>
              <given-names>T.</given-names>
            </name>
            <name>
              <surname>Rosegrant</surname>
              <given-names>M.</given-names>
            </name>
            <name>
              <surname>Valmonte-Santos</surname>
              <given-names>R.</given-names>
            </name>
          </person-group>
          <article-title>Global Scenarios for Biofuels: Impacts and Implications for Food Security and Water Use</article-title>
          <source>Tenth Annual Conference on Global Economic Analysis</source>
          <publisher-name>Purdue University</publisher-name>
          <publisher-loc>West Lafayette, IN, USA</publisher-loc>
          <year>2007</year>
        </citation>
      </ref>
      <ref id="B2-atmosphere-03-00573">
        <label>2.</label>
        <citation citation-type="journal">
          <person-group person-group-type="author">
            <name>
              <surname>Dumanski</surname>
              <given-names>J.</given-names>
            </name>
            <name>
              <surname>Desjardins</surname>
              <given-names>R.L.</given-names>
            </name>
            <name>
              <surname>Tarnocai</surname>
              <given-names>C.</given-names>
            </name>
            <name>
              <surname>Monreal</surname>
              <given-names>C.</given-names>
            </name>
            <name>
              <surname>Gregorich</surname>
              <given-names>E.G.</given-names>
            </name>
            <name>
              <surname>Kirkwood</surname>
              <given-names>V.</given-names>
            </name>
            <name>
              <surname>Campbell</surname>
              <given-names>C.A.</given-names>
            </name>
          </person-group>
          <article-title>Possibilities for future carbon sequestration in canadian agriculture in relation to land use changes</article-title>
          <source>Climatic Change</source>
          <year>1998</year>
          <volume>40</volume>
          <fpage>81</fpage>
          <lpage>103</lpage>
          <pub-id pub-id-type="doi">10.1023/A:1005390815340</pub-id>
        </citation>
      </ref>
      <ref id="B3-atmosphere-03-00573">
        <label>3.</label>
        <citation citation-type="journal">
          <person-group person-group-type="author">
            <name>
              <surname>Adegoke</surname>
              <given-names>J.O.</given-names>
            </name>
            <name>
              <surname>Pielke</surname>
              <given-names>R.</given-names>
              <suffix>Sr.</suffix>
            </name>
            <name>
              <surname>Carleton</surname>
              <given-names>A.M.</given-names>
            </name>
          </person-group>
          <article-title>Observational and modeling studies of the impacts of agriculture-related land use change on planetary boundary layer processes in the central US</article-title>
          <source>Agri. Forest Meteorol.</source>
          <year>2007</year>
          <volume>142</volume>
          <fpage>203</fpage>
          <lpage>215</lpage>
          <pub-id pub-id-type="doi">10.1016/j.agrformet.2006.07.013</pub-id>
        </citation>
      </ref>
      <ref id="B4-atmosphere-03-00573">
        <label>4.</label>
        <citation citation-type="journal">
          <person-group person-group-type="author">
            <name>
              <surname>Beltrán-Przekurat</surname>
              <given-names>A.</given-names>
            </name>
            <name>
              <surname>Pielke</surname>
              <given-names>R.A.</given-names>
              <suffix>Sr.</suffix>
            </name>
            <name>
              <surname>Eastman</surname>
              <given-names>J.L.</given-names>
            </name>
            <name>
              <surname>Coughenour</surname>
              <given-names>M.B.</given-names>
            </name>
          </person-group>
          <article-title>Modelling the effects of land-use/land-cover changes on the near-surface atmosphere in Southern South America</article-title>
          <source>Int. J. Climatol.</source>
          <year>2012</year>
          <volume>32</volume>
          <fpage>1206</fpage>
          <lpage>1225</lpage>
          <pub-id pub-id-type="doi">10.1002/joc.2346</pub-id>
        </citation>
      </ref>
      <ref id="B5-atmosphere-03-00573">
        <label>5.</label>
        <citation citation-type="journal">
          <person-group person-group-type="author">
            <name>
              <surname>Betts</surname>
              <given-names>R.A.</given-names>
            </name>
            <name>
              <surname>Falloon</surname>
              <given-names>P.D.</given-names>
            </name>
            <name>
              <surname>Goldewijk</surname>
              <given-names>K.K.</given-names>
            </name>
            <name>
              <surname>Ramankutty</surname>
              <given-names>N.</given-names>
            </name>
          </person-group>
          <article-title>Biogeophysical effects of land use on climate: Model simulations of radiative forcing and large-scale temperature change</article-title>
          <source>Agri. Forest Meteorol.</source>
          <year>2007</year>
          <volume>142</volume>
          <fpage>216</fpage>
          <lpage>233</lpage>
          <pub-id pub-id-type="doi">10.1016/j.agrformet.2006.08.021</pub-id>
        </citation>
      </ref>
      <ref id="B6-atmosphere-03-00573">
        <label>6.</label>
        <citation citation-type="journal">
          <person-group person-group-type="author">
            <name>
              <surname>Chase</surname>
              <given-names>T.N.</given-names>
            </name>
            <name>
              <surname>Pielke</surname>
              <given-names>R.A.</given-names>
              <suffix>Sr.</suffix>
            </name>
            <name>
              <surname>Kittel</surname>
              <given-names>T.G.F.</given-names>
            </name>
            <name>
              <surname>Nemani</surname>
              <given-names>R.R.</given-names>
            </name>
            <name>
              <surname>Running</surname>
              <given-names>S.W.</given-names>
            </name>
          </person-group>
          <article-title>Simulated impacts of historical land cover changes on global climate in northern winter</article-title>
          <source>Clim. Dynam.</source>
          <year>2000</year>
          <volume>16</volume>
          <fpage>93</fpage>
          <lpage>105</lpage>
          <pub-id pub-id-type="doi">10.1007/s003820050007</pub-id>
        </citation>
      </ref>
      <ref id="B7-atmosphere-03-00573">
        <label>7.</label>
        <citation citation-type="journal">
          <person-group person-group-type="author">
            <name>
              <surname>Gameda</surname>
              <given-names>S.</given-names>
            </name>
            <name>
              <surname>Qian</surname>
              <given-names>B.</given-names>
            </name>
            <name>
              <surname>Campbell</surname>
              <given-names>C.A.</given-names>
            </name>
            <name>
              <surname>Desjardins</surname>
              <given-names>R.L.</given-names>
            </name>
          </person-group>
          <article-title>Climatic trends associated with summerfallow in the Canadian prairies</article-title>
          <source>Agri. Forest Meteorol.</source>
          <year>2007</year>
          <volume>142</volume>
          <fpage>170</fpage>
          <lpage>185</lpage>
          <pub-id pub-id-type="doi">10.1016/j.agrformet.2006.03.026</pub-id>
        </citation>
      </ref>
      <ref id="B8-atmosphere-03-00573">
        <label>8.</label>
        <citation citation-type="journal">
          <person-group person-group-type="author">
            <name>
              <surname>Pielke</surname>
              <given-names>R.A.</given-names>
              <suffix>Sr.</suffix>
            </name>
            <name>
              <surname>Adegoke</surname>
              <given-names>J.O.</given-names>
            </name>
            <name>
              <surname>Chase</surname>
              <given-names>T.N.</given-names>
            </name>
            <name>
              <surname>Marshall</surname>
              <given-names>C.H.</given-names>
            </name>
            <name>
              <surname>Matsui</surname>
              <given-names>T.</given-names>
            </name>
            <name>
              <surname>Niyogi</surname>
              <given-names>D.</given-names>
            </name>
          </person-group>
          <article-title>A new paradigm for assessing the role of agriculture in the climate system and in climate change</article-title>
          <source>Agri. Forest Meteorol.</source>
          <year>2007</year>
          <volume>142</volume>
          <fpage>234</fpage>
          <lpage>254</lpage>
          <pub-id pub-id-type="doi">10.1016/j.agrformet.2006.06.012</pub-id>
        </citation>
      </ref>
      <ref id="B9-atmosphere-03-00573">
        <label>9.</label>
        <citation citation-type="journal">
          <person-group person-group-type="author">
            <name>
              <surname>Raddatz</surname>
              <given-names>R.L.</given-names>
            </name>
          </person-group>
          <article-title>Evidence for the influence of agriculture on weather and climate through the transformation and management of vegetation: Illustrated by examples from the canadian prairies</article-title>
          <source>Agri. Forest Meteorol.</source>
          <year>2007</year>
          <volume>142</volume>
          <fpage>186</fpage>
          <lpage>202</lpage>
          <pub-id pub-id-type="doi">10.1016/j.agrformet.2006.08.022</pub-id>
        </citation>
      </ref>
      <ref id="B10-atmosphere-03-00573">
        <label>10.</label>
        <citation citation-type="journal">
          <person-group person-group-type="author">
            <name>
              <surname>Pielke</surname>
              <given-names>R.A.</given-names>
              <suffix>Sr.</suffix>
            </name>
            <name>
              <surname>Pitman</surname>
              <given-names>A.</given-names>
            </name>
            <name>
              <surname>Niyogi</surname>
              <given-names>D.</given-names>
            </name>
            <name>
              <surname>Mahmood</surname>
              <given-names>R.</given-names>
            </name>
            <name>
              <surname>McAlpine</surname>
              <given-names>C.</given-names>
            </name>
            <name>
              <surname>Hossain</surname>
              <given-names>F.</given-names>
            </name>
            <name>
              <surname>Goldewijk</surname>
              <given-names>K.K.</given-names>
            </name>
            <name>
              <surname>Nair</surname>
              <given-names>U.</given-names>
            </name>
            <name>
              <surname>Betts</surname>
              <given-names>R.</given-names>
            </name>
            <name>
              <surname>Fall</surname>
              <given-names>S.</given-names>
            </name>
            <etal/>
          </person-group>
          <article-title>Land use/land cover changes and climate: Modeling analysis and observational evidence</article-title>
          <source>WIREs Clim. Change</source>
          <year>2011</year>
          <volume>2</volume>
          <fpage>828</fpage>
          <lpage>850</lpage>
          <pub-id pub-id-type="doi">10.1002/wcc.144</pub-id>
        </citation>
      </ref>
      <ref id="B11-atmosphere-03-00573">
        <label>11.</label>
        <citation citation-type="journal">
          <person-group person-group-type="author">
            <name>
              <surname>Nair</surname>
              <given-names>U.S.</given-names>
            </name>
            <name>
              <surname>Wu</surname>
              <given-names>Y.</given-names>
            </name>
            <name>
              <surname>Kala</surname>
              <given-names>J.</given-names>
            </name>
            <name>
              <surname>Lyons</surname>
              <given-names>T.J.</given-names>
            </name>
            <name>
              <surname>Pielke</surname>
              <given-names>R.A.</given-names>
              <suffix>Sr.</suffix>
            </name>
            <name>
              <surname>Hacker</surname>
              <given-names>J.M.</given-names>
            </name>
          </person-group>
          <article-title>The Role of land use change on the development and evolution of the west coast trough, convective clouds, and precipitation in Southwest Australia</article-title>
          <source>J. Geophys. Res.</source>
          <year>2011</year>
          <pub-id pub-id-type="doi">10.1029/2010JD014950</pub-id>
        </citation>
      </ref>
      <ref id="B12-atmosphere-03-00573">
        <label>12.</label>
        <citation citation-type="journal">
          <person-group person-group-type="author">
            <name>
              <surname>Desjardins</surname>
              <given-names>R.L.</given-names>
            </name>
            <name>
              <surname>Sivakumar</surname>
              <given-names>M.V.K.</given-names>
            </name>
            <name>
              <surname>de Kimpe</surname>
              <given-names>C.</given-names>
            </name>
          </person-group>
          <article-title>The contribution of agriculture to the state of climate: Workshop summary and recommendations</article-title>
          <source>Agri. Forest Meteorol.</source>
          <year>2007</year>
          <volume>142</volume>
          <fpage>314</fpage>
          <lpage>324</lpage>
          <pub-id pub-id-type="doi">10.1016/j.agrformet.2006.07.011</pub-id>
        </citation>
      </ref>
      <ref id="B13-atmosphere-03-00573">
        <label>13.</label>
        <citation citation-type="book">
          <person-group person-group-type="author">
            <name>
              <surname>Solomon</surname>
              <given-names>S.</given-names>
            </name>
            <name>
              <surname>Qin</surname>
              <given-names>D.</given-names>
            </name>
            <name>
              <surname>Manning</surname>
              <given-names>M.</given-names>
            </name>
            <name>
              <surname>Chen</surname>
              <given-names>Z.</given-names>
            </name>
            <name>
              <surname>Marquis</surname>
              <given-names>M.</given-names>
            </name>
            <name>
              <surname>Averyt</surname>
              <given-names>K.B.</given-names>
            </name>
            <name>
              <surname>Tignor</surname>
              <given-names>M.</given-names>
            </name>
            <name>
              <surname>Miller</surname>
              <given-names>H.L.</given-names>
            </name>
          </person-group>
          <source>Contribution of Working Group I to the Fourth Assessment Report of the Intergovernmental Panel on Climate Change, 2007</source>
          <publisher-name>Cambridge University Press</publisher-name>
          <publisher-loc>Cambridge, UK</publisher-loc>
          <year>2007</year>
        </citation>
      </ref>
      <ref id="B14-atmosphere-03-00573">
        <label>14.</label>
        <citation citation-type="journal">
          <person-group person-group-type="author">
            <name>
              <surname>Avila</surname>
              <given-names>F.B.</given-names>
            </name>
            <name>
              <surname>Pitman</surname>
              <given-names>A.J.</given-names>
            </name>
            <name>
              <surname>Donat</surname>
              <given-names>M.G.</given-names>
            </name>
            <name>
              <surname>Alexander</surname>
              <given-names>L.V.</given-names>
            </name>
            <name>
              <surname>Abramowitz</surname>
              <given-names>G.</given-names>
            </name>
          </person-group>
          <article-title>Climate model simulated changes in temperature extremes due to land cover change</article-title>
          <source>J. Geophys. Res.</source>
          <year>2012</year>
          <pub-id pub-id-type="doi">10.1029/2011JD016382</pub-id>
        </citation>
      </ref>
      <ref id="B15-atmosphere-03-00573">
        <label>15.</label>
        <citation citation-type="journal">
          <person-group person-group-type="author">
            <name>
              <surname>Pitman</surname>
              <given-names>A.J.</given-names>
            </name>
            <name>
              <surname>Avila</surname>
              <given-names>F.B.</given-names>
            </name>
            <name>
              <surname>Abramowitz</surname>
              <given-names>G.</given-names>
            </name>
            <name>
              <surname>Wang</surname>
              <given-names>Y.P.</given-names>
            </name>
            <name>
              <surname>Phipps</surname>
              <given-names>S.J.</given-names>
            </name>
            <name>
              <surname>de Noblet-Ducoudre</surname>
              <given-names>N.</given-names>
            </name>
          </person-group>
          <article-title>Importance of background climate in determining impact of land-cover change on regional climate</article-title>
          <source>Nature Clim. Change</source>
          <year>2011</year>
          <volume>1</volume>
          <fpage>472</fpage>
          <lpage>475</lpage>
          <pub-id pub-id-type="doi">10.1038/nclimate1294</pub-id>
        </citation>
      </ref>
      <ref id="B16-atmosphere-03-00573">
        <label>16.</label>
        <citation citation-type="journal">
          <person-group person-group-type="author">
            <name>
              <surname>Lee</surname>
              <given-names>S.-H.</given-names>
            </name>
            <name>
              <surname>Kimura</surname>
              <given-names>F.</given-names>
            </name>
          </person-group>
          <article-title>Comparative studies in the local circulations induced by land-use and by topography</article-title>
          <source>Bound. Lay. Meteorol.</source>
          <year>2001</year>
          <volume>101</volume>
          <fpage>157</fpage>
          <lpage>182</lpage>
          <pub-id pub-id-type="doi">10.1023/A:1019219412907</pub-id>
        </citation>
      </ref>
      <ref id="B17-atmosphere-03-00573">
        <label>17.</label>
        <citation citation-type="journal">
          <person-group person-group-type="author">
            <name>
              <surname>Clark</surname>
              <given-names>C.A.</given-names>
            </name>
            <name>
              <surname>Arritt</surname>
              <given-names>R.W.</given-names>
            </name>
          </person-group>
          <article-title>Numerical simulations of the effect of soil moisture and vegetation cover on the development of deep convection</article-title>
          <source>J. Appl. Meteor.</source>
          <year>1995</year>
          <volume>34</volume>
          <fpage>2030</fpage>
          <lpage>2045</lpage>
        </citation>
      </ref>
      <ref id="B18-atmosphere-03-00573">
        <label>18.</label>
        <citation citation-type="book">
          <person-group person-group-type="author">
            <name>
              <surname>Weisman</surname>
              <given-names>M.L.</given-names>
            </name>
            <name>
              <surname>Klemp</surname>
              <given-names>J.B.</given-names>
            </name>
          </person-group>
          <article-title>Characteristics of Isolated Convective Storms in Mesoscale Meteorology and Forecasting</article-title>
          <source>Mesoscale Meteorology and Forecasting</source>
          <person-group person-group-type="editor">
            <name>
              <surname>Ray</surname>
              <given-names>P.S.</given-names>
            </name>
          </person-group>
          <publisher-name>American Meteorological Society</publisher-name>
          <publisher-loc>Boston, MA, USA</publisher-loc>
          <year>1986</year>
          <fpage>331</fpage>
          <lpage>358</lpage>
        </citation>
      </ref>
      <ref id="B19-atmosphere-03-00573">
        <label>19.</label>
        <citation citation-type="journal">
          <person-group person-group-type="author">
            <name>
              <surname>Pielke</surname>
              <given-names>R.A.</given-names>
              <suffix>Sr.</suffix>
            </name>
          </person-group>
          <article-title>Influence of the spatial distribution of vegetation and soils on the prediction of cumulus convective rainfall</article-title>
          <source>Rev. Geophys.</source>
          <year>2001</year>
          <volume>39</volume>
          <fpage>151</fpage>
          <lpage>177</lpage>
          <pub-id pub-id-type="doi">10.1029/1999RG000072</pub-id>
        </citation>
      </ref>
      <ref id="B20-atmosphere-03-00573">
        <label>20.</label>
        <citation citation-type="book">
          <person-group person-group-type="author">
            <name>
              <surname>Oke</surname>
              <given-names>T.R.</given-names>
            </name>
          </person-group>
          <source>Boundary Layer Climates</source>
          <edition>2nd</edition>
          <publisher-name>Routledge</publisher-name>
          <publisher-loc>London, UK</publisher-loc>
          <year>1987</year>
          <fpage>435</fpage>
        </citation>
      </ref>
      <ref id="B21-atmosphere-03-00573">
        <label>21.</label>
        <citation citation-type="journal">
          <person-group person-group-type="author">
            <name>
              <surname>Mahrt</surname>
              <given-names>L.</given-names>
            </name>
            <name>
              <surname>Pierce</surname>
              <given-names>D.</given-names>
            </name>
          </person-group>
          <article-title>Relationship of moist convection to boundary-layer properties: Application to a semiarid region (Colorado)</article-title>
          <source>Mon. Weather Rev.</source>
          <year>1980</year>
          <volume>108</volume>
          <fpage>1810</fpage>
          <lpage>1815</lpage>
          <pub-id pub-id-type="doi">10.1175/1520-0493(1980)108&lt;1810:ROMCTB&gt;2.0.CO;2</pub-id>
        </citation>
      </ref>
      <ref id="B22-atmosphere-03-00573">
        <label>22.</label>
        <citation citation-type="journal">
          <person-group person-group-type="author">
            <name>
              <surname>Rabin</surname>
              <given-names>R.M.</given-names>
            </name>
            <name>
              <surname>Stensrud</surname>
              <given-names>D.J.</given-names>
            </name>
            <name>
              <surname>Stadler</surname>
              <given-names>S.</given-names>
            </name>
            <name>
              <surname>Wetzel</surname>
              <given-names>P.J.</given-names>
            </name>
            <name>
              <surname>Gregory</surname>
              <given-names>M.</given-names>
            </name>
          </person-group>
          <article-title>Observed effects of landscape variability on convective clouds</article-title>
          <source>Bull. Amer. Meteorol. Soc.</source>
          <year>1990</year>
          <volume>71</volume>
          <fpage>272</fpage>
          <lpage>280</lpage>
          <pub-id pub-id-type="doi">10.1175/1520-0477(1990)071&lt;0272:OEOLVO&gt;2.0.CO;2</pub-id>
        </citation>
      </ref>
      <ref id="B23-atmosphere-03-00573">
        <label>23.</label>
        <citation citation-type="journal">
          <person-group person-group-type="author">
            <name>
              <surname>Segal</surname>
              <given-names>M.</given-names>
            </name>
            <name>
              <surname>Arritt</surname>
              <given-names>R.W.</given-names>
            </name>
            <name>
              <surname>Clark</surname>
              <given-names>C.</given-names>
            </name>
            <name>
              <surname>Rabin</surname>
              <given-names>R.</given-names>
            </name>
            <name>
              <surname>Brown</surname>
              <given-names>J.</given-names>
            </name>
          </person-group>
          <article-title>Scaling evaluation of the effect of surface characteristics on potential for deep convection over uniform terrain</article-title>
          <source>Mon. Weather Rev.</source>
          <year>1995</year>
          <volume>123</volume>
          <fpage>383</fpage>
          <lpage>400</lpage>
          <pub-id pub-id-type="doi">10.1175/1520-0493(1995)123&lt;0383:SEOTEO&gt;2.0.CO;2</pub-id>
        </citation>
      </ref>
      <ref id="B24-atmosphere-03-00573">
        <label>24.</label>
        <citation citation-type="journal">
          <person-group person-group-type="author">
            <name>
              <surname>Zawadzki</surname>
              <given-names>I.</given-names>
            </name>
            <name>
              <surname>Torlaschi</surname>
              <given-names>E.</given-names>
            </name>
            <name>
              <surname>Sauvageau</surname>
              <given-names>R.</given-names>
            </name>
          </person-group>
          <article-title>The relationship between mesoscale thermodynamic variables and convective precipitation</article-title>
          <source>J. Atmos. Sci.</source>
          <year>1981</year>
          <volume>38</volume>
          <fpage>1535</fpage>
          <lpage>1540</lpage>
          <pub-id pub-id-type="doi">10.1175/1520-0469(1981)038&lt;1535:TRBMTV&gt;2.0.CO;2</pub-id>
        </citation>
      </ref>
      <ref id="B25-atmosphere-03-00573">
        <label>25.</label>
        <citation citation-type="journal">
          <person-group person-group-type="author">
            <name>
              <surname>Blanchard</surname>
              <given-names>D.O.</given-names>
            </name>
          </person-group>
          <article-title>Assessing the vertical distribution of convective available potential energy</article-title>
          <source>Weather Forecast.</source>
          <year>1998</year>
          <volume>13</volume>
          <fpage>870</fpage>
          <lpage>877</lpage>
          <pub-id pub-id-type="doi">10.1175/1520-0434(1998)013&lt;0870:ATVDOC&gt;2.0.CO;2</pub-id>
        </citation>
      </ref>
      <ref id="B26-atmosphere-03-00573">
        <label>26.</label>
        <citation citation-type="journal">
          <person-group person-group-type="author">
            <name>
              <surname>Galway</surname>
              <given-names>J.G.</given-names>
            </name>
          </person-group>
          <article-title>The lifted index as a predictor of latent instability</article-title>
          <source>Bull. Amer. Meteor. Soc.</source>
          <year>1956</year>
          <volume>37</volume>
          <fpage>528</fpage>
          <lpage>529</lpage>
        </citation>
      </ref>
      <ref id="B27-atmosphere-03-00573">
        <label>27.</label>
        <citation citation-type="journal">
          <person-group person-group-type="author">
            <name>
              <surname>Raddatz</surname>
              <given-names>R.L.</given-names>
            </name>
          </person-group>
          <article-title>Anthropogenic vegetation transformation and the potential for deep convection on the canadian prairies</article-title>
          <source>Can. J. Soil Sci.</source>
          <year>1998</year>
          <volume>78</volume>
          <fpage>657</fpage>
          <lpage>666</lpage>
          <pub-id pub-id-type="doi">10.4141/S98-011</pub-id>
        </citation>
      </ref>
      <ref id="B28-atmosphere-03-00573">
        <label>28.</label>
        <citation citation-type="journal">
          <person-group person-group-type="author">
            <name>
              <surname>Raddatz</surname>
              <given-names>R.L.</given-names>
            </name>
          </person-group>
          <article-title>An operational agrometeorological information system for the canadian prairies</article-title>
          <source>Climatol. Bull.</source>
          <year>1989</year>
          <volume>23</volume>
          <fpage>83</fpage>
          <lpage>97</lpage>
        </citation>
      </ref>
      <ref id="B29-atmosphere-03-00573">
        <label>29.</label>
        <citation citation-type="journal">
          <person-group person-group-type="author">
            <name>
              <surname>Raddatz</surname>
              <given-names>R.L.</given-names>
            </name>
            <name>
              <surname>Cummine</surname>
              <given-names>J.D.</given-names>
            </name>
          </person-group>
          <article-title>Inter-annual variability of moisture flux from the prairie agro-ecosystem: Impact of crop phenology on the seasonal pattern of tornado days</article-title>
          <source>Bound. Lay. Meteorol.</source>
          <year>2003</year>
          <volume>106</volume>
          <fpage>283</fpage>
          <lpage>295</lpage>
          <pub-id pub-id-type="doi">10.1023/A:1021117925505</pub-id>
        </citation>
      </ref>
      <ref id="B30-atmosphere-03-00573">
        <label>30.</label>
        <citation citation-type="web">
          <collab>Statistics Canada</collab>
          <article-title>Preliminary Estimates of Principal Field Crop Areas</article-title>
          <access-date>(accessed on 7 December 2012)</access-date>
          <comment>Available online:<ext-link xmlns:xlink="http://www.w3.org/1999/xlink" xlink:href="www.statcan.gc.ca/daily-quotidien/120627/t120627a001-eng.htm" ext-link-type="uri">www.statcan.gc.ca/daily-quotidien/120627/t120627a001-eng.htm</ext-link></comment>
        </citation>
      </ref>
      <ref id="B31-atmosphere-03-00573">
        <label>31.</label>
        <citation citation-type="journal">
          <person-group person-group-type="author">
            <name>
              <surname>Dow</surname>
              <given-names>C.L.</given-names>
            </name>
            <name>
              <surname>de Walle</surname>
              <given-names>D.R.</given-names>
            </name>
          </person-group>
          <article-title>Trends in evaporation and Bowen ratio on urbanizing watersheds in Eastern United States</article-title>
          <source>Water Resour. Res.</source>
          <year>2000</year>
          <volume>36</volume>
          <fpage>1835</fpage>
          <lpage>1843</lpage>
          <pub-id pub-id-type="doi">10.1029/2000WR900062</pub-id>
        </citation>
      </ref>
      <ref id="B32-atmosphere-03-00573">
        <label>32.</label>
        <citation citation-type="journal">
          <person-group person-group-type="author">
            <name>
              <surname>Degu</surname>
              <given-names>A.M.</given-names>
            </name>
            <name>
              <surname>Hossain</surname>
              <given-names>F.</given-names>
            </name>
            <name>
              <surname>Niyogi</surname>
              <given-names>D.</given-names>
            </name>
            <name>
              <surname>Pielke</surname>
              <given-names>R.</given-names>
              <suffix>Sr.</suffix>
            </name>
            <name>
              <surname>Shepherd</surname>
              <given-names>J.M.</given-names>
            </name>
            <name>
              <surname>Voisin</surname>
              <given-names>N.</given-names>
            </name>
            <name>
              <surname>Chronis</surname>
              <given-names>T. </given-names>
            </name>
          </person-group>
          <article-title>The influence of large dams on surrounding climate and precipitation patterns</article-title>
          <source>Geophys. Res. Lett.</source>
          <year>2011</year>
          <pub-id pub-id-type="doi">10.1029/2010GL046482</pub-id>
        </citation>
      </ref>
      <ref id="B33-atmosphere-03-00573">
        <label>33.</label>
        <citation citation-type="journal">
          <person-group person-group-type="author">
            <name>
              <surname>Campbell</surname>
              <given-names>C.A.</given-names>
            </name>
            <name>
              <surname>Zentner</surname>
              <given-names>R.P.</given-names>
            </name>
            <name>
              <surname>Gameda</surname>
              <given-names>S.</given-names>
            </name>
            <name>
              <surname>Blomert</surname>
              <given-names>B.</given-names>
            </name>
            <name>
              <surname>Wall</surname>
              <given-names>D.D.</given-names>
            </name>
          </person-group>
          <article-title>Production of annual crops on the canadian praries: trends during 1976–1998</article-title>
          <source>Can. J. Soil Sci.</source>
          <year>2002</year>
          <volume>82</volume>
          <fpage>45</fpage>
          <lpage>57</lpage>
        <pub-id pub-id-type="doi">10.4141/S01-046</pub-id></citation>
      </ref>
      <ref id="B34-atmosphere-03-00573">
        <label>34.</label>
        <citation citation-type="web">
          <collab>Environment Canada</collab>
          <article-title>National Climate Data and Information Archive</article-title>
          <access-date>(accessed on 3 April 2012)</access-date>
          <comment>Available online:<ext-link xmlns:xlink="http://www.w3.org/1999/xlink" xlink:href="climate.weatheroffice.gc.ca/climateData/canada_e.html" ext-link-type="uri">climate.weatheroffice.gc.ca/climateData/canada_e.html</ext-link></comment>
        </citation>
      </ref>
      <ref id="B35-atmosphere-03-00573">
        <label>35.</label>
        <citation citation-type="web">
          <collab>Agriculture and Agri-Food Canada</collab>
          <article-title>AAFC-AAC Real Time Weather Data System</article-title>
          <access-date>(accessed on 27 March 2012)</access-date>
          <comment>Available online:<ext-link xmlns:xlink="http://www.w3.org/1999/xlink" xlink:href="ablethr2/weather/weathermain.aspx?Language=0" ext-link-type="uri">ablethr2/weather/weathermain.aspx?Language=0</ext-link></comment>
        </citation>
      </ref>
      <ref id="B36-atmosphere-03-00573">
        <label>36.</label>
        <citation citation-type="book">
          <person-group person-group-type="author">
            <name>
              <surname>Allen</surname>
              <given-names>R.G.</given-names>
            </name>
            <name>
              <surname>Pereira</surname>
              <given-names>L.S.</given-names>
            </name>
            <name>
              <surname>Raes</surname>
              <given-names>D.</given-names>
            </name>
            <name>
              <surname>Smith</surname>
              <given-names>M.</given-names>
            </name>
          </person-group>
          <source>Crop Evapotranspiration (Guidelines for Computing Crop Water Requirements); FAO Irrigation and Drainage Paper No. 56</source>
          <publisher-name>Food and Agriculture Organization of the United Nations (FAO)</publisher-name>
          <publisher-loc>Rome, Italy</publisher-loc>
          <year>1998</year>
        </citation>
      </ref>
      <ref id="B37-atmosphere-03-00573">
        <label>37.</label>
        <citation citation-type="journal">
          <person-group person-group-type="author">
            <name>
              <surname>Robertson</surname>
              <given-names>G.W.</given-names>
            </name>
          </person-group>
          <article-title>A biometeorological time scale for a cereal crop involving day and night temperatures and photoperiod</article-title>
          <source>Int. J. Biometeorol.</source>
          <year>1968</year>
          <volume>12</volume>
          <fpage>191</fpage>
          <lpage>223</lpage>
          <pub-id pub-id-type="doi">10.1007/BF01553422</pub-id>
        </citation>
      </ref>
      <ref id="B38-atmosphere-03-00573">
        <label>38.</label>
        <citation citation-type="journal">
          <person-group person-group-type="author">
            <name>
              <surname>Baier</surname>
              <given-names>W.</given-names>
            </name>
          </person-group>
          <article-title>Evaluation of latent evaporation estimates and their conversion to potential evaporation</article-title>
          <source>Can. J. Plant. Sci.</source>
          <year>1971</year>
          <volume>51</volume>
          <fpage>255</fpage>
          <lpage>266</lpage>
          <pub-id pub-id-type="doi">10.4141/cjps71-053</pub-id>
        </citation>
      </ref>
      <ref id="B39-atmosphere-03-00573">
        <label>39.</label>
        <citation citation-type="journal">
          <person-group person-group-type="author">
            <name>
              <surname>Hobbs</surname>
              <given-names>E.H.</given-names>
            </name>
            <name>
              <surname>Krogman</surname>
              <given-names>K.K.</given-names>
            </name>
          </person-group>
          <article-title>Observed and estimated evapotranspiration in Southern Alberta</article-title>
          <source>T. ASAE</source>
          <year>1968</year>
          <volume>11</volume>
          <fpage>502</fpage>
          <lpage>503</lpage>
        </citation>
      </ref>
      <ref id="B40-atmosphere-03-00573">
        <label>40.</label>
        <citation citation-type="journal">
          <person-group person-group-type="author">
            <name>
              <surname>Rasmussen</surname>
              <given-names>V.P.</given-names>
            </name>
            <name>
              <surname>Hanks</surname>
              <given-names>R.J.</given-names>
            </name>
          </person-group>
          <article-title>Spring wheat yield model for limited moisture conditions</article-title>
          <source>Agron. J.</source>
          <year>1978</year>
          <volume>70</volume>
          <fpage>940</fpage>
          <lpage>944</lpage>
          <pub-id pub-id-type="doi">10.2134/agronj1978.00021962007000060012x</pub-id>
        </citation>
      </ref>
      <ref id="B41-atmosphere-03-00573">
        <label>41.</label>
        <citation citation-type="journal">
          <person-group person-group-type="author">
            <name>
              <surname>Clothier</surname>
              <given-names>B.E.</given-names>
            </name>
            <name>
              <surname>Clawson</surname>
              <given-names>K.L.</given-names>
            </name>
            <name>
              <surname>Pinter Jr</surname>
              <given-names>P.J.</given-names>
            </name>
            <name>
              <surname>Moran</surname>
              <given-names>M.S.</given-names>
            </name>
            <name>
              <surname>Reginato</surname>
              <given-names>R.J.</given-names>
            </name>
            <name>
              <surname>Jackson</surname>
              <given-names>R.D.</given-names>
            </name>
          </person-group>
          <article-title>Estimation of soil heat flux from net radiation during the growth of Alfalfa</article-title>
          <source>Agri. Forest Meteorol.</source>
          <year>1986</year>
          <volume>37</volume>
          <fpage>319</fpage>
          <lpage>329</lpage>
          <pub-id pub-id-type="doi">10.1016/0168-1923(86)90069-9</pub-id>
        </citation>
      </ref>
      <ref id="B42-atmosphere-03-00573">
        <label>42.</label>
        <citation citation-type="journal">
          <person-group person-group-type="author">
            <name>
              <surname>Santanello</surname>
              <given-names>J.A.</given-names>
            </name>
            <name>
              <surname>Friedl</surname>
              <given-names>M.A.</given-names>
            </name>
          </person-group>
          <article-title>Diurnal covariation in soil heat flux and net radiation</article-title>
          <source>J. Appl. Meteorol.</source>
          <year>2003</year>
          <volume>42</volume>
          <fpage>851</fpage>
          <lpage>862</lpage>
          <pub-id pub-id-type="doi">10.1175/1520-0450(2003)042&lt;0851:DCISHF&gt;2.0.CO;2</pub-id>
        </citation>
      </ref>
      <ref id="B43-atmosphere-03-00573">
        <label>43.</label>
        <citation citation-type="web">
          <collab>Statistics Canada</collab>
          <article-title>Total Farm Area, Land Tenure and Land in Crops, by Province (Census of Agriculture, 1986–2006)</article-title>
          <access-date>(accessed on 27 August 2012)</access-date>
          <comment>Available online:<ext-link xmlns:xlink="http://www.w3.org/1999/xlink" xlink:href="www.statcan.gc.ca/tables-tableaux/sum-som/l01/cst01/agrc25a-eng.htm" ext-link-type="uri">www.statcan.gc.ca/tables-tableaux/sum-som/l01/cst01/agrc25a-eng.htm</ext-link></comment>
        </citation>
      </ref>
      <ref id="B44-atmosphere-03-00573">
        <label>44.</label>
        <citation citation-type="book">
          <collab>Statistics Canada</collab>
          <source>Census of Agriculture. Alberta</source>
          <publisher-name>Agriculture Division, Statistics Canada</publisher-name>
          <publisher-loc>Ottawa, ON, Canada</publisher-loc>
          <year>1977</year>
          <fpage>153</fpage>
        </citation>
      </ref>
      <ref id="B45-atmosphere-03-00573">
        <label>45.</label>
        <citation citation-type="book">
          <collab>Statistics Canada</collab>
          <source>Census of Agriculture. Manitoba</source>
          <publisher-name>Agriculture Division, Statistics Canada</publisher-name>
          <publisher-loc>Ottawa, ON, Canada</publisher-loc>
          <year>1977</year>
          <fpage>177</fpage>
        </citation>
      </ref>
      <ref id="B46-atmosphere-03-00573">
        <label>46.</label>
        <citation citation-type="book">
          <collab>Statistics Canada</collab>
          <source>Census of Agriculture.Saskatchewan</source>
          <publisher-name>Agriculture Division, Statistics Canada</publisher-name>
          <publisher-loc>Ottawa, ON, Canada</publisher-loc>
          <year>1977</year>
          <fpage>189</fpage>
        </citation>
      </ref>
      <ref id="B47-atmosphere-03-00573">
        <label>47.</label>
        <citation citation-type="journal">
          <person-group person-group-type="author">
            <name>
              <surname>Raddatz</surname>
              <given-names>R.L.</given-names>
            </name>
            <name>
              <surname>Noonan</surname>
              <given-names>M.</given-names>
            </name>
          </person-group>
          <article-title>Monthly mean afternoon mixing-layer depths “tuned” to the eco-climatic regions of the canadian prairie provinces</article-title>
          <source>Environ. Model. Assess.</source>
          <year>2005</year>
          <volume>9</volume>
          <fpage>147</fpage>
          <lpage>158</lpage>
          <pub-id pub-id-type="doi">10.1007/s10666-005-3802-x</pub-id>
        </citation>
      </ref>
      <ref id="B48-atmosphere-03-00573">
        <label>48.</label>
        <citation citation-type="journal">
          <person-group person-group-type="author">
            <name>
              <surname>Ash</surname>
              <given-names>G.H.B.</given-names>
            </name>
            <name>
              <surname>Shaykewich</surname>
              <given-names>C.F.</given-names>
            </name>
            <name>
              <surname>Raddatz</surname>
              <given-names>R.L.</given-names>
            </name>
          </person-group>
          <article-title>Moisture risk assessment for spring wheat on the eastern prairies: A water-use simulation model</article-title>
          <source>Climatol. Bull.</source>
          <year>1992</year>
          <volume>26</volume>
          <fpage>65</fpage>
          <lpage>78</lpage>
        </citation>
      </ref>
      <ref id="B49-atmosphere-03-00573">
        <label>49.</label>
        <citation citation-type="journal">
          <person-group person-group-type="author">
            <name>
              <surname>Raddatz</surname>
              <given-names>R.L.</given-names>
            </name>
            <name>
              <surname>Shaykewich</surname>
              <given-names>C.F.</given-names>
            </name>
            <name>
              <surname>Bullock</surname>
              <given-names>P.R.</given-names>
            </name>
          </person-group>
          <article-title>Prairie crop yield estimates from modelled phenological development and water use</article-title>
          <source>Can. J. Plant. Sci.</source>
          <year>1994</year>
          <volume>74</volume>
          <fpage>429</fpage>
          <lpage>436</lpage>
          <pub-id pub-id-type="doi">10.4141/cjps94-080</pub-id>
        </citation>
      </ref>
      <ref id="B50-atmosphere-03-00573">
        <label>50.</label>
        <citation citation-type="journal">
          <person-group person-group-type="author">
            <name>
              <surname>Koster</surname>
              <given-names>R.D.</given-names>
            </name>
            <name>
              <surname>Suarez</surname>
              <given-names>M.J.</given-names>
            </name>
          </person-group>
          <article-title>Suggestions in the observational record of land-atmosphere feedback operating at seasonal time scales</article-title>
          <source>J. Hydrometeorol.</source>
          <year>2004</year>
          <volume>5</volume>
          <fpage>567</fpage>
          <lpage>572</lpage>
          <pub-id pub-id-type="doi">10.1175/1525-7541(2004)005&lt;0567:SITORO&gt;2.0.CO;2</pub-id>
        </citation>
      </ref>
      <ref id="B51-atmosphere-03-00573">
        <label>51.</label>
        <citation citation-type="book">
          <collab>Environment Canada</collab>
          <source>National Inventory Report 1990–2006—Greenhouse Gas Sources and Sinks in Canada</source>
          <publisher-name>Environment Canada</publisher-name>
          <publisher-loc>Gatineau, QC, Canada</publisher-loc>
          <year>2008</year>
        </citation>
      </ref>
      <ref id="B52-atmosphere-03-00573">
        <label>52.</label>
        <citation citation-type="journal">
          <person-group person-group-type="author">
            <name>
              <surname>Raddatz</surname>
              <given-names>R.L.</given-names>
            </name>
            <name>
              <surname>Hanesiak</surname>
              <given-names>J.M.</given-names>
            </name>
          </person-group>
          <article-title>Significant summer rainfall in the canadian prairie provinces: Modes and mechanisms 2000–2004</article-title>
          <source>Int. J. Climatol.</source>
          <year>2008</year>
          <volume>28</volume>
          <fpage>1607</fpage>
          <lpage>1613</lpage>
          <pub-id pub-id-type="doi">10.1002/joc.1670</pub-id>
        </citation>
      </ref>
      <ref id="B53-atmosphere-03-00573">
        <label>53.</label>
        <citation citation-type="web">
          <person-group person-group-type="author">
            <name>
              <surname>Gameda</surname>
              <given-names>S.</given-names>
            </name>
            <name>
              <surname>Qian</surname>
              <given-names>B.</given-names>
            </name>
            <name>
              <surname>Campbell</surname>
              <given-names>C.A.</given-names>
            </name>
            <name>
              <surname>Desjardins</surname>
              <given-names>R.</given-names>
            </name>
          </person-group>
          <article-title>Summerfallow Trends and Climate in the Canadian Prairies</article-title>
          <access-date>(accessed on 24 March 2012)</access-date>
          <comment>Available online:<ext-link xmlns:xlink="http://www.w3.org/1999/xlink" xlink:href="ams.confex.com/ams/BLTAgFBioA/techprogram/paper_111162.htm" ext-link-type="uri">ams.confex.com/ams/BLTAgFBioA/techprogram/paper_111162.htm</ext-link></comment>
        </citation>
      </ref>
      <ref id="B54-atmosphere-03-00573">
        <label>54.</label>
        <citation citation-type="journal">
          <person-group person-group-type="author">
            <name>
              <surname>Bonsai</surname>
              <given-names>B.R.</given-names>
            </name>
            <name>
              <surname>Zhang</surname>
              <given-names>X.</given-names>
            </name>
            <name>
              <surname>Hogg</surname>
              <given-names>W.D.</given-names>
            </name>
          </person-group>
          <article-title>Canadian prairie growing season precipitation variability and associated atmospheric circulation</article-title>
          <source>Climate Res.</source>
          <year>1999</year>
          <volume>11</volume>
          <fpage>191</fpage>
          <lpage>208</lpage>
          <pub-id pub-id-type="doi">10.3354/cr011191</pub-id>
        </citation>
      </ref>
      <ref id="B55-atmosphere-03-00573">
        <label>55.</label>
        <citation citation-type="journal">
          <person-group person-group-type="author">
            <name>
              <surname>Zhang</surname>
              <given-names>X.</given-names>
            </name>
            <name>
              <surname>Vincent</surname>
              <given-names>L.A.</given-names>
            </name>
            <name>
              <surname>Hogg</surname>
              <given-names>W.D.</given-names>
            </name>
            <name>
              <surname>Niitsoo</surname>
              <given-names>A.</given-names>
            </name>
          </person-group>
          <article-title>Temperature and precipitation trends in canada during the 20th Century</article-title>
          <source>Atmos. Ocean.</source>
          <year>2000</year>
          <volume>38</volume>
          <fpage>395</fpage>
          <lpage>429</lpage>
          <pub-id pub-id-type="doi">10.1080/07055900.2000.9649654</pub-id>
        </citation>
      </ref>
      <ref id="B56-atmosphere-03-00573">
        <label>56.</label>
        <citation citation-type="journal">
          <person-group person-group-type="author">
            <name>
              <surname>Akinremi</surname>
              <given-names>O.O.</given-names>
            </name>
            <name>
              <surname>McGinn</surname>
              <given-names>S.M.</given-names>
            </name>
            <name>
              <surname>Cutforth</surname>
              <given-names>H.W.</given-names>
            </name>
          </person-group>
          <article-title>Seasonal and spatial patterns of rainfall trends on the canadian prairies</article-title>
          <source>J. Climate</source>
          <year>2001</year>
          <volume>14</volume>
          <fpage>2177</fpage>
          <lpage>2182</lpage>
          <pub-id pub-id-type="doi">10.1175/1520-0442(2001)014&lt;2177:SASPOR&gt;2.0.CO;2</pub-id>
        </citation>
      </ref>
      <ref id="B57-atmosphere-03-00573">
        <label>57.</label>
        <citation citation-type="journal">
          <person-group person-group-type="author">
            <name>
              <surname>Shepherd</surname>
              <given-names>A.</given-names>
            </name>
            <name>
              <surname>McGinn</surname>
              <given-names>S.M.</given-names>
            </name>
          </person-group>
          <article-title>Assessment of climate change on the canadian prairies from downscaled gcm data</article-title>
          <source>Atmos. Ocean.</source>
          <year>2003</year>
          <volume>41</volume>
          <fpage>301</fpage>
          <lpage>316</lpage>
          <pub-id pub-id-type="doi">10.3137/ao.410404</pub-id>
        </citation>
      </ref>
      <ref id="B58-atmosphere-03-00573">
        <label>58.</label>
        <citation citation-type="journal">
          <person-group person-group-type="author">
            <name>
              <surname>Cutforth</surname>
              <given-names>H.W.</given-names>
            </name>
          </person-group>
          <article-title>Climate change in the semiarid prairie of southwestern saskatchewan: Temperature, precipitation, wind, and incoming solar energy</article-title>
          <source>Can. J. Soil Sci.</source>
          <year>2000</year>
          <volume>80</volume>
          <fpage>375</fpage>
          <lpage>385</lpage>
          <pub-id pub-id-type="doi">10.4141/S99-074</pub-id>
        </citation>
      </ref>
      <ref id="B59-atmosphere-03-00573">
        <label>59.</label>
        <citation citation-type="journal">
          <person-group person-group-type="author">
            <name>
              <surname>Brimelow</surname>
              <given-names>J.C.</given-names>
            </name>
            <name>
              <surname>Hanesiak</surname>
              <given-names>J.M.</given-names>
            </name>
            <name>
              <surname>Raddatz</surname>
              <given-names>R.L.</given-names>
            </name>
            <name>
              <surname>Hayashi</surname>
              <given-names>M.</given-names>
            </name>
          </person-group>
          <article-title>Validation of ET estimates from the canadian prairie agrometeorological model for contrasting vegetation types and growing seasons</article-title>
          <source>Can. Water Resour. J.</source>
          <year>2010</year>
          <volume>35</volume>
          <fpage>209</fpage>
          <lpage>230</lpage>
          <pub-id pub-id-type="doi">10.4296/cwrj3502209</pub-id>
        </citation>
      </ref>
    </ref-list>
  </back>
</article>
