Carbon Dioxide and Methane at a Desert Site—A Case Study at Railroad Valley Playa, Nevada, USA


Abstract
: Ground based in-situ measurements of carbon dioxide (CO2) and methane (CH4) at the dry lakebed at Railroad Valley (RRV) playa, Nevada, USA (38°30.234′ N, 115°41.604′ W, elevation 1437 m) were conducted over a five day period from 20–25 June 2010. The playa is a flat, desert site with virtually no vegetation, an overall size of 15 km × 15 km and is approximately 110 km south-west of the nearest city, Ely (elevation 1962 m, inhabitants 4000). The measurements were taken in support of the vicarious calibration experiment to validate column-averaged dry air mole fractions of CO2 and CH4 (XCO2 and XCH4) retrieved from the Greenhouse Gases Observing Satellite (GOSAT) which was launched in January 2009. This work reports on ground-based in-situ measurements of CO2 and CH4 from RRV playa and describes comparisons made between in-situ data and XCO2 and XCH4 from GOSAT.1. Introduction
Carbon dioxide (CO2) and methane (CH4) are the first and second most important increasing greenhouse gases respectively. Before the industrial revolution, the concentration of CO2 in the atmosphere was 280 ± 10 ppm for several thousand years [1-3]. The global average mixing ratio of tropospheric CO2 in 2009 was 386.8 parts per million, ppm, with the seasonal cycle superimposed onto this average [4]. The amplitude of the ground-based seasonal cycle varies depending on location of the measurements; for example amplitudes of 15.5 ppm were reported at Ochsenkopf, Germany [5] whereas amplitudes of 30.4 ppm have been reported from the Zotino tall tower in central Siberia [6]. The atmospheric lifetime of CO2 is a controversial topic. Some estimates describe a range of 50–200 years [7] and others claiming a far longer time in the order of magnitude of a few centuries [8]. The importance of CO2 is amplified due to its long atmospheric life-time, its high global mean radiative forcing (+1.66 ± 0.17 Wm−2 [1]) and the fact that the average mixing ratio is increasing at a rate of 2 ppm/year [9] due to anthropogenic activities [1].
Since pre-industrial times the atmospheric concentration of CH4 has more than doubled as a result of anthropogenic activities [1]. The most important sources of CH4 are wetlands, rice fields, energy production, ruminants, landfills and biomass burning, contributing to a total of approximately 600 Tg emitted annually [1]. Recently (1999–2006) the increase in CH4 mixing ratio started to stabilize, for reasons that are not well understood [10,11]. However, more recent reports suggest a renewed increase in atmospheric CH4 [12,13]. The global average mixing ratio of tropospheric CH4 in 2009 was 1.803 ppm [4] and the mean atmospheric lifetime of CH4 is 8.4 years [1]. CH4 is also considered the second most important trace gas in the atmosphere, in terms of its radiative forcing (+0.48 ± 0.05 Wm−2 [1]); hence CH4 emissions have the ability to alter the state of the atmosphere on a global scale. CH4 also plays an important role in the photochemistry of the atmosphere as it is primarily removed by oxidation with the hydroxyl radical (OH) and in so doing acts as a precursor for secondary pollutants, including ozone and eventually CO2, CH4 sinks also include soils and losses to the stratosphere.
Satellite data can be used to provide a better understanding of the atmospheric processes and CO2 and CH4 budgets. In January 2009, the Greenhouse Gases Observing Satellite (GOSAT) instrument was launched with the aim of measuring the column amounts of CO2 and CH4 [14]. GOSAT has a CO2 target to achieve 4 ppm accuracy for a three month regional average using a combination of short-wavelength infrared, SWIR, and infrared, IR, channels [14-16]. This paper reports on ground-based in-situ measurements of CO2 and CH4 taken at a playa in Railroad Valley (RRV), Nevada during a field campaign in June 2010. The field campaign was part of a vicarious calibration experiment with the primary aim to validate column-averaged dry air mole fractions of CO2 and CH4 (XCO2 and XCH4) retrieved from GOSAT. Comparisons of ground-based, in-situ data with XCO2 and XCH4 from GOSAT measurements taken on two cloud-free days are presented. Here, in-situ CO2 and CH4 data is presented from four measurement days to provide context to the daily and day-to-day variations and its potential relevance to satellite measurements.
2. Experimental
Ground-based atmospheric measurements of CO2 and CH4 were taken on a dry lakebed, or playa, at Railroad Valley (RRV), Nevada, USA (38°30.234′ N, 115°41.604′ W, height 1437 m) from 20–25 June 2010. The playa is a flat, high altitude desert site which makes up part of the Great Basin desert of the United States; except for several small oil fields, RRV is an area where local sources and sinks of carbon-species are expected to be minimal. The playa has virtually no vegetation, an overall size of 15 km × 15 km and is approximately 110 km south-west of the nearest city, Ely (elevation: 1962 m, inhabitants: 4000); the location and characteristics of the RRV site are such that it provides an estimate of well-mixed continental air. RRV playa is a radiometrically flat region and has been used to calibrate various satellite radiometers for many years [17-19]. The CO2 and CH4 measurements were part of a vicarious calibration of the GOSAT data; other measurements included solar irradiance, spectral albedo, bidirectional reflectance distribution function (BRDF), radiosonde (temperature, humidity profiles) and meteorological data (temperature, humidity, pressure, wind speed and direction) [19].
The CO2 and CH4 measurements were conducted using Wavelength-Scanned Cavity Ring-Down Spectroscopy (WS-CRDS) technique. The analyzer (Picarro Inc., CA, USA, model G1302) relies on the use of a high-finesse optical cavity consisting of three high-reflectivity mirrors (>99.995%), two lasers, a high-precision wavelength monitor, and photo-detectors to enable extremely precise and simultaneous measurements of CO2 and CH4. This technique has been described in detail elsewhere and is widely used as a ground-based and airborne-based instrument [6,20-22].
Laboratory analyzer tests were performed with a synthetic standard to calibrate the analyzer before and after deployment at RRV (Scott-Marrin, Inc. 420 ppm CO2, 1.997 ppm CH4 (±1% NIST) balance in ultrapure air). Instrument precision was calculated from the average 1-sigma standard deviation during standard sampling and was below 0.17 ppm for CO2 and 0.56 ppb for CH4, with no outliers greater than ±0.20 and 0.001 ppm from the standard mean for CO2 and CH4 respectively. Applying least-squares linear fit to the measured standard values analyzed before and after the deployment gave an estimation of the analyzer drift. Drift was estimated to be −1.9 ppb/day for CO2 and −0.002 ppb/day for CH4. A flow mixing system was used to dilute the standard with pure nitrogen to determine instrument linearity over a wide concentration range (100–400 ppm), the instrument proved to be extremely linear (slope = 1.04, r2 = 1.00).
The field deployment was conducted in support of GOSAT overpasses which occurred on 21 (20:44 UTC), 22 (21:16 UTC), 24 (20:44 UTC) and 26 (21:16 UTC) June 2010. The analyzer operated a minimum of 1.5 h either side of the GOSAT overpasses. The analyzer was located upwind of the base-camp and to prevent the use of a generator, the instrument was powered using two marine batteries wired in parallel and connected to an inverter which provided 110 VAC. The instrument inlet was approximately 3 m above the ground. During measurements, all generators were switched off and human interaction was prevented. The location of the analyzer was approximately 10 m from a ground-based meteorological station (R.M. Young Company, MI, USA) which reported wind direction and speed, temperature, humidity and pressure every second for the entire duration of the campaign.
3. Results and Discussion
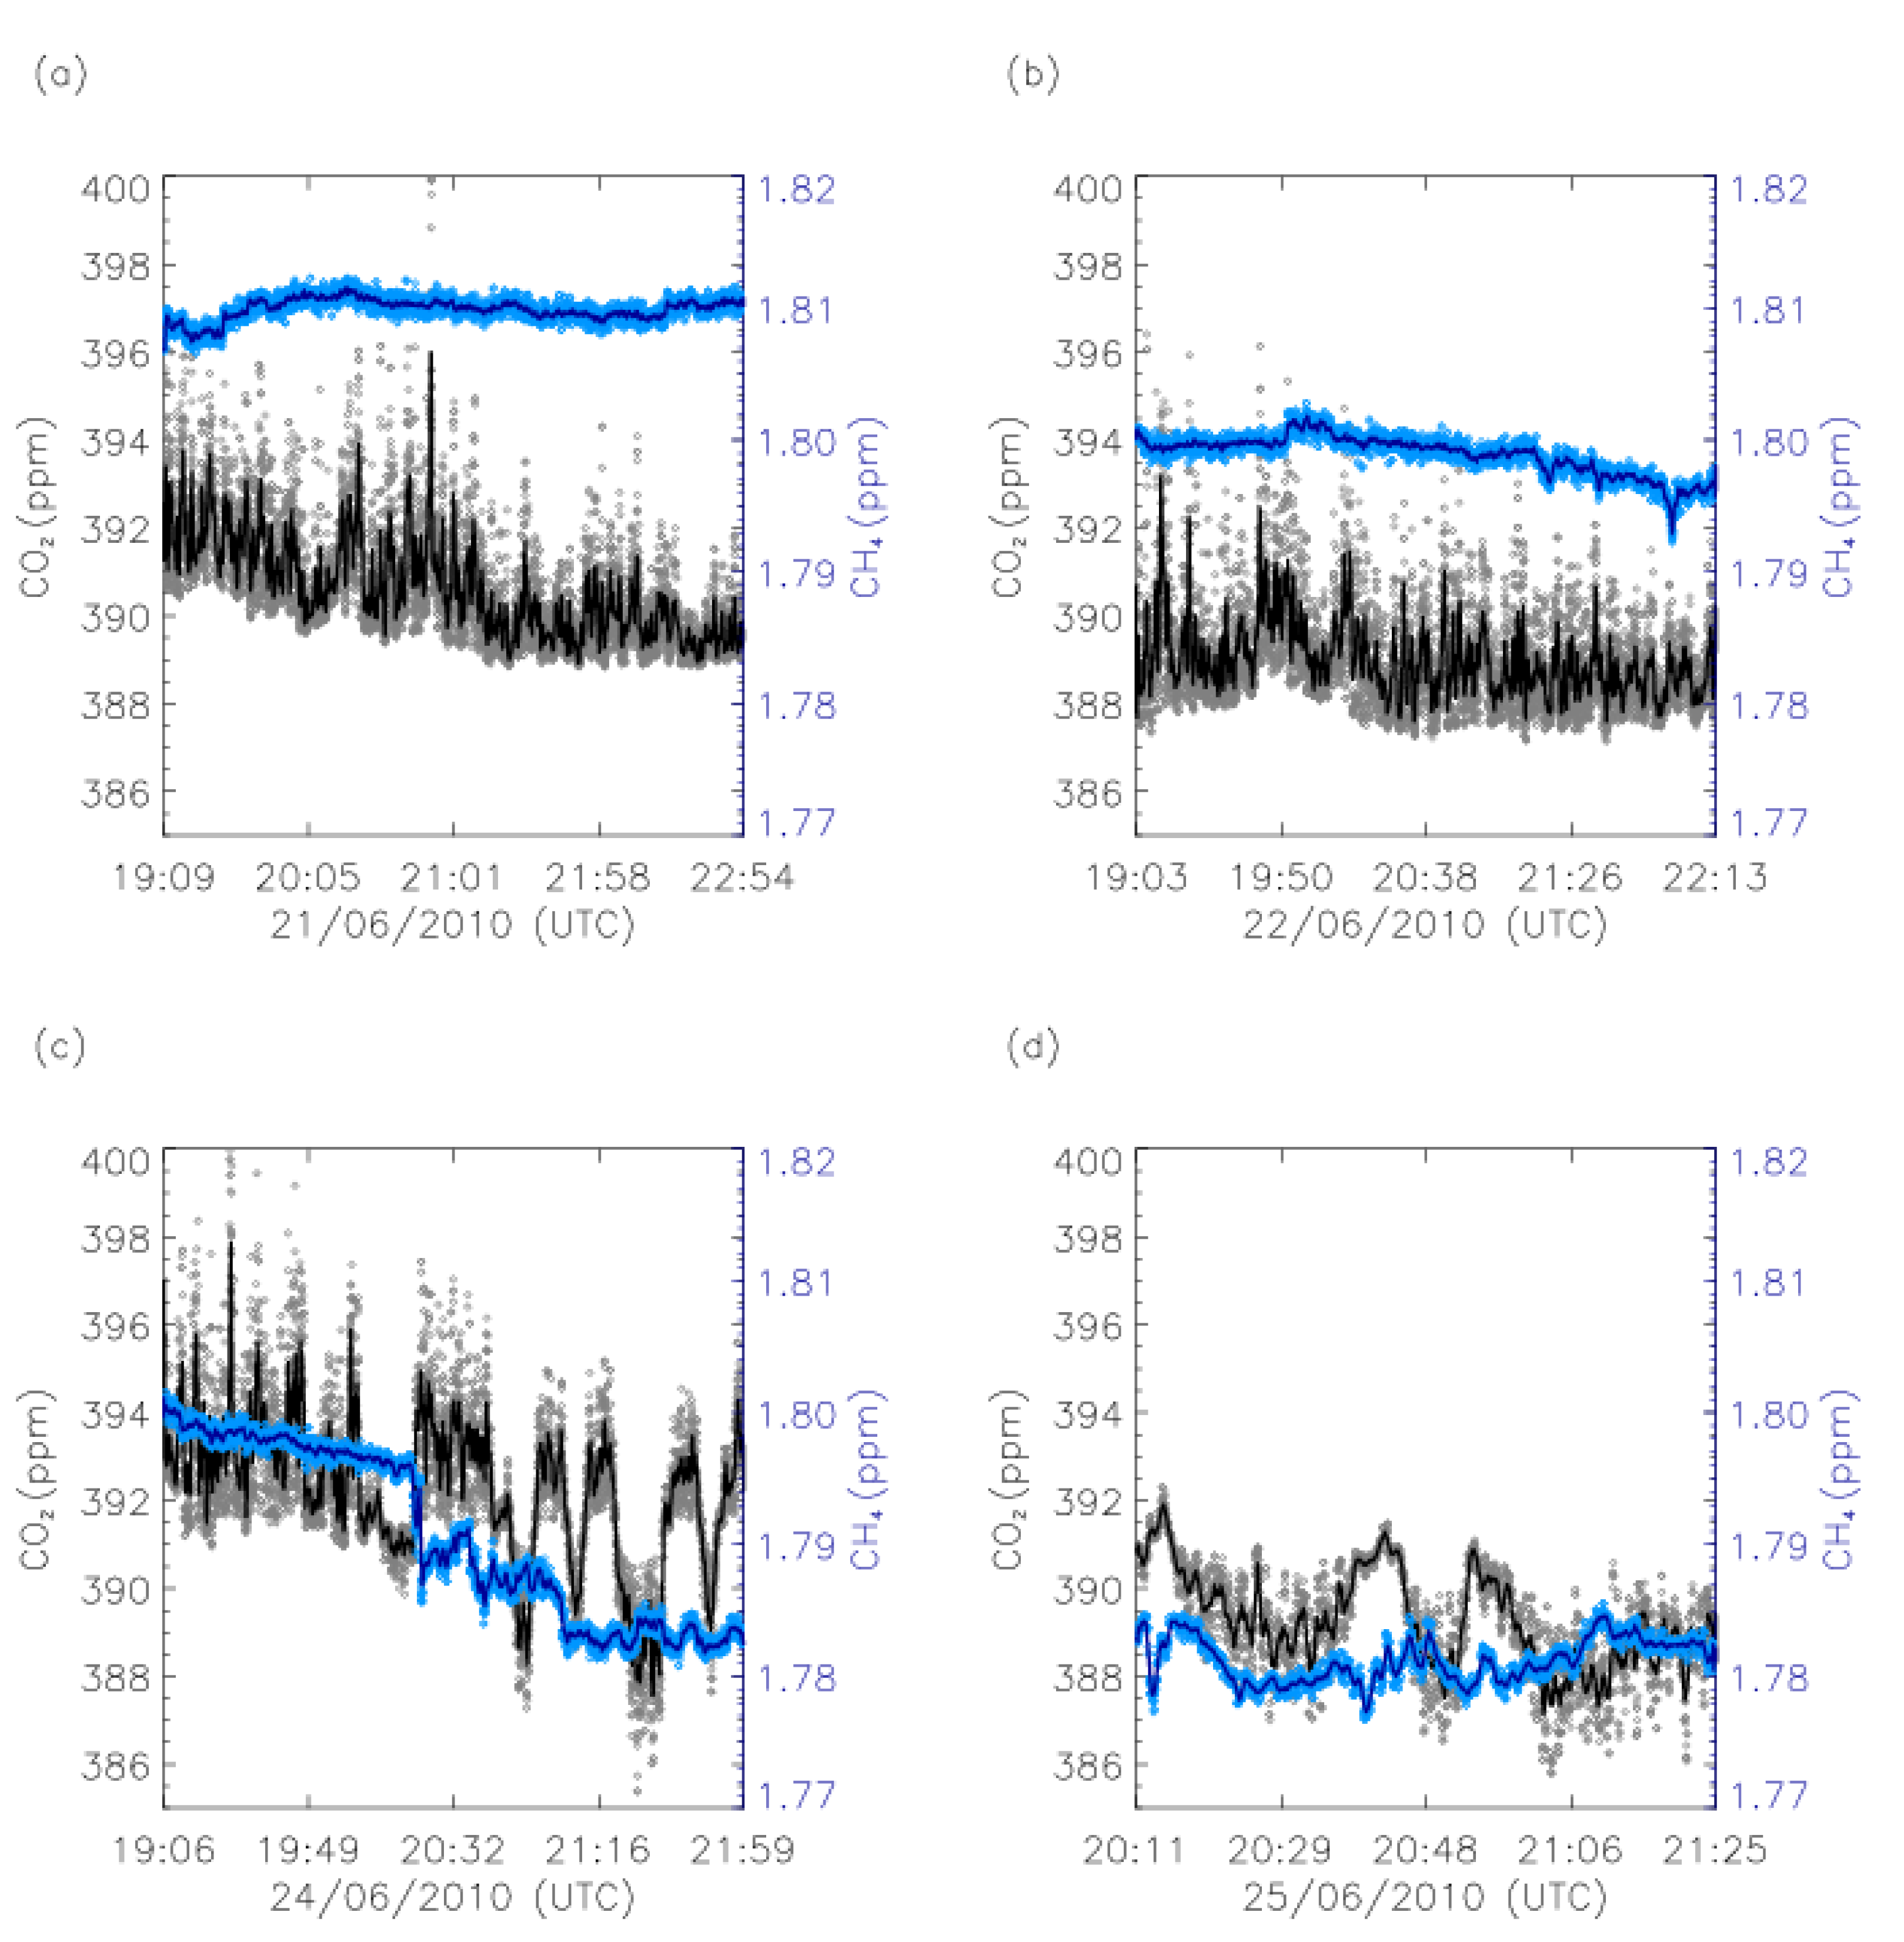
The RRV field campaign bracketed the summer solstice, from 20–25 June 2010, and coincided with the decreasing phases of the seasonal cycles of the CO2 and CH4. Data from the closest NOAA station at Wendover, Utah show that the CO2 and CH4 seasonal minima occur in August/September and July/August respectively ( www.esrl.noaa.gov/gmd/dv/iadv). The 2 s temporal resolution ground-based datasets of CO2 and CH4 are presented in Figure 1 for each GOSAT overpass day.
The minimum and maximum concentrations during the measurement campaign were 385.39–404.25 ppm for CO2 and 1.777–1.812 ppm for CH4. As expected the overall mean CO2 and CH4 concentrations on each measurement day were close to (although, always higher than for CO2) the global average of 386.8 ppm and 1.803 ppm respectively, see Table 1. Differences from these mean concentrations are discussed more in the following sections. Day-to-day variations in the average CO2 and CH4 values result primarily from large scale mixing and variations on a time-scale of 2–5 days due to changes in emission sources and synoptic variability [23] which mixes background, oceanic air with continental signals. The small time-scales of the daily CO2 fluctuations, defined as lasting <1 min in duration and consisting of >10 data points, are seen in the raw data in Figure 1. The speed and magnitude of these fluctuations (most fluctuations are approximately 5 ppm (which is 30 times the instrument 1σ standard deviation)) were not observed in pre-deployment laboratory calibration testing. Given the location of the field instrument (removed from base-camp emissions and limited human interaction) we believe these fluctuations indicate local sources and/or sinks influence observations at this remote site.
3.1. Investigating Emission Sources
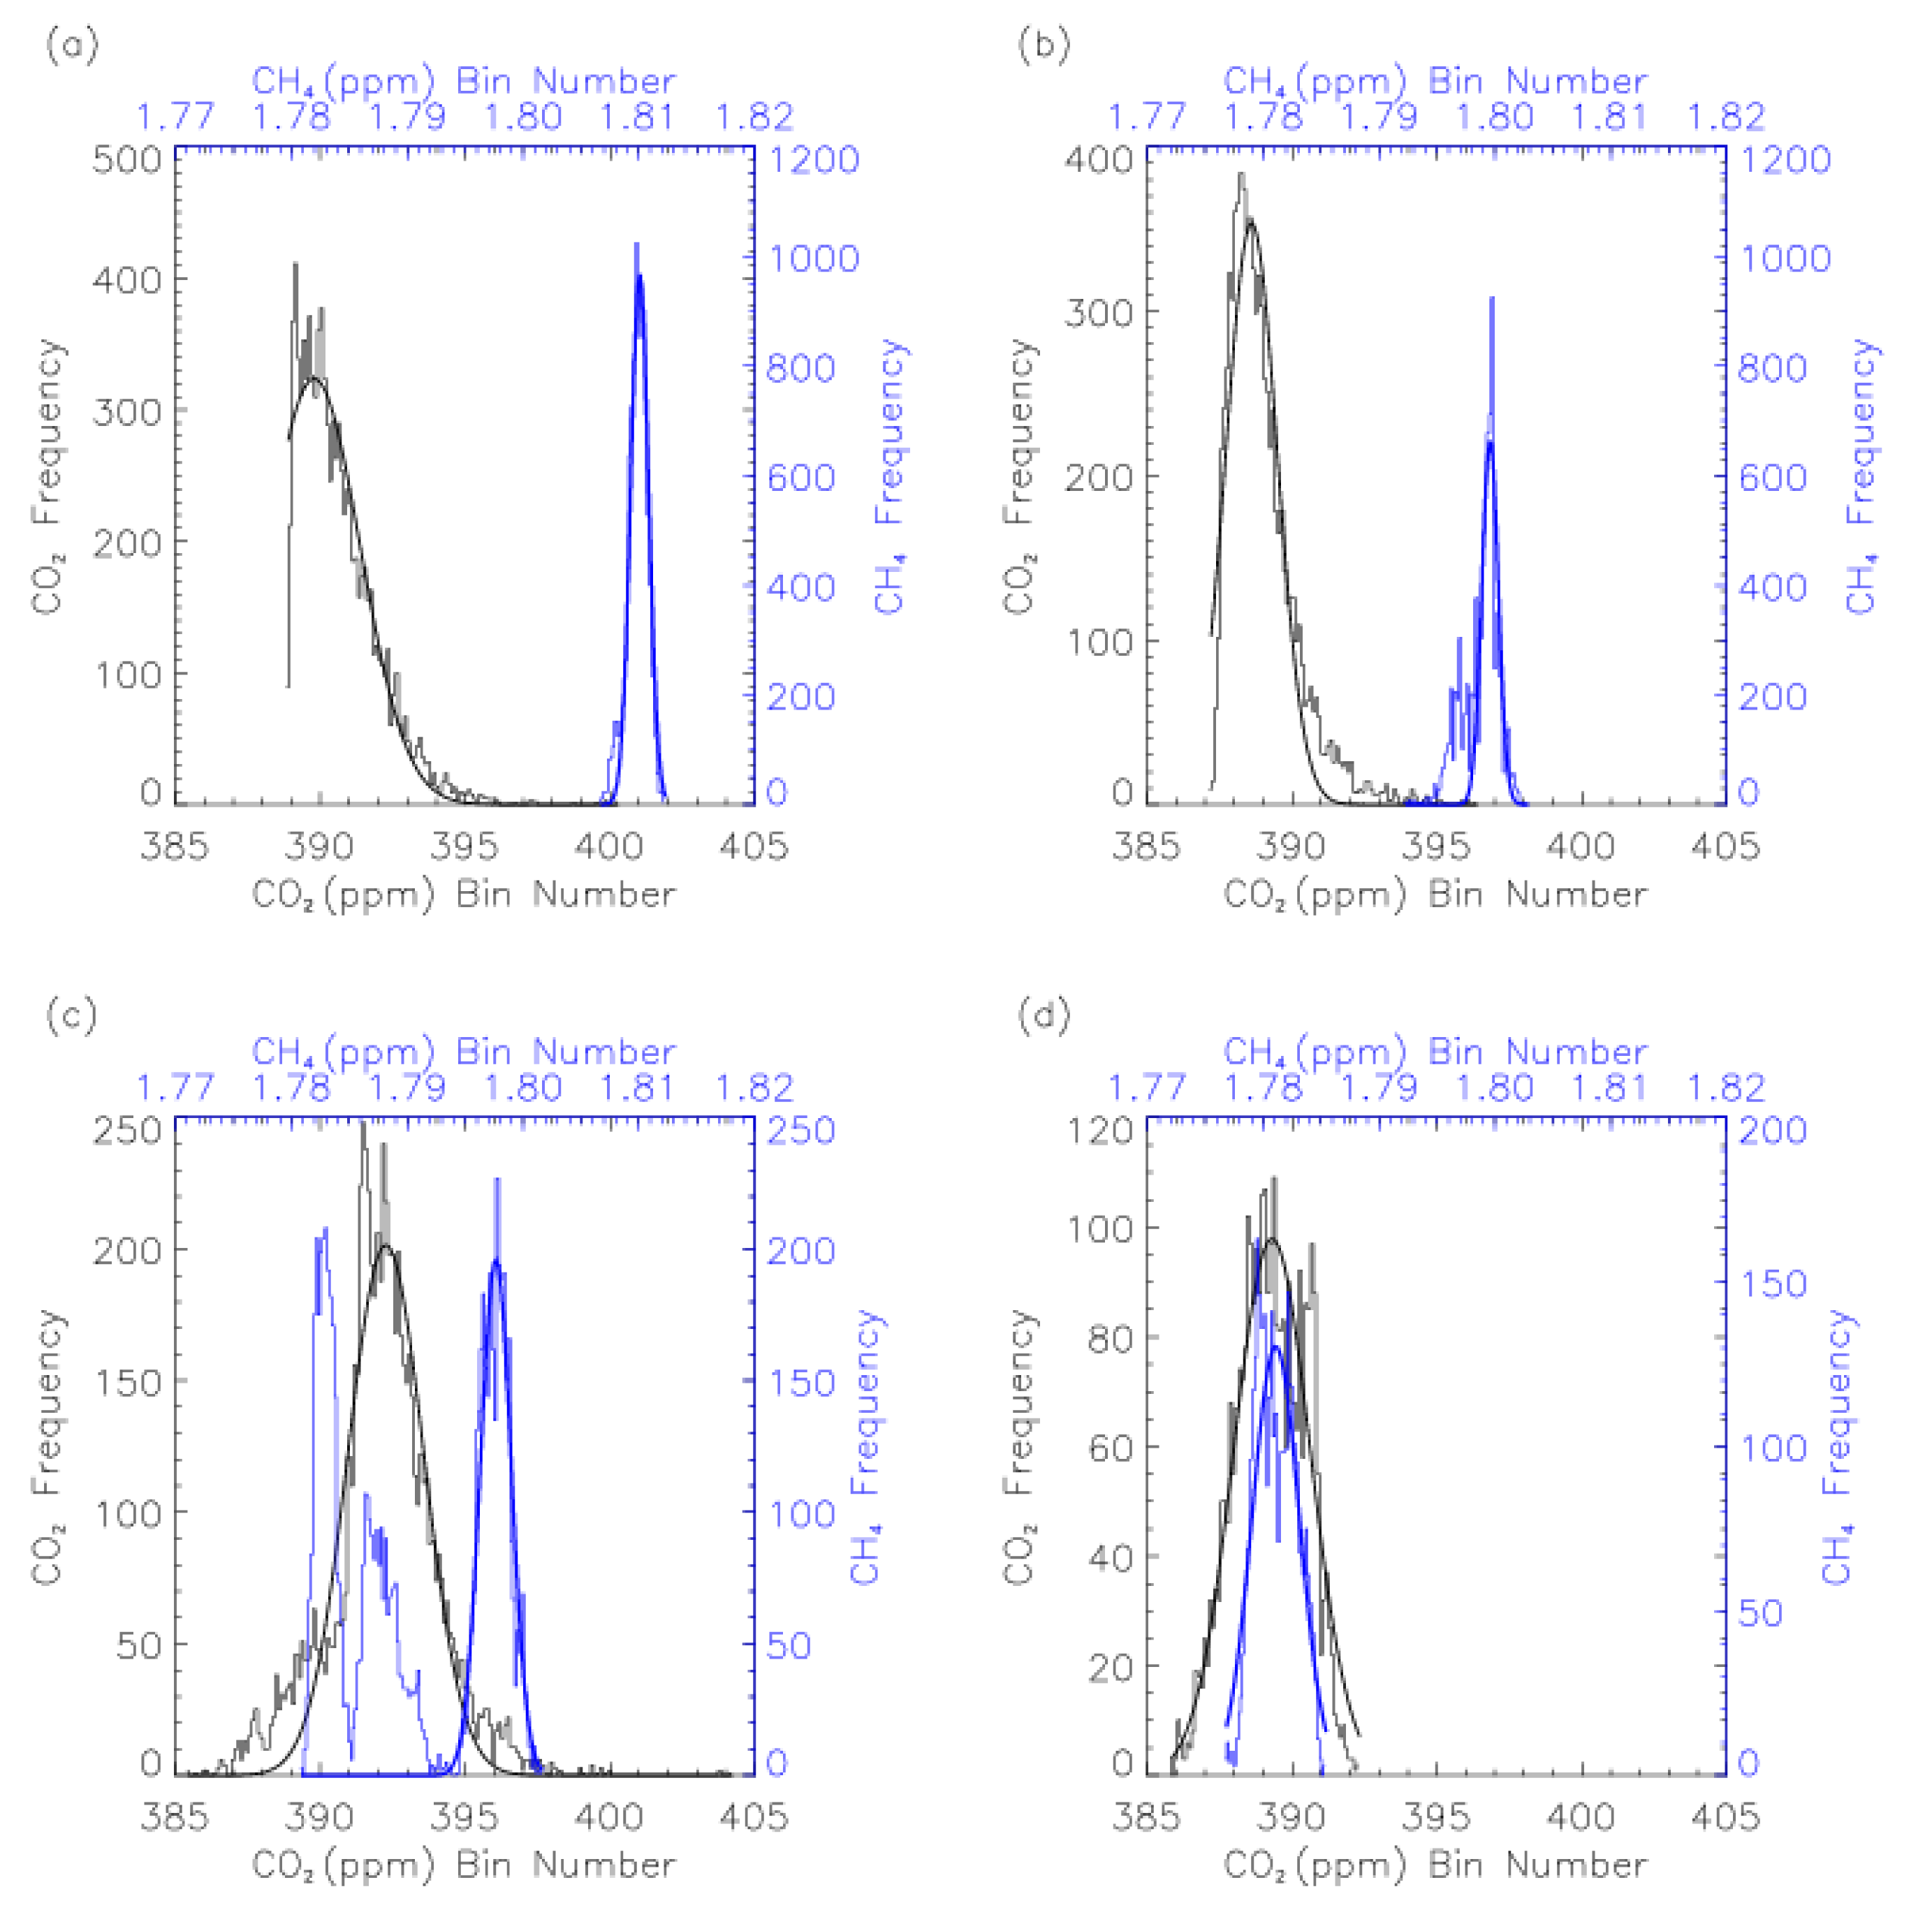
The measured CO2 and CH4 probability distributions during each GOSAT overpass day are shown in Figure 2. Superimposed on the Figure 2 histograms is a Gaussian probability distribution. The comparison of the actual and the Gaussian probability distributions, along with the statistical summary provided in Table 1, informs us that each histogram is positively skewed (with varying extents), with more data points lying to the right of the centre. The non-symmetric, positive skew of the histograms suggests there are more fluctuations of CO2 and CH4 concentration values above the mean concentration than below, indicative of potential local sources influencing the observations at this remote site.
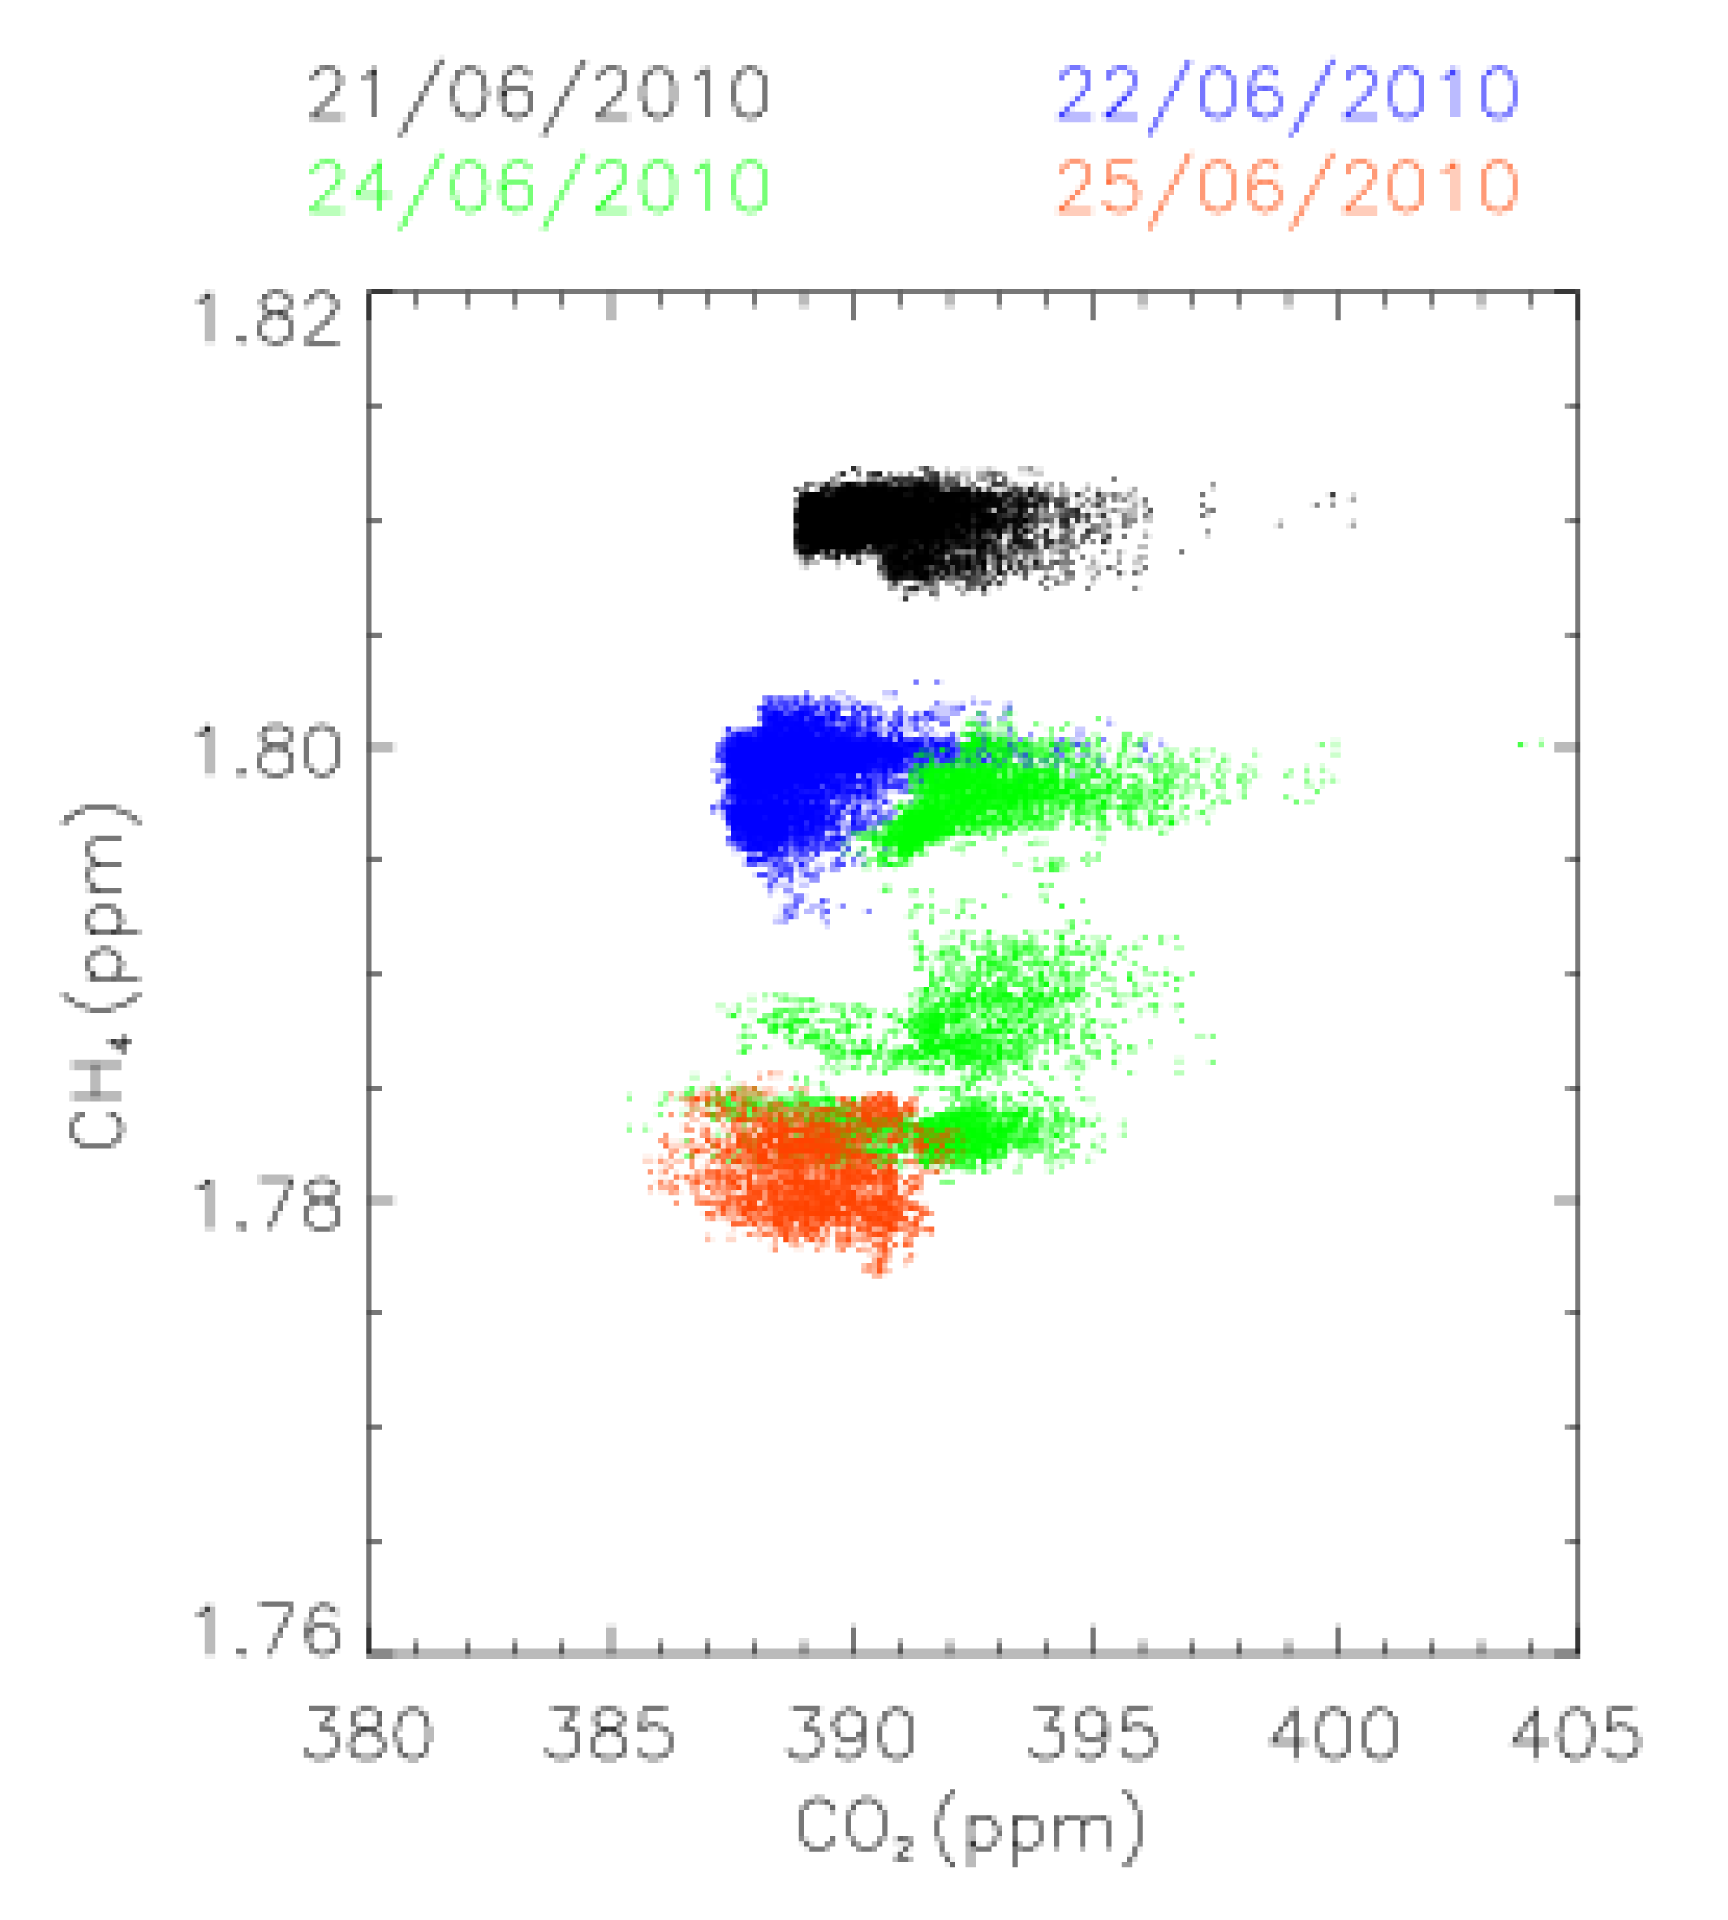
The histogram plot of CH4 on 24 June 2010 is bi-modal in shape, with two apparent peaks of similar occurrence frequency. This suggests that the data is from two separate processes or distinct sources, providing further evidence towards a local emission source. To investigate this possibility further a scatter plot of CH4 versus CO2 is presented in Figure 3. Excluding 24 June, it can be deduced from Figure 3 that the CH4 values on each day vary by less than 0.02 ppm (∼1% variation compared with background concentration value). Because, the day-to-day differences are larger than 0.02 ppm, each day's data falls into a distinct group bracketed by these small changes (0.02 ppm) in CH4 concentration. CO2, on the other hand shows much more daily variation, in the order of 20 ppm. This is a ∼5% variation when compared with the background CO2 value. On 24 June the CH4 measurements span a wider range of concentrations (2 ppm) and appear to have several distinct groups. The scatter plot further confirms that measurements on 24 June 2010 were influenced by two or more distinct sources with differing CH4/CO2 emission ratios.
The CH4/CO2 ratio does not appear to have a very robust relationship, as represented by the variation in the r2 values (r2 values: 0.008, 0.06, 0.2, and 0.02 on 21, 22, 24, 25 June 2010 respectively). Using the reported, average background concentrations of CO2 (386.8 ppm) and CH4 (1.803 ppm) [4] the expected CH4/CO2 ratio is 0.0047. However, these are averaged concentrations, and in reality concentrations of CO2 and CH4 vary in time and space depending on the magnitude of local (or large regional and global) sources and sinks. The absence of a direct link between CH4 and CO2 concentrations can be expected when considering their independent and varying emission sources.
The fluctuations of CO2 (up to 10 ppm) during each measurement period was unexpected given that the measurement period occurred at the same time on each day (late-morning to mid-afternoon) and considering the playa was virtually free from all vegetation. Further research is needed to investigate possible CO2 fluxes. The Great Basin area (including RRV) is considered to have a minimal carbon emission, however due to the sparse measurement data of carbon fluxes in the desert region of United States Midwest the possibility of a local source/sink must also be considered. Further investigation is required to identify CO2 (and CH4) sources and sinks including RRV oil fields and the role of soil-atmosphere interactions.
3.2. Comparisons with Meteorological Data
During the CO2 and CH4 measurement period, the first two GOSAT overpass days wind speeds were low (∼5 m/s) and the wind direction was highly variable. Temperatures on 21 and 22 June 2010 remained below 30 °C, skies were clear and mean humidity was 9–13%. Radiosonde data launched at GOSAT overpass time (20:44 and 21:16 UTC) on 21 and 22 June 2010 show a well-mixed planetary boundary layer (PBL) to 4000 m (above sea level) as indicated by the base of the temperature inversion and the level of minimum vertical gradient of relative humidity. Hence we expect the CO2 and CH4 mixing ratios within the PBL to be fairly constant during the measurement time and during the well-mixed PBL case. Indeed, evidence presented in Figures 1 and 2 and Table 1 does show that the CO2 and CH4 observations are well-mixed, with fluctuations around the mean values.
In contrast, the final two measurement days were characterized by increasing wind speeds in the afternoon (average wind speed: 12.64 m/s and 19.08 m/s on 24 and 25 June 2010 respectively, with gusts up to 30 m/s) from a more sustained and less variable, (100–250°) direction, particularly during the afternoon winds. Temperatures on these final measurement days remained above 30 °C, cloud cover was present, and humidity decreased (mean: 7.69% and 4.90% on 24 and 25 June respectively). Comparing wind data with CH4 mixing ratios on 24 June 2010 does indicate a relationship between CH4 mixing ratios and wind direction/speed. The decrease in CH4 concentration at 20:23 UTC on 24 June 2010 presented in Figures 1 and 2 coincides with a change in wind direction from SW (higher CH4 concentrations) to SE (lower CH4 concentrations) with wind speeds from the SW direction being lower than those from the SE. Figure 4 shows the relationship between CH4 and wind speed/direction (CH4 has been interpolated to the same temporal resolution as the wind data: once per minute) and points towards a local CH4 source in the SW region. The origins of the source are inconclusive. Small oil fields are located in RRV, however most appear to be towards the north and east of RRV playa. Other potential sources could include biogenic emissions from the soil or thermal springs; all possibilities, and the subsequent effects on the local environment, require further investigation. The same behavior was not observed for CO2; fluctuations in CO2 did not depend on wind direction/speed.
The effects of temperature and humidity on CO2 and CH4 concentrations have been investigated to help determine the role of biosphere interactions on the atmospheric levels of these carbon species. The area is not vegetated and hence evidence of photosynthesis as a key role in controlling CO2 is not expected. However, there are local hot and cold springs which could potentially result in biogenic emissions of CH4 and as such would be temperature dependent. Temperature and humidity would also determine the potential role of the playa soil itself, in terms of decomposition of organic matter. When CO2 and CH4 time series data is over-plotted with temperature and humidity there does appear to be a general degree of correlation; for example as temperature increases CO2 appears to decrease. However, a scatter-plot of meteorological parameters (1 min resolution) versus (1 min average) CO2 data shows little correlation, in terms of r2 values, due to the large variability in CO2 concentration on each day. Given the general observations of decreasing CO2 concentrations throughout each afternoon (as temperature increases) and the short time-frame of each day's measurements, no definite conclusion can be drawn regarding the effects of temperature on CO2 mixing ratios. Comparisons of temperature and humidity with the less-variable CH4 data result in a better degree of correlation, but r2 values vary dramatically from day-to-day. For example, the r2 values for temperature/CH4 are 0.066, 0.50, 0.63, and 0.0043 on 21, 22, 24 and 25 June respectively. The lack of correlation between meteorological data and the carbon species leads us to deduce that in this instance local temperature and humidity conditions observed on the playa had little influence on the measured CO2 and CH4 concentrations, at least under the limited temperature and humidity range observed here. To better assess the role of temperature and humidity diurnal cycles would be required over larger temperature and humidity ranges.
3.3. GOSAT Comparisons
The XCO2 and XCH4 GOSAT retrievals were derived using a method described elsewhere [24-26]. Briefly the data analysis method consists of three steps: (a) data is filtered by several cloud-detection methods to determine cloud-free observations, (b) determination of XCO2 and XCH4, and (c) examination of retrieval quality. XCH4 are obtained from the Japanese National Institute for Environmental Studies (NIES) products, whereas XCO2 is retrieved with two different algorithms; XCO2 from NIES products and from the NASA-sponsored Atmospheric CO2 Observations from Space (ACOS) team. NIES XCO2 and XCH4 products V01.39 are retrieved as requested from L1 V110 data with NIES V01 algorithm and corrected the lower bias (8.9 ppm for XCO2 and 0.02 ppm for XCH4). ACOS XCO2 products are retrieved from L1 V130 data with ACOS b2.9 algorithm. GOSAT's onboard Thermal and Near infrared Sensor for carbon Observation Fourier Transform Spectrometer (TANSO-FTS) pointing mechanism has image motion compensation capability, this mechanism can view the same surface target for up to 20 s. The RRV GOSAT overpasses were approximately 13 s in total, comprising of up to three data points for each GOSAT overpass.
The ground based in-situ measurements of CO2 and CH4, averaged over 30 min (15 min either side of the GOSAT overpass), were compared with the XCO2 and XCH4 retrievals by NIES and by ACOS from GOSAT overpasses on 21 and 22 June 2010. Comparisons of the GOSAT overpasses on 24 and 25 June 2010 could not be made due to large cloud cover fraction during these days, preventing XCO2 and XCH4 retrievals. The data is presented in Table 2. Note that on 22 June NIES rejected two and ACOS rejected one of the possible three data points.
The differences in the measurements of in-situ CO2 and CH4 mixing ratios and XCO2 and XCH4 can be understood when considering the nature of the measurements. Ground-based, surface CO2 mixing ratios are largely influenced by their diurnal cycle (which in turn is driven by synoptic-scale weather patterns which affect boundary layer mixing, photosynthesis and ecosystem respiration [27]). In contrast, in order for there to be large-scale replacement of air within the column, column CO2 is largely linked to events that have timescales in the order of 2 to 6 days [28]. Despite these differences there appears to be a good agreement between in-situ CO2 and XCO2 and between in-situ CH4 and XCH4. It has been previously concluded that the varying amplitude of the CO2 seasonal cycle with altitude is responsible for column average CO2 being greater than surface CO2 in summer and fall and lower in winter and spring in the Northern Hemisphere mid-latitudes [28]. However, during this summer study the NIES and ACOS XCO2 values are less than the surface CO2 mixing ratio on the 21 June and greater than on 22 June 2010. The reason for this discrepancy on 21 June 2010 may be due to the “rectifier effect”: interactions between biosphere emissions (here effects of photosynthesis rates are limited but other biogenic sources have not been accounted for) and boundary layer dynamics and/or local sources and sinks, and further investigation is required to better address these roles.
4. Conclusions
Ground based in-situ measurements of CO2 and CH4 at RRV playa were carried out during June 2010. The measurements were in support of the vicarious calibration experiment which in turn helps validate GOSAT XCO2 and XCH4 retrievals. This work focuses on the analysis of the ground-based in-situ measurements of CO2 and CH4. The daily mean CO2 and CH4 concentrations are close to the reported global average values. However, fluctuations were observed, which were greater than expected given the remoteness of the RRV site. Further investigation is required in order to analyze the cause of these fluctuations and their influence on satellite validations.
Comparisons of in-situ CO2 and CH4 measurements with XCO2 and XCH4 from GOSAT show a general good-approximation of boundary layer mixing ratios. However, due to the spatially limited coverage of the in-situ data and the reliance on cloud-free measurement days, the results presented should be regarded as a first attempt at comparison. Further validation including a more comprehensive study of the boundary layer is needed.
Planned improvements for future calibration campaigns include increased power availability to measure CO2 and CH4 for longer periods of time, including the analysis of diurnal cycles which would help identify the role of local sources/sinks. A detailed analysis of local emission sources/sinks would be advantageous, allowing the assessment of the role of the oil fields, identification of potential biogenic sources/sinks, and assessment of the potential influence of these on satellite measurements. Measurement of ground based CO2 and CH4 mixing ratios coincident with in-situ analysis of CO2 and CH4 in the free troposphere would allow for the investigation of CO2 and CH4 vertical profiles and provide a method of calculating column averages from aircraft profiles to directly compare with GOSAT column XCO2 and XCH4, which is a method routinely used for satellite validation [9,29].


| 21 June 2010 | 22 June 2010 | 24 June 2010 | 25 June 2010 | |||||
|---|---|---|---|---|---|---|---|---|
| CO2 | CH4 | CO2 | CH4 | CO2 | CH4 | CO2 | CH4 | |
| 388.84 | 1.806 | 387.15 | 1.792 | 385.39 | 1.781 | 385.78 | 1.777 | |
| 390.66 | 1.809 | 389.01 | 1.799 | 392.23 | 1.791 | 389.26 | 1.781 | |
| 390.37 | 1.810 | 388.75 | 1.799 | 392.22 | 1.789 | 389.26 | 1.781 | |
| 1.34 | 8.70e−4 | 1.17 | 1.53e−4 | 1.85 | 6.55e−3 | 1.19 | 1.72e−3 | |
| 400.34 | 1.812 | 396.41 | 1.803 | 404.25 | 1.802 | 392.31 | 1.786 | |
| Skewness | 1.27 | 0.719 | 1.24 | 1.938 | 1.86 | 0.796 | 0.14 | 0.002 |
| Kurtosis | 0.18 | −1.096 | 0.04 | 3.569 | 2.48 | −0.697 | −1.522 | −1.322 |
| Date/time of GOSAT overpass | XCO2 NIES | XCO2 ACOS | In-situ CO2 | XCH4 NIES | In-situ CH4 |
|---|---|---|---|---|---|
| 21/06/2010 20:44 | 392.7 | 390.0 | 393.60 | 1.814 | 1.810 |
| 389.9 | 389.3 | 1.816 | |||
| 390.3 | 390.2 | 1.806 | |||
| 22/06/2010 21:16 | - | 391.4 | 388.01 | - | 1.798 |
| 390.7 | 391.3 | 1.805 | |||
| - | - | - |
Acknowledgments
We specifically acknowledge the cooperation and efforts of the personnel involved in the Railroad Valley vicarious calibration experiment from Atmospheric CO2 Observations from Space (ACOS), Japan Aerospace Exploration Agency (JAXA), National Institute for Environmental Studies (NIES) and Colorado State University (CSU), particulary the work of Hiroshi Suto of JAXA, NIES GOSAT project office, David Crisp and Carol Bruegge of ACOS. We also thank the University of Arizona Remote Sensing Group for making the research facilities at Railroad Valley available. We acknowledge financial support from NASA's Earth Science Division and Oak Ridge Associated Universities (ORAU) through the NASA Postdoctoral Program (E.L.Y., J.M.T.). Helpful comments from two anonymous reviewers are appreciated.
References
- Intergovernmental Panel on Climate Change (IPCC). Climate Change 2007: The Physical Science Basis; Solomon, S., Qin, D., Manning, M., Chen, Z., Marquis, M., Averyt, K.B., Tignor, M., Miller, H.L., Eds.; Cambridge University Press: Cambridge, UK, 2007. [Google Scholar]
- Lorius, C.; Jouzel, J.; Raynaud, D. The Ice Core Record: Past Archive of the Climate and Signpost to the Future. In Antarctica and Environmental Change; Oxford Science Publications: Oxford, UK, 1993; pp. 27–34. [Google Scholar]
- Etheridge, D.M.; Steele, L.P.; Langenfelds, R.L.; Francey, R.J. Natural and anthropogenic changes in atmospheric CO2 over the last 1000 years from air in Arctic ice and firn. J. Geophys. Res. 1996, 101, 4115–4128. [Google Scholar]
- WMO Secretariat. WMO Greenhouse Gas Bulletin: The State of Greenhouse Gases in the Atmosphere Based on Global Observations through 2009, 2010. World Meteorological Organization Available online: http://www.wmo.int/pages/prog/arep/gaw/ghg/documents/GHG_bull_6en.pdf (accessed on 23 September 2011).
- Thompson, R.L.; Manning, A.C.; Gloor, E.; Schultz, U.; Seifert, T.; Hänsel, F.; Jordan, A.; Heinmann, M. In-situ measurements of oxygen, carbon monoxide and greenhouse gases from Ochsenkopf tall tower in Germany. Atmos. Meas. Tech. 2009, 2, 573–591. [Google Scholar]
- Winderlich, J.; Chen, H.; Gerbig, C.; Seifert, T.; Kolle, O.; Laverič, J.V.; Kaiser, C.; Höfer, A.; Heimann, M. Continuous low-maintenance CO2/CH4/H2O measurements at the Zotino Tall Tower Observatory (ZOTTO) in Central Siberia. Atmos. Meas. Tech. 2010, 3, 1113–1128. [Google Scholar]
- Flannery, T. The Weather Makers: The History and Future Impact of Climate Change; Atlantic Monthly Press: New York, NY, USA, 2005. [Google Scholar]
- Archer, D. The Long Thaw: How Humans Are Changing the Next 100,000 Years of Earth's Climate; Princeton University Press: Princeton, NJ, USA, 2008. [Google Scholar]
- Kulawik, S.S.; Jones, D.B.A.; Nassar, R.; Irion, E.W.; Worden, J.R.; Bowman, K.W.; Machida, T.; Matsueda, H.; Sawa, Y.; Biraud, S.C.; et al. Characterization of Tropospheric emission spectrometer (TES) CO2 for carbon cycle science. Atmos. Chem. Phys. 2010, 10, 5601–5623. [Google Scholar]
- Dlugokencky, E.J.; Houweling, S.; Bruhwiler, L.; Masarie, K.A.; Lang, P.M.; Miller, J.B.; Tans, P.P. Atmospheric methane levels off: Temporary pause or a new steady-state? Geophys. Res. Lett. 2003, 30, 3–6. [Google Scholar]
- Bousquet, P.; Ciais, P.; Miller, J.B.; Dlugokencky, E.J.; Hauglustaine, D.A.; Prigent, C.; van der Werf, G.R.; Peylin, P.; Brunke, E.G.; Carouge, C.; et al. Contribution of anthropogenic and natural sources to atmospheric methane variability. Nature 2006, 443, 439–443. [Google Scholar]
- Rigby, M.; Prinn, R.G.; Fraser, P.B.; Simmonds, P.G.; Langenfels, R.L.; Huang, J.; Cunnold, D.M.; Steele, L.P.; Krummel, P.B.; Weiss, R.F.; et al. Renewed growth of atmospheric methane. Geophys. Res. Lett. 2008, 35, L22805. [Google Scholar]
- Dlugokencky, E.J.; Bruhwiler, L.; White, J.W.C.; Emmons, L.K.; Novelli, P.C.; Montzka, S.A.; Masarie, K.A.; Lang, P.M.; Crotwell, A.M.; Miller, J.B.; Gatti, L.V.; et al. Observational constraints on recent increases in the atmospheric CH4 burden. Geophys. Res. Lett. 2009, 36, L18803. [Google Scholar]
- Nikitin, A.V.; Lyulin, O.M.; Mikhailenko, S.N.; Perevalov, V.I.; Filippov, N.N.; Grigoriev, I.M.; Morino, I.; Yokota, T.; Kumazawa, R.; Watanabe, T. GOSAT-2009 methane spectral line list in the 5550–6236 cm−1 range. J. Quant. Spectrosc. Radiat. Transf. 2010, 111, 2211–2224. [Google Scholar]
- Kuze, A.; Suto, H.; Nakajima, M.; Hamazaki, T. Thermal and near infrared sensor for carbon observation Fourier-transform spectrometer on the Greenhouse Gases Observing Satellite for greenhouse gases monitoring. Appl. Opt. 2009, 48, 6716–6733. [Google Scholar]
- Yokota, T.; Yoshida, Y.; Eguchi, N.; Tanaka, T.; Watanabe, H.; Maksyutov, S. Global concentrations of CO2 and CH4 retrieved from GOSAT: First preliminary results. Sci. Online Lett. Atmos. 2009, 5, 160–163. [Google Scholar]
- Thome, K.J. Absolute radiometric calibration of Landsat 7 ETM+ using the reflectance-based method. Remote Sens. Environ. 2001, 78, 27–38. [Google Scholar]
- Tonooka, H.; Palluconi, F.D.; Hook, S.J.; Matsunaga, T. Vicarious calibration of ASTER thermal infrared bands. IEEE Trans. Geosci. Remote Sens. 2005, 43, 2733–2746. [Google Scholar]
- Kuze, A.; O'Brien, D.M.; Taylor, T.M.; Day, O.; O'Dell, C.W.; Katakoka, F.; Yoshida, M.; Mitomi, Y.; Bruegee, C.J.; Pollock, H.; et al. Vicarious calibration of the GOSAT sensors using the Railroad Valley desert playa 2010. IEEE Trans. Geosci. Remote Sens. 2010, 48, 4331–4380. [Google Scholar]
- Crosson, E.R. A cavity ring-down analyzer for measuring atmospheric levels of methane, carbon dioxide and water vapor. Appl. Phys. B 2008, 92, 403–408. [Google Scholar]
- Chen, H.; Winderlich, J.; Gerbig, C.; Hoefer, A.; Rella, C.W.; Crosson, E.R.; van Pelt, A.D.; Steinbach, J.; Kolle, O.; Beck, V.; et al. High-accuracy continuous airborne measurements of greenhouse gases (CO2 and CH4) using cavity ring-down spectroscopy (CRDS) technique. Atmos. Meas. Tech. 2010, 3, 375–386. [Google Scholar]
- Corbin, K.D.; Denning, A.S.; Lokupititya, E.Y.; Schuh, A.E.; Miles, N.L.; Davis, K.J.; Richardson, S.; Baker, I.T. Assessing the impact of crops on regional CO2 fluxes and atmospheric concentrations. Tellus B 2010, 62, 521–532. [Google Scholar]
- Zhou, L.X.; Worthy, D.E.J.; Lang, P.M.; Ernst, M.K.; Zhang, X.C.; Wen, Y.P.; Li, J.L. Ten years of atmospheric methane observations at a high elevation site in Western China. Atmos. Environ. 2004, 38, 7041–7054. [Google Scholar]
- Yoshida, Y.; Ota, Y.; Eguchi, N.; Kikuchi, N.; Nobuta, K.; Tran, H.; Morino, I.; Yokota, T. Retrieval algorithm for CO2 and CH4 column abundances from short-wavelength infrared spectral observations by the Greenhouse Gases Observing Satellite. Atmos. Meas. Tech. 2011, 4, 717–734. [Google Scholar]
- O'Dell, C.W.; Connor, B.; Bősch, H.; O'Brien, D.; Frankenberg, C.; Castano, R.; Christi, M.; Crisp, D.; Eldering, A.; Fisher, B.; et al. The ACOS CO2 retrieval algorithm—Part 1: Description and validation against synthetic observations. Atmos. Meas. Tech. Discuss. 2011, 4, 6097–6158. [Google Scholar]
- Butz, A.; Guerlet, S.; Hasekamp, O.; Schepers, D.; Galli, A.; Aben, I.; Frankenberg, C.; Hartmann, J.-M.; Tran, H.; Kuze, A.; et al. Toward accurate CO2 and CH4 observations from GOSAT. Geophys. Res. Lett. 2011, 38, L14812. [Google Scholar]
- Bakwin, P.S.; Tans, P.P.; Hurst, D.F.; Zhao, C. Measurements of carbon dioxide on very tall towers: Results of the NOAA/CMDL program. Tellus Ser. B 1998, 50, 401–415. [Google Scholar]
- Olsen, S.C.; Randerson, J.T. Differences between surface and column atmospheric CO2 and implications for carbon cycle research. J. Geophys. Res. 2004, 109, D02301. [Google Scholar]
- Macatangay, R.; Warneke, T.; Gerbig, C.; Kőrner, S.; Ahmadov, R.; Heimann, M.; Notholt, J. A framework for comparing remotely sensed and in-situ CO2 concentrations. Atmos. Chem. Phys. 2008, 8, 1549–1588. [Google Scholar]
© 2011 by the authors; licensee MDPI, Basel, Switzerland. This article is an open access article distributed under the terms and conditions of the Creative Commons Attribution license (http://creativecommons.org/licg/licenses/by/3.0/).
Share and Cite
Yates, E.L.; Schiro, K.; Lowenstein, M.; Sheffner, E.J.; Iraci, L.T.; Tadić, J.M.; Kuze, A. Carbon Dioxide and Methane at a Desert Site—A Case Study at Railroad Valley Playa, Nevada, USA. Atmosphere 2011, 2, 702-714. https://doi.org/10.3390/atmos2040702
Yates EL, Schiro K, Lowenstein M, Sheffner EJ, Iraci LT, Tadić JM, Kuze A. Carbon Dioxide and Methane at a Desert Site—A Case Study at Railroad Valley Playa, Nevada, USA. Atmosphere. 2011; 2(4):702-714. https://doi.org/10.3390/atmos2040702
Chicago/Turabian StyleYates, Emma L., Kathleen Schiro, Max Lowenstein, Edwin J. Sheffner, Laura T. Iraci, Jovan M. Tadić, and Akihiko Kuze. 2011. "Carbon Dioxide and Methane at a Desert Site—A Case Study at Railroad Valley Playa, Nevada, USA" Atmosphere 2, no. 4: 702-714. https://doi.org/10.3390/atmos2040702
APA StyleYates, E. L., Schiro, K., Lowenstein, M., Sheffner, E. J., Iraci, L. T., Tadić, J. M., & Kuze, A. (2011). Carbon Dioxide and Methane at a Desert Site—A Case Study at Railroad Valley Playa, Nevada, USA. Atmosphere, 2(4), 702-714. https://doi.org/10.3390/atmos2040702