
Analysis of Near-Surface Wind Shear Characteristics over Land in China

1
Haizhuang Wind Power Co., Ltd., China State Shipbuilding Corp. (CSSC), Chongqing 401120, China
2
Economic Transformation of Climate Resources Key Laboratory, China Meteorological Administration, Chongqing 401120, China
3
Chongqing Shete Meteorological Application Research Institute, Chongqing Meteorological Service, Chongqing 401120, China
*
Author to whom correspondence should be addressed.
Atmosphere 2024, 15(5), 582; https://doi.org/10.3390/atmos15050582
Submission received: 28 March 2024
/
Revised: 3 May 2024
/
Accepted: 7 May 2024
/
Published: 10 May 2024
(This article belongs to the Section Biosphere/Hydrosphere/Land–Atmosphere Interactions)
Abstract
:Wind shear is one of the crucial parameters in wind resource assessment and also serves as a vital parameter and basis for determining wind turbines’ selection and hub height. Existing studies have only focused on typical underlying surface areas, but a relatively limited comprehensive analysis of wind shear characteristics in different complex environments remains. This study analyzes the daily and monthly variations in wind shear index (α) at the station scale based on the observations from 754 wind measurement towers across land surfaces in China. The distribution and empirical values of wind shear in different wind regions and underlying surface types are also investigated. The research findings indicate that the wind shear index derived from fitting the complete annual average wind speeds at multiple height levels of meteorological towers can accurately characterize the stratification state of the atmospheric boundary layer. The variation pattern of solar radiation influences the daily α value in typical regions. In mountainous and desert areas, the monthly variation tends to be higher in autumn and winter and lower in spring and summer. However, its monthly variation shows relatively smaller fluctuations in plain regions. The comprehensive α value over land regions in China is 0.135. The α values for I, II, III, and IV wind fields are 0.111, 0.163, 0.1, and 0.153, respectively. Its values for mountainous, plains, grassland, and desert regions are 0.12, 0.273, 0.123, and 0.104, respectively. By conducting statistical analysis on α values across different wind regions, guidance is provided for extrapolating surface wind speeds to hub-height wind speeds. This serves as a reference for wind energy resource assessment, wind turbine selection, and hub height determination in the atmospheric boundary layer of China.
1. Introduction
The accurate characterization of onshore wind energy resources is crucial for supporting a range of analyses needed for the continuously growing wind power industry. The precise estimation of wind speeds at turbine hub heights is primarily utilized to estimate the electricity generation of wind farms and the load on turbines. These estimations provide data support for various technical [1] and life cycle cost analyses [2].
The sparsity of observations hinders the accurate characterization of wind speeds at turbine hub heights, especially in the desert regions of western and northern China. The installation cost of meteorological towers is typically high, and the equipment is expensive. The data from these towers are owned and highly proprietary to wind farm developers or turbine manufacturers. Abundant near-surface wind speed measurements are valuable for characterizing land-based wind resources, but the prerequisite is that they can be accurately extrapolated to turbine hub heights. The wind shear index (α) is one of the crucial parameters in wind resource assessment. It serves as a vital parameter and basis for determining wind turbines’ selection and hub height [3,4]. The traditional method of the power law curve in the wind power industry can be effectively utilized with abundant wind measurement databases. The method utilizes measured data from two or more heights to calculate the α values. Although the power law curve has a long history of accurately predicting the wind speeds in the atmospheric boundary layer, the logarithmic assumption is inappropriate at hub height under stable stratification conditions. This is because turbulence flux decreases, causing the near-surface winds to decouple from the high-altitude winds [5,6]. Additionally, the variation in wind shear index is influenced by both time and surface characteristics. On one hand, the meteorological conditions differ between day and night, affecting the structure and stability of the atmospheric boundary layer. On the other hand, terrain undulations and surface cover types play a significant role in the distribution and structure of wind fields. Different surface cover types affect surface roughness, thereby influencing the dynamics and thermodynamics of the atmospheric boundary layer, consequently affecting the magnitude of the wind shear index.
For wind farms, near-surface wind data are often measured at heights below 100 m, and vertical extrapolation of wind data needs to consider the influence of surface roughness. However, in reality, standard formulas are no longer applicable. Based on extensive data from existing wind towers, the situation is entirely different, and further data mining can be conducted to explore the variation characteristics of near-surface wind shear. Additionally, due to the comprehensive considerations required for the development of wind farms, including geographical location, topography, wind resource conditions, and construction conditions, China has now developed numerous wind power projects in various regions, such as the desert areas in the north, plains in the east and northeast, and mountainous areas in the south or southwest. Among them, typical wind measurement towers or wind farm locations can fully represent the wind conditions of the underlying surfaces of the same type. Currently, existing research only focuses on studying typical underlying surfaces. For instance, Gong et al. [7] analyzed the variation in α values under different underlying surfaces and stability conditions. Li et al. [8] examined the daily variation characteristics of α values using gradient wind observation data from the China Wind Energy Resource Professional Observation Network and the power law curve method from May to October 2009. Yuan et al. [9] investigated the monthly variation characteristics of wind shear and the influence of underlying surfaces on wind shear under different underlying surface conditions (including plateaus, mountains, and plains) using wind data measured at seven sites. The results indicate that wind shear exhibits significant seasonal variations, albeit with distinct characteristics. Zhang and Hu [10] utilized data from a Light Detection and Ranging (LiDAR) system at a wind farm in Jilin Province to study the daily variation patterns of wind shear. The conclusion suggests that high wind shear enhances wind turbines’ power output, reduces output power variability, and decreases uncertainty in the wind-to-electricity conversion process.
In conclusion, there is increasing research on near-surface wind shear in wind farm construction. However, there is still a relative scarcity of wind shear characteristic analyses based on a large amount of wind tower measurements. The purpose of this study is to utilize a multi-year accumulated wind measurement database to analyze the characteristics of wind shear in the near-surface layer over land in different wind regions, terrains, and underlying surface conditions in China. This analysis aims to provide effective guidance for extrapolating surface wind speeds to hub height. Analyzing the characteristics of near-surface wind shear under different conditions provides valuable insights for wind energy resource assessment, wind turbine selection, and hub height determination in various regions of China. Section 2 describes information about the data used in this study and the research methodology. Section 3 analyzed the overall characteristics and spatial distribution of wind shear in the near-surface layer across China and their characteristics in different wind fields and terrains. The discussion of relevant research results and the conclusion can be found in Section 4.
2. Materials and Methods
2.1. Observations of Wind Measurement Tower
This study collected and compiled the observed hub-height wind speed measurements from 754 wind measurement towers across mainland China. The measured meteorological parameters from the wind towers include average, maximum, minimum, and standard deviation values of wind speed, wind direction, temperature, and pressure at the near-surface level (approximately 10 m in height) in 10 min intervals. The actual measurement period of the wind towers ranges from a minimum of 1 year to a maximum of 10 years, covering the period from 2008 to 2023. The measurement periods vary among different sites, with 77.98% having measurement periods of 1–2 years, 14.72% having measurement periods of 2–3 years, and the remaining 7.29% covering other periods (Table 1).
These data are used to analyze the characteristics of comprehensive wind shear in the near-surface layer (below approximately 100 m) for onshore wind turbines in China. Wind measurement towers are equipped with multiple sensors placed along the vertical direction, typically ranging in height from 10 to over 140 m. They are widely used in the wind power industry to characterize the delicate features of wind fields and flow fields at turbine hub heights. The wind speed variation across multiple vertical height layers measured by wind tower observations is superior to single-height observations from conventional meteorological stations, often influenced by surrounding environmental factors. Additionally, the maintenance of wind measurement towers is much more expensive than ground-based stations. Therefore, the limited availability of publicly accessible data makes it difficult to conduct large-scale near-surface wind shear analysis.
The measurements of wind speeds used in this study are sampled at a 10 min average. To balance data quality and quantity, time series lengths exceeding one full year are selected, with data completeness exceeding 95% after outlier removal. The effective wind (horizontal wind) height at each wind tower is at least three heights, and these three height layers are as close to the hub height of the wind turbine (approximately 100 m) as possible to fit and form effective wind shear coefficients at the hub height of the wind turbine. This is because surface conditions highly influence the wind speed profiles. The geographical spatial distribution of towers is illustrated in Figure 1, with scattered locations across regions of varying elevations and underlying surfaces throughout the country.
2.2. Data Processing
This study’s wind measurement data processing mainly utilized Windo-grapher software version 4.0 developed by the Norwegian company Wind-Sim AS. The main aspects of data quality control include checks for data file validity and completeness, examination of climate extremes, assessment of data correlations, verification of variability, evaluation of temporal consistency, and examination of spatial consistency. According to the guidance documents “Methodology of Wind Energy Resource Assessment for Wind Farm (GB/T 18710-2002)” and “Technical Code for Wind Energy Resource Measurement and Assessment of Wind Power Projects (NB/T 311147-2018)”, the specific data quality control procedures are as follows:
- (1)
- Eliminate the data that do not conform to physical principles or typical climate statistical characteristics, such as horizontal wind speed ±20 m s−1, vertical wind speed ±10 m s−1, and temperature ±50 °C.
- (2)
- Eliminate data that are greater than five times the variance.
- (3)
- Eliminate static wind data with less than 0.1 m s−1. According to the 10 min wind speed and direction data, the hourly, daily, and monthly average wind speed and direction data are obtained through summation and averaging when the completeness of hourly, daily, and monthly data is greater than 90%.
- (4)
- When analyzing the monthly variation distribution characteristics, the selected wind tower site data must have completeness of wind data within a day higher than 95%, and the completeness of daily-scale valid data for each month must also exceed 95%. Then, arithmetic averages are computed for the valid data for each month from the complete annual wind data. For analyzing the diurnal variation distribution characteristics, the completeness of wind data at each hour on a daily and monthly scale from complete annual wind data must be at least 95%. Subsequently, arithmetic averages are calculated for the corresponding wind data at each hour.
In this study, the data from 754 sites underwent filtering based on time length, completeness rate, and outlier processing.
2.3. Wind Shear Fitting Method
In the near-surface layer, wind shear is influenced by factors such as atmospheric thermal stability, roughness, height, etc. [11]. Optis et al. [6] discussed six methods for vertical extrapolation in the near-surface layer and pointed out that, to some extent, all of them can accurately estimate wind profiles. However, the wind profile assumed by Hellman in the form of a power law exponent hypothesis suggests that the mixing length varies exponentially with height under neutral atmospheric conditions. The power law formula for the vertical wind speed profile is as follows:
Here, V(z) is the wind speed at height z. V0 is the reference wind speed at a reference height of z0. The parameter α is a dimensionless wind shear exponent. On land, it is typically represented as 0.143 [12,13], while it is usually represented as 0.11 over water bodies [14]. Taking the logarithm of both sides of Equation (1), the formula for the wind shear exponent can be derived as follows:
This study utilizes Equation (2) to calculate the wind shear for the measurements from each inspected wind measurement tower.
2.4. Distribution of Wind Resources Nationwide
Assessing and utilizing wind energy resources within China more precisely is significant. Categorizing wind resources into different levels or classes based on wind power density, wind speed, and hours of electricity generation can better guide the planning and layout of wind power projects and the selection of wind energy utilization technologies. This classification can assist governments and enterprises in more effectively utilizing limited resources and formulating corresponding policy measures to promote the healthy development of the wind power industry. Additionally, categorizing wind resources helps to further study the characteristics and variation patterns of wind energy resources in different regions, providing more reliable data support for wind energy resource assessment and forecasting. The national wind energy resources are categorized into four classes (https://mp.weixin.qq.com/s/ZbbIesyEjeJKhf77kC_YZA, accessed on 6 May 2024):
- (1)
- Class I: Areas excluding Chifeng City, Tongliao City, Xing’an League, and Hulunbuir City in Inner Mongolia Autonomous Region; Urumqi City, Ili Kazakh Autonomous Prefecture, Changji Hui Autonomous Prefecture, Karamay City, and Shihezi City in Xinjiang Uygur Autonomous Region.
- (2)
- Class II: Zhangjiakou City and Chengde City in Hebei Province; Chifeng City, Tongliao City, Xing’an League, and Hulunbuir City in Inner Mongolia Autonomous Region; Zhangye City, Jiayuguan City, and Jiuquan City in Gansu Province.
- (3)
- Class III: Baicheng City and Songyuan City in Jilin Province; Jixi City, Shuangyashan City, Qitaihe City, Suihua City, Yichun City, and Daxing’anling Area in Heilongjiang Province; Areas excluding Zhangye City, Jiayuguan City, and Jiuquan City in Gansu Province; Areas excluding Urumqi City, Ili Kazakh Autonomous Prefecture, Changji Hui Autonomous Prefecture, Karamay City, and Shihezi City in Xinjiang Uygur Autonomous Region; Ningxia Hui Autonomous Region.
- (4)
- Class IV: Areas excluding the first three classes of resource areas.
2.5. Other Datasets
- (1)
- The topographic data in Figure 1 are derived from the Shuttle Radar Topography Mission (SRTM) Digital Elevation Model (DEM) (https://www.earthdata.nasa.gov/sensors/srtm, accessed on 6 May 2024).
- (2)
- The land cover classification data are sourced from the University of Maryland (UMD) Land Cover Classification Scheme based on MODIS data and other auxiliary data (https://glad.umd.edu/, accessed on 6 May 2024). This classification defines fourteen land cover types: ten natural vegetation types, two anthropogenic, and two non-vegetation types.
3. Results
3.1. Wind Shear Analysis over the Typical Underlying Surfaces
3.1.1. Wind Shear Fitting
Based on the actual underlying surface conditions of the observation stations, this study selected measurements from six wind measurement towers (Figure 1) located on three different underlying surfaces (mountains, plains, and desert areas), with time series lengths exceeding two years (Table 2). The comprehensive wind shears for the near-surface layer are calculated by fitting statistical analysis to the annual average wind speeds at each height level. Figure 2 shows that the α values for the terrain areas A# and B# are 0.0979 and 0.125, respectively. The α values for the plain areas C# and D# are 0.295 and 0.361, respectively. Similarly, the α values for the desert areas E# and F# are 0.123 and 0.0871, respectively. The comprehensive wind shears calculated by fitting have all passed the t-test at a 0.01 level. Additionally, the α values in the plain areas are relatively high, exceeding 0.2, while the α values in the mountain and desert areas are closer to each other. Thus, it can be observed that, by fitting the multi-year average wind data from different height layers of meteorological towers, the average wind shear index at the location can be obtained, which can be used to characterize the stability status of the atmospheric boundary layer near the surface.
3.1.2. Analysis of Diurnal Distribution Characteristics of Wind Shear
Figure 3 depicts the variation in the α values over time. The horizontal axis represents the time in whole hours throughout the day (24 h clock, Beijing time), while the vertical axis represents the values of the overall wind shear fitted based on measured wind speeds. It can be observed that the α value is relatively large and stable during the night, while it varies significantly during the morning and evening and is relatively small and stable at midday. This is because solar radiation is solid or absent for extended periods during midday or night-time, and surface temperature changes are minimal, leading to uniform mixing in the atmosphere and a greater likelihood of neutral or stable atmospheric stability. Similarly, the surface temperature rises or falls rapidly during the morning and evening, leading to vigorous atmosphere mixing between upper and lower layers, resulting in significant variations in wind speeds between these layers. In contrast, due to the uniform underlying surfaces of the desert and the plain regions with minimal terrain variations, the wind shear changes gradually and predictably. In mountainous areas, the wind shear is influenced by the large surface roughness and terrain, resulting in localized turbulence, chaotic vertical wind profiles, and even negative wind shear. It is challenging to grasp the changing patterns of atmospheric stratification in the near-surface layers of mountainous areas. When analyzing wind shear and wind resources in mountainous regions, gathering as many observations as possible is essential for analyzing the actual wind conditions in that region.
3.1.3. Analysis of Monthly Variations in Wind Shear Characteristics
Similarly, based on the statistical wind shear results, this study analyzed the monthly variation characteristics of wind shear, as shown in Figure 4. It can be observed that the monthly variation characteristics of wind shear for each tower under different underlying surface conditions are different. In mountainous and desert areas, wind shear generally exhibits larger values in autumn and winter and smaller values in spring and summer. However, in plain areas, the monthly variation in wind shear shows relatively tiny fluctuations. In conclusion, through the analysis of data from typical underlying surface wind tower sites, this study can grasp the changing patterns of wind shear at different time scales, providing a favorable reference basis for subsequent research and practical applications.
3.2. Overall Wind Shear Characteristics
3.2.1. Overall Wind Shear Index Characteristics of Land Surface Regions in China
Through the actual wind data obtained from land surface wind towers, corresponding wind shear index results are obtained. Figure 5 illustrates the overall wind shear index characteristics of land surface regions in China. As depicted in Figure 5a, most sites have α values ranging from 0.06 to 0.2, accounting for approximately 70%. Among them, the interval of 0.14 to 0.16 has the highest proportion, around 11%, followed by 0.08 to 0.12. As shown in the box plot in Figure 5b, α values greater than 0.37 are considered outliers. With 728 valid data samples, the average α value is 0.149, and the skewness value is 0.135. The difference between the mean and skewness values, influenced by the presence of outliers, is 10.37%. However, the skewness better reflects the probability of variable occurrences and the distribution of numerical values. Therefore, the skewness value of α is more reasonable, consistent with previous studies where α was considered as 0.14 or one-seventh [8,9,12,15].
3.2.2. Wind Shear Characteristics in Different Wind Fields
The division of wind fields nationwide provides a reliable scientific basis for the study of wind resources and the development of wind farms. However, there has been limited research on the boundary layer wind profiles in different wind fields. This study discusses wind shear characteristics and recommends optimal values based on the classification of varying wind fields, with the skewness value serving as the standard for genuine information. As shown in Figure 6, there are significant differences in the α values among the four wind zones. For the most favorable resource-rich I wind field, the α value is 0.111, with relatively small fluctuations in α values at the sites, indicating a relatively uniform and stable resource distribution. This is attributed to the simple and uniform underlying surfaces and flat terrain in most Class I wind fields. On the other hand, the III wind field exhibits the smallest α value (α = 0.1), which is slightly lower than the I, as it is often adjacent to the I wind field and shares similar α values. In contrast, the α values in II and IV wind fields fluctuate more significantly, at 0.163 and 0.153, respectively, due to the complex and varied underlying surfaces and extensive distribution in these areas.
3.2.3. Wind Shear Characteristics in Different Terrains
Similarly, the wind shear characteristics and effective values are statistically analyzed based on the characteristics of different underlying surfaces. As shown in Figure 7 below, this study utilized high-precision DEM data and land surface vegetation classification datasets to categorize the terrain of the observed sites. Under conditions where the roughness differences are insignificant, multiple observed sites are categorized into four major types—mountainous, desert, grassland, and plain—for further discussion. It is evident from the box plots that, after excluding outliers beyond the quartiles, consistent α values are obtained in different terrains. The skewness values are 0.12, 0.123, and 0.104, respectively, with relatively small fluctuations in α values. In contrast, the plain terrain exhibited higher α values, with mean and skewness values of 0.256 and 0.273, respectively. It is hoped that, through the statistical analysis of wind shear in different terrain types, effective reference points can be provided for the subsequent development of wind farms in corresponding wind zones.
4. Conclusions
This study analyzed the wind shear index calculation and daily and monthly variations, as well as the distribution and empirical values of wind shear at the site scale, different wind zones, and different underlying surfaces using actual data from 754 wind towers on China’s land surface. The research findings are as follows:
- (1)
- Wind shear index α, obtained from multi-year average wind data at different heights of wind towers, accurately characterizes the stratification of the atmospheric boundary layer near the surface.
- (2)
- The typical region’s wind shear index α exhibits larger and more stable values at night, significant variations during the morning and evening, and smaller yet stable values at midday. This pattern arises from the balance of surface temperatures due to solar solid radiation or its absence, resulting in uniform atmosphere mixing between upper and lower layers.
- (3)
- Wind shear monthly variations differ across sites with different underlying surface conditions. In mountainous and desert areas, they generally align with the typical pattern of being more prominent in autumn and winter and smaller in spring and summer. However, in plain areas, monthly fluctuations in wind shear are relatively minor.
- (4)
- The overall wind shear index for China’s land surface regions is 0.135. The α values for Class I, II, III, and IV wind zones are 0.111, 0.163, 0.1, and 0.153, respectively. The wind shear index α values for mountainous, plains, grassland, and desert areas are 0.12, 0.273, 0.123, and 0.104, respectively.
Through statistical analysis of wind shear in different wind fields, this study provides a feasible method for extrapolating surface wind speeds to hub-height wind speeds. It serves as a reference for wind energy resource assessment, wind turbine selection, and hub-height determination in various regions of China.
Author Contributions
L.Y. and F.Y. led the writing of this paper and acknowledge responsibility for the experimental data and results. Q.L. and X.R. drafted the paper, and X.R. and F.Z. led the consolidation of the dataset. This paper is written in cooperation with all of the co-authors. All authors have read and agreed to the published version of the manuscript.
Funding
This research was funded by the Research and Application of Cross-Scale Wind Resource Assessment Technology for Wind Farms Based on Numerical Models Project, grant number YJ23.006. The article publishing charge (APC) is funded by the Haizhuang Wind Power Co., Ltd., China State Shipbuilding Corp. (CSSC).
Institutional Review Board Statement
Not applicable.
Informed Consent Statement
Not applicable.
Data Availability Statement
Data are contained within the article.
Acknowledgments
We are grateful for the datasets provided by the Shuttle Radar Topography Mission (SRTM) Digital Elevation Model (DEM), https://www.earthdata.nasa.gov/sensors/srtm (accessed on 28 March 2024). The land cover classification data are sourced from the University of Maryland (UMD) Land Cover Classification Scheme based on MODIS data and other auxiliary data, https://glad.umd.edu/ (accessed on 28 March 2024). The measurements of the wind tower are from Haizhuang Wind Power Co., Ltd., China State Shipbuilding Corp (CSSC), https://www.cssc-hz.com/?en/ (accessed on 28 March 2024). The authors would like to thank all their colleagues at the observation stations on the TP for maintaining the instruments.
Conflicts of Interest
The authors declare that they have no known competing financial interests or personal relationships that could have appeared to influence the work reported in this paper. The authors are employees of Haizhuang Wind Power Co., Ltd. This paper reflects the views of the scientists and not the company.
References
- Mahoney, W.P.; Parks, K.; Wiener, G.; Liu, Y.; Myers, W.L.; Sun, J.; Delle Monache, L.; Hopson, T.; Johnson, D.; Haupt, S.E. A wind power forecasting system to optimize grid integration. IEEE Trans. Sustain. Energy 2012, 3, 670–682. [Google Scholar] [CrossRef]
- de Jong, P.; Dargaville, R.; Silver, J.; Utembe, S.; Kiperstok, A.; Torres, E.A. Forecasting high proportions of wind energy supplying the Brazilian Northeast electricity grid. Appl. Energy 2017, 195, 538–555. [Google Scholar] [CrossRef]
- Liao, M.F.; Xu, K.; Wu, B.; Yuan, K.F. Effect of wind shear on wind turbine power. J. Shenyang Univ. Technol. 2008, 30, 163–167. [Google Scholar] [CrossRef]
- Wang, Y.; Cui, Y.F.; Yuan, H.L.; Song, J.B. Study on Calculation Method of Wind Shear Index in Plain Area. Northwest Hydropower 2019, 5, 95–99. [Google Scholar] [CrossRef]
- Optis, M.; Monahan, A.; Bosveld, F.C. Moving Beyond Monin–Obukhov Similarity Theory in Modelling Wind-Speed Profiles in the Lower Atmospheric Boundary Layer under Stable Stratification. Bound.-Lay. Meteorol. 2014, 153, 497–514. [Google Scholar] [CrossRef]
- Optis, M.; Bodini, N.; Debnath, M.; Doubrawa, P. New methods to improve the vertical extrapolation of near-surface offshore wind speeds. Wind Energy Sci. 2021, 6, 935–948. [Google Scholar] [CrossRef]
- Gong, X.; Zhu, R.; Li, Z.C. Study of Near-Surface Wind Shear Exponents of Different Regions in China. Meteorol. Mon. 2018, 44, 1160–1168. [Google Scholar] [CrossRef]
- Li, Y.; Liang, H.H.; Wang, S.D.; Zhou, Q.; Guo, X.X.; Qiao, H. Study of the Near Surface Wind Shear Daily Variation Characteristics Based on China’s Wind Power Resources Professional Observation Network. J. Nat. Resour. 2012, 27, 1362–1372. [Google Scholar] [CrossRef]
- Yuan, H.L.; Liu, J.T.; Chen, B.; Wang, Y. Analysis of Monthly Variation Characteristics of Surface Layer Wind Shear over Different Land Surfaces. Northwest Hydropower 2023, 4, 80–83. [Google Scholar] [CrossRef]
- Zhang, S.Y.; Hu, F. A study on effects of boundary layer meteorology to wind turbines’ power performance. Renew. Energy Resour. 2017, 35, 427–436. [Google Scholar] [CrossRef]
- Ryu, G.H.; Kim, Y.G.; Kwak, S.J.; Choi, M.S.; Jeong, M.S.; Moon, C.J. Atmospheric Stability Effects on Offshore and Coastal Wind Resource Characteristics in South Korea for Developing Offshore Wind Farms. Energies 2022, 15, 1305. [Google Scholar] [CrossRef]
- Touma, J.S. Dependence of the wind profile power law on stability for various locations. J. Air Pollut. Control Assoc. 1977, 27, 863–866. [Google Scholar] [CrossRef]
- Zhu, R.Z.; Xue, H. Calculation of Wind Energy and Distribution of Wind Energy Resources in China. Meteorol. Mon. 1981, 7, 26–28. [Google Scholar] [CrossRef]
- Hsu, S.A.; Meindl, E.A.; Gilhousen, D.B. Determining the power-law wind-profile exponent under near-neutral stability conditions at sea. J. Appl. Meteorol. 1994, 33, 757–765. [Google Scholar]
- Ramon, J.; Lledó, L.; Torralba, V.; Soret, A.; Doblas-Reyes, F.J. What global reanalysis best represents near-surface winds? Q. J. R. Meteorol. Soc. 2019, 145, 3236–3251. [Google Scholar] [CrossRef]
Figure 1.
(a) The regional topographic map of China in meters and (b) the land cover classification (1—Evergreen Needleleaf Forest, 2—Evergreen Broadleaf Forest, 3—Deciduous Needleleaf Forest, 4—Deciduous Broadleaf Forest, 5—Mixed Forest, 6—Shrubland, 7—Open Shrubland, 8—Grassland, 9—Bare or Sparse Vegetation, 10—Cropland, 11—Non-Irrigated Cropland, 12—Urban and Built-Up, 13—Snow and Ice), along with the spatial distribution of wind measurement tower stations. The red “+” symbols represent the positions of the wind measurement towers, green hexagons represent representative stations for typical terrains (mountain areas: A# and B#, plains: C# and D#, and desert areas: E# and F#), thick solid black lines represent national and provincial boundaries, thin solid lines represent rivers, and blank areas represent water bodies.
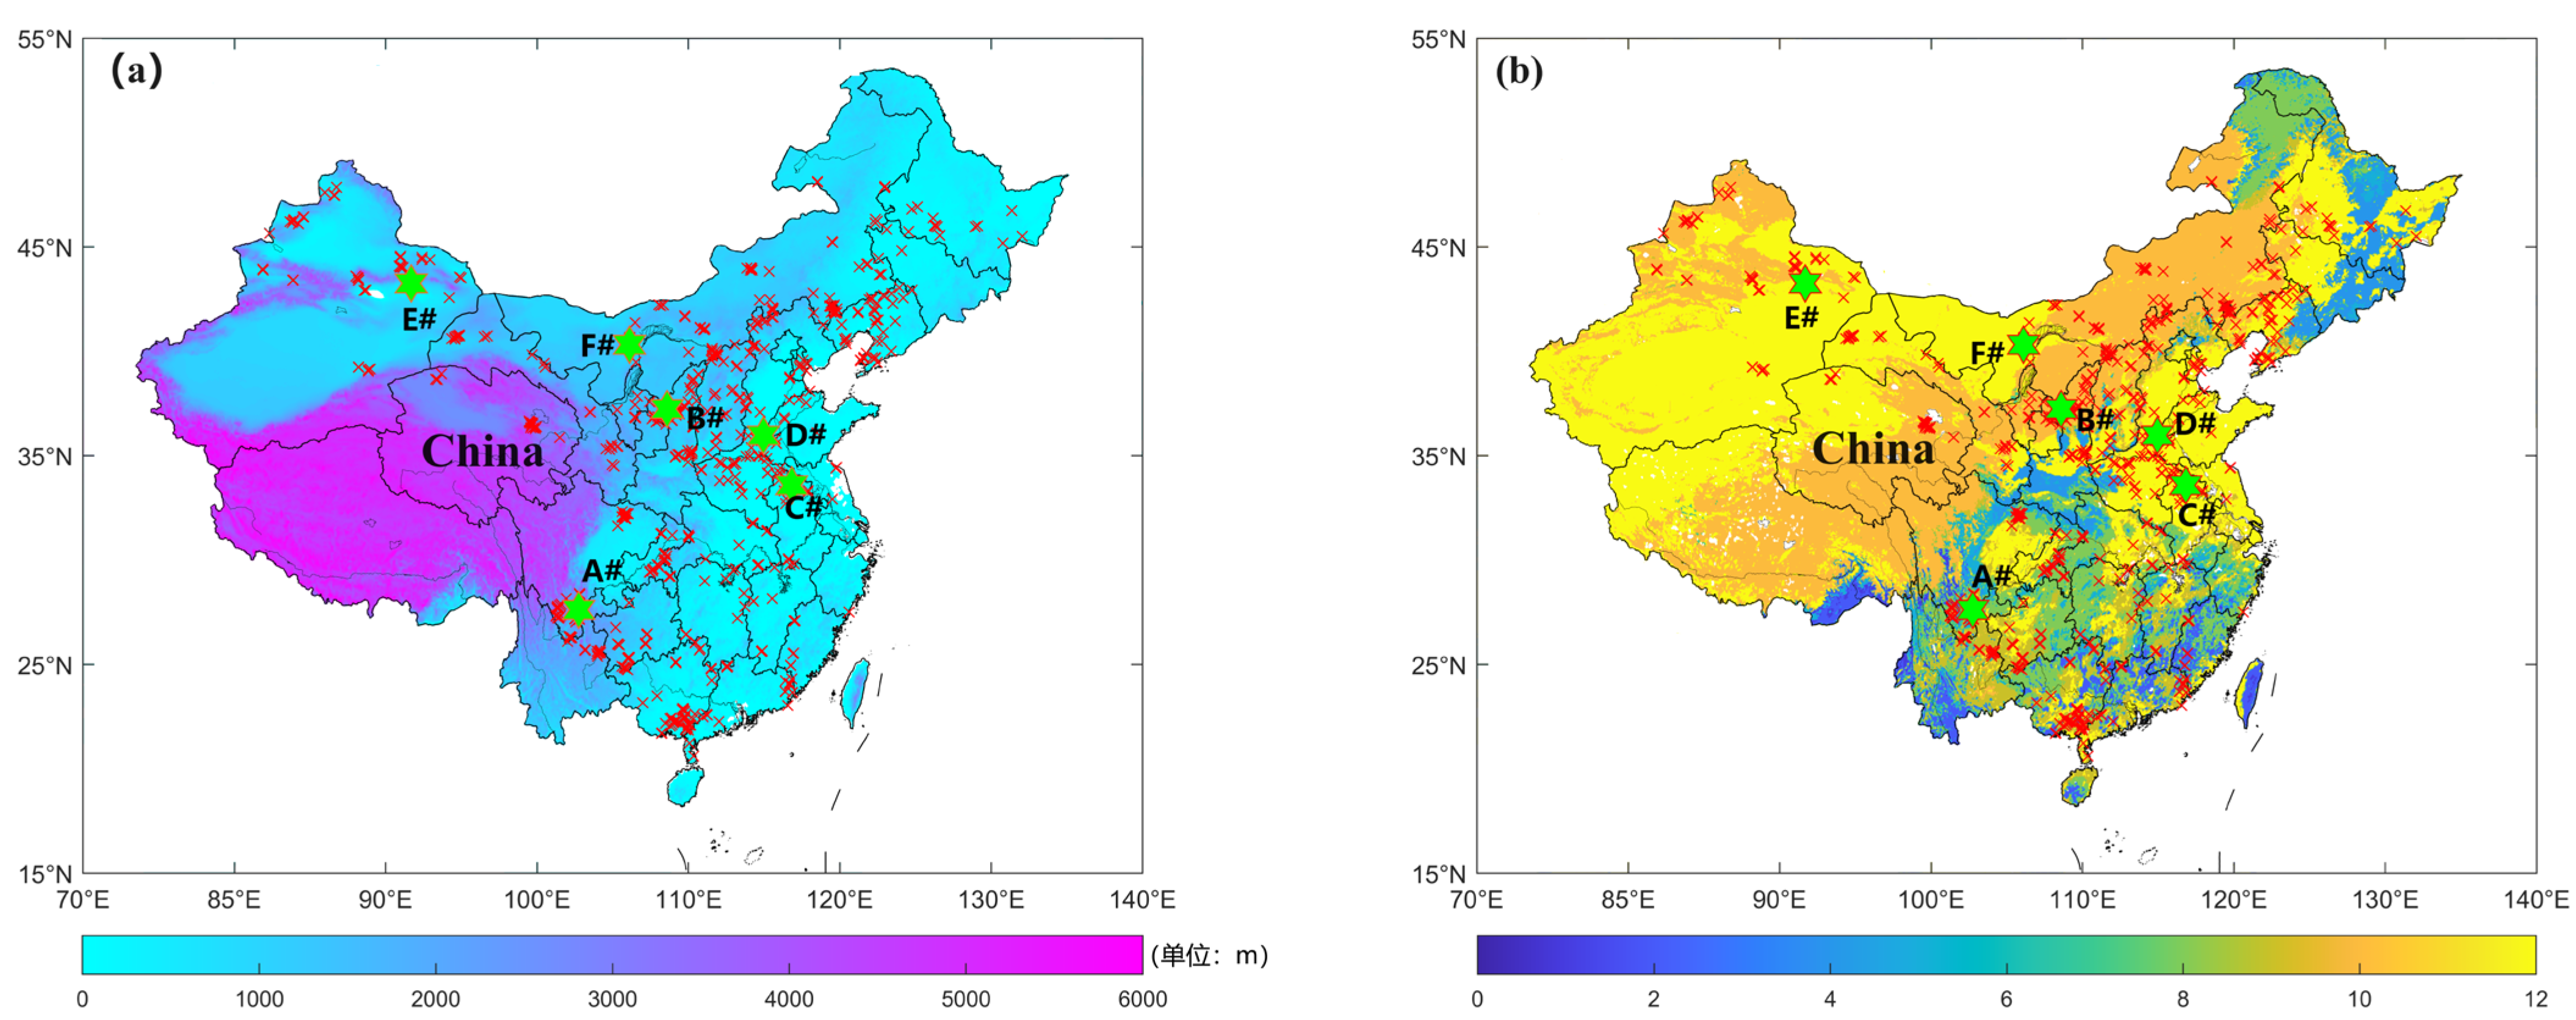
Figure 2.
Wind shear fitting for wind measurement towers demonstrating three different terrains (mountains, plain, desert).
Figure 2.
Wind shear fitting for wind measurement towers demonstrating three different terrains (mountains, plain, desert).

Figure 3.
Analysis of diurnal variations in wind shear measured by wind towers in three different terrain types. The horizontal lines represent the average wind shear coefficient values for different stations.
Figure 3.
Analysis of diurnal variations in wind shear measured by wind towers in three different terrain types. The horizontal lines represent the average wind shear coefficient values for different stations.
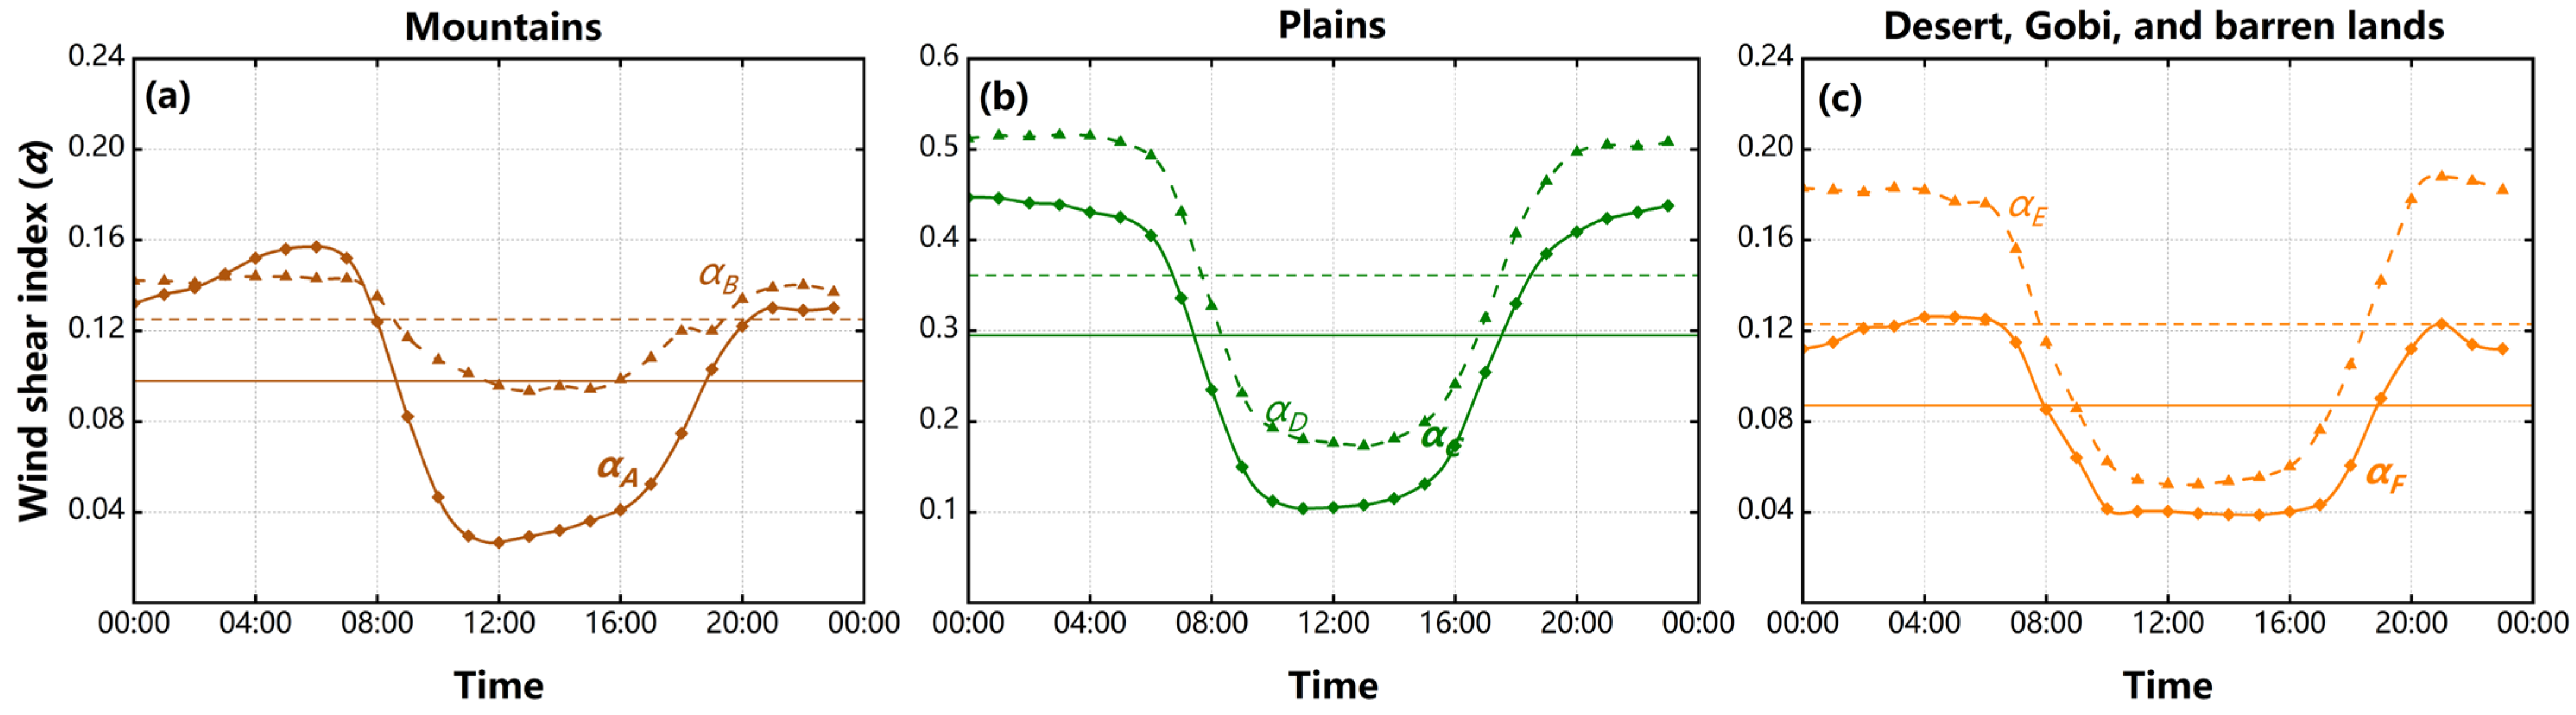
Figure 4.
Monthly variation analysis of wind shear measured by wind towers in three different terrain types.
Figure 4.
Monthly variation analysis of wind shear measured by wind towers in three different terrain types.
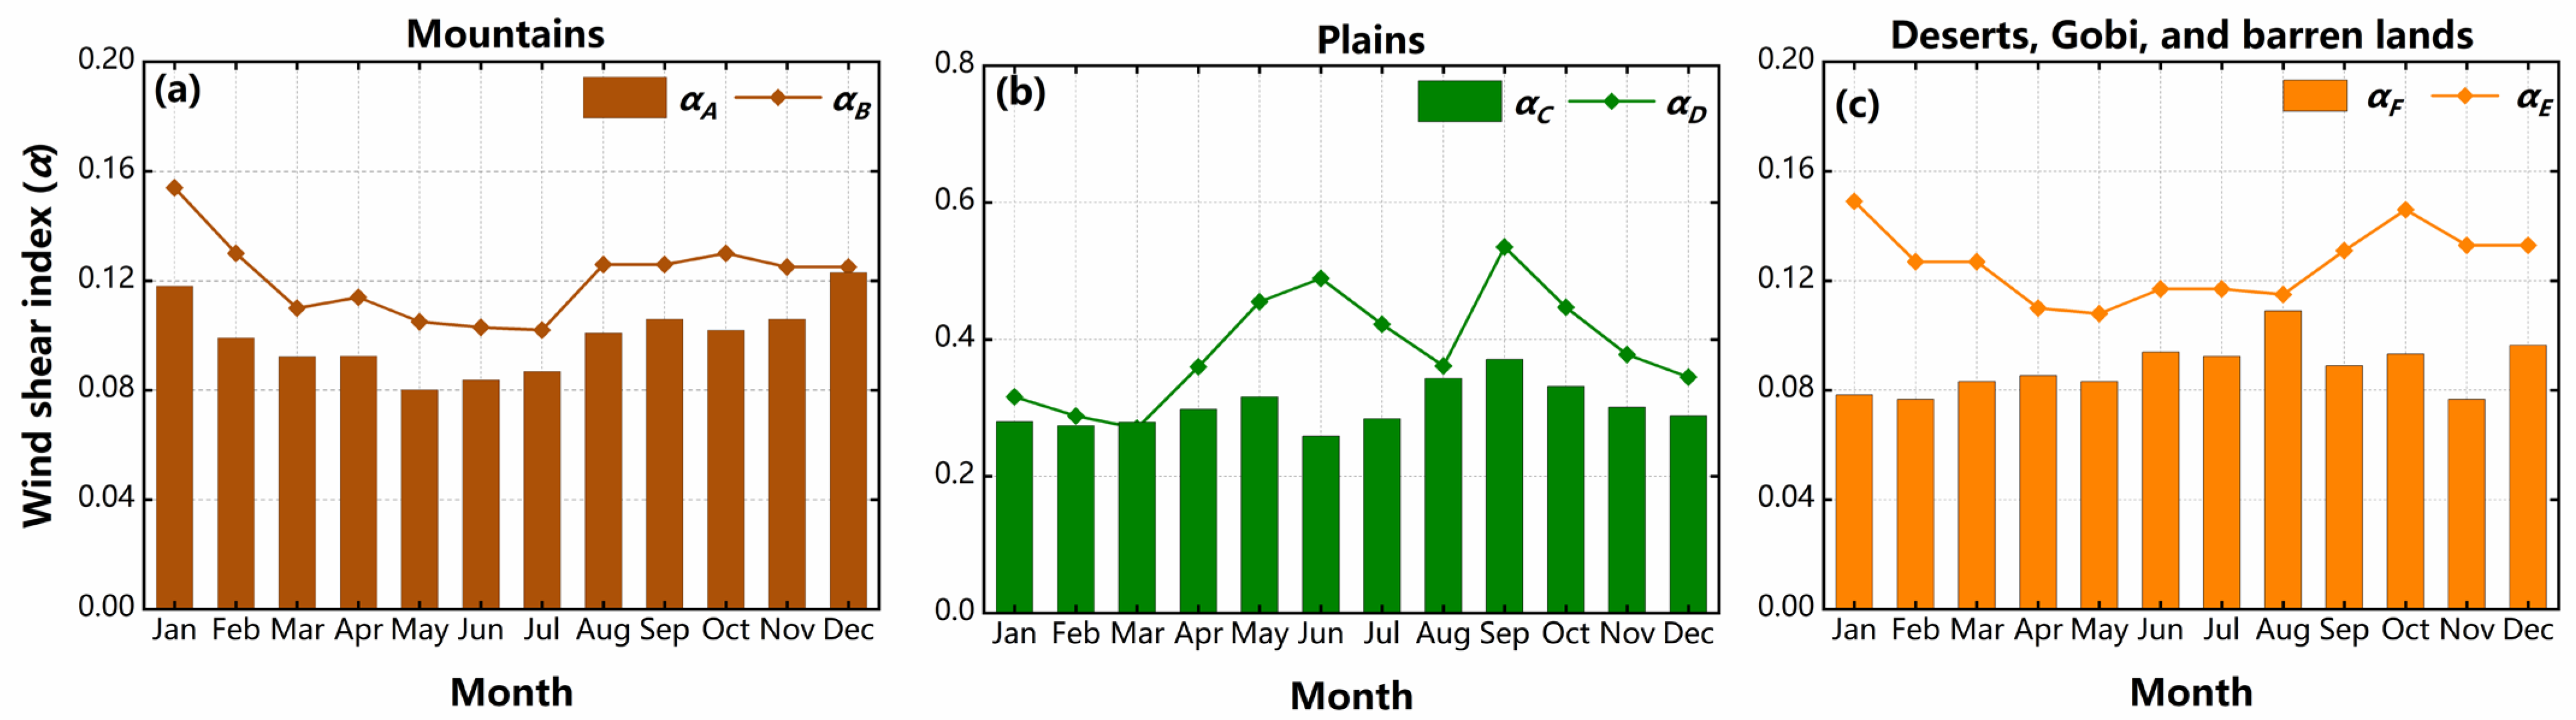
Figure 5.
Statistical analysis of overall wind shear characteristics of land surface regions in China.
Figure 5.
Statistical analysis of overall wind shear characteristics of land surface regions in China.

Figure 6.
Statistical analysis of wind shear index characteristics in different wind zones.
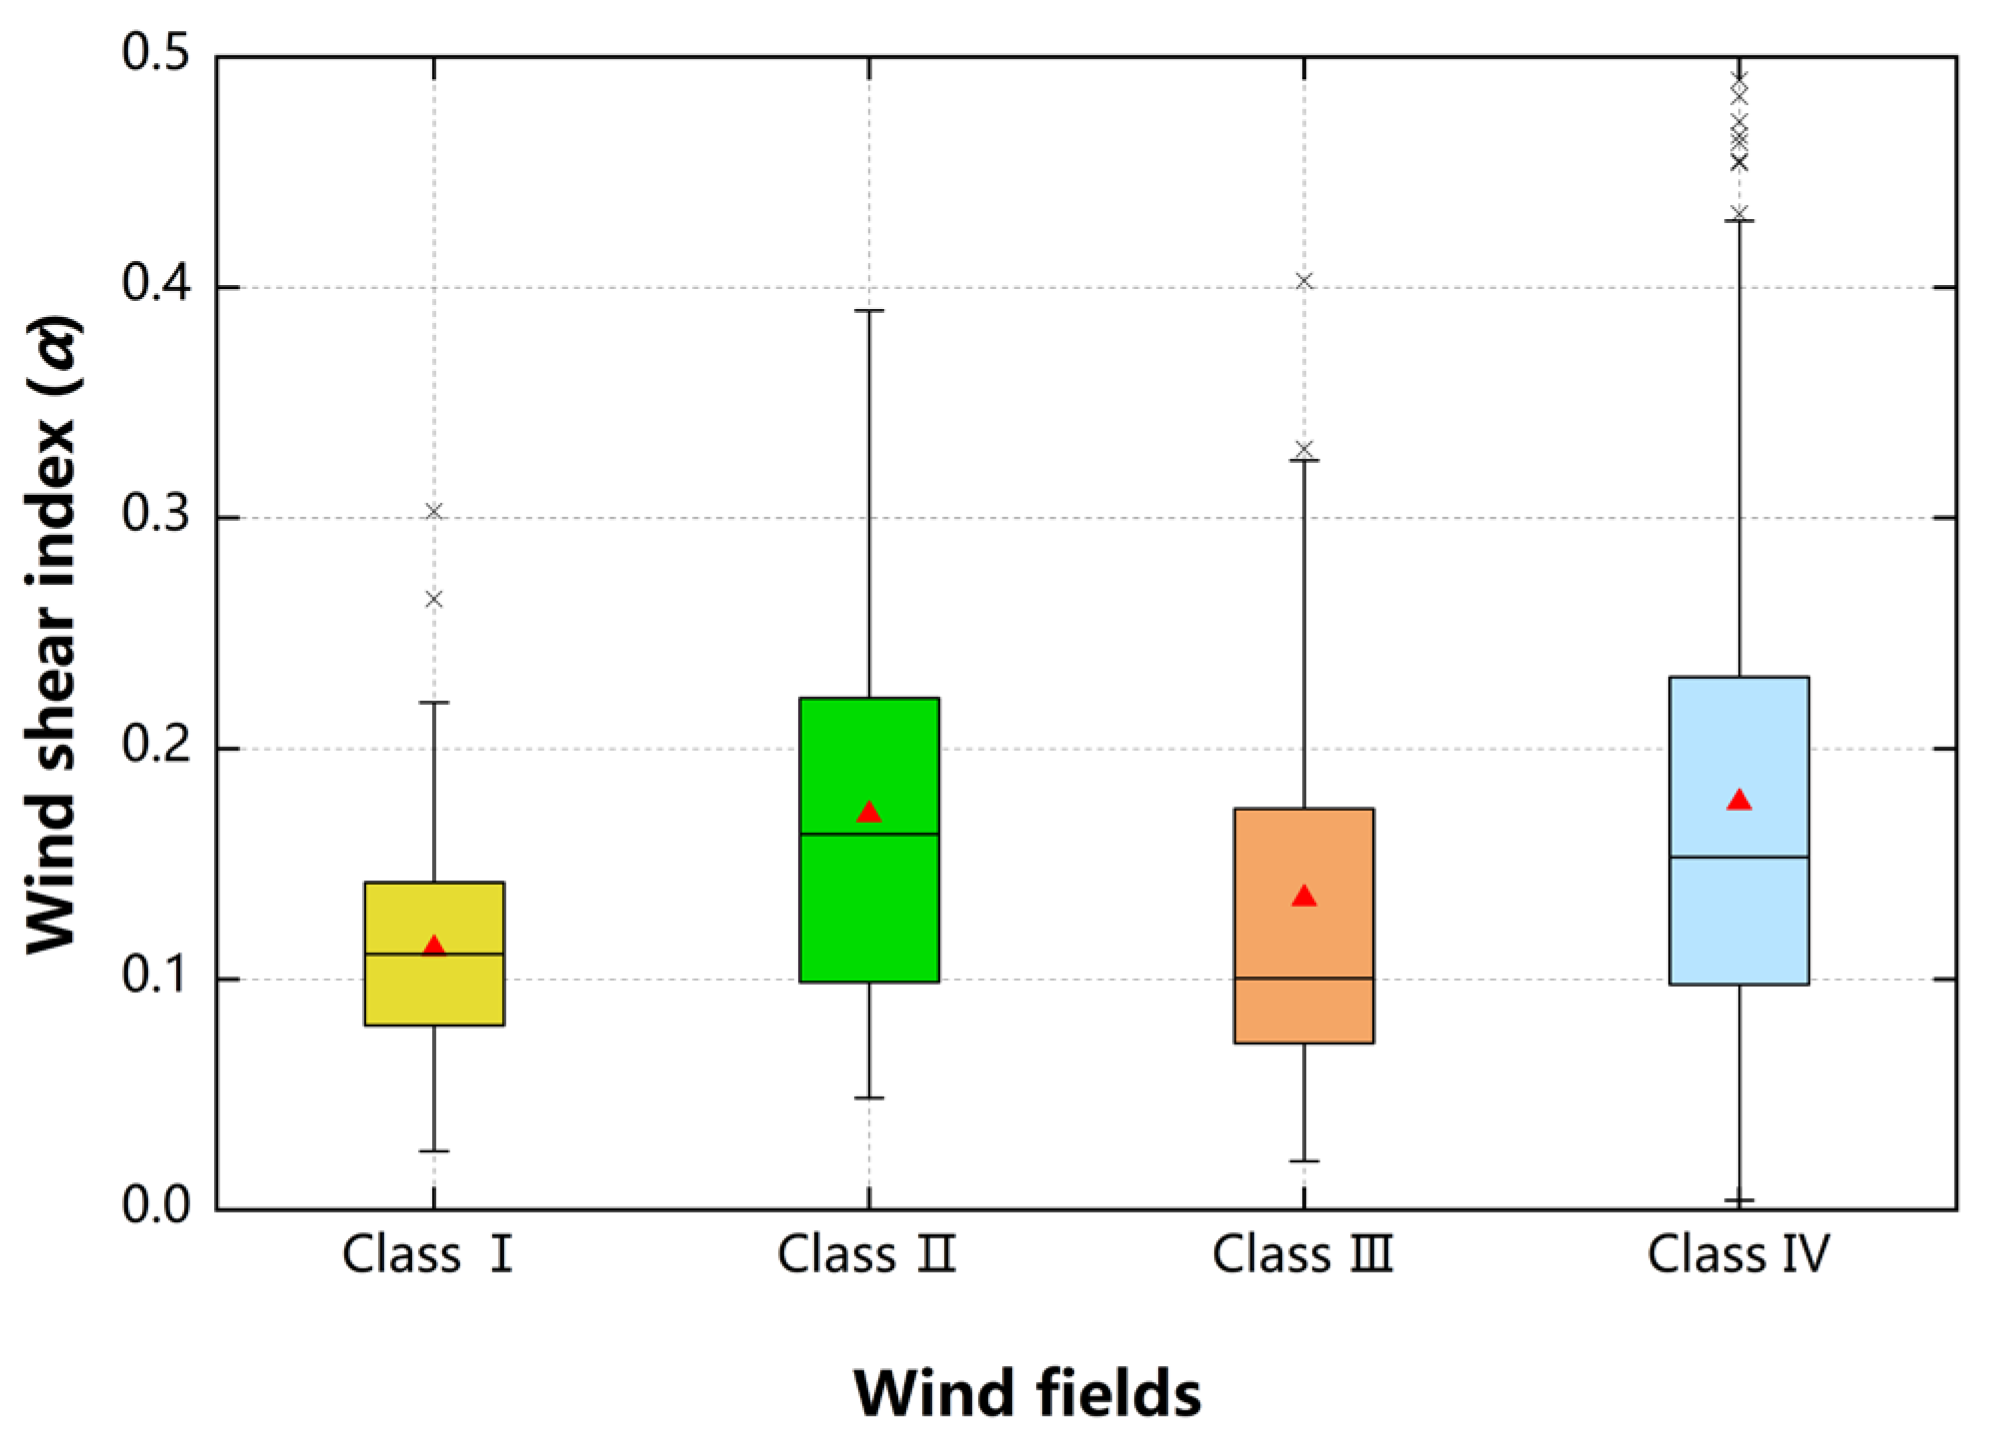
Figure 7.
A box plot of wind shear characteristics in different terrains.


Table 1.
The detailed information from the utilized data of 754 wind measurement towers in this study.
Table 1.
The detailed information from the utilized data of 754 wind measurement towers in this study.
| Category | Number of Stations | Rate |
|---|---|---|
| Total | 754 | 100% |
| Land cover types | ||
| Mountains | 141 | 18.70% |
| Plains | 192 | 25.46% |
| Desert, gobi, and barren lands | 421 | 55.83% |
| Measurement duration | ||
| 1–2 years | 587 | 77.98% |
| 2–3 years | 110 | 14.72% |
| Above 3 years | 57 | 7.29% |
Table 2.
The detailed information from the utilized data of 6 wind measurement towers in this study.
Table 2.
The detailed information from the utilized data of 6 wind measurement towers in this study.
| Land Cover Types | No. | Measurement Period | Completeness Rate |
|---|---|---|---|
| Mountains | A# | 2013.11.13–2018.12.17 | 96.92% |
| B# | 2013.01.01–2021.12.31 | 99.58% | |
| Plains | C# | 2015.06.17–2020.07.13 | 98.91% |
| D# | 2017.05.14–2021.06.02 | 97.87% | |
| Desert, Gobi, and barren lands | E# | 2017.01.17–2018.07.18 | 100% |
| F# | 2013.07.01–2016.05.23 | 95.99% |
Disclaimer/Publisher’s Note: The statements, opinions and data contained in all publications are solely those of the individual author(s) and contributor(s) and not of MDPI and/or the editor(s). MDPI and/or the editor(s) disclaim responsibility for any injury to people or property resulting from any ideas, methods, instructions or products referred to in the content. |
© 2024 by the authors. Licensee MDPI, Basel, Switzerland. This article is an open access article distributed under the terms and conditions of the Creative Commons Attribution (CC BY) license (https://creativecommons.org/licenses/by/4.0/).
Share and Cite
MDPI and ACS Style
Yuan, L.; Yang, F.; Ruan, X.; Zou, F.; Luo, Q. Analysis of Near-Surface Wind Shear Characteristics over Land in China. Atmosphere 2024, 15, 582. https://doi.org/10.3390/atmos15050582
AMA Style
Yuan L, Yang F, Ruan X, Zou F, Luo Q. Analysis of Near-Surface Wind Shear Characteristics over Land in China. Atmosphere. 2024; 15(5):582. https://doi.org/10.3390/atmos15050582
Chicago/Turabian StyleYuan, Ling, Fengzhi Yang, Xia Ruan, Feng Zou, and Qi Luo. 2024. "Analysis of Near-Surface Wind Shear Characteristics over Land in China" Atmosphere 15, no. 5: 582. https://doi.org/10.3390/atmos15050582
Note that from the first issue of 2016, this journal uses article numbers instead of page numbers. See further details here.