
Modeling Yield of Irrigated and Rainfed Bean in Central and Southern Sinaloa State, Mexico, Based on Essential Climate Variables

 , ,
, , 
Abstract
:1. Introduction
- (a)
- For essential climate variables, using the National Meteorological Service (SMN)–National Water Commission (CONAGUA) database [23], daily series of precipitation and maximum–minimum temperatures were obtained. To obtain reliable, long-term, good quality results [24,25], the SMN–CONAGUA daily series were homogenized using the standard normal homogeneity test method [26]. With the homogenized series, the mean daily temperature (meanT) was determined. The annual series of AMT, MMT, AmT, mmT, AMeT, MMeT, average bean degree days (ABDD) [14], CET, and CEP were then calculated.
- (b)
- From the European Space Agency (ESA) experimental break-adjusted COMBINED Product (version 07.1) [27] with a spatial resolution of 0.25° × 0.25°, daily soil moisture was obtained. These data were obtained for two points near the Culiacán and Rosario stations, respectively. ASM was calculated for each year.
- (c)
- From the Agrifood and Fisheries Information Service (SIAP) [28], the annual series of IBY and RBY were obtained.
2. Materials and Methods
2.1. Study Area
2.2. Essential Climate Variables
2.2.1. Quality Control and Homogenization of Meteorological Series
2.2.2. Temperatures: Average Maximum (AMT), Maximum Maximorum (MMT), Average Minimum (AmT), Minimum Minimorum (mmT), Average Mean (AMeT) and Maximorum Mean (MMeT)
2.2.3. Average Bean Degree Days (ABDD), Cumulative Reference Evapotranspiration (CET), and Cumulative Effective Precipitation (CEP)
2.2.4. Average Surface Soil Moisture (ASM)
2.3. Agricultural Variables
Irrigated (IBY) and Rainfed (RBY) Bean Yield for the Autumn–Winter Cycle
2.4. Mathematical Equations That Govern the Statistical Analyses, Applied to Agricultural Variables and Essential Climate Variables
2.4.1. Normalization
2.4.2. Normality Tests
Shapiro–Wilk Method
Anderson–Darling Method
Lilliefors Method
Jarque–Bera Method
2.4.3. Correlations
Pearson (PC)
Spearman (SC)
2.4.4. Hypothesis Tests
2.4.5. Multiple Linear Regressions (MLR)
2.5. Validation of Mathematical Models
- (1)
- (2)
- Goodness-of-fit statistics were calculated: R2, PC, mean error (ME), root mean square error (RMSE), mean error absolute (MEA), percentage of error mean (PEM), percentage of error absolute mean (PEAM), and Theil’s U2 statistic (U2). To comply with the linearity hypothesis, in each MLR, the condition PC ≥ CCP ∴ CP ≠ 0 was met [7].
- (3)
- For the analysis of severe non-multicollinearity, the variance inflation factor (VIF) and tolerance (To) were initially calculated. For severe non-multicollinearity, it was verified that R2 ≤ 0.800, VIF ≤ 5.000 ∴ To > 0.200 [60], as cited by [61,62]. In the models, the variables that presented severe multicollinearity were eliminated, and each MLR was subsequently recalculated.
- (4)
- For the homogeneity, it was verified that the average of each residual series was zero [63].
- (5)
- A normality analysis was applied to the residuals of each MLR. Normality methods were the same as for PC and SC.
2.6. Software Used and Statistical Significance
3. Results
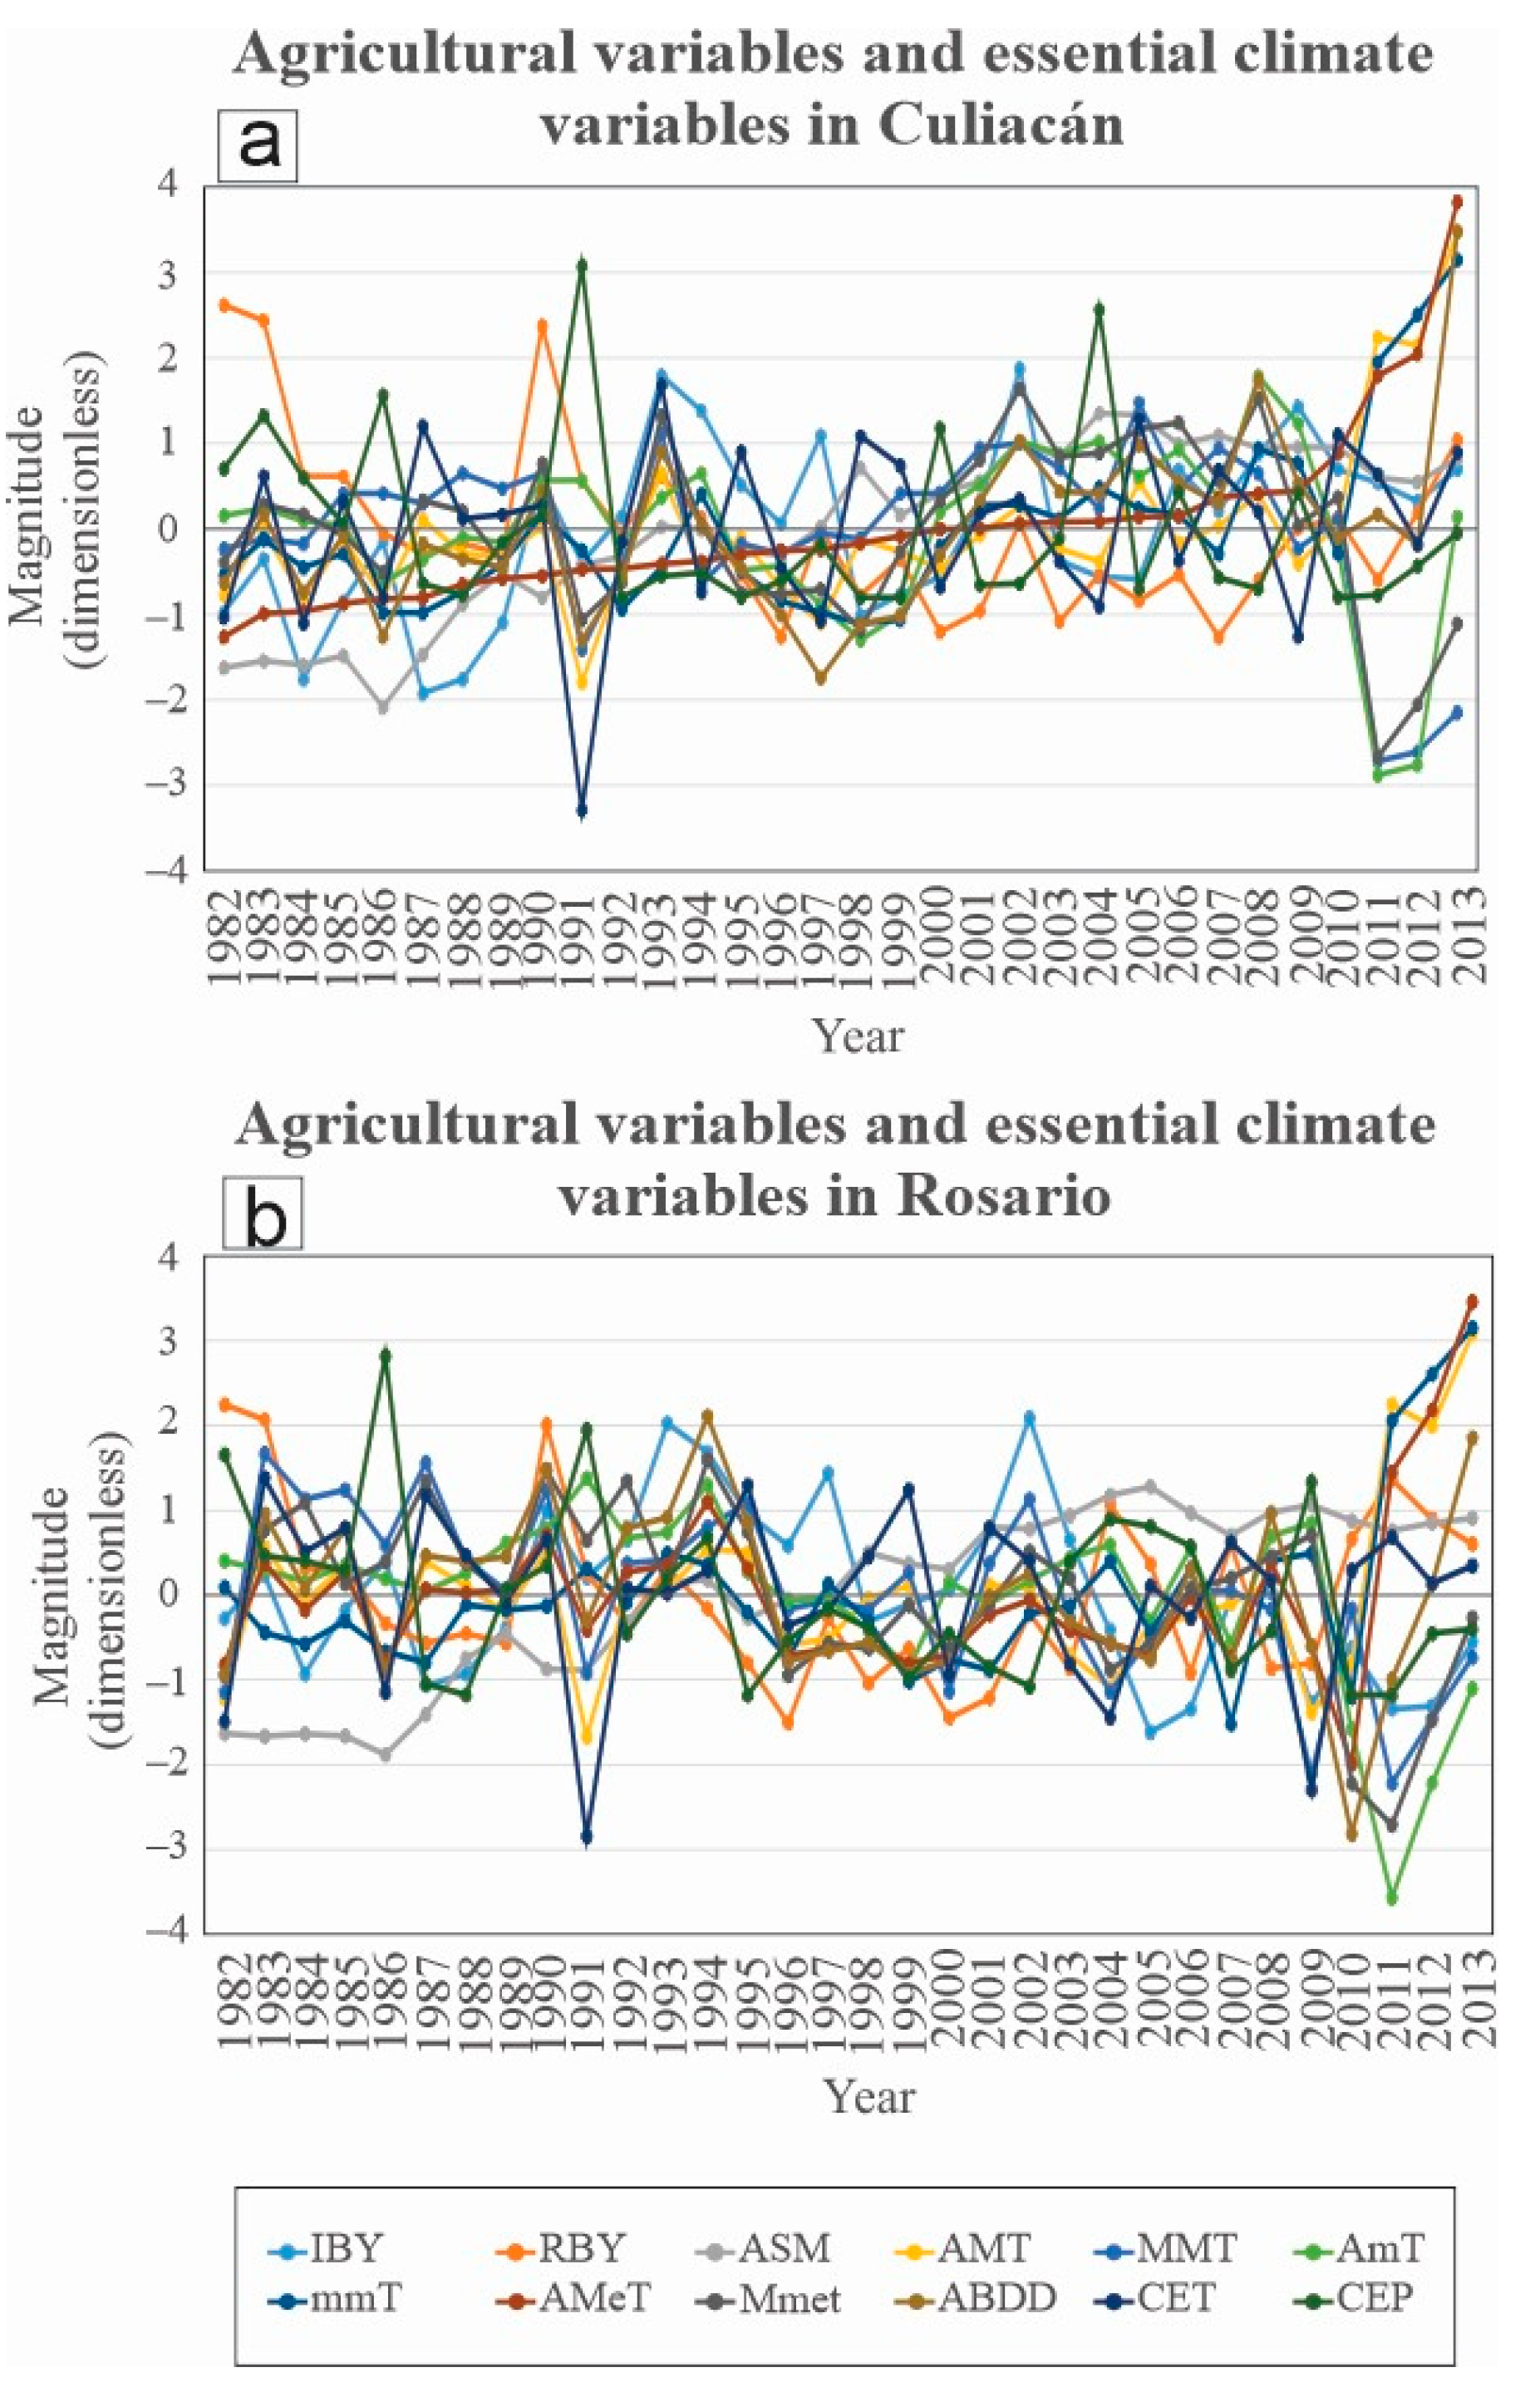
3.1. Agricultural Variables and Essential Climate Variables ()
3.2. Correlation
3.3. Models
3.4. Validation
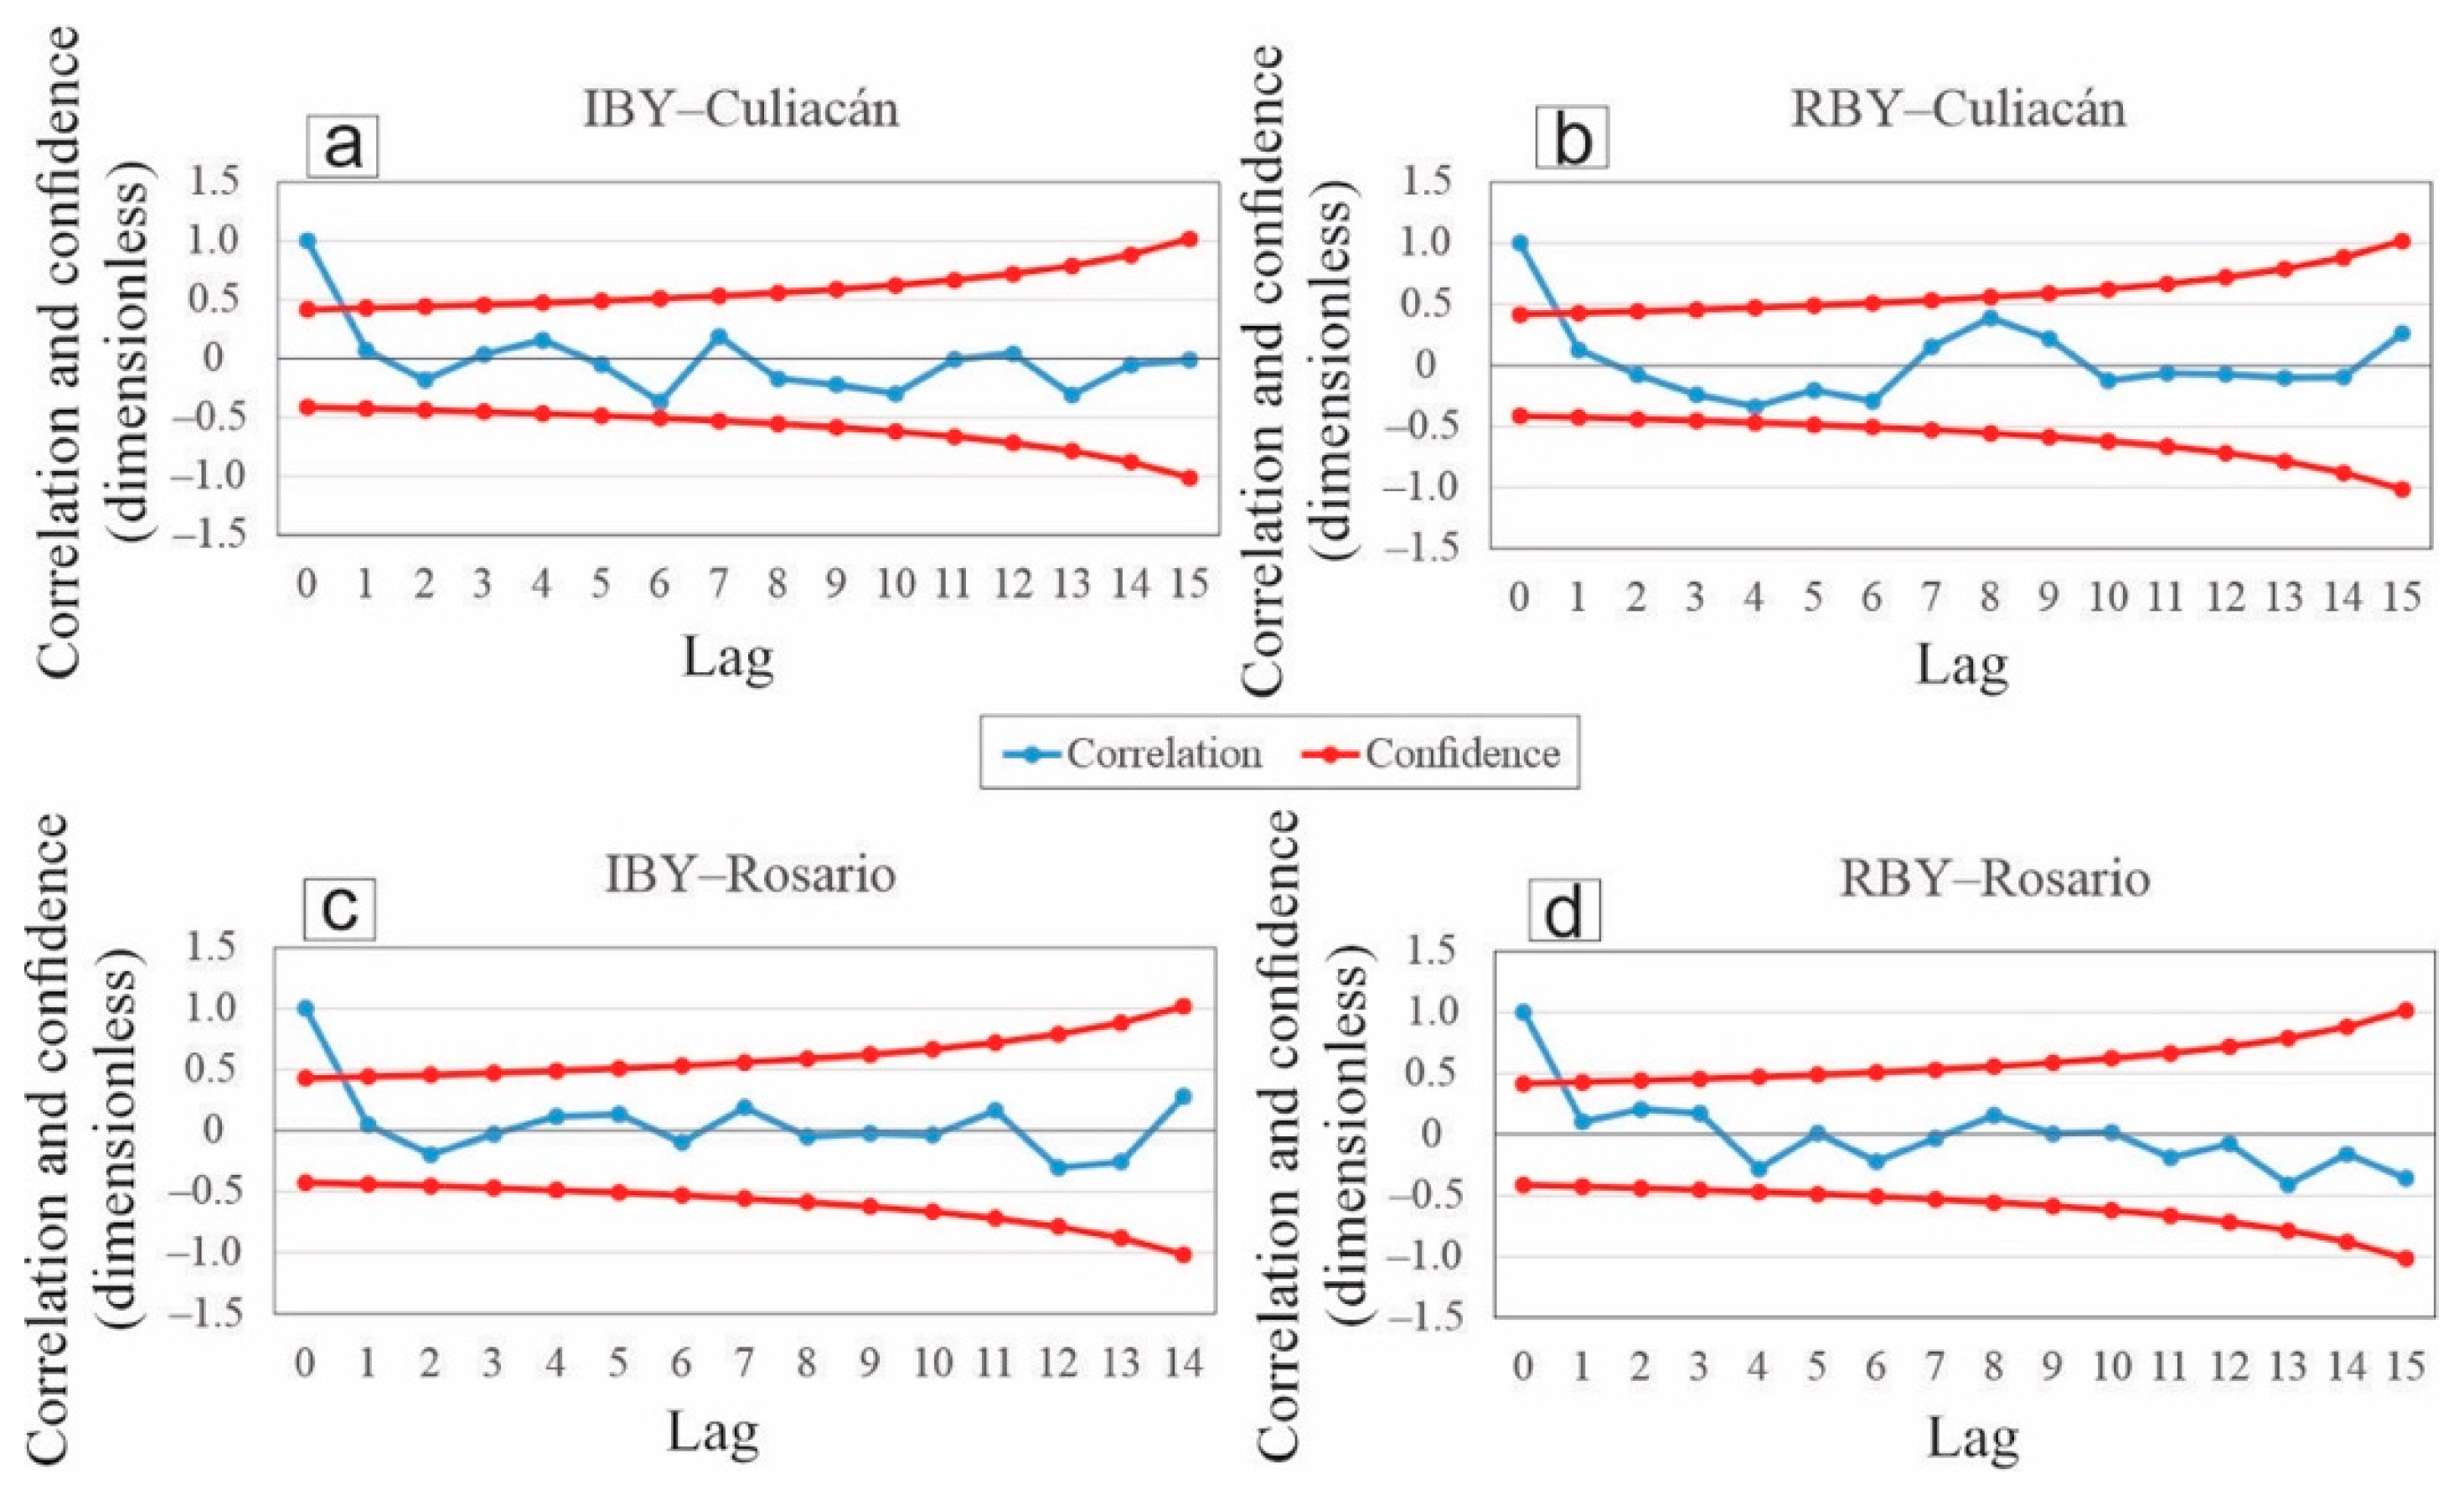
3.4.1. No Autocorrelation
3.4.2. Linearity and Severe Non-Multicollinearity
3.4.3. Homogeneity
3.4.4. Normality
4. Discussion
5. Conclusions
Author Contributions
Funding
Institutional Review Board Statement
Informed Consent Statement
Data Availability Statement
Acknowledgments
Conflicts of Interest
References
- United Nations, Department of Economic and Social Affairs, Population Division. World Population Prospects 2022, Online Edition. 2022. Available online: https://population.un.org/wpp/Download/Standard/Population/ (accessed on 11 November 2023).
- Stacey, N.; Friederike, M.; Hannes, E.; Naomi, S. Economics of Land Degradation Initiative: Report for Policy and Decision Makers_ Reaping Economic and Environmental Benefits from Sustainable Land Management; ELD Initiative and Deutsche Gesellschaft für Internationale Zusammenarbeit (GIZ) GmbH: Bonn, Germany, 2015; Available online: https://repo.mel.cgiar.org/handle/20.500.11766/4881 (accessed on 9 December 2023).
- Servín, P.M.; Salazar, M.R.; López, C.I.L.; Medina, G.G.; Cid, R.J.A. Predicción de la producción y rendimiento de frijol, con modelos de redes neuronales artificiales y datos climáticos. Biotecnia 2022, 24, 104–111. [Google Scholar] [CrossRef]
- United Nations (UN). The 2030 Agenda and the Sustainable Development Goals: An Opportunity for Latin America and the Caribbean (LC/G.2681-P/Rev.3), Santiago; 2018, 90p. Available online: https://repositorio.cepal.org/server/api/core/bitstreams/6321b2b2-71c3-4c88-b411-32dc215dac3b/content (accessed on 8 October 2023).
- Ballari, D.; Vilches, B.L.M.; Orellana, S.M.L.; Salgado, C.F.; Ochoa, S.A.E.; Graw, V.; Turini, N.; Bendix, J. Satellite Earth Observation for Essential Climate Variables Supporting Sustainable Development Goals: A Review on Applications. Remote Sens. 2023, 15, 2716. [Google Scholar] [CrossRef]
- Lobell, D.B.; Nicholas, K.C.; Field, C.B. Historical effects of temperature and precipitation on California crop yields. Clim. Chang. 2007, 81, 187–203. [Google Scholar] [CrossRef]
- Llanes, C.O.; Norzagaray, C.M.; Gaxiola, A.; Pérez, G.E.; Montiel, M.J.; Troyo, D.E. Sensitivity of Four Indices of Meteorological Drought for Rainfed Maize Yield Prediction in the State of Sinaloa, Mexico. Agriculture 2022, 12, 525. [Google Scholar] [CrossRef]
- Qian, C.L.; Shi, W.X.; Jia, Z.; Jia, L.; Yi, Z.; Ze, Z. Ensemble learning prediction of soybean yields in China based on meteorological data. J. Integr. Agric. 2023, 22, 1909–1927. [Google Scholar] [CrossRef]
- Mohite, J.D.; Sawant, S.A.; Pandit, A.; Agrawal, R.; Pappula, S. Soybean Crop Yield Prediction by Integration of Remote Sensing and Weather Observations. The International Archives of the Photogrammetry, Remote Sensing and Spatial Information Sciences 2023, Volume XLVIII-M-1-2023. In Proceedings of the 39th International Symposium on Remote Sensing of Environment (ISRSE-39) “From Human Needs to SDGs”, Antalya, Türkiye, 24–28 April 2023. [Google Scholar] [CrossRef]
- Global Climate Observing System (GCOS). Essential Climate Variables. Available online: https://gcos.wmo.int/en/essential-climate-variables (accessed on 22 January 2024).
- Ojeda, B.W. Evaluación del Impacto del Cambio Climático en la Productividad de la Agricultura de Riego y Temporal del Estado de Sinaloa. Informe Final de Proyecto, Comisión Nacional de Ciencia y Tecnología (CONACYT), México; 2010, 393p. Available online: http://repositorio.imta.mx/bitstream/handle/20.500.12013/1142/RD_0910_6.pdf?sequence=1&isAllowed=y (accessed on 18 December 2023).
- Liu, Y.; Yang, Y. Advances in the Quality of Global Soil Moisture Products: A Review. Remote Sens. 2022, 14, 3741–3772. [Google Scholar] [CrossRef]
- Medina, G.G.; Ruiz, C.J.A. Estadísticas Climatológicas Básicas del Estado de Zacatecas. Libro Técnico Número 3, Instituto Nacional de Investigaciones Forestales, Agrícolas y Pecuarias (INIFAP); 2004, 249p. Available online: http://zacatecas.inifap.gob.mx/publicaciones/climaZacatecas.pdf (accessed on 22 January 2023).
- Barrios, G.E.J.; López, C.C. Temperatura base y tasa de extesnión floliar en frijol. Agrociencia 2009, 43, 29–35. Available online: https://www.redalyc.org/pdf/302/30211438004.pdf (accessed on 22 December 2023).
- Carrão, H.; Russo, S.; Sepulcre, C.G.; Barbosa, P. An empirical standardized soil moisture index for agricultural drought assessment from remotely sensed data. Int. J. Appl. Earth Obs. Geoinf. 2016, 48, 74–84. [Google Scholar] [CrossRef]
- Murillo, A.B.; Troyo, D.E.; García, H.J.L.; Landa, H.L.; Larrinaga, M.J.A. El Frijol Yorimón: Leguminosa Tolerante a Sequía y Salinidad. Editorial Centro de Investigaciones Biológicas del Noroeste; 2000, 33p. Available online: https://cibnor.repositorioinstitucional.mx/jspui/handle/1001/1770 (accessed on 18 January 2023).
- Medina, G.G.; Baez, G.A.D.; López, H.J.; Ruíz, C.J.A.; Tinoco, A.C.A.; Kiniry, J.R. Large-area dry bean yield prediction modeling in Mexico. Rev. Mex. Cienc. Agríc. 2010, 3, 407–420. Available online: https://www.researchgate.net/publication/237031236_Large-area_dry_bean_yield_prediction_modeling_in_Mexico (accessed on 25 February 2024).
- Mompremier, R.; Her, Y.; Hoogenboom, G.; Migliaccio, K.; Muñoz, C.R.; Brym, Z.; Colbert, R.W.; Jeune, W. Modeling the response of dry bean yoeld to irrigation water availability controlled by watershed hydrology. Agric. Water Manag. 2021, 243, 106429. [Google Scholar] [CrossRef]
- Ayala, G.A.V.; Acosta, G.J.A.; Reyes, M.L. El Cultivo de Frijol: Presente y Futuro Para México. Libro Técnico Número 1 del Instituto Nacional de Investigaciones Forestales, Agrícolas y Pecuarias (INIFAP); 2021, 236p. Available online: https://vun.inifap.gob.mx/VUN_MEDIA/BibliotecaWeb/_media/_librotecnico/12319_5085_El_cultivo_del_frijol_presente_y_futuro_para_México.pdf (accessed on 19 March 2024).
- Secretaría de Agricultura, Ganadería, Desarrollo Rural, Pesca y Alimentación (SAGARPA). Agenda Técnica Agrícola de Sinaloa, 2nd ed.; SAGARPA: México City, Mexico, 2015; 242p, Available online: https://issuu.com/senasica/docs/25_sinaloa_2015_sin (accessed on 17 January 2024).
- Flores, C.L.M.; Arzola, G.J.F.; Ramírez, S.M.; Osorio, P.A. Global climate change impacts in the Sinaloa state, Mexico. Cuad. Geogr. 2012, 21, 115–119. Available online: http://www.scielo.org.co/pdf/rcdg/v21n1/v21n1a09.pdf (accessed on 19 February 2024).
- Llanes, C.O.; Gutiérrez, R.O.G.; Montiel, M.J.; Troyo, D.E. Hot Extremes and Climatological Drought Indicators in the Transitional Semiarid-Subtropical Region of Sinaloa, Northwest Mexico. Pol. J. Environ. Stud. 2022, 31, 4567–4577. [Google Scholar] [CrossRef]
- Servicio Meteorológico Nacional–Comisión Nacional del Agua (SMN–CONAGUA). Base de Datos Meteorológicos de México. Available online: https://smn.conagua.gob.mx/es/climatologia/informacion-climatologica/informacion-estadistica-climatologica (accessed on 25 December 2023).
- Guijarro, J.A. Homogenization of Climatological Series with Climatol Version 3.1.1; State Meteorological Agency (AEMET): Balearic Islands, Spain, 2018; 20p, Available online: https://repositorio.aemet.es/bitstream/20.500.11765/12185/2/homog_climatol-en.pdf (accessed on 12 December 2023).
- Argiriou, A.A.; Li, Z.; Armaos, V.; Mamara, A.; Shi, Y.; Yan, Z. Homogenized monthly and daily temperature and precipitation time series in China and Greece since 1960. Adv. Atmos. Sci. 2023, 40, 1326–1336. [Google Scholar] [CrossRef]
- Alexandersson, H. A homogeneity test applied to precipitation data. J. Climatol. 1986, 6, 661–675. [Google Scholar] [CrossRef]
- European Space Agency (ESA). Experimental Break-Adjusted COMBINED Product. Database. Available online: https://data.ceda.ac.uk/neodc/esacci/soil_moisture/data/daily_files/break_adjusted_COMBINED/v07.1 (accessed on 12 August 2023).
- Secretaría de Información Agroalimentaria y Pecuaria (SIAP). Datos Abiertos del Rendimiento del Frijol en México. Available online: http://infosiap.siap.gob.mx/gobmx/datosAbiertos.php (accessed on 25 January 2023).
- Oxford Cambridge and RSA (OCR). Formulae and Statistical Tables (ST1). 1–8: Database of Critical Values. Available online: https://www.ocr.org.uk/Images/174103-unit-h869-02-statistical-problem-solving-statistical-tables-st1-.pdf (accessed on 15 December 2023).
- Bouza, H.C.N. Modelos de Regresión y sus Aplicaciones. Reporte Técnico; 2018, 124p. Available online: https://www.researchgate.net/profile/Carlosouza/publication/323227561_MODELOS_DE_REGRESION_Y_SUS_APLICACIONES/links/5a871265a6fdcc6b1a3abe40/MODELOS-DE-REGRESION-Y-SUS-APLICACIONES.pdf (accessed on 15 December 2023).
- Liang, L.; Cui, H.; Arabameri, A.; Arora, A.; Danesh, S.A. Landslide susceptibility mapping: Application of novel hybridization of rotation forests (RF) and Java decision trees (J48). Soft Comput. 2023, 27, 17387–17402. [Google Scholar] [CrossRef]
- Jinse, J.; Varadharajan, R. Simultaneous raise regression: A novel approach to combating collinearity in linear regression models. Qual. Quant. 2023, 57, 4365–4386. [Google Scholar] [CrossRef]
- Akingboye, A.S.; Bery, A.A. Development of novel velocity–resistivity relationships for granitic terrains based on complex collocated geotomographic modeling and supervised statistical analysis. Acta Geophys. 2023, 71, 2675–2698. [Google Scholar] [CrossRef]
- Romero, F.C.S.; López, C.C.; Kohashi, S.J.; Miranda, C.S.; Aguilar, R.V.H.; Martínez, R.C.G. Cambios en el rendimiento y sus componentes en frijol bajo riego y sequía. Rev. Mex. Cienc. Agríc. 2019, 10, 351–364. [Google Scholar] [CrossRef]
- Li, S.; You, S.; Song, Z.; Zhang, L.; Liu, Y. Impacts of Climate and Environmental Change on Bean Cultivation in China. Atmosphere 2021, 12, 1591. [Google Scholar] [CrossRef]
- Amador, R.M.D.; Acosta, D.E.; Medina, G.G.; Gutiérrez, L.R. An empirical model to predict yield of rainfed dry bean with multi-year data. Rev. Fitotec. Mex. 2007, 30, 311–319. Available online: https://www.redalyc.org/pdf/610/61003014.pdf (accessed on 18 January 2024).
- Bojinsky, S.; Verstraete, M.; Peterson, T.C.; Richter, C.; Simmons, A.; Zemp, M. The concept of essential climate variables in support of climate research, applications, and policy. Am. Meteorol. Soc. 2014, 95, 1431–1443. Available online: https://www.researchgate.net/publication/271271716_The_Concept_of_Essential_Climate_Variables_in_Support_of_Climate_Research_Applications_and_Policy (accessed on 30 March 2024). [CrossRef]
- Botero, H.; Barnes, A.P. The effect of ENSO on common bean production in Colombia: A time series approach. Food Secur. 2022, 14, 1417–1430. [Google Scholar] [CrossRef] [PubMed]
- Guijarro, J.A. Package Climatol. R Package Version, 4.0.0; 2023, 40p. Available online: https://www.rdocumentation.org/packages/climatol/versions/4.0.0 (accessed on 24 January 2024).
- Ruiz, C.J.A.; Medina, G.G.; Macías, J.C.; Silva, M.M.S.; Diaz, P.G. Estadísticas Climatológicas Básicas del Estado de Sinaloa (Período 1961–2003). Libro Técnico Núm. 2. INIFAP-CIRNO. Cd. Obregón, Sonora, México. 2005. Available online: https://docplayer.es/41213292-Estadisticas-climatologicas-basicas-del-estado-de-sinaloa-periodo.html (accessed on 24 February 2024).
- Llanes, C.O.; Cervantes, A.L.; González, G.G.E. Calculation of indicators of maximum extreme temperature in Sinaloa state, northwestern Mexico. Earth Sci. Res. J. 2023, 27, 77–84. [Google Scholar] [CrossRef]
- Hargreaves, G.H.; Samani, Z.A. Reference crop evapotranspiration from temperature. Applied Eng. in Agric. 1985, 1, 96–99. Available online: https://www.researchgate.net/publication/247373660_Reference_Crop_Evapotranspiration_From_Temperature (accessed on 17 January 2024). [CrossRef]
- Allen, R.G.; Pereira, L.S.; Raes, D.; Smith, M. Evapotranspiración de Cultivo: Guías Para la Determinación de Los Requerimientos de Agua de los Cultivos. FAO, Irrigation and Drainage Paper, No. 56. 300p; 2006. Available online: https://www.researchgate.net/publication/312841499_Evapotranspiracion_del_cultivo_Guias_para_la_determinacion_de_los_requerimientos_de_agua_de_los_cultivos (accessed on 11 December 2023).
- Brouwer, C.; Heibloem, M. Irrigation Water Management: Irrigation Water Needs; Food and Agriculture Organization (FAO): Rome, Italy, 1986; Available online: https://www.fao.org/3/s2022e/s2022e07.htm (accessed on 16 January 2024).
- Flores, G.H. Impacto del Cambio Climático en Los Distritos de Riego de Sinaloa. Master’s Thesis, del Colegio de Postgraduados Campus Montecillo, Mexico City, Mexico, 2010; 204p. [Google Scholar] [CrossRef]
- Dorigo, W.; Preimesberger, W.; Moesinger, L.; Pasik, A.; Scanlon, T.; Hahn, S.; Van der Schalie, R.; Van der Vliet, M.; De Jeu, R.; Kidd, R.; et al. ESA Soil Moisture Climate Change Initiative (Soil_Moisture_cci): Experimental Break-Adjusted COMBINED Product, Version 07.1. NERC EDS Centre for Environmental Data Analysis. 2023. Available online: https://catalogue.ceda.ac.uk/uuid/0ae6b18caf8a4aeba7359f11b8ad49ae (accessed on 15 December 2023).
- Seo, E.; Dirmeyer, P.A. Improving the ESA CCI daily soil moisture time series with physically based land surface model dataset using a Fourier time-filtering method. J. Hydrometeorol. 2022, 23, 473–489. [Google Scholar] [CrossRef]
- Feng, S.; Huang, X.; Zhao, S.; Qin, Z.; Fan, J.; Zhao, S. Evaluation of Several Satellite-Based Soil Moisture Products in the Continental US. Sensors 2022, 22, 9977. [Google Scholar] [CrossRef]
- Yu, W.; Li, Y.; Liu, G. Calibration of the ESA CCI-Combined Soil Moisture Products on the Qinghai-Tibet Plateau. Remote Sens. 2023, 15, 918. [Google Scholar] [CrossRef]
- Secretaría de Agricultura y Desarrollo Rural (SAGARPA) y Servicio de Información Agroalimentaria y Pesquera (SIAP). Aptitud Agroaclimática del Frijol en México Ciclo Agrícola Otoño–Inverno. Informe Técnico; 2019, 30p. Available online: https://www.gob.mx/cms/uploads/attachment/file/495087/Reporte_de_Aptitud_agroclim_tica_de_M_xico_del_frijol_OI_2019-2020.pdf (accessed on 10 January 2024).
- Wu, H.; Hayes, J.M.; Weiss, A.; Hu, Q. An evaluation of the standardized precipitation index, the China–Z index and the statistical Z–score. Int. J. Climatol. 2001, 21, 745–758. [Google Scholar] [CrossRef]
- Shapiro, S.S.; Wilk, M.B. An analysis of variance test for normality (complete samples). Biometrika 1965, 52, 591–611. Available online: https://www.bios.unc.edu/~mhudgens/bios/662/2008fall/Backup/wilkshapiro1965.pdf (accessed on 7 February 2024). [CrossRef]
- Anderson, T.W.; Darling, D.A. A test of goodness of fit. J. Amer. Stat. Assn. 1954, 49, 765–769. [Google Scholar] [CrossRef]
- Lilliefors, H. On the Kolmogorov-Smirnov test for normality with mean and variance unknown. J. Amer. Statist. Assoc. 1967, 62, 399–402. Available online: http://www.bios.unc.edu/~mhudgens/bios/662/2008fall/Backup/lilliefors1967.pdf (accessed on 11 January 2024). [CrossRef]
- Jarque, M.C.; Bera, K.A. A test for normality of observations and regression residual. Int. Stat. Rev. 1987, 55, 163–172. Available online: http://webspace.ship.edu/pgmarr/Geo441/Readings/Jarque%20and%20Bera%201987%20-%20A%20Test%20for%20Normality%20of%20Observations%20and%20Regression%20Residuals.pdf (accessed on 8 January 2024). [CrossRef]
- Hauke, J.; Kossowski, T. Comparison of values of Pearson’s and Spearman’s correlation coefficients on the same sets of data. Quaest. Geogr. 2011, 30, 87–93. Available online: https://www.researchgate.net/publication/227640806_Comparison_of_Values_of_Pearson%27s_and_Spearman%27s_Correlation_Coefficients_on_the_Same_Sets_of_Data (accessed on 15 February 2024). [CrossRef]
- Walpole, E.R.; Myers, H.R.; Myers, L.S.; Ye, K. Probabilidad y Estadística Para Ingeniería y Ciencias. Universidad de Texas, San Antonio, editorial Pearson; 2012, 816p. Available online: https://vereniciafunez94hotmail.files.wordpress.com/2014/08/8va-probabilidad-y-estadistica-para-ingenier-walpole_8.pdf (accessed on 25 January 2024).
- Breusch, T.S. “Testing for Autocorrelation in Dynamic Linear Models. Aust. Econ. Pap. 1978, 17, 334–355. [Google Scholar] [CrossRef]
- Ljung, G.M.; Box, G.E.P. On a measure of lack of fit in time series models. Biometrika 1978, 65, 297–303. [Google Scholar] [CrossRef]
- Kleinbaum, D.G.; Kupper, L.L.; Muller, K.E. Applied Regression Analysis and Other Multivariable Methods. PWS-Kent, Boston; 1988. Available online: https://ebin.pub/applied-regression-analysis-and-other-multivariable-methods-5nbsped-1285051084-9781285051086.html (accessed on 10 December 2023).
- Deduy, G.I. Regresión Sobre Componentes Principals. Bachelor’s Thesis, Universidad de Sevilla, Sevilla, Spain, 2019. Available online: https://idus.us.es/bitstream/handle/11441/90005/Deduy%20Guerra%20Irene%20TFG.pdf?sequence=1&isAllowed=y (accessed on 20 December 2023).
- Kutner, H.M.; Nachtsheim, J.C.; Neter, J.; Li, W. Applied Linear Statistical Models (Fifth Edition). Editorial McGraw–Hill Irwin; 2005, 1415p. Available online: https://users.stat.ufl.edu/~winner/sta4211/ALSM_5Ed_Kutner.pdf (accessed on 11 December 2023).
- Carrasquilla, B.A.; Chacón, R.A.; Núñez, M.K.; Gómez, E.O.; Valverde, J.; Guerrero, B.M. Regresión Lineal Simple y Múltiple: Aplicación en la Predicción de Variables Naturales Relacionadas con el Crecimiento Microalgal. Tecnología en Marcha. Encuentro de Investigación y Extensión; 2016, 33–45. Available online: https://www.scielo.sa.cr/scielo.php?pid=S0379-39822016000900033&script=sci_abstract&tlng=es (accessed on 15 December 2023).
- Llanes, C.O.; Norzagaray, C.M.; Gaxiola, A.; González, G.G.E. Regional precipitation teleconnected with PDO–AMO–ENSO in northern Mexico. Theor. Appl. Climatol. 2020, 140, 667–681. [Google Scholar] [CrossRef]
- Servicio Meteorológico Nacional (SMN). Ciclones que Han Impactado en México, 1981–2001. Cuadro I.8.1. 2002. Available online: https://paot.org.mx/centro/ine-semarnat/informe02/estadisticas_2000/compendio_2000/01dim_social/01_08_Desastres/data_desastres/CuadroI.8.1b.htm (accessed on 18 December 2023).
- Méndez, M.; Magaña, V. Regional Aspects of Prolonged Meteorological Droughts over Mexico and Central American. J. Clim. 2010, 5, 1175–1188. [Google Scholar] [CrossRef]
- Llanes, C.O.; Gaxiola, H.A.; Estrella, G.R.D.; Norzagaray, C.M.; Troyo, D.E.; Pérez, G.E.; Ruiz, G.R.; Pellegrini, C.M.J. Variability and Factors of Influence of Extreme Wet and Dry Events in Northern Mexico. Atmosphere 2018, 9, 122. [Google Scholar] [CrossRef]
- Avila, M.J.A.; Ávila, S.J.M.; Rivas, S.F.J.; Martínez, H.D. El Cultivo del Frijol: Sistemas de Producción en el Noroeste de México. Universidad de Sonora; 2023, 88p. Available online: https://agricultura.unison.mx/memorias%20de%20maestros/EL%20CULTIVO%20DEL%20FRIJOL.pdf (accessed on 15 December 2023).
- Llanes, C.O. Predictive association between meteorological drought and climate indices in the state of Sinaloa, northwestern Mexico. Arab. J. Geosci. 2023, 16, 1–14. [Google Scholar] [CrossRef]
- Norzagaray, C.M.; Llanes, C.O.; Gaxiola, A.; González, G.G.E. Meteorological interaction between drought/oceanic indicators and rainfed maize yield in an arid agricultural zone in northern Mexico. Arab. J. Geosci. 2020, 13, 131. [Google Scholar] [CrossRef]
- Comisión Nacional del Agua (CONAGUA). Base de Datos del índice Estandarizado de Precipitación (SPI). Secretaría de Gobernación de México. Available online: https://smn.conagua.gob.mx/es/climatologia/monitor-de-sequia/spi (accessed on 22 October 2023).
- Soria, R.J.; Fernández, O.Y.; Quijano, C.A.; Macías, C.J.; Sauceda, P.; González, D.; Quintana, J. Remote Sensing and Simulation Models for Crop Management. Proceedings of Progress in Electromagnetics Research Symposium. Moscow, Russia. 2012. Available online: https://www.researchgate.net/publication/289288401_Remote_sensing_and_simulation_model_for_crop_management (accessed on 24 January 2024).
- Jasso, M.M.; Soria, R.J.; Antonio, N.X. Pérdida de superficies cultivadas de maíz de temporal por efecto de heladas en el valle de Toluca. Rev. Mexicana Cienc. Agríc. 2022, 13, 207–222. [Google Scholar] [CrossRef]
- Schober, P.; Boer, C.; Schwarte, L.A. Correlation Coefficients: Appropriate Use and Interpretation. Anesth. Analg. 2018, 126, 1763–1768. [Google Scholar] [CrossRef]
- Zhenhua, L.; Ziqing, X.; Feixiang, C.; Yueming, H.; Ya, W.; Jianbin, L.; Huiming, L.; Luo, L. Soil Moisture Index Model for Retrieving soil Moisture in Semiarid Regions of China. IEEE J. Sel. Top. Appl. Earth Obs. Remote Sens. 2020, 13, 5929–5937. Available online: https://ieeexplore.ieee.org/stamp/stamp.jsp?arnumber=9204441 (accessed on 10 December 2023).
- Rosales, S.R.; Ochoa, M.R.; Acosta, G.J.A. Fenología y rendimiento del frijol en el altiplano de México y su respuesta al Fotoperiodo. Agrociencia 2001, 35, 513–523. Available online: https://www.redalyc.org/pdf/302/30235505.pdf (accessed on 15 February 2024).
- Sifuentes, E.; Macías, J.; Ojeda, W.; González, V.M.; Salinas, D.A.; Quintana, J.G. Gestión de Riego Enfocada a Variabilidad Climática en el Cultivo de Papa: Aplicación al Distrito de Riego 075, Río Fuerte, Sinaloa, México. Tecnol. Cienc. Agua 2016, 7, 149–168. Available online: https://www.scielo.org.mx/pdf/tca/v7n2/2007-2422-tca-7-02-00149.pdf (accessed on 12 January 2024).
- Morantes, Q.G.R.; Rincón, P.G.; Pérez, S.N.A. Modelo de Regresión Lineal Múltiple Para Estimar Concentración de PM1. Rev. Int. Contam. Ambie. 2019, 35, 179–194. Available online: https://www.revistascca.unam.mx/rica/index.php/rica/article/view/RICA.2019.35.01.13 (accessed on 17 January 2024). [CrossRef]
- Pérez, R.; López, A.J. Econometría Aplicada con Gretl. Universidad de Oviedo; 2019, 385p. Available online: https://www.researchgate.net/profile/Ana-Lopez-Menendez/publication/334771581_Econometria_Aplicada_con_Gretl/links/5d40766ba6fdcc370a6eedb8/Econometria-Aplicada-con-Gretl.pdf (accessed on 26 January 2024).
- Prieto, C.M.R.; Matus, G.J.A.; Gavi, R.F.; Omaña, S.J.M.; Brambila, P.J.J.; Sánchez, E.J.; Martínez, D.M.A. Evolution of the Area Cultivated to Common Bean and Economic Impact of Drought on its Yield under Rainfed Conditions in Mexico. Rev. Fitotec. Mex. 2019, 2, 173–182. Available online: https://www.scielo.org.mx/pdf/rfm/v42n2/0187-7380-rfm-42-02-173.pdf (accessed on 10 January 2024).


| Variable | IBY (t ha−1 yr−1) | RBY (t ha−1 yr−1) | ASM (m3 m−3 yr−1) | AMT (°C yr−1) | MMT (°C) | AmT (°C yr−1) | mmT (°C) | AMeT (°C yr−1) | MMeT (°C) | ABDD (°C yr−1) | CET (mm yr−1) | CEP (mm yr−1) | |
|---|---|---|---|---|---|---|---|---|---|---|---|---|---|
| Culiacán | IBY (t ha−1 yr−1) | 0.939 | 0.005 | 0.178 | 0.966 | 0.640 | 0.299 | 0.014 | 0.521 | 0.039 | 0.367 | 0.301 | |
| RBY (t ha−1 yr−1) | 0.135 | 0.001 | 0.850 | 0.609 | 0.515 | 0.885 | 0.694 | 0.726 | 0.722 | 0.653 | 0.096 | ||
| ASM (m3 m−3 yr−1) | 0.443 | −0.487 | 0.056 | 0.062 | 0.402 | 0.371 | 0.016 | 0.158 | 0.094 | 0.286 | 0.193 | ||
| AMT (°C yr−1) | 0.260 | −0.071 | 0.435 | 0.834 | 0.377 | 0.235 | 0.000 | 0.667 | 0.017 | 0.229 | 0.054 | ||
| MMT (°C) | −0.039 | −0.253 | 0.401 | 0.228 | 0.399 | 0.034 | 0.123 | 0.030 | 0.271 | 0.660 | 0.192 | ||
| AmT (°C yr−1) | 0.086 | 0.057 | 0.291 | 0.171 | 0.283 | 0.740 | 0.298 | 0.021 | 0.960 | 0.555 | 0.137 | ||
| mmT (°C) | 0.290 | −0.078 | 0.350 | 0.177 | 0.108 | 0.258 | 0.081 | 0.323 | 0.074 | 0.138 | 0.529 | ||
| AMeT (°C yr−1) | 0.487 | −0.015 | 0.598 | 0.742 | 0.431 | 0.492 | 0.359 | 0.365 | 0.000 | 0.093 | 0.332 | ||
| MMeT (°C) | 0.118 | −0.145 | 0.386 | 0.391 | 0.402 | 0.406 | 0.279 | 0.556 | 0.814 | 0.475 | 0.412 | ||
| ABDD (°C yr−1) | 0.486 | −0.019 | 0.596 | 0.743 | 0.434 | 0.481 | 0.360 | 0.999 | 0.557 | 0.118 | 0.427 | ||
| CET (mm yr−1) | −0.100 | −0.183 | 0.094 | 0.620 | −0.063 | −0.083 | −0.118 | 0.175 | 0.218 | 0.174 | 0.781 | ||
| CEP (mm yr−1) | −0.088 | 0.375 | −0.250 | −0.409 | 0.257 | 0.324 | −0.009 | 0.003 | −0.062 | 0.002 | −0.515 | ||
| Rosario | IBY (t ha−1 yr−1) | 0.546 | 0.573 | 0.404 | 0.225 | 0.468 | 0.739 | 0.005 | 0.825 | 0.204 | 0.692 | 0.922 | |
| RBY (t ha−1 yr−1) | −0.111 | 0.139 | 0.239 | 0.618 | 0.708 | 0.876 | 0.622 | 0.832 | 0.144 | 0.783 | 0.204 | ||
| ASM (m3 m−3 yr−1) | −0.279 | −0.155 | 0.468 | 0.053 | 0.065 | 0.854 | 0.265 | 0.240 | 0.897 | 0.722 | 0.060 | ||
| AMT (°C yr−1) | −0.129 | 0.151 | −0.185 | 0.658 | 0.448 | 0.211 | 0.801 | 0.024 | 0.081 | 0.008 | 0.100 | ||
| MMT (°C) | 0.221 | −0.092 | −0.439 | 0.035 | 0.216 | 0.894 | 0.439 | 0.062 | 0.029 | 0.011 | 0.169 | ||
| AmT (°C yr−1) | 0.256 | 0.133 | −0.255 | −0.137 | 0.116 | 0.849 | 0.679 | 0.000 | 0.999 | 0.547 | 0.670 | ||
| mmT (°C) | −0.024 | 0.156 | 0.048 | 0.097 | −0.233 | 0.079 | 0.028 | 0.636 | 0.068 | 0.807 | 0.845 | ||
| AMeT (°C yr−1) | 0.351 | −0.009 | −0.276 | 0.195 | 0.158 | 0.099 | 0.446 | 0.596 | 0.079 | 0.233 | 0.830 | ||
| MMeT (°C) | −0.041 | 0.039 | −0.175 | 0.514 | 0.334 | 0.473 | −0.024 | 0.067 | 0.570 | 0.055 | 0.343 | ||
| ABDD (°C yr−1) | 0.292 | 0.010 | −0.159 | 0.405 | 0.140 | 0.245 | 0.247 | 0.569 | 0.504 | 0.446 | 0.716 | ||
| CET (mm yr−1) | 0.023 | 0.124 | −0.206 | 0.462 | 0.368 | 0.045 | −0.137 | 0.245 | 0.310 | 0.304 | 0.000 | ||
| CEP (mm yr−1) | −0.020 | 0.197 | −0.095 | −0.270 | −0.284 | 0.138 | 0.258 | 0.004 | −0.050 | 0.044 | −0.588 | ||
| n = 32; CPC = |0.349|; CSC = |0.350| | |||||||||||||
| Pearson coefficients (PC) | |||||||||||||
| Plain | Spearman coefficients (SC) | ||||||||||||
| Bold | Coefficients significantly different from zero (significant correlations) | ||||||||||||
| Coefficients with severe multicollinearity | |||||||||||||
| Variable | IBY– Culiacán | RBY– Culiacán | IBY– Rosario | RBY– Rosario |
|---|---|---|---|---|
| Coefficient of determination (R2) | 0.348 | 0.539 | 0.386 | 0.283 |
| Pearson coefficient (PC) = (R2)0.5 | 0.590 | 0.734 | 0.621 | 0.532 |
| Mean error (ME) | 1.834 × 10⁻¹⁵ | 2.255 × 10⁻¹⁶ | −1.135 × 10⁻¹⁵ | 3.785 × 10⁻¹⁵ |
| Root mean square error (RMSE) | 0.192 | 0.111 | 0.228 | 0.143 |
| Mean error absolute (MEA) | 0.143 | 0.086 | 0.181 | 0.119 |
| Percentage of error mean (PEM) | −1.735 | −2.643 | −2.844 | −4.391 |
| Percentage of error absolute mean (PEAM) | 9.906 | 13.763 | 13.736 | 18.266 |
| Theil’s statistic (U2) | 0.848 | 0.743 | 0.846 | 0.817 |
| n = 32; CPC = |0.349| n = 31; CPC = |0.355| Bold = significant correlations |
| p-Values of Normality Tests | ||||
|---|---|---|---|---|
| Dependent Variable in Each Model | Shapiro–Wilk | Anderson–Darling | Lilliefors | Jarque–Bera |
| IBY–Culiacán | 0.410 | 0.211 | 0.077 | 0.860 |
| RBY–Culiacán | 0.158 | 0.185 | 0.070 | 0.344 |
| IBY–Rosario | 0.900 | 0.904 | 0.890 | 0.963 |
| RBY–Rosario | 0.395 | 0.534 | 0.788 | 0.500 |
Disclaimer/Publisher’s Note: The statements, opinions and data contained in all publications are solely those of the individual author(s) and contributor(s) and not of MDPI and/or the editor(s). MDPI and/or the editor(s) disclaim responsibility for any injury to people or property resulting from any ideas, methods, instructions or products referred to in the content. |
© 2024 by the authors. Licensee MDPI, Basel, Switzerland. This article is an open access article distributed under the terms and conditions of the Creative Commons Attribution (CC BY) license (https://creativecommons.org/licenses/by/4.0/).
Share and Cite
Llanes Cárdenas, O.; Estrella Gastélum, R.D.; Parra Galaviz, R.E.; Gutiérrez Ruacho, O.G.; Ávila Díaz, J.A.; Troyo Diéguez, E. Modeling Yield of Irrigated and Rainfed Bean in Central and Southern Sinaloa State, Mexico, Based on Essential Climate Variables. Atmosphere 2024, 15, 573. https://doi.org/10.3390/atmos15050573
Llanes Cárdenas O, Estrella Gastélum RD, Parra Galaviz RE, Gutiérrez Ruacho OG, Ávila Díaz JA, Troyo Diéguez E. Modeling Yield of Irrigated and Rainfed Bean in Central and Southern Sinaloa State, Mexico, Based on Essential Climate Variables. Atmosphere. 2024; 15(5):573. https://doi.org/10.3390/atmos15050573
Chicago/Turabian StyleLlanes Cárdenas, Omar, Rosa D. Estrella Gastélum, Román E. Parra Galaviz, Oscar G. Gutiérrez Ruacho, Jeován A. Ávila Díaz, and Enrique Troyo Diéguez. 2024. "Modeling Yield of Irrigated and Rainfed Bean in Central and Southern Sinaloa State, Mexico, Based on Essential Climate Variables" Atmosphere 15, no. 5: 573. https://doi.org/10.3390/atmos15050573