
Analysis of the Post-Cyclonic Physical Flood Susceptibility and Changes of Mangrove Forest Area Using Multi-Criteria Decision-Making Process and Geospatial Analysis in Indian Sundarbans

 , , , ,
Abstract
:1. Introduction
1.1. Studies on the Impact of Tropical Cyclones and Flood Occurrences in Sundarbans
1.2. Review of the Geospatial Analysis on the Cyclonic Flood Assessment in Sundarbans
1.3. Summary of the Literature Review and Research Gap
- What are the major indicators of physical susceptibility to floods in the study area?
- Which area is the most vulnerable and susceptible to flood occurrences in the C.D. blocks under the Indian Sundarbans?
- What is the relationship between flood (NDFI) and mangrove damage, and what are the major indicators of physical susceptibility to flooding?
2. Materials and Methods
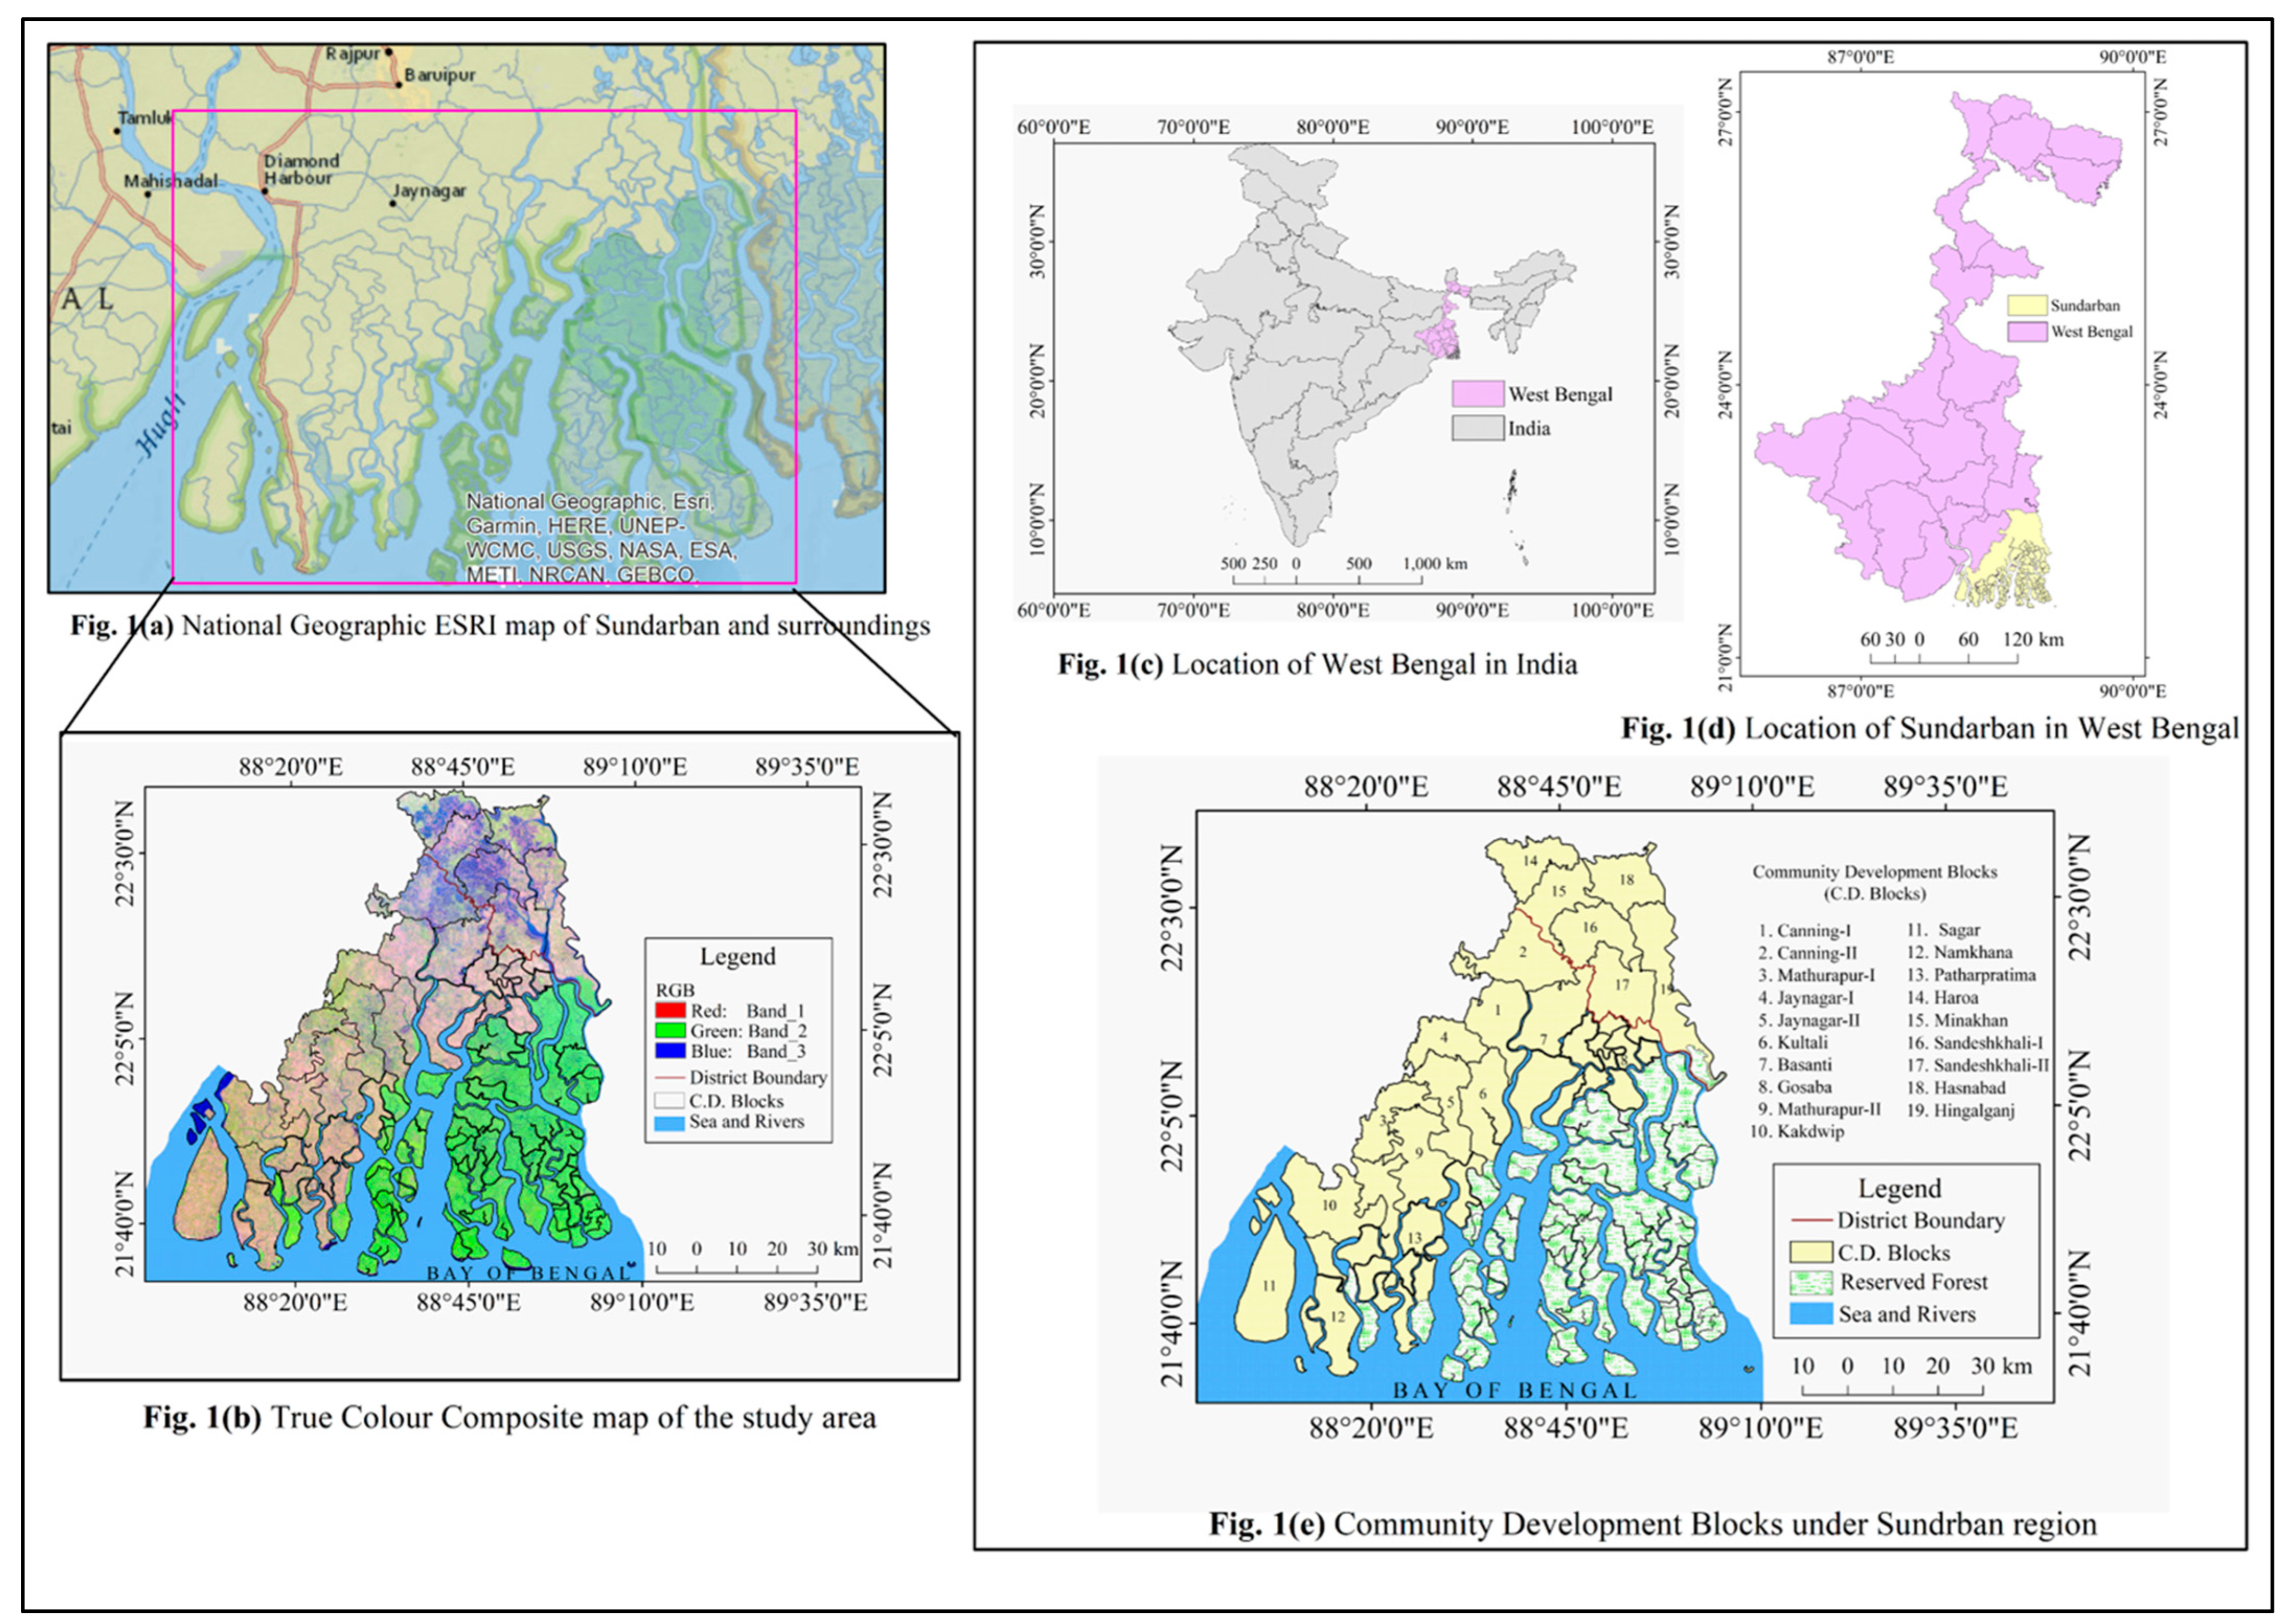
2.1. Study Area
2.2. Data Sources
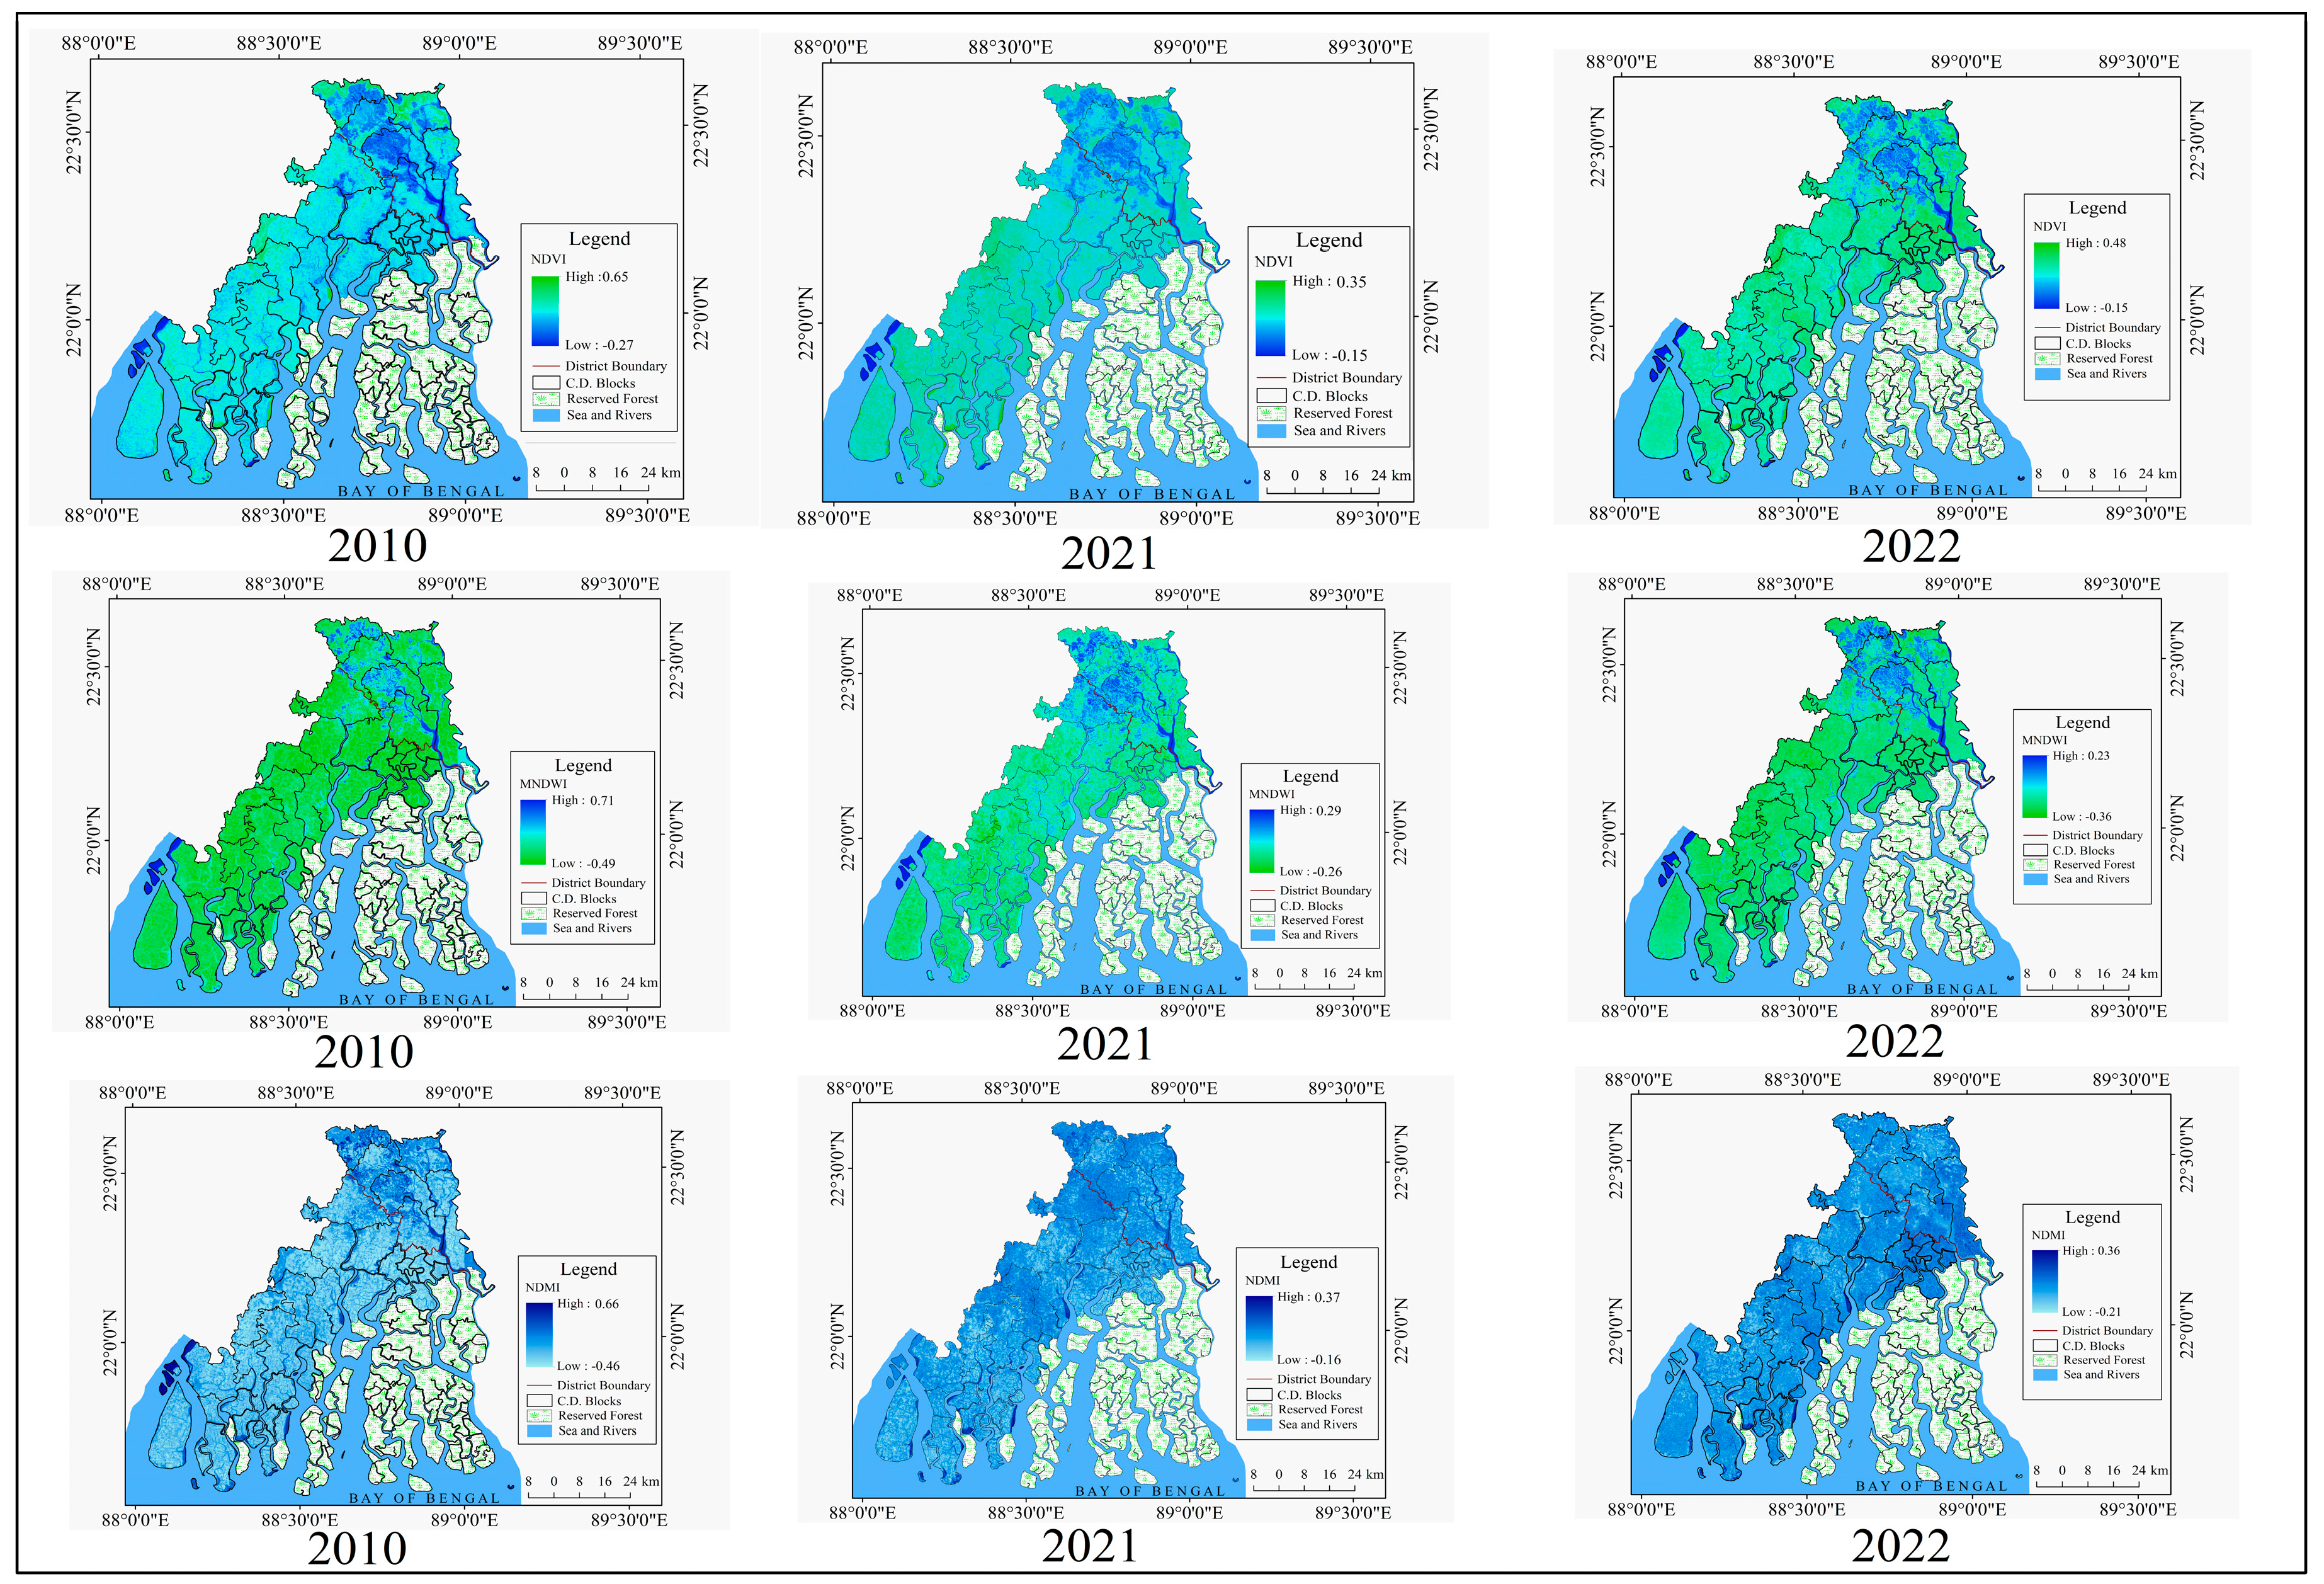
2.3. Selection of the Indicators (Spectral Indices)
2.4. Methods and Techniques
2.4.1. Spectral Indices and Buffer Creation
2.4.2. Multi-Criteria Decision-Making-Analytical Hierarchy Process (MCDM-AHP), and Weighted Overlay Analysis (WOA) Method
2.4.3. Statistical Analyses
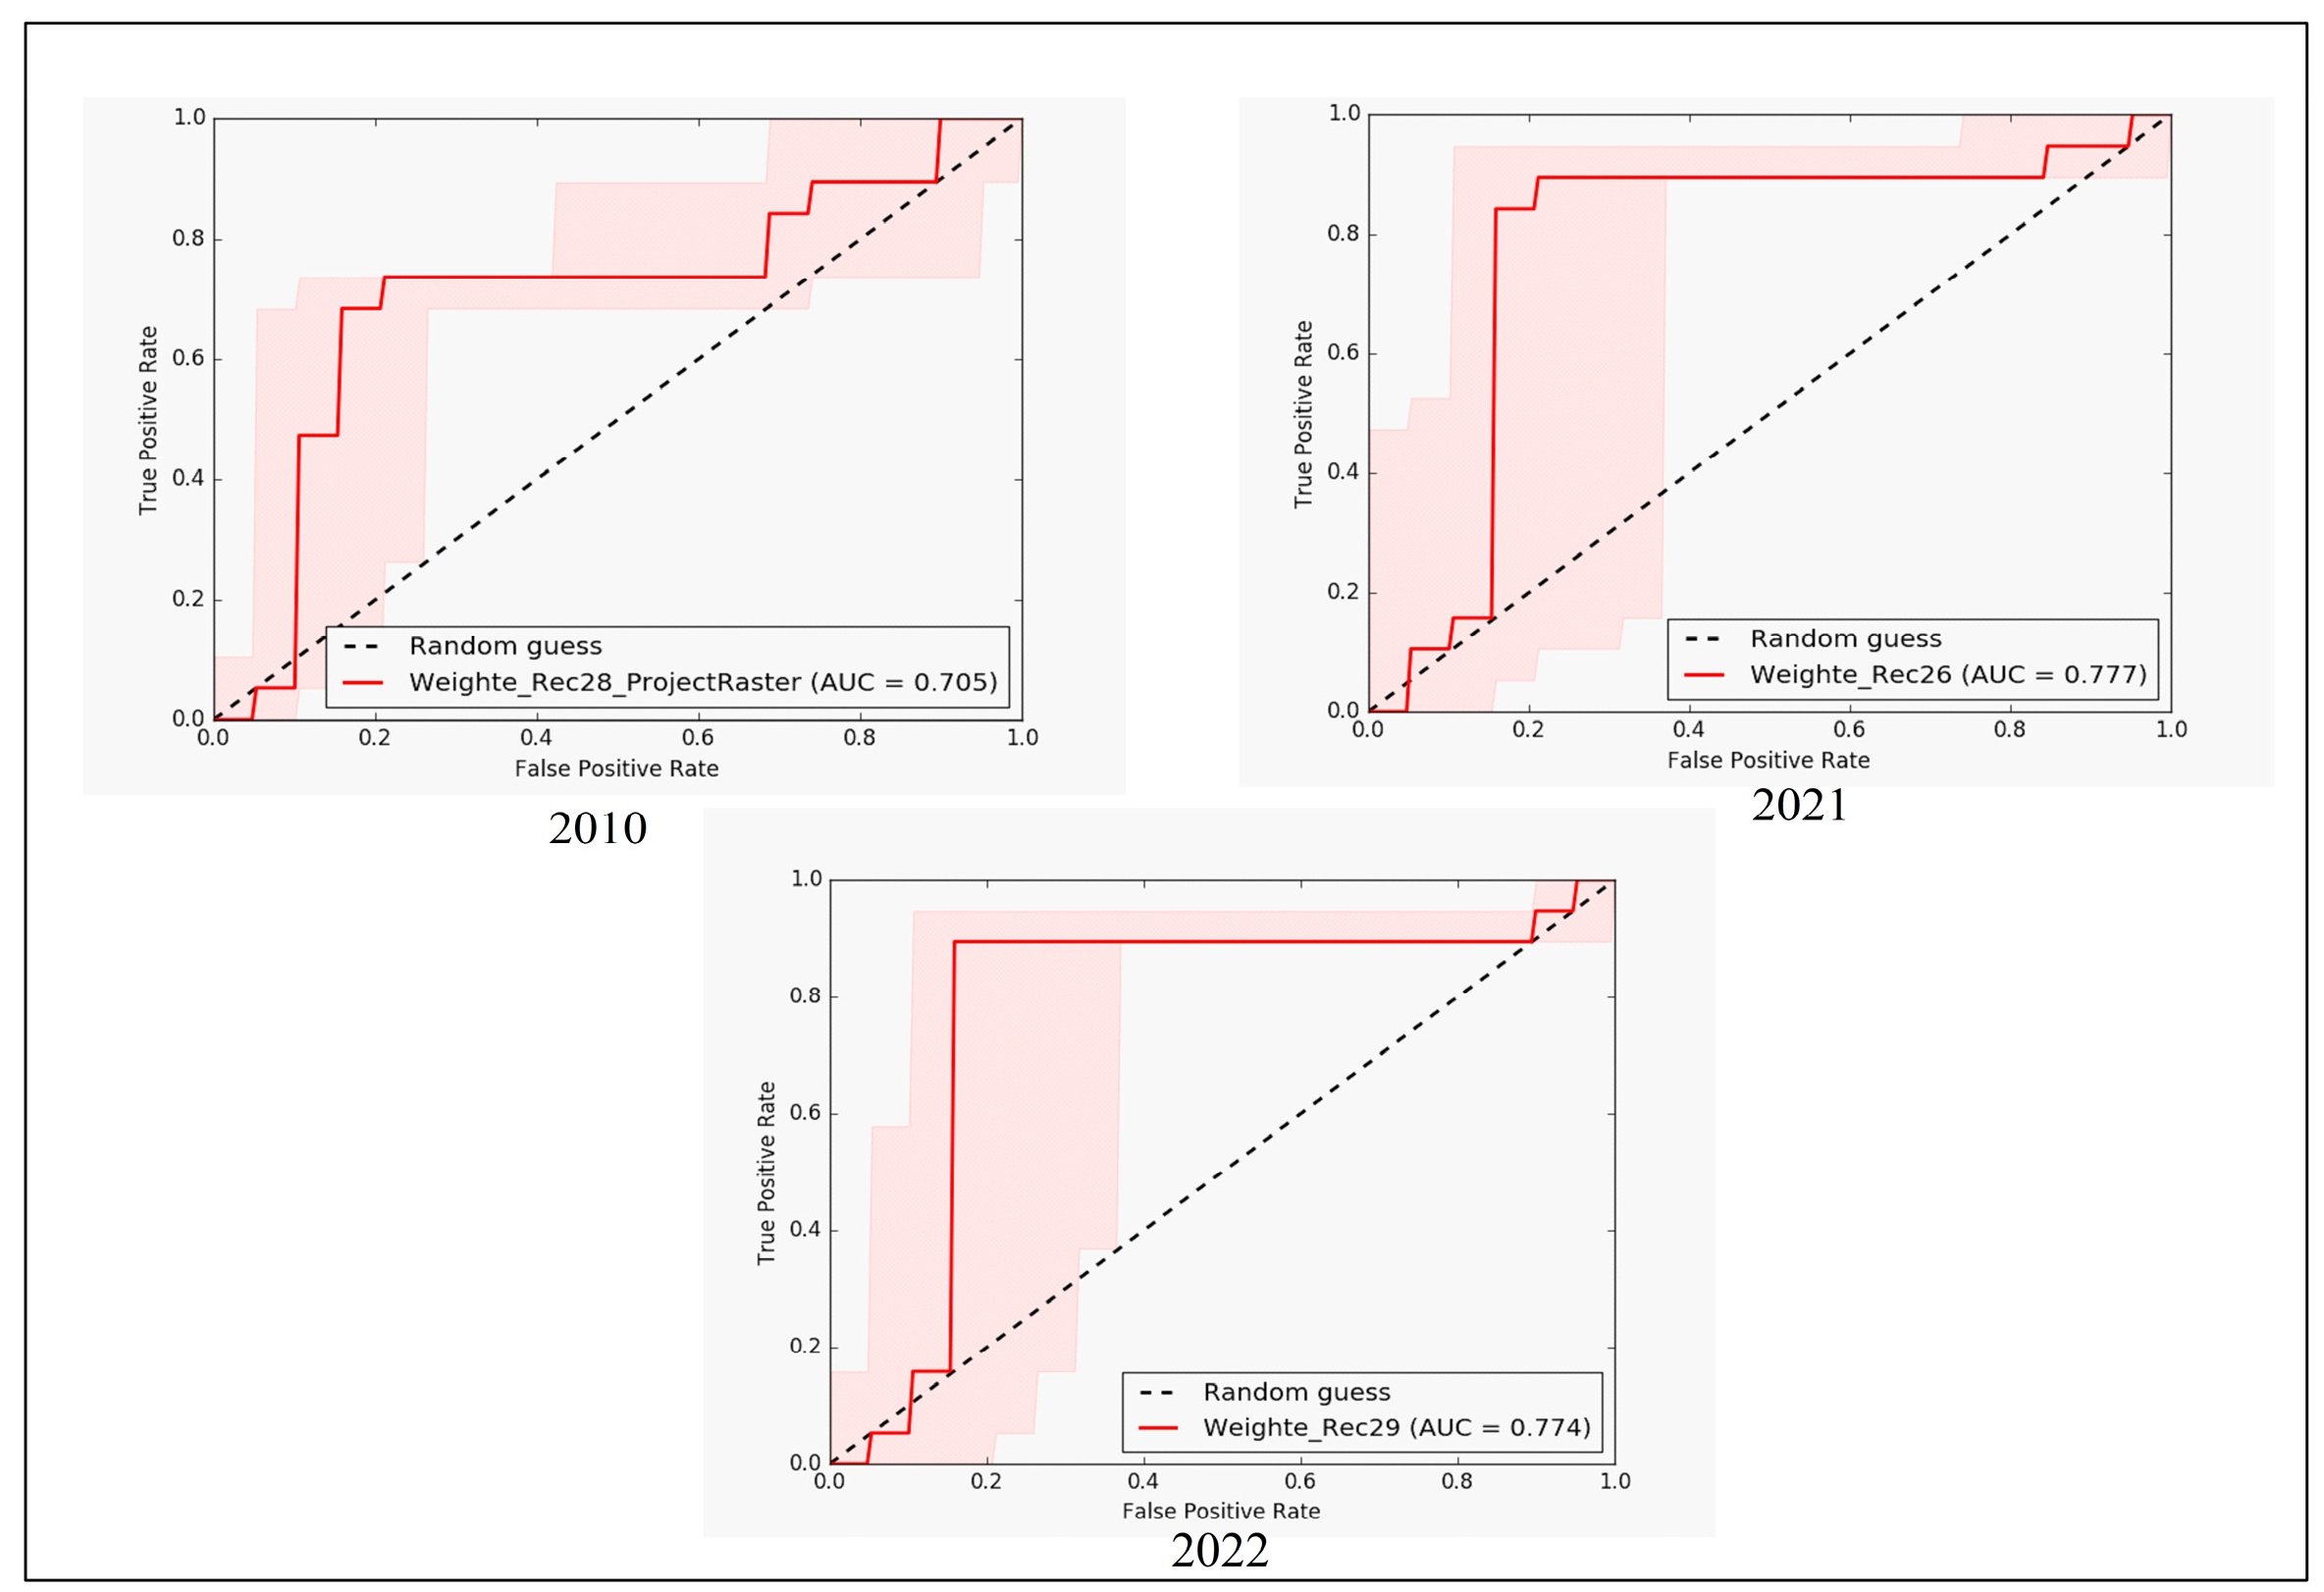
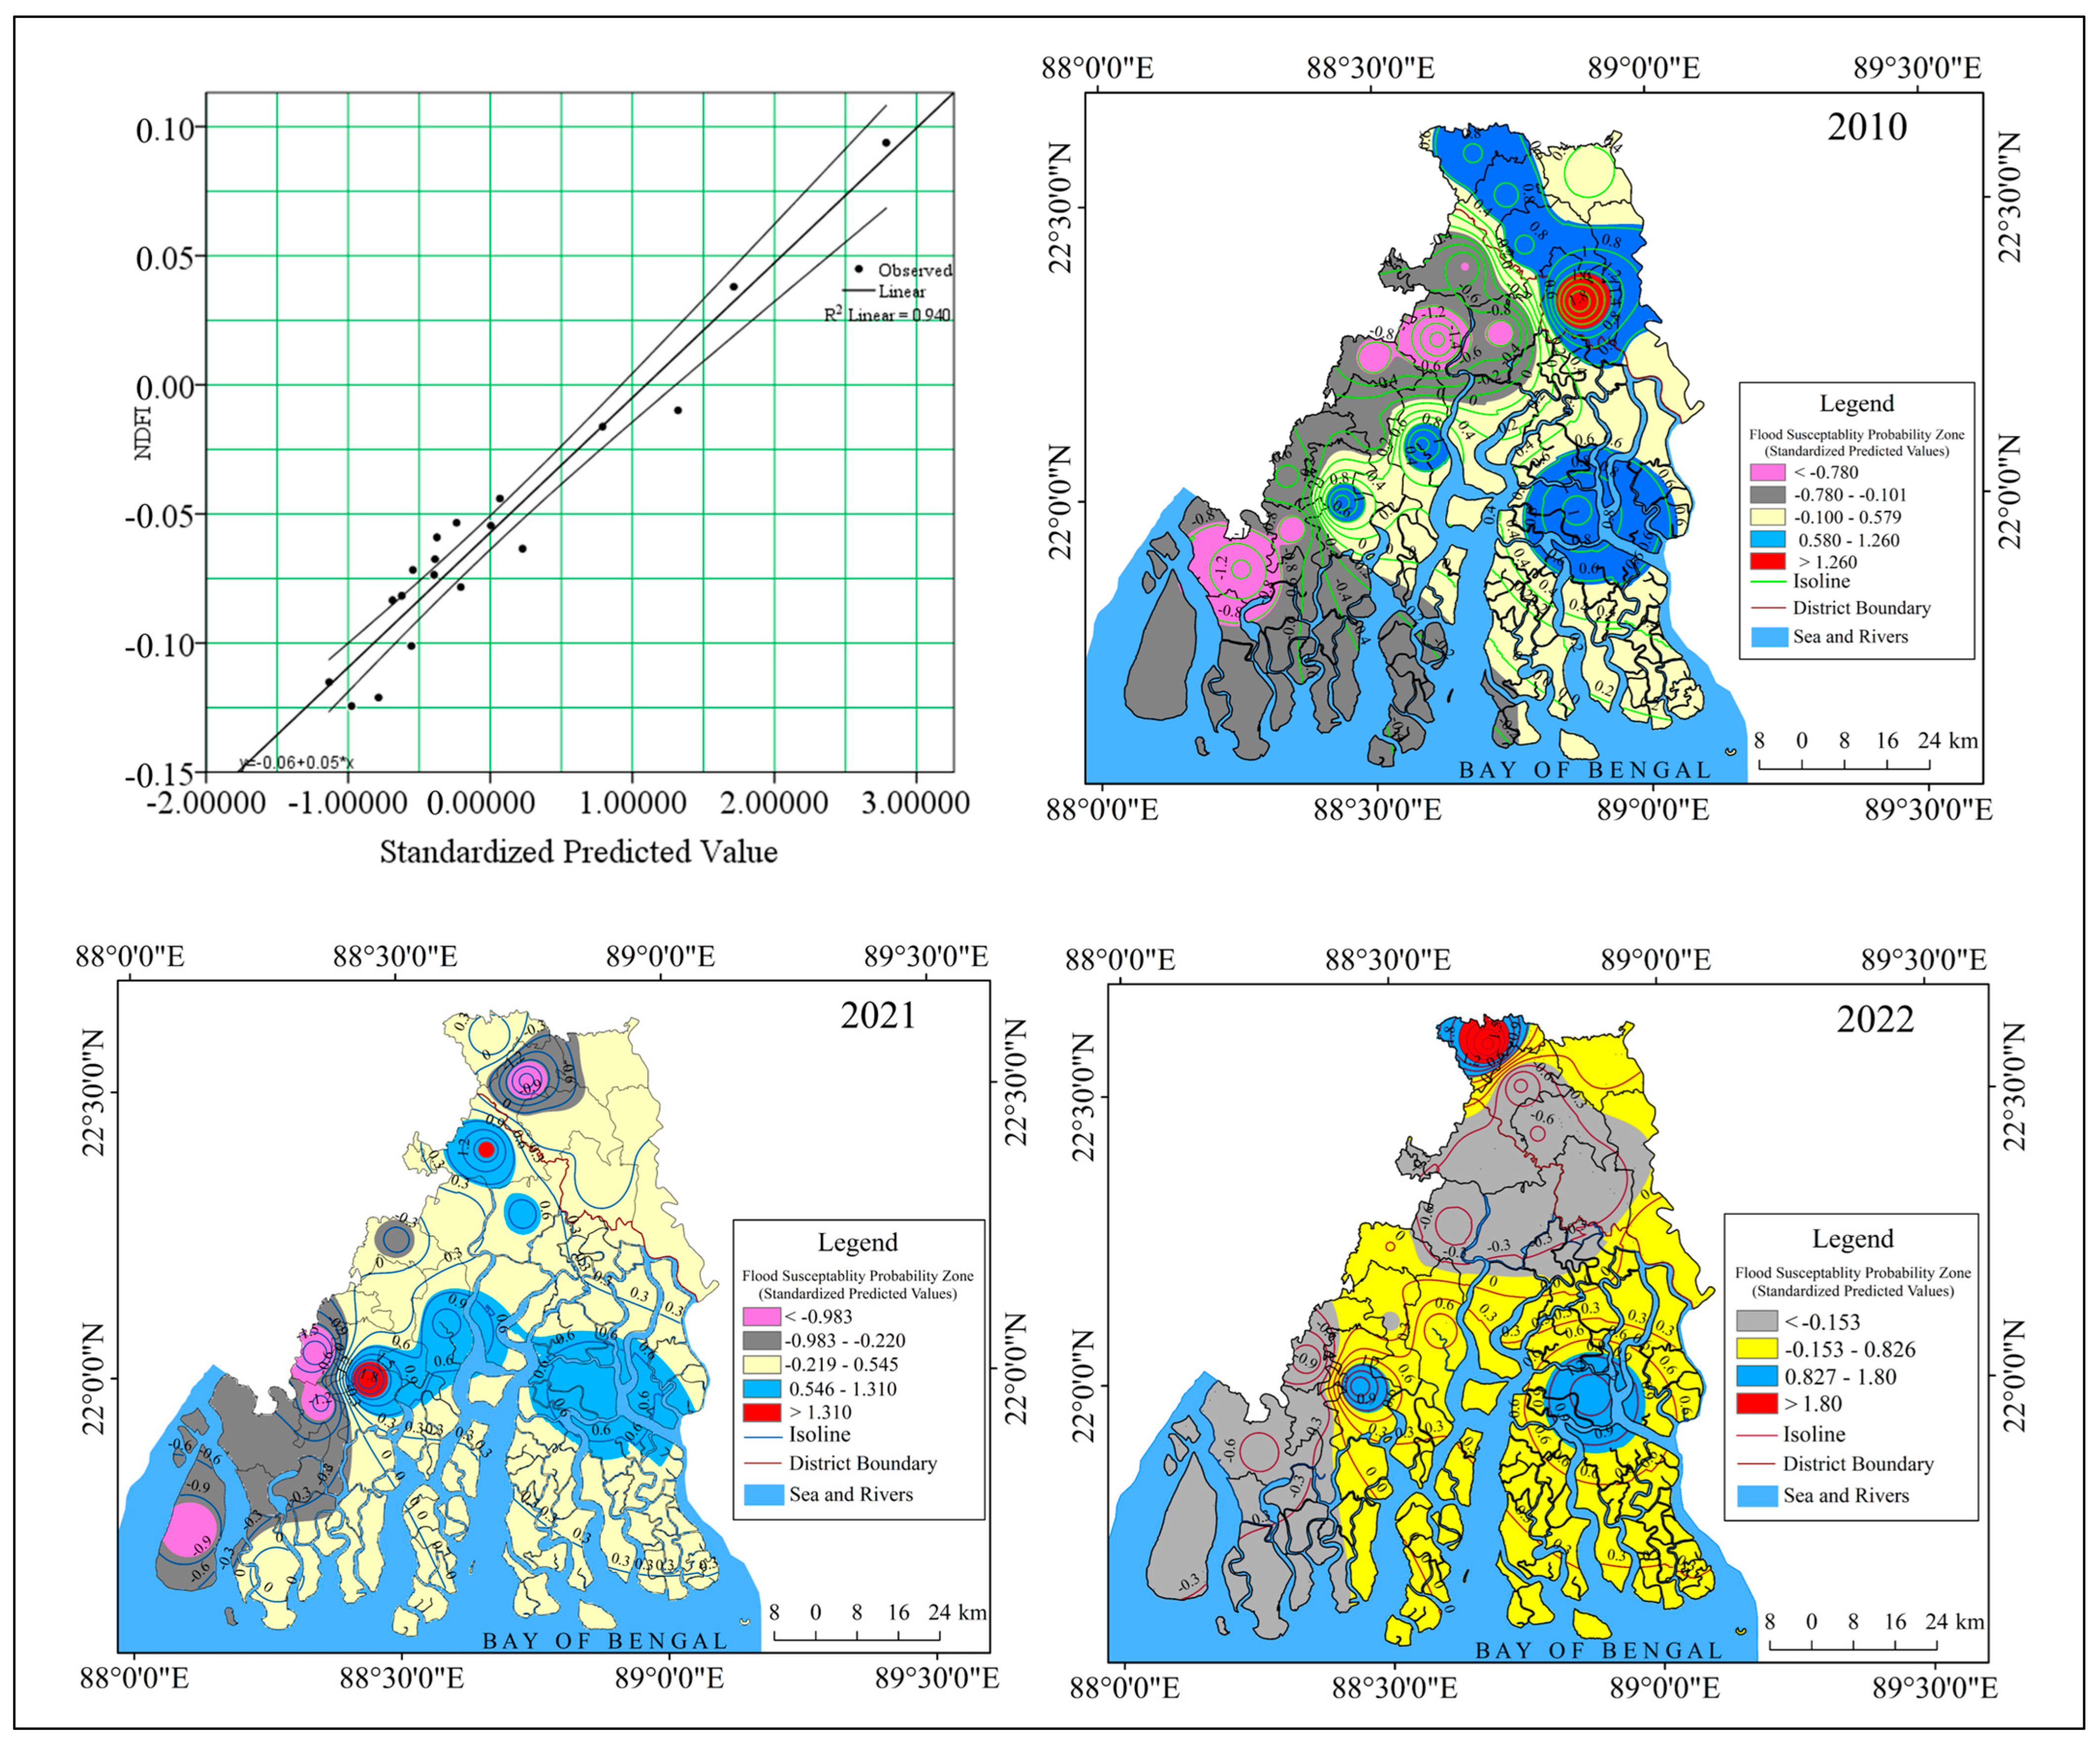
2.4.4. Model Validation
3. Results
3.1. Major Cyclonic Events from 2009 to 2021
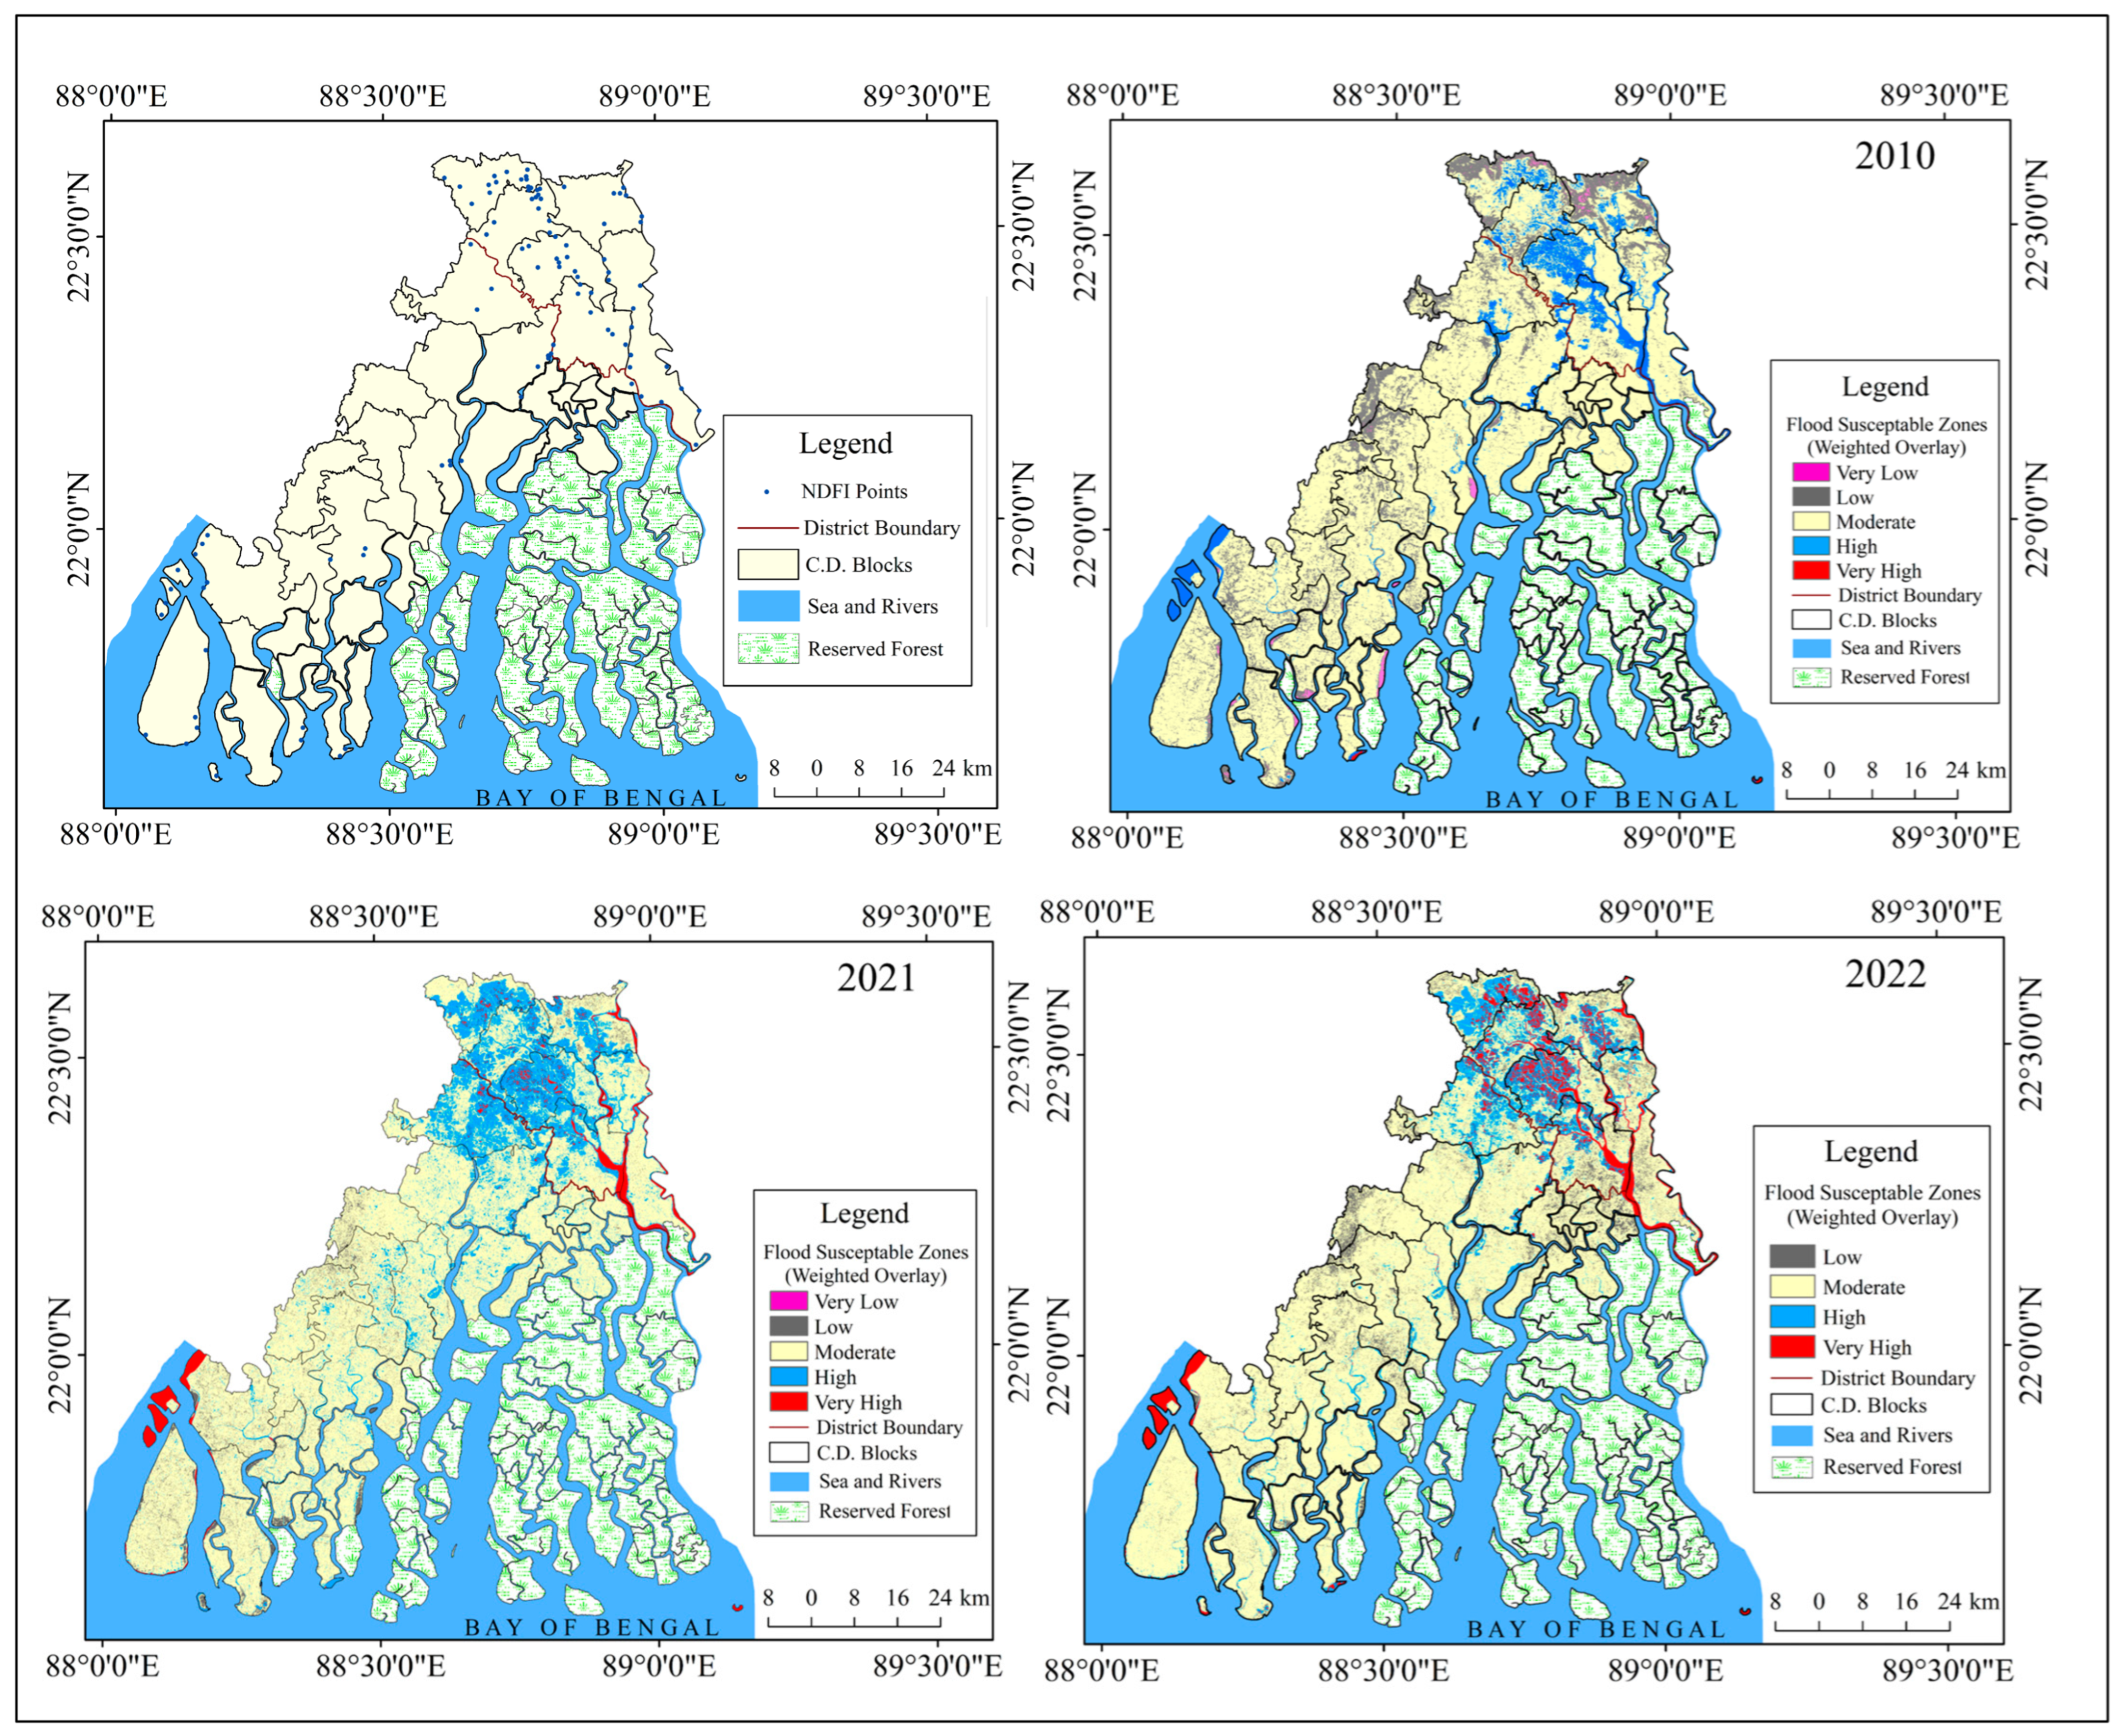
3.2. Physical Susceptibility to Flood in Sundarbans
3.3. Relationship of NDFI with the Indicators of Flood Susceptibility
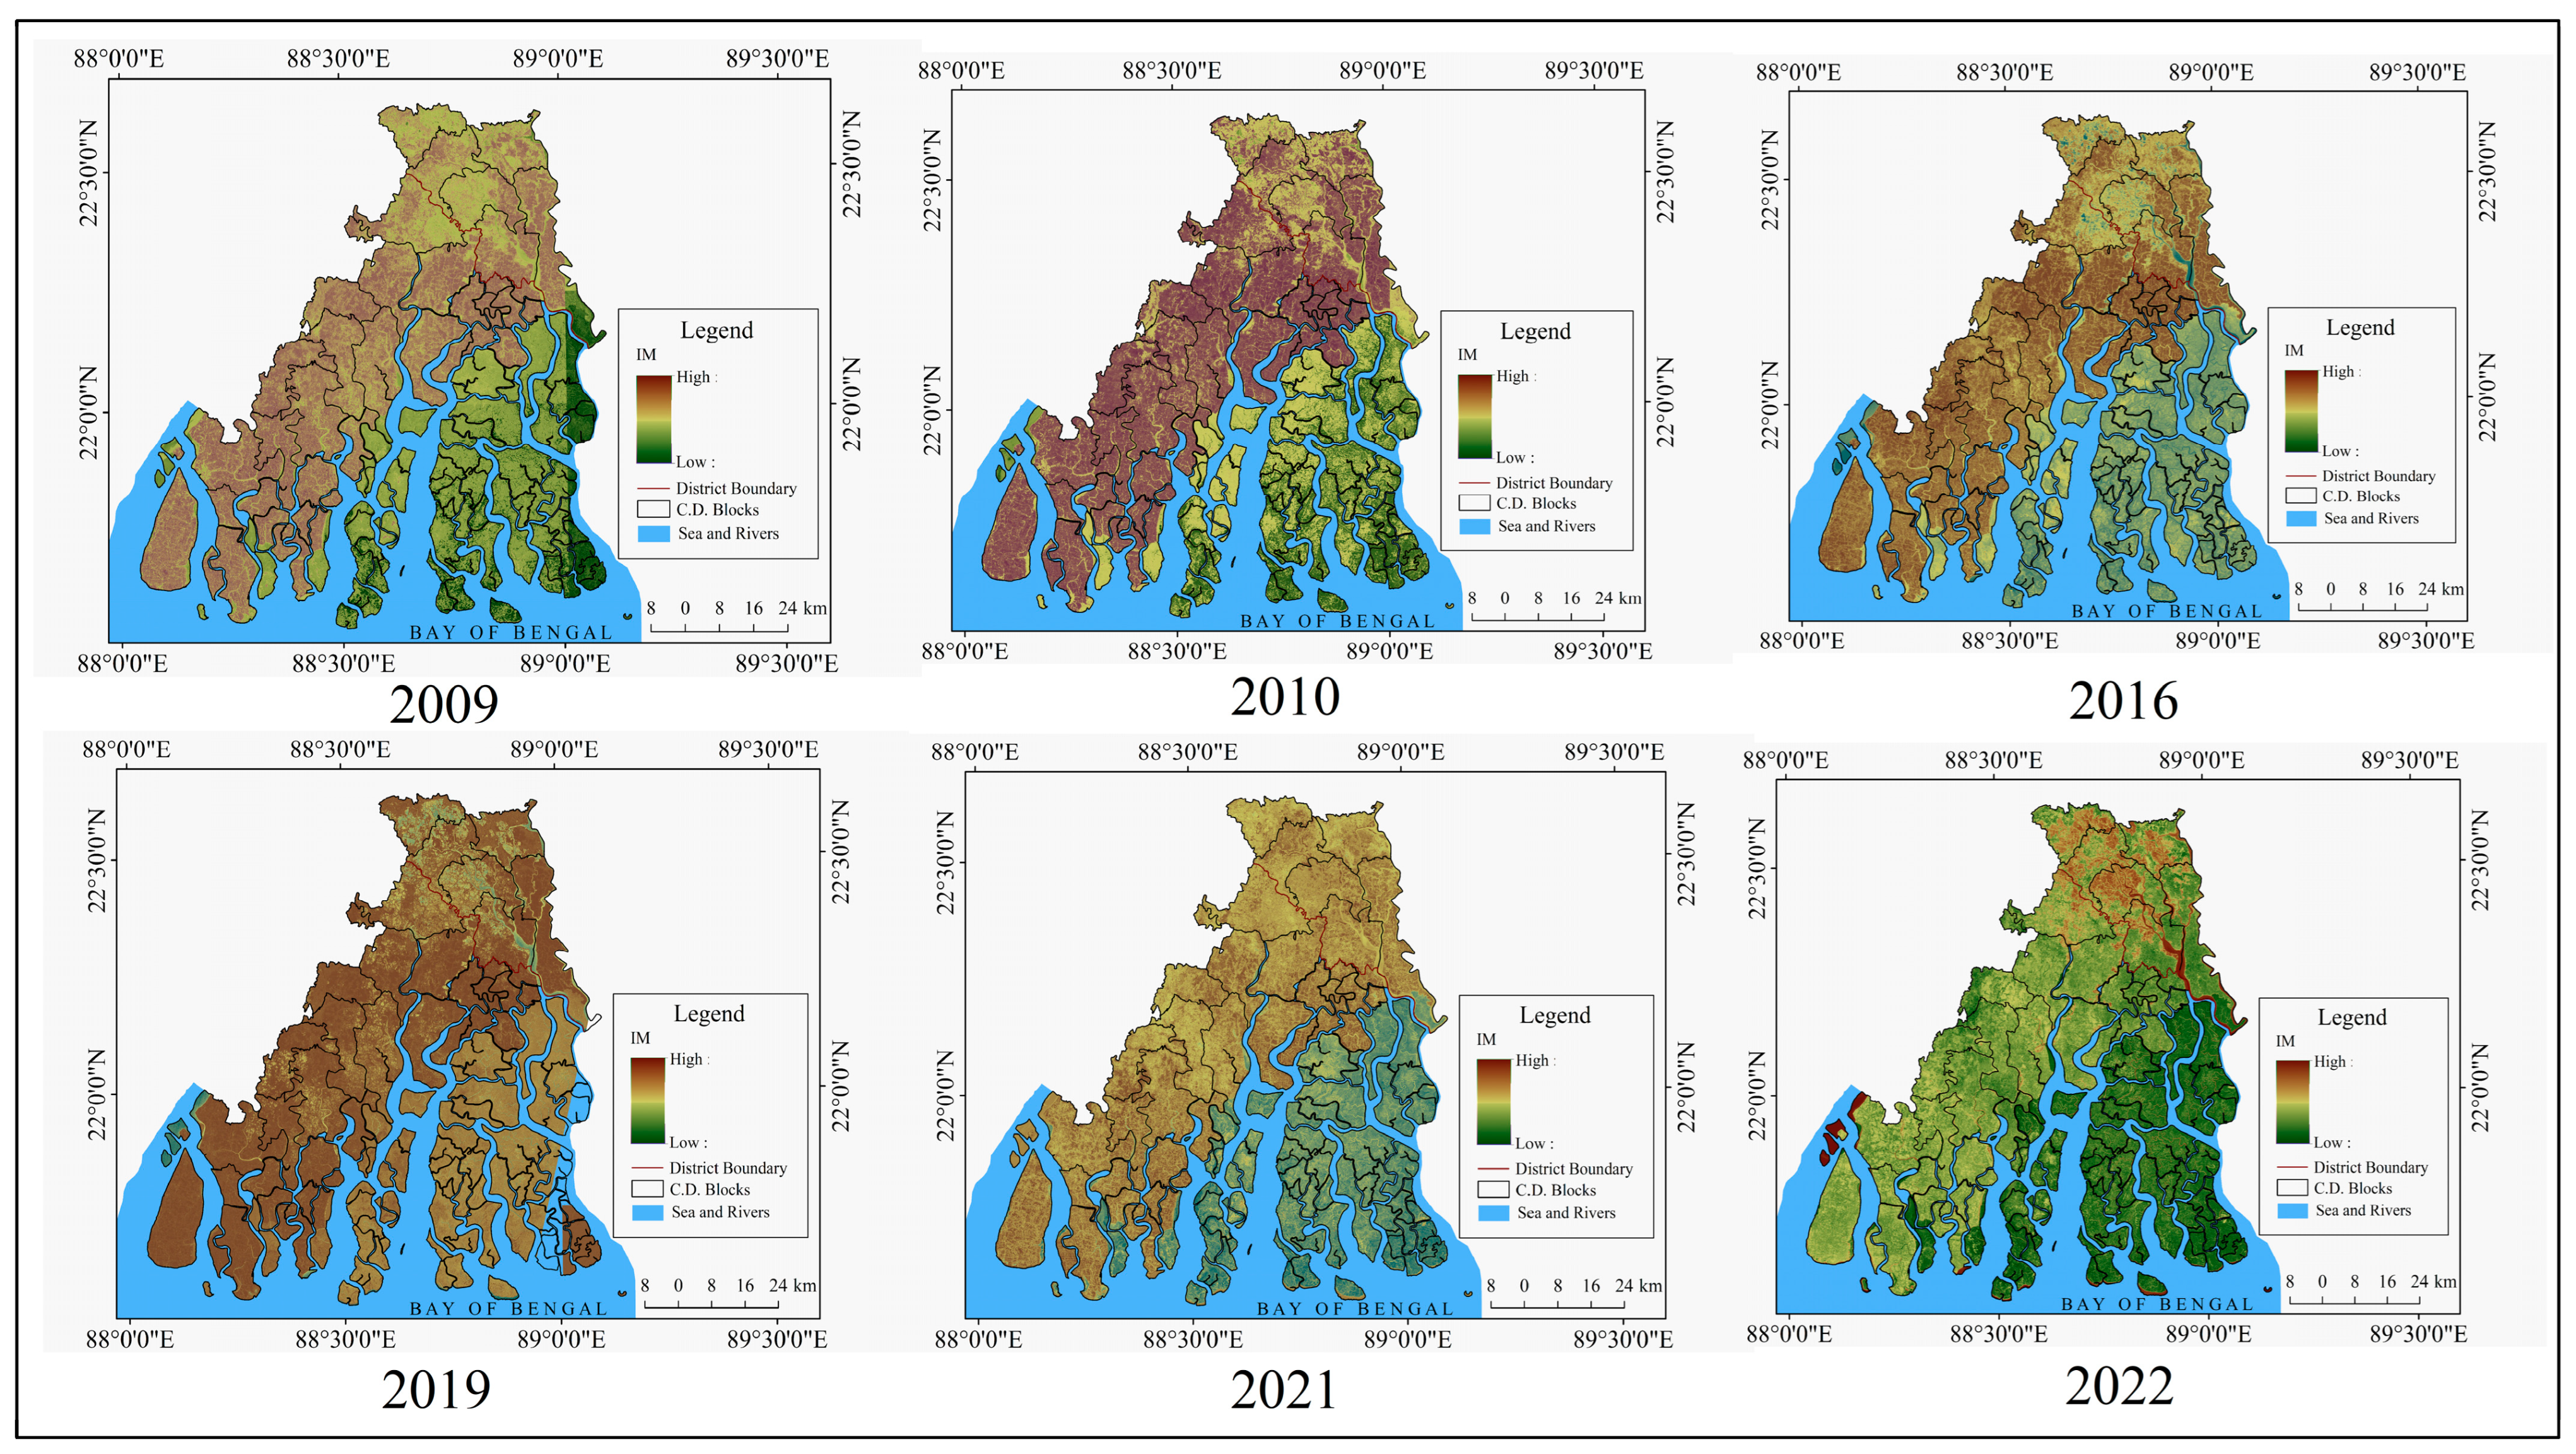
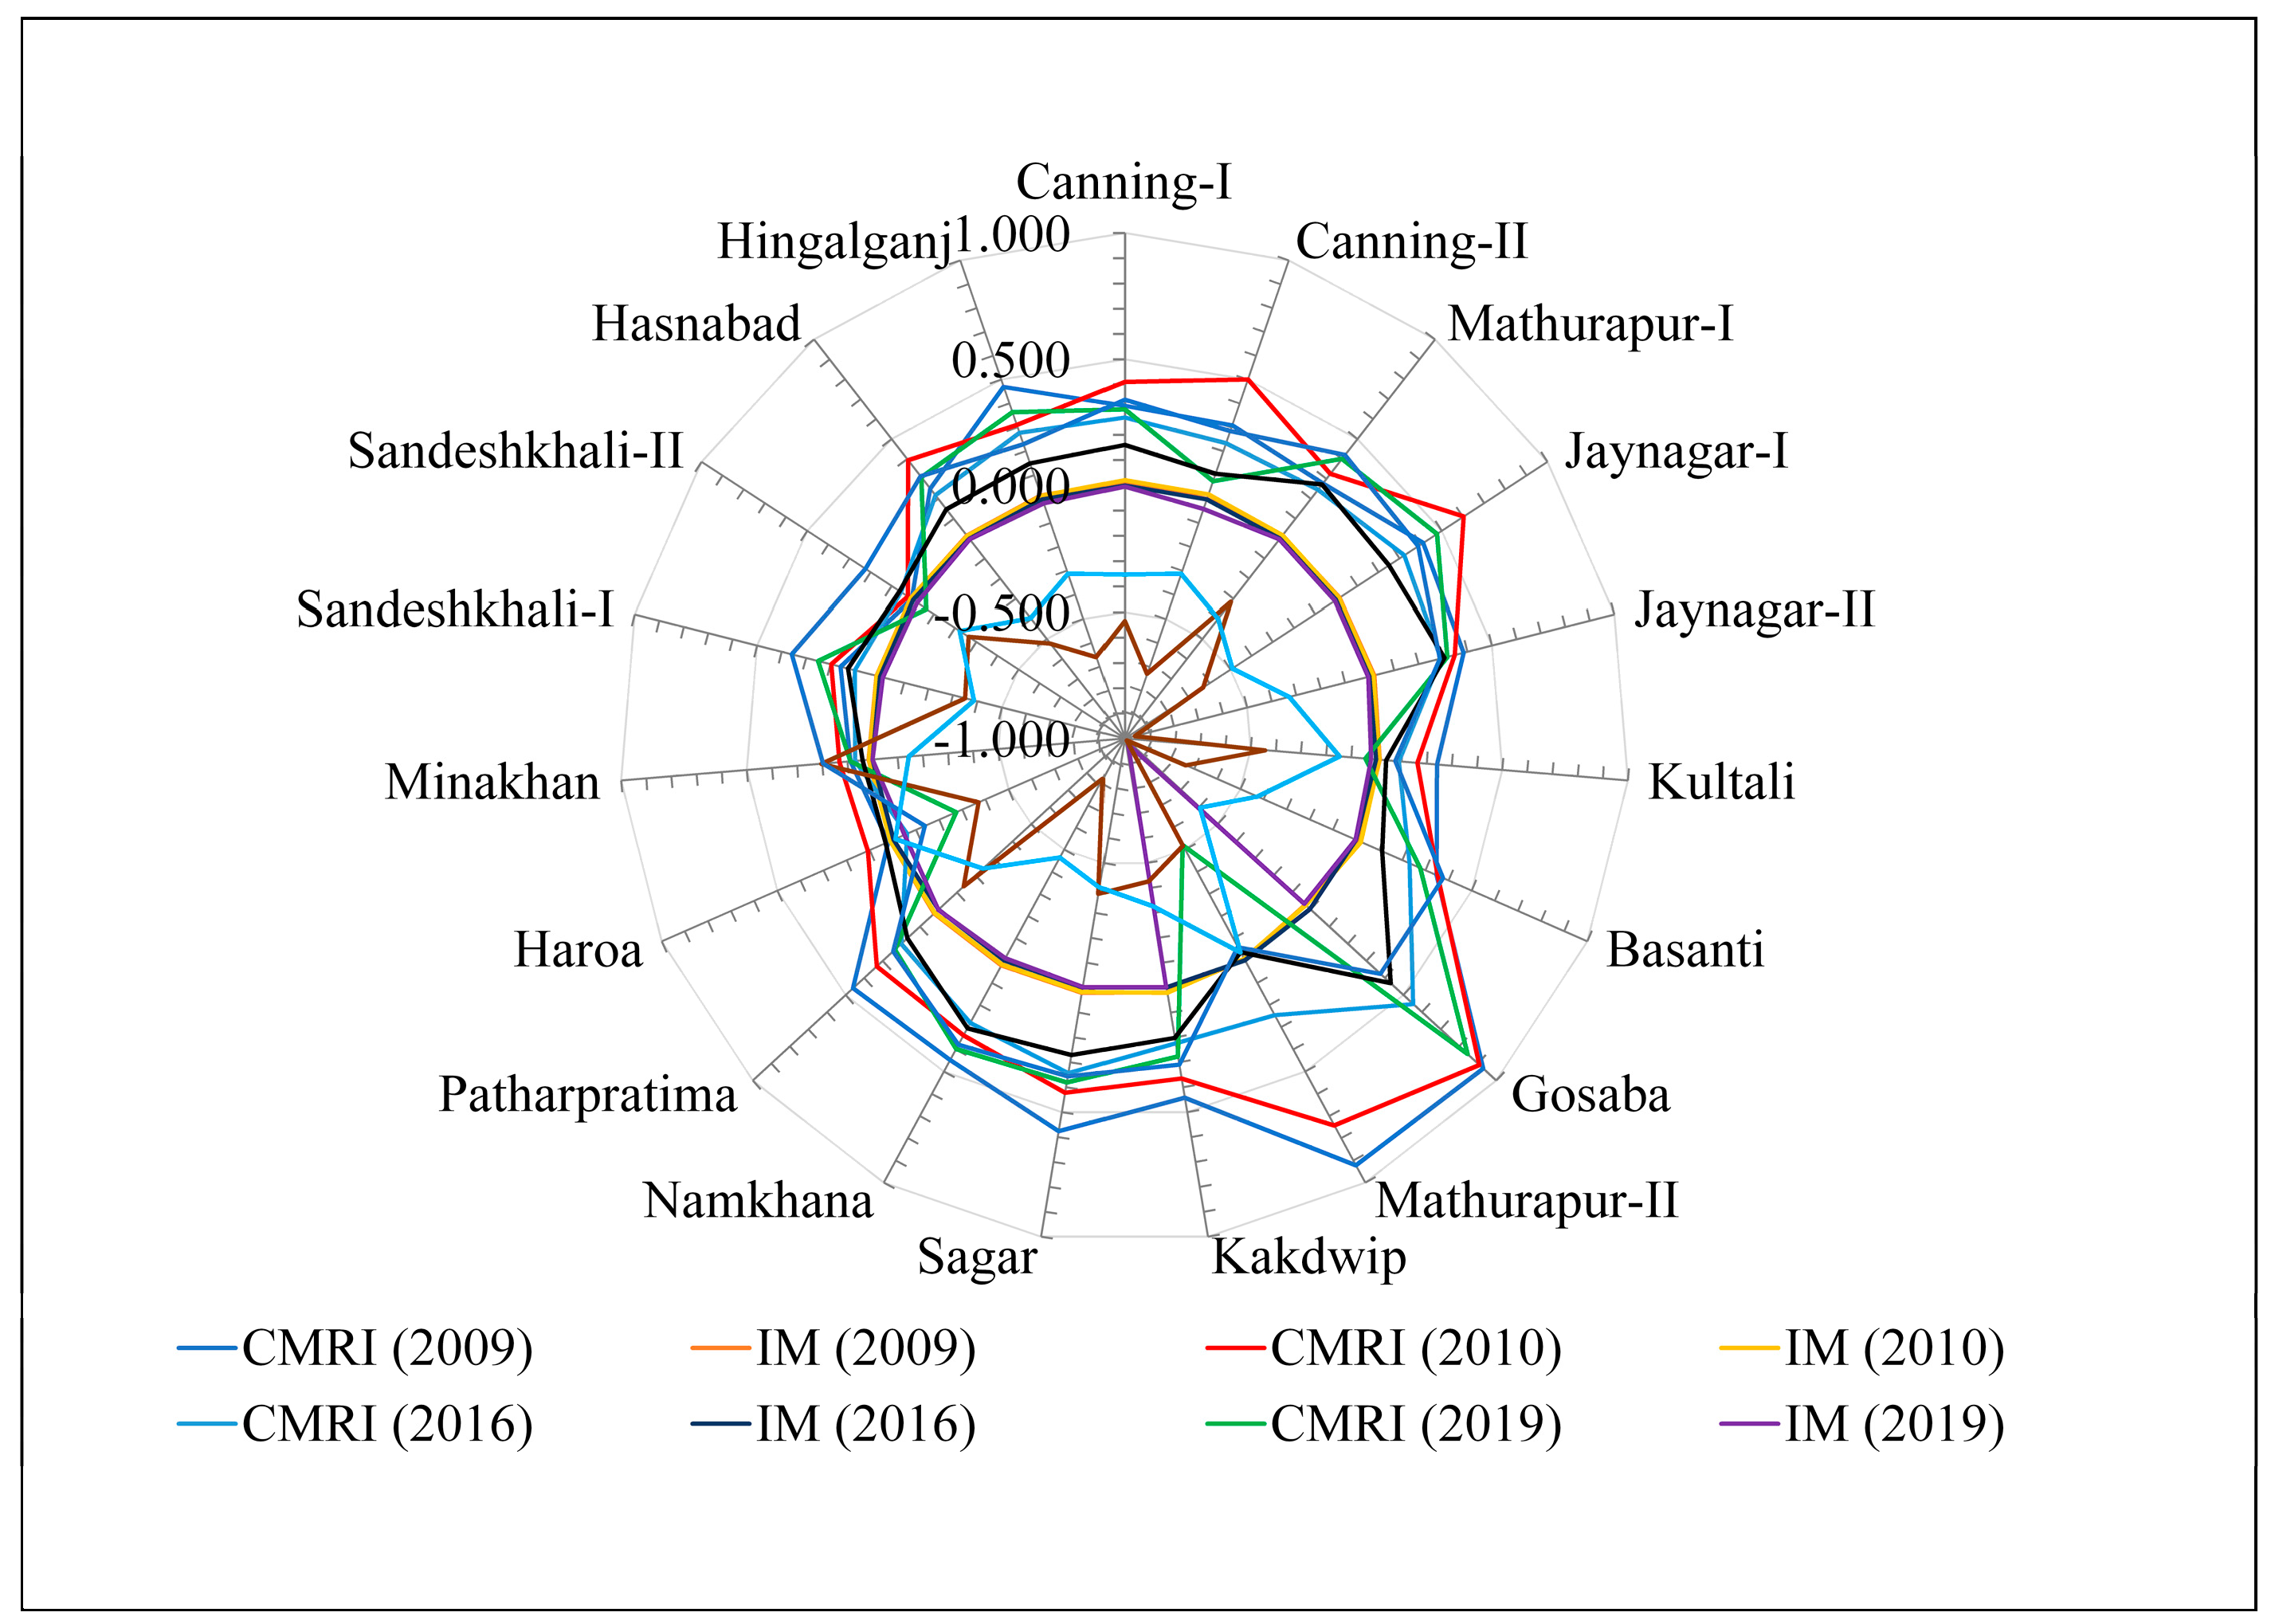
3.4. Changes in Mangrove Area
3.5. Results of Hypothesis Testing
4. Discussion
5. Conclusions
Author Contributions
Funding
Institutional Review Board Statement
Informed Consent Statement
Data Availability Statement
Acknowledgments
Conflicts of Interest
Abbreviations
| SMF | Sundarbans Mangrove Forest |
| UNESCO | United Nations Educational, Scientific and Cultural Organization |
| km | Kilometer |
| mm | Millimeter |
| cm | Centimeter |
| TC | Tropical Cyclone |
| Radar | Radio Detection And Ranging |
| LiDAR | Light Detection and Ranging |
| NDVI | Normalized Difference Vegetation Index |
| SVM | Support Vector Machine |
| SBR | Sundarban Biosphere Reserve |
| CVI | Coastal Vulnerability Index |
| NDFI | Normalized Difference Flood Index |
| C.D. Blocks | Community Development Blocks |
| ISR | Indian Sundarban Region |
| OLI | Operational Land Imager |
| TIRS | Thermal Infrared Sensor |
| LISS | Linear Imaging and Self Scanning Sensor |
| AWiFS | Advanced Wide Field Sensor |
| MERRA | Meteorological Re-analysis |
| NASA | National Aeronautics and Space Administration |
| NIR | Near Infrared |
| SWIR | Shortwave Infrared |
| USGS | United States Geological Survey |
| NRSC | National Remote Sensing Centre |
| GMAO | Global Modeling and Assimilation Office |
| SoDA | Solar Radiation Data |
| MNDWI | Modified Normalized Difference Water Index |
| NDMI | Normalized Difference Moisture Index |
| BSI | Bare Soil Index |
| NDBI | Normalized Difference Build-up Index |
| NDTI | Normalized Difference Turbidity Index |
| CMRI | Combined Mangrove Recognition Index |
| IM | Mangrove Damage Index |
| NDWI | Normalized Different Water Index |
| MCDM | Multi-Criteria Decision-Making |
| AHP | Analytical Hierarchy Process |
| FVI | Flood Vulnerability Index |
| CI | Consistency Index |
| CR | Consistency Ratio |
| RI | Random Index |
| GIS | Geographic Information System |
| WOA | Weighted Overlay Analysis |
| SD | Standard Deviation |
| DW Statistic | Durbin–Watson Statistic |
| ANOVA | Analysis of Variance |
| ZPR Value | Standardized Predicted Value |
| df | Degrees of Freedom |
| RMSE | Root Mean Square Error |
| ROC | Receiver Operating Characteristic |
| AUC | Area under the ROC Curve |
| IMD | India Meteorological Department |
| ESCS | Extremely Severe Cyclonic Strom |
| sig. | Significant |
| Std. Error | Standard Error |
| VIF | Variance Inflation Factor |
| LULC | Land Use Land Cover |
Appendix A
Appendix B


Appendix C

| Years Spectral Indices | 2010 | 2021 | 2022 | |||
|---|---|---|---|---|---|---|
| Classified | Reclassified | Classified | Reclassified | Classified | Reclassified | |
| NDVI | −0.27–−0.17 | 1 | −0.14–−0.089 | 1 | −0.15–−0.082 | 1 |
| −0.16–−0.072 | 2 | −0.088–−0.034 | 2 | −0.081–−0.012 | 2 | |
| −0.071–0.027 | 3 | −0.033–0.021 | 3 | −0.011–0.059 | 3 | |
| 0.028–0.13 | 4 | 0.022–0.077 | 4 | 0.06–0.03 | 4 | |
| 0.14–0.23 | 5 | 0.078–0.13 | 5 | 0.14–0.20 | 5 | |
| 0.24–0.33 | 6 | 0.14–0.19 | 6 | 0.21–0.27 | 6 | |
| 0.34–0.43 | 7 | 0.2–0.24 | 7 | 0.28–0.34 | 7 | |
| 0.44–0.52 | 8 | 0.25–0.3 | 8 | 0.35–0.41 | 8 | |
| 0.53–0.62 | 9 | 0.31–0.35 | 9 | 0.42–0.48 | 9 | |
| MNDWI | −0.49–−0.35 | 1 | −0.26–−0.2 | 1 | −0.36–−0.30 | 1 |
| −0.34–−0.22 | 2 | −0.19–−0.14 | 2 | −0.29–−0.23 | 2 | |
| −0.21–−0.09 | 3 | −0.13–−0.074 | 3 | −0.22–−0.16 | 3 | |
| −0.089–0.043 | 4 | −0.073–−0.012 | 4 | −0.15–−0.10 | 4 | |
| 0.044–0.18 | 5 | −0.011–0.05 | 5 | −0.09–−0.034 | 5 | |
| 0.19–0.31 | 6 | 0.051–0.11 | 6 | −0.033–0.031 | 6 | |
| 0.32–0.44 | 7 | 0.12–0.17 | 7 | 0.032–0.096 | 7 | |
| 0.45–0.57 | 8 | 0.18–0.24 | 8 | 0.097–0.16 | 8 | |
| 0.58–0.7 | 9 | 0.25–0.3 | 9 | 0.17–0.23 | 9 | |
| NDMI | −0.46–−0.34 | 1 | −0.16–−0.097 | 1 | −0.21–−0.14 | 1 |
| −0.33–−0.21 | 2 | −0.096–−0.039 | 2 | −0.13–−0.081 | 2 | |
| −0.2–−0.087 | 3 | −0.038–0.019 | 3 | −0.08–−0.018 | 3 | |
| −0.086–0.037 | 4 | 0.02–0.077 | 4 | −0.017–0.044 | 4 | |
| 0.038–0.16 | 5 | 0.078–0.13 | 5 | 0.045–0.11 | 5 | |
| 0.17–0.29 | 6 | 0.14–0.19 | 6 | 0.12–0.17 | 6 | |
| 0.3–0.41 | 7 | 0.2–0.25 | 7 | 0.18–0.23 | 7 | |
| 0.42–0.54 | 8 | 0.26–0.31 | 8 | 0.24–0.29 | 8 | |
| 0.55–0.66 | 9 | 0.32–0.37 | 9 | 0.3–0.36 | 9 | |
| NDBI | −0.66–−0.54 | 1 | −0.43–−0.37 | 1 | −0.36–−0.29 | 1 |
| −0.53–−0.41 | 2 | −0.36–−0.3 | 2 | −0.28–−0.23 | 2 | |
| −0.40–−0.29 | 3 | −0.29–−0.24 | 3 | −0.22–−0.17 | 3 | |
| −0.28–−0.16 | 4 | −0.23–−0.17 | 4 | −0.16–−0.11 | 4 | |
| −0.15–−0.037 | 5 | −0.16–−0.11 | 5 | −0.1–−0.044 | 5 | |
| −0.036–0.087 | 6 | −0.1–−0.042 | 6 | −0.043–0.018 | 6 | |
| 0.088–0.21 | 7 | −0.041–0.024 | 7 | 0.019–0.081 | 7 | |
| 0.22–0.34 | 8 | 0.025–0.09 | 8 | 0.082–0.14 | 8 | |
| 0.35–0.46 | 9 | 0.091–0.16 | 9 | 0.15–0.21 | 9 | |
| BSI | −0.47–−0.39 | 1 | −0.26–−0.22 | 1 | −0.23–−0.19 | 1 |
| −0.38–−0.31 | 2 | −0.21–−0.18 | 2 | −0.18–−0.15 | 2 | |
| −0.30–−0.22 | 3 | −0.17–−0.15 | 3 | −0.14–−0.1 | 3 | |
| −0.21–−0.14 | 4 | −0.14–−0.11 | 4 | −0.09–−0.062 | 4 | |
| −0.13–−0.061 | 5 | −0.1–−0.076 | 5 | −0.061–−0.02 | 5 | |
| −0.06–0.022 | 6 | −0.075–−0.04 | 6 | −0.019–0.022 | 6 | |
| 0.023–0.1 | 7 | −0.039–−0.0039 | 7 | 0.023–0.063 | 7 | |
| 0.11–0.19 | 8 | −0.0038–0.032 | 8 | 0.064–0.11 | 8 | |
| 0.20–0.27 | 9 | 0.033–0.068 | 9 | 0.12–0.15 | 9 | |
| NDTI | −0.31–−0.26 | 1 | −0.067–−0.056 | 1 | −0.087–−0.067 | 1 |
| −0.25–−0.21 | 2 | −0.055–−0.046 | 2 | −0.066–−0.048 | 2 | |
| −0.20–−0.16 | 3 | −0.045–−0.036 | 3 | −0.047–−0.028 | 3 | |
| −0.15–−0.11 | 4 | −0.035–−0.026 | 4 | −0.027–−0.008 | 4 | |
| −0.10–−0.057 | 5 | −0.025–−0.015 | 5 | −0.0079–0.012 | 5 | |
| −0.056–−0.0068 | 6 | −0.014–−0.005 | 6 | 0.013–0.032 | 6 | |
| −0.0067–0.043 | 7 | −0.0049–0.0053 | 7 | 0.033–0.051 | 7 | |
| 0.044–0.094 | 8 | 0.0054–0.016 | 8 | 0.052–0.071 | 8 | |
| 0.095–0.14 | 9 | 0.017–0.026 | 9 | 0.072–0.091 | 9 | |
| Model Summary b | ||||||||||
|---|---|---|---|---|---|---|---|---|---|---|
| Model | R | R Square | Adjusted R Square | Std. Error of the Estimate | Durbin−Watson | |||||
| 1 | 0.970 a | 0.940 | 0.923 | 0.01493 | 1.914 | |||||
| a. Predictors: (Constant), NDTI, NDVI, NDBI, BSI | ||||||||||
| b. Dependent Variable: NDFI | ||||||||||
| ANOVA a | ||||||||||
| Model | Sum of Squares | df | Mean Square | F | Sig. | |||||
| 1 | Regression | 0.049 | 4 | 0.012 | 55.045 | 0.000 b | ||||
| Residual | 0.003 | 14 | 0.000 | |||||||
| Total | 0.052 | 18 | ||||||||
| a. Dependent Variable: NDFI | ||||||||||
| b. Predictors: (Constant), NDTI, NDVI, NDBI, BSI | ||||||||||
| Coefficients a | ||||||||||
| Model | Unstandardized Coefficients | Standardized Coefficients | t | Sig. * | 95.0% Confidence Interval for B | Collinearity Statistics | ||||
| B | Std. Error | Beta | Lower Bound | Upper Bound | Tolerance | VIF | ||||
| 1 | (Constant) | −0.031 | 0.033 | −0.948 | 0.359 | −0.103 | 0.040 | |||
| NDVI | −0.658 | 0.093 | −1.094 | −7.047 | 0.000 ** | −0.858 | −0.458 | 0.177 | 5.644 | |
| NDBI | −0.797 | 0.509 | −0.809 | −1.567 | 0.140 | −1.889 | 0.294 | 0.016 | 62.488 | |
| BSI | −0.168 | 0.924 | −0.123 | −0.182 | 0.858 | −2.150 | 1.814 | 0.009 | 106.917 | |
| NDTI | −0.709 | 0.598 | −0.191 | −1.186 | 0.255 | −1.992 | 0.573 | 0.165 | 6.074 | |
| * The total number of observations (n) = 19 ** The p-value: Minimal but not quite zero | ||||||||||
| a. Dependent Variable: NDFI | ||||||||||
| Excluded Variables a | ||||||||||
| Model | Beta In | t | Sig. | Partial Correlation | Collinearity Statistics | |||||
| Tolerance | VIF | Minimum Tolerance | ||||||||
| 1 | MNDWI | −10.801 b | −1.240 | 0.237 | −0.325 | 0.000054220 | 18,443.399 | 0.0000370 | ||
| NDMI | .b | . | . | . | 0.000 ** | . | 0.000 ** | |||
| a. Dependent Variable: NDFI | ||||||||||
| b. Predictors in the Model: (Constant), NDTI, NDVI, NDBI, BSI | ||||||||||
| C.D. Blocks | NDFI (2010) | NDFI (2021) | NDFI (2022) | ZPR (2010) | ZPR (2021) | ZPR (2022) |
|---|---|---|---|---|---|---|
| Canning−I | −0.45946 | 0.095745 | −0.1211 | −0.78611 | 0.08813 | −1.46359 |
| Canning−II | −0.38235 | 0.193871 | −0.06753 | −0.38926 | 1.41659 | −0.79838 |
| Mathurapur−I | −0.36585 | −0.03463 | −0.11512 | −1.13422 | −1.75122 | −0.64429 |
| Jaynagar−I | −0.39 | 0.06398 | −0.05454 | 0.00452 | −0.37661 | −0.88091 |
| Jaynagar−II | −0.32489 | 0.102167 | −0.07834 | −0.20735 | 0.17996 | −0.28575 |
| Kultali | −0.17073 | 0.163889 | −0.01618 | 0.79065 | 1.04404 | 1.06068 |
| Basanti | −0.39932 | 0.138561 | −0.0736 | −0.39557 | 0.67979 | −0.92696 |
| Gosaba | −0.1746 | 0.141982 | −0.00988 | 1.32131 | 0.75628 | 1.04259 |
| Mathurapur−II | −0.1677 | 0.238038 | 0.037978 | 1.71383 | 2.07778 | 1.09658 |
| Kakdwip | −0.43357 | 0.057409 | −0.08345 | −0.68745 | −0.45934 | −1.23924 |
| Sagar | −0.37255 | 0.006768 | −0.05907 | −0.37587 | −1.1838 | −0.7058 |
| Namkhana | −0.37165 | 0.098237 | −0.05341 | −0.23713 | 0.12614 | −0.69482 |
| Patharpratima | −0.39785 | −0.00271 | −0.07171 | −0.54458 | −1.2942 | −0.91281 |
| Haroa | −0.2 | 0.124469 | 0.093731 | 2.78633 | 0.52248 | 0.82285 |
| Minakhan | −0.19313 | −0.0265 | −0.12439 | −0.97659 | −1.62789 | 0.86377 |
| Sandeshkhali−I | −0.19588 | 0.084123 | −0.08168 | −0.62304 | −0.09262 | 0.85849 |
| Sandeshkhali−II | −0.07027 | 0.078758 | −0.10111 | −0.5549 | −0.12813 | 1.94128 |
| Hasnabad | −0.25604 | 0.07904 | −0.04405 | 0.0683 | −0.14953 | 0.33297 |
| Hingalganj | −0.23077 | 0.102639 | −0.06347 | 0.22712 | 0.17214 | 0.53333 |
References
- Ostling, J.L.; Butler, D.R.; Dixon, R.W. The biogeomorphology of mangroves and their role in natural hazards mitigation. Geogr. Compass 2009, 3, 1607–1624. [Google Scholar] [CrossRef]
- Karimi, Z.; Abdi, E.; Deljouei, A.; Cislaghi, A.; Shirvany, A.; Schwarz, M.; Hales, T.C. Vegetation-induced soil stabilization in coastal area: An example from a natural mangrove forest. Catena 2022, 216, 106410. [Google Scholar] [CrossRef]
- Leal Filho, W.; Alam, G.M.; Nagy, G.J.; Rahman, M.M.; Roy, S.; Wolf, F.; Kovaleva, M.; Saroar, M.; Li, C. Climate change adaptation responses among riparian settlements: A case study from Bangladesh. PLoS ONE 2022, 17, e0278605. [Google Scholar] [CrossRef] [PubMed]
- Mitra, A.; Dutta, J.; Mitra, A.; Thakur, T. Amphan Super cyclone: A death knell for Indian Sundarbans. J. Appl. For. Ecol. 2020, 8, 41–48. [Google Scholar]
- Das, C.S.; Mallick, D.; Mandal, R.N. Mangrove Forests in Changing Climate: A Global Overview. J. Indian Soc. Coast. Agric. Res. 2020, 38, 104–124. [Google Scholar]
- Siegert, M.; Alley, R.B.; Rignot, E.; Englander, J.; Corell, R. Twenty-first century sea-level rise could exceed IPCC projections for strong-warming futures. One Earth 2020, 3, 691–703. [Google Scholar] [CrossRef]
- Sobhani, P.; Esmaeilzadeh, H.; Barghjelveh, S.; Sadeghi, S.M.; Marcu, M.V. Habitat integrity in protected areas threatened by LULC changes and fragmentation: A case study in Tehran province, Iran. Land 2021, 11, 6. [Google Scholar] [CrossRef]
- Moradi, F.; Sadeghi, S.M.; Heidarlou, H.B.; Deljouei, A.; Boshkar, E.; Borz, S.A. Above-ground biomass estimation in a Mediterranean sparse coppice oak forest using Sentinel-2 data. Ann. For. Res. 2022, 65, 165–182. [Google Scholar] [CrossRef]
- Pourreza, M.; Moradi, F.; Khosravi, M.; Deljouei, A.; Vanderhoof, M.K. GCPs-free photogrammetry for estimating tree height and crown diameter in Arizona Cypress plantation using UAV-mounted GNSS RTK. Forests 2022, 13, 1905. [Google Scholar] [CrossRef]
- Sobhani, P.; Esmaeilzadeh, H.; Deljouei, A.; Wolf, I.D.; Marcu, M.V.; Sadeghi, S.M. Assessing water security and footprint in hypersaline Lake Urmia. Ecol. Indic. 2023, 155, 110955. [Google Scholar] [CrossRef]
- Sakib, M. Sundarban as a buffer against storm surge flooding. World J. Eng. Technol. 2015, 3, 59. [Google Scholar] [CrossRef]
- Gayathri, R.; Murty, P.L.; Bhaskaran, P.K.; Srinivasa; Kumar, T. A. Numerical study of hypothetical storm surge and coastal inundation for AILA cyclone in the Bay of Bengal. Environ. Fluid Mech. 2016, 16, 429–452. [Google Scholar] [CrossRef]
- Rahman, S.; Rahman, H.; Shahid, S.; Khan, R.U.; Jahan, N.; Ahmed, Z.U.; Khanum, R.; Ahmed, M.F.; Mohsenipour, M. The impact of cyclone Aila on the Sundarban forest ecosystem. Int. J. Ecol. Dev. 2017, 32, 87–97. [Google Scholar]
- Sharma, S.; Suwa, R.; Ray, R.; Mandal, M.S. Successive cyclones attacked the world’s largest mangrove forest located in the Bay of Bengal under pandemic. Sustainability 2022, 14, 5130. [Google Scholar] [CrossRef]
- Mondal, P.; Dutta, T.; Qadir, A.; Sharma, S. Radar and optical remote sensing for near real-time assessments of cyclone impacts on coastal ecosystems. Remote Sens. Ecol. 2022, 8, 506–520. [Google Scholar] [CrossRef] [PubMed]
- Deb, M.; Ferreira, C.M. Potential impacts of the Sunderban mangrove degradation on future coastal flooding in Bangladesh. J. Hydro-Environ. Res. 2017, 17, 30–46. [Google Scholar] [CrossRef]
- Bahinipati, C.S.; Sahu, N. Mangrove conservation as a sustainable adaptation to cyclonic risk in Kendrapada District of Odisha, India. Asian J. Environ. Disaster Manag. 2012, 4, 183–202. [Google Scholar] [CrossRef]
- Ghosh, A.; Schmidt, S.; Fickert, T.; Nüsser, M. The Indian Sundarban mangrove forests: History, utilization, conservation strategies and local perception. Diversity 2015, 7, 149–169. [Google Scholar] [CrossRef]
- Samanta, S.; Hazra, S.; Mondal, P.P.; Chanda, A.; Giri, S.; French, J.R.; Nicholls, R.J. Assessment and attribution of mangrove Forest changes in the Indian Sundarbans from 2000 to 2020. Remote Sens. 2021, 13, 4957. [Google Scholar] [CrossRef]
- Giri, C.; Pengra, B.; Zhu, Z.; Singh, A.; Tieszen, L.L. Monitoring mangrove forest dynamics of the Sundarbans in Bangladesh and India using multi-temporal satellite data from 1973 to 2000. Estuar. Coast. Shelf Sci. 2007, 73, 91–100. [Google Scholar] [CrossRef]
- Kumar, D.; Bhattacharjya, R.K. Review of different methods and techniques used for flood vulnerability analysis. Nat. Hazards Earth Syst. Sci. 2020, 11–30. [Google Scholar]
- Ali, M.; Tasnim Mukarram, M.; Islam, A. Environmental Degradation Due to Deforestation in the Sundarban Forest of Bangladesh. Int. J. Sci. Eng. Res. 2021, 12, 855–862. [Google Scholar]
- Majumder, R.; Ghosh, D.K.; Mandal, A.C.; Patra, P.; Bhunia, G.S. An appraisal of geomorphic characteristics and flood susceptibility zone using remote sensing and GIS: A case study in Bongaon Subdivision, North 24 Parganas (West Bengal), India. Int. J. Res. Geogr. 2017, 3, 32–40. [Google Scholar]
- Sahana, M.; Rehman, S.; Sajjad, H.; Hong, H. Exploring effectiveness of frequency ratio and support vector machine models in storm surge flood susceptibility assessment: A study of Sundarban Biosphere Reserve, India. Catena 2020, 189, 104450. [Google Scholar] [CrossRef]
- Sahana, M.; Sajjad, H. Vulnerability to storm surge flood using remote sensing and GIS techniques: A study on Sundarban Biosphere Reserve, India. Remote Sens. Appl. Soc. Environ. 2019, 13, 106–120. [Google Scholar] [CrossRef]
- Jana, R.; Mohapatra, S.; Gupta, A. Vulnerability to cyclone disaster in Indian Sundarbans: A micro-level analysis. Hill Geographer. 2017, XXXIII, 1–15. [Google Scholar]
- Bera, A.; Meraj, G.; Kanga, S.; Farooq, M.; Singh, S.K.; Sahu, N.; Kumar, P. Vulnerability and risk assessment to climate change in Sagar Island, India. Water 2022, 14, 823. [Google Scholar] [CrossRef]
- Sahana, M.; Hong, H.; Ahmed, R.; Patel, P.P.; Bhakat, P.; Sajjad, H. Assessing coastal island vulnerability in the Sundarban Biosphere Reserve, India, using geospatial technology. Environ. Earth Sci. 2019, 78, 1–22. [Google Scholar] [CrossRef]
- Ali, S.A.; Khatun, R.; Ahmad, A.; Ahmad, S.N. Assessment of cyclone vulnerability, hazard evaluation and mitigation capacity for analyzing cyclone risk using GIS technique: A study on Sundarban biosphere reserve, India. Earth Syst. Environ. 2020, 4, 71–92. [Google Scholar] [CrossRef]
- Mondal, B.K. Nature of propensity of Indian Sundarban. Int. J. Appl. Res. 2015, 4, 1–17. [Google Scholar]
- Mondal, B.K. Assessment of effects of global warming and climate change on the vulnerability of Indian Sundarban. In Sustainable Development: Dynamic Perspective; Anjan Publisher: Kolkata, India, 2018; pp. 63–74. [Google Scholar]
- Mondal, B.K. Climate change induced coastal hazards and community vulnerability in Indian Sundarban. In Applied Geomorphology and Contemporary Issues; Springer International Publishing: Cham, Switzerland, 2022; pp. 587–609. [Google Scholar]
- USGS (United States Geological Survey). Landsat Data Access; Department of Interior, United States Geological Survey: Washington, DC, USA, 2021. Available online: https://earthexplorer.usgs.gov/ (accessed on 26 December 2022).
- USGS (United States Geological Survey). Landsat Data Access; Department of Interior, United States Geological Survey: Washington, DC, USA, 2022. Available online: https://earthexplorer.usgs.gov/ (accessed on 26 December 2022).
- NRSC (National Remote Sensing Centre). Resourcesat-1/Resoursat-2: LISS-III; Government of India: New Delhi, India, 2009. Available online: https://bhuvan.nrsc.gov.in/home/index.php (accessed on 23 December 2022).
- NRSC (National Remote Sensing Centre). Resourcesat-1/Resoursat-2: AWiFS; Government of India: New Delhi, India, 2010. Available online: https://bhuvan.nrsc.gov.in/home/index.php (accessed on 22 December 2022).
- NRSC (National Remote Sensing Centre). Resourcesat-1/Resoursat-2: LISS-III; Government of India: New Delhi, India, 2016. Available online: https://bhuvan.nrsc.gov.in/home/index.php (accessed on 3 January 2023).
- NRSC (National Remote Sensing Centre). Resourcesat-1/Resoursat-2: LISS-III; Government of India: New Delhi, India, 2019. Available online: https://bhuvan.nrsc.gov.in/home/index.php (accessed on 26 December 2022).
- India Meteorological Department. Climatological Table; Ministry of Earth Sciences, Government of India: New Delhi, India, 2010.
- India Meteorological Department. Climatological Table; Ministry of Earth Sciences, Government of India: New Delhi, India, 2021.
- India Meteorological Department. Climatological Table; Ministry of Earth Sciences, Government of India: New Delhi, India, 2022.
- Global Modeling and Assimilation Office (GMAO). MERRA-2 Day and Month-wise Rainfall Data of Selected Coordinate Points in West Bengal, India; Goddard Earth Sciences Data and Information Services Center (GES DISC): Greenbelt, MD, USA, 2010.
- Global Modeling and Assimilation Office (GMAO). MERRA-2 Day and Month-Wise Rainfall Data of Selected Coordinate Points in West Bengal, India; Goddard Earth Sciences Data and Information Services Center (GES DISC): Greenbelt, MD, USA, 2021.
- Global Modeling and Assimilation Office (GMAO). MERRA-2 Day and Month-Wise Rainfall Data of Selected Coordinate Points in West Bengal, India; Goddard Earth Sciences Data and Information Services Center (GES DISC): Greenbelt, MD, USA, 2022.
- Rouse, J.W., Jr.; Haas, R.H.; Schell, J.A.; Deering, D.W. Monitoring Vegetation Systems in the Great Plains with ERTS. In Proceedings of the Third Earth Resources Technology Satellite-1 Symposium: Section AB, Technical presentations, Greenbelt, MY, USA, 10—14 December 1973; Scientific and Technical Information Office: Oak Ridge, TN, USA; National Aeronautics and Space Administration: Washington, DC, USA, 1974; Volume 1, Paper a 20; pp. 309–317. [Google Scholar]
- Xu, H. A study on information extraction of water body with the modified normalized difference water index (MNDWI). J. Remote Sens.-Beijing 2005, 9, 589–595. [Google Scholar]
- Gao, B.C. NDWI—A normalized difference water index for remote sensing of vegetation liquid water from space. Remote Sens. Environ. 1996, 58, 257–266. [Google Scholar] [CrossRef]
- Diek, S.; Fornallaz, F.; Schaepman, M.E.; De Jong, R. Barest pixel composite for agricultural areas using landsat time series. Remote Sens. 2017, 9, 1245. [Google Scholar] [CrossRef]
- Rikimaru, A.; Roy, P.S.; Miyatake, S. Tropical Forest cover density mapping. Trop. Ecol. 2002, 43, 39–47. [Google Scholar]
- Piyoosh, A.K.; Ghosh, S.K. Development of a modified bare soil and urban index for Landsat 8 satellite data. Geocarto Int. 2018, 33, 423–442. [Google Scholar] [CrossRef]
- Zha, Y.; Gao, J.; Ni, S. Use of normalized difference built-up index in automatically mapping urban areas from TM imagery. Int. J. Remote Sens. 2003, 24, 583–594. [Google Scholar] [CrossRef]
- Elhag, M.; Gitas, I.; Othman, A.; Bahrawi, J.; Gikas, P. Assessment of water quality parameters using temporal remote sensing spectral reflectance in arid environments, Saudi Arabia. Water 2019, 11, 556. [Google Scholar] [CrossRef]
- Lacaux, J.P.; Tourre, Y.M.; Vignolles, C.; Ndione, J.A.; Lafaye, M. Classification of ponds from high-spatial resolution remote sensing: Application to Rift Valley Fever epidemics in Senegal. Remote Sens. Environ. 2007, 106, 66–74. [Google Scholar] [CrossRef]
- Gupta, K.; Mukhopadhyay, A.; Giri, S.; Chanda, A.; Majumdar, S.D.; Samanta, S.; Mitra, D.; Samal, R.N.; Pattnaik, A.K.; Hazra, S. An index for discrimination of mangroves from non-mangroves using LANDSAT 8 OLI imagery. MethodsX 2018, 5, 1129–1139. [Google Scholar] [CrossRef] [PubMed]
- McFeeters, S.K. The use of the Normalized Difference Water Index (NDWI) in the delineation of open water features. Int. J. Remote Sens. 1996, 17, 1425–1432. [Google Scholar] [CrossRef]
- Winarso, G.; Purwanto, A.D. Evaluation of mangrove damage level based on Landsat 8 image. Int. J. Remote Sens. Earth Sci. 2014, 11, 105–116. [Google Scholar] [CrossRef]
- Boschetti, M.; Nutini, F.; Manfron, G.; Brivio, P.A.; Nelson, A. Comparative analysis of normalised difference spectral indices derived from MODIS for detecting surface water in flooded rice cropping systems. PLoS ONE 2014, 9, e88741. [Google Scholar] [CrossRef] [PubMed]
- Wan, K.M.; Billa, L. Post-flood land use damage estimation using improved Normalized Difference Flood Index (NDFI3) on Landsat 8 datasets: December 2014 floods, Kelantan, Malaysia. Arab. J. Geosci. 2018, 11, 434. [Google Scholar] [CrossRef]
- Ali, S.A.; Khatun, R.; Ahmad, A.; Ahmad, S.N. Application of GIS-based analytic hierarchy process and frequency ratio model to flood vulnerable mapping and risk area estimation at Sundarban region, India. Model. Earth Syst. Environ. 2019, 5, 1083–1102. [Google Scholar] [CrossRef]
- Bera, R.; Maiti, R. Multi hazards risk assessment of Indian Sundarbans using GIS based Analytic Hierarchy Process (AHP). Reg. Stud. Mar. Sci. 2021, 44, 101766. [Google Scholar] [CrossRef]
- Arif, M.S.; Mahdi, I.; Rafi, M.A.; Khan, S.J.; Rahman, M.M. Cyclone exposure mapping in coastal Bangladesh: A multi-criteria decision analysis. Heliyon 2023, 9, e21259. [Google Scholar] [CrossRef] [PubMed]
- Ghosh, A.; Chatterjee, U.; Pal, S.C.; Towfiqul Islam, A.R.; Alam, E.; Islam, M.K. Flood hazard mapping using GIS-based statistical model in vulnerable riparian regions of sub-tropical environment. Geocarto Int. 2023, 38, 2285355. [Google Scholar] [CrossRef]
- Kaya, C.M.; Derin, L. Parameters and methods used in flood susceptibility mapping: A review. J. Water Clim. Chang. 2023, 14, 1935–1960. [Google Scholar] [CrossRef]
- Mohanty, S.; Mustak, S.; Singh, D.; Van Hoang, T.; Mondal, M.; Wang, C.T. Vulnerability and risk assessment mapping of Bhitarkanika national park, Odisha, India using machine-based embedded decision support system. Front. Environ. Sci. 2023, 11, 1176547. [Google Scholar] [CrossRef]
- Saaty, R.W. The analytic hierarchy process—What it is and how it is used. Math. Model. 1987, 9, 161–176. [Google Scholar] [CrossRef]
- Bozdağ, A.; Yavuz, F.; Günay, A.S. AHP and GIS based land suitability analysis for Cihanbeyli (Turkey) County. Environ. Earth Sci. 2016, 75, 813. [Google Scholar] [CrossRef]
- Saaty, T.L. A scaling method for priorities in hierarchical structures. J. Math. Psychol. 1977, 15, 234–281. [Google Scholar] [CrossRef]
- Saaty, T.L. The Analytic Hierarchy Process; Mcgraw Hill: New York, NY, USA, 1980. [Google Scholar]
- Abu Dabous, S.; Alkass, S. Decision support method for multi-criteria selection of bridge rehabilitation strategy. Constr. Manag. Econ. 2008, 26, 883–893. [Google Scholar] [CrossRef]
- Bhushan, N.; Rai, K. The analytic hierarchy process. In Strategic Decision Making: Applying the Analytic Hierarchy Process; Springer: London, UK, 2004; pp. 11–21. [Google Scholar]
- Shankar, S.V.; Dharanirajan, K.; Narshimulu, G. Cyclone vulnerability zonation of southern part of South Andaman, India using Multi-criteria weighted overlay analysis techniques. Indian J. Geo-Mar. Sci. 2015, 44, 1181–1190. [Google Scholar]
- Nikolova, V.; Zlateva, P. Assessment of flood vulnerability using fuzzy logic and geographical information systems. In Information Technology in Disaster Risk Reduction: First IFIP TC 5 DCITDRR International Conference, ITDRR 2016, Sofia, Bulgaria, 16–18 November 2016; Revised Selected Papers 1; Springer International Publishing: Berlin/Heidelberg, Germany, 2017; pp. 254–265. [Google Scholar]
- Batbold, B.; Bolorchuluun, C. Flood Risk Mapping Using GIS-Based Multi-Criteria Analysis: Songinokhairkhan District Case Study. In Proceedings of the Climate Risks and Space Weather, Glasgow, Scotland, 14–17 June 2021; Irkutsk State University: Irkutsk, Russia, 2021; pp. 67–76. [Google Scholar]
- Hossain, M.Z.; Adhikary, S.K. Flood Susceptibility Assessment in Southwest Coastal Region of Bangladesh Using an AHP-GIS Based Approach. In Proceedings of the 6th International Conference on Advances in Civil Engineering (ICACE-2022), CUET, Chattogram, Bangladesh, 21–23 December 2022; 2024; pp. 1129–1136. Available online: www.cuet.ac.bd/icace (accessed on 12 January 2024).
- Santosa, B.H.; Martono, D.N.; Purwanaa, R.; Koestoera, R.H. Flood Vulnerability Evaluation and Prediction Using Multi-temporal Data: A Case in Tangerang, Indonesia. Int. J. Adv. Sci. Eng. Inf. Technol. 2022, 12, 2156–2164. [Google Scholar] [CrossRef]
- AlAli, A.M.; Salih, A.; Hassaballa, A. Geospatial-Based Analytical Hierarchy Process (AHP) and Weighted Product Model (WPM) Techniques for Mapping and Assessing Flood Susceptibility in the Wadi Hanifah Drainage Basin, Riyadh Region, Saudi Arabia. Water 2023, 15, 1943. [Google Scholar] [CrossRef]
- Wijesinghe, W.M.; Mishra, P.K.; Tripathi, S.; Abdelrahman, K.; Tiwari, A.; Fnais, M.S. Integrated Flood Hazard Vulnerability Modeling of Neluwa (Sri Lanka) Using Analytical Hierarchy Process and Geospatial Techniques. Water 2023, 15, 1212. [Google Scholar] [CrossRef]
- Durbin, J.; Watson, G.S. Testing For Serial Correlation in Least Squares Regression. III. Biometrika 1971, 58, 1–19. [Google Scholar] [CrossRef]
- Fisher, R.A. Statistical Methods for Research Workers. In Nature, 6th ed.; Oliver and Boyd: London, UK, 1936; p. xiv+339. [Google Scholar]
- Uyanik, G.; Guler, N. A study on multiple linear regression. Procedia Soc. Behav. Sci. 2013, 106, 234–240. [Google Scholar] [CrossRef]
- Chai, T.; Draxler, R.R. Root mean square error (RMSE) or mean absolute error (MAE)?–Arguments against avoiding RMSE in the literature. Geosci. Model Dev. 2014, 7, 1247–1250. [Google Scholar] [CrossRef]
- Welch, B.L. The generalization of ‘student’s’ problem when several different population variances are involved. Biometrika 1947, 34, 28–35. [Google Scholar] [CrossRef] [PubMed]
- Kanani-Sadat, Y.; Arabsheibani, R.; Karimipour, F.; Nasseri, M. A new approach to flood susceptibility assessment in data-scarce and ungauged regions based on GIS-based hybrid multi criteria decision-making method. J. Hydrol. 2019, 572, 17–31. [Google Scholar] [CrossRef]
- Roopnarine, C.; Ramlal, B.; Roopnarine, R. A Comparative Analysis of Weighting Methods in Geospatial Flood Risk Assessment: A Trinidad Case Study. Land 2022, 11, 1649. [Google Scholar] [CrossRef]
- India Meteorological Department. Cyclonic Disturbances over North Indian Ocean during 2009: A Report; Cyclone Warning Division: New Delhi, India, 2010. [Google Scholar]
- India Meteorological Department. Cyclonic Storm, KOMEN over the Bay of Bengal (26 July–02 August, 2015): A Report; Earth System Science Organisation, Ministry of Earth Sciences, Government of India: New Delhi, India, 2015.
- India Meteorological Department. Extremely Severe Cyclonic Storm “FANI” over Eastcentral Equatorial Indian Ocean and Adjoining Southeast Bay of Bengal; Regional Specialised Meteorological Centre-Tropical Cyclones: New Delhi, India, 2019. [Google Scholar]
- India Meteorological Department. Bulletin No.: 26 (Bay of Bengal 01/2020) Cyclone Warning Division; Earth System Science Organisation (Ministry of Earth Sciences), Government of India: New Delhi, India, 2020.
- India Meteorological Department. Bulletin No.: 20 (BOB/02/2021); Ministry of Earth Sciences, Government of India: New Delhi, India, 2021.
- Pearson, K. Mathematical contributions to the theory of evolution—On a form of spurious correlation which may arise when indices are used in the measurement of organs. Proc. R. Soc. Lond. 1897, 60, 489–498. [Google Scholar]
- Pearson, K. On certain errors with regard to multiple correlation occasionally made by those who have not adequately studied this subject. Biometrika 1914, 10, 181–187. [Google Scholar]
- Datta, D.; Deb, S. Analysis of coastal land use/land cover changes in the Indian Sunderbans using remotely sensed data. Geo-Spat. Inf. Sci. 2012, 15, 241–250. [Google Scholar] [CrossRef]
- Hossain, K.A.; Masiero, M.; Pirotti, F. Land cover change across 45 years in the world’s largest mangrove forest (Sundarbans): The contribution of remote sensing in forest monitoring. Eur. J. Remote Sens. 2022, 12, 1–7. [Google Scholar] [CrossRef]
- Bera, M.K. Collective efforts of people to reduce disasters in the Indian Sundarban islands. Disaster Prev. Manag. 2019, 28, 691–705. [Google Scholar] [CrossRef]
- Mondal, M.; Biswas, A.; Haldar, S.; Mandal, S.; Mandal, P.; Bhattacharya, S.; Paul, S. Climate change, multi-hazards and society: An empirical study on the coastal community of Indian Sundarban. Nat. Hazards Res. 2022, 2, 84–96. [Google Scholar] [CrossRef]
- Sudha Rani, N.N.; Satyanarayana, A.N.; Bhaskaran, P.K. Coastal vulnerability assessment studies over India: A review. Nat. Hazards 2015, 77, 405–428. [Google Scholar] [CrossRef]


| Serial. Number. | Data | Year | Spatial, and Temporal Resolution | Data Sources | Purpose of Data Usage | Website |
|---|---|---|---|---|---|---|
| Category 1: Remote Sensing datasets | ||||||
| 1 | Landsat 8 OLI/TIRS C2 L1 | 2021 (Date Acquired: 21 December 2021; File Date: 29 December 2021); 2022 (Date Acquired: 22 November 2022; Date Product Generated: 29 November 2022 | Spatial resolution: 30 m (visible, NIR, SWIR); 100 m (thermal); and 15 m (panchromatic. Temporal resolution: 16 days | [33,34] | To determine the spectral indices | https://earthexplorer.usgs.gov/ (accessed on 26 December 2022) |
| 2 | Resourcesat-1/Resourcesat-2: LISS-III (2009, 2016, and 2019) and AWiFS (2010) | Date of Pass: 23 November 2009; 26 December 2010; 20 April 2016; 4 February 2019 | Spatial resolution: LISS-III: 24 m; AWiFS: 56 m. Temporal resolution: 5 days | [35,36,37,38] | To determine the spectral indices | https://bhuvan-app3.nrsc.gov.in/data/download/index.php (accessed on 22, 23, and 26 December 2022; and 3 January 2023) |
| Category 2: Rainfall data | ||||||
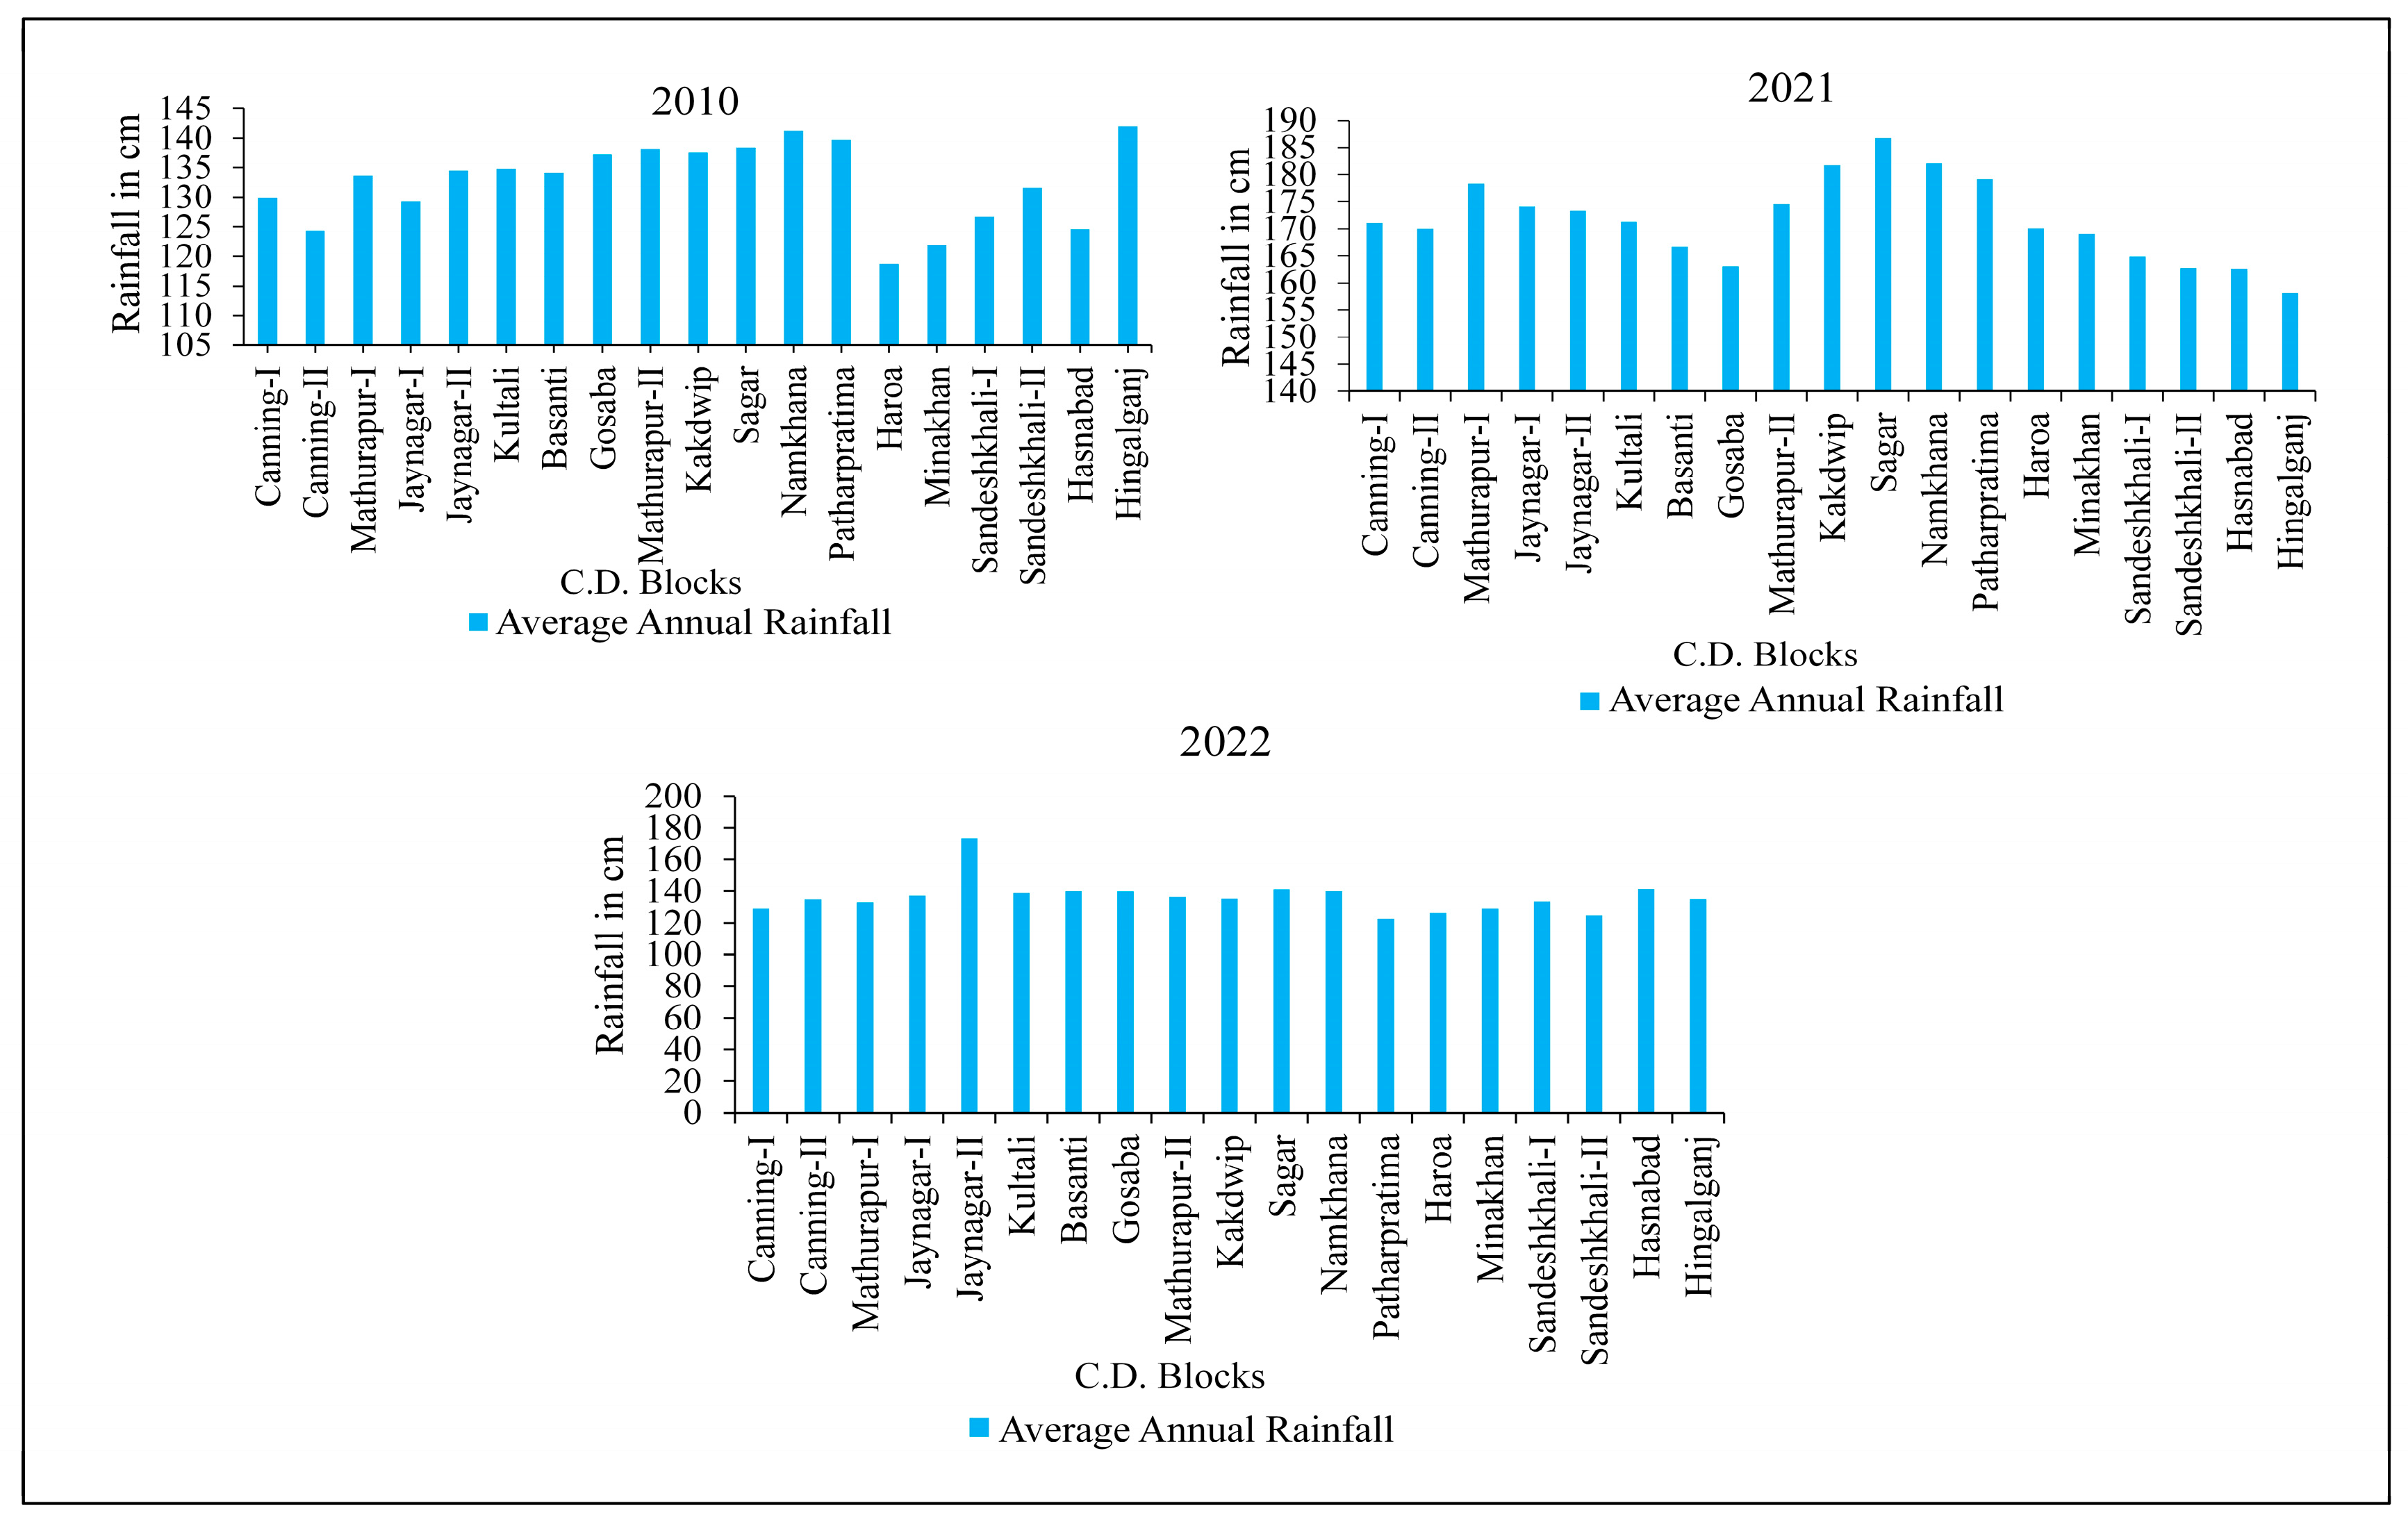
| 3 | Rainfall (cm) | 2010, 2021, 2022 (January to December) | [39,40,41,42,43,44] | To calculate the average annual rainfall | https://mausam.imd.gov.in/ Website of Solar Radiation Data (SODA): Modern-Era Retrospective Analysis for Research and Applications (MERRA) Project collaboration with NASA (https://gmao.gsfc.nasa.gov/reanalysis/MERRA-2/) (Accessed on 23 December 2022, and 6 February 2023) | |
| Sl. No. | Variables (Indices) | Measurement | Source(s) | Purpose of Selection |
|---|---|---|---|---|
| 1 | Normalized Difference Vegetation Index (NDVI) | NDVI = | [45] | The spectral index is used for measuring surface vegetation conditions. |
| 2 | Modified Normalized Difference Water Index (MNDWI) | MNDWI = | [46] | The spectral index is used for measuring surface vegetation conditions. The spectral index for measuring the enhanced surface water condition. |
| 3 | Normalized Difference Moisture Index (NDMI) | NDMI = (NIR − SWIR)/(NIR + SWIR) | [47] | The spectral index is used to determine vegetation water content. |
| 4 | Bare Soil Index (BSI) * | BSI = ((Red + SWIR) − (NIR + Blue))/((Red + SWIR) + (NIR + Blue)) | [48,49,50] | The spectral index indicates soil bareness. |
| 5 | Normalized Difference Built-up Index (NDBI) | NDBI = | [51] | The spectral index for determining habitation (built-up areas) condition. |
| 6 | Normalized Difference Turbidity Index (NDTI) | NDTI = | [52,53] | The spectral index is used to estimate the turbidity in water bodies. |
| Variables | 2010 | 2021 | 2022 | |||
|---|---|---|---|---|---|---|
| Mean | Std. Deviation | Mean | Std. Deviation | Mean | Std. Deviation | |
| NDVI | 0.2288 | 0.11714 | 0.1006 | 0.06134 | 0.1865 | 0.08951 |
| MNDWI | −0.2030 | 0.12920 | 0.0403 | 0.06208 | −0.0745 | 0.07501 |
| NDMI | −0.0688 | 0.16263 | 0.1114 | 0.06887 | 0.1014 | 0.05465 |
| NDBI | 0.0688 | 0.16263 | −0.1112 | 0.06896 | −0.1014 | 0.05465 |
| BSI | 0.0058 | 0.11480 | −0.0953 | 0.04032 | −0.0407 | 0.03938 |
| NDTI | −0.0958 | 0.03548 | −0.0294 | 0.00999 | −0.0132 | 0.01450 |
| NDFI | −0.2925 | 0.11391 | 0.0898 | 0.07128 | −0.0572 | 0.05385 |
| Valid N (listwise): 19 | ||||||
| Serial Number | Categories | Priority | Rank | (+) | (−) | |||||||
|---|---|---|---|---|---|---|---|---|---|---|---|---|
| 1 | NDVI | 45.70% | 1 | 10.70% | 10.70% | |||||||
| 2 | MNDWI | 18.80% | 3 | 5.70% | 5.70% | |||||||
| 3 | NDMI | 20.70% | 2 | 6.50% | 6.50% | |||||||
| 4 | NDBI | 6.90% | 4 | 1.80% | 1.80% | |||||||
| 5 | BSI | 4.30% | 5 | 1.50% | 1.50% | |||||||
| 6 | NDTI | 3.60% | 6 | 0.90% | 0.90% | |||||||
| Number of Comparisons = 15 | ||||||||||||
| Consistency Ratio (CR) = 3.3% | ||||||||||||
| Random Index (RI) | ||||||||||||
| n | 1 | 2 | 3 | 4 | 5 | 6 | 7 | 8 | 9 | 10 | 11 | 12 |
| RI | 0 | 0 | 0.52 | 0.89 | 1.11 | 1.25 | 1.35 | 1.4 | 1.45 | 1.49 | 1.51 | 1.54 |
| Decision matrix | ||||||
|---|---|---|---|---|---|---|
| 1 | 2 | 3 | 4 | 5 | 6 | |
| 1 | 1 | 3.00 | 3.00 | 7.00 | 9.00 | 9.00 |
| 2 | 0.33 | 1 | 1.00 | 2.00 | 7.00 | 5.00 |
| 3 | 0.33 | 1.00 | 1 | 5.00 | 5.00 | 5.00 |
| 4 | 0.14 | 0.50 | 0.20 | 1 | 2.00 | 2.00 |
| 5 | 0.11 | 0.14 | 0.20 | 0.50 | 1 | 2.00 |
| 6 | 0.11 | 0.20 | 0.20 | 0.50 | 0.50 | 1 |
| 2010 | NDFI | NDVI | MNDWI | NDMI | NDBI | BSI | NDTI | |
|---|---|---|---|---|---|---|---|---|
| Pearson Correlation [90,91] | NDFI | 1.000 | −0.175 | 0.963 | 0.641 | −0.641 | −0.643 | −0.155 |
| * Sig. (1-tailed) | . | 0.237 | 0.000 * | 0.002 * | 0.002 * | 0.001 * | 0.264 | |
| 2021 | 1.000 | −0.300 | 0.911 | 0.665 | −0.663 | −0.651 | −0.625 | |
| Pearson Correlation | NDFI | |||||||
| Sig. (1-tailed) * | . | 0.106 | 0.000 * | 0.001 * | 0.001 * | 0.001 * | 0.002 * | |
| 2022 | 1.000 | −0.448 | 0.923 | 0.364 | −0.364 | −0.302 | −0.621 | |
| Pearson Correlation | NDFI | |||||||
| Sig. (1-tailed) * | . | 0.027 * | 0.000 * | 0.063 | 0.063 * | 0.104 | 0.002 * | |
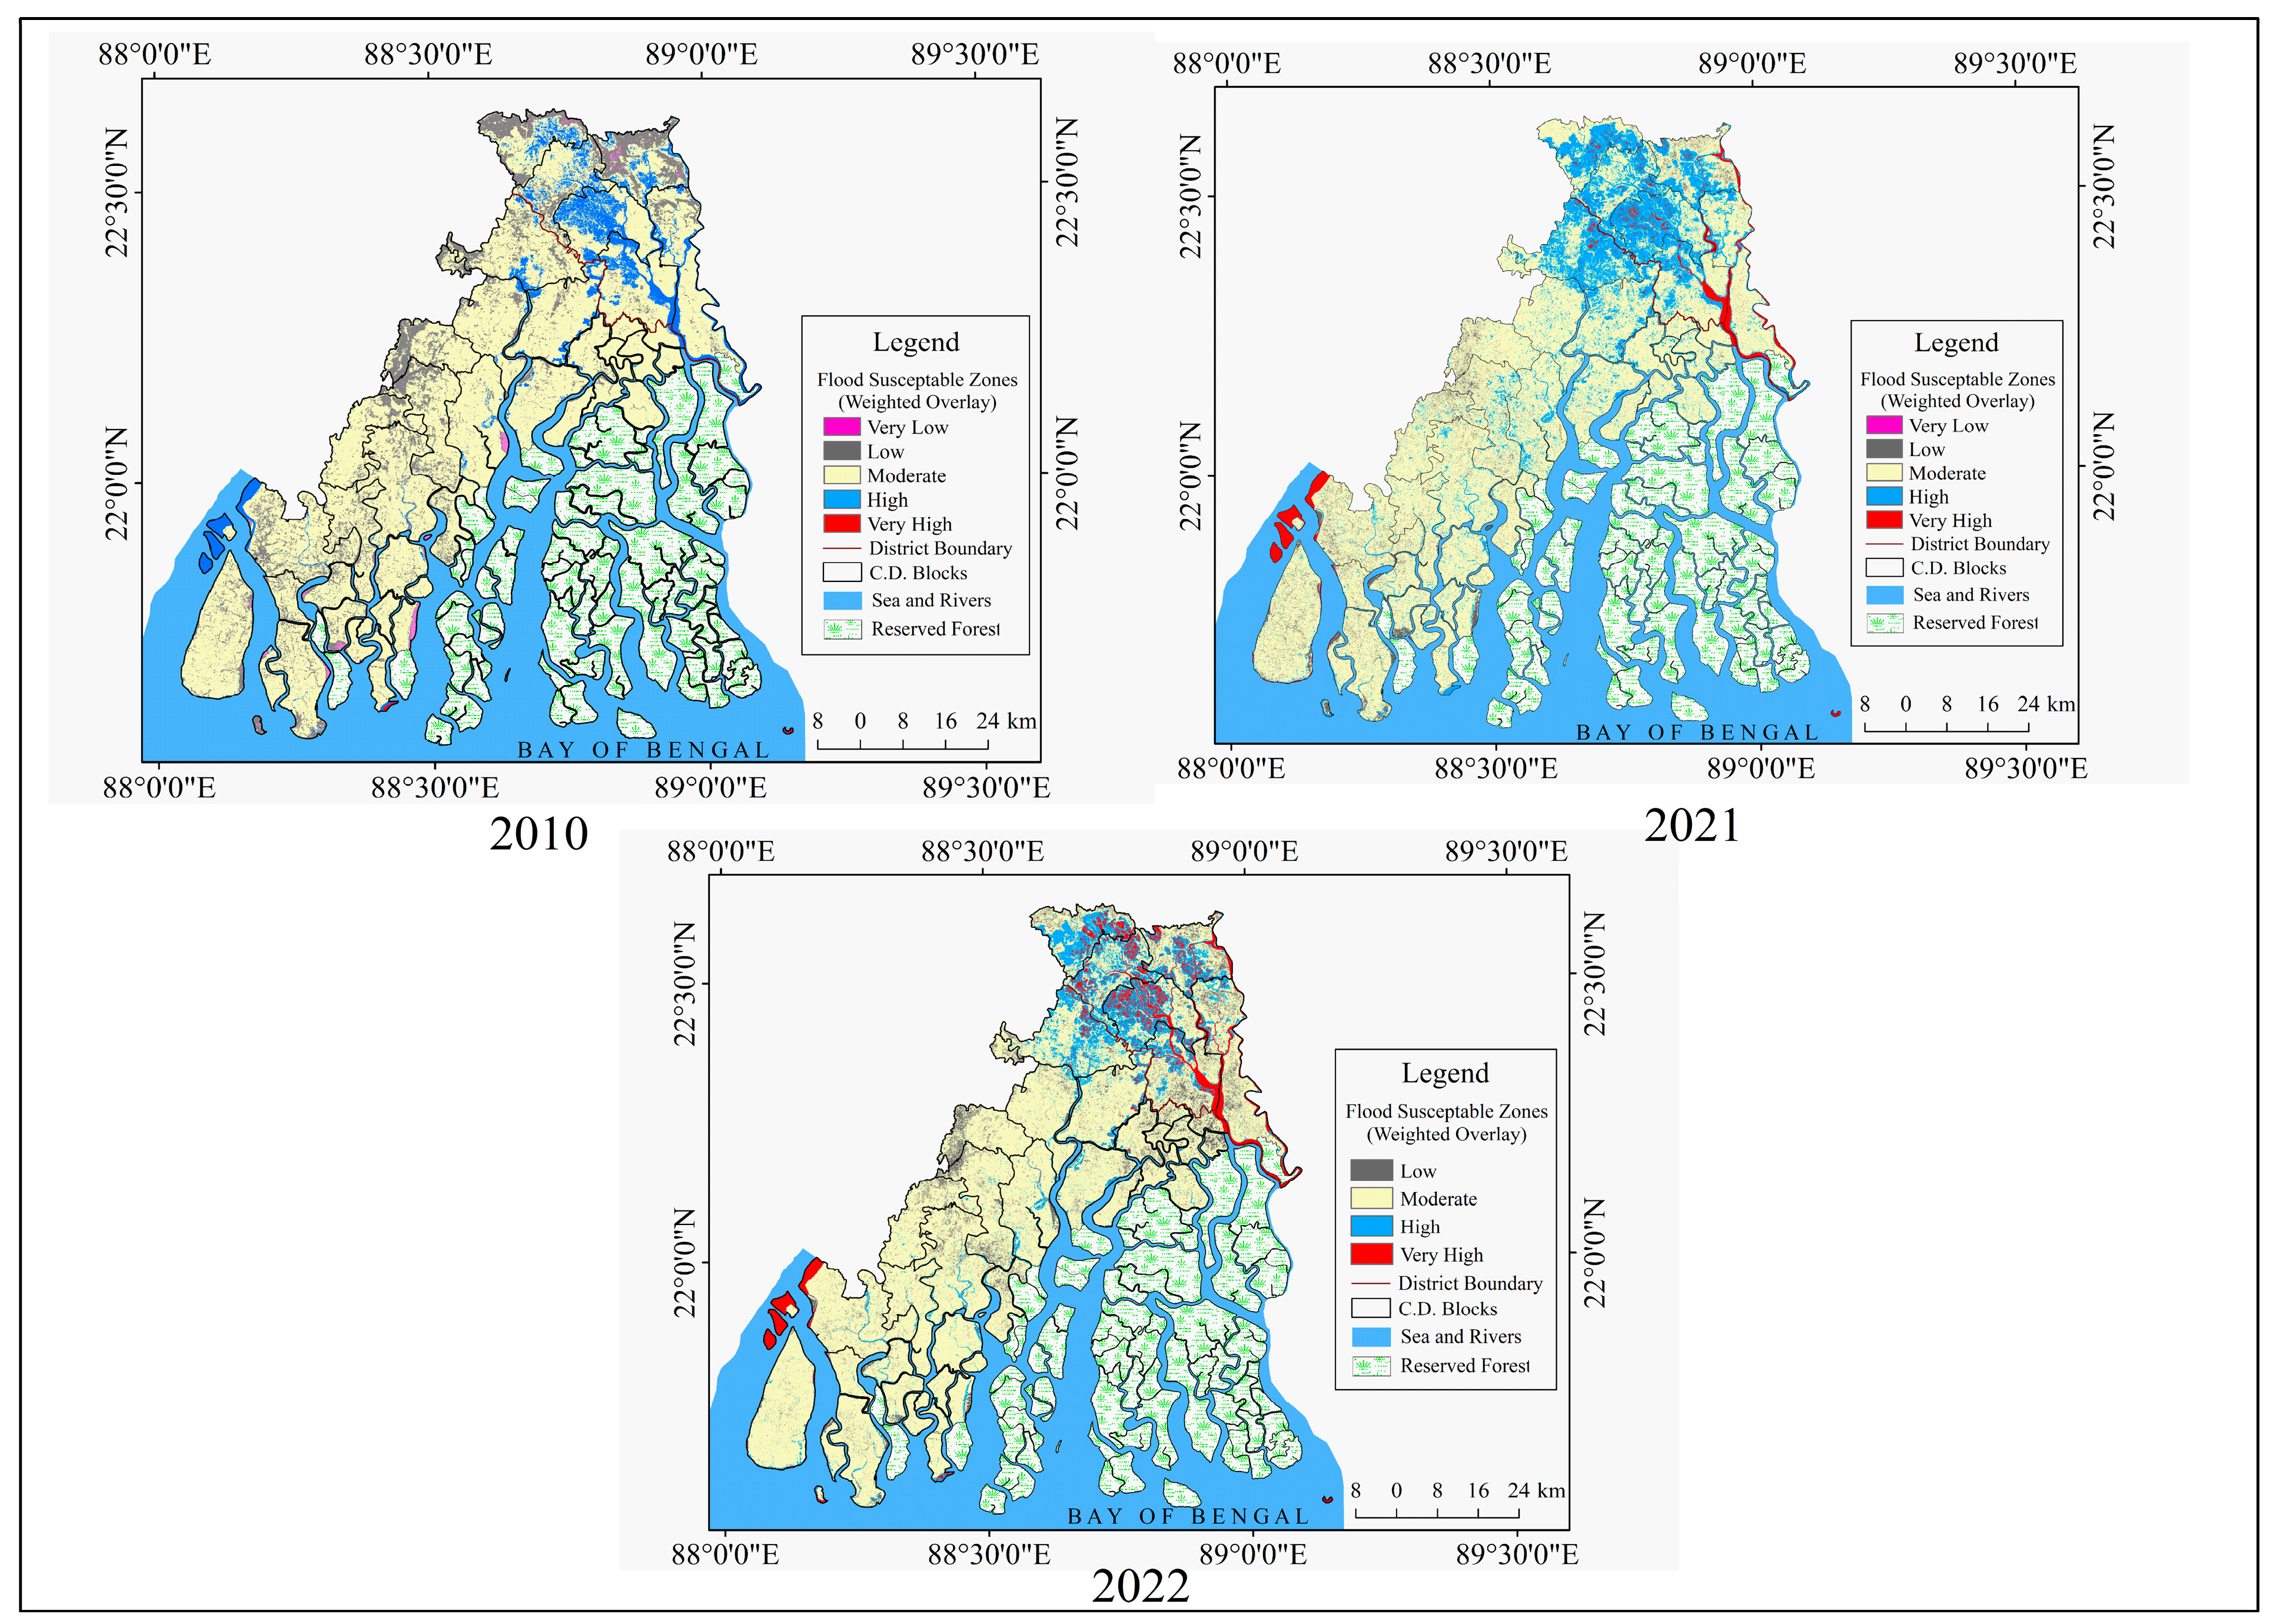
| Year | Weighted Overlay Classes | Categories | Area (%) | ZPR Classes | Categories |
|---|---|---|---|---|---|
| 2010 | 3 | Very Low | 19.84 | <−0.780 | Very Low |
| 4 | Low | 22.12 | −0.780–−0.101 | Low | |
| 5 | Moderate | 52.00 | −0.100–0.579 | Moderate | |
| 6 | High | 5.99 | 0.580–1.260 | High | |
| 7 | Very High | 0.05 | >1.260 | Very High | |
| 2021 | 3 | Very Low | 0.00103 | <−0.983 | Very Low |
| 4 | Low | 12.70 | −0.983–−0.220 | Low | |
| 5 | Moderate | 71.72 | −0.219–0.545 | Moderate | |
| 6 | High | 13.44 | 0.546–1.310 | High | |
| 7 | Very High | 2.13 | >1.310 | Very High | |
| 2022 | 4 | Low | 9.51 | <−0.153 | Low |
| 5 | Moderate | 76.59 | −0.153–0.826 | Moderate | |
| 6 | High | 9.25 | 0.827–1.80 | High | |
| 7 | Very High | 4.65 | >1.80 | Very High |
| Two-Sample t Test with Unequal Variances (Unpaired Unequal Welch’s Test) | ||||||
|---|---|---|---|---|---|---|
| Variables | Obs 1 | Mean | Std. Err. 2 | Std. Dev. 3 | [95% Conf. | Interval] 4 |
| NDFI | 19 | −0.0563158 | 0.0121927 | 0.0531466 | −0.0819316 | −0.0306999 |
| IM | 19 | −0.3142728 | 0.0334002 | 0.1455879 | −0.3844439 | −0.2441017 |
| combined | 38 | −0.1852943 | 0.0275159 | 0.1696192 | −0.2410467 | −0.1295419 |
| diff | 0.257957 | 0.035556 | 0.1844453 | 0.3314687 | ||
| diff 5 = mean (NDFI)-mean (IM) t = 7.2549 H0: diff = 0 Welch’s degrees of freedom = 23.2374 | ||||||
| Ha: diff < 0 Pr(T < t) = 1.0000 | Ha: diff! = 0 Pr(|T| > |t|) = 0.0000 | Ha: diff > 0 Pr(T > t) = 0.0000 | ||||
Disclaimer/Publisher’s Note: The statements, opinions and data contained in all publications are solely those of the individual author(s) and contributor(s) and not of MDPI and/or the editor(s). MDPI and/or the editor(s) disclaim responsibility for any injury to people or property resulting from any ideas, methods, instructions or products referred to in the content. |
© 2024 by the authors. Licensee MDPI, Basel, Switzerland. This article is an open access article distributed under the terms and conditions of the Creative Commons Attribution (CC BY) license (https://creativecommons.org/licenses/by/4.0/).
Share and Cite
Mondal, B.K.; Mahata, S.; Basu, T.; Das, R.; Patra, R.; Abdelrahman, K.; Fnais, M.S.; Praharaj, S. Analysis of the Post-Cyclonic Physical Flood Susceptibility and Changes of Mangrove Forest Area Using Multi-Criteria Decision-Making Process and Geospatial Analysis in Indian Sundarbans. Atmosphere 2024, 15, 432. https://doi.org/10.3390/atmos15040432
Mondal BK, Mahata S, Basu T, Das R, Patra R, Abdelrahman K, Fnais MS, Praharaj S. Analysis of the Post-Cyclonic Physical Flood Susceptibility and Changes of Mangrove Forest Area Using Multi-Criteria Decision-Making Process and Geospatial Analysis in Indian Sundarbans. Atmosphere. 2024; 15(4):432. https://doi.org/10.3390/atmos15040432
Chicago/Turabian StyleMondal, Biraj Kanti, Sanjib Mahata, Tanmoy Basu, Rima Das, Rajib Patra, Kamal Abdelrahman, Mohammed S. Fnais, and Sarbeswar Praharaj. 2024. "Analysis of the Post-Cyclonic Physical Flood Susceptibility and Changes of Mangrove Forest Area Using Multi-Criteria Decision-Making Process and Geospatial Analysis in Indian Sundarbans" Atmosphere 15, no. 4: 432. https://doi.org/10.3390/atmos15040432