Article

Meteorological Characteristics of a Continuous Ice-Covered Event on Ultra-High Voltage Transmission Lines in Yunnan Region in 2021

1
China Southern Power Grid Co., Ltd. Ultra High Voltage Transmission Company, Electric Power Research Institute, Guangzhou 510663, China
2
Collaborative Innovation Centre on Forecast and Evaluation of Meteorological Disasters, Key Laboratory for Aerosol-Cloud-Precipitation of China Meteorological Administration, School of Atmospheric Physics, Nanjing University of Information Science and Technology, Nanjing 210044, China
*
Authors to whom correspondence should be addressed.
Atmosphere 2024, 15(4), 389; https://doi.org/10.3390/atmos15040389
Submission received: 27 January 2024 / Revised: 15 March 2024 / Accepted: 16 March 2024 / Published: 22 March 2024
(This article belongs to the Section Meteorology)

Abstract

:
Yunnan plays a pivotal role in transmitting electricity from west to east within China’s Southern Power Grid. During 7–13 January 2021, a large-scale continuous ice-covering event of ultra-high voltage (UHV) transmission lines occurred in the Qujing area of eastern Yunnan Province. Based on ERA5 reanalysis data and meteorological observation data of UHV transmission line icing in China’s Southern Power Grid, the synoptic causes of the icing are comprehensively analyzed from various perspectives, including weather situations, vertical stratification of temperature and humidity, local meteorological elements, and atmospheric circulation indices. The results indicate a strong East Asian trough and a blocking high directing northern airflow southward ahead of the ridge. Cold air enters the Qujing area and combines with warm and moist air from the subtropical high pressure of 50–110° E. As warm and cold air masses form a quasi-stationary front over the northern mountainous area of Qujing due to topographic uplift, the mechanism of “supercooling and warm rain” caused by the “warm–cold” temperature profile structure leads to freezing rain events. Large-scale circulation indices in the Siberian High, East Asian Trough, and 50–110° E Subtropical High regions provided clear precursor signals within 0–2 days before the icing events.

1. Introduction

Carbon emissions from the agriculture, livestock, and industrial sectors are among the factors contributing to extreme weather events [1,2,3,4]. In particular, the main meteorological disasters (road icing, ice on power lines, crop frost damage, etc.) in winter in southern China are caused by the persistent freezing rain and snow during the cold wave (After the cold air passes through a certain place, if the temperature drops by 8 °C within 24 h or 10 °C within 48 h and the daily minimum temperature is below 4 °C, the situation is called a cold wave process in China.) [5]. Electricity is the driving force behind the rapid and healthy development of the national economy. Overhead line icing refers to the weather phenomenon where freezing rain, freezing fog, or wet snow freezes on the power lines. The main environmental factors contributing to this phenomenon include quasi-stationary fronts, atmospheric vertical structures, and inversion layers. It is also influenced by terrain, altitude, and the power lines. Overall, the distribution of icing disasters on power lines shows a pattern of more rime in the north and more silver thaw in the south [6]. Overhead line icing has always been one of the most serious meteorological disasters for ultra-high voltage (UHV) power transmission lines in southern China, posing a direct threat to the operation and maintenance of these power lines.
China experiences frequent incidents of wire icing, particularly during the winter months. In January and early February 2008, southern China confronted an unprecedented period marked by extremely low temperatures, freezing rain, and extensive snowfall. Continuous freezing rain and freezing fog led to long-lasting and extensive wire icing in the southern power grid, with maximum ice thickness exceeding 100 mm [7]. It caused significant disasters in 20 provinces (districts), such as Hunan, Guizhou, Guangxi, and Hubei, affecting over 100 million people and resulting in direct economic losses of over 150 billion RMB [8]. During the freezing rain and snow event in southern China, a total of 506 transmission towers for the 500 kV transmission lines collapsed, and transmission tower structures at various levels of the power grid suffered severe damage [9]. Extreme freezing rain and snow weather events can bring about significant harm, and it is of great importance to analyze the causes of the icing events.
Currently, many researchers have conducted extensive studies on the freezing rain and snow in southern China, focusing on various aspects, such as atmospheric circulation, local meteorological elements, thermodynamic structure, and moisture transport [5,10]. For example, previous research has analyzed the causes of the low-temperature freezing rain and snow weather events at the end of December 2020 and the beginning of January 2021 by examining atmospheric circulation anomalies. Both cold wave weather events occurred under the influence of the “two troughs and one ridge” circulation pattern. During these cold wave processes, there was a transition from a west–east trough to a north–south trough, which rapidly transported cold air southward. Furthermore, the continuous southward displacement of polar vortices and the presence of a blocking high-pressure system near the Ural Mountains played a crucial role in facilitating the deep southward movement of the cold air [11]. Additionally, Wen et al. [12] emphasized the climatic background and summarized the meteorological and climatic characteristics, meteorological element conditions, and the relationship between geographical environmental factors and wire icing in Guizhou from 2008 to 2011. They found that Guizhou’s wire icing is closely related to anomalies in mid-high latitude atmospheric circulation, the northward shift of the western Pacific subtropical high, and the influence of the lower tropospheric inversion layer.
Furthermore, regarding moisture transport, the freezing rain and snow weather event in Guizhou in 2008 was influenced by an Ω-shaped blocking pattern in the mid-high latitude westerlies. The subtropical high-pressure system was positioned to the northwest, allowing cold air to move southward. A quasi-stationary front was maintained in Guizhou for an extended period, facilitating the northward transport of water vapor by the southern airflow [13]. In Yunnan, during the wire icing in January and February 2008, the quasi-stationary front near Kunming was the most significant influencing weather system [14]. Additionally, some researchers used micro-meteorological factors as input data and icing mass as output, constructing analytical models and non-analytical models from polynomial regression, time series analysis (including stationary and non-stationary analysis), and machine learning perspectives [15,16,17,18,19]. However, these new artificial intelligence-based input factors are closely linked to the previous exploration of the physical mechanisms affecting icing. There are two main mechanisms for freezing rain development: the “melting” process and the “supercooled warm rain” process [20]. Based on the statistical analysis of 572 freezing rain events in sounding stations from 2008 to 2017, Lu et al. [21] found that the “melting” process was mostly responsible for the freezing rain formation at low-altitude stations (<500 m) and middle-altitude stations (500–1500 m), while the “supercooled warm rain” process was the main mechanism for high-altitude stations (>1500 m).
From 7 January to 13 January 2021, a cold wave collided with warm airflows from the southwest, causing widespread wire icing in eastern Yunnan and central-northern and western regions of Guizhou. Multiple UHV transmission lines, notably in Qujing city of Yunnan Province, experienced significant icing, adversely affecting power transmission and communication, highlighting the need for specialized anti-icing measures in this region with unique characteristics and considerable temperature discrepancies.
Wang et al. [5] conducted a study in 2015 on the causes of ice accumulation in the Guilin Plain area of Guangxi, China, involving analysis of weather conditions, surface meteorological elements, upper temperature, and humidity profiles and quantitative analysis of the atmospheric circulation index. However, there is a lack of quantitative analysis of the atmospheric circulation index in plateau areas, and the reasons for the difference in ice accumulation on power lines between the plain and the plateau remain unclear. Therefore, this study uses the 2021 icing event in the Qujing Plateau area of Yunnan as a case study to systematically explore the causes of ice accumulation on UHV transmission lines in plateau regions.
Through analysis of weather conditions, surface meteorological elements, and upper temperature and humidity profiles and quantitative analysis of the atmospheric circulation index in the Qujing Plateau area of Yunnan Province in 2021, this study aims to systematically investigate the causes of ice accumulation on UHV transmission lines in plateau regions. The objective is to compare the differences in ice accumulation causes between the Guilin Plain area of Guangxi in 2015 and the Qujing Plateau area of Yunnan in 2021 to identify unified principles for future ice accumulation prediction in different altitude areas and the differences requiring additional attention. This study establishes the groundwork for the broader application of ice cover forecasting methods, ultimately enhancing forecast accuracy. Additionally, it offers the power industry valuable scientific insights to proactively manage ice accumulation on power lines, ensuring public safety and minimizing losses.

2. Materials and Methods

This study focuses on typical transmission line towers, denoted as A–H (specific tower names are replaced with A–H to protect power security information), located in the mountainous areas of Fuyuan, Zhanyi, and Huize in eastern Qujing, Yunnan Province. These towers have experienced severe and rapid icing over the years. Their geographical coordinates range from approximately 103.33° E to 104.34° E and 25.74° N to 26.01° N. From 7 to 13 January 2021, due to the influence of a southern trough and cold air, Qujing experienced a significant temperature drop. It resulted in a continuous icing event on the UHV transmission lines in the mountainous areas of Fuyuan, Zhanyi, and Huize. The region with severe ice covering is mainly concentrated along the Kunliulong Line, with the probability distribution of the maximum ice thickness shown in Figure 1.
The temperature and ice thickness data used in this study were obtained from the UHV transmission line icing observation system. The temporal resolution is 10 min (due to confidentiality agreements, the data acquisition address cannot be disclosed here). Additionally, data from the fifth generation of the European Centre for Medium-Range Weather Forecasts (ECMWF) atmospheric reanalysis of the global climate (ERA5) for the period from 5 January to 14 January 2021 were used to analyze the precipitation conditions in the tower area, the weather situation during the icing process, and the temperature–humidity vertical structure. In this study, we mainly used the pressure-level datasets, including geopotential, relative humidity, specific humidity, temperature, u component of wind, v component of wind, and vertical velocity. Additionally, we utilized a single-level dataset containing mean sea level pressure. The pressure-level datasets are from 1000 hPa to 400 hPa, with 18 layers. These datasets cover the range of 40–160° E and 10–70° N, with a spatial resolution of 0.25° × 0.25° and a temporal resolution of 1 h (https://www.ecmwf.int/en/forecasts/dataset/ecmwf-reanalysis-v5, accessed on 27 January 2024).
To identify large-scale circulation precursor signals for UHV transmission line icing, this study also calculated six atmospheric circulation indices (Figure 2), including the Siberian high intensity index (Siberian High Pressure System), East Asian trough intensity index, subtropical high ridge point, subtropical high area (intensity) index, and 850 hPa subtropical high index at 50~110° E. The Siberian high intensity index is calculated as the standardized sea-level pressure over the region of 80–120° E and 40–65° N [22]. The East Asian trough intensity index is calculated from the standardized 500 hPa height field over the region of 110–145° E and 25–45° N [23]. Since the strength of the Siberian High Pressure System (East Asia Trough) is closely related to the changes in the sea level pressure field (geopotential altitude field), these indicators can fully reflect the strength of the system [5,22,23]. Wang et al. [5] calculated the subtropical high index in the range of 90–160° E north of 10° N. However, due to the high-pressure system that affected Qujing, Yunnan, being located west of 110° E, the subtropical high index was calculated for the range of 10–70° N and 50–110° E. The area index is defined as the number of grid points within this region where the 500 hPa geopotential height is greater than 5880 gpm. The intensity index is the cumulative difference between grids with potential heights > 5880 gpm and 5870 gpm. The subtropical ridge point is determined as the longitude of the westernmost location where the 5880 gpm contour of geopotential height is found. The 850 hPa subtropical high index represents the average deviation of the 850 hPa geopotential height within the region spanning from 50 to 110° E and from 10 to 30° N.

3. Results

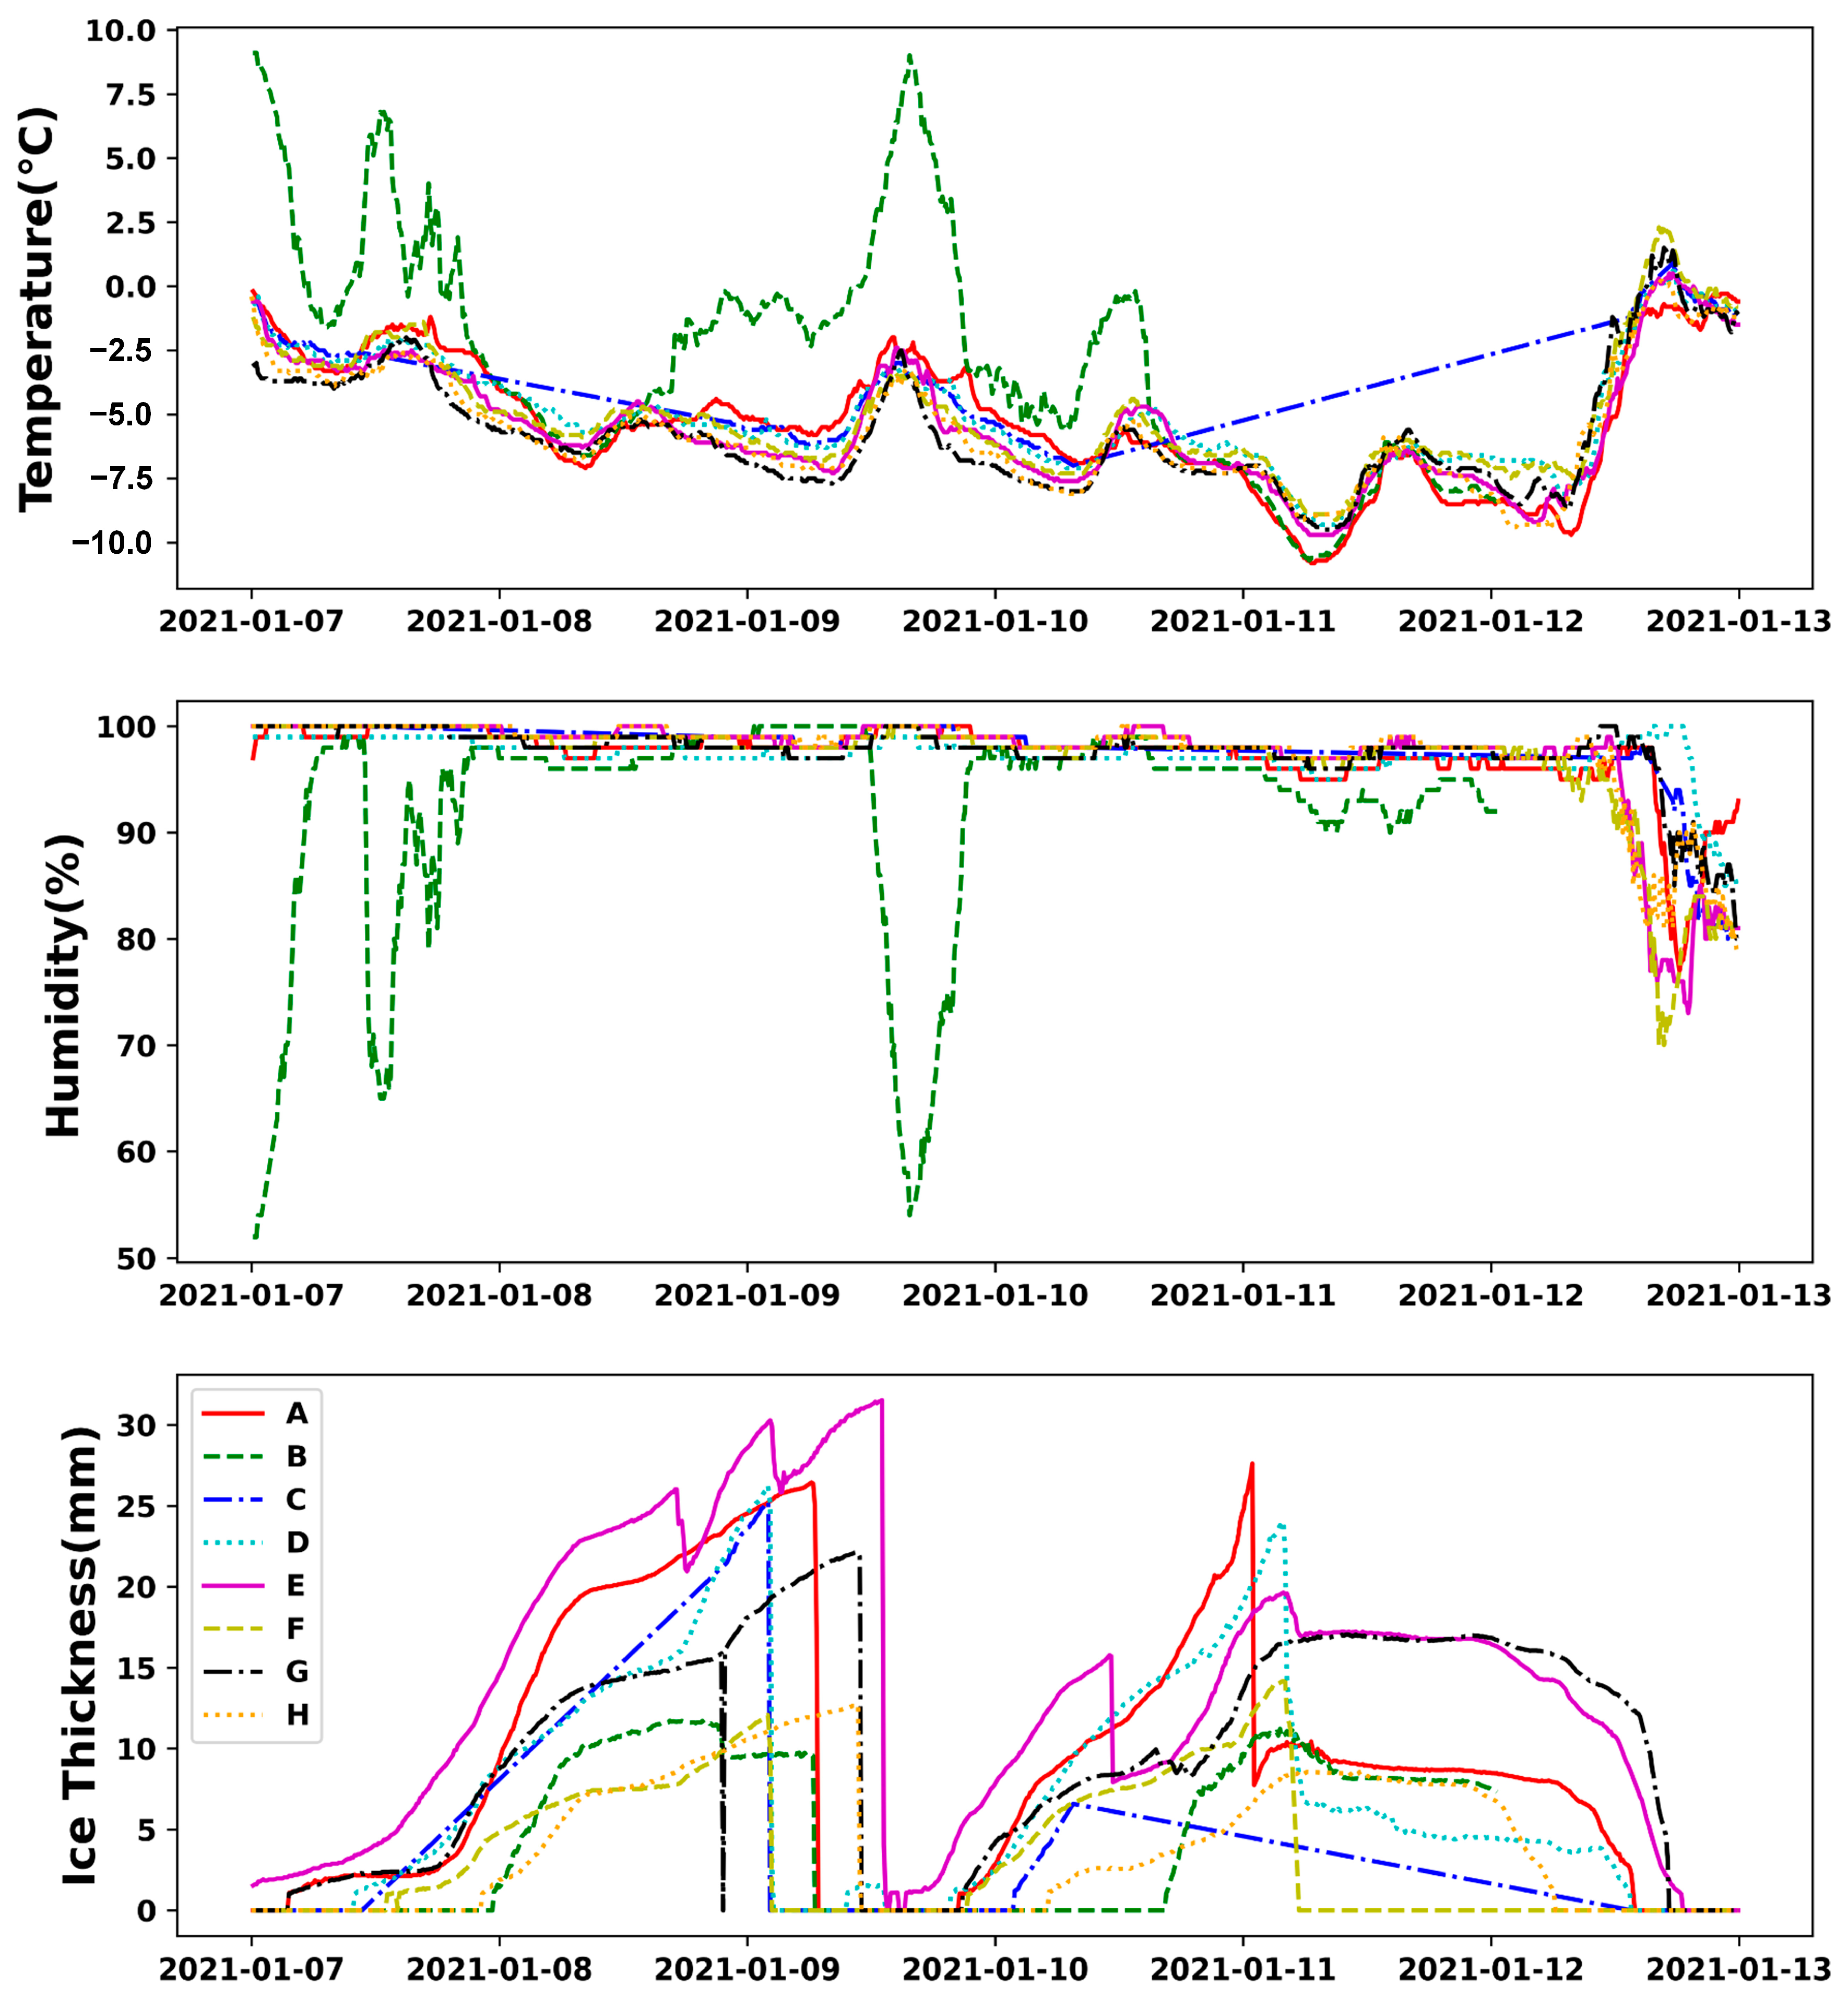
3.1. The Icing Process Overview

Figure 3 provides an overview of the dual icing events that were observed from 7 January to 13 January 2021. Table 1 presents data concerning the maximum ice thickness, time of occurrence, temperature, and humidity for the first stage (7 January to 10 January) and the second stage (10 January to 13 January) of icing for eight tower pylons designated as A to H. Icing was initiated at approximately 08:00 on 7 January (hereafter all time zones are provided as UTC+8). During the first stage, pylon E had the largest ice thickness among all pylons, reaching 31.52 mm on 9 January, with an average rate of ice growth of 0.51 mm/h and a minimum temperature of −3.10 °C. In the second icing stage, pylon A had the largest ice thickness among all pylons, reaching 27.61 mm, exhibiting an average growth rate of 0.99 mm/h. Details for the other pylons are outlined in Table 1. To ensure the safety of power transmission lines, a “direct current de-icing” operation was implemented. However, due to the persistent influx of frigid air, the transmission lines experienced a subsequent icing event on 10 January. Pylon A’s ice thickness reached 27.61 mm, and the temperature dropped to −8.00 °C. As the intensity of the cold air abated and relative humidity diminished, resulting in reduced moisture content in the atmosphere, a gradual ice melt was observed by 12 January. Due to micro-topographical influences, there were variations in the initial icing onset times and times to reach maximum icing thickness among the eight pylons. Additionally, de-icing operations were carried out upon achieving a specific ice thickness threshold. However, the second icing event exhibited relatively milder conditions, with some of the ice naturally melting. The temperature of the second stage was lower than that of the first stage.

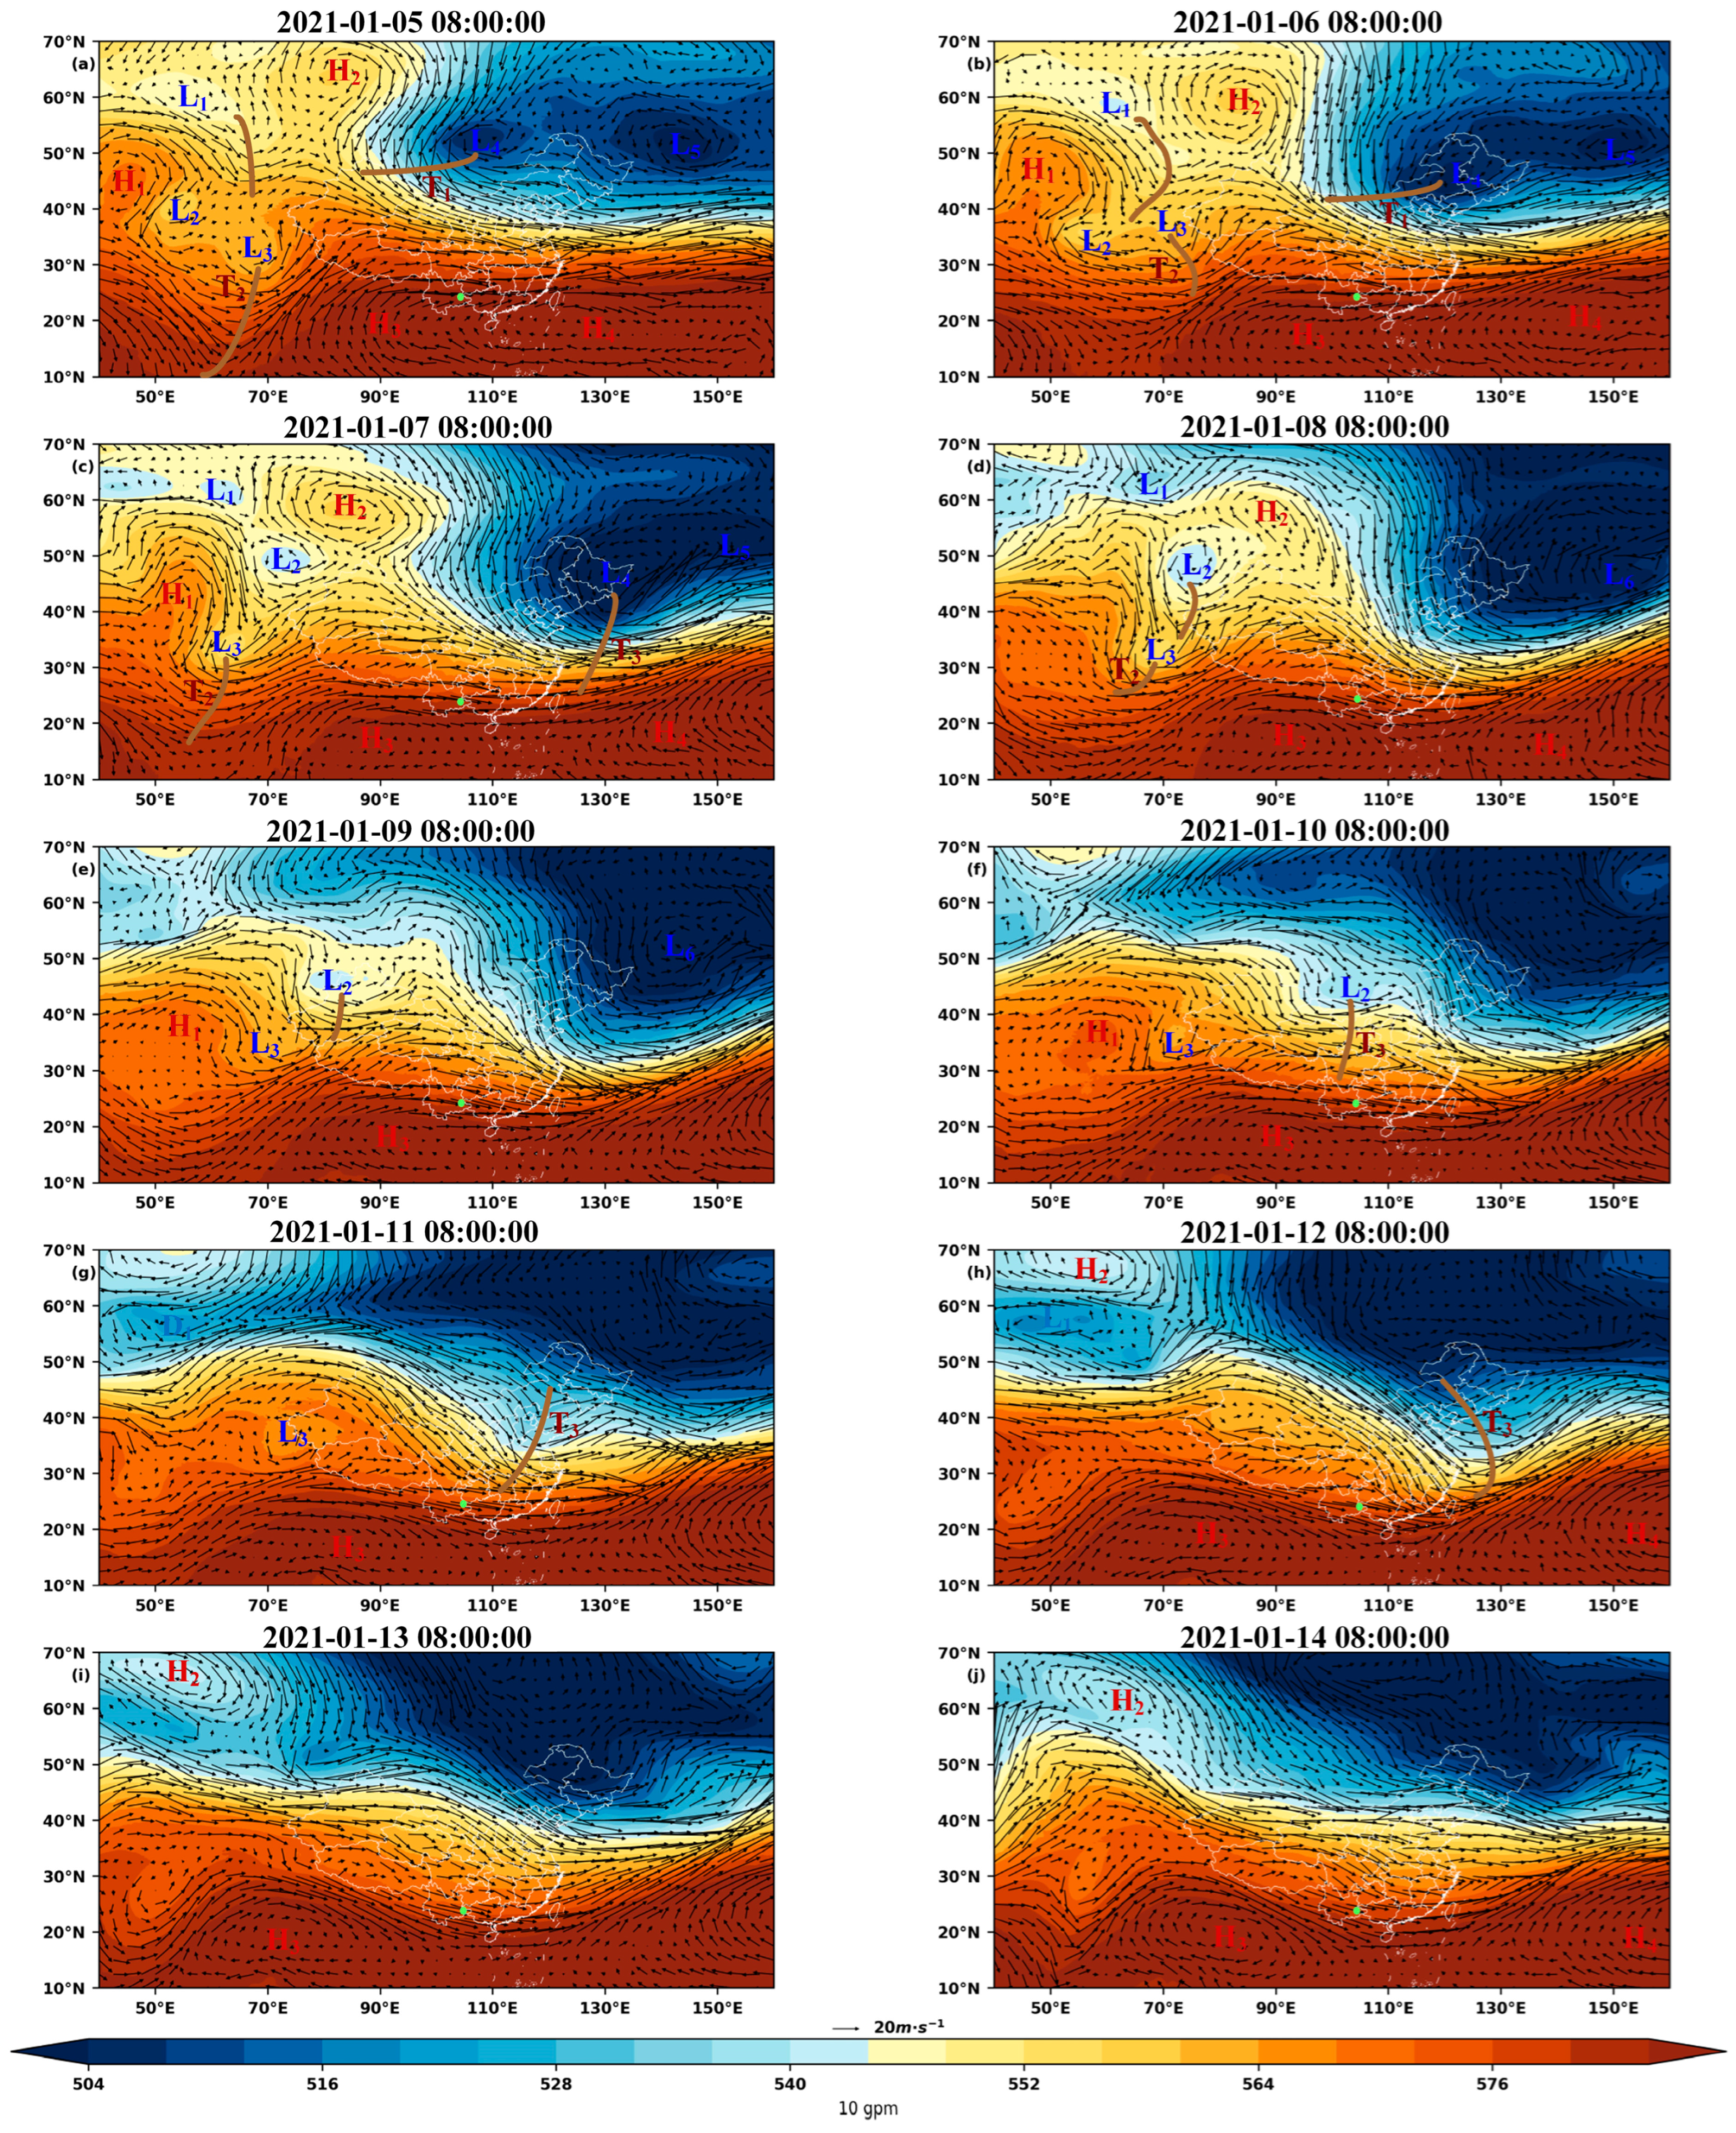
3.2. Analysis of the Atmospheric Circulation Pattern during the Icing Process

On 5 January 2021, at 08:00, the large-scale geopotential height field at 500 hPa showed a “ridge-trough” pattern in the Eurasian middle and high latitudes (Figure 4). To the east of the Ural Mountains, there was a high-pressure ridge, and there were two cold vortexes (L4, D5), one over Lake Baikal and one over the Okhotsk Sea. The Western Pacific subtropical high (H4) was shifting northwestward. By 6 January 2021, at 08:00, the cold vortex (L4) over Lake Baikal had strengthened and moved eastward, pressing southward into the northeastern region of China. This led to the formation of a blocking high-pressure system (H2), and due to the northwest airflow behind the trough (T1), cold air was continuously transported southward. The trough (T2) in the southern branch weakened, and the Western Pacific subtropical high (H4) shifted eastward. On 7 January, the northeastern cold vortex (L4) further intensified, leading to increased wind speeds. The zonal-oriented trough (T1) transformed into the meridional-oriented trough (T3), and the southwestern airflow ahead of the southern trough (T1) transported maritime moisture onto the continent. By 8 January, the northeastern cold vortex (L4) weakened and continued to move eastward, eventually merging with the cold vortex (L5) over the Sea of Okhotsk to form a low-pressure system (L6). The southern trough (T2) weakened and transformed into a high-pressure ridge around 90° E while still carrying maritime moisture. On 9 January, the blocking high-pressure system (H2) began to gradually break down, allowing cold air to continue moving southward. On 10 January, the blocking high-pressure system (H2) completely broke down, and a low-pressure system (L2) from Mongolia moved eastward and southward. The trough (T3) continued to deepen, with Qujing located ahead of it. A new surge of cold air moved eastward and southward. By 11 January, the trough (T3) deepened further as it moved eastward. Qujing remained situated behind the trough (T3), experiencing northwest airflow. The Iranian high-pressure system (H1) shifted eastward and northward. On 12 January, the trough (T3) continued to move eastward over the sea, weakening. Qujing remained under northwest airflow behind the trough (T3). On 13 January, a high-pressure system (H3) gradually strengthened in the 70–90° E region, and a blocking high-pressure system (H2) began to form, making it increasingly difficult for the cold air to move southward.
The ice-covered atmospheric circulation situation in the Yunnan Plateau region is different from that occurring in the Guangxi Plain in 2015 [5], mainly in that although the driving factors of cold air are all affected by the East Asian low trough, there is an additional cold vortex (L4) of Lake Baikal in the early stage of the formation of the East Asian low trough in January 2021.
From 5 to 8 January (Figure 5a–d), influenced by the high-pressure system (H1) over the Ural Mountains and the cold vortex system (L1) over the Sea of Okhotsk, as the trough (T1) transitioned from a zonal to a meridional orientation, it directed the movement of cold air from north to south. In the Qujing area of Yunnan, the location near the frontal zone (F1) meant encountering dry, cold air from the north and warm, moist air from the south. These two air masses, with opposing characteristics, converged above Qujing’s airspace. When the cold air mass predominated, a swift temperature decline ensued, causing supercooled liquid droplets or fog droplets to freeze, resulting in power line icing. Conversely, dominance by the warm air mass prompted temperatures to rise, leading to ice melting. Between 10 and 11 January (Figure 5f,g), the westward shift of the Yenisei River cold vortex (L2) occurred. The trough (T2) steered another bout of cold air southward, affecting regions including southeastern Xinjiang, Qinghai, and the eastern Tibetan Plateau, thereby impacting Qujing in Yunnan (depicted by the purple path in Figure 5g,h). By 12 January (Figure 5h), the convergence of these two cold air masses heralded prolonged cold temperatures. From 13 to 14 January (Figure 5i,j), the subtropical high-pressure system (H2) strengthened, facilitating weak warm advection northward. Simultaneously, the cold vortex (L1) over the Sea of Okhotsk retreated northward and weakened, allowing warm air to prevail over the Qujing area in Yunnan.
The early stages of the cold air process from 7 January to 13 January, 2021, were characterized by the transformation of a zonal-oriented trough into a meridional-oriented trough, which deepened southward. This shift in weather patterns led to a significant influx of cold air, resulting in the outbreak of frigid weather. As the blocking high-pressure system gradually broke down and the Mongolian low-pressure system moved eastward and southward, the trough continued to deepen. Additionally, a new surge of cold air developed from the southeast of Xinjiang and the Tibetan Plateau. The convergence of these two cold air masses intensified the cooling effect. As the Yenisei River cold vortex moved westward, it brought a weak cold air mass that influenced the Qujing area in Yunnan. Additionally, the southern flow behind the subtropical high-pressure system transported moisture from the sea northward. In the first stage, there was a strong cold air mass, and a significant amount of moisture was transported from the south to the north. In the second stage, although the cold air mass was still strong, the center of the subtropical high-pressure system shifted towards the southwest, resulting in less moisture transport. Therefore, in the first stage, the icing on the power lines occurred rapidly, leading to a greater ice thickness.

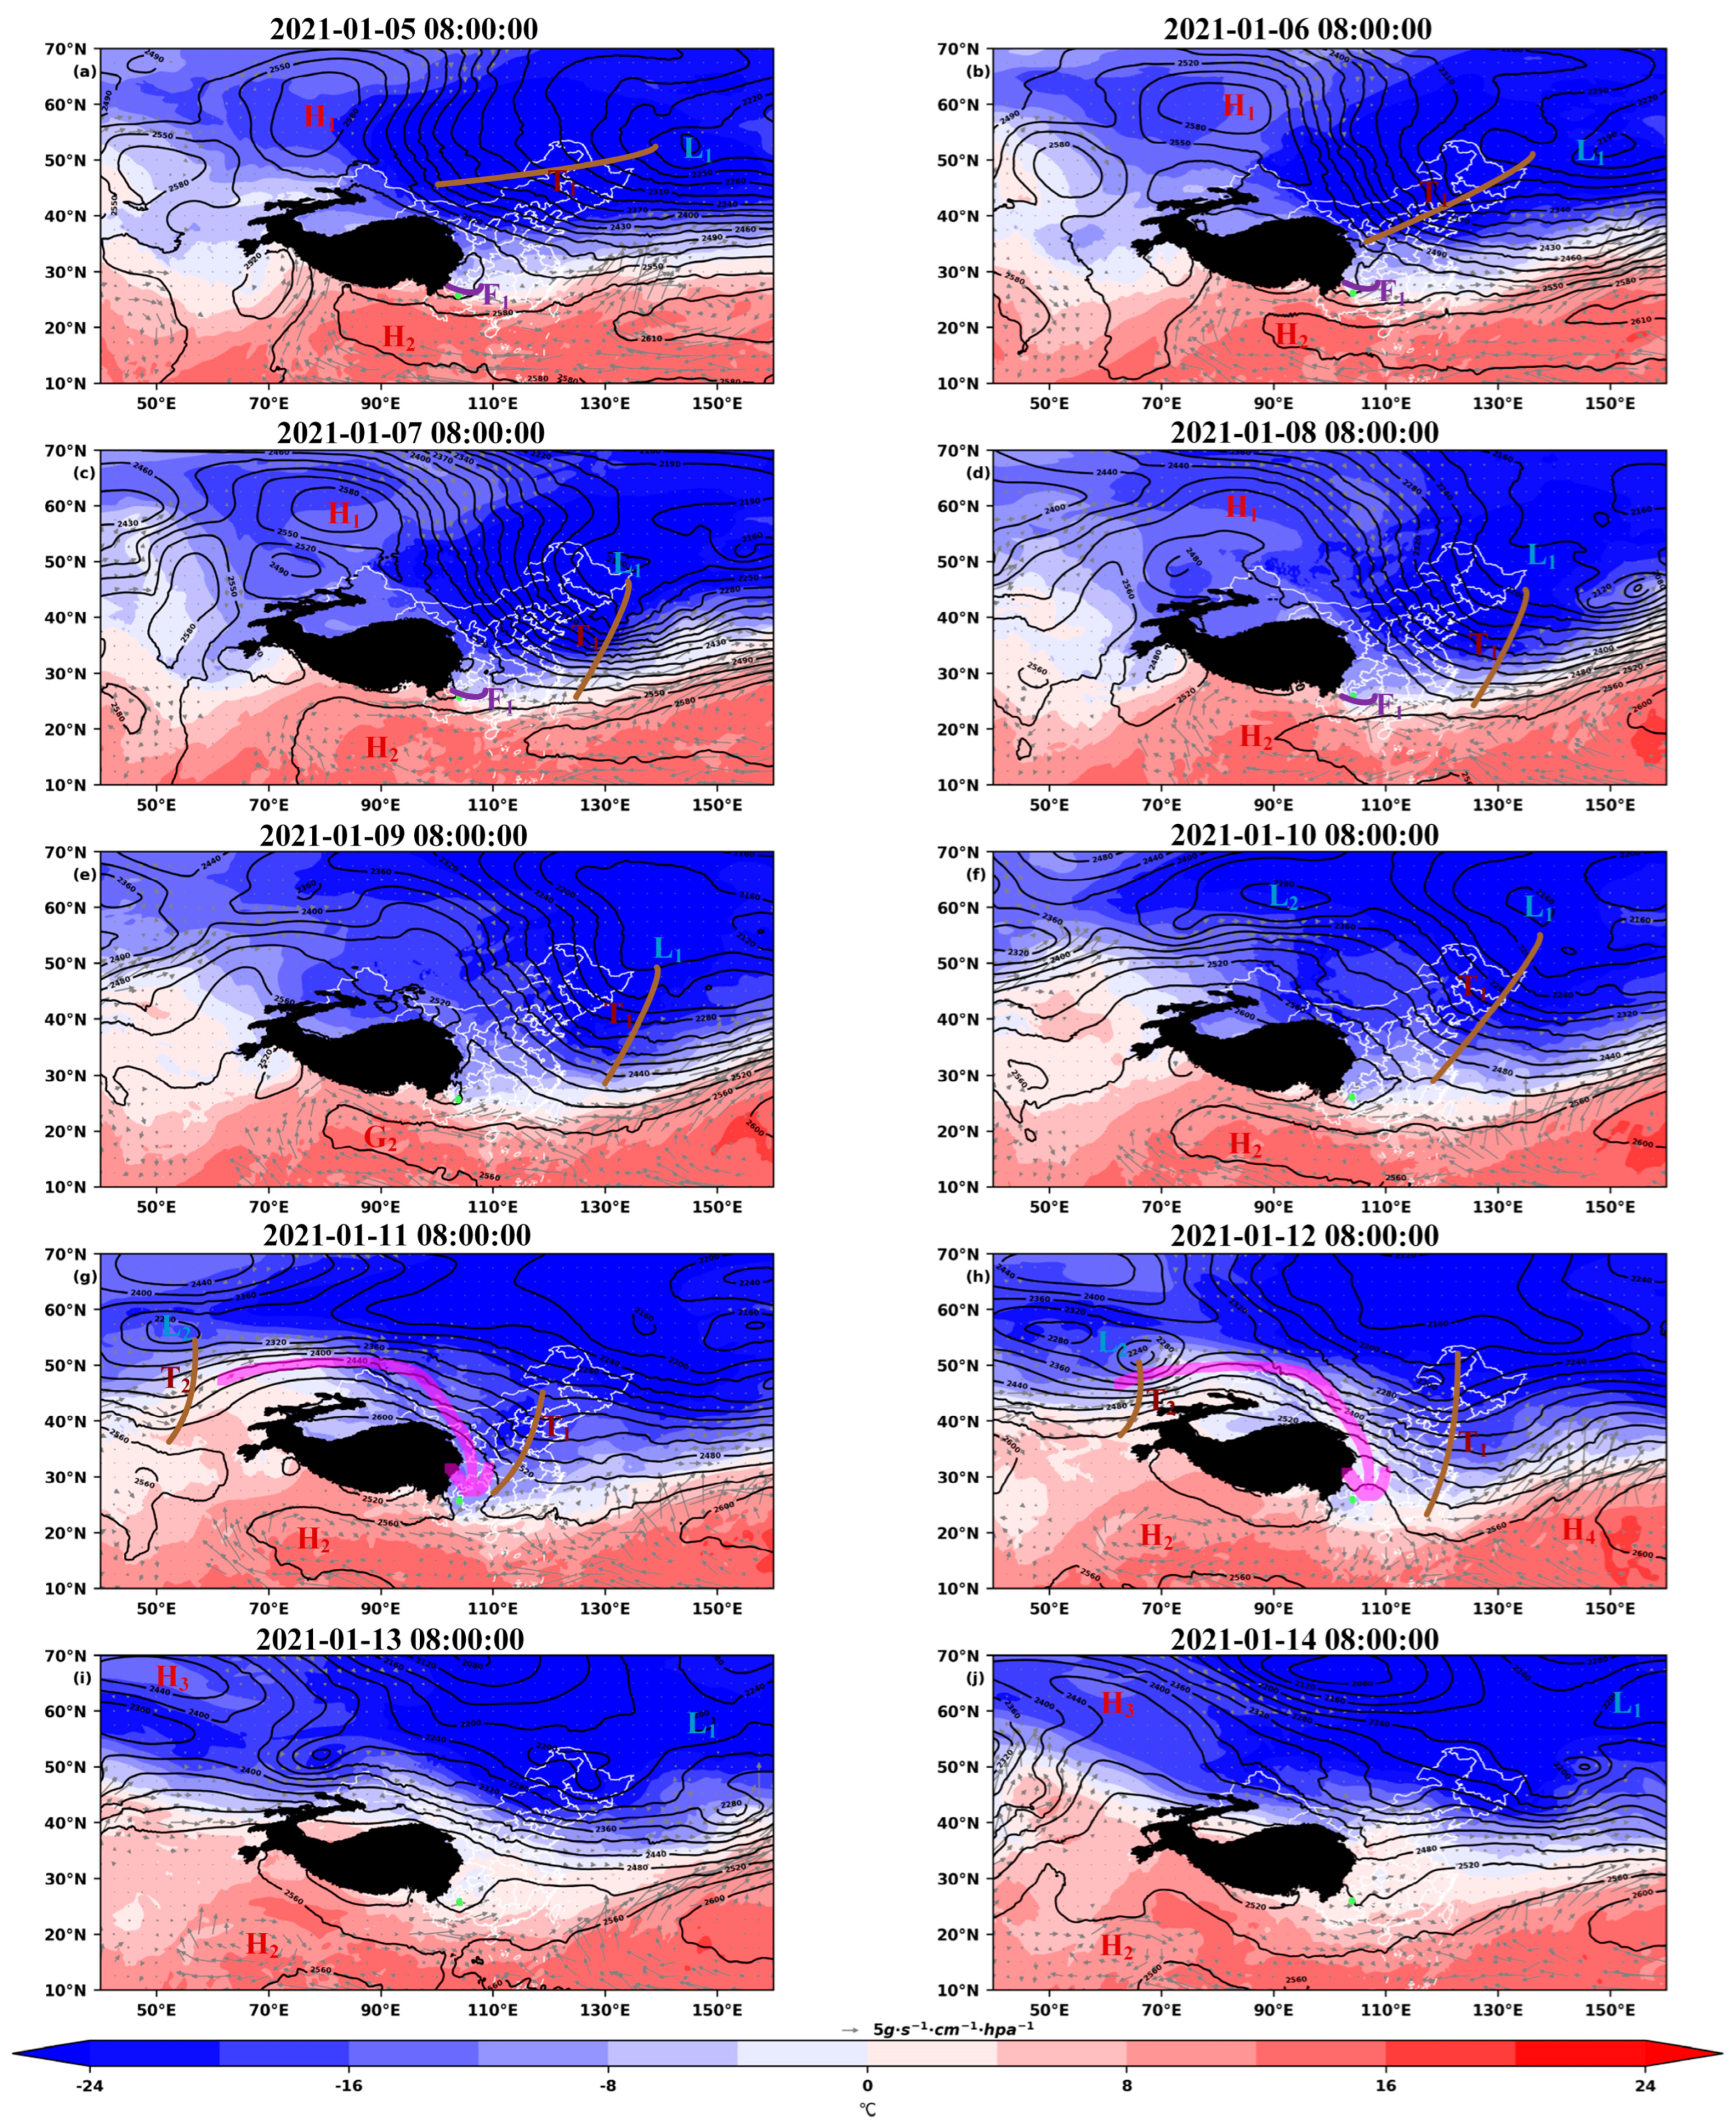
3.3. Analysis of Temperature and Humidity Conditions during the Icing Process

Figure 6 and Figure 7 show the vertical profiles of temperature and relative humidity of the whole icing event. During the first stage of the icing process (7 January to 10 January), there was a prominent presence of strong warm and moist airflow ascending northward in the upper part of the boundary layer. However, by 7–8 January, as cold air descended from the near-surface and intruded southward, a strong inversion layer developed in the lower part of the troposphere. This inversion layer inhibited the vertical movement of air, causing a substantial amount of moisture to accumulate beneath it. When combined with the sub-zero cold air present beneath the inversion layer, it often results in freezing rain and snowfall. These conditions were conducive to the icing of the extra-high-voltage transmission lines. In the second stage (10 January to 13 January), there was also an occurrence of a stable inversion layer. However, despite the relative humidity being high within the two stages, the relative humidity during the second stage was lower than that during the first stage. Figure 8 represents the 750 hPa water vapor flux over Qujing. On 5–6 January, Qujing was situated in the northern part of the subtropical high-pressure system (H2) of 50–110° E at 750 hPa (Figure 5), where a significant amount of water vapor was transported northward into Qujing’s airspace. This influx of moisture contributed to the conditions necessary for icing on power lines. From 7 to 8 January, as cold air moved southward, it led to icing on the power lines. From 9 to 10 January, there was a shift in the direction of water vapor transport, signifying an interplay between warm, moist air masses and cold air masses, resulting in reduced water vapor flux. However, on 11 January, with the substantial intensification of cold air, icing on the power lines resumed. After 12 January, the predominant direction of water vapor transport shifted from north to south, and the cold air ceased its southward movement.
Figure 9 shows the daily total precipitation in the areas where the eight pylons are located during this process. Rainy weather occurred on all 7 days. Although the rainfall did not exceed 3 mm on any of these days, when the temperature was below 0 °C, supercooled water droplets came into contact with the power lines, leading to icing.

4. Discussion

4.1. Comparison of Icing Temperature and Humidity Conditions

Figure 10 and Figure 11 show the latitudinal temperature and humidity vertical profiles at the peak times of maximum ice covering during the first stage (9 January, 08:00) and the second stage (11 January, 03:00). In these figures, red arrows represent warm, moist air, while blue arrows indicate dry, cold air. The structure of the atmosphere in those eight pylons in Qujing exhibits a “warm–cold” vertical structure (from a high altitude to a low altitude) in both stages, which is considered a typical vertical pattern for freezing rain weather conditions [24]. The presence of a pronounced inversion layer in the atmospheric structure and abundant moisture are conducive to the growth and maintenance of the ice cover on power lines. In the second stage, the inversion layer is deeper compared to the first stage, and the cold air is stronger than in the first stage. Additionally, the temperature in the second stage is lower. The moisture content is as abundant as in the first stage. Finally, the ice covering in the second stage soon melts with the warm air sinking and warming (Figure 6).
To find out the difference between the causes of ice accumulation in plain areas and plateau areas, we analyzed the icing event in Guilin Plain, Guangxi in 2015. During this event, the temperature profile exhibited a “cold–warm–cold” structure [5]. The “cold–warm–cold” temperature profile structure observed in this event aligns with the “melting” mechanism of freezing rain, snow, or ice crystals. In this process, these frozen forms completely melt into raindrops while descending through a warm layer with temperatures above 0 °C. Following this, the raindrops descend into a sub-freezing layer with temperatures below 0 °C, transforming into supercooled raindrops. In 2021, the inversion layer structure in the Yunnan Plateau region is uplifted by the terrain, and the vertical temperature profile forms an obvious “warm–cold” structure. This “warm–cold” temperature profile structure also corresponds to the “supercool and warm rain” mechanism of freezing rain. Freezing rain grows by collision and coalescence of supercooled cloud droplets and raindrops [21].

4.2. Correlation Analysis of Ice Thickness and Large-Scale Atmospheric Circulation Indices

The strong cold air brought by the Siberian high-pressure system invades southern China. When the cold air at the forefront of the high-pressure system encounters warm air from the south, the formation of a cold front occurs if the cold air holds greater dominance over the warm air. The cold surge brought by the cold front has a significant impact on the winter cooling process in China. When the high-pressure ridge at 70–90° E is strong and eastward in winter, the southwest-coming airflow in the rear of the high-pressure ridge guides warm and moist airflow to the northeast region. In areas with higher terrain, the accumulation of cold air forces the warm and moist air masses to rise, forming a quasi-stationary front, making it easier for power lines to accumulate ice. Therefore, the intensity of the cold air is assessed using the Siberian high-pressure index and the East Asian trough intensity index, and the intensity of the warm and moist air is evaluated using the 50–110° E subtropical high-pressure index to analyze the variation of cold and warm air during the icing process. Figure 12 shows the changes in various indices during the icing period. In this context, a high Siberian high-pressure index corresponds to a strong Siberian cold high-pressure system, and a low East Asian trough index corresponds to a strong East Asian trough. In the pre-icing period, the Siberian high-pressure index decreased, and the intensity of the East Asian trough continued to strengthen. It indicates that the strength of the East Asian trough has deepened and directed cold air from Siberia southward. In the second stage, the Siberian high-pressure system exhibited decreased strength compared to the first stage, and the intensity of the East Asian trough was also reduced. Despite the lower intensity of the cold air in the second stage compared to the first, the combination of the two cold air masses in the second stage results in lower temperatures than in the first stage (Table 1 and Figure 3). Among the various indices related to the high-pressure system at 70–90° E, except for the low subtropical ridge point index (which corresponds to the high-pressure system shifting eastward), all other high indices indicate a strong high-pressure system. It can be observed that during the icing period, the high-pressure system was shifted eastward and higher in intensity. It is because the source of moisture transport to Qujing during this icing event was mainly influenced by the high-pressure ridge at low latitudes in the 50–110° E region. It is quite different from the dominant moisture factor (850 hPa West Pacific subtropical high in the 110–150° E region) in the 2015 icing event in Guangxi [5].
To further investigate the relationships among the Siberian High, East Asian Trough, 50–110° E Subtropical High, and ice cover thickness, an analysis of their lead-lag correlations is presented in Figure 13. The results indicate that when the East Asian Trough’s intensity, the subtropical high area, and the subtropical high intensity are leading by one day, their correlations with the maximum ice cover thickness are the lowest (correlation coefficients of −0.86, −0.83, and −0.83, respectively). On the other hand, when the 850 hPa subtropical high-intensity index leads by two days, it exhibits the lowest correlation (correlation coefficient of −0.82). Conversely, the Siberian High and subtropical high ridge points show the highest correlations with ice cover thickness when leading by one day (correlation coefficients of 0.92, and 0.86, respectively). Overall, the analysis suggests that various indices can provide relatively clear precursor signals for the daily maximum ice cover thickness when leading by 0 to 2 days in advance.

5. Summary and Conclusions

This study investigated an UHV transmission line icing event in Qujing, Yunnan Province from 7 January to 13 January 2021. The study systematically examined meteorological factors affecting ice cover, including weather conditions, temperature and humidity distributions, local meteorological elements, and atmospheric circulation indices. The formation of covering ice is mainly related to the convergence of cold and dry air from the north and warm and humid air from the south, as well as the uplifting effect of the plateau topography, resulting in the development of quasi-stationary fronts. The dominance of these two warm and cold air masses, as well as the blocking of the terrain, play an important role in determining whether ice accumulates on the power line and the thickness of the ice.
  • Large-scale circulation patterns: The early part of this cold air process is a zonal-oriented trough turning the meridional-oriented trough. The northeast cold vortex rapidly moved eastward into the sea, and its strength led to the continuous rebuilding and eastward movement of the East Asian trough. As the blocking high-pressure system collapsed and reformed, cold air descended southward from the east side of Xinjiang and the Tibetan Plateau. The 50–110° E subtropical high-pressure system, which was eastward and strong, guided the southwest airflow to transport warm and moist air from the ocean to the southwestern region of China. Over Yunnan, the forces of cold and warm air masses were roughly equal, leading to their confrontation. The dominance of either the cold or warm air mass caused the front to oscillate back and forth. Under the influence of mountain ranges and the flow field, this led to the formation of a quasi-stationary front. When the cold air mass dominated and there was abundant moisture, it favored icing on power lines. However, when the warm air mass dominated, it contributed to ice melting.
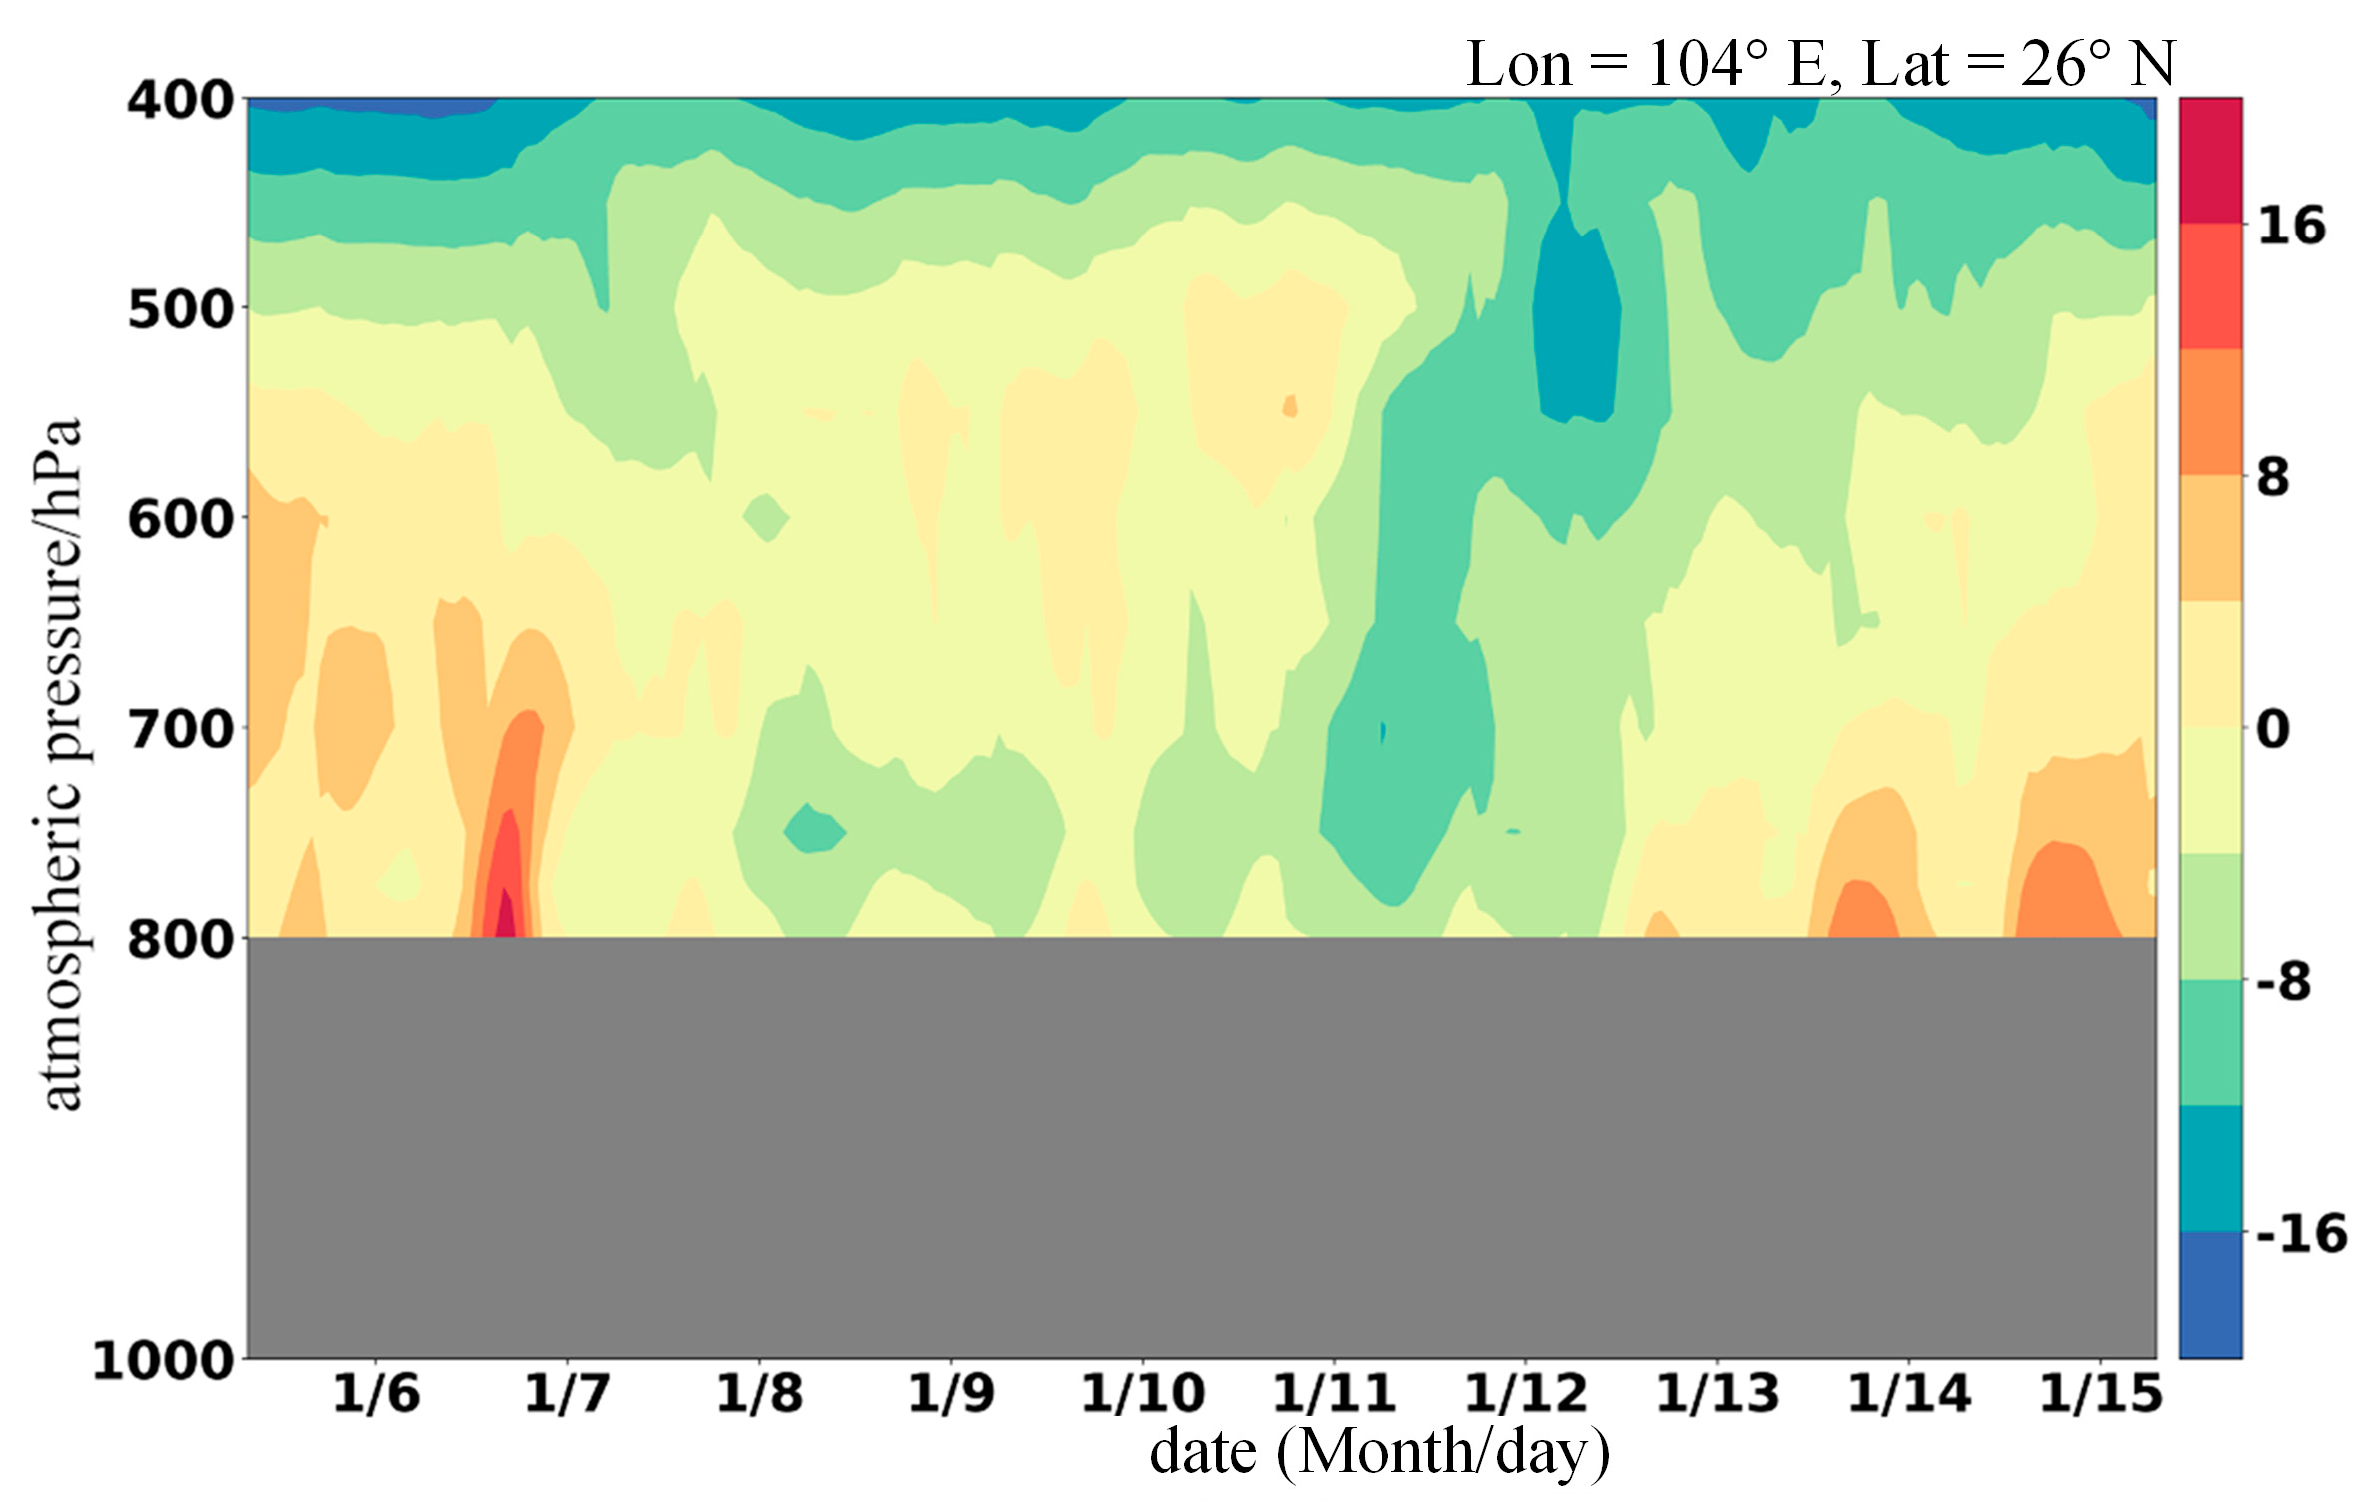
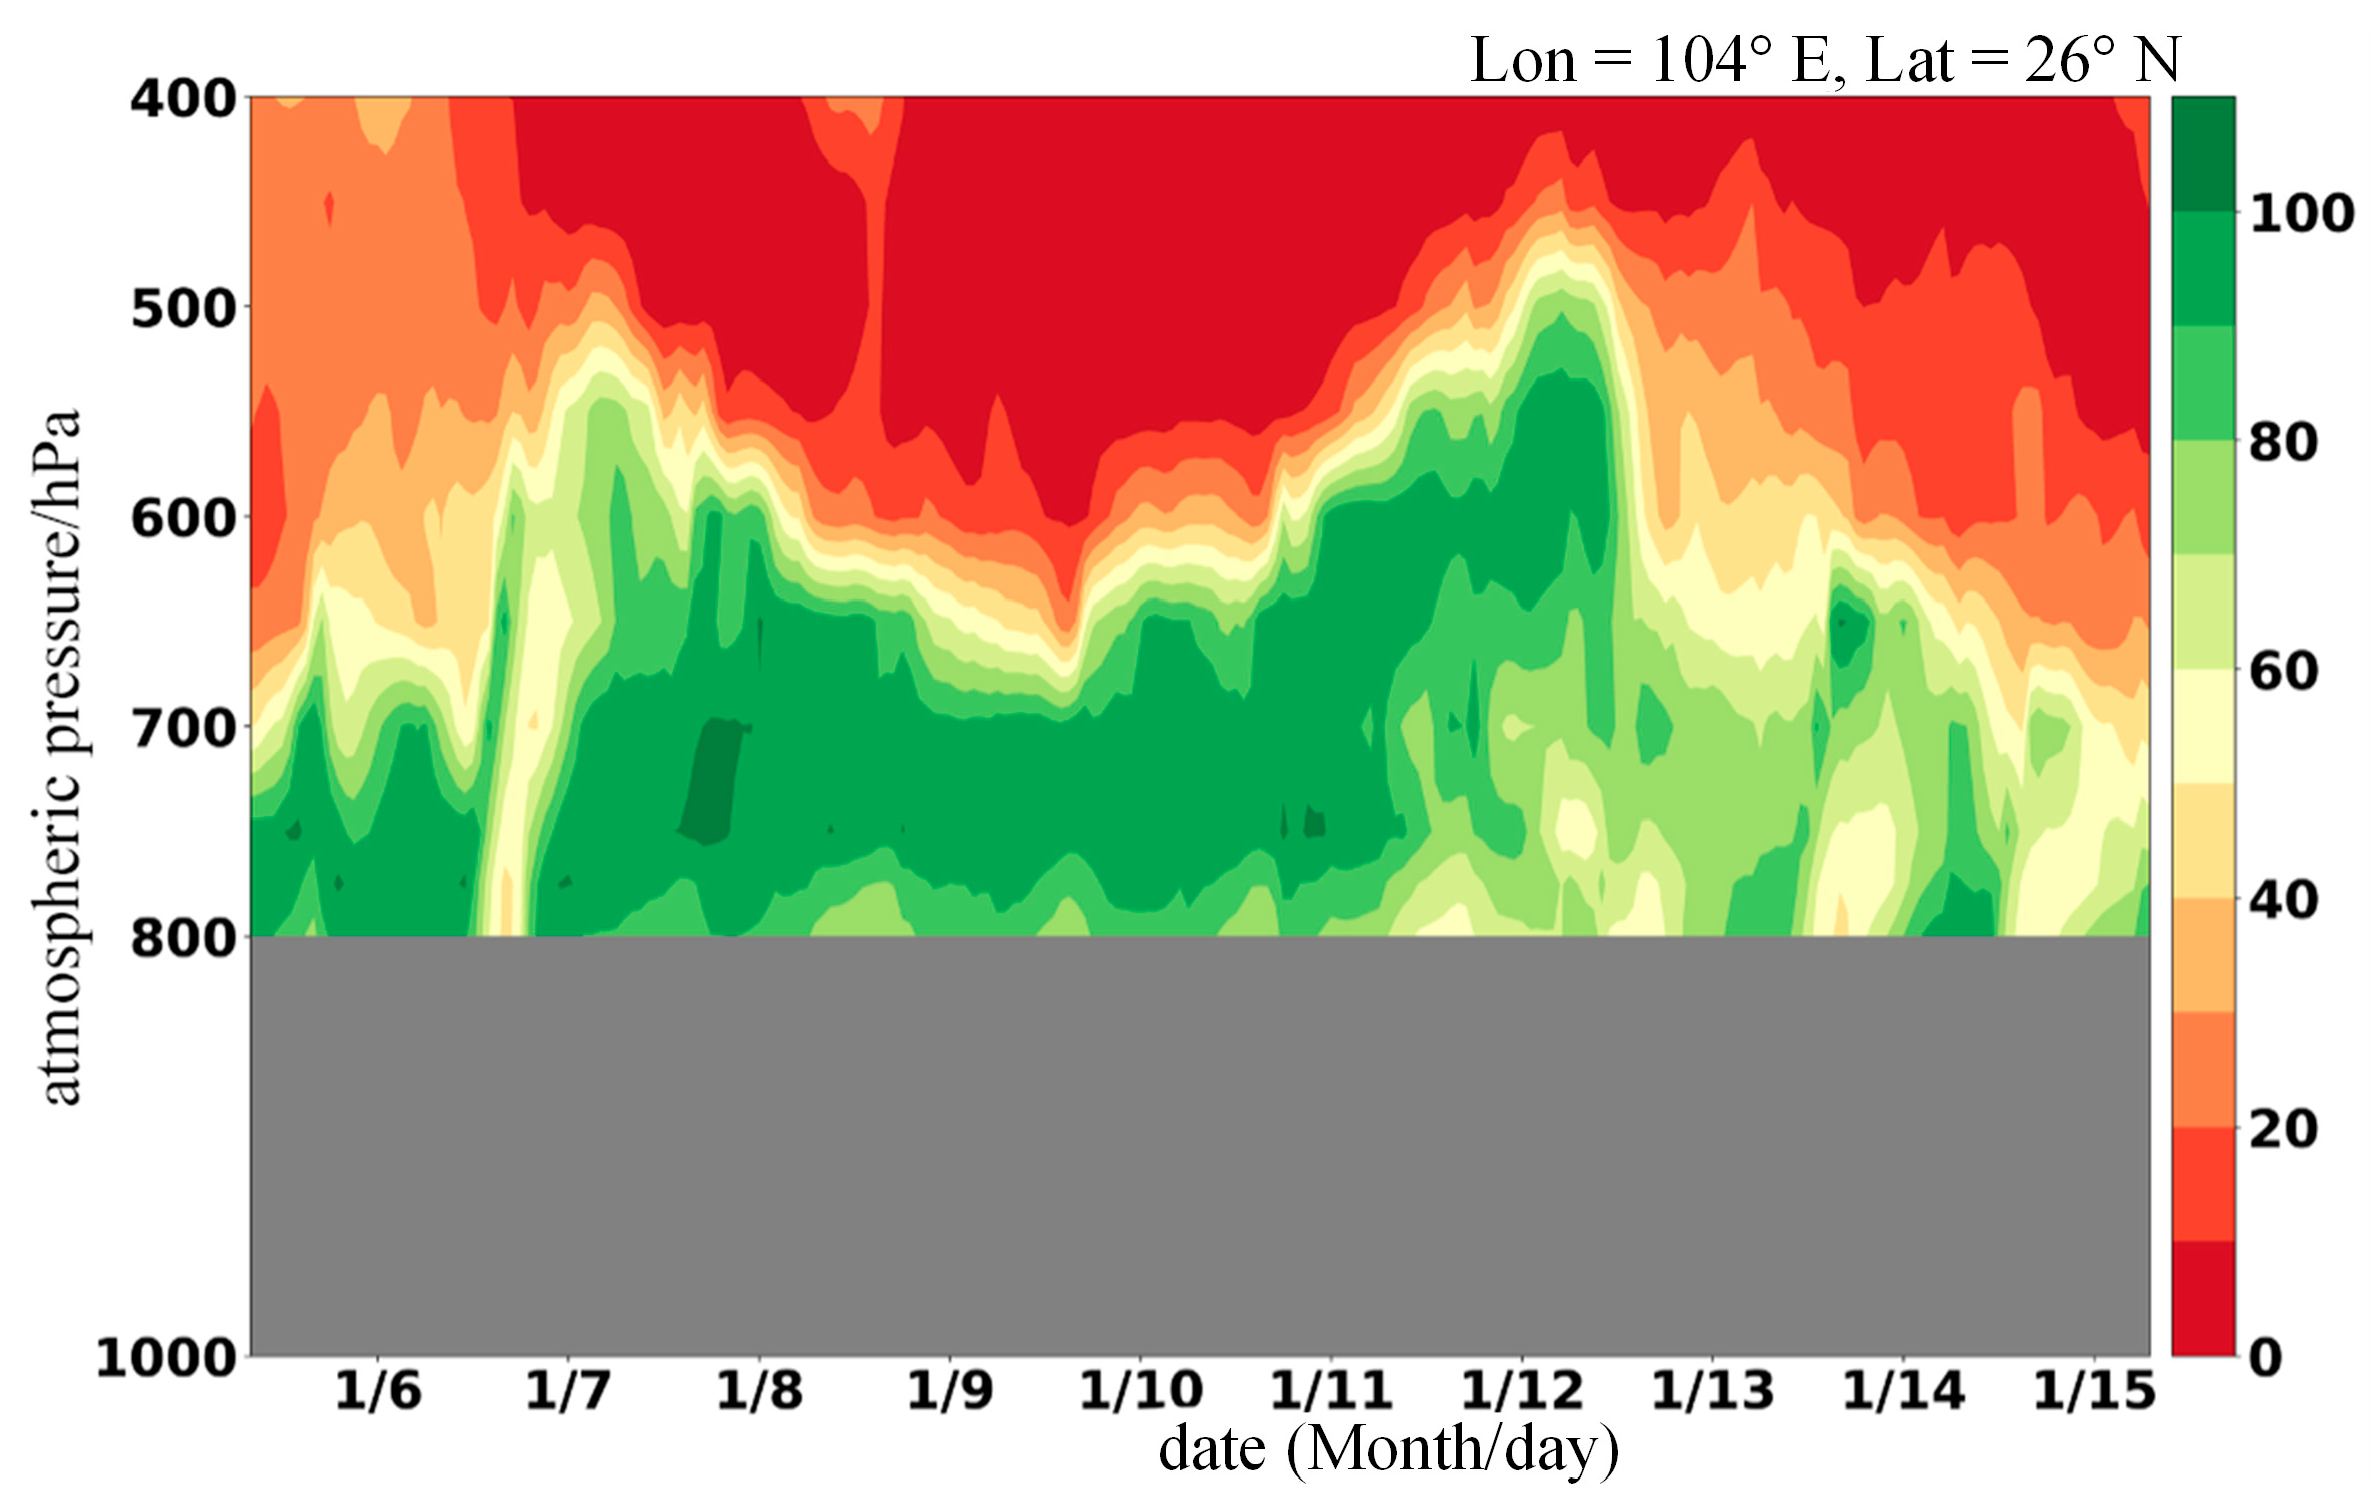
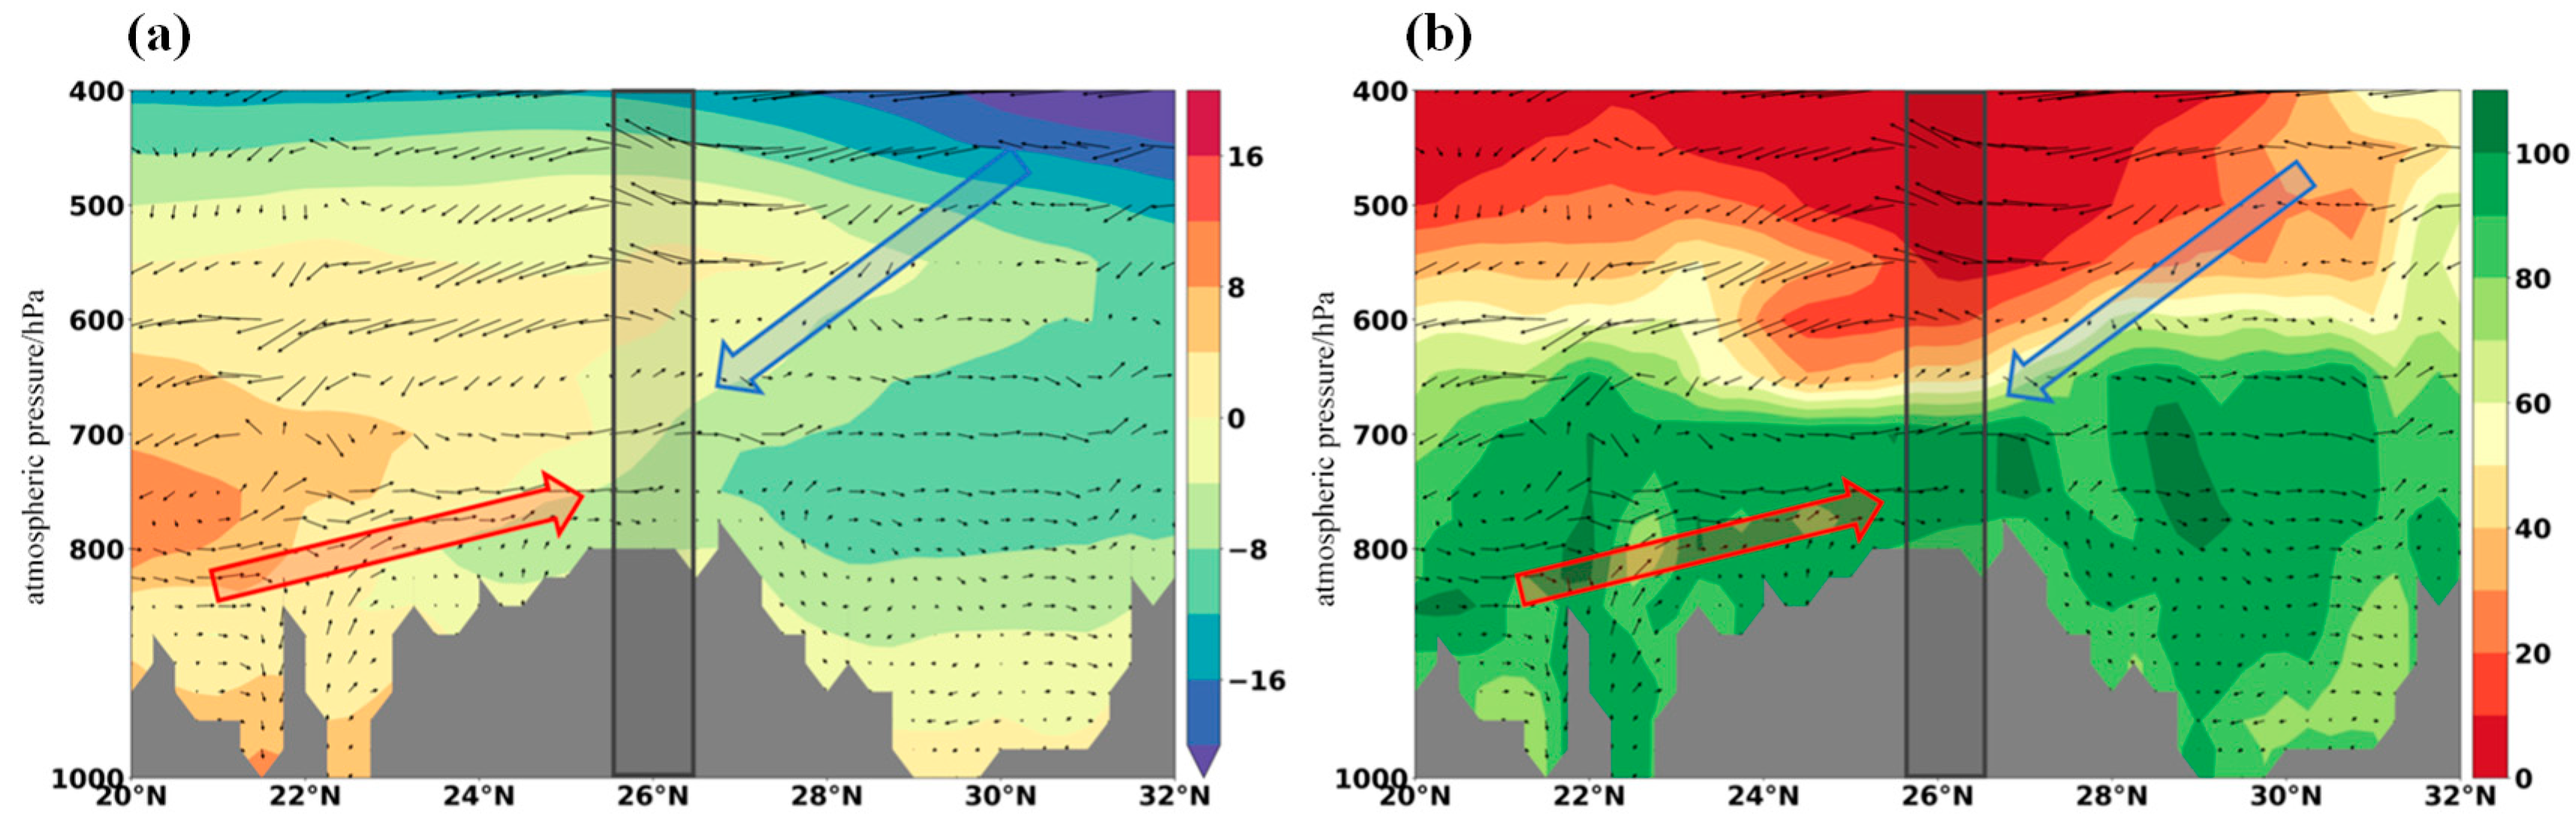
  • Vertical temperature and humidity structure: In the early stage of icing, there is strong warm and humid air moving north in the upper part of the boundary layer. At the same time, due to the topographic uplift, cold air moves south and accumulates near the mountain, forming a temperature inversion layer. In the first stage, the cold air is weaker but has more abundant moisture. As a result, the ice thickness in the first stage is slightly greater than that in the second stage.
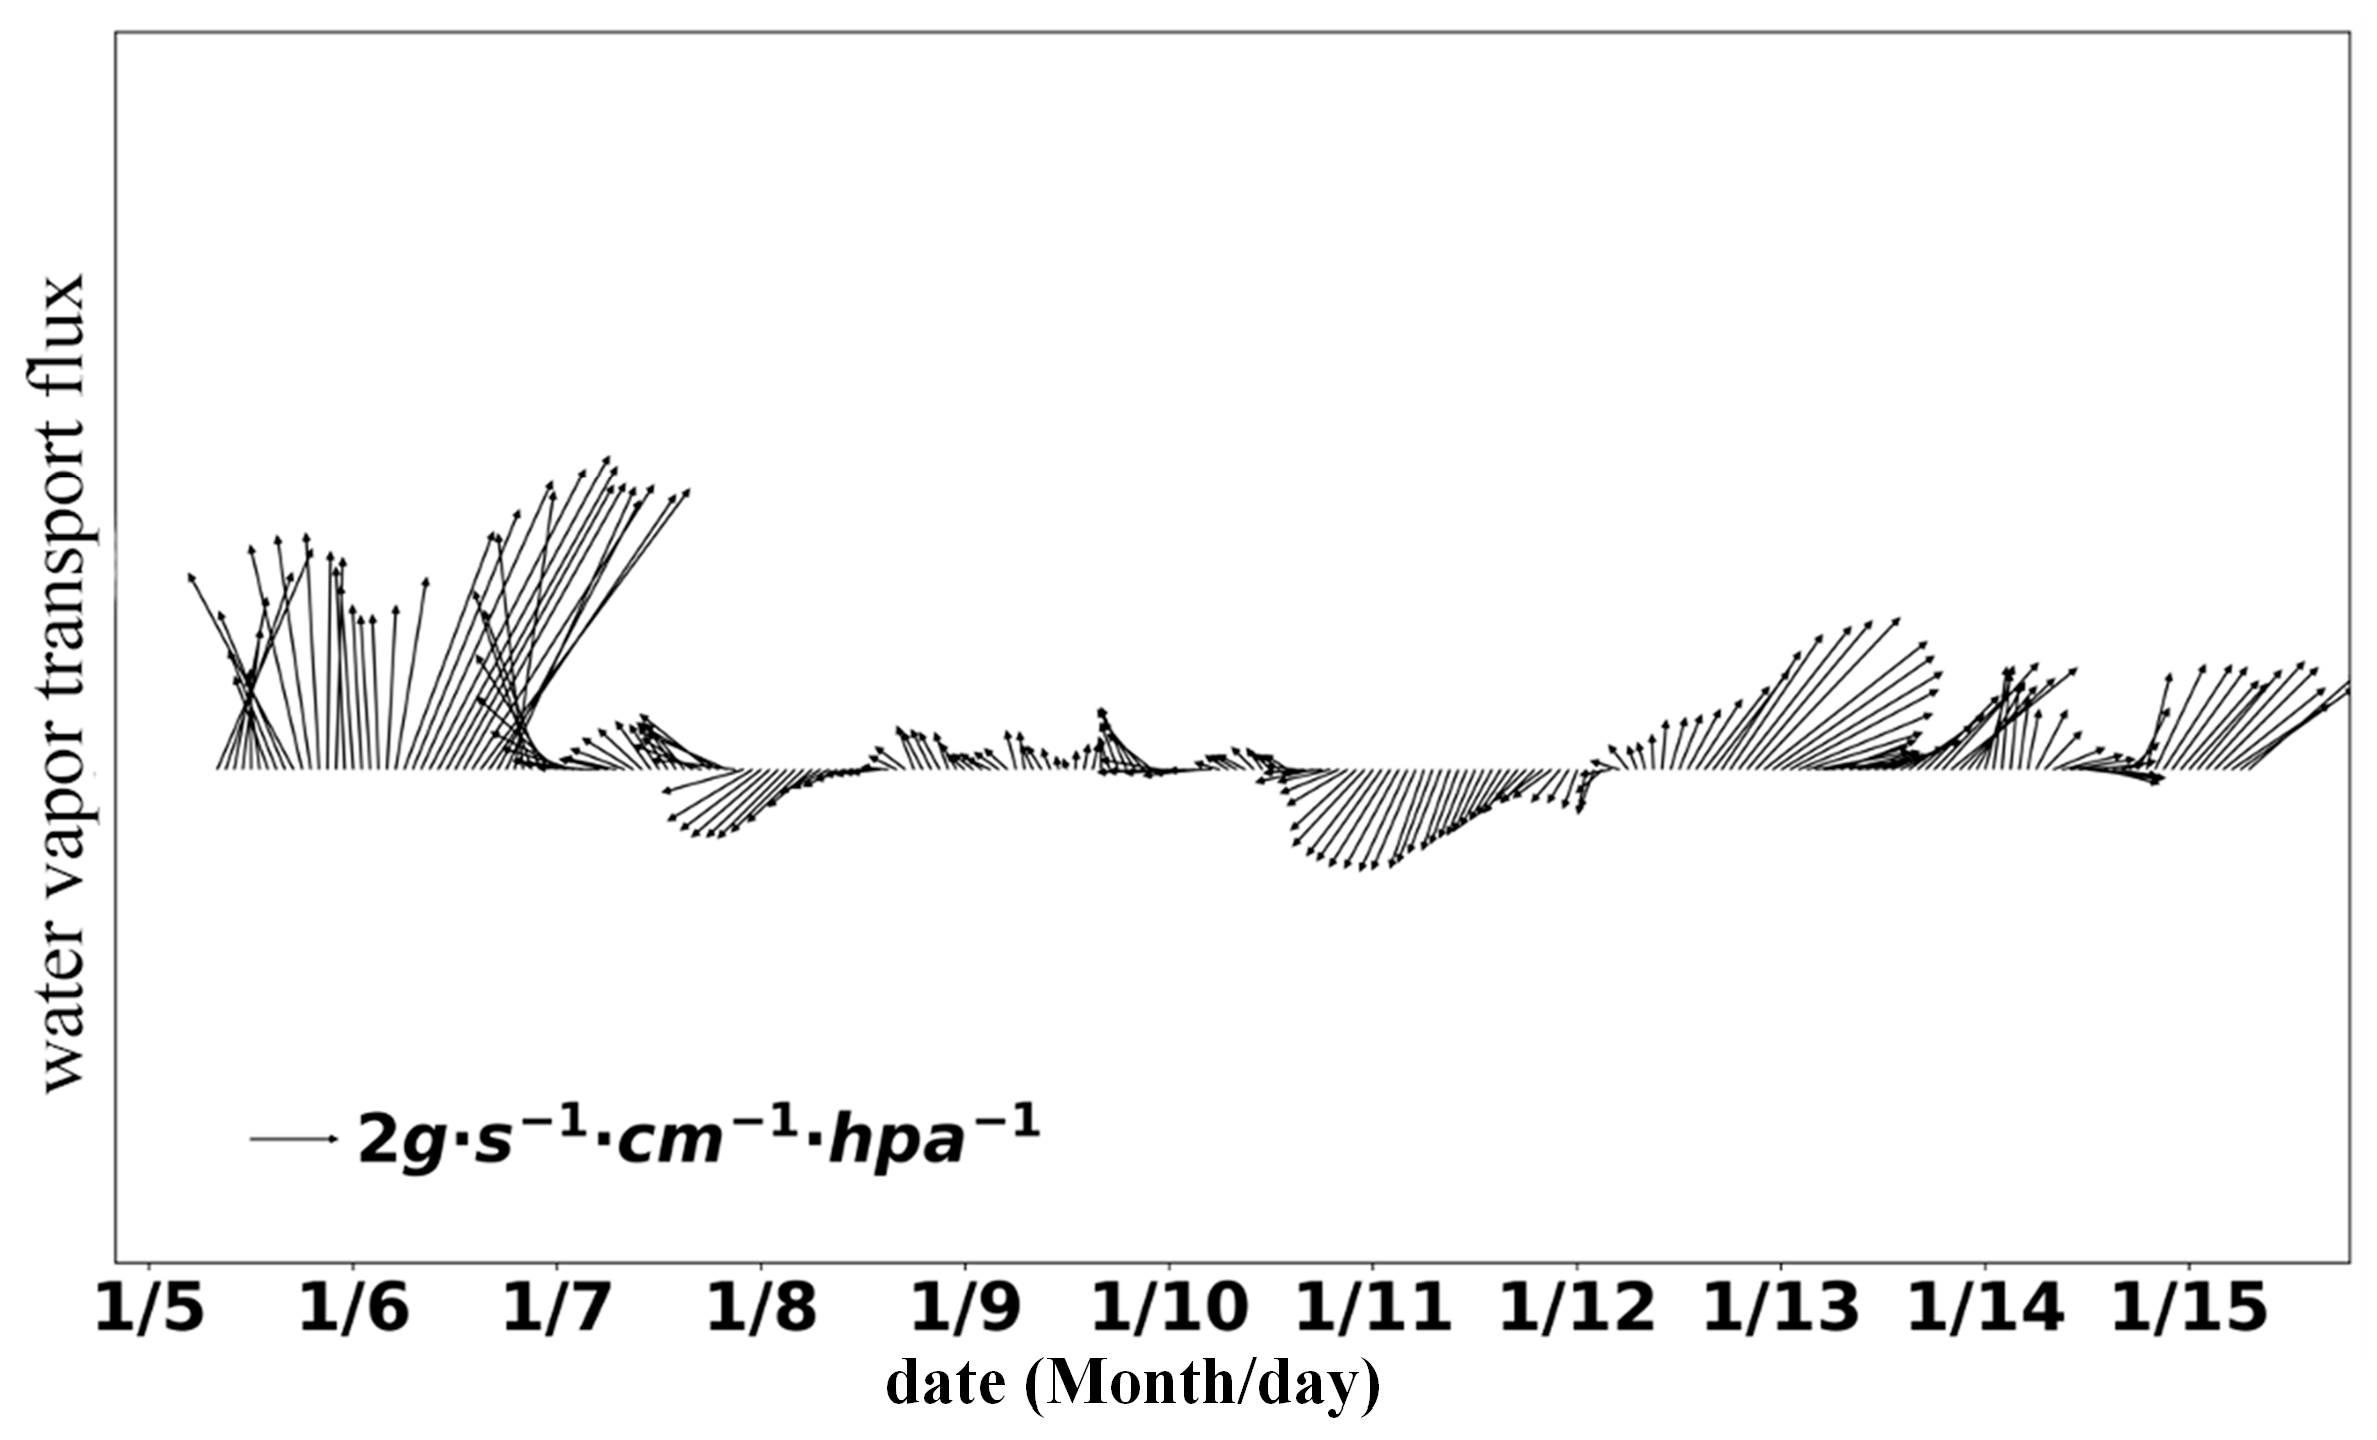
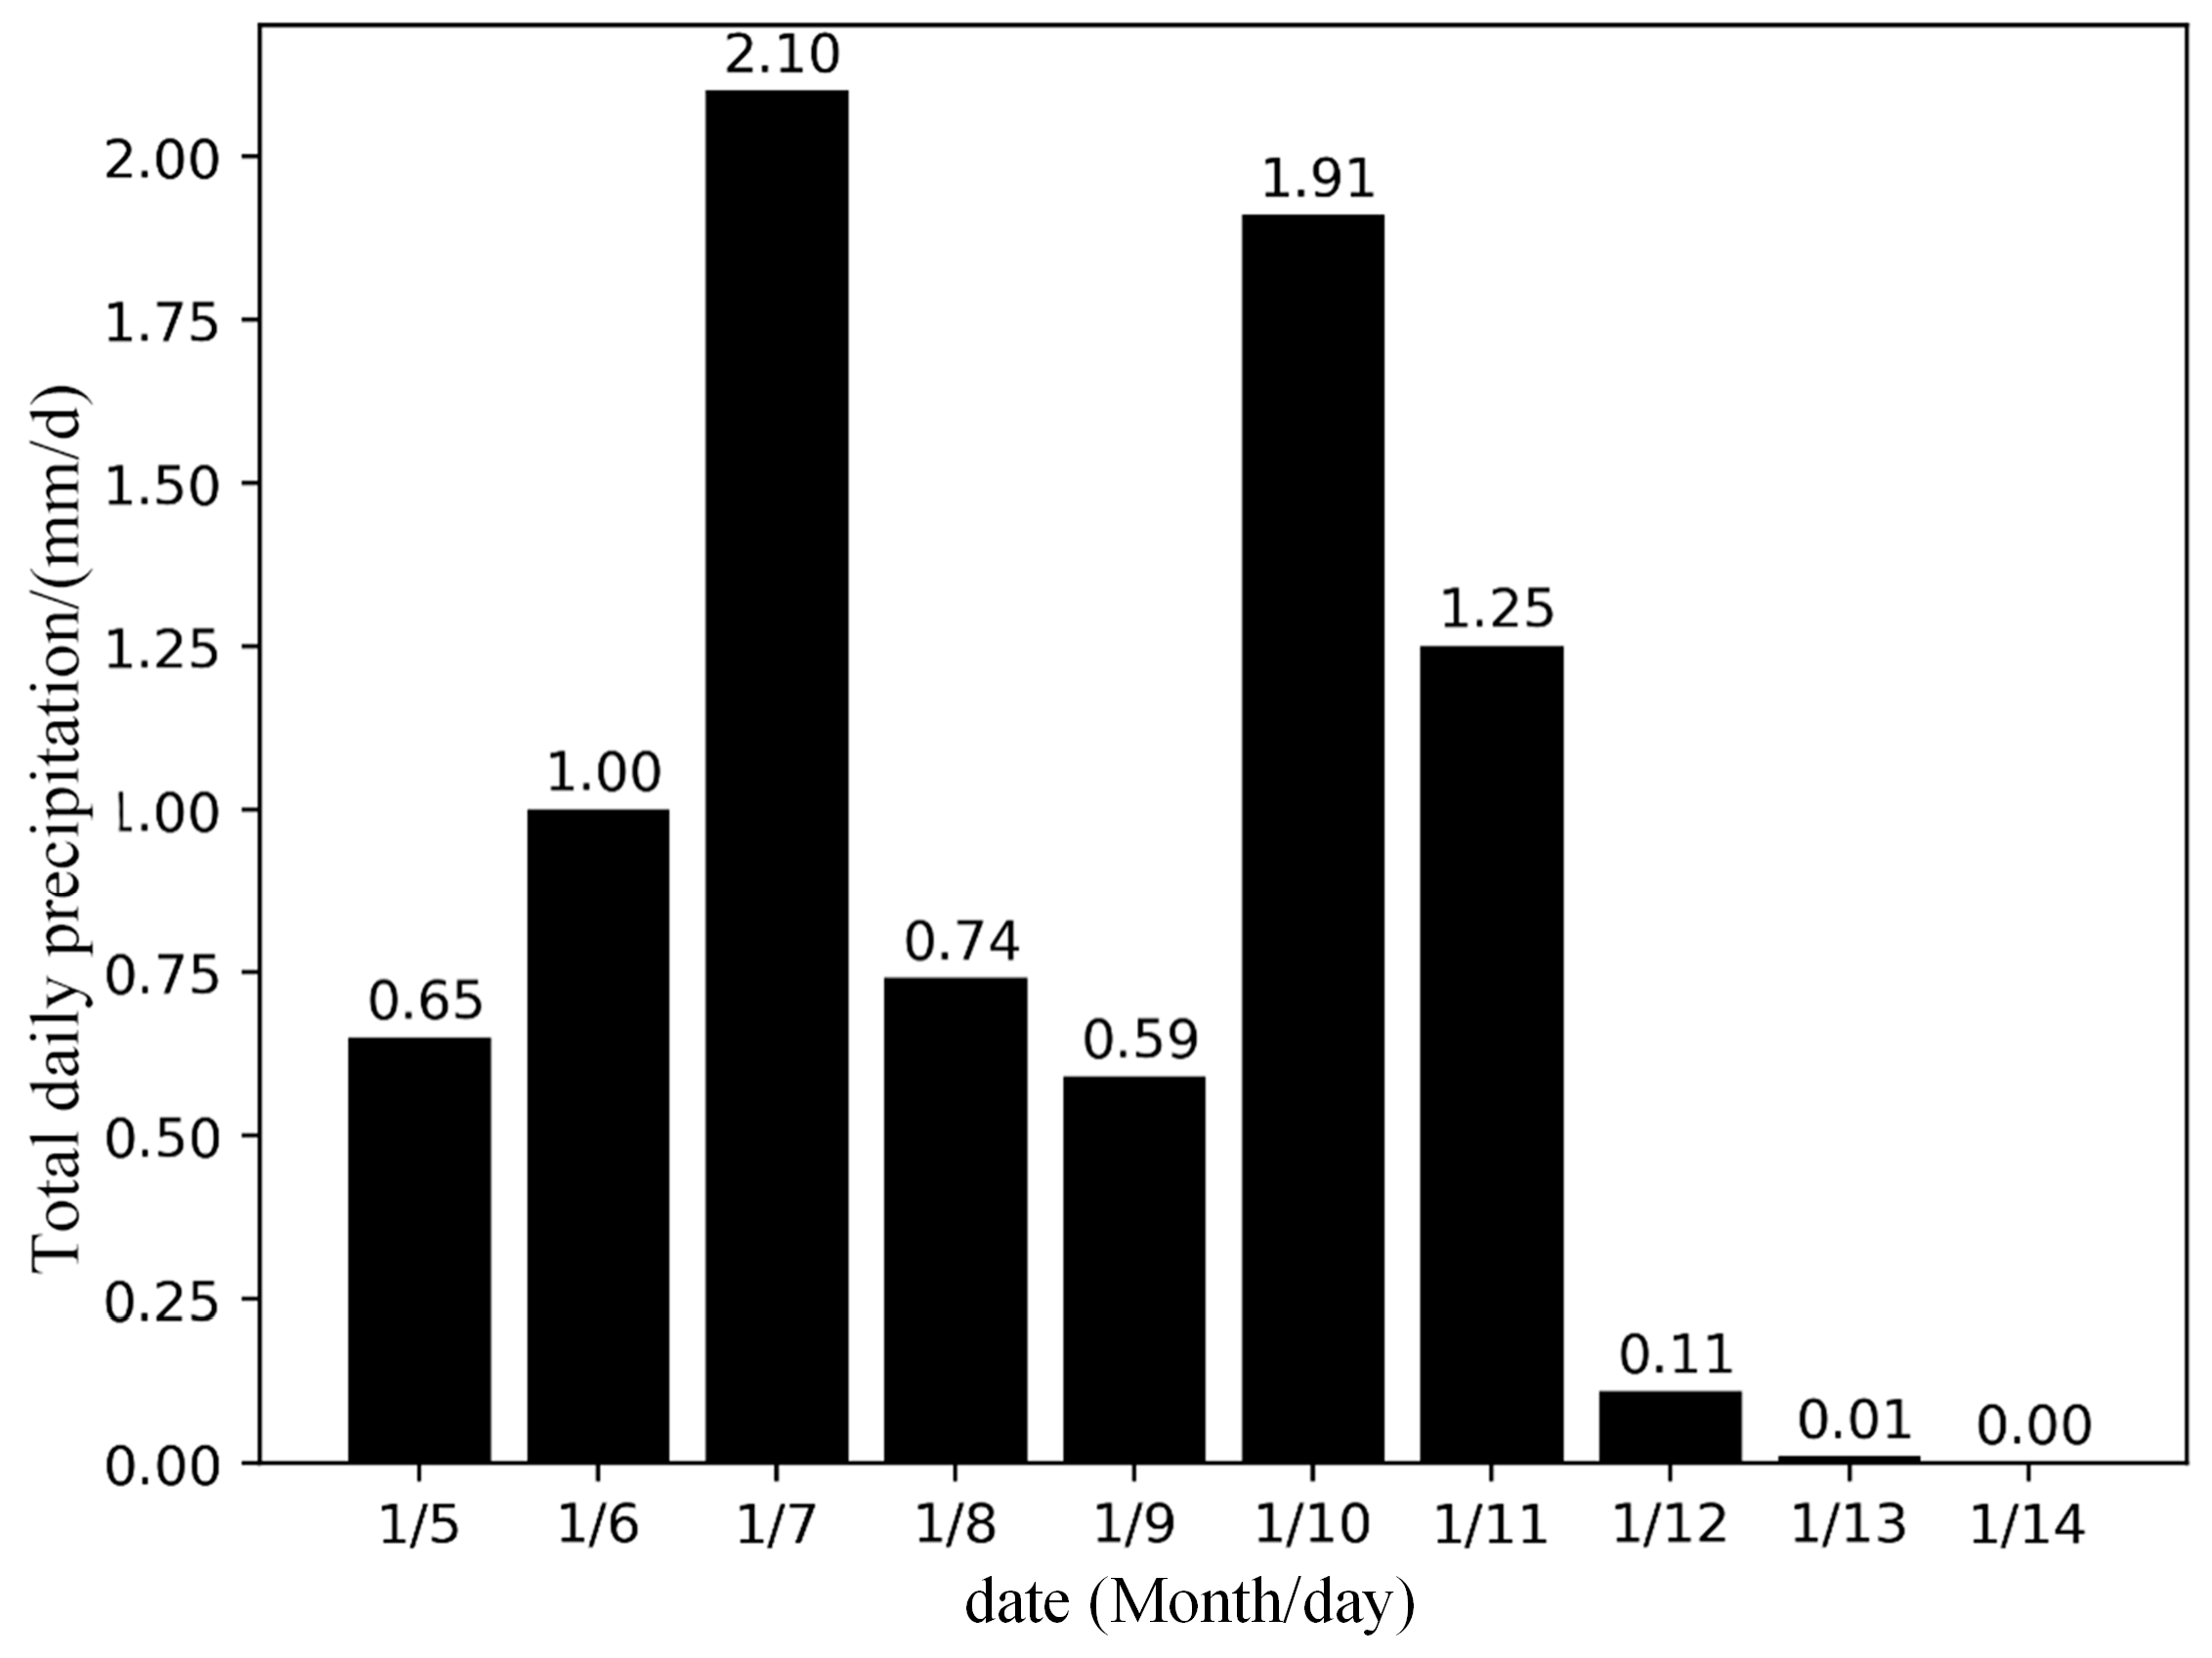
  • Local meteorological elements: From the perspective of temperature and water vapor flux, the second stage has lower temperatures, while the first stage has a higher water vapor flux directed towards the Qujing area. In the early stages of both icing phases, precipitation occurs. In high-altitude and cold mountain areas where the temperature is below 0 °C, due to the “warm–cold” temperature profile structure, cloud droplets collide and grow to form raindrops, and raindrops form supercooled raindrops in the cold layer, which is a typical freezing rain mechanism of “supercooled warm rain” at work. Supercooled raindrops condense into transparent or translucent ice on power lines.
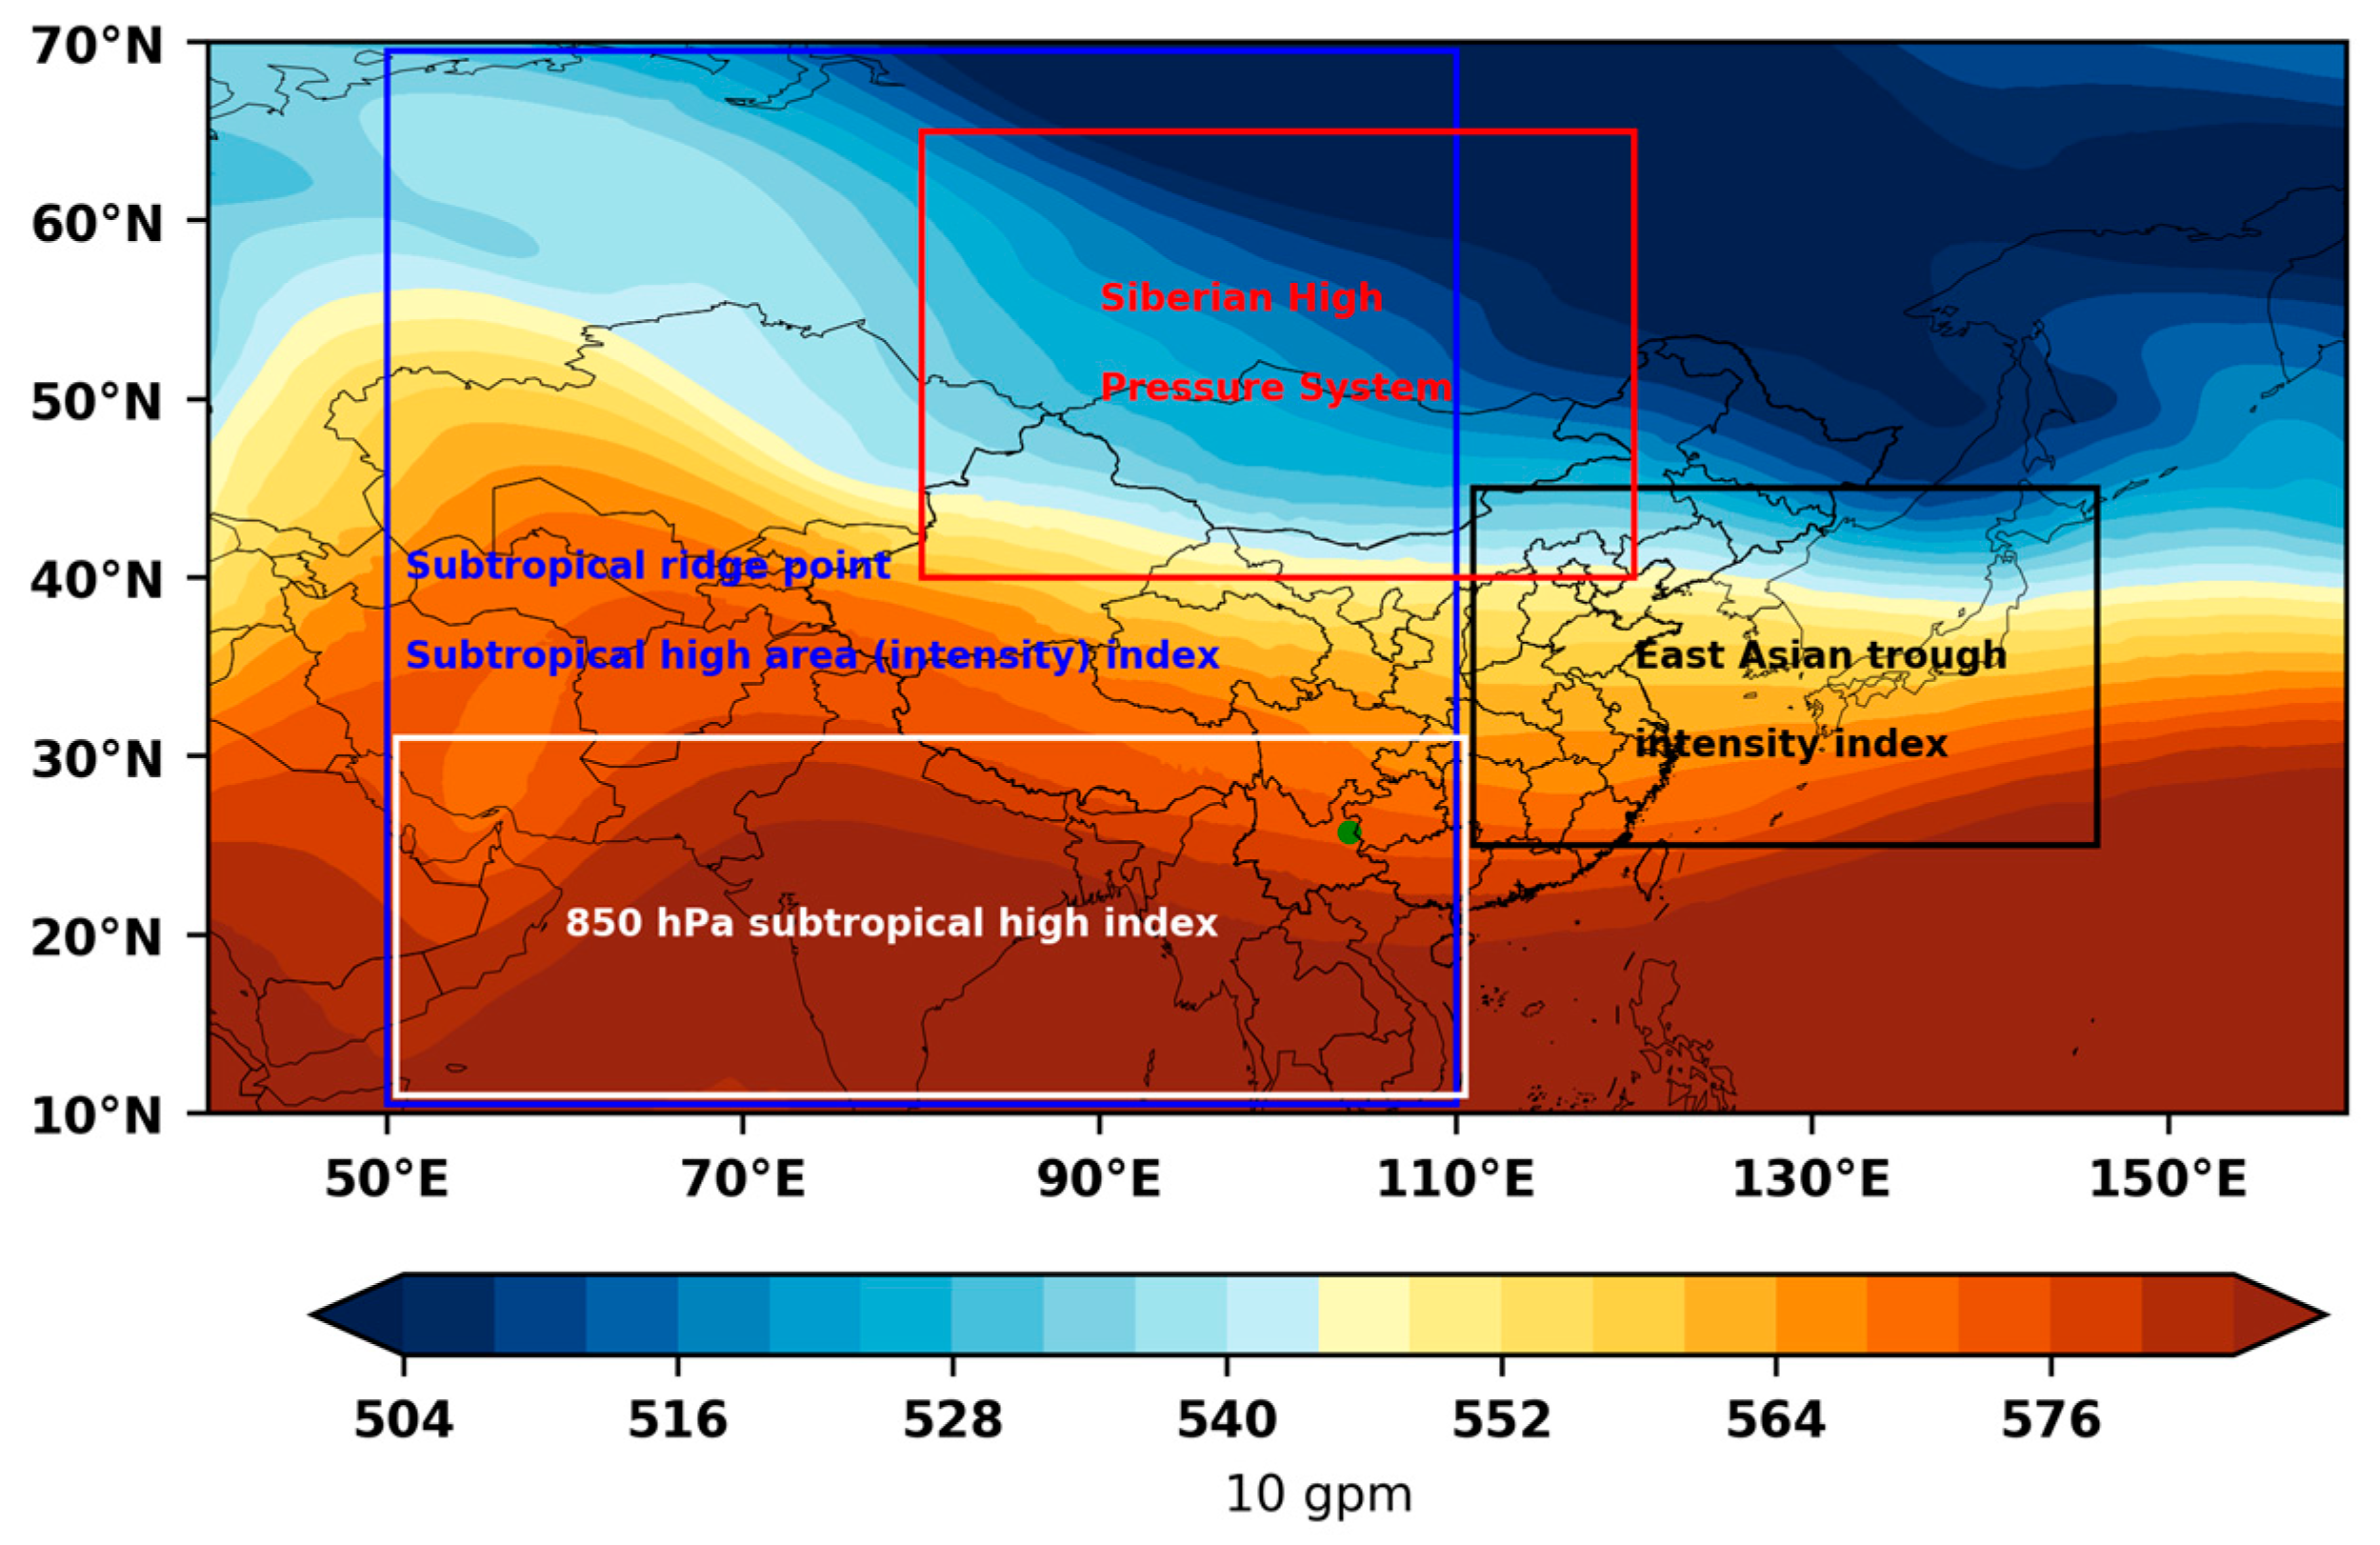
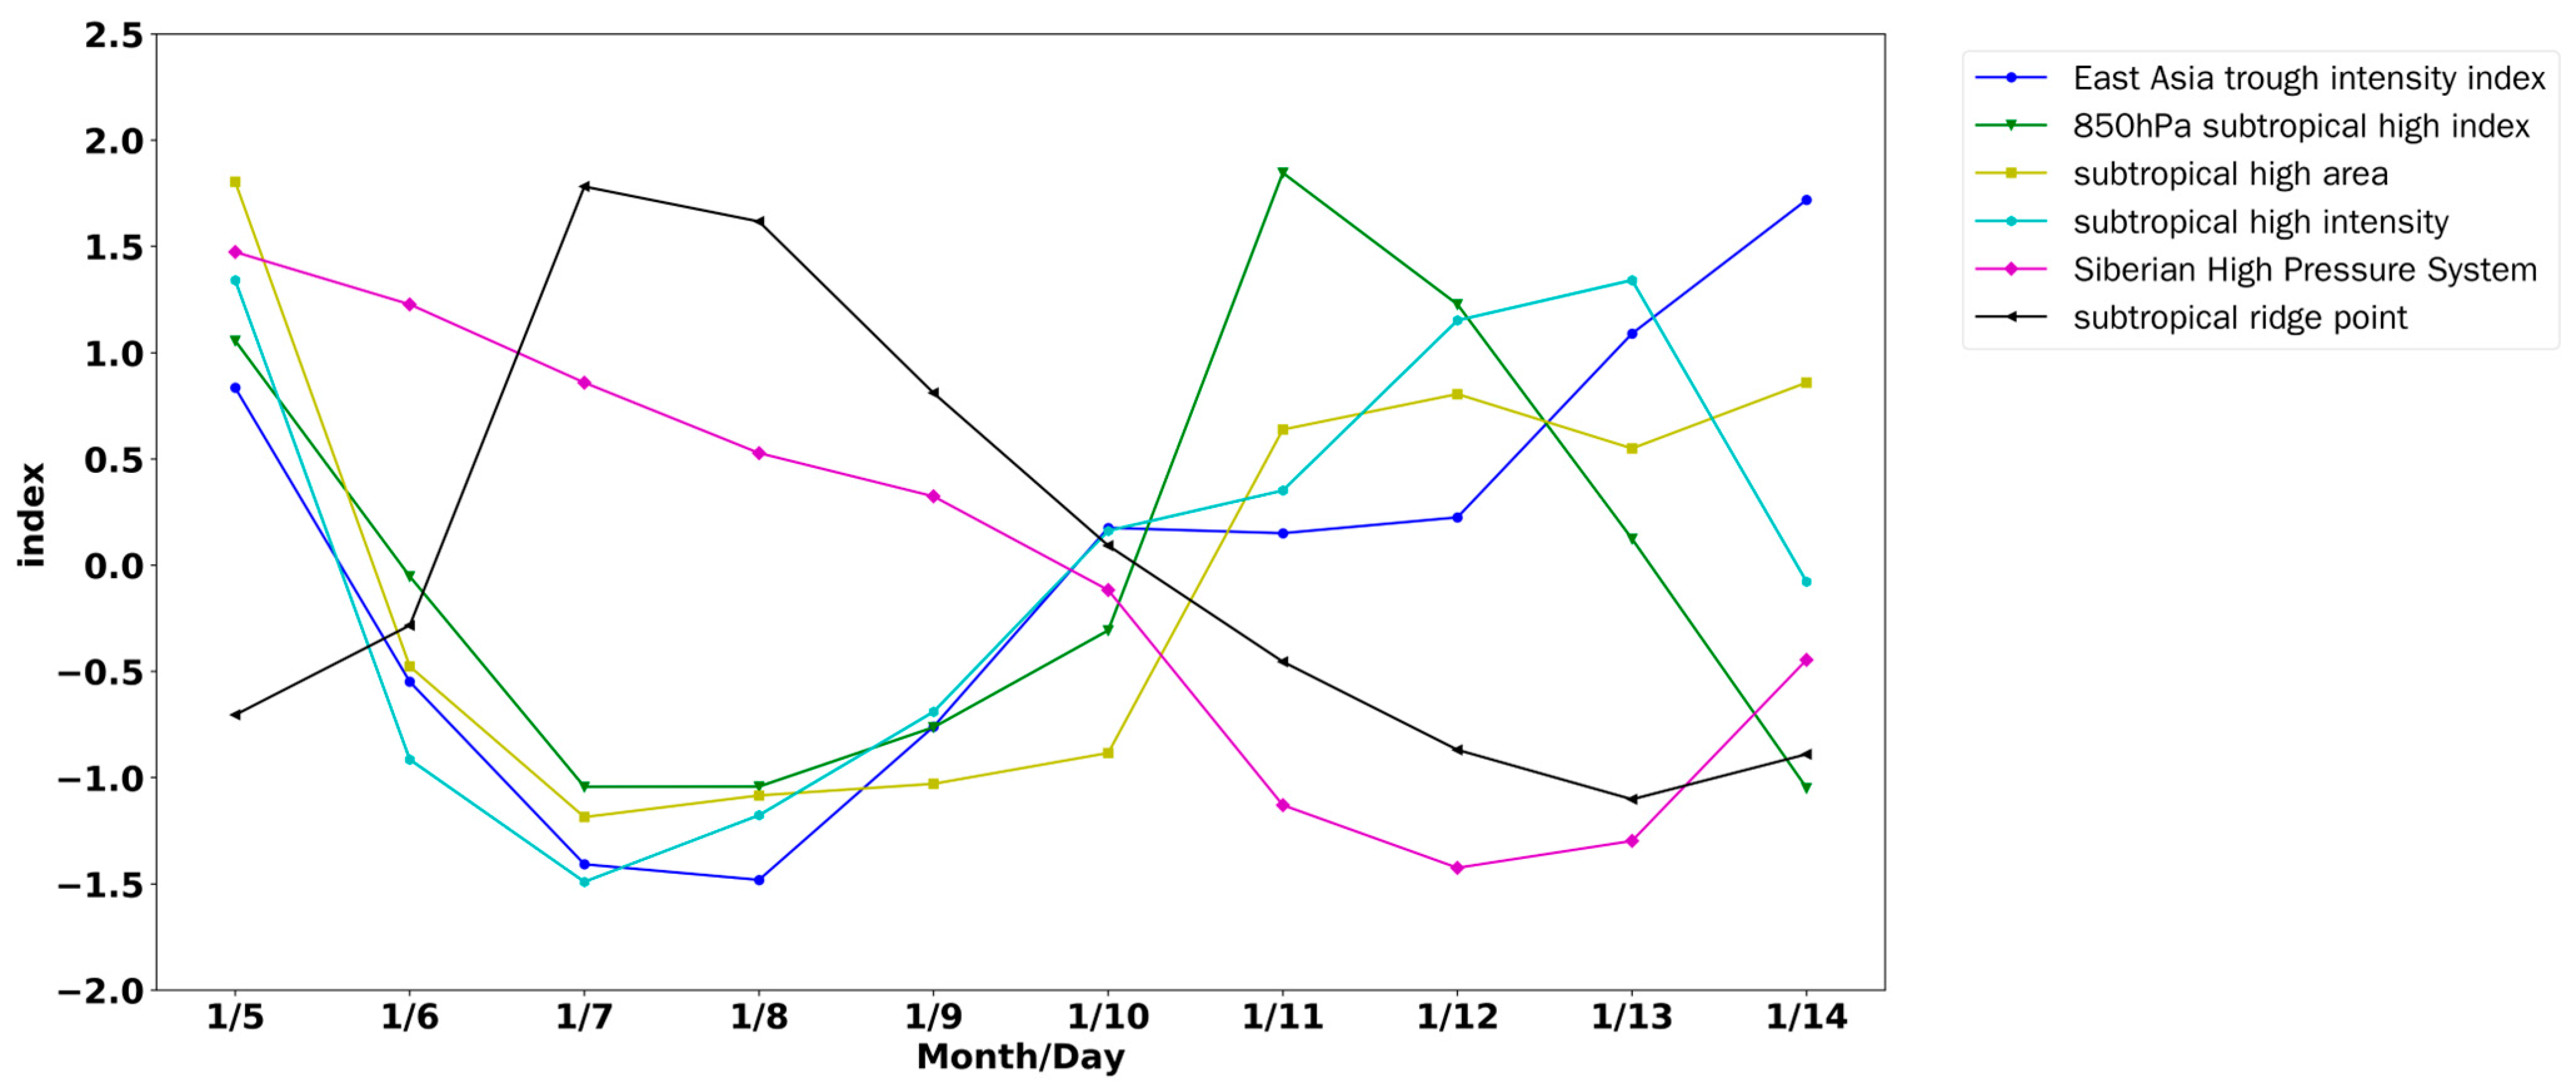
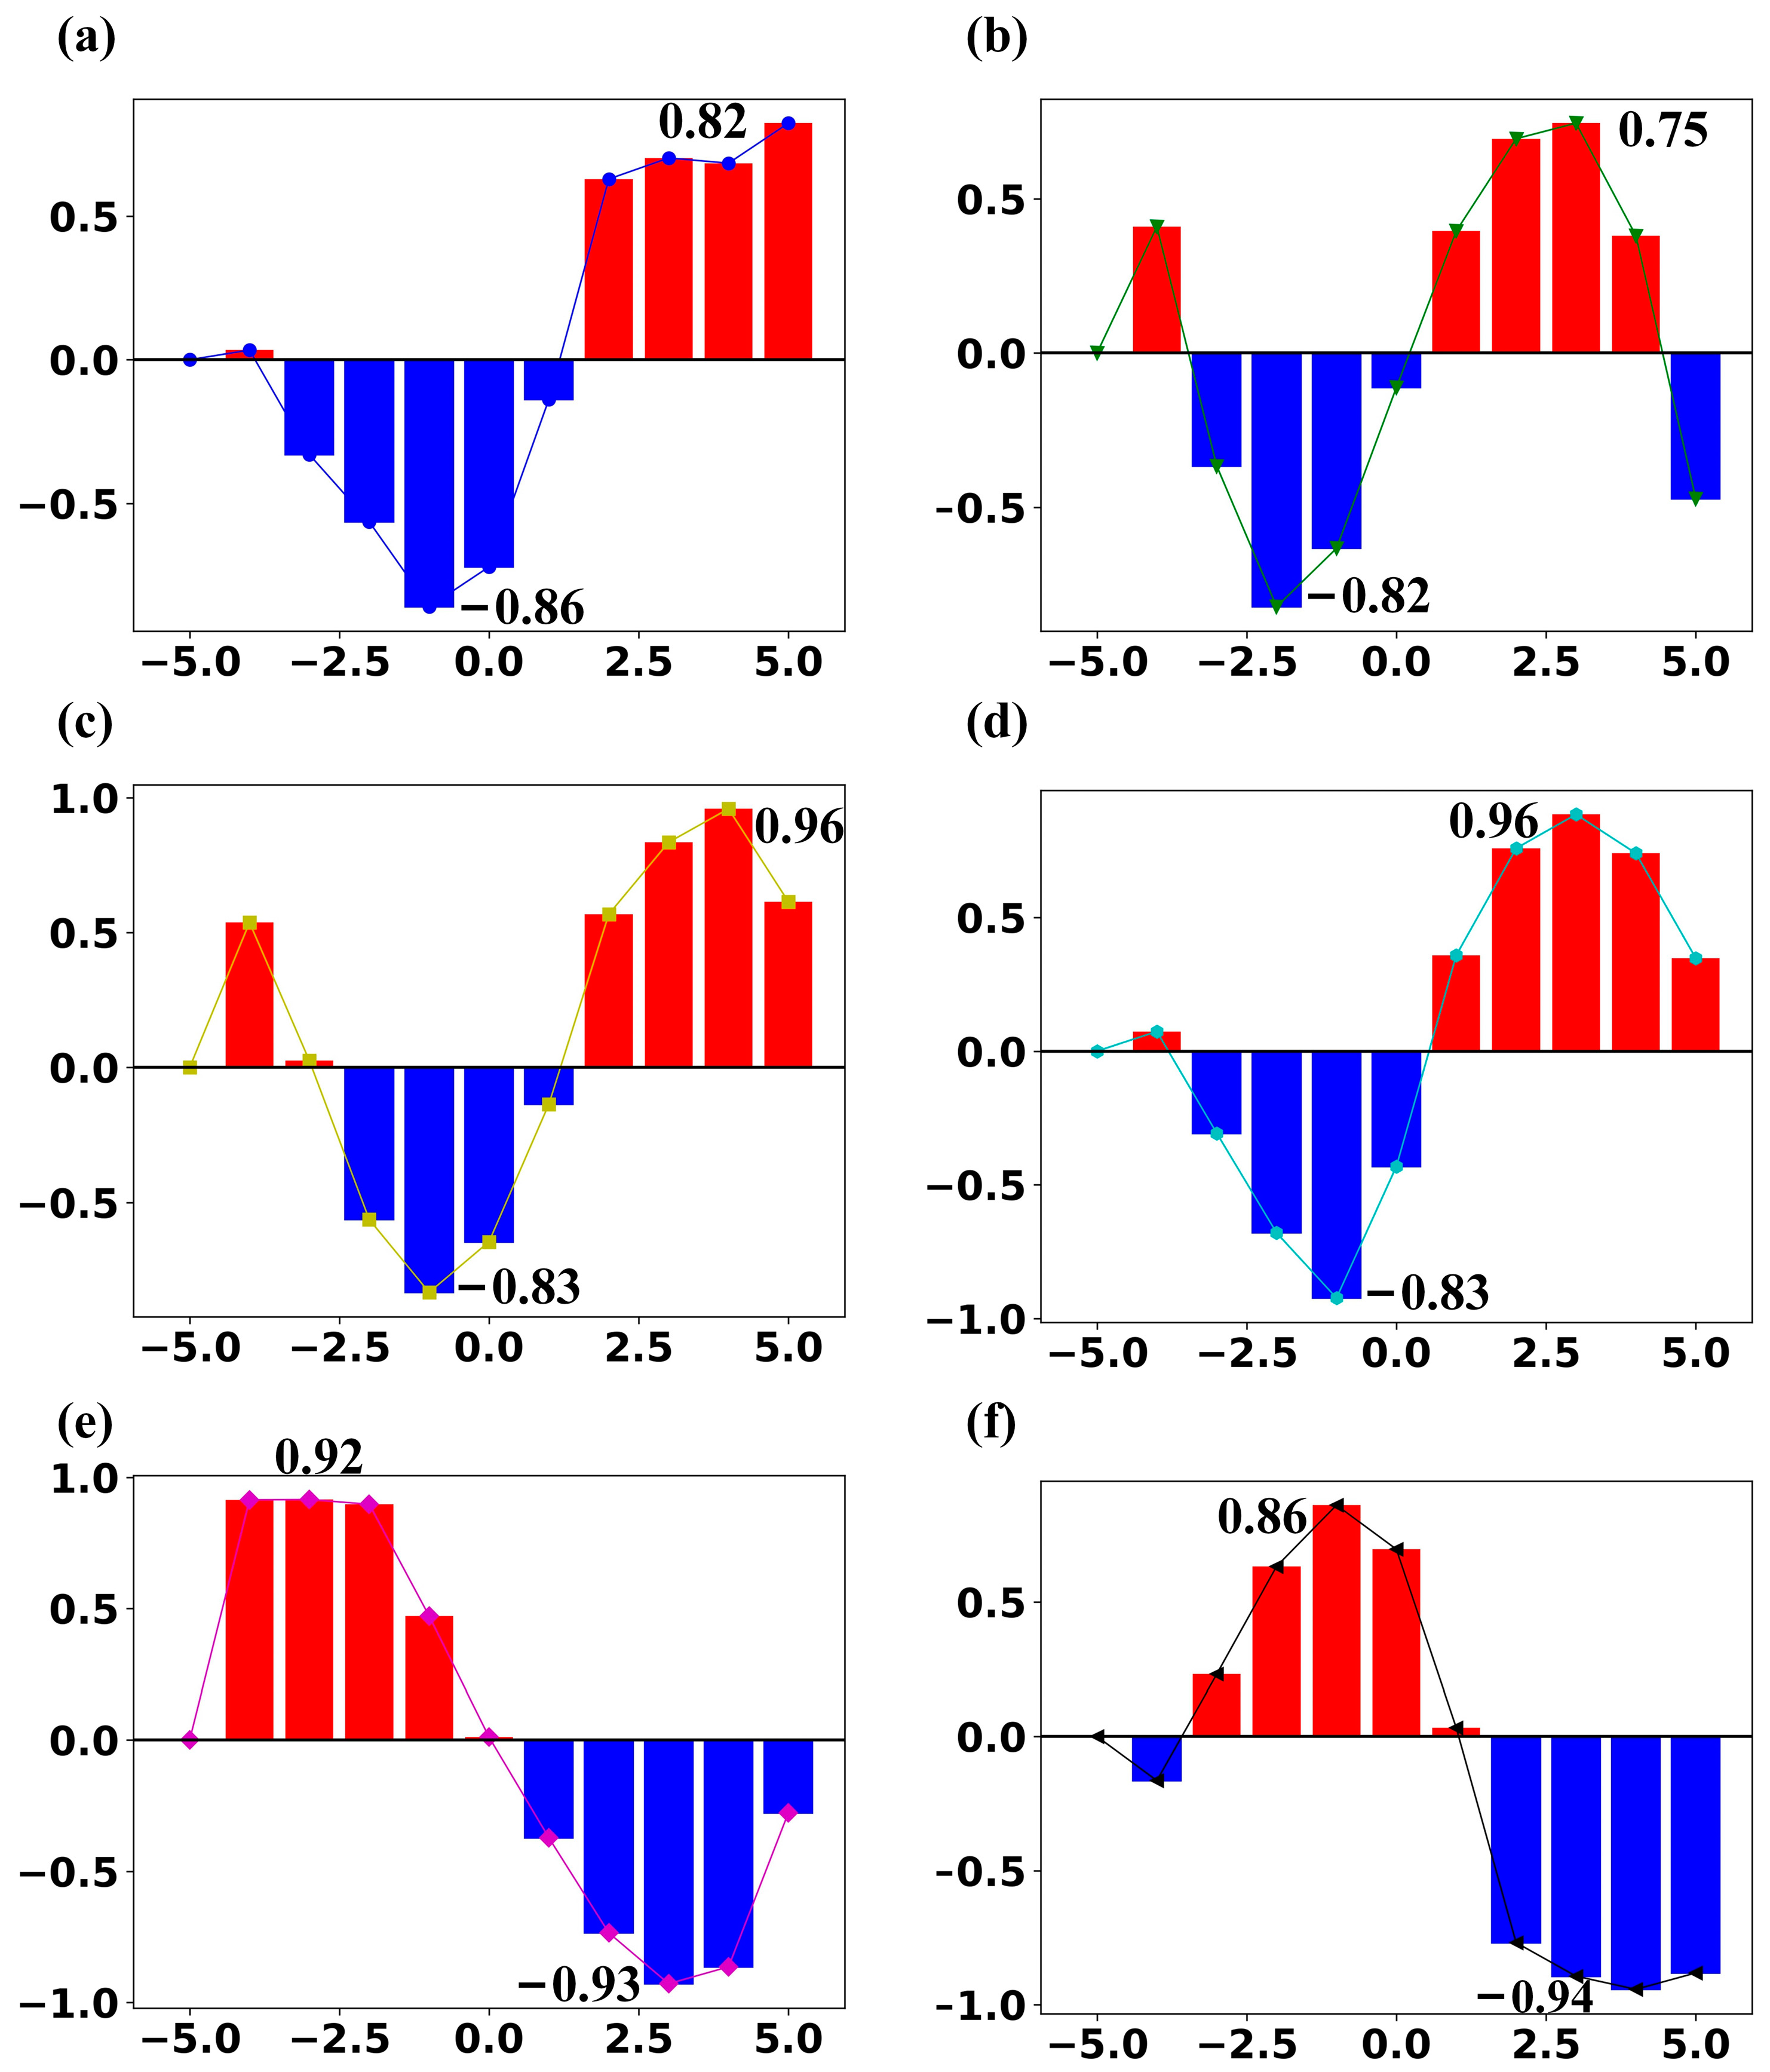
  • Atmospheric circulation indices: The intensity of cold air is characterized by the Siberian High Pressure Index and the East Asian Trough Index, and the intensity of warm and humid air is characterized by the Subtropical High Index. During the icing period, the Siberian High and East Asian Trough exhibited heightened intensity, while the Subtropical High also leaned toward being strong with an eastward bias. The large-scale circulation indices in the Siberian High, East Asian Trough, and 50–110° E Subtropical High regions provided clear precursor signals within 0–2 days before the icing events.
  • Comparison with the cause of the ice cover in Guangxi District in 2015: Although the driving factors for cold air were both influenced by the East Asian trough, there was one more cold vortex in the pre-formation period of the East Asian trough in January 2021. In January 2021, the moisture source for Yunnan’s Qujing region was mainly the oceanic moisture carried by the 50–110° E subtropical high, while in January 2015, the moisture source for the mountainous areas of Guilin, Guangxi, was mainly the oceanic moisture carried by the Western Pacific subtropical high. In addition, the mechanism of freezing rain in Guilin Plain and Qujing Plateau of Yunnan is also different, corresponding to the “melting” mechanism and “overcooling and warm rain” mechanism, respectively.
This paper initially explores ice-cover prediction using the case study of transmission line icing in the mountainous region of Qujing in 2021. In this study, the relationship between the atmospheric circulation index obtained from reanalysis data and the daily maximum ice thickness is primarily grounded in real-time observations. However, forecasting based on reanalysis data entails a time lag. Hence, future research will explore the utilization of multi-model ensemble forecast data to refine the association between forecasts and real conditions.

Author Contributions

Conceptualization, S.H.; methodology, S.H., Y.S. and H.H.; software, S.H. and S.Z.; validation, Y.H. and Z.G.; formal analysis, S.H.; investigation, Y.S. and H.H.; resources, S.H. and Y.H.; data curation, S.H. and Y.H.; writing—original draft preparation, S.H.; writing—review and editing, Y.S. and S.Z.; visualization, H.H. and Z.G.; supervision, S.H.; project administration, S.H., Y.S. and S.Z.; funding acquisition, Z.G. All authors have read and agreed to the published version of the manuscript.

Funding

This research has been supported by the second batch of service public bidding projects for EHV transmission companies in 2022 (2022-FW-2-ZB) (grant no. CG0100022001526556).

Institutional Review Board Statement

Not applicable.

Informed Consent Statement

Not applicable.

Data Availability Statement

The ERA5 data are available as a free-access repository from the Climate Data Store (CDS) at https://cds.climate.copernicus.eu/cdsapp#!/dataset/reanalysis-era5-pressure-levels?tab=overview (accessed on 27 January 2024).

Acknowledgments

The authors would like to thank Xingya Xi, Zexia Duan, and Bingcheng Wan for their help and discussions on the article illustrations. We are very grateful to two reviewers for their careful review and valuable comments, which led to substantial improvements in the paper.

Conflicts of Interest

Sen He, Yunhai Song, Heyan Huang, Yuhao He are employees of China Southern Power Grid Co., Ltd. Ultra High Voltage Transmission Company. The paper reflects the views of the scientists and not the company.

References

  1. Abbas, A.; Mushtaq, Z.; Ikram, A.; Yousaf, K.; Zhao, C. Assessing the Factors of Economic and Environmental Inefficiency of Sunflower Production in Pakistan: An Epsilon-Based Measure Model. Front. Environ. Sci. 2023, 11, 1186328. [Google Scholar] [CrossRef]
  2. Elahi, E.; Li, G.; Han, X.; Zhu, W.; Liu, Y.; Cheng, A.; Yang, Y. Decoupling Livestock and Poultry Pollution Emissions from Industrial Development: A Step towards Reducing Environmental Emissions. J. Environ. Manag. 2024, 350, 119654. [Google Scholar] [CrossRef] [PubMed]
  3. Abbas, A.; Zhao, C.; Ullah, W.; Ahmad, R.; Waseem, M.; Zhu, J. Towards Sustainable Farm Production System: A Case Study of Corn Farming. Sustainability 2021, 13, 9243. [Google Scholar] [CrossRef]
  4. Elahi, E.; Khalid, Z.; Zhang, Z. Understanding Farmers’ Intention and Willingness to Install Renewable Energy Technology: A Solution to Reduce the Environmental Emissions of Agriculture. Appl. Energy 2022, 309, 118459. [Google Scholar] [CrossRef]
  5. Wang, Q.; Zhang, H.; Zong, L.; Su, H.; Yang, Y.; Gao, Z. Synoptic cause of a continuous conductor icing event on ultra-high-voltage transmission lines in northern Guangxi in 2015. J. Trop. Meteorol. 2021, 37, 579–589. (In Chinese) [Google Scholar] [CrossRef]
  6. Dong, B.; Jiang, X.; Yin, F. Development and the prospect of monitoring and prevention methods of icing disaster in China power grid. IET Gener. Transm. Distrib. 2022, 16, 4480–4493. [Google Scholar] [CrossRef]
  7. Lu, Z. Optimization and Simulation of Parametric Scheme for Ice Covering of Conductors. Available online: https://kns.cnki.net/KCMS/detail/detail.aspx?dbname=CMFD201901&filename=1018140350.nh (accessed on 27 January 2024).
  8. Zhou, W.; Chan, J.C.L.; Chen, W.; Ling, J.; Pinto, J.G.; Shao, Y. Synoptic-scale controls of persistent low temperature and icy weather over southern China in January 2008. Mon. Weather. Rev. 2009, 137, 3978–3991. [Google Scholar] [CrossRef]
  9. Zhou, Y. Research on the Formation Mechanism of Ice-Covering in Power Lines: Observation and Simulation. Available online: https://xueshu.baidu.com/usercenter/paper/show?paperid=fcc9408a90deb833bc4244906fce92af&site=xueshu_se (accessed on 27 January 2024). (In Chinese).
  10. Sun, X.; Li, S.; Wang, J.X.; Yang, Y.; Chen, L. The Extended Period Precursory Signals of Strong Persistent Freezing Rain and Snow Events in Southwest China. Res. Sq. 2021, 20, 4–8. [Google Scholar] [CrossRef]
  11. Shi, Q.; Xue, Y.; He, L.; Pen, W. Comparative analysis of two cold wave processes from the end of December 2020 to the beginning of January 2021. Agric. Disaster Res. 2021, 11, 131–134. (In Chinese) [Google Scholar]
  12. Wen, J.; Jia, R.; Peng, Y. Observation and analysis of meteorological conditions for icing of wires in Guizhou, China. J. Geosci. Environ. Prot. 2019, 7, 214–230. [Google Scholar] [CrossRef]
  13. Chen, Q.; Li, Z.; Fan, G.; Zhu, K.; Zhang, W.; Zhu, H. Indications of stratospheric anomalies in the freezing rain and snow disaster in South China, 2008. Sci. China Earth Sci. 2011, 54, 1248–1256. [Google Scholar] [CrossRef]
  14. Tao, Y.; Wu, X.; Duan, X.; He, H.; Wang, M. Meteorological conditions of electric wire ice covering in northeast Yunnan Province in 2008. J. Catastrophology. 2009, 24, 82–86. Available online: https://xueshu.baidu.com/usercenter/paper/show?paperid=17660a60s5540r00d27k0er0k9323609&sc_from=pingtai4&cmd=paper_forward&wise=0 (accessed on 27 January 2024). (In Chinese).
  15. Han, Z.; Lv, H.; Liang, Z.; Yi, J. Transmission line icing thickness prediction model based on issa-cnn-lstm. J. Phys. Conf. Ser. 2023, 2588, 012020. (In Chinese) [Google Scholar] [CrossRef]
  16. Longji, L.; Xiaoguang, W.; Hao, W.; Guoyong, Z.; Yong, L.; Qiran, L. Micro-meteorological analysis and prediction for transmission lines in micro-geography environment. In Proceedings of the 16th IET International Conference on AC and DC Power Transmission (ACDC 2020), Online, 2–3 July 2020; Volume 2020, pp. 435–441. [Google Scholar] [CrossRef]
  17. Xu, X.; Niu, D.; Zhang, L.; Wang, Y.; Wang, K. Ice cover prediction of a power grid transmission line based on two-stage data processing and adaptive support vector machine optimized by genetic tabu search. Energies 2017, 10, 1862. [Google Scholar] [CrossRef]
  18. Li, T.; Shi, X.; Cao, N.; Gu, Z.; Zhao, S.; Huang, Y.; Liang, X. Combined prediction method of transmission line icing based on arima-cssvr. In Proceedings of the 2021 China International Conference on Electricity Distribution (CICED), Shanghai, China, 7–9 April 2021; pp. 63–69. [Google Scholar] [CrossRef]
  19. Wang, D.; Yue, J.; Li, J.; Xu, Z.; Zhao, W.; Zhu, R. Research on sag monitoring of ice-accreted transmission line arcs based on stereovision technique. Electr. Power Syst. Res. 2023, 225, 109794. [Google Scholar] [CrossRef]
  20. Stewart, R.E.; Thériault, J.M.; Henson, W. On the Characteristics of and Processes Producing Winter Precipitation Types near 0 °C. Bull. Am. Meteorol. Soc. 2015, 96, 623–639. [Google Scholar] [CrossRef]
  21. Lu, Z.; Han, Y.; Liu, Y. Improving the Ramer Scheme for Diagnosis of Freezing Rain in China. Atmos. Res. 2021, 254, 105520. [Google Scholar] [CrossRef]
  22. Panagiotopoulos, F.; Shahgedanova, M.; Hannachi, A.; Stephenson, D.B. Observed trends and teleconnections of the Siberian high: A recently declining center of action. J. Clim. 2005, 18, 1411–1422. [Google Scholar] [CrossRef]
  23. Xiong, S.; Yang, Y.; Wu, R.; Liu, Y.; Zhang, M.; Li, J.; Li, Y. Interannual and Interdecadal Variations of Haze Days and the Urban-rural Differences in the Middle Reaches of Yangtze River. Meteorol. Environ. Sci. 2020, 43, 33–40. (In Chinese) [Google Scholar] [CrossRef]
  24. Fang, D.; Bai, H.; Li, L.; Cao, Z. Review of winter freezing rain research in Guizhou. Guizhou Meteorol. 2020, 44, 19–26. Available online: https://xueshu.baidu.com/usercenter/paper/show?paperid=1a7n0ec0vf0e0e106s770rt0s9069337&site=xueshu_se (accessed on 27 January 2024). (In Chinese).
Figure 1. The probability distribution of the maximum ice thickness of transmission lines in Yunnan during the continuous icing process from 7 January to 13 January 2021.
Atmosphere 15 00389 g001
Figure 2. The rectangular region of the six atmospheric circulation indices was calculated. The green dot represents the areas where power transmission lines experienced icing (the colored plot is the 500 hPa potential height field at 8:00 a.m. on 14 January 2023).
Atmosphere 15 00389 g002
Figure 3. Time series plot of icing thickness, temperature, and humidity for pylons A-H from 7 January to 13 January 2021. (The vertical downward phase of the curve corresponds to the rapid melting of the icing caused by the high-voltage company’s direct current de-icing operation on the towers).
Atmosphere 15 00389 g003
Figure 4. The 500 hPa large-scale circulation pattern (daily 8:00 A.M. from 5 January to 14 January 2023). The green dots represent the areas where power transmission lines experienced icing, and the brown solid lines represent the locations of low-pressure troughs. “H” represents high-pressure centers, “L” represents low-pressure centers, and “T” represents troughs.
Atmosphere 15 00389 g004
Figure 5. The 750 hPa large-scale circulation situation field ((aj) represent 8:00 A.M. each day from 5 January to 14 January 2023, respectively). Contours are potential height fields, filled colors are temperature fields, and vector fields are water vapor fluxes. The black filled areas represent the Tibetan Plateau.
Atmosphere 15 00389 g005
Figure 6. Time series of temperature vertical profiles.
Atmosphere 15 00389 g006
Figure 7. Time series of relative humidity vertical profiles.
Atmosphere 15 00389 g007
Figure 8. Transport of water vapor flux at 750 hPa.
Atmosphere 15 00389 g008
Figure 9. Daily total precipitation in the area (the latitude is from 25.7 to 26.0° N and the longitude is from 103.3 to 104.4° E) of the eight pylons.
Atmosphere 15 00389 g009
Figure 10. The latitudinal temperature (a) and humidity (b) vertical profiles on 9 January at 08:00 during the first stage (longitude is 104° E).
Atmosphere 15 00389 g010
Figure 11. The latitudinal temperature (a) and humidity (b) vertical profiles on 11 January at 03:00 during the second stage (longitude is 104° E).
Atmosphere 15 00389 g011
Figure 12. Standardization of daily average value of selected atmospheric circulation indices during the icing process (The time point on the horizontal axis represents 08:00 a.m. on one day to 07:00 a.m. the next day).
Atmosphere 15 00389 g012
Figure 13. Leading and lagging correlation coefficients of average daily variation and maximum daily ice cover thickness of each circulation index. The negative (positive) abscissa indicates the number of days leading (lagging), and the ordinate indicates the correlation coefficient. The negative (positive) delay on the horizontal axis represents the leading (lagging) correlation between the daily mean circulation index and the daily maximum ice cover thickness ((a) represents East Asia trough intensity index, (b) represents 850hPa subtropical high index, (c) represents subtropical high area, (d) represents subtropical high intensity, (e) represents Siberian High Pressure System, and (f) represents subtropical ridge point.).
Atmosphere 15 00389 g013
Table 1. Overview of the two maximum icing values for pylons A–H during this icing event.
PylonTime (UTC+8)Maximum Icing Thickness/mmTemperature/°CHumidity/%
A2021-01-09 06:13:1726.44−5.7098
2021-01-11 00:54:0727.61−8.0097
B2021-01-08 16:30:0611.71−4.1097
2021-01-11 03:34:1511.21−9.1094
C2021-01-09 02:02:3525.23−5.5099
2021-01-10 07:33:476.58−7.0098
D2021-01-09 02:00:2626.25−5.4097
2021-01-11 03:54:1623.85−7.9096
E2021-01-09 13:03:2431.52−3.10100
2021-01-11 03:54:1919.63−8.3097
F2021-01-09 02:00:2012.07−6.2098
2021-01-11 03:54:2014.17−7.8097
G2021-01-09 10:43:2122.16−6.5098
2021-01-11 10:04:2417.04−9.1096
H2021-01-09 10:43:2212.72−6.1099
2021-01-11 11:24:278.58−7.7098
Disclaimer/Publisher’s Note: The statements, opinions and data contained in all publications are solely those of the individual author(s) and contributor(s) and not of MDPI and/or the editor(s). MDPI and/or the editor(s) disclaim responsibility for any injury to people or property resulting from any ideas, methods, instructions or products referred to in the content.

