Article

Carbon Sequestration Potential of Agroforestry versus Adjoining Forests at Different Altitudes in the Garhwal Himalayas

1
Department of Forestry, College of Forestry, Veer Chandra Singh Garhwali Uttarakhand University of Horticulture and Forestry, Ranichauri 249199, Uttarakhand, India
2
GeoBioTec Research Centre, Department of Geosciences, University of Aveiro, 3810-193 Aveiro, Portugal
3
Department of Forestry and Natural Resources, HNB Garhwal University, Srinagar 246174, Uttarakhand, India
*
Authors to whom correspondence should be addressed.
Atmosphere 2024, 15(3), 313; https://doi.org/10.3390/atmos15030313
Submission received: 6 January 2024 / Revised: 16 February 2024 / Accepted: 28 February 2024 / Published: 1 March 2024

Abstract

:
Forests face a variety of threats in the modern era. Agroforestry systems, both traditional and introduced, have a tremendous capacity for providing sustainable resources and combating the impact of global climate change. Indigenous agroforestry and forest land-use systems are important reservoirs for biodiversity conservation and ecosystem services, providing a potential contribution to livelihood security for rural communities. This study aimed to assess the tree diversity and carbon stock of agroforestry and adjoining forests along altitudinal gradients, ranging between 700 and 2200 masl (i.e., lower, middle, and upper altitudes) by laying sample plots randomly of a size of 20 × 20 m2. In the forest land-use system, the maximum Importance Value Index (IVI) included Dalbergia sissoo (71.10), Pyrus pashia (76.78), and Pinus roxburghii (79.69) at the upper, middle, and lower elevations, respectively, whereas, in the agroforestry land-use system, the IVI reported for Ficus semicordata was 43.05 at the upper, while for Grewia optiva it was at 53.82 at the middle and 59.33 at the lower altitudes. The below-ground biomass density (AGBD) was recorded as 1023.48 t ha−1 (lower), 242.92 t ha−1 (middle), and 1099.35 t ha−1(upper), while in the agroforestry land-use system, the AGBD was 353.48 t ha−1 (lower), 404.32 t ha−1 (middle), and 373.23 t ha−1 (upper). The total carbon density (TCD) values recorded were 630.57, 167.32, and 784.00 t ha−1 in forest land-use systems, and 227.46, 343.23, and 252.47 in agroforestry land-use systems for lower, middle, and upper altitudes, respectively. The Margalef’s Index values for agroforestry and forests ranged from 2.39 to 2.85 and 1.12 to 1.30, respectively. Soil organic carbon (SOC) stock recorded 45.32, 58.92, and 51.13 Mg C ha−1 for agroforestry and 61.73, 42.65, and 71.08 Mg C ha−1 for forest in lower, middle and upper elevations, respectively. The study suggests that selecting land use patterns can be an effective management system for tree species at different elevations for carbon storage, helping to mitigate climate change and aiding in sustainable management of ecosystems in the Garhwal Himalayas.

1. Introduction

A recent report has suggested that the CO2 in the atmosphere is about 421 ppm. In the middle of the 20th century, human activity was the main driver of climate change in the landscape, continuing to increase in 2020 and 2021 despite a 5.6% reduction in fossil fuel CO2 emissions due to the COVID-19 pandemic restrictions [1]. Global estimates show that land use interventions reduce emissions by approximately 30% through the carbon sequestration process and are necessary to meet the carbon reduction target set at the COP-25 meeting [2].
A forest ecosystem is dominated by perennial vegetation, with higher carbon stocks playing a crucial role in the carbon cycle and helping to mitigate climate change [3,4]. However, the rapid growth of urbanization and anthropogenic activities has lead to deforestation, land use change, loss of biodiversity, and forest degradation [5,6]. The contribution of trees to improving livelihoods and providing ecosystem services cannot be ignored, and management of resources through agroforestry can provide a nature-based solution to synergize adaptation and mitigation strategies to meet forest-based needs [6]. Agroforestry has been proposed as a global solution to improving land use by reducing environmental impacts and financial risks for farmers [5]. Adoption of agroforestry techniques depends on the edaphic climate, socio-economic status and needs of farmers, as well as the physical, demographic, and institutional factors affecting management [7]. Agroforestry is a unique and very common practice in the Central Western Himalayan region of Uttarakhand, India. The trees in agroforestry are designed to enhance the grower’s demand to achieve their diverse needs, such as fodder, fuel, fiber, fruits, small timber, farming tools, etc., along with agricultural produce [8,9,10]. Agroforestry systems are vital reservoirs of biodiversity and ecosystem services, providing a potential contribution to the preservation of biodiversity and supporting livelihoods [11,12,13,14]. The rise in concentrations of greenhouse gases (GHGs), particularly carbon dioxide (CO2), and investigating ways and strategies to mitigate atmospheric carbon (C) could be a critical challenge for the global community [15,16,17,18]; therefore, the more mitigation measures undertaken to promote the natural regeneration capability of natural vegetation, the better the resilience of the earth’s ecosystem [19].
Agroforestry can be an effective measure of adaptation to climate change. Climate change negatively impacts agroforestry systems by reducing tree growth, productivity, and distribution, which can lead to adverse effects on crop yields and food security [13,14]. However, agroforestry can offer a suitable measure for adaptation to climate change by providing ecosystem services such as micro-climate buffering. Several studies have been conducted to examine the impact of climate change on agroforestry and the potential effects of agroforestry practices on climate change mitigation and adaptation strategies. Some of the latest research papers on this topic include “Climate Change Adaptation through Agroforestry: Opportunities and Gaps” [20], “Impacts of Climate Change on Tropical Agroforestry Systems: A Systematic Review for Identifying Future Research Priorities” [21], “Agroforestry and Climate Change: Issues, Challenges, and the Way Forward” [22],“Potential Effects of Agroforestry Practices on Climate Change Mitigation and Adaptation Strategies: A Review” [23], and “Climate Change Impacts, Agroforestry Adaptation and Policy Environment in Sri Lanka [24]. This study hypothesized that carbon sequestration potential between agroforestry and adjoining forest land-use systems vary with altitudes. To understand the hypothesis, the following objectives were selected for the study: (1) To assess the carbon sequestration potential of agroforestry and adjacent forest land-use systems at different altitudes. (2) To examine the species composition and species diversity of agroforestry and adjacent forests.

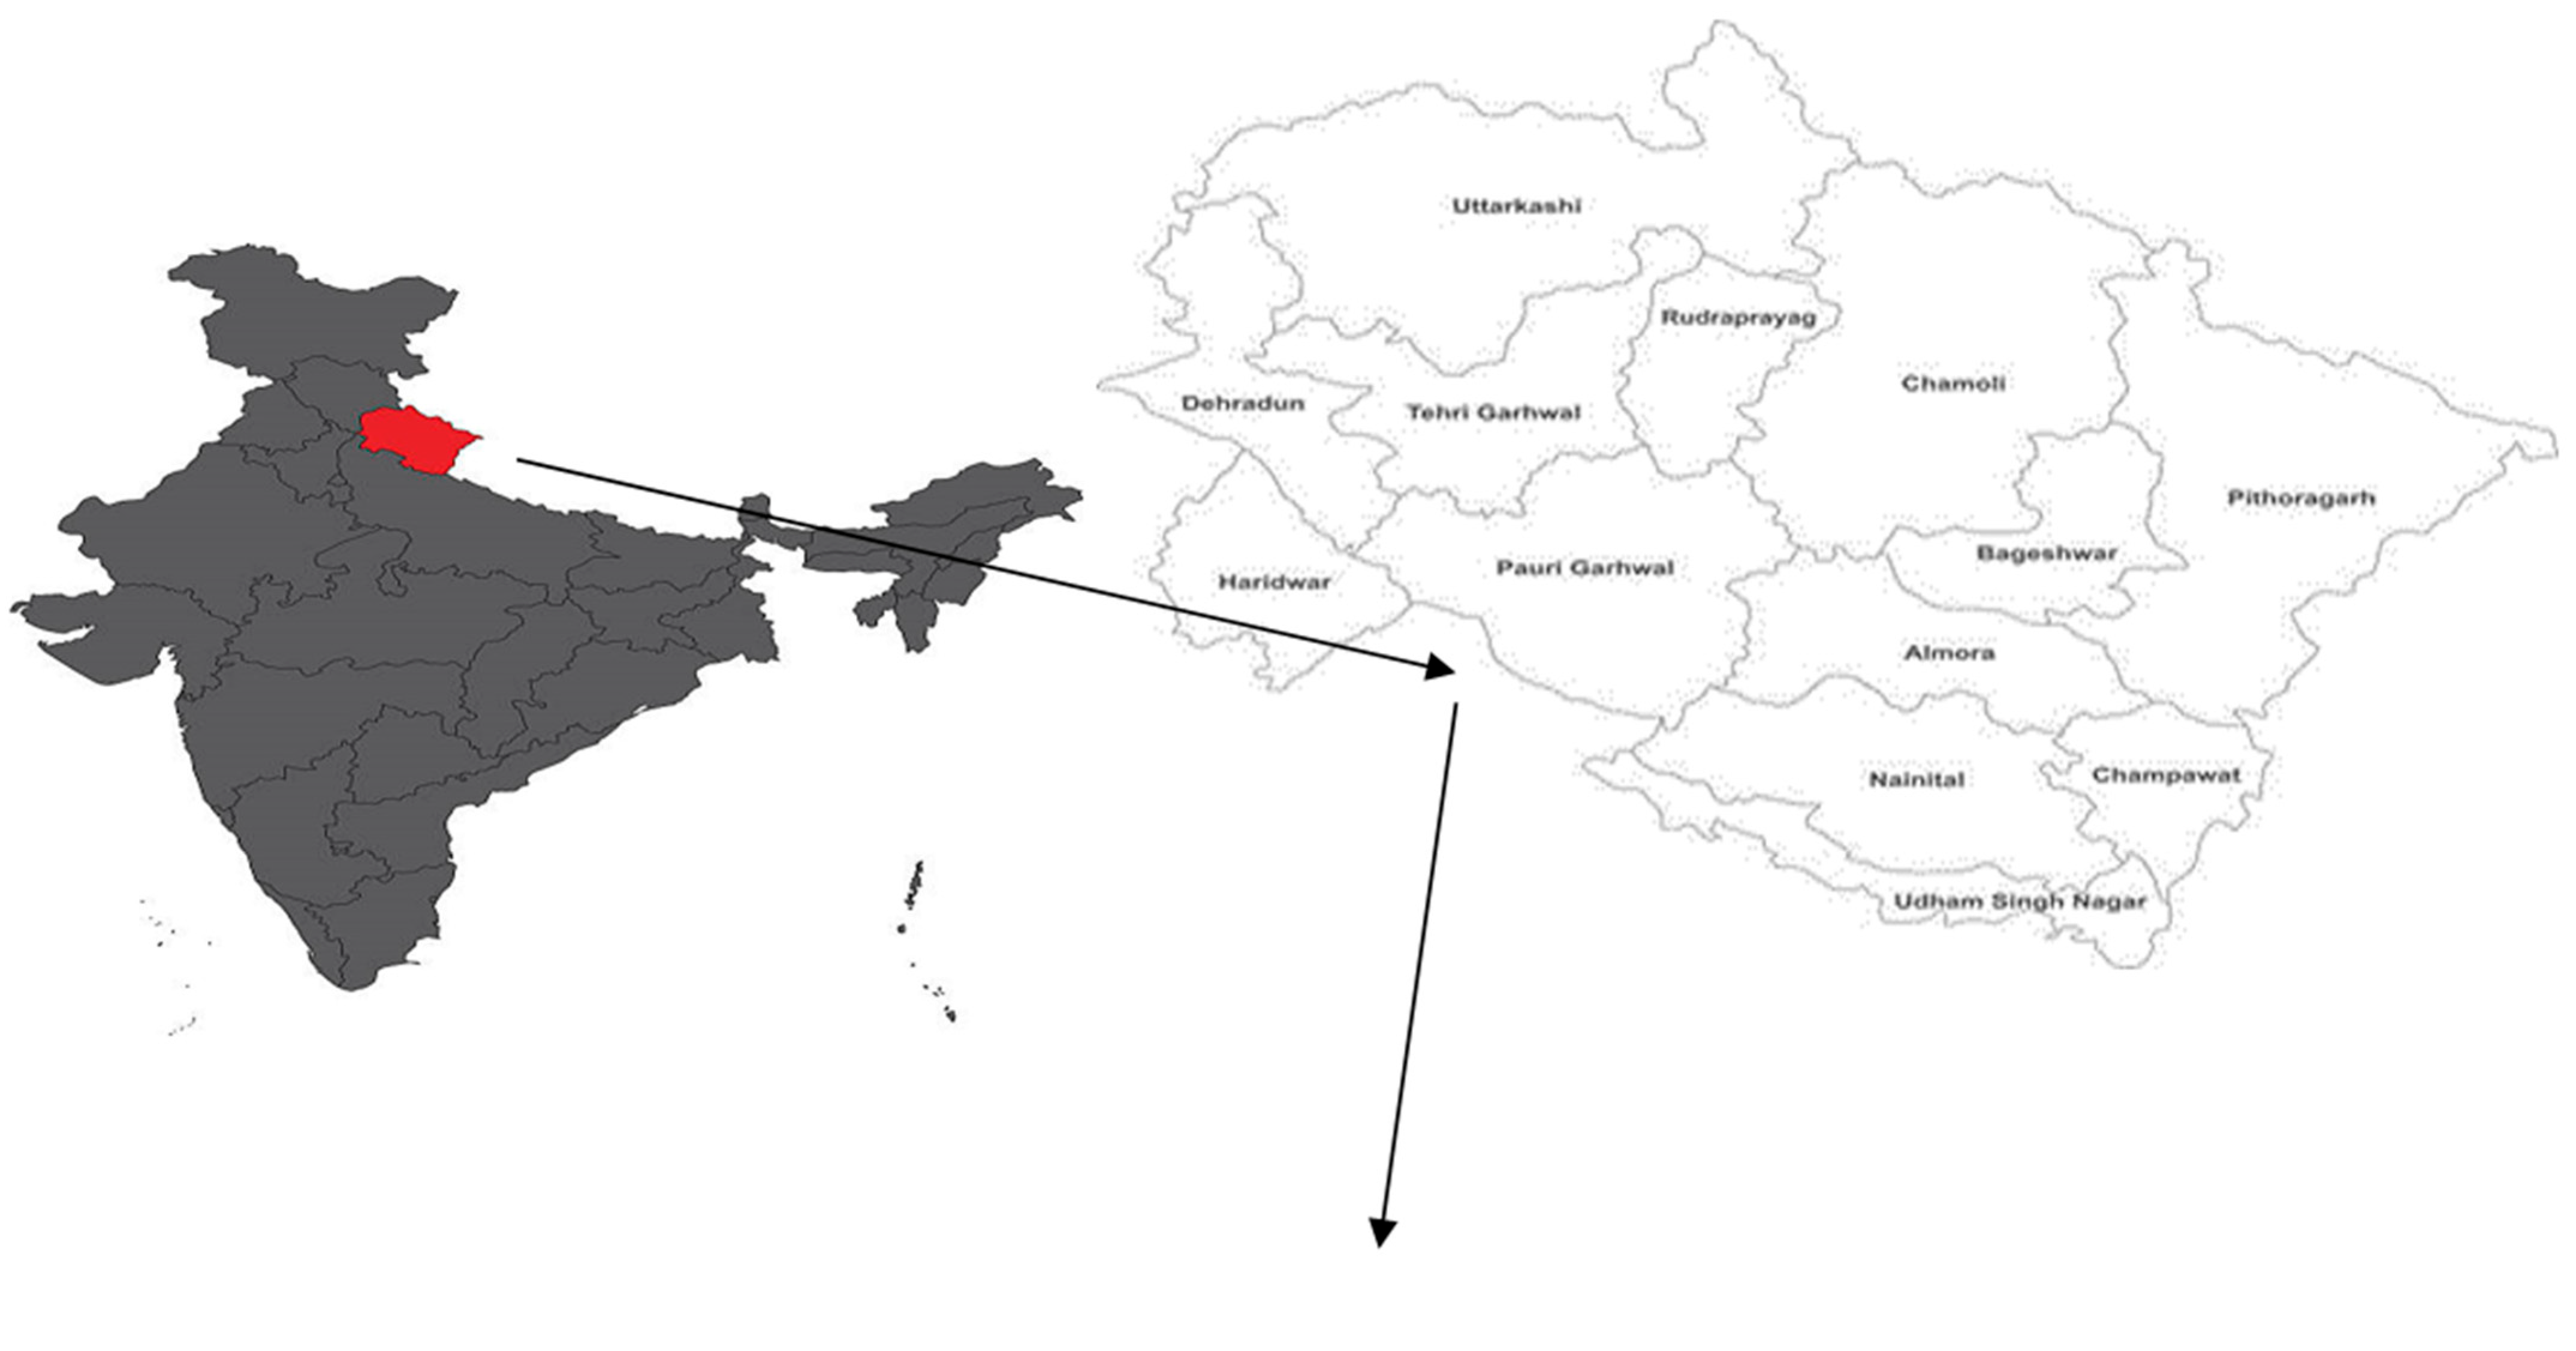
2. Materials and Methods

The study aimed to assess the tree species composition, diversity, and carbon stocks by laying out sample plots (20 × 20 m2) randomly in agroforestry and forest land-use systems in an altitudinal gradient ranging from 700 to 2200masl. Sample plots were taken based on stratified random sampling at each site to collect the data between the altitudinal gradients. Three altitudes were selected for the study: Lower altitudes (700–1200 m), middle altitudes (1200–1700 m), and upper altitudes (1700–2200 m). The geographic coordinates and elevation of each village (Table 1) were recorded using GPS (eTrex Vista, Garmin, Olathe, KS, USA).
The average annual rainfall of the study region (Figure 1) ranges from 956 to 2449 mm. This mid-hill area of study experiences a moderate climate, and the temperature ranges from 12 to 13 °C. The mountain soil of this region is Typic Udorthents under the soil order of Entisol. The soil of the study area was sandy loam in texture, with moderate depth and slightly stony in general. The fertility status of soils in this area varies based on humus content and pertinent parental material. The soils of the Tehri Garhwal district were recorded with a wide variation in pH, ranging from acidic to slightly alkaline. In terms of the nutrient index, the soils of this district are largely medium for extractable N but high for other primary, secondary, and micronutrients like P, K, Ca, Mg, S, Zn, Cu, Fe, Mn, B, and Mo. The deficiencies of K, Ca, S, Zn, Fe, Mn, and Mo were recorded also in various blocks [25].

3. Methodology Adopted

3.1. Diversity

The study was carried out in traditional agroforestry systems and nearby forest areas close to the selected villages. Ten sample plots, sized 20 × 20 m2 (0.04 ha), were laid down in each system for the estimating parameters of frequency, density, and abundance [26,27]. The percentage values of the relative density, relative frequency, and relative dominance were summed up for the Importance Value Index (IVI) [28] to determine the dominance of trees. Margalef’s index of richness, Menhinick’s index of species richness, and Simpson’s diversity index were determined, as described by [29,30,31].

3.2. Carbon Sequestration

A total of 10 quadrates, each of a size of 0.04 ha (20 × 20 m2), were established to understand the carbon stock assessment of tree species in the agroforestry and forest areas. The height and diameter at breast height (dbh) of all individuals within the sample plots were measured [32] and used to estimate carbon density. Above-ground biomass was estimated based on total growing stand density (GSVD) using volume equations as described in Table 2 [33,34]. The estimated GSVD (m3 ha−1) was then converted into above-ground biomass density (AGBD), which was calculated by multiplying the GSVD of the forest with the appropriate biomass expansion factor (BEF) [35]. Below-ground biomass density (BGBD) was calculated using the regression equations [36]. The BGBD (from fine and coarse roots) was estimated for different tree species using the following equation:
BGBD = exp [−1.059 + 0.884 × ln (AGBD) + 0.284].
Total biomass density (TBD) was calculated using the following formula: TBD = AGBD + BGBD. The total carbon density (TCD) was computed by using the formula given as [37]:
Carbon (Mg ha−1) = Biomass (Mg ha−1) × (0.5).
The tree acquires carbon if carbon dioxide intake during photosynthesis exceeds carbon dioxide released during respiration over the year (carbon sequestration). As a result, a tree that accumulates a net amount of carbon for a year (tree growth) also produces a net amount of oxygen. Carbon sequestration has an estimated quantity of oxygen based on atomic weights. Net oxygen production by trees was estimated using the following formula [38]:
Net O2 release (Mg ha−1 yr) = Net C sequestration (Mg ha yr−y) × 32/12

3.3. Carbon Credit

One carbon credit corresponds to one ton of net CO2 sequestered or reduced in the form of plant biomass [39]. As a result, the total carbon credit of the land use is determined using the equivalent CO2 values of the stored biomass. Approved C carbon credits are calculated based on the net carbon dioxide of trees or agricultural biomass only. Carbon credits in t/ha/year are approximated by multiplying the total carbon sequestration rate by the current carbon price in US dollars and Indian rupees. The carbon credit was estimated by using the formula given by Mukherjee and Ghosh [40], whereas carbon credit in USD/ha is calculated by multiplying total carbon sequestration with the current price of carbon in USD.
Carbon dioxide emission (t/ha/year) = price × $50 × 83.19

3.4. Soil Analysis

The soil samples were collected from all 10 quadrates laid at each site, and one representative sample was made for each quadrate after mixing the soil collected from five points of a quadrate. Soil samples were collected randomly from each plot at two different depths, viz., 0–15 and 15–30 cm, after clearing litter. The soil was packed in a zip-lock bag and brought to the laboratory for analysis. Layer-wise estimation was used to derive the average soil property of the respective site. The moisture content (%) was determined on a fresh-weight basis [41]. For determining soil bulk density (BD), soil samples were collected through a special metal core-sampling cylinder of known volume (119.39 cc). The weight of oven-dried soil samples was divided by their volume to estimate bulk density [41]. The soil organic carbon (SOC) was determined by the Walkley–Black [42] method and a soil-organic-carbon-stock per hectare was calculated using the following formula [43].
Carbon stock (Mg ha−1) = (BD × soil depth × SOC (%) × 100

4. Results

4.1. Diversity Assessment of Plants at Different Altitudes

Table 3 and Table 4 provide a comprehensive overview of the agroforestry and forest land-use systems at three different elevations (lower: 700–1200 m, middle: 1200–1700 m, upper: 1700–2200 m) in the study area, focusing on the density, frequency (%), abundance to frequency ratio, and Importance Value Index for various tree species.
In the agroforestry land-use system, the maximum (43.05) value of IVI was observed for F. semicordata at the lower elevation. In contrast, F. auriculata shows the minimum (8.14) value of IVI at the middle elevation, while G. optiva exhibits the highest IVI (53.82) at the middle elevations while Ficus religiosa has the lowest (7.32) IVI at the middle elevation. In the upper elevation, the maximum and minimum IVI values were reported for G. optiva (59.33) and P. emblica (4.23), respectively (Table 3).
In the forest land-use system among the trees at lower elevations, D. sissoo reported the maximum (71.10) value of IVI. O. oojeinensis, A. latifolia, Dalbergia sissoo, and A. catechu were associated tree species in the forest composition. In the middle elevation, P. pashia exhibits a significant presence with the maximum values of IVI (76.78). Other notable species include P. granatum and P. cerasoides. At the upper elevations, P. roxburghii dominates with the maximum IVI (79.69), showing its importance to the ecosystem. Q. leucotricophora, M. esculenta, R. arboreum, L. ovalifolia, and C. capitata also contribute to the forest dynamics (Table 4).

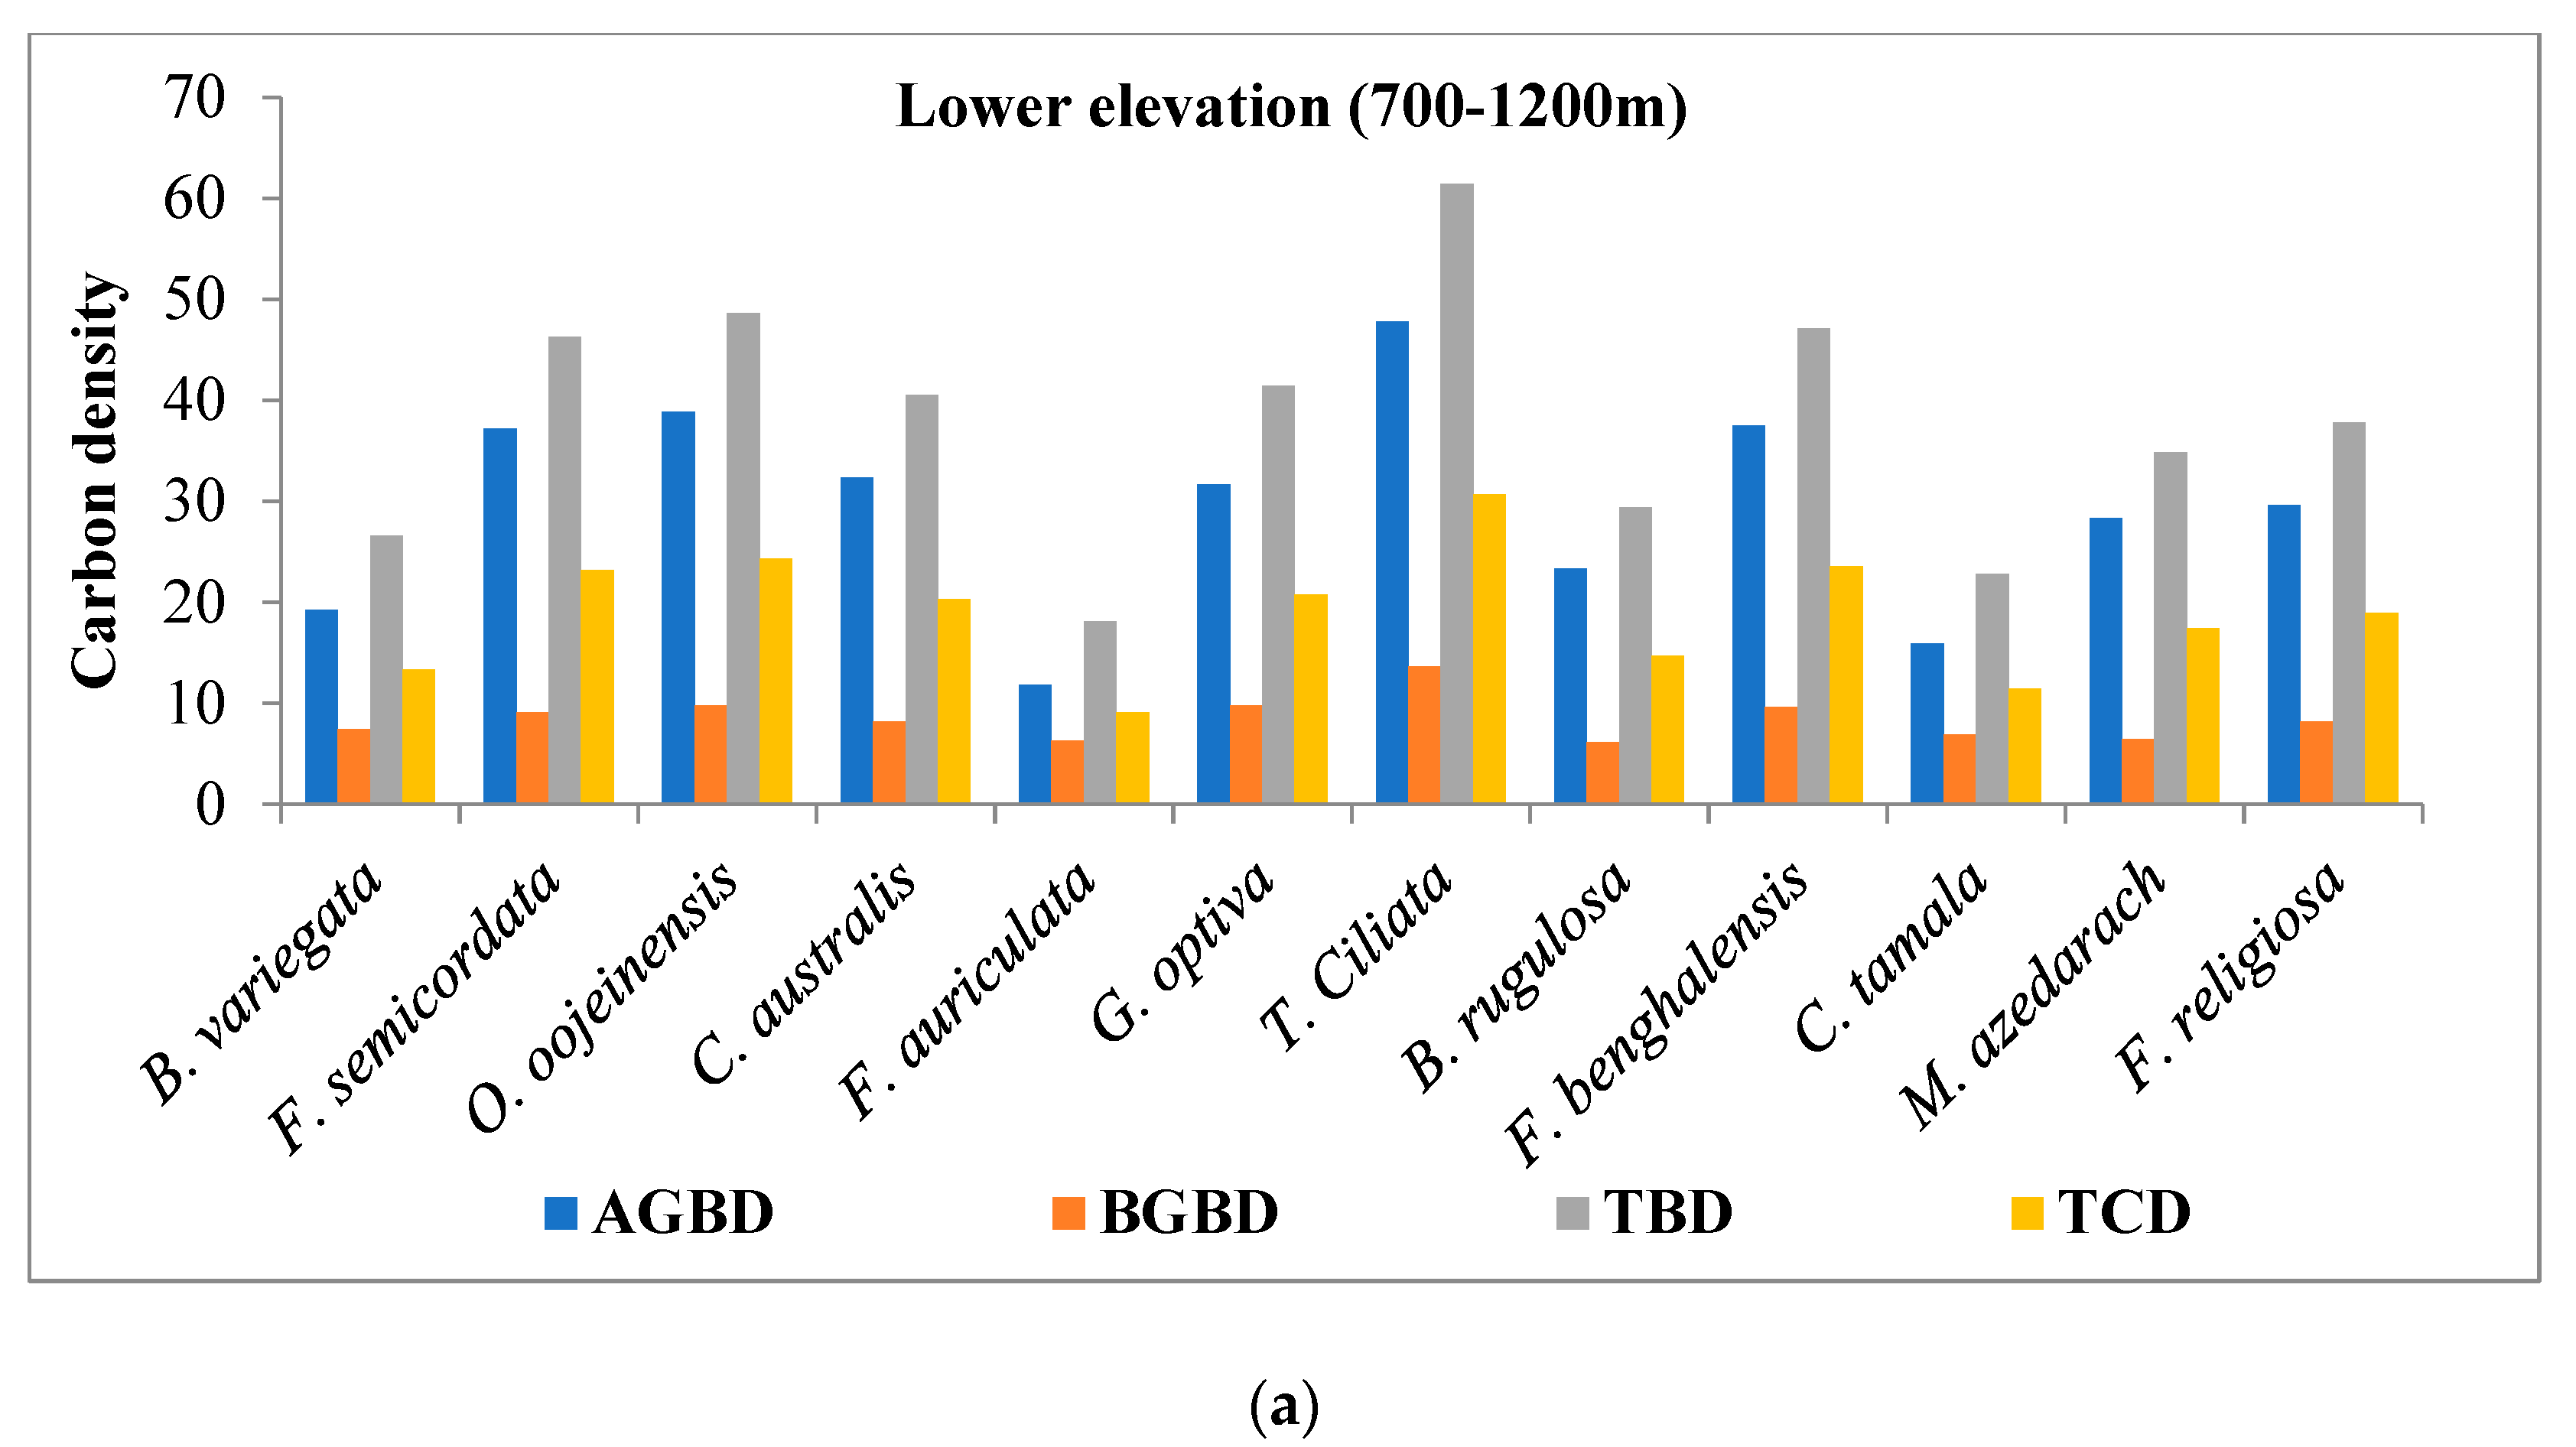
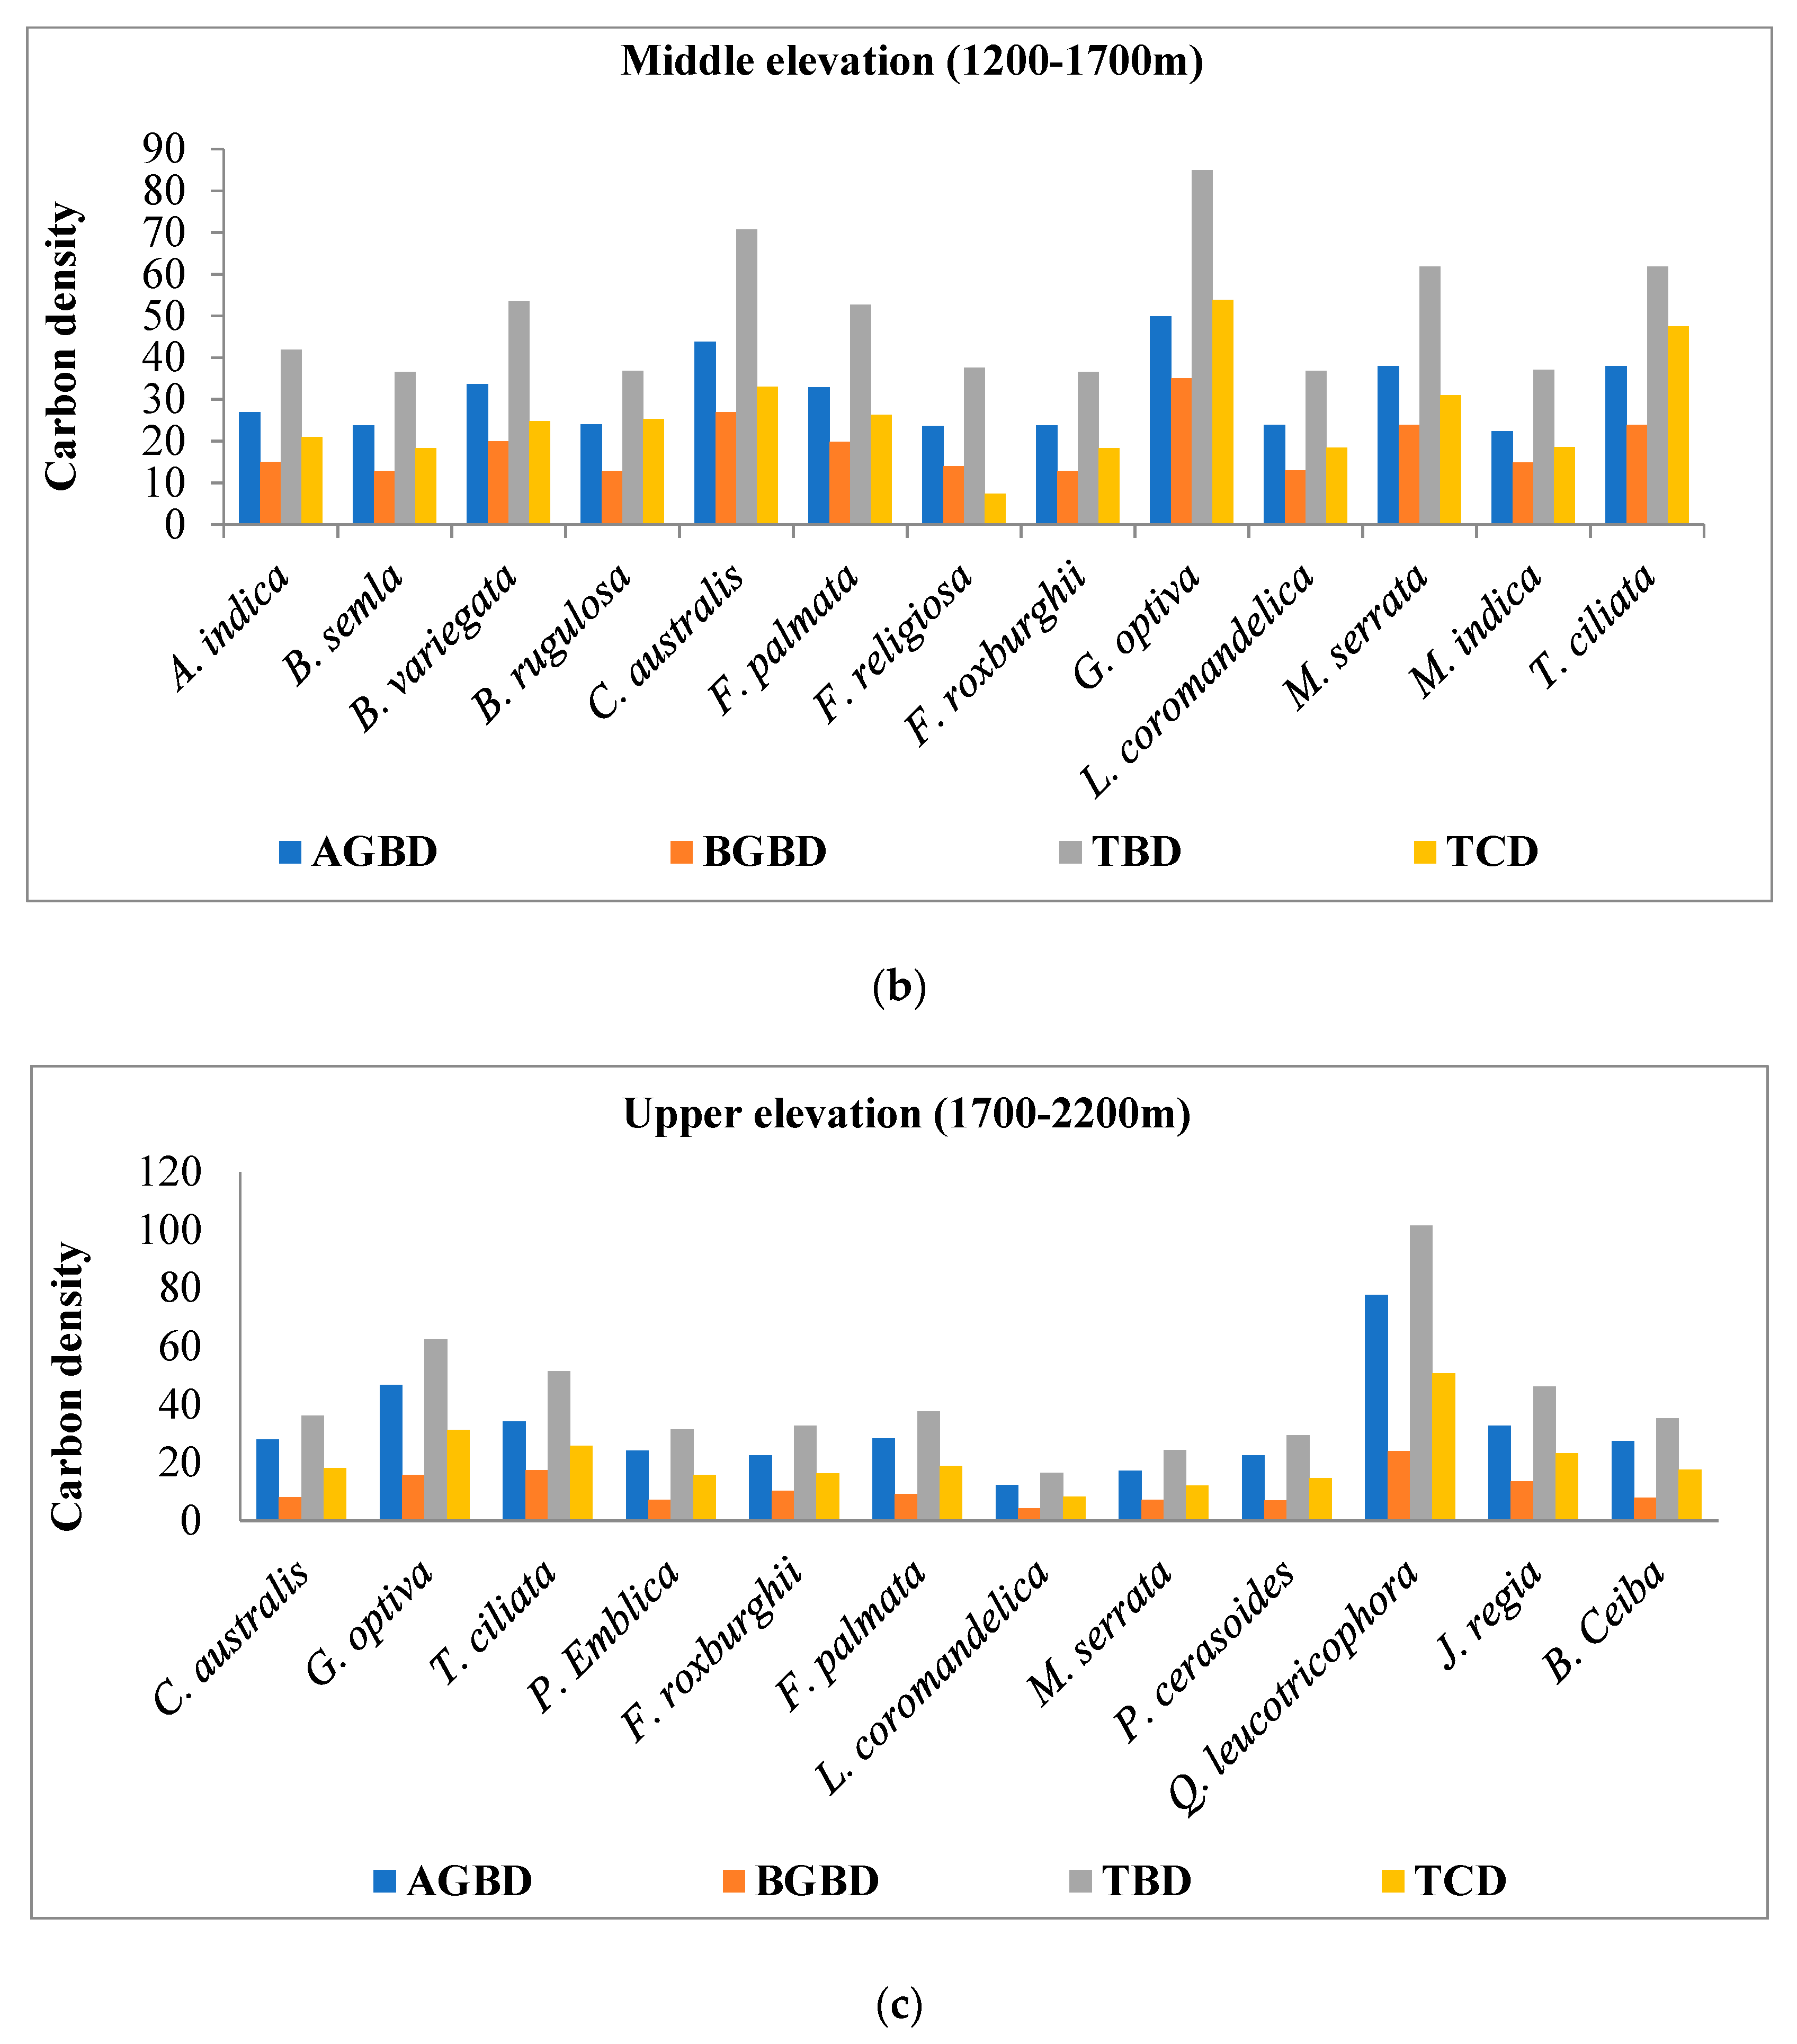
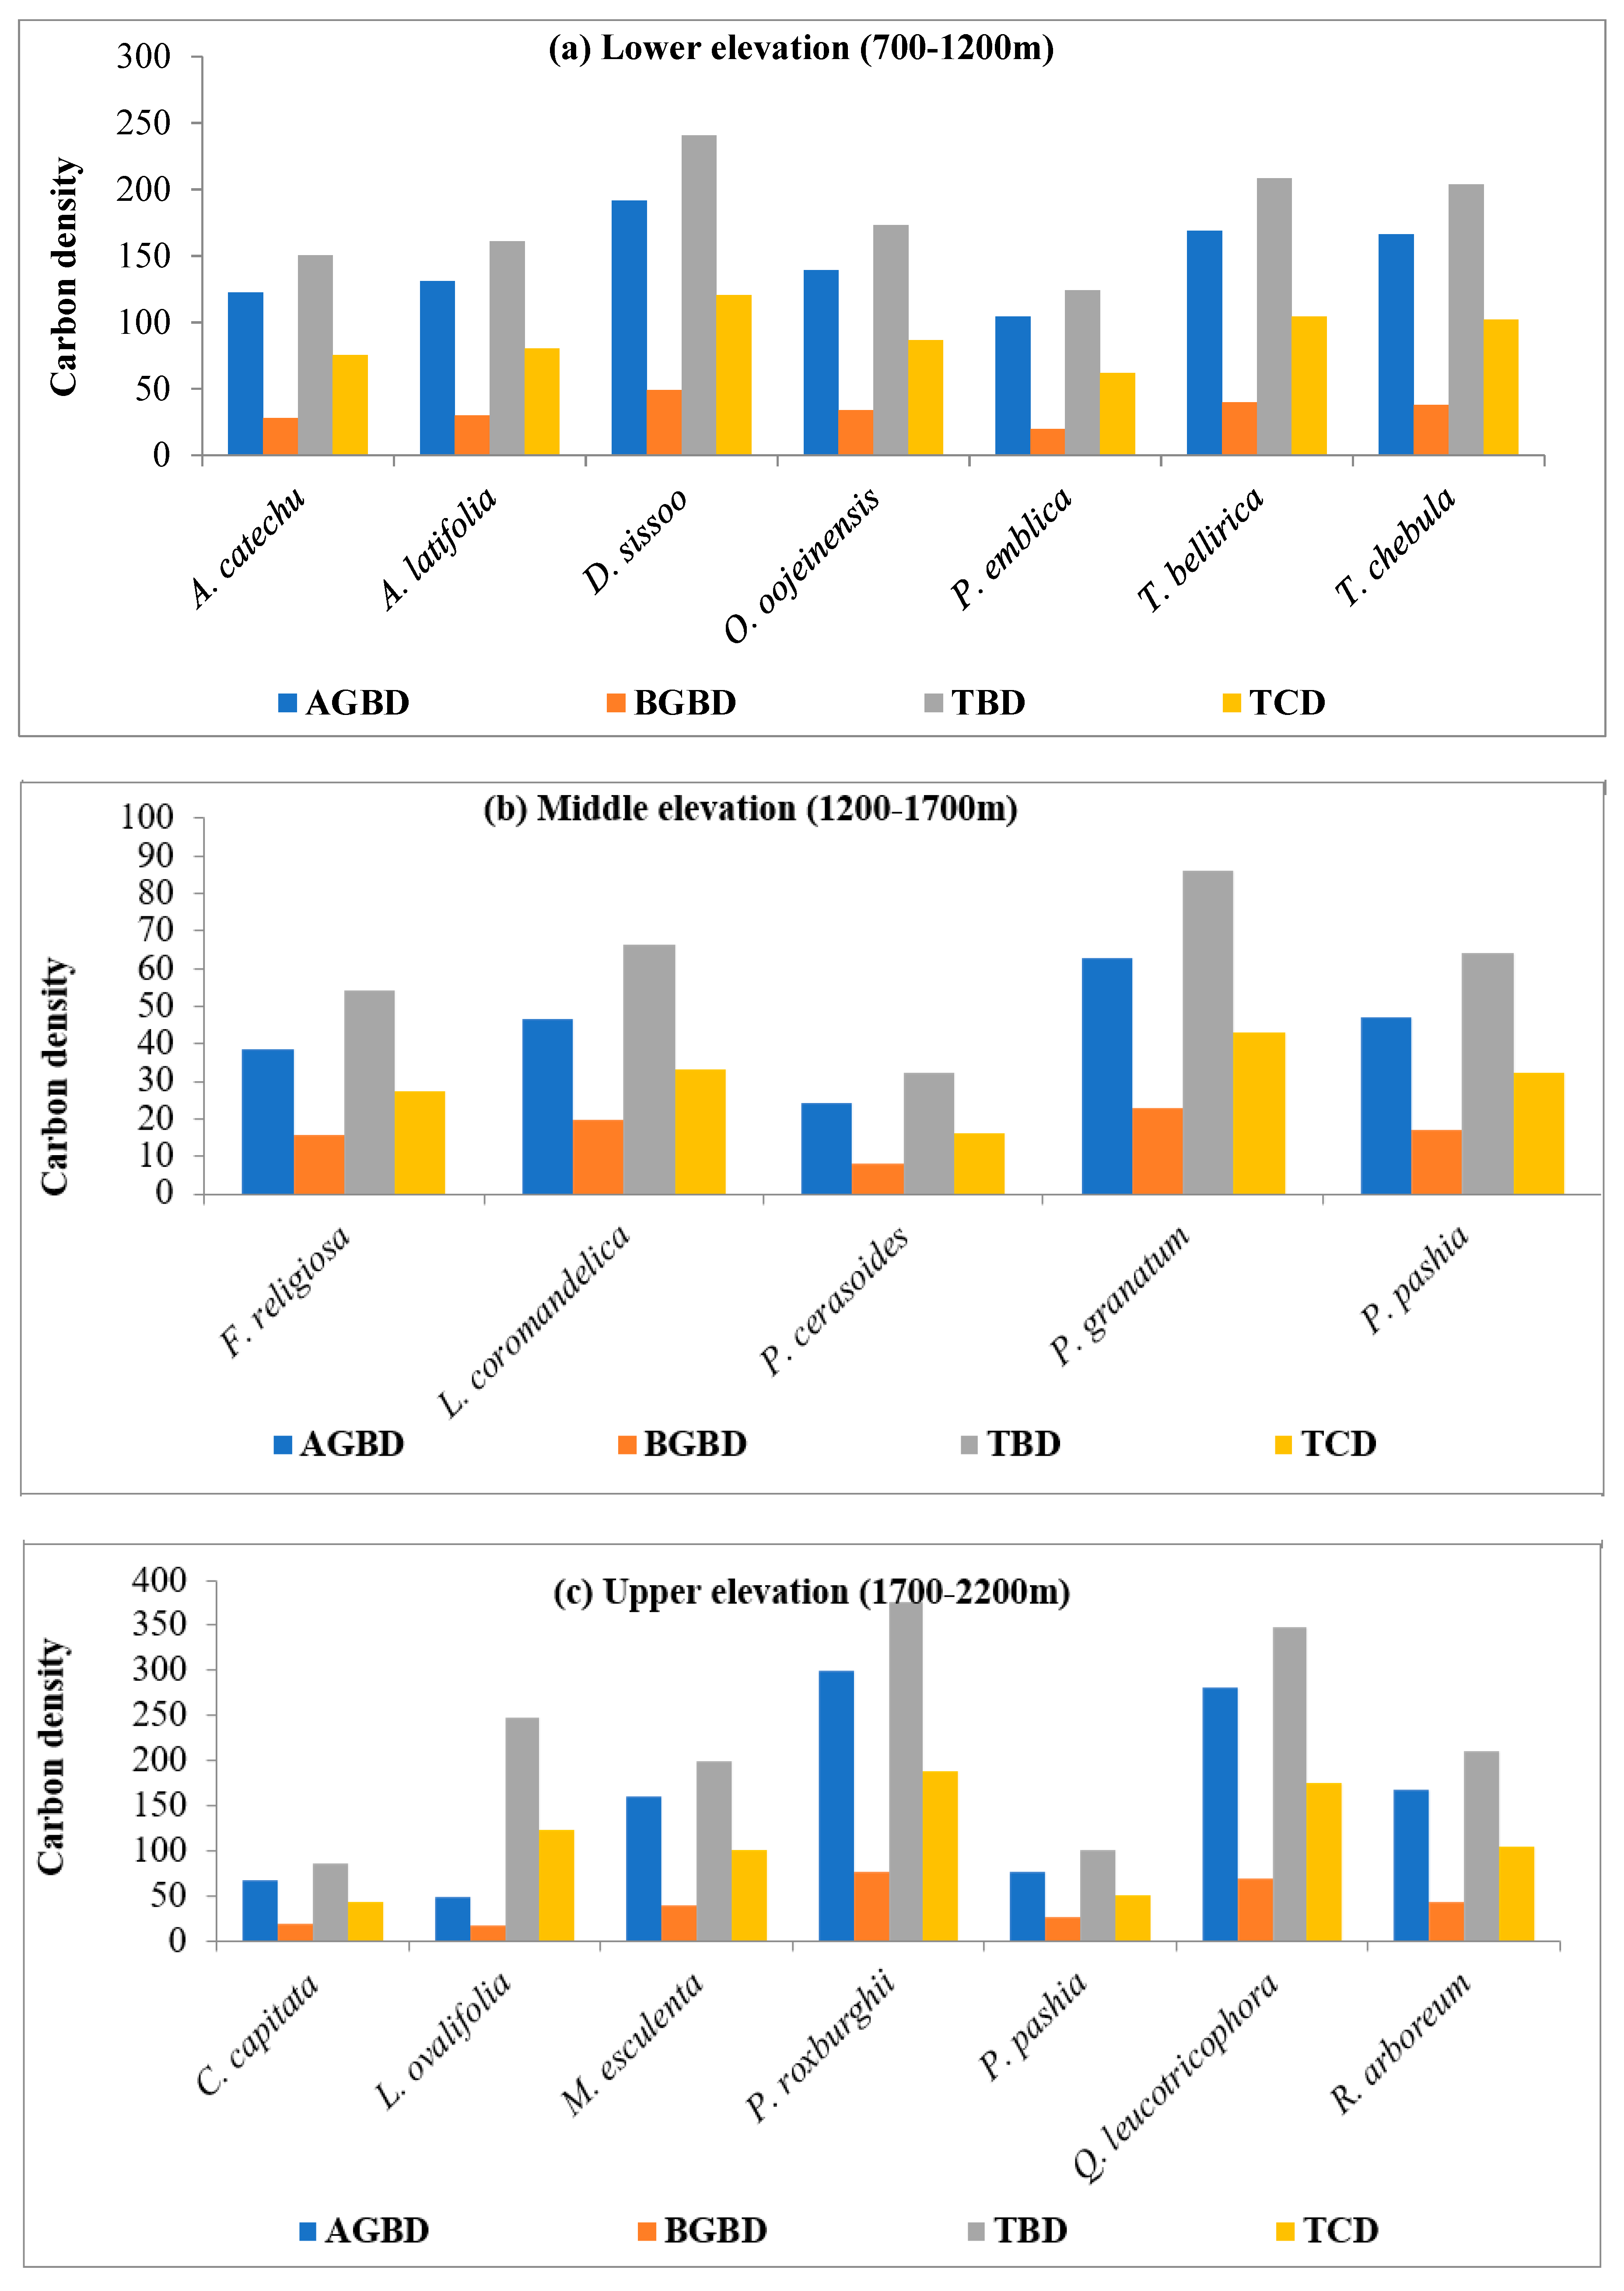
4.2. Species Wise Carbon Density

Figure 2a–c present data on species-wise carbon density in agroforestry land-use systems at three elevations: lower (700–1200 m), middle (1200–1700 m), and upper (1700–2200 m). Four carbon density metrics were provided for each elevation, i.e., AGBD, BGBD, TBD, and TCD. Looking at AGBD, the maximum (47.8 t ha−1) value was observed for T. ciliata at the middle elevation, indicating a higher concentration of aboveground biomass for this species in that particular range. On the other hand, F auriculata exhibits the minimum (11.8 t ha−1) AGBD at the lower elevation, suggesting a lower contribution to AGBD in that elevation range. For BGBD, G. optiva shows the highest (34.98 t ha−1) BGBD at the upper elevation, indicating a significant belowground biomass contribution in that specific elevation range. Conversely, F.auriculata and M. azedarach exhibit the minimum BGBD values at the lower and middle elevations, respectively. TBD is the sum of AGBD and BGBD. T. ciliata has the maximum (61.4 t ha−1) TBD at the middle elevation, emphasizing its overall biomass density in that elevation range. Meanwhile, F. auriculata again shows the minimum (18.1 t ha−1) TBD at the lower elevation, indicating lower overall biomass density for this species.TCD representing the total carbon stored in both aboveground and belowground biomass reveals the highest value for G. optiva at the upper elevation (84.88 t ha−1), indicating its significant role in carbon sequestration in that particular range. F. religiosa exhibits the minimum (18.90) TCD at the lower elevation, suggesting lower overall carbon storage for this species in that range (Figure 2a–c).
Figure 3a–c provides species-wise carbon density data for forest land-use systems across three elevations. For the lower elevation (700–1200 m), the maximum AGBD was observed for D. sissoo (191.65 t ha−1), indicating a high concentration of above-ground biomass for this species. Conversely, F. religiosa exhibits the minimum AGBD in this elevation range, suggesting lower above-ground biomass density for this species.
In terms of BGBD, A. latifolia stands out with the maximum value at the lower elevation (33.9 t ha−1), reflecting a substantial below-ground biomass for this species. Meanwhile, Ficus religiosa has the minimum BGBD at the lower elevation, again suggesting a lower below-ground biomass density for this particular species. The highest TBD value was associated with D. sissoo at the lower elevation (240.54 t ha−1), emphasizing the overall biomass density of this species. On the other hand, F. religiosa again demonstrates the minimum TBD at the lower elevation, indicating a comparatively lower total biomass density. Finally, for total carbon density (TCD), P. roxburghii shows the maximum (376.12 t ha−1) value at the upper elevation, highlighting its substantial contribution to the total carbon density in that elevation range. In contrast, F. religiosa exhibits the minimum TCD at the lower elevation for this species (Figure 3a–c).

4.3. Oxygen (O2) Production Potential and Carbon Credits of Trees in Different Altitudes

At the altitude range of 700–2200 m, the maximum total O2 production was 264.10 Mg ha−1 from the forest at the upper altitude, while the minimum was 50.56 Mg ha−1 from agroforestry land use at the lower altitude. The maximum net O2 production in the agroforestry land-use system was recorded at 4.02 at the middle altitude, and in the forest land-use system, maximum net O2 production was recorded at 11.57% at lower altitudes. The carbon credits were higher in the forests as compared to the agroforestry land use-systems at different altitudes (Table 5).

4.4. Species Diversity

The altitudes from 700 to 1200 m (both agroforestry and forest) show relatively high values for Marglef’s Index, indicating a diverse ecological community. However, agroforestry exhibits higher values for Menheink’s Index, the Shannon–Weiner Index, and Pielou Equitability, suggesting a more evenly distributed species composition and higher species richness compared to forest land use.
At middle altitude (1200–1700 m), the diversity indices for both agroforestry and forest decreased. The agroforestry land-use systems maintained the higher values of the Marglef’s Index, Shannon–Weiner Index, and Pielou Equitability. At higher altitudes (1700–2200 m), the values of all diversity indices decreased from agroforestry and forest. Interestingly, forest land at this altitude shows a higher Marglef’s Index and Simpson’s Diversity Indices than agroforestry, implying a higher dominance of certain species within the community. In the present study, in the agroforestry land-use system, Margalef’s index was recorded from 2.39 to 2.85, whereas, in the forest system, it was recorded from 1.12 to 1.30 at an altitude of 700–2800 m. Menheink’s index was recorded from 0.25 to 0.31 in the agroforestry land-use system; however, in the forest, it was between 0.24 and 0.42 (700–2800 m) altitudes. Simpson’s Diversity Index varied from 0.86 to 0.88 in agroforestry land use-systems; however, in forest land use, the Simpson’s Diversity Index varied from 0.61 to 0.72 (700–2800 m) altitude. The Shannon–Weiner Index (H) varied between 2.19 and 0.88 in agroforestry land-use systems; however, for forest land use, it was reportedly between 0.61 and 2.34 (700–2800 m). Pielo Equitability (J) varied from 0.91 to 0.96 in agroforestry land-use systems; however, in forest land use, it was from 0.47 to 0.66 (700–2800 m) altitude (Table 6).

4.5. Carbon Sequestration

Table 7 provided sources of variation, degrees of freedom (DF), and the F-ratio for different factors, including altitude, land use, and their interaction (altitude*land use), concerning the variables AGBD, BGBD, TBD, and TCD. The asterisks (*) indicate that the variations are statistically significant. Significant differences were observed in the variables AGBD, BGBD, TBD, and TCD when considering the factors of altitude, land use, and their interaction. Regarding altitude, it had a significant impact on all four variables, i.e., AGBD, BGBD, TBD, and TCD. The F-ratio for altitude was 66.5623, 25.4956, 54.7692, and 54.7928, respectively, and all of them are statistically significant. Land use, as another factor, also exhibited a significant influence on AGBD, BGBD, TBD, and TCD, with F-ratios of 387.5805, 157.6239, 324.4058, and 324.5134, respectively. These F ratios are all statistically significant.
Moreover, the interaction between altitude and land use was found to be significant as well. The F-ratios for altitude*land use with AGBD, BGBD, TBD, and TCD were 65.3199, 28.3887, 55.2311, and 55.2495, and all of them were statistically significant. In summary, the analysis reveals that both altitude and land use have significant individual effects on AGBD, BGBD, TBD, and TCD. Furthermore, the interaction between altitude and land use also significantly influences these variables. These findings emphasize the importance of considering altitude, land use, and their interaction when studying or modeling AGBD, BGBD, TBD, and TCD.

4.6. Soil Properties

The maximum soil bulk density (BD) (1.36) was recorded at the 15–30 cm soil layer of the forest land-use system at the 1700–2200 m asl altitudinal range, whereas the minimum value of soil bulk density (0.92) was recorded at the 0–15 cm soil layer of the agroforestry land-use system at the 1200–1700 m asl altitudinal range (Table 8).
The maximum soil organic carbon (4.38%) was recorded at the 0–15 cm soil layer of the forest land-use system at the 1700–2200 m asl altitudinal range, whereas the minimum value of soil organic carbon % (2.21%) was recorded at the 0–15 cm soil layer of the forest land-use system at the 1200–1700 m asl altitudinal range (Table 8).
The maximum soil organic carbon stock (71.61 Mg C ha−1) was recorded at the 0–15 cm soil layer of the forest land-use system at the 1700–2200 m asl altitudinal range, and the minimum value of soil organic carbon stock (42.10 Mg C ha−1) was recorded at the 15–30 cm soil layer of the forestland-use system at the 1200–1700 m asl altitudinal range (Table 6).
The analysis of variance provides significant insight into the effects of different factors and their interactions with BD, SOC, and SOC stock. For BD, we observe that both altitude and land use have highly significant effects, with F-ratios of 34.8136 and 74.6156, respectively. These results suggest that changes in altitude and land use significantly influence the BD of the soil. Additionally, the interaction between altitude and land use is also significant, indicating that the combined effects of these two factors play a role in determining BD. However, neither depth nor its interactions with other factors have a significant effect on BD, as indicated by their low F-ratio (Table 7).
In the case of SOC, altitude and land use also exhibit highly significant effects, with F-ratios of 100.52 and 210.39, respectively. This implies that both altitude and land use have a substantial impact on the SOC in the soil. Furthermore, the interaction between altitude and land use is also highly significant, suggesting a combined effect on SOC. Notably, depth does not significantly affect SOC, and its interaction with other factors is negligible. SOCS follow a similar pattern, with altitude and land use demonstrating significant effects, as indicated by F-ratios of 77.91 and 175.64, respectively. These results emphasize the significant influence of altitude and land use on soil organic carbon stocks. The interaction between altitude and land use is also highly significant, underscoring their combined effect on SOCS. Depth alone does not significantly impact SOCS, and its interactions with other factors have minimal effects. In summary, the analysis of variance reveals that altitude and land use have pronounced effects on BD, OC, and SOCS. Moreover, their interactions further emphasize the combined influence of these factors on the respective soil properties. Depth and its interactions, on the other hand, do not play a significant role in determining these soil characteristics (Table 9).

5. Discussion

5.1. Diversity Assessment

The diversity assessment of plants at different altitudes in the study area reveals significant variations in tree density, frequency, and abundance, highlighting diverse ecological characteristics at different elevations. The findings indicate distinct species compositions at different altitudinal ranges, with certain species exhibiting a significant presence at specific elevations. For instance, T. bellirica, L. coromandelica, and Q. leucotricophora emerge as key species at lower, middle, and upper elevations, respectively, based on their high density, frequency, and Importance Value Index. Additionally, the abundance-to-frequency ratio (A/F) and IVI values further emphasize the ecological importance of certain species at different altitudes, such as the higher abundance of F. palmata at the middle elevation and the high IVI of G. optiva at the upper elevation. These findings underscore the need for tailored conservation and management strategies across different altitudinal zones to preserve the unique plant communities and their ecological significance. Topographic and environmental conditions in the Himalayan region vary significantly, leading to variations in biodiversity patterns concerning aspect, elevation, and habitat types [44,45]. The study provides valuable insights regarding ecosystem management and conservation efforts, emphasizing the importance of considering altitudinal gradients in biodiversity assessments and conservation planning. Since species diversity and richness are well-established community structure metrics, any changes to these parameters can be utilized as a sign of a shift in community dynamics [46,47,48].
The Importance Value Index (IVI) is the most crucial factor to consider while analysing the community organisation’s competitive abilities. Across 700–2200 m of the asl altitudinal gradient, for the agroforestry land-use system, the maximum IVI reported for G. optiva was 58.66 and the minimum for L. coromandelica was 7.44, whereas in the forest land-use system across 700–2200 m of the asl altitudinal gradient, the maximum IVI reported for Q. leucotrichophora was 81.57, while the minimum for F. religiosa was 5.52. The findings show that, in both land-use systems, these tree species dominated over all other species in the study area. This might be due to the dominance and ecological success of trees, their good regeneration, and their greater ecological amplitude [49]. These characteristics enable trees to effectively adapt to changing environments, recover from disturbances, and occupy diverse ecological niches.

5.2. Diversity Indices

5.2.1. Margalef Index

The Margalef index of species richness (SR) reported in the present study under a forest land-use system ranged from 1.12 to 1.30 across a 700–2200 m altitudinal gradient. Current findings contradict those reported for trees, which were 1.36–2.17 [50], 2.37–4.63 [51], and 2.21–7.00 [52]. These fluctuations in species richness are caused by variations in environmental conditions, such as temperature, altitude, humidity, rainfall, aspect, and the interaction of these elements with other site-specific factors [53,54,55,56]. McCain [53] discovered that the climate, particularly a mix of water and temperature, is a key indicator of patterns of richness. This variance in the Margalef index may be caused by the size, type, and altitudinal gradient of the forest [57]. The Margalef index for agroforestry land-use system ranged from 2.39 to 2.82 across 700–1200 m asl at all three altitudes. Kumar et al. [16] studied the diversity parameters of Quercus leucotrichophora-based agroforestry systems in the Garhwal Himalayas and reported that Margalef’s index for various agroforestry land-use systems ranged from 0.74 to 2.48. The species richness was higher at higher altitudes as compared to lower altitudes in both studied land-use systems. Our findings corroborated those of Van and Cochard [58], who noticed an increase in species richness with the increased elevation.

5.2.2. Menhenik Index

The Menhenik index in the present study for trees was found to be 0.24–0.42 across 700–2200 m. These were very similar to the findings of Thakur et al. [59], which ranged from 0.8 to 1.13. Gairola et al. [60] studied species diversity in the moist temperate forest of the Garhwal Himalayas and found that the index ranged between 0.27 and 1.03. Wani et al., [61] also reported similar findings in the Gulmarg Wildlife Sanctuary, which ranged from 0.24 to 0.99. Our findings contradict those of Negi et al. [62], who studied tree diversity in six temperate forests in the north-western Himalayas, where the index ranged between 0.22 and 0.49. The findings demonstrated patterns of tree species diversity related to both large-scale (climate) and small-scale (anthropogenic and soil) variables. Together, these factors determine the composition of local communities and the distribution of species within a specific area.

5.2.3. Shannon-Weiner Index

The Shannon–Weiner diversity (H’) values for tree species reported in the present study ranged between 1.62 and 2.36 across 700–2200 m asl in the forest land-use system. According to Sharma et al., [63], the Shannon diversity for trees in a temperate forest in the Garhwal Himalayas ranged between 0.41 and 1.81, which is similar to the current findings. Our findings are contradictory to Thakur et al. [59], who reported that overall tree diversity ranged from 1.70 to 2.42. Uniyal et al. [52] reported diversity values of 0.70 to 3.08, while Pant and Sammant [64] reported between 0.99 and 2.93 in various Himalayan temperate forests. The Shannon diversity values for trees under an agroforestry land-use system ranged between 2.19 and 2.34 across 700–2200 m asl in our study. Present findings reported higher than the values of Thakur et al. [65] for the Western Himalayas under various agroforestry systems, i.e., 0.045–0.106. This might be because elevation, slope, latitude, aspect, rainfall, and humidity play a crucial role in determining the tree diversity of the area.

5.2.4. Simpson Index

The Simpsons diversity index (D) in the present study was observed at being between 0.61 and 0.88 across 700–2200 m. Whittaker [66] (1965) observed that certain temperate vegetation had D values ranging from 0.19 to 0.99. D levels between 0.12 and 0.25 were found in the Mandal Chopta forests of the Garhwal Himalayas, according to Gairola et al. [60]. Raturi [67] measured D values from 0.09 to 0.63 while studying various temperate and sub-tropical forests in the Garhwal Himalayas. Malik and Bhatt [51] recently reported D readings from a protected area of the Western Himalayas that ranged from 0.06 to 0.37. The lower value of D demonstrated that dominance was shared by several different species.

5.2.5. Pielou Equitability

In the present study, Pielou’s equitability was found to be between 0.47 and 0.96. The findings of Uniyal et al. [52], Negi et al. [62], and Shaheen et al. [68] were reported as 0.47–0.67, 0.47–0.74, and 0.21–0.72, respectively, which are intermediate between our findings. The findings demonstrate how patterns of tree species diversity are related to both large-scale (climate) and small-scale (anthropogenic and soil) variables. Together, these factors govern the species distribution and local community assemblages in a given area. The spatial variety of ecosystems within various study plots may be the cause of the variation in species diversity and richness. Higher anthropogenic disruptions and the localization of non-native species may be to blame for the poor species diversity at lower altitudes [69,70,71]. It is generally known that anthropogenic disturbance has a significant impact on species diversity [72,73].

5.3. Carbon Sequestration

Preventing deforestation and encouraging afforestation have often been cited as means of slowing global warming [74]. Increasing C sequestration in larger forest areas (e.g., plantation forests) has been proposed as an effective measure to reduce high atmospheric CO2 concentrations and thereby prevent global warming [75]. However, protecting forests with large C stocks is also a valuable way to reduce carbon emissions, as it can be more beneficial than afforestation in the short term. Canadell and Raupach [76] noted that the overall potential of management activities to increase C density can be significant and comparable to that of afforestation. Forests often keep C well below potential, and therefore they can respond to management to increase C. Old-growth forest stands around the earth showed that old-growth forests continue to accumulate significant amounts of C [77]. The preservation of old stocks not only preserves large amounts of stored C, but studies also show that they bind much more C than previously thought.
In the present study, the maximum total carbon density was observed (178.2 Mg/ha) at higher elevations. This might be due to an increase in the basal area, leaf litter, and higher canopy cover in the high-altitude regions [78]. Additionally, a greater effect of forest degradation was found in the lower part of the mountains than in the higher altitudes, where steeper terrain can limit accessibility and act as a shield from human disturbance [79]. The lower biomass carbon stock reported for forest land use that grows at the middle altitude is extensively influenced by anthropogenic activities [80], leading to reduced biomass C storage.

5.4. Soil Organic Carbon (SOC)

The present study examined the fluctuations of the SOC in the forest and agroforestry land. Soil organic carbon increased with altitude in both the forest and agroforestry land-use systems. Soil carbon increased with increased precipitation and decreased with increasing temperature [81]. According to various workers [81,82,83], these differences are due to the distribution of shallow root systems along hilly ecosystems. Previous researchers have also reported an increasing trend in soil carbon density at increasing altitudes [83,84,85,86]. Less soil carbon was reported at lower elevations than at higher elevations in both forest and agroforestry land-use systems. This lower carbon content can be attributed to the occurrence of less detritus on the forest floor due to increases in tree diameters along the elevation gradient. Increasing tree diameters also indicate increased competition between tree species. As a result, there is increased natural shedding of lower branches, leaving more deadwood material on the forest floor and, consequently, more carbon [84,85,86,87]. The SOC density decreased with an increase in soil depth in all the elevations at both forest and agroforestry land-use systems (Table 8). This decreasing trend of soil carbon with increasing soil depth may be due to slower soil carbon cycling at increased depths and compaction of the soil [88,89,90]. Similar findings were also reported by other researchers [81,88].

5.5. Bulk Density (BD)

In this study, we observed a decrease in soil BD with increasing altitude in both forest and agroforestry land-use systems. A few workers [63,88] reported a similar relationship between altitude and soil BD. SOC and soil BD were inversely proportional. The lower soil BD indicates higher levels of soil organic matter, good granulation, aeration, and higher infiltration [88]. The present study also indicates that higher soil BD results in lower soil carbon at lower altitudes than at higher altitudes in both forestry and agroforestry systems. In this study, soil BD showed an increase with increasing soil depth at all elevations in both the forest and agroforestry systems. This may be due to higher bulk densities at greater soil depths in the forest soil, as well as mineral entrainment into the soil [91].

5.6. Soil Organic Carbon Stock

SOC stocks decreased with increasing soil depth at all altitudes. Similar results were also observed [81]. The trend of decreasing SOC with increasing depth may be due to the increased proportion of slower cycles of SOC pools at depth and soil compaction [81,89,90]. The SOC stocks observed in the present study are well within the range of other studies (Table 8). Our results are lower than those of Sheikh et al. [92] in subtropical and broadleaf temperate coniferous forests of the Garhwal Himalaya, India. This difference may be because they made the estimates up to a soil depth of 60 cm. Many workers [83,93] observed lower values of SOC in temperate forests on Mt. Changbai, China, possibly due to the lower elevation compared to the present study. In the present study, the lowest SOC was observed in agroforestry and forest land-use systems at middle altitude, while the highest SOC was observed at high altitude. This may also be due to the higher rate of mineralization in forest and agroforestry land-use systems at low altitudes than at high altitudes, where the rate of mineralization is low due to cool temperatures and high rainfall. Similar results have also been reported by others [81,83,84,86,90,94,95] in temperate forests.
SOC stock is inversely proportional to soil BD. Among the altitudes, the value of SOC stock was higher at lower altitudes and decreased with increasing soil depth. A similar study by other workers [85,96,97] reported that soil BD and SOC decreased with increasing altitude and soil depth due to low temperatures, a slow decomposition rate of litter at higher elevations, and the lower availability of organic matter in the subsurface soil. Agroforestry practices have significant advantages in improving soil quality over monoculture. Interestingly, comparable results have been reported by other researchers [98,99,100,101,102].

5.6.1. O2 Production Potential

Plants are the primary source of oxygen and have a significant store of carbon dioxide. The study found that the upper elevation (264.10 Mgha−1) had the highest total oxygen production (TOP) in a forest land-use system, indicating greater overall oxygen production in both aboveground and below ground biomass. Several factors could be responsible for these variations in oxygen production potential, such as the overall biomass, number of trees, diameter distribution, age, and management practices used in each elevation range. It was noted that the values in the current study were lower than those reported by [103] when comparing the results with earlier investigations.
The current study found that the net oxygen production value varied between 3.16 and11.57 Mg ha−1yr−1, and the net oxygen production of various tree species in an agroforestry system ranged from 1.04 to 34.15 Mg ha−1 yr−1.Thelocation, net carbon sequestration, age, and diameter distribution of the trees in each study are among the variables that can be blamed for these variations in net oxygen production. Additionally, the net oxygen production was also reported [104], and the results were higher than those of the current investigation.

5.6.2. Carbon Credit

Total Carbon Credits varied from 11,709.82 to 15,659.64 in agroforestry land-use systems, whereas forest land-use system ranged from 9038.434 to 45,077.81. Vikrant et al., [105] reported similar findings of total C credits in agroforestry estimated at 42,992.53, wherein the highest number (21,631.45) was from the middle elevation and the lowest number (4574.21) was from the upper elevation of the Tehri district.

6. Conclusions

The present study reveals valuable insights into the carbon sequestration capabilities of agroforestry systems in comparison to their adjacent natural forests across varying altitudes. The comprehensive analysis of carbon density, diversity indices, and soil properties across different altitudes in the Garhwal Himalayas highlights the nuanced patterns of carbon sequestration potential in agroforestry and adjacent forest land-use systems. In agroforestry, T. ciliata emerges as a key contributor to aboveground biomass density at middle elevations, while G. optiva plays a significant role in belowground biomass density at upper elevations. In forests, D. sissoo dominates aboveground biomass at lower elevations and P. roxburghii stands out for total carbon density at upper elevations. The oxygen production potential and carbon credits are notably higher in forests compared to agroforestry, suggesting superior ecological services provided by natural forest ecosystems. Furthermore, diversity indices reveal that agroforestry maintains a more evenly distributed and species-rich ecosystem across various altitudes, with decreasing diversity in both land-use systems at higher elevations. The statistical analysis underscores the significance of altitude, land use, and their interaction in influencing carbon density and soil properties, emphasizing the need for a holistic approach when assessing carbon sequestration potential in these ecosystems. Overall, this study contributes valuable insights into the intricate dynamics of carbon sequestration in agroforestry and adjoining forests, which is essential for environmental conservation and management strategies in the Garhwal Himalayas.

Author Contributions

Conceptualization, M.K.R.; Methodology, N.S., M.K.R., B.S. and C.S.; Software, M.K.R.; Formal analysis, N.S., D.R. and C.S.; Investigation, N.S. and C.S.; Resources, N.S.; Data curation, D.R. and M.K.; Writing—original draft, N.S., D.R. and C.S.; Writing—review & editing, M.K.R., B.S., V.P.K., M.M.S.C.P. and M.K.; Supervision, M.K.R., B.S. and V.P.K.; Funding acquisition, M.M.S.C.P. and M.K. All authors have read and agreed to the published version of the manuscript.

Funding

This research received no external funding.

Institutional Review Board Statement

Not applicable.

Informed Consent Statement

Not applicable.

Data Availability Statement

The data presented in this study are available on request from the corresponding author.

Conflicts of Interest

The authors declare no conflict of interest.

References

  1. Aynekulu, E.; Suber, M.; van Noordwijk, M.; Arango, J.; Roshetko, J.M.; Rosenstock, T.S. Carbon Storage Potential of Silvopastoral Systems of Colombia. Land 2020, 9, 309. [Google Scholar] [CrossRef]
  2. Besar, N.A.; Suaedi, H.; Phua, M.H.; James, D.; Mokhtar, M.B.; Ahmed, M.F. Carbon Stock and Carbon Sequestration Potential of an Agroforestry System in Sabah. Malays. For. 2020, 11, 210. [Google Scholar]
  3. Sarkar, P.K.; Sarkar, P.; Kumar, A.; Pala, N.A.; Kumar, M. Carbon Storage Potential of a Waterlogged Agroforestry System of Tripura, India. Water Air Soil Pollut. 2021, 232, 151. [Google Scholar] [CrossRef]
  4. Dhyani, S.; Murthy, I.K.; Kadaverugu, R.; Dasgupta, R.; Kumar, M.; Gadpayle, K.A. Agroforestry to Achieve Global Climate Adaptation and Mitigation Targets: Are South Asian countries sufficiently prepared? Forests 2021, 12, 303. [Google Scholar] [CrossRef]
  5. Mey, C.B.J.; Gore, M.L. Biodiversity Conservation and Carbon Sequestration in Agroforestry Systems of the Mbalmayo Forest Reserve. J. Environ. Sci. 2021, 37, 91–103. [Google Scholar]
  6. Komal, N.; Zaman, Q.; Yasin, G.; Nazir, S.; Ashraf, K.; Waqas, M.; Ahmad, M.; Batool, A.; Talib, I.; Chen, Y. Carbon Storage Potential of Agroforestry System near Brick Kilns in Irrigated Agro-Ecosystem. Agriculture 2022, 12, 295. [Google Scholar] [CrossRef]
  7. Nath, P.C.; Thangjam, U.; Kalita, S.S.; Sahoo, U.K.; Giri, K.; Nath, A.J. Tree Diversity and Carbon Important Species vary with Traditional Agroforestry Managers in the Indian Eastern Himalayan Region. Environ. Sci. Pollut. Res. 2022, 29, 64732–64744. [Google Scholar] [CrossRef]
  8. Vijay, R.E. The Efficiency of Agricultural Crops in the Present Agri-Horti-Silvicultural System in India. Int. J. Agrofor. Silvic. 2016, 3, 197–202. [Google Scholar]
  9. Nagar, A.; Khanduri, V.P.; Singh, B.; Riyal, M.K.; Singh, I. Altitudinal Variation in Morphometric Traits of Pod, Seed, and Seedling growth of Bauhinia variegata L. in Garhwal Himalaya. Ann. Silvic. Res. 2022, 47, 85–94. [Google Scholar]
  10. Singh, B.; Kumar, M.; Cabral-Pinto, M.M.S.; Bhatt, B.P. Seasonal and altitudinal variation in chemical composition of Celtis australis L. Tree Foliage. Land 2022, 11, 2271. [Google Scholar] [CrossRef]
  11. Reang, D.; Hazarika, A.; Sileshi, G.W.; Pandey, R.; Das, A.K.; Nath, A.J. Assessing Tree Diversity and Carbon Storage During Land Use Transitioning from Shifting Cultivation to Indigenous Agroforestry Systems: Implications for REDD+ Initiatives. J. Environ. Manag. 2021, 298, 113470. [Google Scholar] [CrossRef]
  12. Kumar, S.; Singh, B.; Rawat, D.; Singh, A.P.; Tewari, S. Physico-chemical Properties of Soil and Productivity of Lentil (Lens culinaris Medic.) and Wheat (Triticum aestivum L.) Under Existing agri-Horticulture System in Mid Hills of Uttarakhand Himalaya. J. Tree Sci. 2020, 39, 24–32. [Google Scholar] [CrossRef]
  13. Satapathy, S.R.; Khanduri, V.P.; Singh, B.; Riyal, M.K.; Kumar, S.; Kumar, P.; Rawat, D. Allelopathic Potential of Ficus auriculata and Ficus semicordata on Growth of Four Traditional Food Crops of Garhwal Himalaya. J. Agric. Food Res. 2022, 9, 100352. [Google Scholar]
  14. Padu, K.; Khanduri, V.P.; Singh, B.; Rawat, D.; Riyal, M.K.; Kumar, K.S. Phytotoxicity of Common Weeds on Germination, Seedling Growth, NPK Uptake and Chlorophyll Content of Four Hill Crops of Garhwal Himalaya. J. Agric. Food Res. 2023, 12, 100539. [Google Scholar] [CrossRef]
  15. Kishwan, J.; Pandey, R.; Dadhwal, V.K. Emission Removal Capability of India’s Forest and Tree Cover. Small-Scale For. 2012, 11, 61–72. [Google Scholar] [CrossRef]
  16. Kumar, S.; Bijalwan, A.; Singh, B.; Rawat, D.; Yewale, A.G.; Riyal, M.K.; Thakur, T.K. Comparison of Carbon Sequestration Potential of Quercus leucotrichophora–based Agroforestry Systems and Natural Forest in Central Himalaya, India. Water Air Soil Pollut. 2021, 232, 250. [Google Scholar] [CrossRef]
  17. Tiwari, A.; Khanduri, V.P.; Rawat, D.; Singh, B.; Riyal, M.K.; Mishra, G.; Kumar, M. Vegetation Composition, Soil Properties, and Carbon Stock of Montane Forests Along Disturbance in the Garhwal Himalaya, India. Front. For. Glob. Chang. 2023, 6, 1193792. [Google Scholar] [CrossRef]
  18. Nunes, L.J.R. The Rising Threat of Atmospheric CO2: A Review on the Causes, Impacts, and Mitigation Strategies. Environments 2023, 10, 66. [Google Scholar] [CrossRef]
  19. Dey, D.C.; Knapp, B.O.; Battaglia, M.A.; Deal, R.L.; Hart, J.L.; O’Hara, K.L.; Schweitzer, C.J.; Schuler, T.M. Barriers to natural regeneration in temperate forests across the USA. New For. 2019, 50, 11–40. [Google Scholar] [CrossRef]
  20. Quandt, A.; Neufeldt, H.; Gorman, K. Climate Change Adaptation Through Agroforestry: Opportunities and Gaps. Curr. Opin. Environ. Sustain. 2023, 60, 101244. [Google Scholar] [CrossRef]
  21. Watts, M.; Hutton, C.; Mata Guel, E.O.; Suckall, N.; Peh, K.S.H. Impacts of Climate Change on Tropical Agroforestry Systems: A Systematic Review for Identifying Future Research Priorities. Front. For. Glob. Chang. 2022, 5. [Google Scholar] [CrossRef]
  22. Jhariya, M.K.; Yadav, D.K.; Banerjee, A. (Eds.) Agroforestry and Climate Change: Issues and Challenges; CRC Press: Boca Raton, FL, USA, 2019. [Google Scholar]
  23. Gebre, A.B. Potential Effects of Agroforestry Practices on Climate Change Mitigation and Adaptation Strategies: A Review. J. Nat. Sci. Res. 2016, 6, 83–89. [Google Scholar]
  24. De Zoysa, M.; Inoue, M. Climate Change Impacts, Agroforestry Adaptation and Policy Environment in Sri Lanka. Open J. For. 2014, 4, 439–456. [Google Scholar] [CrossRef]
  25. Prajapati, A.; Pachauri, S.; Srivastava, P.; Pathak, A.; Rawat, D. Status of Some Extractable Macro- and Micro-Nutrients in Soils of Tehri Garhwal District of Uttarakhand. Pantnagar J. Res. 2021, 19, 171. [Google Scholar]
  26. Curtis, J.T.; Mcintosh, R.P. The Interrelations of Certain Analytic and Synthetic Phytosociological Characters. Ecology 1950, 31, 434–455. [Google Scholar] [CrossRef]
  27. Phillips, E.A. Methods of Vegetation Study; Rinehart & Winston: New York, NY, USA, 1959. [Google Scholar]
  28. Curtis, J.T. The Vegetation of Wisconsin, an Ordination of Plant Community; University Wisconsin Press: Madison, WI, USA, 1959. [Google Scholar]
  29. Magurran, A.E.; Magurran, A.E. Diversity Indices and Species Abundance Models. In Ecological Diversity and Its Measurement; Springer: Dordrecht, The Netherlands, 1988; pp. 7–45. [Google Scholar]
  30. Whittaker, R.H. Evolution and Measurement of Species Diversity. Taxon 1972, 21, 213–251. [Google Scholar] [CrossRef]
  31. Simpson, E.H. Measurement of Diversity. Nature 1949, 163, 688. [Google Scholar] [CrossRef]
  32. Knigt, D.H. A Distance Method for Constructing Forest Profile Diagram and Obtaining Structural Data. Trop. Ecol. 1963, 1, 89–94. [Google Scholar]
  33. FSI. Volume Equations for Forests of India, Nepal and Bhutan; Forest Survey of India, Ministry of Environment and Forests, Govt. of India: Dehradun, India, 1996.
  34. Chaturvedi, A.N. General Standard Volume Tables for Semal (Bombax ceiba L.). In Dehradun: Manager of Publications; Records, I., Ed.; Forest Research Institute: Mumbai, India, 1973; Volume 12, pp. 1–8. [Google Scholar]
  35. Brown, S.L.; Schroeder, P.; Kern, J.S. Spatial Distribution of Biomass in Forests of the Eastern USA. For. Ecol. Manag. 1999, 123, 81–90. [Google Scholar] [CrossRef]
  36. Cairns, M.A.; Brown, S.; Helmer, E.H.; Baumgardner, G.A. Root Biomass Allocation in the World’s Upland Forests. Oecologia 1997, 111, 1–11. [Google Scholar] [CrossRef]
  37. IPCC. Land Use, Land-Use Change and Forestry: A Special Report of the Intergovernmental Panel on Climate Change (IPCC); Cambridge University Press: Cambridge, UK, 2000; p. 375. [Google Scholar]
  38. Nowak, D.J.; Hoehn, R.; Crane, D.E. Oxygen Production by Urban Trees in the United States. Arboricult. Urban For. 2007, 33, 220–226. [Google Scholar] [CrossRef]
  39. Intergovernmental Panel on Climate Change (IPCC). Climate Change 2007: The Physical Science Basis. Contribution of Working Group I to the Fourth Assessment Report of the Intergovernmental Panel on Climate Change; Solomon, S., Ed.; Cambridge University Press: New York, NY, USA, 2007; p. 996. [Google Scholar]
  40. Mukherjee, S.; Ghosh, P.B. Estimation of Carbon Credit and Direct Carbon Footprint by Solar Photovoltaic Cells in West Bengal, India. Int. J. Low-Carbon Technol. 2014, 9, 52–55. [Google Scholar] [CrossRef]
  41. Mishra, R. Ecology Work Book Oxford and IBH Publishing Company Calcutta; Oxford and IBH Publishing Co.: Calcutta, India, 1968; 242p. [Google Scholar]
  42. Walkley, A.J.; Black, I.A. Estimation of Soil Organic Carbon by the Chromic Acid Titration Method. Soil Sci. 1934, 37, 29–38. [Google Scholar] [CrossRef]
  43. Brown, S. Exploration of the Carbon Sequestration Potential of Classified Forest in the Republic of Guinea. In Report Submitted to the United States Agency for International Development; Winrock International: Pasig, Philippines, 2004. [Google Scholar]
  44. Rana, D.; Kapoor, K.S.; Samant, S.S.; Bhatt, A. Plant Species Conservation Priority Index for Preparing Management Strategies: A Case Study from the Western Himalayas of India. Small-Scale For. 2020, 19, 461–481. [Google Scholar] [CrossRef]
  45. Ahmad, M.; Sharma, P.; Rathee, S.; Singh, H.P.; Batish, D.R.; Lone, G.R.; Kaur, S.; Jaryan, V.; Kohli, R.K. Niche Width Analyses Facilitate Identification of High-Risk Endemic Species at High Altitudes in Western Himalayas. Ecol. Eng. 2021, 126, 107653. [Google Scholar] [CrossRef]
  46. Koerner, S.E.; Smith, M.D.; Burkepile, D.E.; Hanan, N.P.; Avolio, M.L.; Collins, S.L.; Knapp, A.K.; Lemoine, N.P.; Forrestel, E.J.; Eby, S.; et al. Change in Dominance Determines Herbivore Effects on Plant Biodiversity. Nat. Ecol. Evol. 2018, 2, 1925–1932. [Google Scholar] [CrossRef] [PubMed]
  47. Brinkmann, K.; Patzelt, A.; Dickhoefer, U.; Schlecht, E.; Buerkert, A. Vegetation Patterns and Diversity Along an Altitudinal and a Grazing Gradient in the Jabal al Akhdar Mountain Range of Northern Oman. J. Arid Environ. 2009, 73, 1035–1045. [Google Scholar] [CrossRef]
  48. Zhang, J.T.; Dong, Y. Factors Affecting Species Diversity of Plant Communities and the Restoration Process in the Loess Area of China. Ecol. Eng. 2010, 36, 345–350. [Google Scholar] [CrossRef]
  49. Ballabha, R.; Kuniyal, A.; Tiwari, P.; Tiwari, J.K. Forest Structure and Composition in the Vicinity of Srinagar Hydroelectric Power Project in Alaknanda Valley, Garhwal Himalaya, India. J. For. Environ. Sci. 2020, 36, 78–90. [Google Scholar]
  50. Gairola, S.; Sharma, C.M.; Suyal, S.; Ghildiya, S.K. Species Composition and Diversity in Mid-altitudinal Moist Temperate Forests of the Western Himalaya. J. For. Environ. Sci. 2011, 27, 1–15. [Google Scholar]
  51. Malik, Z.A.; Bhatt, A.B. Phytosociological Analysis of Woody Species in Kedarnath Wildlife Sanctuary and Its Adjoining Areas in Western Himalaya, India. J. For. Environ. Sci. 2015, 31, 149–163. [Google Scholar] [CrossRef]
  52. Uniyal, P.; Pokhriyal, P.; Dasgupta, S.; Bhatt, D.; Todaria, N.P. Plant Diversity in Two Forest Types Along the Disturbance Gradient in Dewalgarh Watershed, Garhwal Himalaya. Curr. Sci. 2010, 98, 938–943. [Google Scholar]
  53. McCain, C.M. Global Analysis of Bird Elevational Diversity. Glob. Ecol. Biogeogr. 2009, 18, 346–360. [Google Scholar] [CrossRef]
  54. McCain, C.M.; Grytnes, J.A. Elevational Gradients in Species Richness; Wiley online Library: Hoboken, NJ, USA, 2010. [Google Scholar]
  55. Sinha, S.; Badola, H.K.; Chhetri, B.; Gaira, K.S.; Lepcha, J.; Dhyani, P.P. Effect of Altitude and Climate in Shaping the Forest Compositions of Singalila National Park in Khangchendzonga Landscape, Eastern Himalaya, India. J. Asia-Pac. Biodivers. 2018, 11, 267–275. [Google Scholar] [CrossRef]
  56. Rana, S.K.; Gross, K.; Price, T.D. Drivers of Elevational Richness Peaks, Evaluated for Trees in the East Himalaya. Ecology 2019, 100, e02548. [Google Scholar] [CrossRef] [PubMed]
  57. Liang, P.; Wang, X.; Sun, H.; Fan, Y.; Wu, Y.; Lin, X.; Chang, J. Forest Type and Height Are Important in Shaping the Altitudinal Change of Radial Growth Response to Climate Change. Sci. Rep. 2019, 9, 1336. [Google Scholar] [CrossRef] [PubMed]
  58. Van, Y.T.; Cochard, R. Tree Species Diversity and Utilities in a Contracting Lowland Hillside Rainforest Fragment in Central Vietnam. For. Ecosyst. 2017, 4, 9. [Google Scholar] [CrossRef]
  59. Thakur, U.; Bisht, N.S.; Kumar, M.; Kumar, A. Influence of Altitude on Diversity and Distribution Pattern of Trees in Himalayan Temperate Forests of Churdhar Wildlife Sanctuary, India. Water Air Soil Pollut. 2021, 232, 205. [Google Scholar] [CrossRef]
  60. Gairola, S.; Ghildiyal, S.K.; Sharma, C.M.; Suyal, S. Species Richness and Diversity Along an Altitudinal Gradient in Moist Temperate Forest of Garhwal Himalaya. Am. J. Sci. 2009, 5, 119–128. [Google Scholar]
  61. Wani, Z.A.; Akash, S.; Pant, S. Tree Diversity and Regeneration Dynamics in Gulmarg Wildlife Sanctuary, Kashmir Himalaya. Acta Ecol. Sin. 2023, 43, 375–381. [Google Scholar] [CrossRef]
  62. Negi, V.; Bhardwaj, D.R.; Sharma, P.; Pala, N.A. Tree Species Composition and Diversity in Natural Temperate Forests of the North-Western Himalayas. Acta Ecol. Sin. 2022, 42, 653–660. [Google Scholar] [CrossRef]
  63. Sharma, C.M.; Gairola, S.; Ghildiyal, S.K.; Suyal, S. Physical Properties of Soils in Relation to Forest Composition in Moist Temperate Valley Slopes of the Central Western Himalaya. J. For. Environ. Sci. 2010, 26, 117–129. [Google Scholar]
  64. Pant, S.; Sammant, S.S. Diversity and Regeneration Status of Tree Species in Khokhan Wildlife Sanctuary, North-Western Himalaya. Trop. Ecol. 2012, 53, 317–331. [Google Scholar]
  65. Thakur, N.S.; Gupta, N.K.; Gupta, B.; Nauni, S.H. Phytosociological Analysis of Woody and Nonwoody Components Under Some Agroforestry Systems in Western Himalaya-A Case Study. Indian J. Agrofor. 2004, 6, 65–71. [Google Scholar]
  66. Whittaker, R.H. Dominance and Diversity in Land Plant Communities: Numerical Relations of Species Express the Importance of Competition in Community Function and Evolution. Science 1965, 147, 250–260. [Google Scholar] [CrossRef]
  67. Raturi, G.P. Forest Community Structure Along an Altitudinal Gradient of District Rudraprayag of Garhwal Himalaya, India. Ecologia 2012, 2, 76–84. [Google Scholar] [CrossRef]
  68. Shaheen, H.; Ullah, Z.; Khan, S.M.; Harper, D.M. Species Composition and Community Structure of Western Himalayan Moist Temperate Forests in Kashmir. For. Ecol. Manag. 2012, 278, 138–145. [Google Scholar] [CrossRef]
  69. Zhang, J.; Presley, G.N.; Hammel, K.E.; Ryu, J.S.; Menke, J.R.; Figueroa, M.; Hu, D.; Orr, G.; Schilling, J.S. Localizing Gene Regulation Reveals a Staggered Wood Decay Mechanism for the Brown Rot Fungus Postia Placenta. Proc. Natl. Acad. Sci. USA 2016, 113, 10968–10973. [Google Scholar] [CrossRef] [PubMed]
  70. Mustaqeem Ahmad, S.K.U.; Singh, R.D. Patterns of Alien Plant Species Richness Across Gradients of Altitude: Analyses from the Himalayan State of Himachal Pradesh. Trop. Ecol. 2018, 59, 35–43. [Google Scholar]
  71. Rawat, D.S.; Dash, S.S.; Sinha, B.K.; Kumar, V.; Banerjee, A.; Singh, P. Community Structure and Regeneration Status of Tree Species in Eastern Himalaya: A Case Study from Neora Valley National Park, West Bengal, India. Taiwania 2018, 63, 16–24. [Google Scholar]
  72. Newbold, T.; Hudson, L.N.; Hill, S.L.; Contu, S.; Lysenko, I.; Senior, R.A.; Börger, L.; Bennett, D.J.; Choimes, A.; Collen, B.; et al. Global Effects of Land Use on Local Terrestrial Biodiversity. Nature 2015, 520, 45–50. [Google Scholar] [CrossRef] [PubMed]
  73. Ahmad, M.; Uniyal, S.K.; Batish, D.R.; Singh, H.P.; Jaryan, V.; Rathee, S.; Sharma, P.; Kohli, R.K. Patterns of Plant Communities Along Vertical Gradient in Dhauladhar Mountains in Lesser Himalayas in North-Western India. Sci. Total Environ. 2020, 716, 136919. [Google Scholar] [CrossRef]
  74. Bala, G.; Caldeira, K.; Wickett, M.; Phillips, T.J.; Lobell, D.B.; Delire, C.; Mirin, A. Combined Climate and Carbon-Cycle Effects of Large-Scale Deforestation. Proc. Natl. Acad. Sci. USA 2007, 104, 6550–6555. [Google Scholar] [CrossRef] [PubMed]
  75. Watson, R.T.; Noble, I.R.; Bolin, B.; Ravindranath, N.H.; Verardo, D.J.; Dokken, D.J. Land Use, Land-Use Change, and Forestry A Special Report of IPCC; Cambridge University Press: Cambridge, UK, 2000. [Google Scholar]
  76. Canadell, J.G.; Raupach, M.R. Managing Forests for Climate Change Mitigation. Science 2008, 320, 1456–1457. [Google Scholar] [CrossRef]
  77. Luyssaert, S.; Schulze, E.D.; Börner, A.; Knohl, A.; Hessenmöller, D.; Law, B.E.; Ciais, P.; Grace, J. Old-Growth Forests as Global Carbon Sinks. Nature 2008, 455, 213–215. [Google Scholar] [CrossRef] [PubMed]
  78. Sheikh, M.A.; Kumar, M.; Todaria, N.P.; Pandey, R. Biomass and Soil Carbon Along Latitudinal Gradients in Temperate Cedrus deodara Forests in Central Himalaya, India: Implications for Climate Change Mitigation. Ecol. Indic. 2020, 111, 06025. [Google Scholar] [CrossRef]
  79. Spracklen, D.V.; Righelato, R. Tropical Montane Forests Are a Larger than Expected Global Carbon Store. Biogeosciences 2014, 11, 2741–2754. [Google Scholar] [CrossRef]
  80. Negi, V.S.; Joshi, B.C.; Pathak, R.; Rawal, R.S.; Sekar, K.C. Assessment of Fuelwood Diversity and Consumption Patterns in Cold Desert Part of Indian Himalaya: Implication for Conservation and Quality of Life. J. Clean. Prod. 2018, 196, 23–31. [Google Scholar] [CrossRef]
  81. Jobbágy, E.G.; Jackson, R.B. The Vertical Distribution of Soil Carbon and Its Relation to Climate and Vegetation. Ecol. Appl. 2000, 10, 423–436. [Google Scholar] [CrossRef]
  82. Yang, Y.; Mohammat, A.; Feng, J.; Zhou, R.; Fang, J. Storage, Patterns and Environmental Controls of Soil Organic Carbon in China. Biogeochemistry 2007, 84, 131–141. [Google Scholar] [CrossRef]
  83. Zhu, B.; Wang, X.; Fang, J.; Piao, S.; Shen, H.; Zhao, S.; Peng, C. Altitudinal Changes in Carbon Storage of Temperate Forests on MT Changbai, Northeast China. J. Plant Res. 2010, 123, 439–452. [Google Scholar] [CrossRef]
  84. Charan, G.; Bharti, V.K.; Jadhav, S.E.; Kumar, S.; Angchok, D.; Acharya, S.; Kumar, P.; Srivastava, R.B. Altitudinal Variations in Soil Carbon Storage and Distribution Patterns in Cold Desert High Altitude Microclimate of India. Afr. J. Agric. Res. 2012, 7, 6313–6319. [Google Scholar] [CrossRef]
  85. Gupta, M.K.; Sharma, S.D. Sequestered Organic Carbon Status in the Soils Under Grassland in Uttarakhand State, India. Appl. Ecol. Environ. Sci. 2013, 1, 7–9. [Google Scholar] [CrossRef]
  86. Wei, Y.; Li, M.; Chen, H.; Lewis, B.J.; Yu, D.; Zhou, W.; Fang, X.; Zhao, W.; Dai, L. Variation in Carbon Storage and Its Distribution by Stand Age and Forest Type in Boreal and Temperate Forests in Northeast China. PLoS ONE 2013, 8, e72201. [Google Scholar]
  87. Zhang, Y.; Ai, J.; Sun, Q.; Li, Z.; Hou, L.; Song, L.; Tang, G.; Li, L.; Shao, G. Soil Organic Carbon and Total Nitrogen Stocks as Affected by Vegetation Types and Altitude Across the Mountainous Regions in the Yunnan Province, South-Western China. Catena 2021, 196, 104872. [Google Scholar] [CrossRef]
  88. Dar, J.A.; Somaiah, S. Soil Organic Carbon Stock Assessment in Two Temperate Forest Types of Western Himalaya of Jammu And Kashmir, India. J. For. Res. 2014, 3, 114. [Google Scholar] [CrossRef]
  89. Paul, E.A.; Follet, R.F.; Leavitt, S.W.; Halvorson, A.; Peterson, G.A.; Lyon, D.J. Radiocarbon Dating for Determination of Soil Organic Pool Sizes and Dynamics. Am. J. Soil Sci. Soc. 1997, 61, 1058–1067. [Google Scholar] [CrossRef]
  90. Trumbore, S.E. Age of Soil Organic Matter and Soil Respiration: Radiocarbon Constraints on Belowground Carbon Dynamics. Ecol. Appl. 2000, 10, 399–411. [Google Scholar] [CrossRef]
  91. Schulp, C.J.E.; Nabuurs, G.-J.; Verburg, P.H.; de Waal, R.W. Effect of Tree Species on Carbon Stocks in Forest Floor and Mineral Soil and Implications for Soil Carbon Inventories. For. Ecol. Manag. 2008, 256, 482–490. [Google Scholar] [CrossRef]
  92. Sheikh, M.A.; Kumar, M.; Bussmann, R.W. Altitude Variation in Soil Organic Carbon Stock in Coniferous Subtropical and Broad Leaf Temperate Forests in Garhwal Himalaya. Carbon Balance Manag. 2009, 4, 6. [Google Scholar] [CrossRef] [PubMed]
  93. Zhang, W.J.; Wang, X.J.; Xu, M.G.; Huang, S.M.; Liu, H.; Peng, C. Soil Organic Carbon Dynamics Under Long-Term Fertilization in Arable Land of Northern China. Biogeosciences 2010, 7, 409–425. [Google Scholar] [CrossRef]
  94. Townsend, A.R.; Vitousek, P.M.; Amundson, R.R. Soil Organic Matter Dynamics Along Gradients in Temperature and Land Use on the Island of Hawaii. Ecology 1996, 76, 721–733. [Google Scholar] [CrossRef]
  95. Conant, R.T.; Klopatek, J.M.; Malin, R.C.; Klopatek, C.C. Carbon Pools and Fluxes Along an Environmental Gradient in Northern Arizona. Biogeochemistry 1998, 43, 43–61. [Google Scholar] [CrossRef]
  96. Babu, S.; Singh, R.; Avasthe, R.K.; Yadav, G.S.; Mohapatra, K.P.; Selvan, T.; Das, A.; Singh, V.K.; Valente, D.; Petrosillo, I. Soil Carbon Dynamics in Indian Himalayan Intensified Organic Rice-Based Cropping Sequences. Ecol. Indic. 2020, 114, 106292. [Google Scholar] [CrossRef]
  97. Rawat, S.; Khanduri, V.P.; Singh, B.; Riyal, M.K.; Thakur, T.K.; Kumar, M.; Cabral-Pinto, M.M. Variation in carbon stock and soil properties in different Quercus leucotrichophora forests of Garhwal Himalaya. Catena 2022, 213, 106210. [Google Scholar] [CrossRef]
  98. Rawat, D.; Mukhopadhyay, D.; Khanduri, V.P.; Singh, B.; Riyal, M.K.; Sati, S.P. Harnessing Soil Ecosystem Services for Achieving Soil-Based SDGs in Indian Himalaya. In Soil Carbon Dynamics in Indian Himalayan Region; Mishra, G., Giri, K., Nath, A.J., Francaviglia, R., Eds.; Springer: Singapore, 2023. [Google Scholar] [CrossRef]
  99. Chauhan, M.; Kumar, M.; Kumar, A. Impact of Carbon Stocks of Anogeissus latifolia on Climate Change and Socioeconomic Development: A Case Study of Garhwal Himalaya, India. Water Air Soil Pollut. 2020, 231, 436. [Google Scholar] [CrossRef]
  100. Kumar, M.; Kumar, R.; Konsam, B.; Sheikh, M.A.; Pandey, R. Above and Below-Ground Biomass Production in Pinus roxburghii Forests Along Altitudes in Garhwal Himalaya, India. Curr. Sci. 2019, 116, 1506–1514. [Google Scholar] [CrossRef]
  101. Singh, A.P.; Bijalwan, A.; Bisht, T.P.; Singh, B.; Kumar, S.; Tariyal, N. Evaluation of growth, yield, economics and soil properties of agri-horticulture systems in mid-hill situations of Himalayas. Agrofor. Syst. 2023, 97, 1113–1130. [Google Scholar] [CrossRef]
  102. Kumar, M.; Kumar, A.; Kumar, R.; Konsam, B.; Nazir, A.; Pala, B.J.A. Carbon Stock Potential in Pinus roxburghii Forests of Indian Himalayan Regions. Environ. Dev. Sustain. 2021, 23, 12463–12478. [Google Scholar] [CrossRef]
  103. Keerthika, A.; Chavan, S.B. Oxygen Production Potential of Trees in India. Curr. Sci. 2022, 122, 850. [Google Scholar] [CrossRef]
  104. Mokashi, M.V.; Ghatanatti, S.M.; Mutanal, S.M. Oxygen Productivity in Different Tree Species. Indian J. Ecol. 2021, 48, 373–375. [Google Scholar]
  105. Vikrant, K.K.; Chauhan, D.S.; Rizvi, R.H. CO2 Mitigation Potential of Traditional Agroforestry Systems along Elevations in Tehri District of North West Himalaya, India, 2023. Available online: https://www.preprints.org/manuscript/202310.1119/v1 (accessed on 2 February 2024).
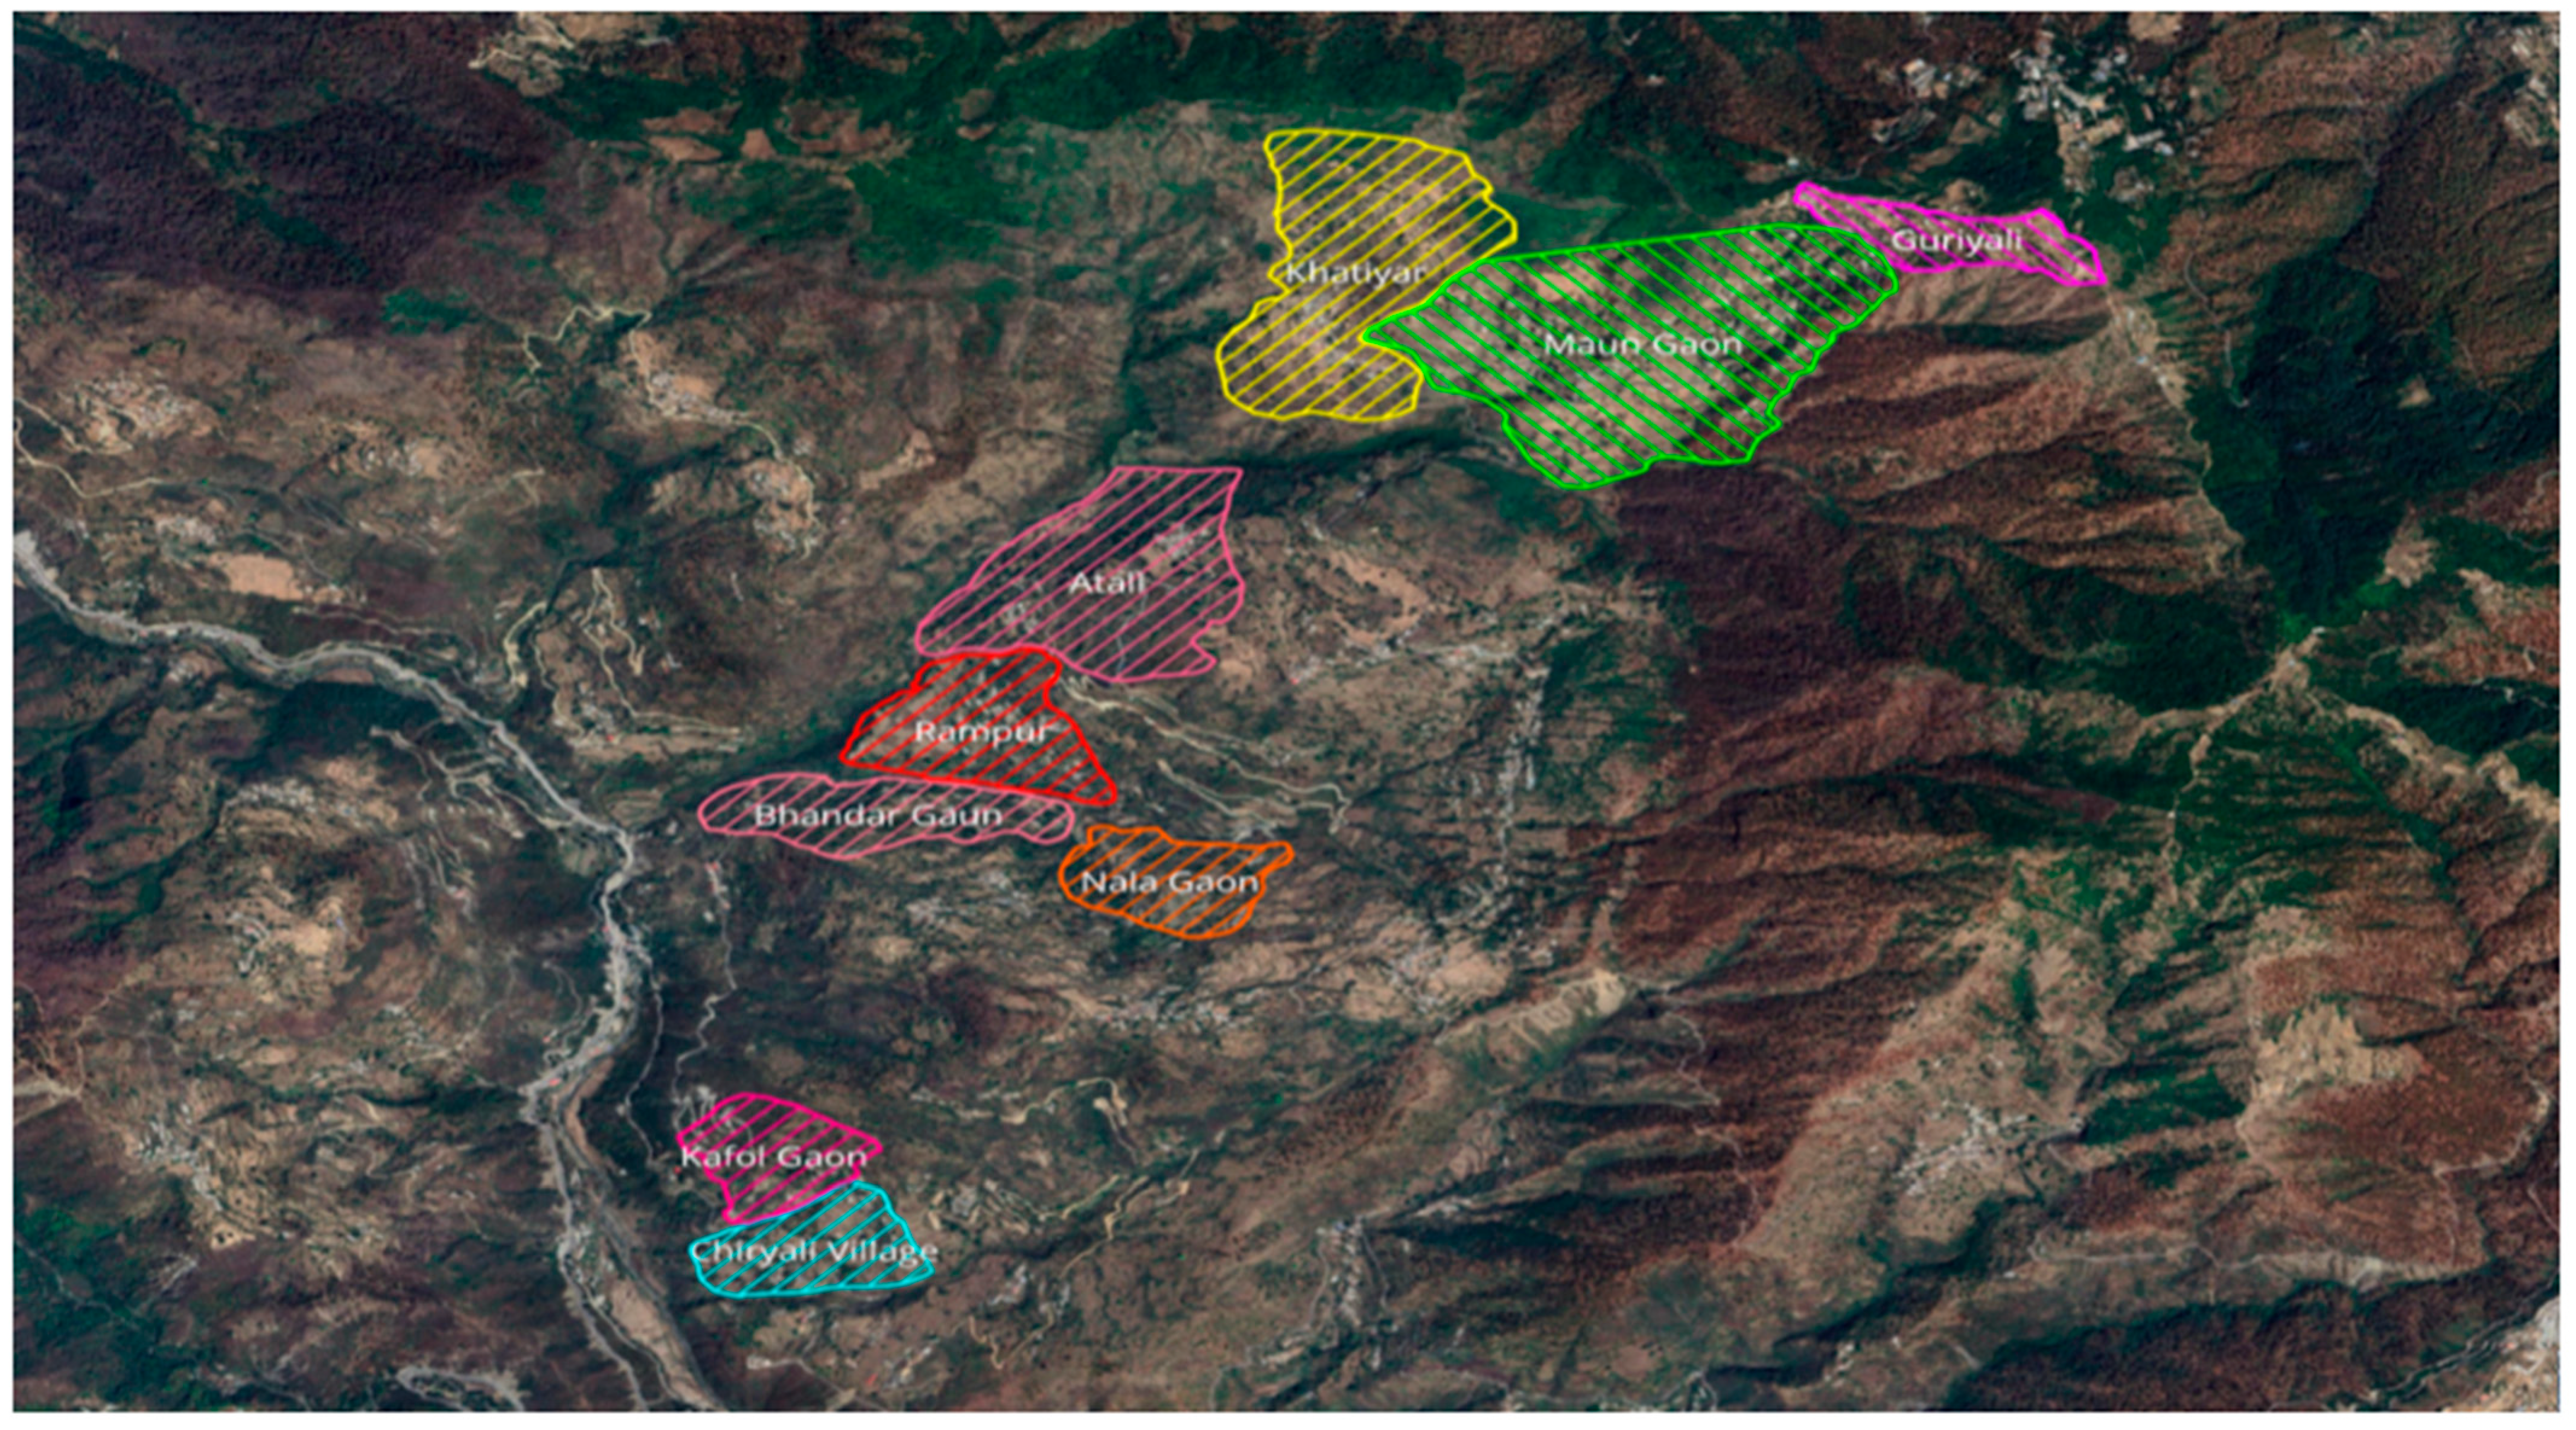
Figure 1. Location map of the study area.
Atmosphere 15 00313 g001aAtmosphere 15 00313 g001b
Figure 2. (ac) Species-wise carbon density (t ha−1) in lower, middle, and upper elevations of the agroforestry land-use system.
Atmosphere 15 00313 g002aAtmosphere 15 00313 g002b
Figure 3. (ac) Species-wise carbon density (t ha−1) in lower, middle, and upper elevations of the forest land-use system.
Atmosphere 15 00313 g003
Table 1. Geographical information of the study sites.
ElevationVillageElevationLatitudeLongitude
Lower
700–1200
Chiryali82430°16′52″ N78°22′7″ E
Kafol Gaon108630°16′27″ N78°22′1″ E
Bhandar Gaon110830°17′41″ N78°22′43″ E
Middle
1200–1700
Rampur125330°17′91″ N78°22′93″ E
Nala130230°16′28″ N78°22′49″ E
Atali144330°18′18″ N78°23′21″ E
Upper
1700–2200
Khatiyar170330°18′0″ N78°23′33″ E
Moun183730°30′21″ N78°39′44″ E
Guriyal204030°30′9″ N78°40′05″ E
Table 2. Volume equations of different tree species.
Common NameBotanical NameVolume Equation
BanjQuercus leucotrichophoraV/D2 = 0.085356/D2 − 1.258189/D + 7.702984
BhimalGrewia optivaV = −0.44075 + 7.49221D − 36.09962D2 + 71.91238D3
KhadikCeltis australisV = 0.23781 − 2.09431 × D + 7.78268 × D2
TimlaFicus auriculata√V = 0.03629 + 3.95389D − 0.84421√D
BeduFicus palmate√V = 0.03629 + 3.95389D − 0.84421√D
BuranshRhododendron arboreumV = 0.06007 − 0.21874√D + 3.63428D2
KhairAcacia catechu√ V = 0.02384 − 0.72161D + 7.46888D2 (L)
HaradTerminalia chebula√V = −0.2264 + 2.93587D (L)
Chir pinePinus roxburghii√V = 0.05131 + 3.9859D − 1.0245√D
MeluPyrus pashiaV = 0.01284 + 0.2138D2H (G)
GuriyalBauhinia variegateV = −0.04262 + 6.09491D2
-Lannea coromandelicaV = 0.19381 − 0.83928√D + 10.32053D2 (L)
DainkanMelia azedarachV = −0.03510 + 5.32981D2
Rest of species--V = 0.00855 + 0.4432D2 + 0.28813D2H
V = Volume (m3); H = Total height of the tree (m); D = Diameter at breast height (m); L = Local volume equation, R = Regional volume equation, G = General volume equation.
Table 3. Importance value index (IVI) of trees in agroforestry land-use systems at three elevations.
TreesLower Elevation (700–1200)Middle Elevation (1200–1700)Upper Elevation (1700–2200)
Density (ha−1)Frequency (%)A/F RatioIVIDensity (ha−1)Frequency (%)A/F RatioIVIDensity (ha−1)Frequency (%)A/F RatioIVI
Bauhinia variegata45.070.00.0432.0725.060.00.0324.78----
Ficus semicordata40.090.00.0243.05--------
Ougeinia oojeinensis40.080.00.0340.35--------
Celtis australis27.560.00.0328.6927.560.00.0332.9520.060.00.0238.73
Ficus auriculata10.020.00.108.14------
Grewia optiva30.070.00.0241.1742.560.00.0253.8235.0600.0459.33
Toona ciliata17.550.00.0338.0110.030.00.0447.475.020.00.0512.96
Boehmeria rugulosa17.530.00.0612.4217.560.00.0225.23----
Ficus benghalensis7.540.00.0226.15--------
Cinnamomum tamala7.530.00.038.74--------
Melia azedarach7.530.00.0310.40--------
Ficus religiosa2.550.00.0010.817.560.00.037.32----
Phyllanthus emblica--------2.510.0.104.23
Azadirachta indica----10.040.00.0312.60----
Ficus roxburghii----15.040.00.0415.7010.030.00.0415.42
Bauhinia semla----5.060.00.037.98----
Mangifera indica----12.560.00.0121.73----
Ficus palmata----7.530.00.039.487.520.00.0812.93
Lannea coromandelica----5.030.00.057.337.530.0.0313.92
Morus serrata----7.530.00.0322.4712.540.00.0222.56
Prunus cerasoides--------2.510.00.106.25
Quercus leucotricophora--------42.560.00.0548.18
Juglans regia--------7.510.00.1014.27
Bombex ceiba--------12.550.00.0244.74
Table 4. Importance value index (IVI) of trees in forest land-use systems at three elevations.
TreesLower Elevation (700–1200m)Middle Elevation (1200–1700m)Upper Elevation (1700–2200m)
Density (ha−1)Frequency (%)A/FratioIVIDensity (ha−1)Frequency (%)A/FratioIVIDensity (ha−1)Frequency (%)A/FratioIVI
Ougeiniaoojeinensis37.530.00.1730.64--------
Anogeissus latifolia37.560.00.0440.66--------
Dalbergia sissoo47.570.00.0471.10--------
Acacia catechu40.040.00.1037.14--------
Phyllanthus emblica37.550.00.0630.56--------
Terminalia chebula35.030.00.1628.44--------
Terminalia bellirica47.580.00.0361.45--------
Ficus religiosa----10.040.00.0352.47----
Lannea coromandelica----22.560.00.0372.22----
Pyrus pashia----27.560.00.0376.7817.560.00.0228.13
Punica granatum----12.550.00.0238.39----
Prunus cerasoides----27.560.00.0260.15----
Quercus leucotricophora---- 72.580.00.0564.21
Pinus roxburghii--------50.060.00.0579.69
Myrica esculenta--------35.060.00.0438.13
Rhododendron arboreum--------27.570.00.0236.48
Lyonia ovalifolia--------25.070.00.0226.35
Cornus capitata--------52.070.00.0226.32
Table 5. Oxygen (O2) production potential and carbon credits of trees in different altitudes.
Altitude
(m asl)
Total O2 Production
(Mg ha−1)
Net O2 Production
(Mg ha−1 yr−1)
Carbon Credits
(Indian Rupees)
AgroforestryForestAgroforestryForestAgroforestryForest
700–120050.56240.213.1611.5712,316.1045,077.81
1200–170063.4458.184.022.3215,659.649038.43
1700–220072.10264.103.009.9711,709.8238,843.61
Table 6. Various diversity parameters in agroforestry and forest in different altitudes.
Altitude
(masl)
Land UseMarglef
Index
(MI)
Menheink Index
(MeI)
Simpson’s, Diversity Index
(D)
Shannon-Weiner Index
(H)
Pielo Equitability
(J)
700–1200Agroforestry2.390.250.882.230.91
Forest1.270.240.612.360.66
1200–1700Agroforestry2.760.290.882.340.94
Forest1.120.420.701.620.47
1700–2200Agroforestry2.850.310.862.190.96
Forest1.300.250.722.020.66
Table 7. Carbon sequestration of agroforestry and forest trees at different altitudes.
Source of VariationDFF Ratio
AGBDBGBDTBDTCD
Altitude266.56 *25.50 *54.77 *54.79 *
Land use1387.58 *157.62 *324.41 *324.51 *
Altitude × Land use265.32 *28.39 *55.23 *55.25 *
* significant at p < 0.05.
Table 8. Variation in soil properties with altitudinal gradient in agroforestry and forest at different depths.
Altitude
(masl)
Land UseSoil Bulk Density (g cm−3)Soil Organic Carbon (%)Soil Organic Carbon Stock (Mg C ha−1)
0–15 cm15–30 cm0–15 cm15–30 cm0–15 cm15–30 cm
Lower (700–1200)Agroforestry1.181.222.632.4146.5544.10
Forest0.981.064.313.7863.3660.10
Middle (1200–1700)Agroforestry0.921.084.293.6259.2058.64
Forest1.211.272.382.2143.2042.10
Upper (1700–2200)Agroforestry1.281.362.682.4951.4650.80
Forest1.091.124.384.271.6170.56
Table 9. Soil properties of agroforestry and forest trees at different altitudes.
Source of VariationDFF Ratio
BDSOCSOCS
Altitude234.81 *100.52 *77.91
Land Use174.62 *210.39 *175.64
Depth10.0020.950.0001
Altitude × Land use21.0036.58 *18.13 *
Altitude × Depth24.80 *0.311.49
Land use × Depth19.92 *0.046.66 *
Altitude × Land use × Depth28.17 *0.175.49
* Significant at p < 0.05 level.
Disclaimer/Publisher’s Note: The statements, opinions and data contained in all publications are solely those of the individual author(s) and contributor(s) and not of MDPI and/or the editor(s). MDPI and/or the editor(s) disclaim responsibility for any injury to people or property resulting from any ideas, methods, instructions or products referred to in the content.

