Article

A Practical Approach for On-Road Measurements of Brake Wear Particles from a Light-Duty Vehicle

Ricardo UK Ltd., Shoreham Technical Centre, Shoreham-by-Sea BN43 5FG, UK
*
Author to whom correspondence should be addressed.
Atmosphere 2024, 15(2), 224; https://doi.org/10.3390/atmos15020224
Submission received: 12 January 2024 / Revised: 1 February 2024 / Accepted: 7 February 2024 / Published: 13 February 2024
(This article belongs to the Special Issue Study of Brake Wear Particle Emission)

Abstract

:
Brake wear particles are generated through frictional contact between the brake disc or brake drum and the brake pads. Some of these particles may be released into the atmosphere, contributing to airborne fine particulate matter (PM2.5). In this study, an onboard system was developed and tested to measure brake wear particles emitted under real-world driving conditions. Brake wear particles were extracted from a fixed volume enclosure surrounding the pad and disc installed on the front wheel of a light-duty vehicle. Real-time data on size distribution, number concentration, PM2.5 mass, and the contribution of semi-volatiles were obtained via a suite of instruments sub-sampling from the constant volume sampler (CVS) dilution tunnel. Repeat measurements of brake particles were obtained from a 42 min bespoke drive cycle on a chassis dynamometer, from on-road tests in an urban area, and from braking events on a test track. The results showed that particle emissions coincided with braking events, with mass emissions around 1 mg/km/brake during on-road driving. Particle number emissions of low volatility particles were between 2 and 5 × 10⁹ particles/km/brake. The highest emissions were observed under more aggressive braking. The project successfully developed a proof-of-principle measurement system for brake wear emissions from transient vehicle operation. The system shows good repeatability for stable particle metrics, such as non-volatile particle number (PN) from the solid particle counting system (SPCS), and allows for progression to a second phase of work where emissions differences between commercially available brake system components will be assessed.

Graphical Abstract

1. Introduction

Tailpipe emissions of particulate matter (PM) have decreased since the introduction of stricter emission standards and the use of exhaust particle filters. However, with the volume of traffic on the road increasing and fleets transitioning towards electric vehicles, there has been increased attention to non-exhaust emissions (NEE). NEE, which include brake wear, tyre wear, and road surface wear, as well as the resuspension of dust from roads, have been increasing and in some countries are now the dominant source of PM10 and PM2.5 from the transport sector. In a review by Harrison et al. [1], data from emission inventories were used to compare the contribution of NEE to PM emissions from road transport between different regions (road transport here excludes the resuspension of road dust). For Europe, tyre, brake, and road abrasion contributed 66% to PM10 emissions from road transport in 2018. In the UK, the contribution was higher at 79%. For California, tyre and brake wear alone contributed 85% to PM10 emissions from road transport for the same year. PM10 emissions from road transport across Delhi, India, were calculated from vehicle data and emission factors, and it was estimated that the total contribution from NEE was 86% (7% from brake, tyre, and road wear and 79% from road dust resuspension) [2]. Grange et al. [3] used filter samples, taken in Switzerland, to study the sources of PM that contributed to the increment in PM in urban and urban-traffic locations and estimated that around 50% of the PM10 was from non-exhaust emissions from vehicles. The increase is expected to continue, and it has been estimated that with a fleet consisting of 4% electric vehicles, global non-exhaust PM10 particle emissions will increase to 58.1 tonnes per kilometre by 2030, from 38.1 tonnes per kilometre in 2017 [4].
Regenerative braking systems in electric vehicles can reduce brake emissions. Bondorf et al. [5] measured particle emissions from brakes on a battery electric vehicle (BEV) with regenerative braking activated and disabled. They found that, during a real-world driving cycle, PN emissions with a size range of 4 nm to 3 μm were reduced by 89.9% when regenerative braking was activated. However, the benefit of regenerative braking on NEE can be offset somewhat by the increase in tyre wear, road wear, and the resuspension of dust as electric vehicles are typically heavier than internal combustion engine (ICE) vehicles of a similar class [6,7,8].
Brake pads consist of binder materials, fillers, friction modifiers, lubricants, and fibre reinforcers. Depending on the manufacturer, these brake components can be made up of different materials. Brake wear particles are generated when the brake disc (or drum) and brake pad surfaces are in contact. As observed in the studies reviewed by Piscitello et al. [9], Grigoratos and Martini [10], and Fussell et al. [11], the mass distribution size of particles emitted from brake pads is typically unimodal, peaking in the size range from 0.1 to 10 μm. Both unimodal and bimodal distributions have been observed for particle number distributions, and in some studies, a peak has been observed in the ultrafine range (<100 nm) caused by the formation of volatile particles when the brake reaches a critical temperature [12].
The critical temperature varies between studies but is on the order of 170–300 °C. Men et al. [13] observed a large increase in ultrafine particles around 170–270 °C, which were attributed to organic materials in the pad evaporating. Nosko and Olofsson [14] found that the mass fraction of ultrafine particles in PM10 is negligible at temperatures below 185 °C but stated that it increased to tens of a percent at temperatures above 200 °C. Peaks in ultrafine particles were found at similar critical temperature ranges by Bondorf et al. [5] (200–245 °C) and Hesse et al. [15] (180–200 °C). The critical temperature may vary with brake material. Kukutschová [16] saw ultrafine particles being created when the disc temperature reached 300 °C for a low-metallic brake pad–pearlitic grey cast iron disc pair, and Niemann et al. [17] found that the critical temperature for the formation of ultrafine particles was around 240 °C for inorganic binder materials compared to a much lower temperature of around 180 °C for pads with an organic binder. Vojtíšek-Lom et al. [18] observed a peak in particle number at 10 nm and found that the production of the ultrafine particles is dependent not only on temperature but also on the total energy dissipated and average braking power. In an on-road study, Farwick zum Hagen [19] found that particle number concentrations increased when the temperature of the brake reached ~170 °C but concluded that the higher brake temperatures were the result of the brake being enclosed during the testing, as the unenclosed brake temperature did not go above 153 °C. Similarly, Mathissen et al. [20] noted that the enclosed measurement wheel in their tests reached nearly 110 °C higher than the unenclosed wheel and that, under these conditions, the PN emissions under normal driving may be overestimated.
Under ordinary driving conditions, these critical temperatures are less likely to be reached. However, there is still large uncertainty in brake emissions, and it is important to understand the range of conditions under which these ultrafine particles can be emitted from brakes, as these smaller particles are a particular concern to human health as they can travel deep into the lungs. Studies have also shown that brake wear particles contain a range of trace metals [10,21] and that exposure to these particles can have a detrimental impact on health [22,23].
The new Euro 7 standard will now include a limit of 7 mg/km/vehicle for brake wear PM emissions for new passenger cars. The Particle Measurement Programme (PMP) informal group drafted a global technical regulation (GTR) to measure and characterise brake wear particle emissions for light-duty vehicles with weights up to 3.5 t. An interlaboratory study was undertaken to assess the proposed methodologies for measuring brake particle mass and particle number emissions [24,25,26]. The GTR will be used for assessing brake emissions for the new Euro 7 standard [27].
Both laboratory-based methods and on-road sampling have been used in studies to directly measure brake wear particle emissions. Laboratory-based methods include brake dynamometer [24,28,29,30,31,32,33], chassis dynamometer [5,20,34,35,36], and pin-on-disc [14,37,38,39,40,41,42] techniques. On-road studies involve installing a particle capture system on the vehicle to sample the particles. On-road measurements provide a better representation of brake particle emissions under real-world driving conditions; however, there are limited studies of this kind, as the technique can be complicated by the need to install the measurement equipment on the vehicle and associated safety considerations.
Studies that have performed on-road or chassis dynamometer measurements of brake wear particles typically use either an “open” system, consisting of one or more inlet probes to sample the particles as they are emitted from the brake [35,36,43,44,45], or a “closed” system, whereby the brake pad and disc are partially or fully enclosed [5,19,34,46,47,48].
The open system set up described in Chasapidis et al. [35] consisted of two stainless steel probes with holes along them, which were installed through slots in the brake calliper, connected at the other end to the analysers via conductive tubing. Kwak et al. [36,44] and Oroumiyeh and Zhu [43] used similar approaches, where the brake probe is placed close to the wheel near the brake pad, and the sample is transferred down conductive tubing to the analysers. The authors note in these studies that the brake inlet may also sample particles from the tyre and road too. Songkitti et al. [45] did not use a probe in their setup, instead installing a real-time PM sensor close to the centre of the wheel near the brake pad, thereby removing the need to transfer the sample to an analyser.
As on-road measurements can also be affected by variations in environmental conditions, contamination from tyre wear, resuspended road dust, and background ambient particulate matter, a closed system is preferable.
A key challenge with an enclosed system is ensuring the brake temperatures remain representative of real-world driving. Farwick Zum Hagen et al. [19] used computational fluid dynamics (CFD) to model the airflow around the brakes during driving, finding that the compression of air under the vehicle pushes it out through the wheels. Therefore, they designed a fixed cone-shaped system that was fixed to the outside of the wheel to collect the particles, which then fed into a sample line. The authors found, however, that the semi-enclosed brake increased in temperature when compared to the reference (unenclosed) brake on the opposite wheel, resulting in an increase in particle number once a critical temperature was reached. For the fully enclosed sampling system used by the Technische Universität Ilmenau [46,47], an inlet to the enclosure is fed with a constant flow of filtered air to ensure adequate ventilation and sample flow. The enclosure surrounds the disc and calliper with bearings to either side so that it does not rotate with the wheel, fitting within the wheel rim. Brake disc temperatures for both the enclosed and unenclosed wheels were monitored and were found to only deviate from each other by a small amount [46].
As stated above, emissions factors for NEE of particles are outdated and not necessarily representative of the current fleet. Real-world measurements of particle brake emissions can provide important information that can be used to update these emission factors and to better understand how the emissions may vary under different driving conditions. In this study we present a “proof-of-concept” on-board system for measuring and characterising brake wear particles from a light-duty vehicle, under real-world driving conditions. The ultimate aim of the study is to produce a sampling and measurement system that provides repeatable measurements and is suitable for producing PM2.5 emissions factors for different brake pad and disc components, including regenerative braking systems. The enclosed brake system was tested under different driving cycles on a chassis dynamometer, a test track, and on a public urban road.

2. Materials and Methods

2.1. System Setup

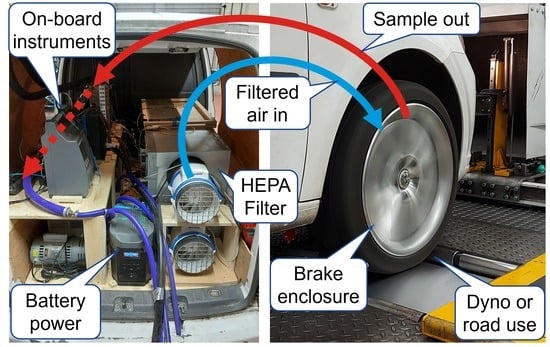
On-road tests involved outfitting the test vehicle (Volkswagen Caddy van) with an onboard sampling system and particle measurement equipment to analyse brake wear emissions. Figure 1 illustrates the schematic layout of the sampling system and instruments.
The chosen sampling method involves an enclosed brake, where the ambient air around the brake system is replaced with filtered air for analysis, and the airflow through the enclosure serves for cooling. Figure 2 shows a schematic of the wheel and brake and the design of the enclosure. The front face of the wheel is sealed, using the wheel itself as the rotating outer enclosure, with a static inner enclosure. This setup necessitates the enclosure around the brake to have a sample line to the particulate measurement system and an inlet to introduce filtered air. Achieving a complete air-tight seal for the brake enclosure is impractical due to necessary clearances for the brake line. Instead, clearances at rotating and static components need to be minimised, and the sampling volume flow rate is set to ~10% lower than the filtered air flow to ensure leakage occurs out of the brake enclosure and removing potential interferences from background particles.
Two air fans and HEPA air filters were used to provide filtered air flow at a positive pressure and adequate cooling to the brake enclosure through a 25 mm diameter, approximately 3 m long, flexible pipe. The flow was measured using an orifice type meter with range calibrated up to 548 L/min. The outlet of the brake enclosure was connected to the sample tunnel via 25 mm internal diameter conductive tubing.

2.2. Instrumentation and Measurement Systems

Two Dekati Electrical Low Pressure Impactor (ELPI+ Dekati Ltd., Kangasala, Finland) analysers were used in parallel for real-time ~1 Hz measurements of number weighted particle size distributions in the range 6 nm to 10 µm. One operated at ambient temperature to measure total solid and volatile particles, while the other, internally heated to 180 °C, sampled through a heated line to evaporate volatile particles, providing a measurement of non-volatile particles. A single Dekati eFilter (Dekati Ltd., Kangasala, Finland), which combines an ambient temperature gravimetric filter holder with a diffusion charger, was used to provide both a PM mass sample (approximately PM2.5) and a real-time mass signal from complete drive cycles. Grade GF/A 47 mm glass-fibre filters (Whatman plc, Maidstone, UK) were used in the filter holder to allow later thermogravimetric analysis for the determination of the soot and volatile fractions of particulate matter. A Q5000-IR thermogravimetric analyser (TGA) (TA Instruments, New Castle, DE, USA) was employed to determine the bulk volatile and elemental carbon fractions of brake and tyre wear particulate matter sampled using the eFilter.
For tests performed within the chassis dynamometer, selected specialist measurement equipment was also employed. These included a continuous solid particle counting system (SPCS), a Horiba MEXA 2000 SPCS (Horiba, Kyoto, Japan), which features a hot dilution (150 °C) step, a high temperature evaporation tube at 350 °C to eliminate volatile materials, and a cold dilution step to avoid recondensation. The SPCS is used to determine non-volatile particle number concentration of particle sizes ≥ 23 nm for compliance with European exhaust emissions regulations. A Horiba MEXA-ONE raw exhaust gas analyser (Horiba, Kyoto, Japan) was also employed during lab-based drive cycles to determine CO2 emissions, via non-dispersive infrared detection, as a measure of baseline test-to-test repeatability.

2.3. Additonal Instrumentation

The enclosed brake (driver’s side) and unenclosed brake (passenger side) were equipped with embedded thermocouples in the pad and rubbing thermocouples on the disc surface to compare temperatures. Additionally, a pressure sensor in the brake line measured fluid pressure to determine the applied braking force. A DEWE-43A logger (DEWESoft, Trbovlje, Slovenia) was used to acquire 10 Hz data for vehicle speed, Global Positioning System (GPS), vehicle On-Board Diagnostics (OBD), and environmental conditions. During road tests, a dash camera recorded video through the vehicle’s windscreen to collect qualitative information on driving conditions, the environment, and nearby vehicles, to quantify any unusual measurements. To power the onboard equipment, EcoFlow Delta Max lithium-ion battery packs (EcoFlow Technology, Seattle, WA, USA) with a combined capacity of 6 kWh were utilised, meeting the power demand and energy requirements for the entire duration of the individual tests.

2.4. Testing Approaches

The test programme focused on a repeated bespoke drive cycle executed on the chassis dynamometer, but it also included multiple runs around an on-road urban real-world driving route, with repeated acceleration and braking events performed on a short straight test track.
Since it was desirable for the evaluative feasibility nature of the project to maximise available particle emissions and reduce time compared to the worldwide harmonised light-duty vehicles test procedure (WLTP) brake dynamometer cycle, which is >4 h in duration, the bespoke drive cycle tested in this study was constructed from the highest particle mass-emitting sections of two existing brake dynamometer drive cycles, the Los Angeles City Traffic (LACT) [49] and worldwide harmonised light-duty vehicles test procedure (WLTP) [50]. The approximately 42 min long bespoke PG42 cycle (Figure 3) commenced with the section drawn from the LACT (1335 s) followed by an excerpt from trip 10 of the WLTP cycle (1200 s). The final cycle contains highly dynamic urban and rural driving, plus cruises and braking from high speeds, and contains braking events of various severities throughout.
On-road particle emissions measurements were undertaken from trips on the same route and distance each time, which was located on urban roads near to the Shoreham-by-Sea site of Ricardo UK. The on-road cycle is much less dynamic than the PG42. Due to various influences, including differing traffic levels and environmental conditions, the repeatability of the on-road cycle in terms of speeds, accelerations, braking events, and time was reduced compared to the PG42. The cycle distance was ~21.5 km, taking ~50 min to complete. The speed vs. time trace of a typical drive is given in Figure 4.
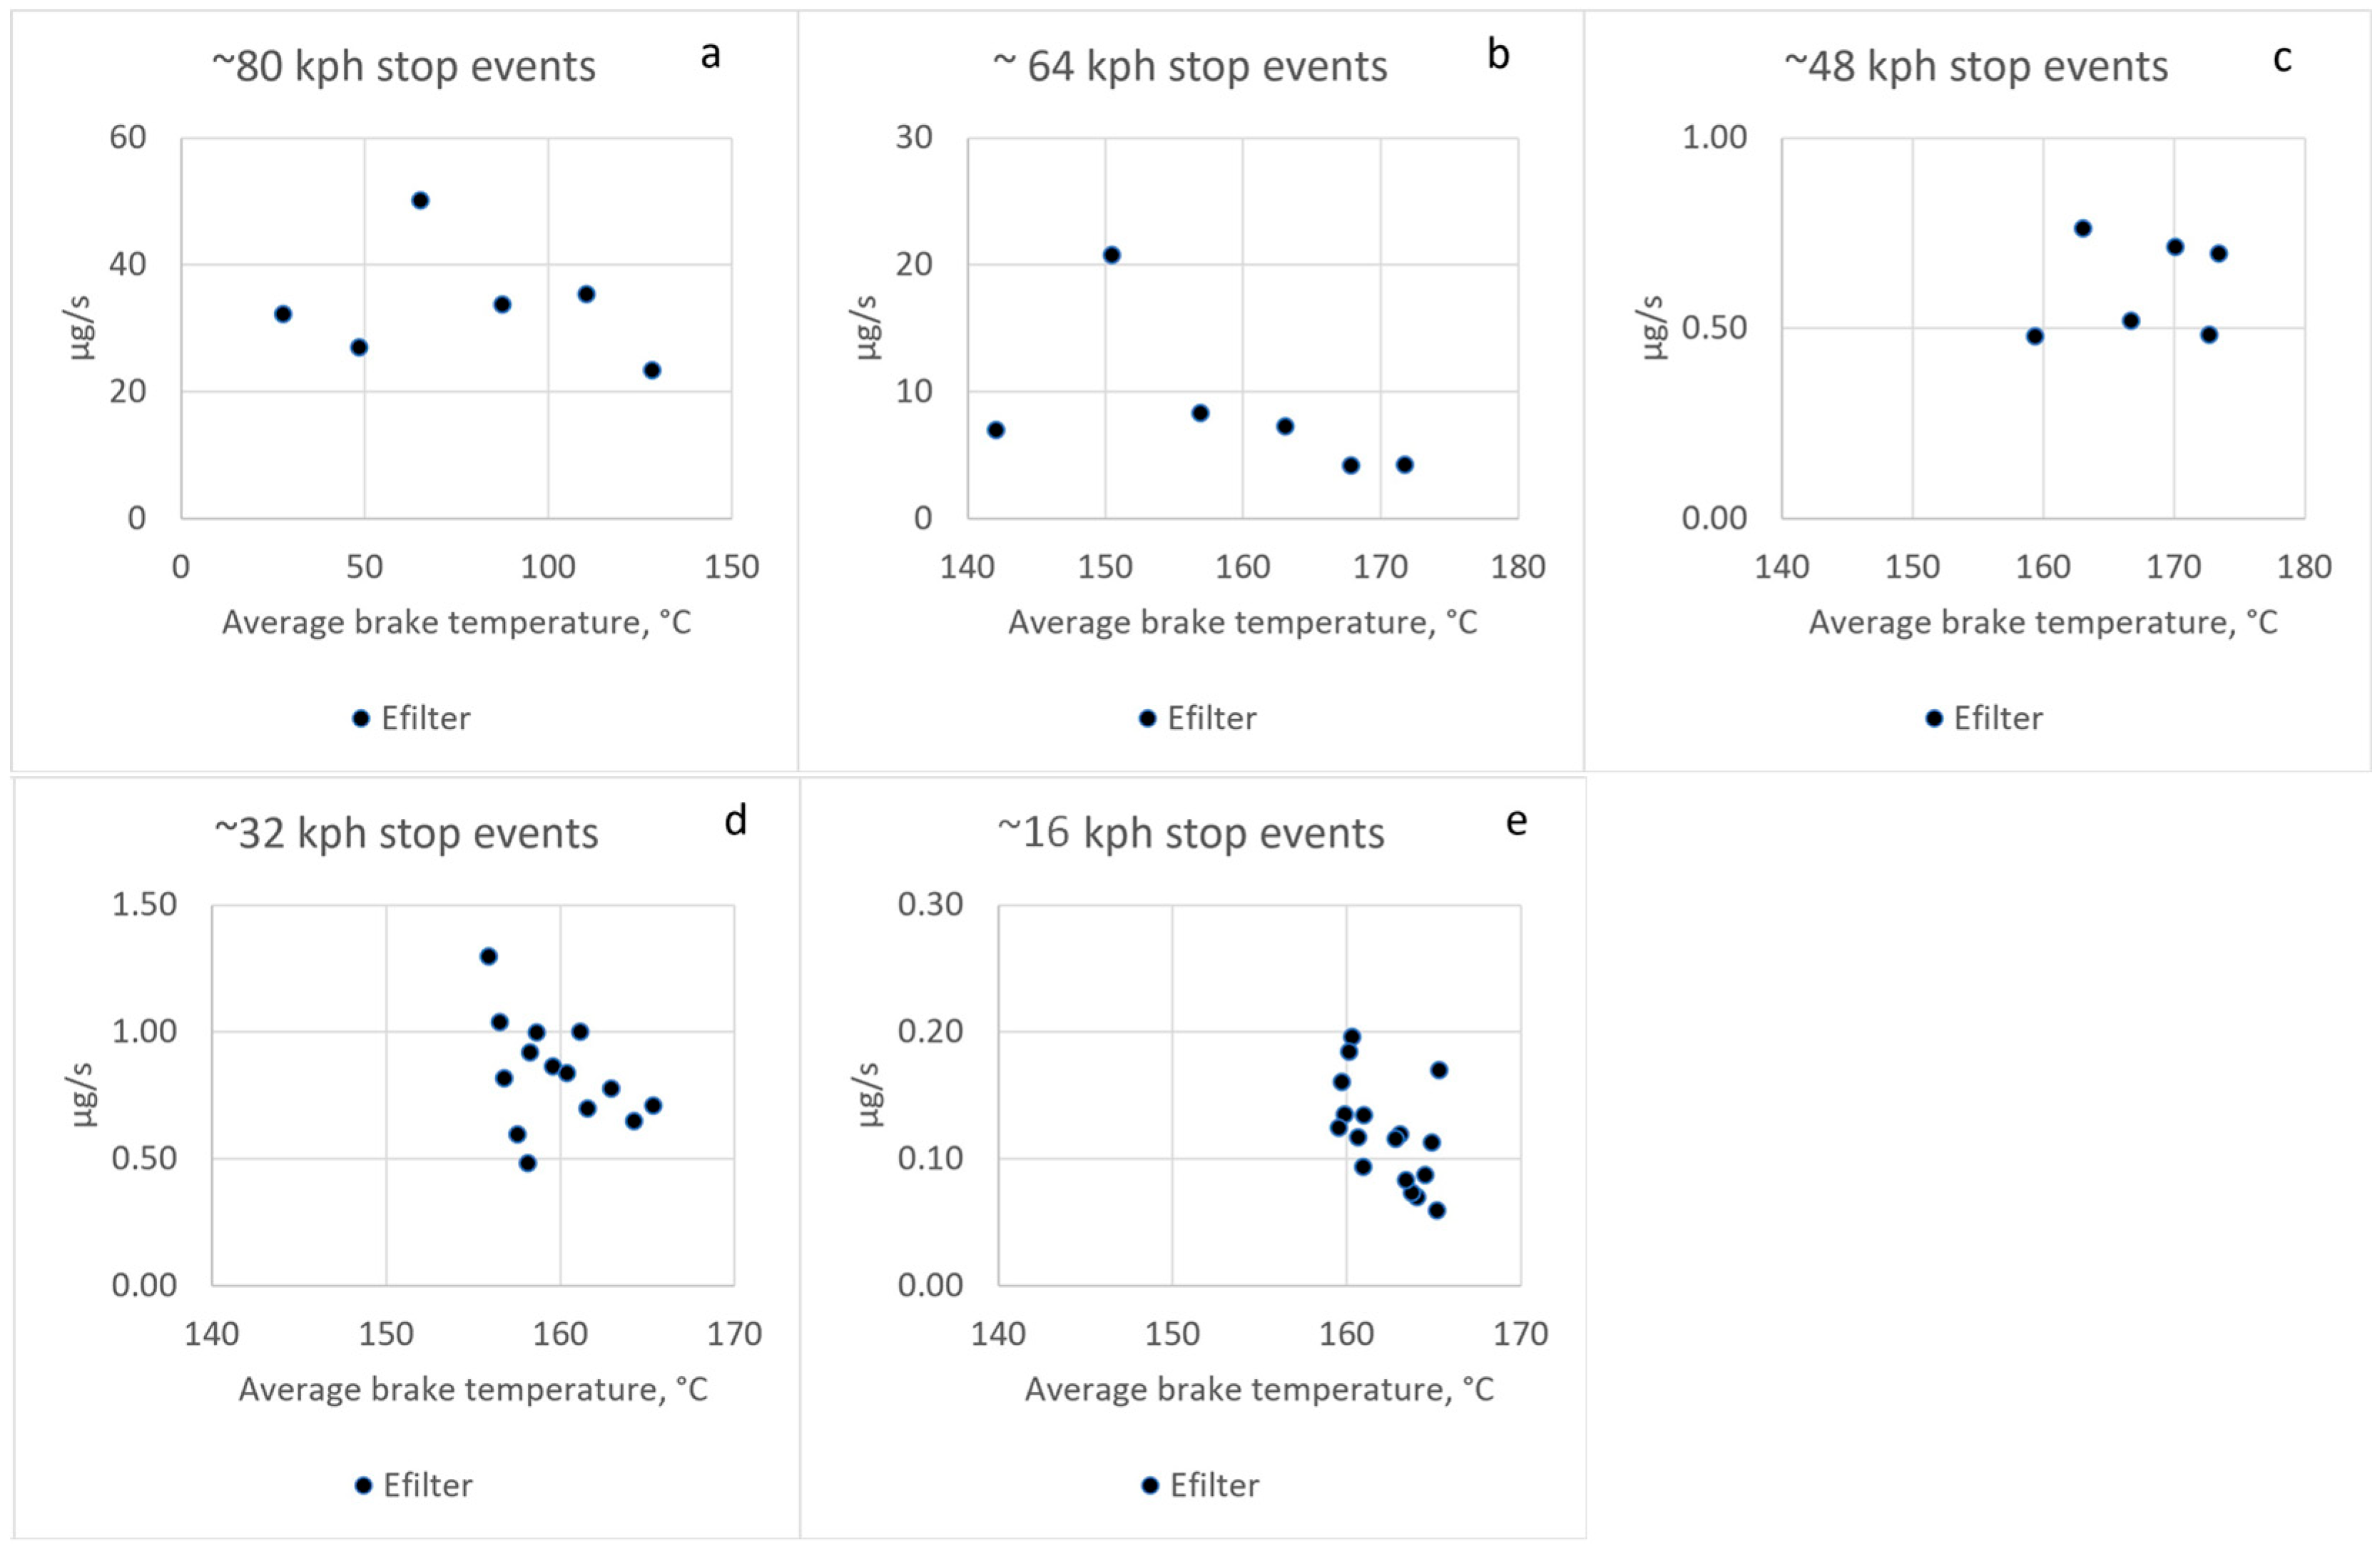
On the test track, repeated braking events were conducted. These were executed as a short acceleration to a target speed followed by either moderate braking or aggressive braking. Due to the short length of the test track, target speeds were limited to approximately 50 mph (80 kph), 40 mph (64 kph), 30 mph (48 kph), 20 mph (32 kph), and 10 mph (16 kph), with all speeds driven in a single session. Higher speeds were tested first, with data collected when driving in both directions along the test track. An example of a moderate test track braking experiment is given in Figure 5.

2.5. Emissions Determination

To calculate the particle number emissions rate (#/s), the particle number concentrations measured were multiplied by the volume flow rate in the brake enclosure (at standard atmospheric conditions) as shown in Equation (1),
E R = Q × 1000 60 × P N c o n c
where ER is the particle number emissions rate (#/s), Q is the volume flow rate through the brake enclosure (L/min), and PNconc is the particle number concentration (#/cm3). A similar equation can be used to convert the mass concentration (μg/m3) into the mass concentration emission rate (μg/s).
Due to the variability in vehicle design and aerodynamics, the time it takes for brake particles to become airborne differs, emphasising the importance of assessing brake emissions throughout the entire driving cycle, not just during braking. Using metrics like mass or number per kilometre (calculated by summing over the emissions rate for the duration of the driving cycle and dividing by the distance travelled) is therefore a suitable metric for measuring brake wear emissions.

3. Results

3.1. Transport Efficiency through the System

The transfer line, a 5 m length of 25 mm internal diameter conductive tubing, was configured with bends and vertical sections resembling the final installation in the vehicle, for testing transport efficiency in the laboratory. The isokinetic sampling system operated at a flow rate of 100–300 L/min, near its maximum with battery-powered ELPI pumps. Using the two ELPI units, simultaneous measurements of particle size distributions were taken upstream and downstream of the sampling system. The system faced a challenge with miniature combustion aerosol standard (mini-CAST)-generated soot particles and coarse test dust, yielding a polydisperse distribution with a modal diameter around 100 nm and coarse test dust with a modal diameter around 2 µm.
Particle transmission efficiency determined in the laboratory, as shown in Figure 6, remained close to 100% up to a diameter of 3 µm, with higher uncertainty at lower particle counts. Beyond this range, efficiency declined to around 20% for the largest diameters, showing a general reduction at diameters greater than 1 µm due to deposition.

3.2. Repeatability of Measurements

Despite the aggressive nature of the PG42 cycle and since its constituent parts, from LACT and WLTP cycles, are intended for execution on a brake dynamometer rig, rather than on a vehicle chassis dynamometer, the PG42 cycle proved highly repeatable. Figure 7 indicates that from nine repeat tests, the overall cycle distance (Figure 7a) and CO2 emissions (Figure 7b) showed coefficients of variance (CoVs) of ~0.2% and ~1.6%, respectively. The higher CO2 variation results from the use of different drivers and how they as individuals address driving the cycle.
Particle number emissions repeatability (Table 1) differed substantially between the cold ELPI, hot ELPI, and SPCS, the results providing insights into the nature of the particle emissions. Cold ELPI results showed the highest variance (123% CoV), indicating that the release of volatile materials from braking events is the least predictable and potentially most dependent on driver-to-driver variation and how this impacts braking pressure and temperature. The hot ELPI results showed a substantially lower CoV (40%), indicating that the majority of materials leading to high variability when total particles are measured are probably volatile below 180 °C. SPCS results show a CoV of 4%, which likely indicates that the bulk of the volatile particle emissions are eliminated and the SPCS detects stable repeatable non-volatile particles. The eFilter, at ~23% CoV, is more repeatable than the hot ELPI, but less than SPCS. This suggests that the particles that dominate PM mass emissions are more likely to be those detected by the hot ELPI and SPCS than the cold ELPI, and these are therefore non-volatile. The repeatability of gravimetric PM was ~7%, aligning more with the general trend of better mass metric repeatability than PN metrics involving volatiles.
The particle size distributions determined by the ELPI instruments (Figure 8) showed that higher cold ELPI variability can be linked to occasional high PN emissions in the <30 nm size range. These data also show that as particles sampled by the hot ELPI pass through its heated inlet, they can restructure and fragment, or evaporate and recondense, forming new modes and changing the particle size distribution. This effect can also increase the particle emissions levels above those of the cold ELPI—a counterintuitive observation since thermal treatment would be expected to eliminate volatile particles and reduce particle number emissions.
The repeatability of measurements from on-road urban drive cycles was generally improved compared to that observed for the PG42 cycles, which may be an indication of the effects of milder on-road driving limiting brake temperatures and variable volatile/semi-volatile materials’ emissions, but as with the PG42 data, the general trend was towards a lower CoV for mass metrics, as well as for hot ELPI compared to cold ELPI (Table 2).
Data from test track measurement experiments, such as those shown in Figure 5, typically consisted of six or more repeated braking events at each target speed. For comparative purposes, the mean emissions of each braking event were simply averaged. The emissions from each braking event were isolated, as shown for the hot ELPI PN emissions from an ~80 kilometres per hour (kph) braking event occurring after 250 s in the left side of Figure 9 and in the cut-out section on the right. For each braking event, particle emissions were integrated below the relevant peak, exemplified by the dashed box labelled “braking time” (Figure 9, right).

3.3. Brake Wear Emissions Events and Levels

During the PG42 cycle, discrete braking events corresponding to brake pressure events of 20 bar and greater can be clearly observed to produce particle mass from the eFilter (Figure 10a) and thermally treated particle number emissions from the SPCS and hot ELPI (Figure 10b and Figure 11b). In these figures, emissions spikes are coincident with both braking pressure signals and braking events. The highest braking pressure events lead to the highest emissions. The total particle number emissions from the cold ELPI (Figure 11a) also appear to coincide with braking events and higher braking pressures, though emissions are substantially lower than from the hot ELPI and are consequently more difficult to resolve. These figures also generally show stable and consistent baseline (maximum background) emissions in the test facility during long cruises, when brake wear would not be anticipated.
The cold ELPI data show a release of volatile particles between ~2100 s and ~2500 s during the high-speed ~135 kph cruise. This is highlighted in Figure 12 and can be seen to follow the hard braking event (~80 bar) just before 2050 s and the three subsequent braking events that follow. A very rapid rise in brake disc temperature to ~225 °C is observed with the 80-bar braking event. Since brake disc temperatures had earlier reached levels above 225 °C (>250 °C, at ~1350 s), this may indicate that a combination of the mechanical effect of braking that releases materials from the pad and the thermal effect of evaporation from these materials followed by volatile particle formation is occurring. Only the cold ELPI indicates a substantial increase in particle numbers in this period, which suggests the particles formed are volatile below the inlet temperature of the hot ELPI, ~180 °C.
Particle emissions detected by the eFilter, cold ELPI, and hot ELPI during on-road urban cycles (Figure 13a, b and c, respectively) also correspond to individual braking events and show stable emissions levels during cruises and idle periods. However, as seen from the PG42 cycle, emissions levels from the cold ELPI are lower than from the hot ELPI, indicating that some restructuring of the sample aerosol (as shown in Figure 8) leading to new particle creation occurred in the sample measured by the hot ELPI. The cold ELPI data appear substantially noisier than those measured by the other instruments, likely due to the measurement occurring at levels close to the ELPI limit of detection and, consequently, discrete emissions events being more difficult to resolve with the cold ELPI than the other instruments.

3.4. Emissions Levels

Emissions levels from PG42 and urban driving determined by the gravimetric PM approach, eFilter, cold ELPI, hot ELPI, and SPCS are shown in Figure 14. These data address emissions from one single front wheel/brake.
Mass emissions, approximating PM2.5, from the gravimetric method and eFilter are higher from the more dynamic PG42 cycle, which features more aggressive braking (~1.6 mg/km), than from the urban drive cycle (~0.92 mg/km). These levels are within the range of 0.8 to 4 mg/km for PM2.5 emissions from disc brakes recently measured from a brake dynamometer interlaboratory study [24]. Emissions from the eFilter are 20–30% of the gravimetric levels. Potential reasons for the disparity between gravimetric and eFilter emissions levels are discussed in Section 4.4.
Due to the high variability of the results, particle number emissions from the cold and hot ELPI showed similarity both to each other and between urban and PG42 cycles, although directional emissions from the PG42 were higher in both cases. Emissions levels ranged from ~2.5 × 10⁹ #/km/brake for the urban cycle to ~5.4 × 10⁹ #/km/brake for the PG42, again aligned with a recent literature value of 3 × 10⁹ #/km/brake for a representative urban cycle [20] and 5 × 10¹⁰ over a WLTC cycle [34], albeit a hybrid-electric light-duty vehicle was used in the latter study. Laboratory based tests with the SPCS, at 4.9 × 10⁹ #/km/brake, were similar to the ELPI results.

3.5. Brake Emissions Composition

The bulk chemical composition of PM filters was determined by the use of thermogravimetry. In the thermogravimetric analyser, a small sample of filter-borne PM suspended on a microbalance is heated to 550 °C in nitrogen. During this heating phase, volatile materials evaporate and are lost; this is detected as a reduction in the sample mass. Air is then introduced, and any remaining organics or elemental carbon are converted to CO2, resulting in further mass loss. Sample filters from both the urban drive and PG42 tests showed collected masses of between 5 and 15 mg of material, with the urban filters at the lower end of the range. Exposed filter areas from both cycle types were jet black, as shown for PG42 cycles in Figure 15. TGA results indicated that >95% of the sampled filter mass was neither volatile nor oxidizable, with the remaining constituents being volatiles, including water and ~1–2% of elemental carbon (Figure 16). The dominant black colour of the samples is mostly likely due to black metal oxides, (e.g., iron, copper) but would also include elemental carbon. The non-volatile fraction would also include ceramics, while the volatile fraction would include large organic molecules, such as binder materials.
Due to the design of the sampling system and the approach to using positive pressure to avoid the ingress of background materials, it was anticipated that background particle contributions from the sampling enclosure would be low. An experiment was conducted to evaluate concentrations measured from the enclosure with the vehicle static but the sampling system otherwise operating normally. Results are shown in Table 3. The data reveal that the cold ELPI background levels were approximately 50 times higher than the hot ELPI levels, indicating a prevalence of small volatile particles in the cold ELPI particle size distributions, which were effectively eliminated by the hot ELPI. The average particle concentration from the hot ELPI during the sampling period was around 85 particles/cm3. The background for the eFilter was approximately 4.4 µg/m3 (0.82 µg/s).
As shown in Table 3, PN background levels were consistent with baseline levels observed during periods between accelerations in the moderate braking experiment. However, the eFilter PM background was more than three times the in-use eFilter baseline levels (0.82 µg/s vs. ~0.25 µg/s). Consequently, it appears that brake enclosure backgrounds, for the eFilter at least, when measured with the vehicle stationary, may not accurately represent the backgrounds encountered during active testing. However, the baseline levels of PN observed during testing, and in the background experiment, did largely agree, and so baseline PN emissions levels shown in Table 3 were used to correct the results of the moderate braking experiment shown in Figure 17. Similarly, baseline eFilter levels were used to correct eFilter results.
Baseline corrected eFilter and ELPI particle emissions from moderate braking events starting at ~80 kph (50 mph), ~64 kph (40 mph), ~48 kph (30 mph), ~32 kph (20 mph), and ~16 kph (10 mph) are shown in Figure 17. Repeat measurements were averaged and 1-sigma error bars were applied. Typical braking pressures were 30 bar or below (Figure 5), which corresponded to deceleration rates on the order of 0.25 g. Results indicated a tendency toward decreased brake emissions when the initial speed at which braking was initiated was reduced. As seen from urban and PG42 drive cycles, hot ELPI emissions were higher than cold ELPI emissions.
As shown in Figure 18, it appears that both number and mass metrics exhibit an apparent quadratic correlation with peak speed, the initial velocity from which braking is initiated. This observation indicates that emissions are proportionate to the kinetic energy transferred to the braking system, which is inherently a function of velocity squared.
The particle mass emissions rate seems to decline with an increase in average brake pad temperature, as shown in Figure 19, for all vehicle speeds tested. Similarly, no correlation is observed between either hot ELPI or cold ELPI PN emissions and average brake pad temperature (Figure 20). It is important to highlight that this pattern may be influenced by the sequencing of testing, where higher-speed braking events were evaluated initially in the sequence. Also, the pad temperature throughout the experiment was ~170 °C or below, and while temperature effects below this level have been shown to be limited, transitions to temperatures above this value have been shown to lead to substantial increases in volatile particle emissions [19].
From a track-based experiment lasting ~10 min and comprising more aggressive repeated braking events, typically at brake pressures of 40–100 bar and with decelerations of closer to 0.5 g (Figure 21, ~750 s to 1350 s), particle number emissions from both the cold ELPI and hot ELPI rose during the experiment, but they did so most substantially after the enclosed pad temperature had exceeded ~180 °C (Figure 21). Hot ELPI emissions levels were higher than cold ELPI emissions, suggesting some restructuring of the particle size distribution was occurring.
PN emissions spikes were aligned with braking events and brake disc temperature spikes, and the PN emissions magnitude increased. Pad temperatures also rose but to lower levels (>100 °C lower) than the disc. Clear temperature differentials of up to 70 °C can be observed between the right-hand (enclosed) pad and disc and the left-hand unenclosed system, with peak enclosed disc and pad temperatures exceeding 450 °C and 250 °C, respectively.
After 1350 s, when the aggressive braking events were complete, pad and disc temperatures reduced. Since the discs have lower thermal inertia, their temperatures dropped faster than pad temperatures. PN emissions from both cold ELPI and hot ELPI also decayed with time, indicating outgassing of materials from the pad, with emissions levels finally reaching the baseline levels seen at the start of the experiment after 3–4 min. During the decay period, cold ELPI levels were 10–100 times higher than hot ELPI levels, indicating that the bulk of the particles emitted were volatile below 180 °C.
The impact of the ~70 °C temperature differential, between closed and unenclosed disc and pad temperatures, on PN emissions was assessed by an examination of two similar braking events at different points of the experiment (Figure 22). Braking events 1 and 2 from ~60 kph (40 mph) are performed at enclosed pad temperatures of ~60 °C and 180 °C, respectively, and indicate similar cold ELPI PN emissions and higher PN emissions at the lower pad temperature. These data suggest that at pad temperatures below ~180 °C (disc temperatures < 350 °C), a 120 °C difference in pad temperature does not substantially impact PN emissions, and therefore the 70 °C temperature differential between enclosed and unenclosed pads likely has no obvious effect on PN emissions.
Comparing PN emissions using cold and hot ELPIs (Figure 23) from urban and severe (PG42) drive cycles, with background/baseline subtraction where relevant, reveals PN emissions factors of 2 to 5 × 10⁹ #/km/brake, with average emissions throughout the moderate braking experiment similarly indicating levels around the top end of this range. From the same tests, eFilter PM emissions were in the range 0.2 to 0.6 mg/km/front wheel. Average emissions from the aggressive braking experiment, and a similar experiment conducted immediately after where disc and pad temperatures rose even higher and the enclosed pad approached 350 °C, can be seen to result in PN emissions of 1–3 orders of magnitude higher, and with cold ELPI emissions that peaked at >5 × 10¹² #/km, consistently higher than the hot ELPI emissions (>2 × 10¹² #/km peak). In these cases, the extra volatile PN formed by materials released by the high pad temperatures outweigh the effects of evaporating materials in the ELPI inlet that then form new particles through recondensation downstream. From the second extreme braking experiment, the high braking system temperatures led to significant mass emissions, up to almost 200 mg/km/front wheel. It is worth noting that the second extreme braking experiment is similar to the conditions that would be experienced on a steep downhill, tortuous route.

4. Discussion

4.1. Effect of Braking Behaviour on Emissions

Repeated aggressive braking events conducted over a short duration can lead to the generation of very high particle mass and number emissions. The cumulative energy supplied to the brake pads and discs seems to result in a near-continuous release of particulate materials, at levels well above potential regulatory limits. Although this braking behaviour is likely unrealistic for typical road use, instances of more aggressive and frequent braking may be observed among specific drivers under certain conditions. It is advisable to establish clear boundaries defining aggressive driving, similar to driving a vehicle outside the Real Driving Emissions (RDE) 95th percentile limit for tailpipe emissions [51], and to describe what qualifies as abusive driving, these being actions performed intentionally to generate unrealistically high levels of particle emissions.

4.2. Particle Size Distribution

Figure 24 illustrates average particle size distributions for various driving cycles, including urban cycles, PG42 cycles, the moderate track experiment, and both extreme track sets. The data presented in Figure 24 originate from hot ELPI measurements, while Figure 25 corresponds to cold ELPI data. In the three subfigures, the size distributions are sequentially displayed on a log y-axis, a linear y-axis, and a down-scaled linear y-axis with the x-axis tailored to depict a narrower size range (>0.1 µm), respectively.
Considering hot ELPI size distributions across all cycle types, consistent forms with varying magnitudes are shown. The ELPI heated inlet appears to stabilise the distributions. Urban, PG42, and moderate track size distributions exhibit generally similar particle concentrations below 0.2 µm, while emissions from the extreme track sets are notably higher, by approximately 10–100 times. In the size range above 0.5 µm, a discernible bimodal distribution is evident, suggested to primarily comprise non-volatile particles.
Alternatively, cold ELPI particle size distributions are less distinct but exhibit similar discrimination in magnitude to the hot ELPI size distributions. A notable difference observed with the cold ELPI is the increased abundance of volatile material within particles ranging from ~10 nm to 100 nm. While particle concentrations remain broadly similar, the mean particle size in the cold ELPI data is considerably larger. Furthermore, the similarity between size distributions in the >0.5 µm region diminishes compared to the hot ELPI data, indicating the probable presence of volatiles in this size range.
Under normal driving conditions, as reflected by the urban, PG42, and moderate braking experiment tests, higher PN levels were detected by the hot ELPI than the cold ELPI. This is counterintuitive, as the hot ELPI includes a 180 °C heated inlet to eliminate volatile particles by shifting them to the gas phase, aiming to create a more stable sample for size distribution and number concentration analysis. However, as size distribution data revealed, the heated inlet of the hot ELPI appears to evaporate some of the relatively few large particles above 2 µm with gas phase materials then subsequently recondensing to form a new mode peaking at ~20 nm, at levels 100× higher than those evaporated—albeit with a concurrent reduction in PM.
Subjecting brake particle emissions to evaporation within the heated inlet during hot ELPI measurements appears to generate more consistent and standardised particle size distributions, even when dealing with wide concentration ranges. To achieve a non-size-specific particle number measurement that is both consistent and replicable, it is advisable to implement robust thermal conditioning techniques, including the removal of volatiles, as seen in the PMP approach. Following this, a secondary measurement becomes necessary to account for volatile particles and materials. This supplementary measurement could involve assessing mass, capturing both solid and particle-phase volatile materials, and utilising a method such as an eFilter.
The Euro 7 proposal from November 2022 implies the need for metrics of both volatile and non-volatile PN [52], and to achieve a stable repeatable non-volatile measurement, a robust volatile removal process will be required using a high-temperature evaporation tube (≥350 °C, as used in the SPCS in this work) or catalytic stripper, while combined (total) volatile and non-volatile particles are measured in parallel.

4.3. Effect of Brake Pad and Disc Temperature on Emission Levels

The approach taken in this study was to almost completely enclose the brake pad and disc and to constantly flush through the enclosure with filtered air that creates a slight overpressure. This has the benefits of ensuring that it is not necessary to totally seal the enclosure, and that any leakage that the system experiences is out from the enclosure, rather than in from the outside. Since the emissions and filtered air are mixed well by the wheel’s rotation and filtered air inflow, the emissions are calculated from concentrations exiting the enclosure, and any leak from the enclosure is irrelevant. As a consequence, the baseline emissions between braking events can be seen to return to very low levels, typically less than 1% of emissions levels, and it is not considered necessary to subtract a background when quantifying emissions.
The airflow through the enclosure also provides brake cooling, but brake emissions are seen to be sensitive to temperature. Thermocouples inside the brake pads and in contact with the brake discs measure the temperature of the enclosed brake and that of the opposite, unenclosed wheel. During normal on-road driving conditions, brake pad and rotor temperatures typically range between ambient and ~150 °C. There are circumstances when the brake temperatures exceed these values on the road, for example, repeated accelerations and decelerations experienced in city driving conditions, the descent of gradients where the drivetrain is not being used to provide deceleration, or when heavy loads and/or towing is taking place. The temperatures reached are very vehicle- and brake-specific and driving style-dependent, but brake disc surface temperatures can have excursions in excess of 600 °C. Friction materials tend to have a higher thermal inertia and a lower thermal conductivity, so during brief applications, the pads tend to experience lower peak temperatures but also cool at a lower rate.
The urban on-road test disc temperatures peaked at ~144 °C and pads peaked at ~109 °C, with a ~33 °C differential between the enclosed and open side. The equivalent peak disc temperatures seen during the PG42 dynamometer test were 242 °C with a ~25 °C differential across the axle and pad temperatures of 256 °C with a 116 °C differential. The large pad differential on the dynamometer may be due to the limited cooling airflow around the calliper for the stationary vehicle. However, during repeated extreme braking tests, where the enclosed brake experienced much higher temperatures than the unenclosed brake, similar PN concentrations suggested the elevated temperature has little impact if that disc temperature is below ~350 °C and the pad temperature is below ~180 °C. Nonetheless, increased airflow through the enclosure would help reduce any temperature difference.

4.4. eFilter vs. Gravimetric Particualte Matter Measurement

While the gravimetric filter method captures gas-phase volatiles, plus both volatile and solid particles, the real-time eFilter method exclusively identifies particles. Consequently, as the GF/A filter used in this work has a high affinity for volatiles, the filter-based approach is anticipated to give a higher mass reading. The data from the eFilter, which reflect the lung deposited surface area (LDSA) of particles, may offer a more precise indication of the health effects associated with particles, as opposed to the combined factors of particle mass and chemistry reported by the filter method. The eFilter determines mass based on charges transferred to particles, a charging efficiency model, an assumed particle size distribution, and assumed particle density. It is worth noting that materials released from brakes may introduce variations in particle size distribution, potentially favouring larger particles with different chemical compositions and likely higher densities (of metal oxides) than the default settings of the eFilter (carbon dominant ambient PM). These factors collectively lead to a probable underestimation of the actual particulate mass. In fact, the eFilter is intended to provide insights into the real-time accumulation of the simultaneously collected filter PM sample. However, optimising the eFilter algorithm may enable a mass metric specifically tailored for real-time brake wear measurement.

4.5. Brake Wear Emission Factors

Emission factors are typically expressed as g/km/vehicle or mg/km/vehicle. As this study only involves measurements from one front brake, it is necessary to make some assumptions to derive vehicle-based emission factors. Here, we have assumed that the braking forces distribute 70% to the front brakes and 30% to the rear brakes, and that brake PM2.5 emissions scale proportionally with braking forces at the front and rear wheels of the vehicle. The average mass emissions determined by the eFilter of 1.6 mg/km for the sampled brake system from the PG42 cycle and 0.92 mg/km from the on-road urban driving would suggest whole-vehicle PM2.5 emissions of ~4.6 mg/km/vehicle and ~2.6 mg/km/vehicle, respectively. These values are comparable to PM2.5 EF measured by Hagino et al. [31] in a brake dynamometer study, with a range of 0.04–1.2 mg/km/vehicle, and a value of 2.66 mg/km/veh recently calculated by Zhang et al. [29], from a test cycle that represented real world driving on a brake dynamometer. The road vehicle brake wear emission factors given by the latest version of the EMEP/EEA Guidebook (Sectoral chapter 1.A.3.b.vi) for PM2.5 is 4.8 mg/km/veh for medium internal combustion engine (ICE) passenger cars and N1 ICE Class 1 vans [53]. The values found here are in good agreement with these. Using the same approach to estimating the whole vehicle PN emissions as described above for PM2.5, PN emissions would be on the order 1.4 × 10¹⁰ #/km/vehicle.

4.6. Study Limitations

The sampling system developed in this project is restricted to isokinetically sampling ~PM2.5 through the practical limitations of flow rates and power requirements achievable on the test vehicle. The ultimate objective of this study was to develop a system suitable for creating emissions factors for PM2.5, and the current system can deliver that. Nonetheless, extending the measured size range to 10µm will be considered as part of a system optimisation step in the next phase of the work.
The brake enclosure excludes many external factors that might influence particle formation, particularly volatile particle formation. Even when driving on public roads, the contents of the enclosure are not exposed to ambient aerosols, moisture, and the same temperature fluctuations that an unenclosed brake system would see. However, the system is intended for the purposes of standardising emissions measurements, pragmatically targeting repeatability and comparability rather than an exact replication of the real-world emissions environment and influences.
It is possible that aggregation of emitted particles may occur in the brake enclosure. This could lead to an increase in the mean modal diameter of the PN emissions and a reduction in the overall number of particles emitted. The likelihood of this occurring is difficult to assess; however, high clean air flow rates through the enclosure to conduct the particles to the sampling tunnel and to provide cooling also reduce particle concentrations and residence time in the enclosure. Together, these reduce the probability of substantial coagulation occurring.
This study has not considered the chemical nature of the particles in any great detail. The collected PM filters could be subjected to off-line analyses, for example, to compare with the disc and pad composition. When tests are performed in the vehicle test laboratory using the chassis dynamometer, the sampling system could be used to allow dedicated on- and off-line sampling and analyses of the brake wear emissions.
As discussed in Section 4.3, it is recognised that there are currently temperature differences between the brake enclosure environment and the opposite, unenclosed braking elements. Higher temperatures in the brake enclosure may promote the production of volatile particle emissions earlier than would happen from components outside it. There appear to be temperature thresholds at which components within the brake pads either thermally decompose or evaporate—one such occurrence was observed with pad temperatures of around 180 °C. If the brake enclosure is substantially hotter than the unenclosed brake system, then emissions from transient cycles will occur earlier from the enclosure than from the unenclosed wheel, and so emissions will not be fully aligned with the drive cycle under test. Further work will seek to optimise sampling, including increasing sample flow through the enclosure and therefore reducing brake system temperatures and the differences between enclosed and unenclosed systems.

5. Conclusions

In this study, an onboard system for measuring and characterising brake wear particles under real-world driving conditions was designed, built, and tested. The system consisted of a brake enclosure that surrounded the brake disc and pad, which was flushed with HEPA-filtered air to aid in the cooling of the brakes and to create a positive pressure to prevent any background particles from entering the enclosure. Particles were directed towards a sample tunnel in which a suite of instruments were installed to measure particle number concentration and size distribution, particle mass, and the contribution of semi-volatiles. Results from the laboratory analysis show that it is challenging to achieve high transmission efficiency of large particles (>3 μm) from brake wear with an onboard system; therefore, the mass measurements in this study are limited to PM2.5.
The system developed is shown to be capable of real-time measurements of brake wear particles on a chassis dynamometer, including on the road, with negligible influences from background sources. Average particle mass emissions during a 42 min cycle on the chassis dynamometer (based on two well-known braking cycles) and during an on-road test in an urban area were ~1.6 mg/km/brake and ~0.92 mg/km/brake, respectively. The higher emissions from the PG42 cycle are likely related to the aggressive braking events that took place, which were not present during the on-road tests. Particle number emissions were also higher during the PG42 cycle with an average emission of ~5.4 × 10⁹ #/km/brake, compared to 2.5 × 10⁹ #/km/brake on-road.
Moderate braking promoted during test-track evaluations revealed a proportional increase in both particle number and particle mass emissions, corresponding to the kinetic energy provided to the brakes. When subjected to extreme braking episodes, brake pad temperatures increased to 350 °C. This high-severity scenario resulted in a substantial 1–3 orders of magnitude elevation of particle number (PN) emissions, and particle mass emissions were more than 300 times higher than those observed during moderate braking events.
This project has successfully developed a proof-of-principle measurement system for brake wear emissions from transient vehicle operation. The system shows good repeatability for stable particle metrics, such as non-volatile PN from the SPCS, and allows us to progress to a second phase of work where we will assess emissions differences between commercially available brake system components.

Author Contributions

Conceptualization, J.A., L.J.K., M.C. and I.M.; methodology, J.A., L.J.K., M.C., I.M., J.N., J.S., S.d.V. and G.W.; formal analysis, J.A., L.J.K., M.C. and I.M.; investigation, J.A., L.J.K., M.C., I.M., J.S., S.d.V. and G.W.; writing—original draft preparation, J.A. and L.J.K.; writing—review and editing, M.C., J.N., G.W. and J.S.; visualization, J.A. and M.C. All authors have read and agreed to the published version of the manuscript.

Funding

This study was funded by Department of Transport, UK, T0018-TETI0037.

Institutional Review Board Statement

Not applicable.

Informed Consent Statement

Not applicable.

Data Availability Statement

Data presented are available on request from the corresponding author. The data are not publicly available because the complete datasets are extremely large and not in an easily transmittable format.

Acknowledgments

The authors would like to thank Dekati for their technical support and the Arup-AECOM consortium for their project management input.

Conflicts of Interest

The authors declare no conflicts of interest. The funders had no role in the design of the study; in the collection, analyses, or interpretation of data; in the writing of the manuscript; or in the decision to publish the results. Jon Andersson, Louisa J. Kramer, Michael Campbell, Ian Marshall, John Norris, Jason Southgate, Simon de Vries and Gary Waite are employees of Ricardo UK Ltd. The paper reflects the views of the scientists, and not the company.

Nomenclature

CFDComputational fluid dynamics
CoVCoefficients of variance
CVSConstant volume sampler
ELPIElectrical Low Pressure Impactor
EREmissions rate [#/s or μg/s]
GTRGlobal technical regulation
HEPAHigh-efficiency particulate air
ICEInternal combustion engine
LACTLos Angeles City Traffic cycle
mini-CASTMiniature combustion aerosol standard
OBDOn-Board Diagnostics
PG4242 min particle generating test drive cycle
PMPParticle Measurement Programme
PNconcParticle number concentration [#/cm3]
QVolume flow rate through the brake enclosure [L/min]
RDEReal Driving Emissions
SPCSSolid particle counting system
WLTPWorldwide Light vehicle Test Procedure

References

  1. Harrison, R.M.; Allan, J.; Carruthers, D.; Heal, M.R.; Lewis, A.C.; Marner, B.; Murrells, T.; Williams, A. Non-Exhaust Vehicle Emissions of Particulate Matter and VOC from Road Traffic: A Review. Atmos. Environ. 2021, 262, 118592. [Google Scholar] [CrossRef]
  2. Singh, V.; Biswal, A.; Kesarkar, A.P.; Mor, S.; Ravindra, K. High Resolution Vehicular PM10 Emissions over Megacity Delhi: Relative Contributions of Exhaust and Non-Exhaust Sources. Sci. Total Environ. 2020, 699, 134273. [Google Scholar] [CrossRef]
  3. Grange, S.K.; Fischer, A.; Zellweger, C.; Alastuey, A.; Querol, X.; Jaffrezo, J.-L.; Weber, S.; Uzu, G.; Hueglin, C. Switzerland’s PM10 and PM2.5 Environmental Increments Show the Importance of Non-Exhaust Emissions. Atmos. Environ. X 2021, 12, 100145. [Google Scholar] [CrossRef]
  4. OCED. Non-Exhaust Particulate Emissions from Road Transport: An Ignored Environmental Policy Challenge; OCED: Paris, France, 2020. [Google Scholar]
  5. Bondorf, L.; Köhler, L.; Grein, T.; Epple, F.; Philipps, F.; Aigner, M.; Schripp, T. Airborne Brake Wear Emissions from a Battery Electric Vehicle. Atmosphere 2023, 14, 488. [Google Scholar] [CrossRef]
  6. Liu, Y.; Chen, H.; Li, Y.; Gao, J.; Dave, K.; Chen, J.; Li, T.; Tu, R. Exhaust and Non-Exhaust Emissions from Conventional and Electric Vehicles: A Comparison of Monetary Impact Values. J. Clean. Prod. 2022, 331, 129965. [Google Scholar] [CrossRef]
  7. Beddows, D.C.S.; Harrison, R.M. PM10 and PM2.5 Emission Factors for Non-Exhaust Particles from Road Vehicles: Dependence upon Vehicle Mass and Implications for Battery Electric Vehicles. Atmos. Environ. 2021, 244, 117886. [Google Scholar] [CrossRef]
  8. Timmers, V.R.J.H.; Achten, P.A.J. Non-Exhaust PM Emissions from Electric Vehicles. Atmos. Environ. 2016, 134, 10–17. [Google Scholar] [CrossRef]
  9. Piscitello, A.; Bianco, C.; Casasso, A.; Sethi, R. Non-Exhaust Traffic Emissions: Sources, Characterization, and Mitigation Measures. Sci. Total Environ. 2021, 766, 144440. [Google Scholar] [CrossRef]
  10. Grigoratos, T.; Martini, G. Brake Wear Particle Emissions: A Review. Environ. Sci. Pollut. Res. 2015, 22, 2491–2504. [Google Scholar] [CrossRef]
  11. Fussell, J.C.; Franklin, M.; Green, D.C.; Gustafsson, M.; Harrison, R.M.; Hicks, W.; Kelly, F.J.; Kishta, F.; Miller, M.R.; Mudway, I.S.; et al. A Review of Road Traffic-Derived Non-Exhaust Particles: Emissions, Physicochemical Characteristics, Health Risks, and Mitigation Measures. Environ. Sci. Technol. 2022, 56, 6813–6835. [Google Scholar] [CrossRef]
  12. Perricone, G.; Olofsson, U.; Wahlström, J.; Alemani, M.; Matejka, V. A Test Stand Study on the Volatile Emissions of a Passenger Car Brake Assembly. Atmosphere 2020, 10, 263. [Google Scholar] [CrossRef]
  13. Men, Z.; Zhang, X.; Peng, J.; Zhang, J.; Fang, T.; Guo, Q.; Wei, N.; Zhang, Q.; Wang, T.; Wu, L.; et al. Determining Factors and Parameterization of Brake Wear Particle Emission. J. Hazard. Mater. 2022, 434, 128856. [Google Scholar] [CrossRef]
  14. Nosko, O.; Olofsson, U. Quantification of Ultrafine Airborne Particulate Matter Generated by the Wear of Car Brake Materials. Wear 2017, 374–375, 92–96. [Google Scholar] [CrossRef]
  15. Hesse, D.; Hamatschek, C.; Augsburg, K.; Weigelt, T.; Prahst, A.; Gramstat, S. Testing of Alternative Disc Brakes and Friction Materials Regarding Brake Wear Particle Emissions and Temperature Behavior. Atmosphere 2021, 12, 436. [Google Scholar] [CrossRef]
  16. Kukutschová, J.; Moravec, P.; Tomášek, V.; Matějka, V.; Smolík, J.; Schwarz, J.; Seidlerová, J.; Šafářová, K.; Filip, P. On Airborne Nano/Micro-Sized Wear Particles Released from Low-Metallic Automotive Brakes. Environ. Pollut. 2011, 159, 998–1006. [Google Scholar] [CrossRef]
  17. Niemann, H.; Winner, H.; Asbach, C.; Kaminski, H.; Frentz, G.; Milczarek, R. Influence of Disc Temperature on Ultrafine, Fine, and Coarse Particle Emissions of Passenger Car Disc Brakes with Organic and Inorganic Pad Binder Materials. Atmosphere 2020, 11, 1060. [Google Scholar] [CrossRef]
  18. Vojtíšek-Lom, M.; Vaculík, M.; Pechout, M.; Hopan, F.; Arul Raj, A.F.; Penumarti, S.; Horák, J.S.; Popovicheva, O.; Ondráček, J.; Doušová, B. Effects of Braking Conditions on Nanoparticle Emissions from Passenger Car Friction Brakes. Sci. Total Environ. 2021, 788, 147779. [Google Scholar] [CrossRef]
  19. Farwick Zum Hagen, F.H.; Mathissen, M.; Grabiec, T.; Hennicke, T.; Rettig, M.; Grochowicz, J.; Vogt, R.; Benter, T. On-Road Vehicle Measurements of Brake Wear Particle Emissions. Atmos. Environ. 2019, 217, 116943. [Google Scholar] [CrossRef]
  20. Mathissen, M.; Grigoratos, T.; Lahde, T.; Vogt, R. Brake Wear Particle Emissions of a Passenger Car Measured on a Chassis Dynamometer. Atmosphere 2019, 10, 556. [Google Scholar] [CrossRef]
  21. Thorpe, A.; Harrison, R.M. Sources and Properties of Non-Exhaust Particulate Matter from Road Traffic: A Review. Sci. Total Environ. 2008, 400, 270–282. [Google Scholar] [CrossRef] [PubMed]
  22. Selley, L.; Schuster, L.; Marbach, H.; Forsthuber, T.; Forbes, B.; Gant, T.W.; Sandström, T.; Camiña, N.; Athersuch, T.J.; Mudway, I.; et al. Brake Dust Exposure Exacerbates Inflammation and Transiently Compromises Phagocytosis in Macrophages. Metallomics 2020, 12, 371–386. [Google Scholar] [CrossRef] [PubMed]
  23. Gasser, M.; Riediker, M.; Mueller, L.; Perrenoud, A.; Blank, F.; Gehr, P.; Rothen-Rutishauser, B. Toxic Effects of Brake Wear Particles on Epithelial Lung Cells in Vitro. Part. Fibre Toxicol. 2009, 6, 30. [Google Scholar] [CrossRef]
  24. Grigoratos, T.; Mathissen, M.; Vedula, R.; Mamakos, A.; Agudelo, C.; Gramstat, S.; Giechaskiel, B. Interlaboratory Study on Brake Particle Emissions—Part I: Particulate Matter Mass Emissions. Atmosphere 2023, 14, 498. [Google Scholar] [CrossRef]
  25. Mathissen, M.; Grigoratos, T.; Gramstat, S.; Mamakos, A.; Vedula, R.; Agudelo, C.; Grochowicz, J.; Giechaskiel, B. Interlaboratory Study on Brake Particle Emissions Part II: Particle Number Emissions. Atmosphere 2023, 14, 424. [Google Scholar] [CrossRef]
  26. Storch, L.; Hamatschek, C.; Hesse, D.; Feist, F.; Bachmann, T.; Eichler, P.; Grigoratos, T. Comprehensive Analysis of Current Primary Measures to Mitigate Brake Wear Particle Emissions from Light-Duty Vehicles. Atmosphere 2023, 14, 712. [Google Scholar] [CrossRef]
  27. UNECE. UN GTR No. 24—Laboratory Measurement of Brake Emissions for Light-Duty Vehicles; UNECE: Geneva, Switzerland, 2023. [Google Scholar]
  28. Garg, B.D.; Cadle, S.H.; Mulawa, P.A.; Groblicki, P.J.; Laroo, C.; Parr, G.A. Brake Wear Particulate Matter Emissions. Environ. Sci. Technol. 2000, 34, 4463–4469. [Google Scholar] [CrossRef]
  29. Zhang, Q.; Fang, T.; Men, Z.; Wei, N.; Peng, J.; Du, T.; Zhang, X.; Ma, Y.; Wu, L.; Mao, H. Direct Measurement of Brake and Tire Wear Particles Based on Real-World Driving Conditions. Sci. Total Environ. 2024, 906, 167764. [Google Scholar] [CrossRef]
  30. Vasiljević, S.; Glišović, J.; Lukić, J.; Miloradović, D.; Stanojević, M.; Đorđević, M. Analysis of Parameters Influencing the Formation of Particles during the Braking Process: Experimental Approach. Atmosphere 2023, 14, 1618. [Google Scholar] [CrossRef]
  31. Hagino, H.; Oyama, M.; Sasaki, S. Laboratory Testing of Airborne Brake Wear Particle Emissions Using a Dynamometer System under Urban City Driving Cycles. Atmos. Environ. 2016, 131, 269–278. [Google Scholar] [CrossRef]
  32. Hagino, H.; Oyama, M.; Sasaki, S. Airborne Brake Wear Particle Emission Due to Braking and Accelerating. Wear 2015, 334–335, 44–48. [Google Scholar] [CrossRef]
  33. Huber, M.P.; Fischer, P.; Mamakos, A.; Steiner, G.; Klug, A. Measuring Brake Wear Particles with a Real-Driving Emissions Sampling System on a Brake Dynamometer; SAE: Warrendale, PA, USA, 2022. [Google Scholar] [CrossRef]
  34. Dimopoulos Eggenschwiler, P.; Schreiber, D.; Habersatter, J. Brake Particle PN and PM Emissions of a Hybrid Light Duty Vehicle Measured on the Chassis Dynamometer. Atmosphere 2023, 14, 784. [Google Scholar] [CrossRef]
  35. Chasapidis, L.; Grigoratos, T.; Zygogianni, A.; Tsakis, A.; Konstandopoulos, A.G. Study of Brake Wear Particle Emissions of a Minivan on a Chassis Dynamometer. Emiss. Control Sci. Technol. 2018, 4, 271–278. [Google Scholar] [CrossRef]
  36. Kwak, J.; Kim, H.; Lee, J.; Lee, S. Characterization of Non-Exhaust Coarse and Fine Particles from on-Road Driving and Laboratory Measurements. Sci. Total Environ. 2013, 458–460, 273–282. [Google Scholar] [CrossRef]
  37. Alemani, M.; Gialanella, S.; Straffelini, G.; Ciudin, R.; Olofsson, U.; Perricone, G.; Metinoz, I. Dry Sliding of a Low Steel Friction Material against Cast Iron at Different Loads: Characterization of the Friction Layer and Wear Debris. Wear 2017, 376–377, 1450–1459. [Google Scholar] [CrossRef]
  38. Varriale, F.; Carlevaris, D.; Wahlström, J.; Malmborg, V.; Lyu, Y. On the Impact of Pad Material Ingredients on Particulate Wear Emissions from Disc Brakes. Results Eng. 2023, 19, 101397. [Google Scholar] [CrossRef]
  39. Wei, L.; Choy, Y.S.; Cheung, C.S. The Effect of Braking Conditions on the Particular Matter Emissions and Brake Squeal. Wear 2023, 530–531, 205045. [Google Scholar] [CrossRef]
  40. Candeo, S.; Leonardi, M.; Gialanella, S.; Straffelini, S. Influence of Contact Pressure and Velocity on the Brake Behaviour and Particulate Matter Emissions. Wear 2023, 514–515, 204579. [Google Scholar] [CrossRef]
  41. Lyu, Y.; Leonardi, M.; Wahlström, J.; Gialanella, S.; Olofsson, U. Friction, Wear and Airborne Particle Emission from Cu-Free Brake Materials. Tribol. Int. 2020, 141, 105959. [Google Scholar] [CrossRef]
  42. Wahlström, J.; Söderberg, A.; Olander, L.; Jansson, A.; Olofsson, U. A Pin-on-Disc Simulation of Airborne Wear Particles from Disc Brakes. Wear 2010, 268, 763–769. [Google Scholar] [CrossRef]
  43. Oroumiyeh, F.; Zhu, Y. Brake and Tire Particles Measured from On-Road Vehicles: Effects of Vehicle Mass and Braking Intensity. Atmos. Environ. 2021, 12, 100121. [Google Scholar] [CrossRef]
  44. Kwak, J.; Lee, S.; Lee, S. On-Road and Laboratory Investigations on Non-Exhaust Ultrafine Particles from the Interaction between the Tire and Road Pavement under Braking Conditions. Atmos. Environ. 2014, 97, 195–205. [Google Scholar] [CrossRef]
  45. Songkitti, W.; Sa-ard-iam, S.; Plengsa-Ard, C.; Wirojaskunchai, E. Effects of Payloads on Non-Exhaust PM Emissions from A Hybrid Electric Vehicle during A Braking Sequence. Aerosol Air Qual. Res. 2022, 22, 220150. [Google Scholar] [CrossRef]
  46. Hesse, D.; Augsburg, K.; Feißel, T.; Sommer, J. Real Driving Emissions Measurement of Brake Dust Particles. In Proceedings of the Eurobrake Conference, Barcelona, Spain, 2–4 June 2020; SAE: Dresden, Germany, 2019. [Google Scholar]
  47. Feißel, T.; Hesse, D.; Augsburg, K.; Gramstat, S. Measurement of Vehicle Related Non-Exhaust Particle Emissions Under Real Driving Conditions. In Proceedings of the 38th FISITA World Congress, Prague, Czech Republic, 14–18 September 2020. [Google Scholar]
  48. Huber, M.; Murg, J.; Steiner, G.; Wanek-Rüdiger, C.; Weidinger, C.; Huemer-Kals, S.; Fischer, P. Assessing a Vehicle’s Real-World Brake Wear Particle Emissions on Public Roads. Regulation 2018, 1832, 17. [Google Scholar]
  49. Mody, P.; Rumold, W.; Attia, F.; Ansmann, S. Mojacar and Los Angeles City Traffic Vehicle Testing: A Comparison & Analysis of Subjective Ratings and Objective Measurements; SAE Technical Paper; SAE International: Warrendale, PA, USA, 2002. [Google Scholar]
  50. Mathissen, M.; Grochowicz, J.; Schmidt, C.; Vogt, R.; Farwick Zum Hagen, F.H.; Grabiec, T.; Steven, H.; Grigoratos, T. A Novel Real-World Braking Cycle for Studying Brake Wear Particle Emissions. Wear 2018, 414–415, 219–226. [Google Scholar] [CrossRef]
  51. European Commission. 2018/1832 of 5 November 2018 Amending Directive 2007/46/EC of the European Parliament and of the Council, Commission Regulation (EC) No 692/2008 and Commission Regulation (EU) 2017/1151 for the Purpose of Improving the Emission Type Approval Tests and Procedures for Light Passenger and Commercial Vehicles, Including Those for in-Service Conformity and Real-Driving Emissions and Introducing Devices for Monitoring the Consumption of Fuel and Electric Energy; European Commission: Brussels, Belgium, 2018. [Google Scholar]
  52. European Commission Emissions in the Automotive Sector. New Euro 7 Standard Proposal. Available online: https://single-market-economy.ec.europa.eu/sectors/automotive-industry/environmental-protection/emissions-automotive-sector_en (accessed on 8 December 2023).
  53. EMEP/EEA EMEP/EEA Air Pollutant Emission Inventory Guidebook 2023: Technical Guidance to Prepare National Emission Inventories; Publications Office of the European Union: Luxembourg, 2023; ISBN 9789294805980.
Figure 1. Schematic of final sampling system and instrumentation.
Atmosphere 15 00224 g001
Figure 2. Brake enclosure design.
Atmosphere 15 00224 g002
Figure 3. PG42 cycle.
Atmosphere 15 00224 g003
Figure 4. On-road real driving cycle.
Atmosphere 15 00224 g004
Figure 5. Moderate test track braking, showing road speed (kph) and braking pressure (bar).
Atmosphere 15 00224 g005
Figure 6. Particle Transmission through the final sampling system at 300 L/min. Uncertainty in the measurements is shown by the error bars.
Atmosphere 15 00224 g006
Figure 7. (a) Repeatability, as CoV, of PG42 on-dyno cycle distance; (b) CO2 emissions. Error bars show one standard deviation.
Atmosphere 15 00224 g007
Figure 8. Repeatability of cold (blue lines) and hot (red lines) ELPI particle size distributions: (a) log scale; (b) linear scale. The measurements during each cycle are represented by the line thickness.
Atmosphere 15 00224 g008
Figure 9. Illustration of hot ELPI particle number emissions isolated from an ~80 kph test track braking experiment.
Atmosphere 15 00224 g009
Figure 10. (a) Real-time brake PM (eFilter) and (b) PN (SPCS), emissions during PG42 cycle.
Atmosphere 15 00224 g010
Figure 11. (a) Real-time brake PN emissions from cold ELPI and (b) hot ELPI during PG42 cycle.
Atmosphere 15 00224 g011
Figure 12. Volatile particle release, between 2100 and 2500 s of PG42, during high-speed cruise, after hard braking.
Atmosphere 15 00224 g012
Figure 13. Real-time braking events on an urban road measured by the (a) eFilter, (b) hot ELPI, and (c) cold ELPI. Also shown is the brake pressure (bar) and road speed (kph) during the cycle.
Atmosphere 15 00224 g013
Figure 14. Brake mass and number emissions from PG42 and urban driving; error bars show one standard deviation. Note, the SPCS was not measuring during the urban driving test.
Atmosphere 15 00224 g014
Figure 15. Image of three filters collected during PG42 brake emissions testing.
Atmosphere 15 00224 g015
Figure 16. Results of thermogravimetric analyses of brake sample filters for the PG42 and urban cycles.
Atmosphere 15 00224 g016
Figure 17. Average particle/s emissions from moderate braking events compared with background levels: (a) cold ELPI, (b) hot ELPI, (c) eFilter, and (d) eFilter low speeds only.
Atmosphere 15 00224 g017
Figure 18. Relationship between particle emission rates and peak speed of braking event: (a) hot ELPI, (b) cold ELPI, (c) eFilter.
Atmosphere 15 00224 g018
Figure 19. There is no consistent relationship between average brake pad temperature and PM emissions rate (µg/s) below ~170 °C for braking events from (a) ~80 kph, (b) ~64 kph, (c) ~48 kph, (d) ~32 kph, and (e) ~16 kph.
Atmosphere 15 00224 g019
Figure 20. There is no consistent relationship between average brake pad temperature and PN emissions rate (#/s) below ~170 °C for braking events from (a) ~80 kph, (b) ~64 kph, (c) ~48 kph, (d) ~32 kph, and (e) ~16 kph.
Atmosphere 15 00224 g020
Figure 21. Cold ELPI and hot ELPI PN emissions rates, vehicle speed, brake pad and disc temperatures and brake pressures, from the first aggressive braking experiment.
Atmosphere 15 00224 g021
Figure 22. Two nominally identical braking events (circled as 1 and 2) executed with different initial pad and disc temperatures.
Atmosphere 15 00224 g022
Figure 23. Comparative (a) cold and hot ELPI PN and (b) eFilter PM emissions from drive cycles and test-track braking experiments.
Atmosphere 15 00224 g023
Figure 24. Hot ELPI size distributions, all cycle types, averaged data.
Atmosphere 15 00224 g024
Figure 25. Cold ELPI size distributions, all cycle types, averaged data.
Atmosphere 15 00224 g025
Table 1. Repeatability data for the PG42 cycle.
PM mg/kmeFilter, mg/kmCold ELPI (/109), #/kmHot (180 °C) ELPI (/109), #/kmHot (350 °C) SPCS (/109), #/km
CoV7.2%22.8%123.4%40.4%4.0%
sample size (n)99998 *
* SPCS malfunctioned on one test and the data are omitted.
Table 2. Repeatability data for the urban on-road drive cycles.
PM,
mg/km
eFilter, mg/kmCold ELPI (/109), #/kmHot (180 °C) ELPI (/109), #/km
CoV22%5%58%27%
n3333
Table 3. Particle emission rates for the cold ELPI, hot ELPI and eFilter calculated during a static test in the enclosure (background) and from the periods between acceleration in the moderate braking experiment (baseline).
BackgroundBaseline
Cold ELPI (#/s)1.4 × 107~1 × 10⁷
Hot ELPI (#/s)2.6 × 105~2 × 10⁵
eFilter (μg/s)0.820.25
Disclaimer/Publisher’s Note: The statements, opinions and data contained in all publications are solely those of the individual author(s) and contributor(s) and not of MDPI and/or the editor(s). MDPI and/or the editor(s) disclaim responsibility for any injury to people or property resulting from any ideas, methods, instructions or products referred to in the content.

