Article

Investigation of the Synoptic and Dynamical Characteristics of Cyclone Shaheen (2021) and Its Influence on the Omani Coastal Region

by
Petros Katsafados
1,*,
Pantelis-Manolis Saviolakis
1,
George Varlas
2,
Haifa Ben-Romdhane
3,4,
Kosmas Pavlopoulos
3,
Christos Spyrou
5 and
Sufian Farrah
6
1
Department of Geography, Harokopio University of Athens, HUA, 17671 Athens, Greece
2
Hellenic Centre for Marine Research, Institute of Marine Biological Resources and Inland Waters, 46.7 km of Athens-Sounio Ave., 19013 Anavissos, Greece
3
Department of Geography and Planning, Sorbonne University Abu Dhabi, Abu Dhabi P.O. Box 38044, United Arab Emirates
4
Department of Environmental Health and Safety, College of Health Sciences, Abu Dhabi University, Abu Dhabi P.O. Box 59911, United Arab Emirates
5
Research Centre for Atmospheric Physics and Climatology, Academy of Athens, 10679 Athens, Greece
6
Department of Meteorology, National Centre of Meteorology, Abu Dhabi P.O. Box 4815, United Arab Emirates
*
Author to whom correspondence should be addressed.
Atmosphere 2024, 15(2), 222; https://doi.org/10.3390/atmos15020222
Submission received: 15 January 2024 / Revised: 5 February 2024 / Accepted: 8 February 2024 / Published: 12 February 2024

Abstract

:
Tropical Cyclone Shaheen (TCS), originating in the Arabian Sea on 30 September 2021, followed an east-to-west trajectory and made landfall as a category-1 cyclone in northern Oman on 3 October 2021, causing severe floods and damages before dissipating in the United Arab Emirates. This study aims to analyze the synoptic and dynamical conditions influencing Shaheen’s genesis and evolution. Utilizing ERA5 reanalysis data, SEVIRI-EUMETSAT imagery, and Sorbonne University Atmospheric Forecasting System (SUAFS) outputs, it was found that Shaheen manifested as a warm-core cyclone with moderate vertical wind shear within the eyewall. Distinctive features included a trajectory aligned with rising sea surface temperatures and increased specific humidity levels at 700 hPa in the Arabian Sea. As Shaheen approached the Gulf of Oman, a significant increase in rainfall rates occurred, correlated with variations in sea surface temperatures and vertical wind shear. Comparative analysis between SUAFS and ERA5 data revealed a slight northward shift in the SUAFS track and landfall. Advance warnings highlighted heavy rainfall, rough seas, and strong winds. This study provides valuable insights into the meteorological factors contributing to Shaheen’s formation and impact.

1. Introduction

Tropical cyclones (TC) are classified as high-impact weather events because they have significant social and economic impacts. They are known to affect food and water supply, damage infrastructure, and put public health at risk. Given these significant impacts, many efforts have been devoted to observe and comprehend their synoptic and dynamical characteristics. Each year, more than 80 tropical cyclones form in the vicinity of the equatorial regions across the oceans [1].
The North Indian Ocean (NIO), including the Arabian Gulf and the Bay of Bengal, contributes almost 4% to the total number of global TCs, thus is not among the more active tropical cyclone basins [2]. In a calendar year, NIO cyclones usually appear from April to December having a bimodal peak of their frequency during May–June and November–December. Monsoon activity prohibits the formation of TCs over the NIO due to the strong vertical wind shear (VWS) [3]. Although cyclogenesis is still possible during this period, it is usually associated with a weak circulation establishment [4]. The pre-monsoon and post-monsoon months generally offer a more favorable environment, with increased sea surface temperatures (SSTs), low VWS and positive potential vorticity [5]. In a typical year, only five or six weather systems reach at least the tropical storm stage, characterized by wind speeds of 18 m s−1 or higher [6]. TCs with winds exceeding 51 m s−1 are even less frequent.
Hoarau et al., 2010 recorded the characteristics of powerful TCs with sustained winds exceeding 51 m s−1 (categories 3, 4, and 5 on the Saffir–Simpson hurricane wind scale) in the NIO during the period 1980–2008 [7]. Their findings revealed that the extreme intensity of these cyclones did not vary significantly by decade. For instance, TC Gay (from the western North Pacific) in November 1989 reached 72 m s−1, while 05B in October 1999 sustained winds of 79 m s−1, and cyclone Gonu in June 2007 reached 74 m s−1. Nonetheless, they admitted that the NIO has the potential, given proper SST conditions, to generate cyclones up to around 82–87 m s−1. In their final assessment, they concluded that the occurrence of small, but highly intense cyclones in regions around the Arabian Sea, such as Oman, Somalia, and Yemen, is not impossible, even in the presence of dry air intrusions.
During early June 2007, TC Gonu entered the Gulf of Oman, resulting in the formation of substantial waves along the coastlines of both Iran and Oman. This cyclone followed an uncommon path, extending much further to the west and north than the typical cyclones in the NIO. Gonu, classified as a Category 5 cyclone, is recognized as one of the most formidable TCs recorded, marked by its minimum pressure of 920 hPa. Gonu had a severe impact, resulting in the loss of over one hundred lives and causing damage of about $4 billion [8]. While Shaheen had less potential compared to Gonu, it remained a noteworthy cyclonic system which deserves an in-depth study.
The formation of Shaheen in the Arabian Sea on 30 September 2021, marked a rare meteorological event [9]. This uniqueness was characterized by several distinctive attributes, including its remarkable persistence over the Indian mainland [10] and its emergence during an active southwest monsoon period in the month of September [11]. Furthermore, it was the first severe cyclonic storm to hit the northern coast of Oman in almost 150 years [9], a fact that underlines the exceptional nature of this event. Similarly to Gonu, it charted an unusual path, from east to west, at the northernmost regions of the Arabian Sea, very close to the Iranian coastline. Eventually, this cyclone entered the Gulf of Oman and made its landfall on the shoreline of Al Khaburah in northern Oman, classified as a category 1 intensity cyclone on 3 October 2021 [12]. Coastal towns such as Al Suwayq and Saham were severely affected by a combination of storm surges and flash flooding. The capital city of Muscat also faced significant flooding and storm waves reaching heights of 8 to 12 m along its coastal areas [9].
Shaheen is also linked with the enhanced formation of TCs during the post-monsoon season (October–November) when the La Niña phase of the El Niño Southern Oscillation (ENSO) events occur. This is attributed to the presence of low-level cyclonic vorticity, increased convection, and elevated TC heat potential in the Bay of Bengal, creating favorable conditions for TC formation and intensification during La Niña [13]. The influence of ENSO teleconnections extends well beyond the tropical Pacific, leading to changes in the atmospheric circulation patterns that can have a global impact on TCs [14]. This occurs because ENSO can redistribute upper ocean heat content in the tropical Pacific, resulting in anomalies in the SSTs and upper ocean structures. It also affects the positioning of tropical convection and the Intertropical Convergence Zone (ITCZ), giving rise to anomalous Walker and Hadley circulations [14].
The primary objective of this work is to examine the synoptic conditions contributing to the genesis of TCS in the Arabian Gulf. Additionally, the dynamic structure of the cyclonic system is analyzed through the implementation of the SUAFS model housed at Sorbonne University Abu Dhabi (SUAD), United Arab Emirates. Furthermore, the impacts during its landfall have been assessed through field observations conducted in the Al Khaburah and Saham areas along the Omani coast.
This study provides a detailed description of the approach adopted to meet the main objective, focusing on the selected area of interest, the utilized data sources, and the configuration of the model is presented (Section 2). It, then, presents the analysis using illustrative figures offering an in-depth overview of the synoptic conditions characterizing TCS, derived from ERA5 data (Section 3). It, then, provides interpretation and discussion of the indicative results obtained from the SUAFS modeling system (Section 4). Finally, it presents the impacts on the Omani coastal zone and conclusions (Section 5 and Section 6).

2. Materials and Methods

The area of interest mainly includes the aquatic source of energy for Shaheen which is the northern part of the Arabian Sea and the Gulf of Oman. Shaheen developed in this area and finally made its landfall in the coastline of Oman on 3 October 2021. Thus, a separate section of this study is devoted to its impacts on the Omani coastal zone.
To obtain the dynamic and synoptic characteristics of Shaheen, Copernicus ERA5 data [15] and satellite retrievals from EUMETSAT [16] were utilized.
ERA5 data available by the European Center for Medium-Range Weather Forecasts (ECMWF) and distributed by the Climate Change Service (C3S) of Copernicus, is the fifth generation of their atmospheric reanalysis project. It offers a comprehensive global climate dataset spanning from January 1940 up to the present. ERA5 provides hourly assessments of numerous climate variables across the atmosphere, land, and oceans. The data are available on a 30-km grid (0.25° × 0.25°) and encompass the Earth’s entire surface. It provides detailed information from the surface to an altitude of 80 km, employing 37 vertical levels.
EUMETSAT functions as the operational satellite agency in Europe, tasked with the ongoing monitoring of weather, climate, and environmental conditions. Their system of meteorological satellites observes the Earth’s atmosphere, oceans, and land surfaces, generating valuable data for scientific applications. This study relies on imagery captured by the SEVIRI satellite. SEVIRI is equipped with a 50 cm-diameter aperture and employs a line-by-line scanning radiometer technology. It delivers image data in four Visible and Near-Infrared (VNIR) channels, as well as eight Infrared (IR) channels [17]. This sophisticated imaging instrument continuously captures Earth’s features using twelve distinct spectral channels, with a baseline repeat cycle of 15 min. The imaging spatial resolution ranges from 3 km, down to 1 km for the High-Resolution Visible (HRV) channel [17].
SUAFS was used to simulate the main features of Shaheen and to resolve its dynamical structure. SUAFS utilizes the Advanced Weather Research and Forecasting (WRF-ARW) model [18] and is a non-hydrostatic modelling system which operates on a horizontal resolution of 9 km × 9 km covering the Arabian Peninsula and adjacent areas (Figure 1).
It employs terrain-following hydrostatic pressure vertical coordinates with a total of 37 vertical levels. The integration time step is 24 s, and the initial and boundary conditions are obtained from the Global Forecast System (GFS) with a spatial resolution of 0.5° × 0.5°. This resolution performs well in the study of tropical cyclones over the Indian Ocean [19]. Further details regarding the model’s configuration and parameterizations used are shown in Table 1.
The performance of WRF, which is the core model of SUAFS, has been tested in various studies which focused on ocean basins such as the Bay of Bengal [20,21]. SUAFS has been running operationally since July 2018 at Sorbonne University HPC infrastructure. In its recent form it also incorporates the desert dust cycle (emission-advection-deposition) through the embedded GOCART module [22]. Special attention has been given in the combination of the surface and the boundary layer schemes i.e., Monin Obukhov and YSU, which are considered as an optimal choice for the simulation of TCs [23,24,25,26,27,28,29,30].

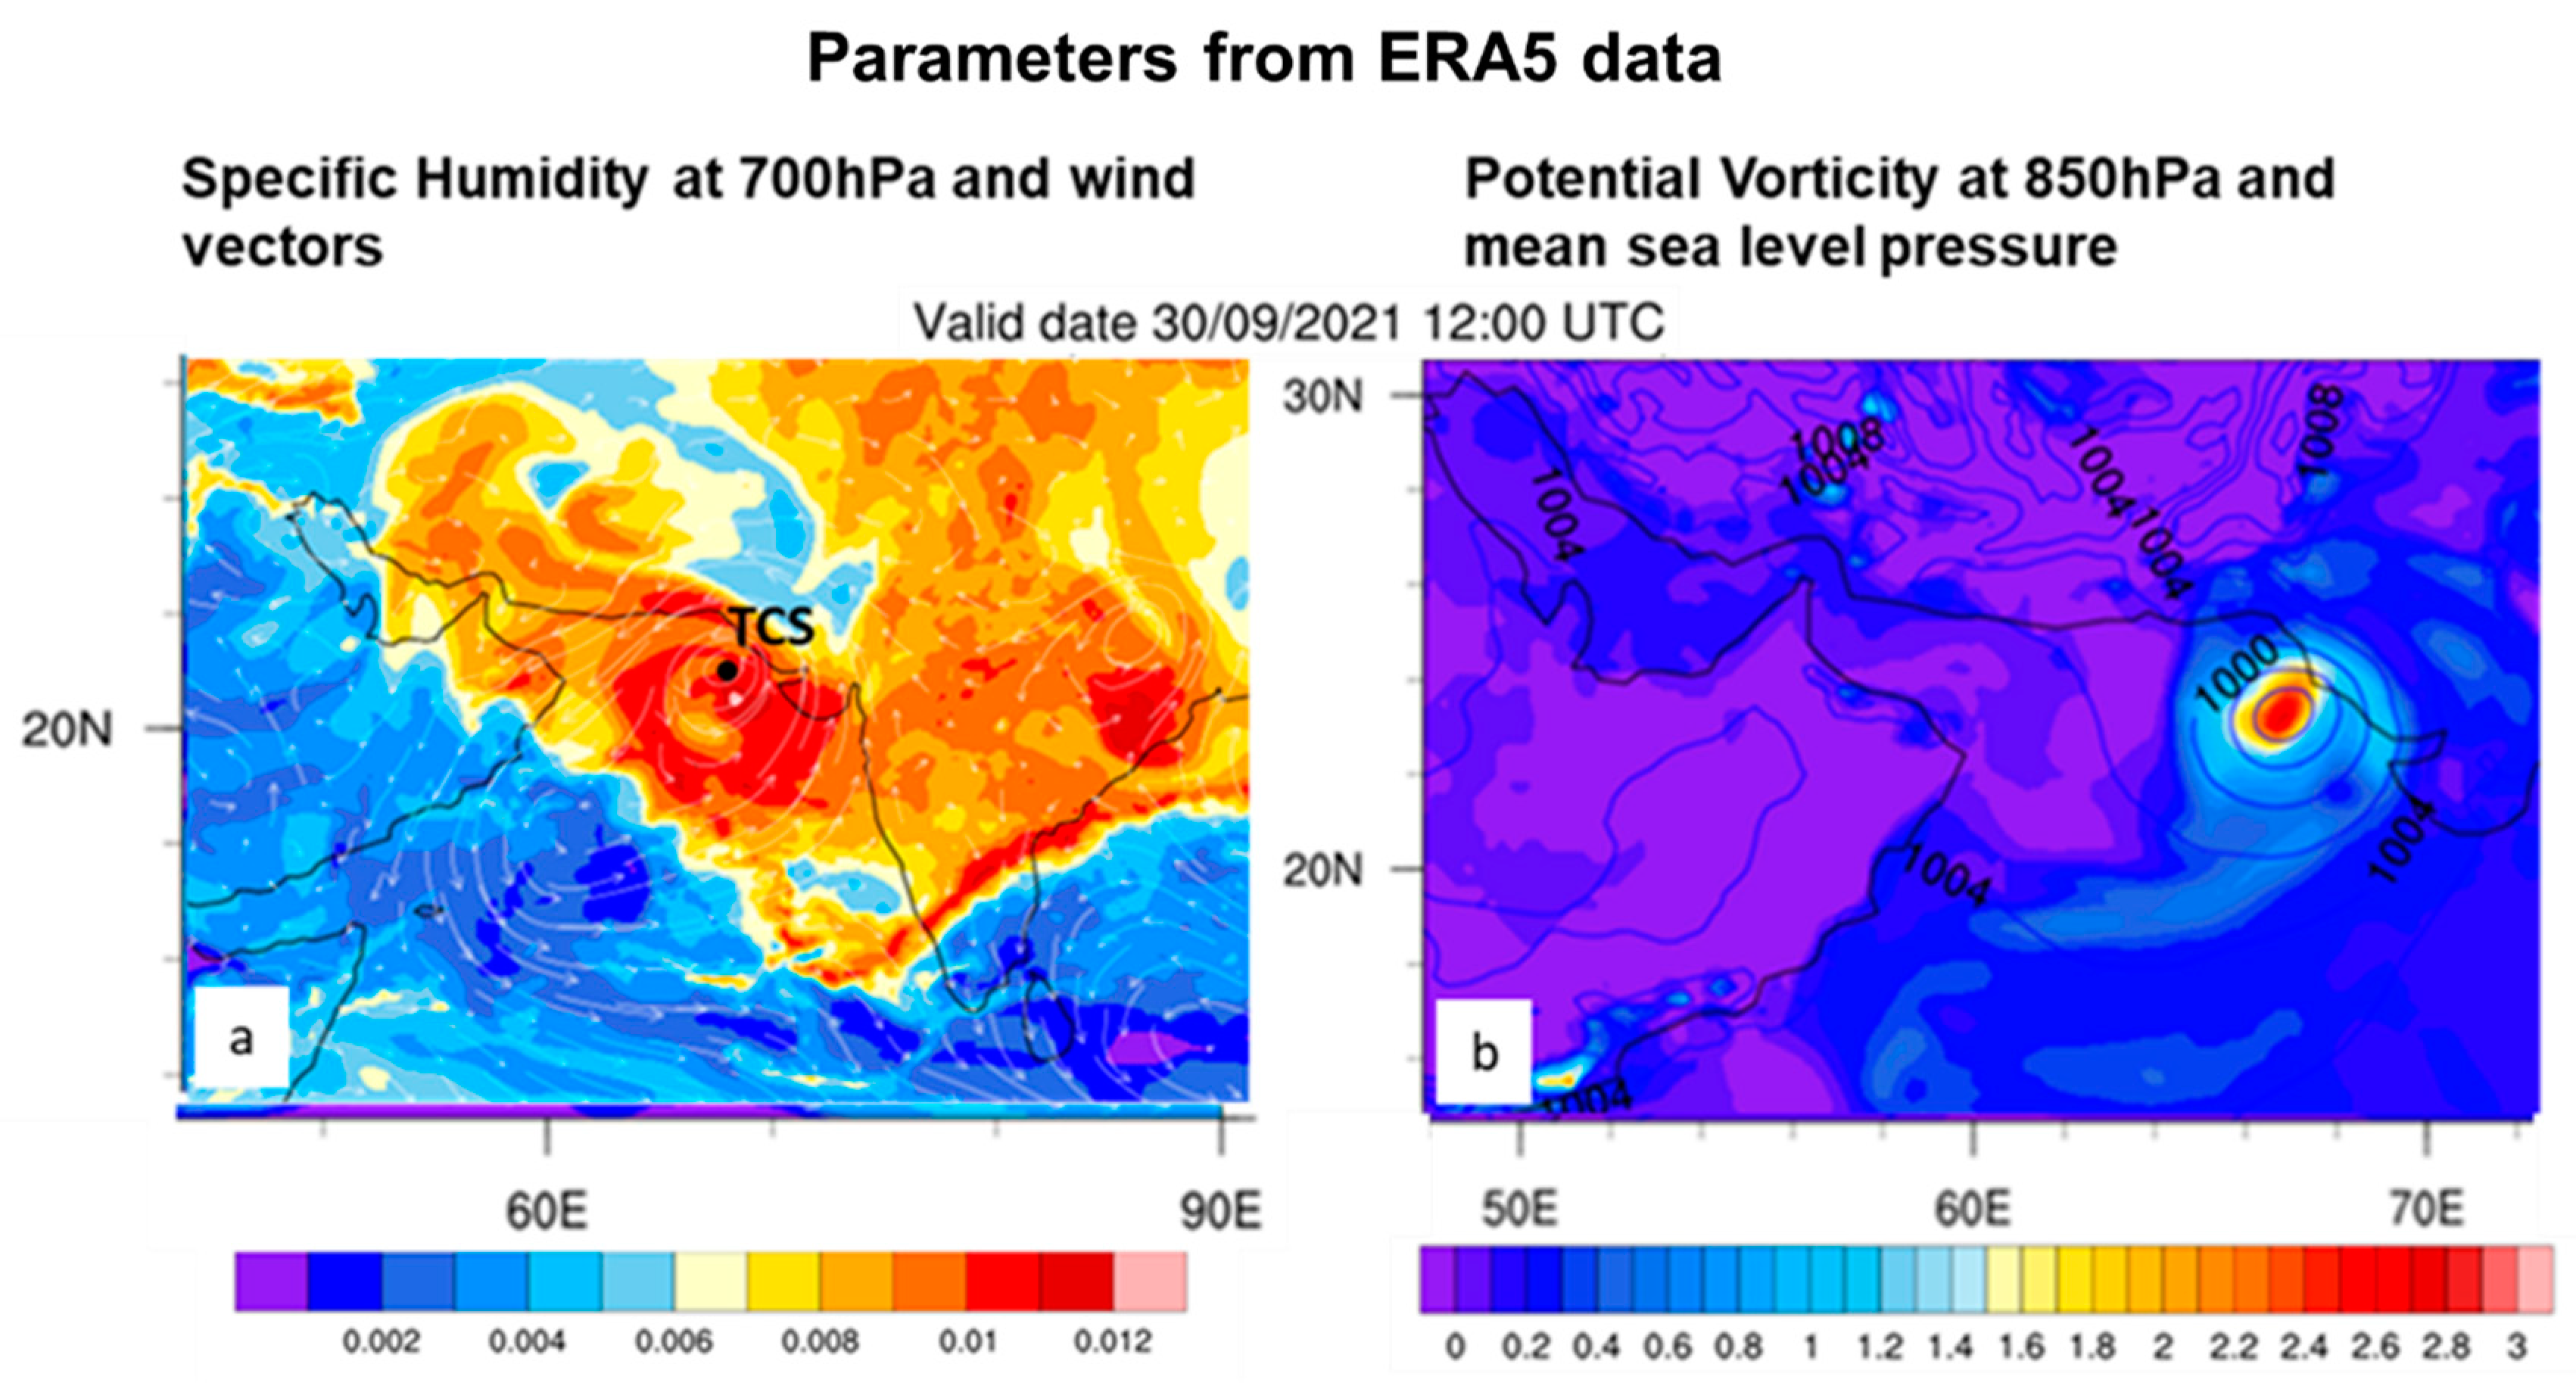
3. Description of the Synoptic Conditions

The cyclone Shaheen was formed due to the remnants left behind by the previous cyclone Gulab [10]. The latter initiated its track from the Bay of Bengal on 24 September 2021 and during its landfall it crossed almost the entire Indian peninsula from east to west (Figure 2) to set a favorable environment for Shaheen to grow northwest of India a few days later.
Although impressive, it is not unprecedented for a tropical disturbance to endure such a prolonged period over land and this is a phenomenon called ‘brown ocean effect’ [31]. According to this phenomenon the wet and warm land surface supplies the cyclone with the required heat energy, mimicking to an extent the warm ocean surface, to maintain its features [31].
The core of TCS started its development on 30 September 2021. Satellite images reveal the development of this tropical system in the time period between 30 September 2021 and 3 October 2021 (Figure 3). The system moved westwards into the northwestern Arabian Sea, where (a) the increased SST above 300 K and subsurface ocean temperatures and (b) the humidity feedback made it feasible.
On 30 September 2021, the system was not fully organized and thick cloudiness was extended in a wide area (Figure 3a). Shaheen then followed a N-NW track along the Iranian coastline and through the Arabian Sea before its landfall over Northern Oman (Figure 3b–d). All along this track the SST values were increased (Figure 4a,b).
The importance of a high SST on the genesis and strength of TCs has been an object of study for the scientific community for many years. Theoretically, it is widely accepted that SSTs exceeding 299 K (26 °C) are a key factor in the formation of a tropical cyclone. Nonetheless, the precise influence of SSTs on cyclone intensity across various ocean basins and seasons (such as the post-monsoon or pre-monsoon period in the NIO) remains uncertain [32]. In the Atlantic Ocean, there is a clear correlation between more intense TCs and higher SSTs but this relationship is not as evident in other oceans [33,34]. Reference [35] introduced the theory of maximum potential intensity (MPI), which views TCs as heat engines [36]. The MPI of TCs is influenced by several factors, including SST, outflow temperature, and other relevant parameters. Notably, the outflow temperature over tropical and subtropical oceans is largely governed by SST [34,37,38]. Consequently, SST plays a predominant role in determining the MPI of TCs, and it also significantly impacts the rate of TC intensification and development [36].
It is important to note that a substantial expansion in the rainfall area of a TC is not anticipated unless the TC tracking shifts towards regions with higher SSTs or unless there are alterations in the spatial distribution of SST patterns in the tropical regions [39]. In Figure 4a,b the SST on two different days is shown along with the contour lines of mean sea level pressure. On 30 September 2021 the cyclone formed northeast in the Arabian Sea in a region where the SST was about 303 K (30 °C) and moved to the west alongside the coastlines of Pakistan and Iran which are regions with increased SSTs as well.
The temperature gradients in the passage of the cyclone on both days are linked with increased precipitation. This is more profound on 3 October 2021 00:00 UTC where the gradients are greater hence the total precipitation per hour has maximum values (Figure 4c).
Maximum values of precipitation are in the northwest region of the cyclone and seem to be linked with the lower negative values of VWS as it is discussed further below. VWS is an important factor for the formation of a cyclone and it should be weak for the system to be successfully developed. As a rule of thumb, increased wind shear tends to tilt the vortex of the cyclonic system, reducing the efficiency of the interaction between surface convergence and the release of latent heat [40]. Still, there are documented instances where tropical cyclones persist and even strengthen in environments characterized by strong VWS [41]. The values of VWS on 30 September 2021 are moderate as presented in Figure 5. Values of VWS are moderate when a deep depression turns into a cyclonic system [11]. According to the literature, there is an existing threshold of −12.5 m s−1, estimated by [42], above which tropical cyclones (in the western north Pacific) cannot be formed [43]. The minimum value of VWS in the periphery of the cyclone is −16.23 m s−1, indicating that in the NIO, TCs can be formed with greater VWS between the 200–850 hPa isobaric layers.
TCs are deep warm core systems and during their formation and maintenance other processes, namely the SST and the supplement of humidity in the lower troposphere, may overcome the elevated VWS in the periphery of the cyclone.
TCS’ warm core characteristics are revealed from the phase space Hart diagram [44] (Figure 6). VTU is the thermal wind calculated for the middle-upper troposphere between 600 and 300 hPa. VTL is the thermal wind calculated for the lower troposphere between 900 and 600 hPa. Equation (1) was used for the calculation of the thermal wind.
V T = Φ l n p
where Φ = Φmax − Φmin is the geopotential height. Φmax was calculated in a radius of 1.5° and Φmin at the center of the cyclone. The first quadrant of Figure 6 (upper right) is for deep warm core tropical cyclones, the second (upper left) is for lower cold core and upper warm core tropical cyclones, the third (bottom left) is for deep cold core cyclones and the fourth (bottom right) is for lower warm core upper cold core cyclones.
The cyclonic system formed on 30 September 2021 as an upper warm core system which gradually gained its deep warm core structure on 1 October 2021 after 00:00 UTC. As the system continued its growth, the values on the X axis increased with maximum value attained on 2 October 2021 12:00 UTC and finally the warm core structure weakened to its minimum value on 3 October 12:00 UTC.
The temperature distribution at the lower troposphere in the region of Shaheen, on 30 September 2021 when the system emerged, did not display a clear pattern of highest temperatures in the center of the cyclone (Figure 7a), a fact that contributes to the results of Figure 6 (upper warm core cyclone, lower cold core).
The observed temperature increments in the eyewall of the Shaheen cyclone are caused by latent heat released from the condensation of water vapor around the core, which fastens the cyclonic development and is important for the developing warm core structure. When the TC is fully developed, the eye of the warm core system has greater temperature values (Figure 7b). The preservation of the warm core structure is facilitated through the converging air ascending within the eyewall in a moist adiabatic process towards the tropopause, simultaneously accompanied by descending motions in a dry adiabatic process back to the surface, as illustrated in Figure 7c [34].
For the maintenance of the system, humidity feedback is important. The distribution of specific humidity in the surroundings of TCS is shown in Figure 8a (specific humidity at 700 hPa). It is obvious that the region where TCS was formed coincides with the maxima of specific humidity. TCS moved northwest through an area of increased specific humidity values at the 700 hPa layer. High values of specific humidity can also be detected eastwards of the cyclone due to the preexisting cyclone Gulab. This region is the source that supplies TCS with the necessary humidity through the prevailing S-SW wind circulation.
The Potential Vorticity at 850 hPa along with the mean sea level pressure contour lines was calculated. Figure 8b shows a positive potential vorticity distribution which increases to the core of the cyclone and exceeds 1.5 Potential Vorticity Units (1 PVU = 10−6 m2 s−1 K kg−1), which is a typical threshold for cyclonic systems and the generated deep potential vorticity tower extended from the lower atmosphere to the tropopause [45]. The increasing values to the center of the cyclone do not satisfy Rayleigh’s necessary condition for barotropic instability, which requires that the gradient of the basic state vorticity exhibit both signs within the cyclone region. More specifically, the phenomena occurring in the mid and lower troposphere lead to potential and relative vorticity fields with maxima near the eyewall rather than the cyclone’s center [46]. To clearly discern the annular tower of high potential vorticity in the eyewall, characterized by low potential vorticity in the inner-core region, a reduction in grid spacing to approximately 1 km or less is necessary [47].
On 30 September 2021, Shaheen’s formation date, the wind shear is moderate, and the rainfall areas are extended to a larger area around the cyclone (Figure 9a). Typically, the size of a TC is influenced by the distribution of its rainbands and the VWS [48]. As a TC strengthens and follows its path, its size tends to decrease due to reduced VWS, leading to the concentration of rainbands around the eye.
From 30 September 2021 to 2 October 2021, there is a gradual increase of the horizontal wind speed as the isobaric contour lines become denser. There is not a decrease in VWS, thus the intensification of the cyclone can be possibly linked to SST gradients. As can be seen from the total precipitation (Figure 9), the cyclonic system is organized with rainfall areas located in its periphery at points where VWS has maximum negative values (Figure 9). This pattern indicates a positive correlation between these two factors.
The cyclonic system reaches a maximum intensity on 2 October 2021 in terms of total precipitation values and surface wind speed. The system showed a weakening trend afterwards, but it lasted only a few hours. TCS was further strengthened after 3 October 2021 at 00:00 UTC as it approached the Gulf of Oman. This intensification could be possibly attributed to the enhanced SST gradient and the distribution of VWS in the Gulf of Oman. The maxima of the integrated vapor transport (IVT) are also located over the areas with maximum negative VWS as well as the peak of precipitation (Figure 10). This finding reveals the relationship between VWS, total precipitation, and the IVT and it is in agreement with other studies e.g., [49].

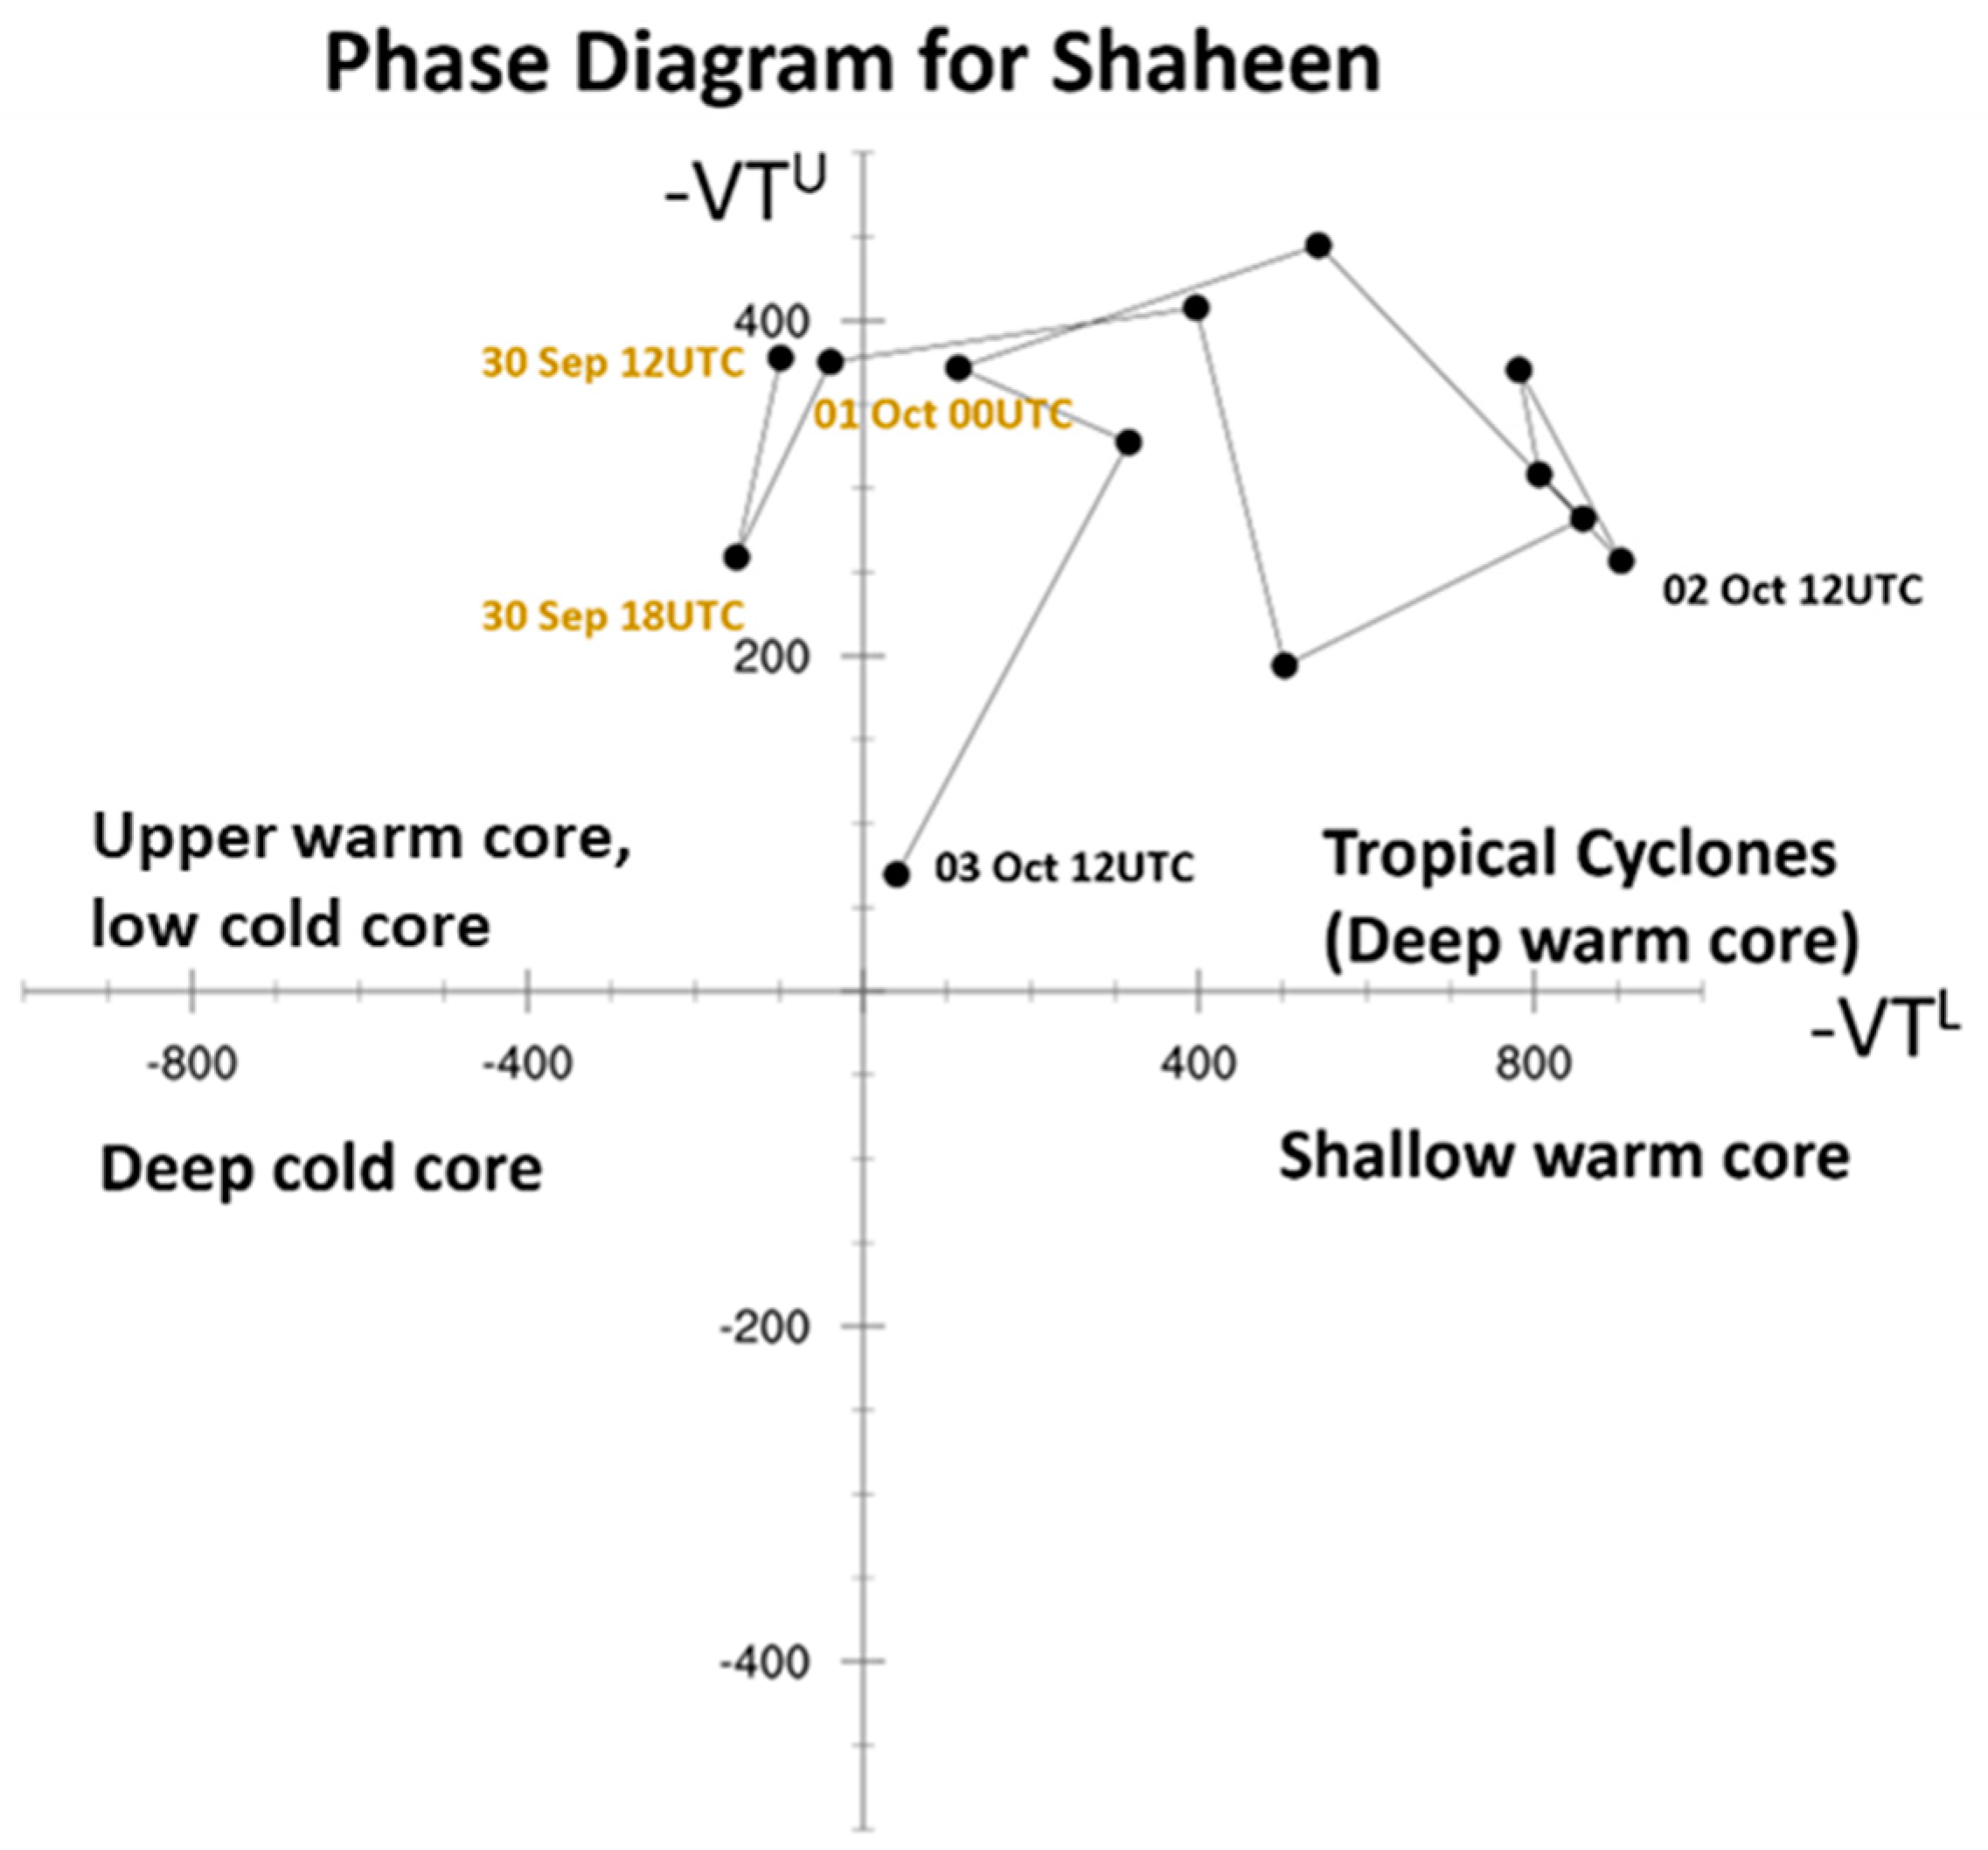
4. The Dynamical Characteristics of Shaheen

The SUAFS modeling system was used for the simulation of TCS. To check the accuracy of the model, the parameters temperature at 2 m, wind speed at 10 m and sea level pressure were compared to the observations from 10 meteorological stations in the vicinity of the cyclone from 2 October 2021 to 4 October 2021. The locations of the selected meteorological stations and the comparison between model and observations are given in Figure 11.
Temperature results exhibit satisfactory agreement across the majority of the chosen stations. Notably, there are some inconsistencies, particularly between two adjacent meteorological stations (41,756 and 40,898) but the model in general reproduces the daily fluctuations of the 2-m temperature (0.4 K and 2.3 K for the bias and the root mean square error-RMSE scores respectively). Regarding the wind speed at 10 m, the model tends to overestimate by 1.9 m⋅s−1. Additionally, there is a good agreement in the mean sea level pressure showing 0.2 hPa and 2.9 hPa for the bias and RMSE scores, respectively. A summary of these observations is presented in Table 2, incorporating calculations for bias and RMSE. In this table, ERA5 shows comparable skill scores to SUAFS and it even slightly outperforms SUAFS in 2-m temperature and 10-m wind speed bias and RMSE. Malakar et al., 2020 also confirmed the superiority of ERA5 to provide a better representation of TCs structure over the NIO among other five reanalysis data sets.
Total precipitation is an important factor to be examined. To this end, the closest to Shaheen landfall meteorological station (41256) recorded 24 h accumulated precipitation as high as 94 mm while SUAFS estimated 124 mm. Thus, SUAFS outputs are in good agreement with the surface observations and they can be used to investigate the dynamical characteristics of TCS. It is noteworthy to state that the downscaling provided by the model compared to ERA5 data is important to resolve additional features of the cyclonic system. Figure 12 highlights the difference between the SUAFS and the ERA5 wind speed and direction.
A large difference of ~15 m s−1 is noticeable around the eyewall between the two datasets. According to what was previously discussed, SUAFS probably overestimates the horizontal velocity in the whole region of study. Other studies have also pointed out overestimations of WRF based models [50] but simultaneously, there are studies that have proved that ERA5 underestimates the wind speed and intensity of TCs [51], mainly due to their coarse resolution. Consequently, different values in horizontal wind velocity are expected between the SUAFS simulation and ERA5 because of their different resolutions. Overestimation of the simulated horizontal wind speed from WRF can result from the parameterization schemes used. The planetary boundary layer scheme used in SUAFS is the Yonsei University (YSU) Scheme which is assumed from previous studies to have the smallest overestimation of the wind speed compared to other schemes like the Mellor-Yamada-Janjic Scheme [51], which are typically used in operational simulations. A potential overestimation of wind speed by SUAFS can result in an overestimation of both surface latent and surface sensible heat fluxes over the sea surface. This is because these fluxes are dependent on both wind speed and sea surface temperature as described by the COARE 3.0 bulk algorithm [52,53]. Figure 13 presents the surface latent, and surface sensible heat fluxes simulated from SUAFS.
The surface latent heat flux is proportional to evaporation and so increases in the region where wind speed is increased [54]. The large values of SST in the Gulf of Oman also enhance the evaporation of water. Accordingly, similar behavior is observed for sensible heat flux (if the contribution of the land surface is neglected). In the eyewall of the cyclone, their values are approximately 1100 and 280 W m−2, respectively.
In Figure 14, we calculate several pertinent parameters: vertical velocity, condensational heating rate, potential vorticity in a radius of 160 km around the eye of the cyclone, and potential vorticity distribution at 850 hPa. The vertical velocity has a maximum value of 1.2 m s−1, which is the same as the maximum vertical velocity from Copernicus ERA5 data.
The maximum values of vertical velocity are located in the eyewall at a radius of 25 km around the eye of the cyclone and are extended from the surface to the 150 hPa pressure level. The obvious correlation with the condensational heating rate is explained by Equation (2) [55] in which the condensational heating rate is proportional to the vertical wind speed component.
d θ d t = L c w d q s d z · θ C p T
In Equation (2), θ = Τ p o p R C p is the potential temperature in K, C p = 1004   J   K 1 k g 1 is the specific heat of dry air at constant pressure, L c = 2.5 · 10 6 is the latent heat of condensation at 0 °C in J kg−1, T is the temperature in K, w is the vertical velocity, qs is the saturated mixing ratio in kg kg−1.
Figure 14a,b indicates that there is a symmetrical vertical motion and transfer of energy in a radius of 25 km around the cyclone and they are both extended from the lower to the upper troposphere. Nevertheless, they are stronger eastwards of the cyclone, especially in the layer from the lower to the middle troposphere (850 to 400 hPa). Potential vorticity (Figure 14c,d) has its greatest values in the lower troposphere around the center of the cyclone and not precisely in the center. The transfer of potential vorticity from the eyewall to the center of the cyclone triggers the dynamic warming of the eye and a subsequent reduction in central pressure, which causes an increase in the pressure gradient force. This in turn, gives feedback to the unbalanced boundary layer radial inflow, promoting the development of a symmetric convective potential vorticity tower during the rapid intensification process [56].
As far as the movement of the cyclone is concerned, the SUAFS model simulated track of Shaheen is shown in Figure 15 in comparison to the track extracted from Copernicus ERA5 data.
The SUAFS simulated track is in good agreement with the relevant track extracted from ERA5. It shifts northerly, with their best alignment on 2 October 2021 00:00 UTC and 03:00 UTC up to 3 October 2021 00:00 UTC. The simulated landfall of the TCS is also north from the landfall obtained by ERA5 and the simulated velocity of the cyclone after 2 October 2021 21:00 UTC is greater than the velocity from ERA5. This is the reason for the increased predicted cyclone intrusion into the land area. The velocity of the cyclone before 2 October 2021 21:00 UTC is on average 0.5° per 3 h but is less for ERA5 afterwards. Moreover, the simulated landfall from SUAFS was on 3 October 2021 at 12:00 UTC and from ERA5 was at 15:00 UTC.

5. Impacts on the Oman Coastal Zone

Field observations of the effects of the cyclone were carried out in November 2021, in the drainage basin of wadi Hawasnah and wadi Bani flood plain (Figure 16), including Al Khaburah and Saham coastal areas. This corresponds to a drainage basin of 1130 Km2 with a 210 km perimeter and higher altitude of 1375 m, and basin length of 46.8 km, (the longest dimension of a basin parallel to its principal drainage channel). This drainage basin consists mostly of the following geological formations.
  • Hawasina group, consisting of radiolarites, chert and shale, limestone, and quartz sandstones,
  • basic volcanic rocks, at the upper catchment western part bedrock, primarily comprised of the mantle sequence of the Semail nappe, where the ophiolite consists mainly of tectonized harzburgite (peridotite) and,
  • tertiary sedimentary formations forming the upstream of Wadi’s.
The alluvial deposits form the gravel plain. The alluvial deposits are exposed along the Wadi course in the catchment [57,58]. All of these different geological formations were susceptible to erosion and transport, due to the particularly intense rainfall and their long-term exposure to mechanical weathering in the hyper-arid climatic conditions of the study area.
Precipitation in Oman’s arid to semi-arid environment is infrequent and exhibits significant variability in terms of location, timing, volume, and duration [57]. When heavy rainfall occurs, particularly in coastal regions, surface runoff in the wadis persists for a period, ranging from a few hours to a few days. This relatively short duration is primarily attributed to the steep terrain, coarse topsoil composition, and the extremely arid state of the soil [58,59]. Based on the field observations, the direct effects are summarized below.
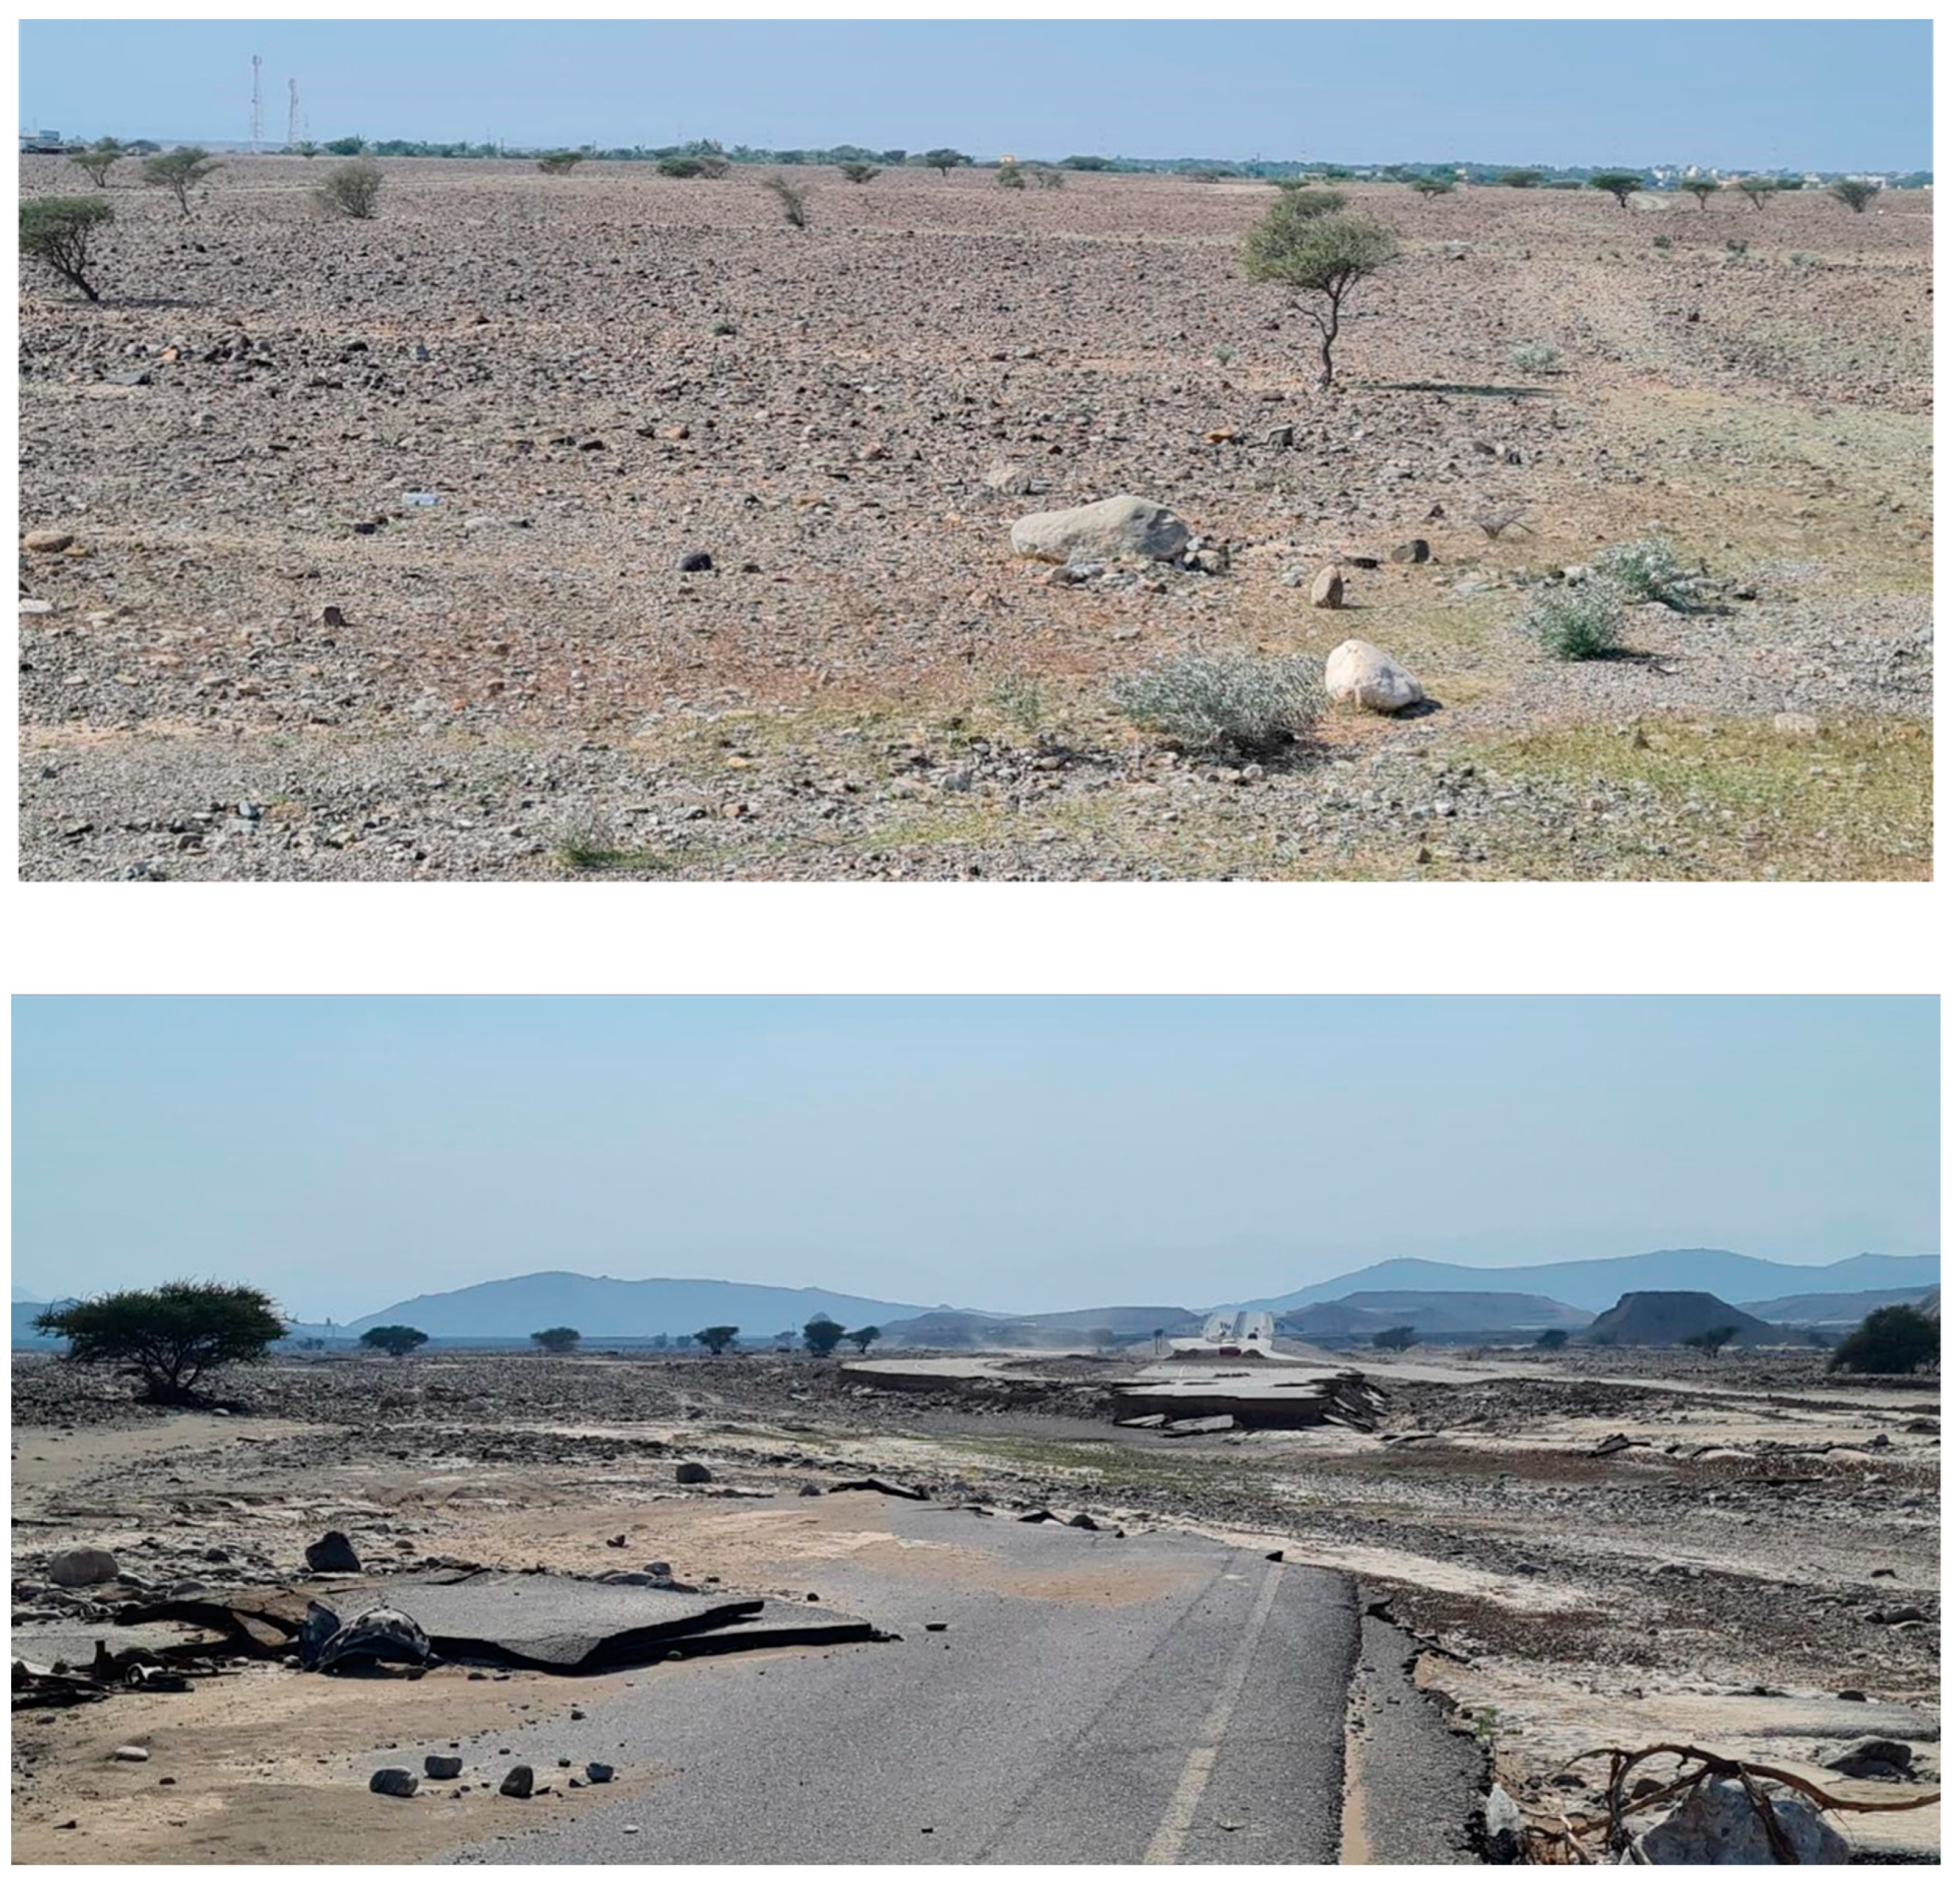
  • Intense erosion in the upstream hydrographic basins of wadi Hawasnah and wadi Bani, mainly in the loose alluvial deposits on the wadi valleys, with intense downcutting erosion and incision of their beds (Figure 17).
  • This had, as an immediate result, a great increase in the wadi’s bed load, in the downstream areas, specifically on the coastal alluvial fans and gravel plains, creating extensive flooding, causing destruction of infrastructure such as roads, bridges, and homes (Figure 17).

6. Discussion and Conclusions

The main objective of this work was to examine the synoptic and dynamical conditions of the TCS and its ramifications on the Omani coastal zone. To this end, the Copernicus ERA5 data, EUMETSAT satellite imagery, and the advanced modelling system SUAFS were complementarily used.
In general, high-impact weather systems in the equatorial region are generated in the form of tropical wave disturbances, which are transformed to tropical depressions and subsequently, to tropical storms. Under favorable conditions, tropical storms can be upgraded to TCs [60]. This transformation is mainly triggered by sea surface temperatures exceeding 27 °C, low vertical wind shear, enhanced moisture content in the middle troposphere, increased sensible and latent heat fluxes from the sea surface to the marine boundary layer [61,62], and favorable potential vorticity [14]. In the area within a latitude range between 5° and 30° in both hemispheres, which is the typical range where TCs are formed, there are five main tropical cyclone formation basins. The North Atlantic Ocean, the Northwest and Northeast Pacific Ocean, the NIO, and the Southern Hemisphere (including South Pacific and South Indian Ocean) [63].
In the region of the NIO, the Arabian Sea, the Gulf of Oman, and the adjacent countries experience the influence of TCs relatively infrequently. Typically, cyclones originating in the Arabian Sea tend to follow westward paths or recurve northward to impact Pakistan or India [64]. Their penetration into the Gulf of Oman is a rare phenomenon. Given the relatively small geographic expanse of the Arabian Sea, these cyclones tend to have shorter lifetimes and are generally less intense compared to cyclones in other areas. The duration and TC’s track lengths are approximately 58 h and around 802 km respectively [65]. TCs are also related to increased frequency and intensity of dust storms. A study of ninety-five cyclonic storms between 2001 and 2010 shows that they have a major effect on dust entrainment and transport [66]. Tropical cyclones passing close to dust source areas in the north and northwestern Arabian Sea raise dust and transport them mainly westwards towards the western Arabian Sea and Arabian Peninsula. Tropical cyclones located in the SE Arabian Sea and in the Bay of Bengal alter the transport pathway of dust plumes and advect them towards the Indian Peninsula.
TCS manifested as a high impact weather event, causing significant floods, fatalities, and disasters upon landfall in the Omani region. Its anomalous westward trajectory was marked by notably higher SST, approximately 2 K higher than the surrounding Arabian Sea area, along with an augmented specific humidity at 700 hPa. The Gulf of Oman had the highest SST values (>304 K), and the observed positive SST gradients significantly fueled the cyclone’s rapid intensification, notably affecting recorded rainfall rates. The areas experiencing intense rainfall exhibited a clear correlation with maximum negative values of VWS (~−15 m s−1), persisting throughout the extreme event.
TCS took its initial form as an upper warm core cyclone on 30 September 2021, originating from the remnants of Cyclone Gulab in the northern Arabian Sea. By 1 October 2021, it had developed its profound warm core characteristics, extending vertically up to the tropopause. During its developmental phase, the system experienced moderate VWS (in 200–850 hPa the minimum value exceeded −16 m s−1) in its periphery. Crucial factors contributing to its formation included elevated SST (>302 K) and humidity advection in the lower troposphere.
Comparative analyses of the extracted tracks from ERA5 and SUAFS revealed relatively close alignments, although the model-simulated track exhibited a slight northerly shift. Notably, the system’s velocity, especially after 21:00 UTC on 2 October 2021, appeared relatively reinforced in the model, leading to an overestimation of the cyclone’s intrusion into Oman’s land area between 3 October 2021 18:00 UTC, and 3 October 2021, 21:00 UTC.
Regarding the wind field encircling the cyclone, disparities were observed between the simulated horizontal velocity at 10 m, from the model and the velocities (a) observed from meteorological stations and (b) derived from the ERA5 data. These differences might be attributed to the parameterization schemes in the model or resolution differences (for ERA5). The model slightly overestimates the horizontal velocity (bias = 1.9 m s−1, RMSE = 3.4 m s−1). In terms of potential vorticity, values exceeded 1.5 PVU at 850 hPa within the cyclone’s vicinity, but the resolution of ERA5 data was insufficient to discern its annular structure, especially the maximum values surrounding the eye of the cyclone.
The SUAFS provides a more detailed depiction of the potential vorticity structure both horizontally (at 850 hPa) and vertically (from 1000 to 150 hPa). However, the values derived from SUAFS are tenfold higher compared to those obtained from ERA5. The highest potential vorticity values (>22 PVU) are symmetrically positioned a few kilometers surrounding the eye of the cyclone, extending vertically to the 150 hPa pressure level beneath the jet stream.
The simulated peak for the condensational heating rate reached 26 K h−1 within a 25 km radius around the eye of the cyclone, displaying a distinct correlation with the vertical velocity. This rate serves as an indicator of energy transport in the vertical direction and exhibits greater intensity eastward of the cyclone, spanning from the surface to the 400 hPa isobaric layer. Thus, the main outcomes of this study can be summarized as follows.
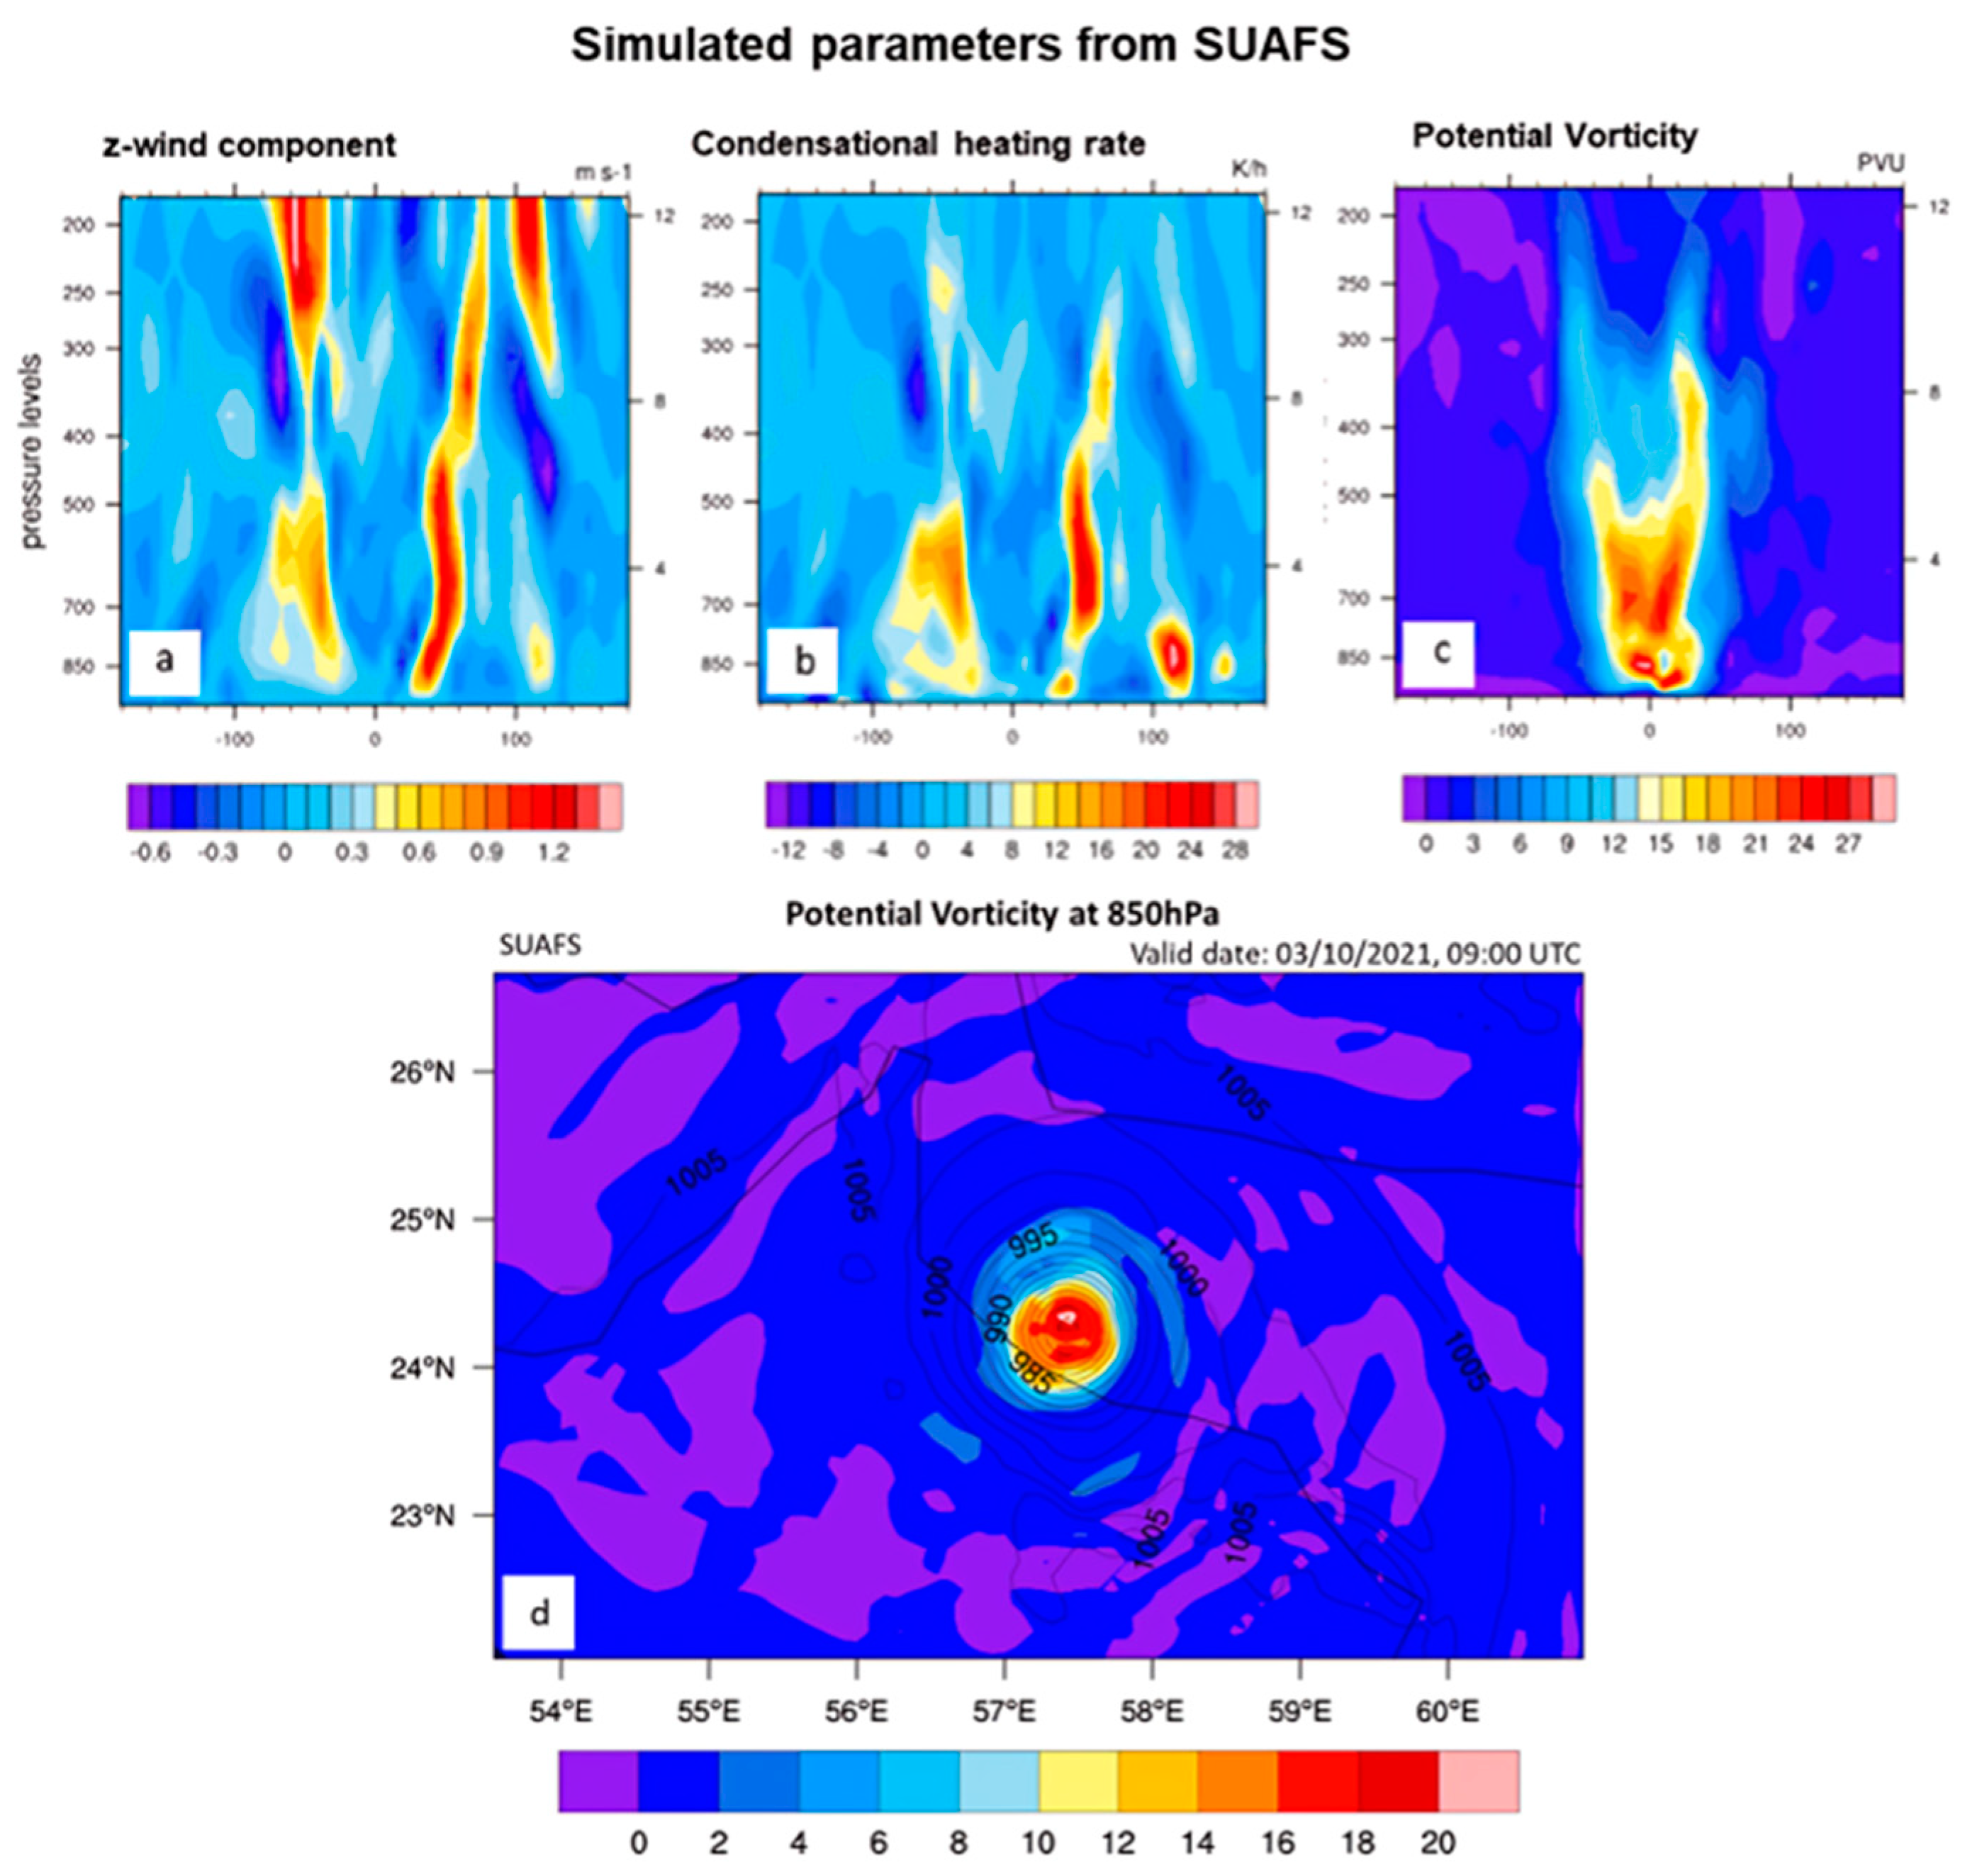
  • Shaheen in its formation was an upper warm-core tropical cyclone and gradually transformed to a typically deep warm-core tropical system.
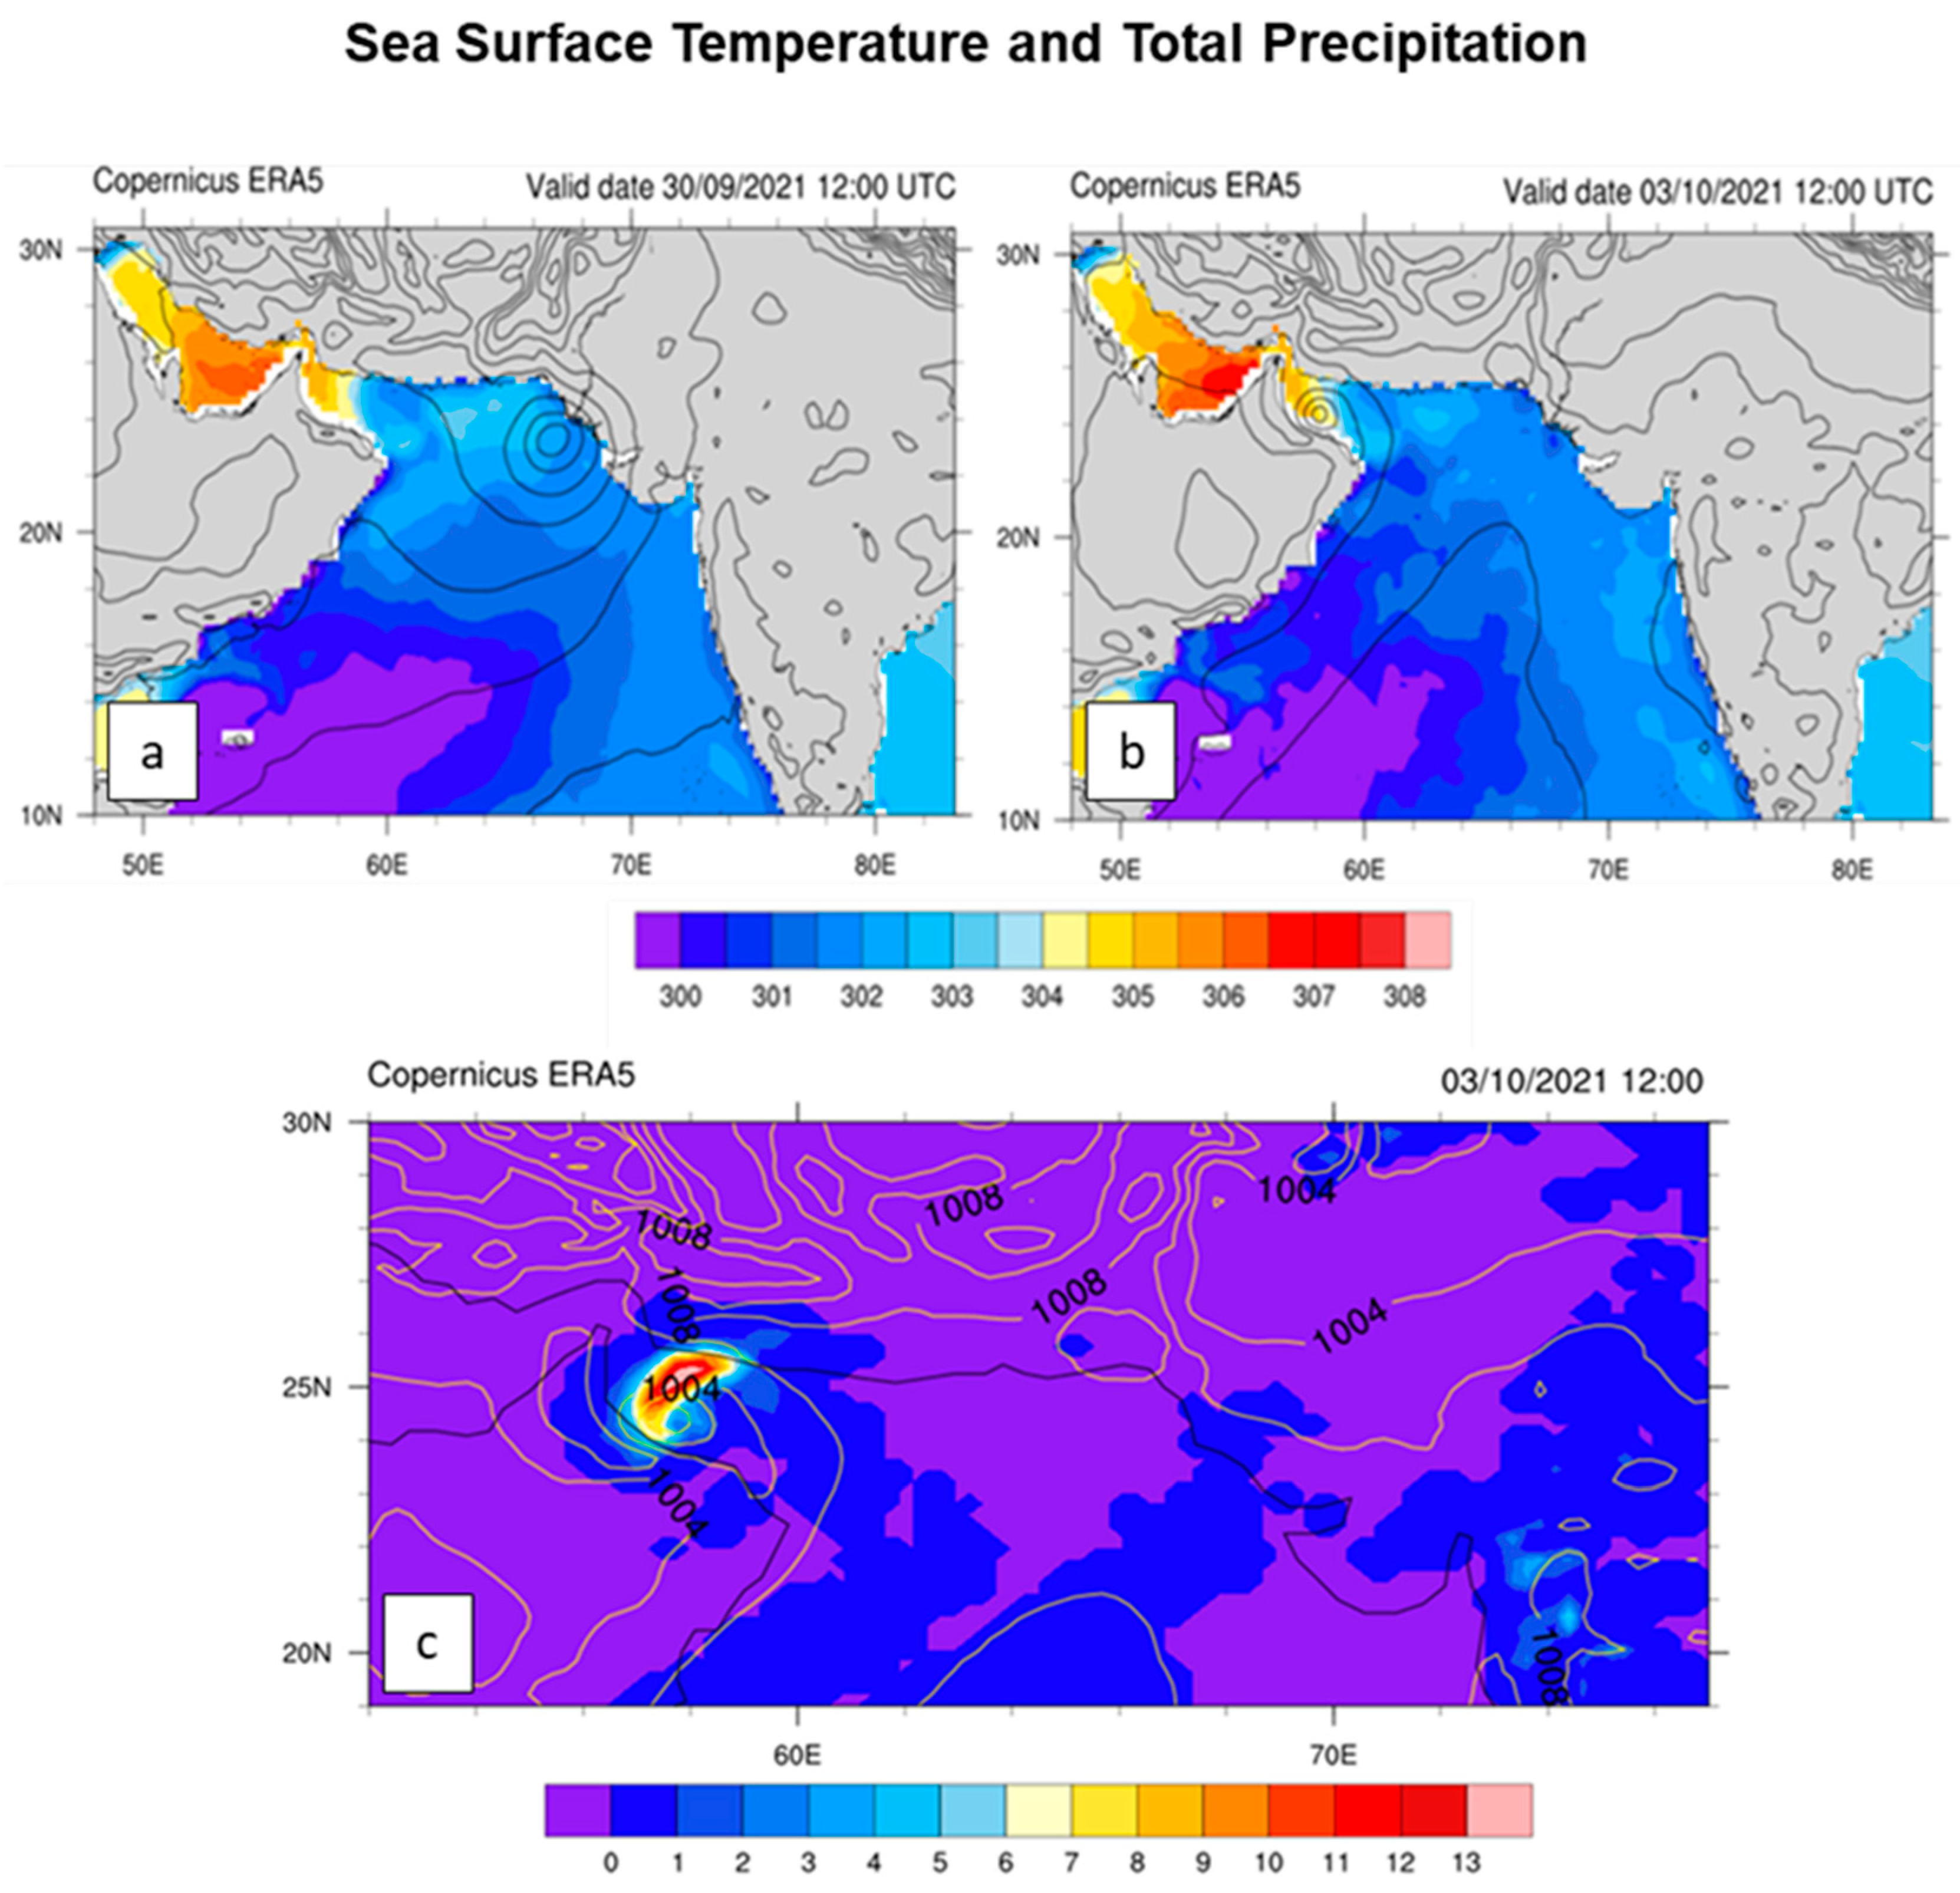
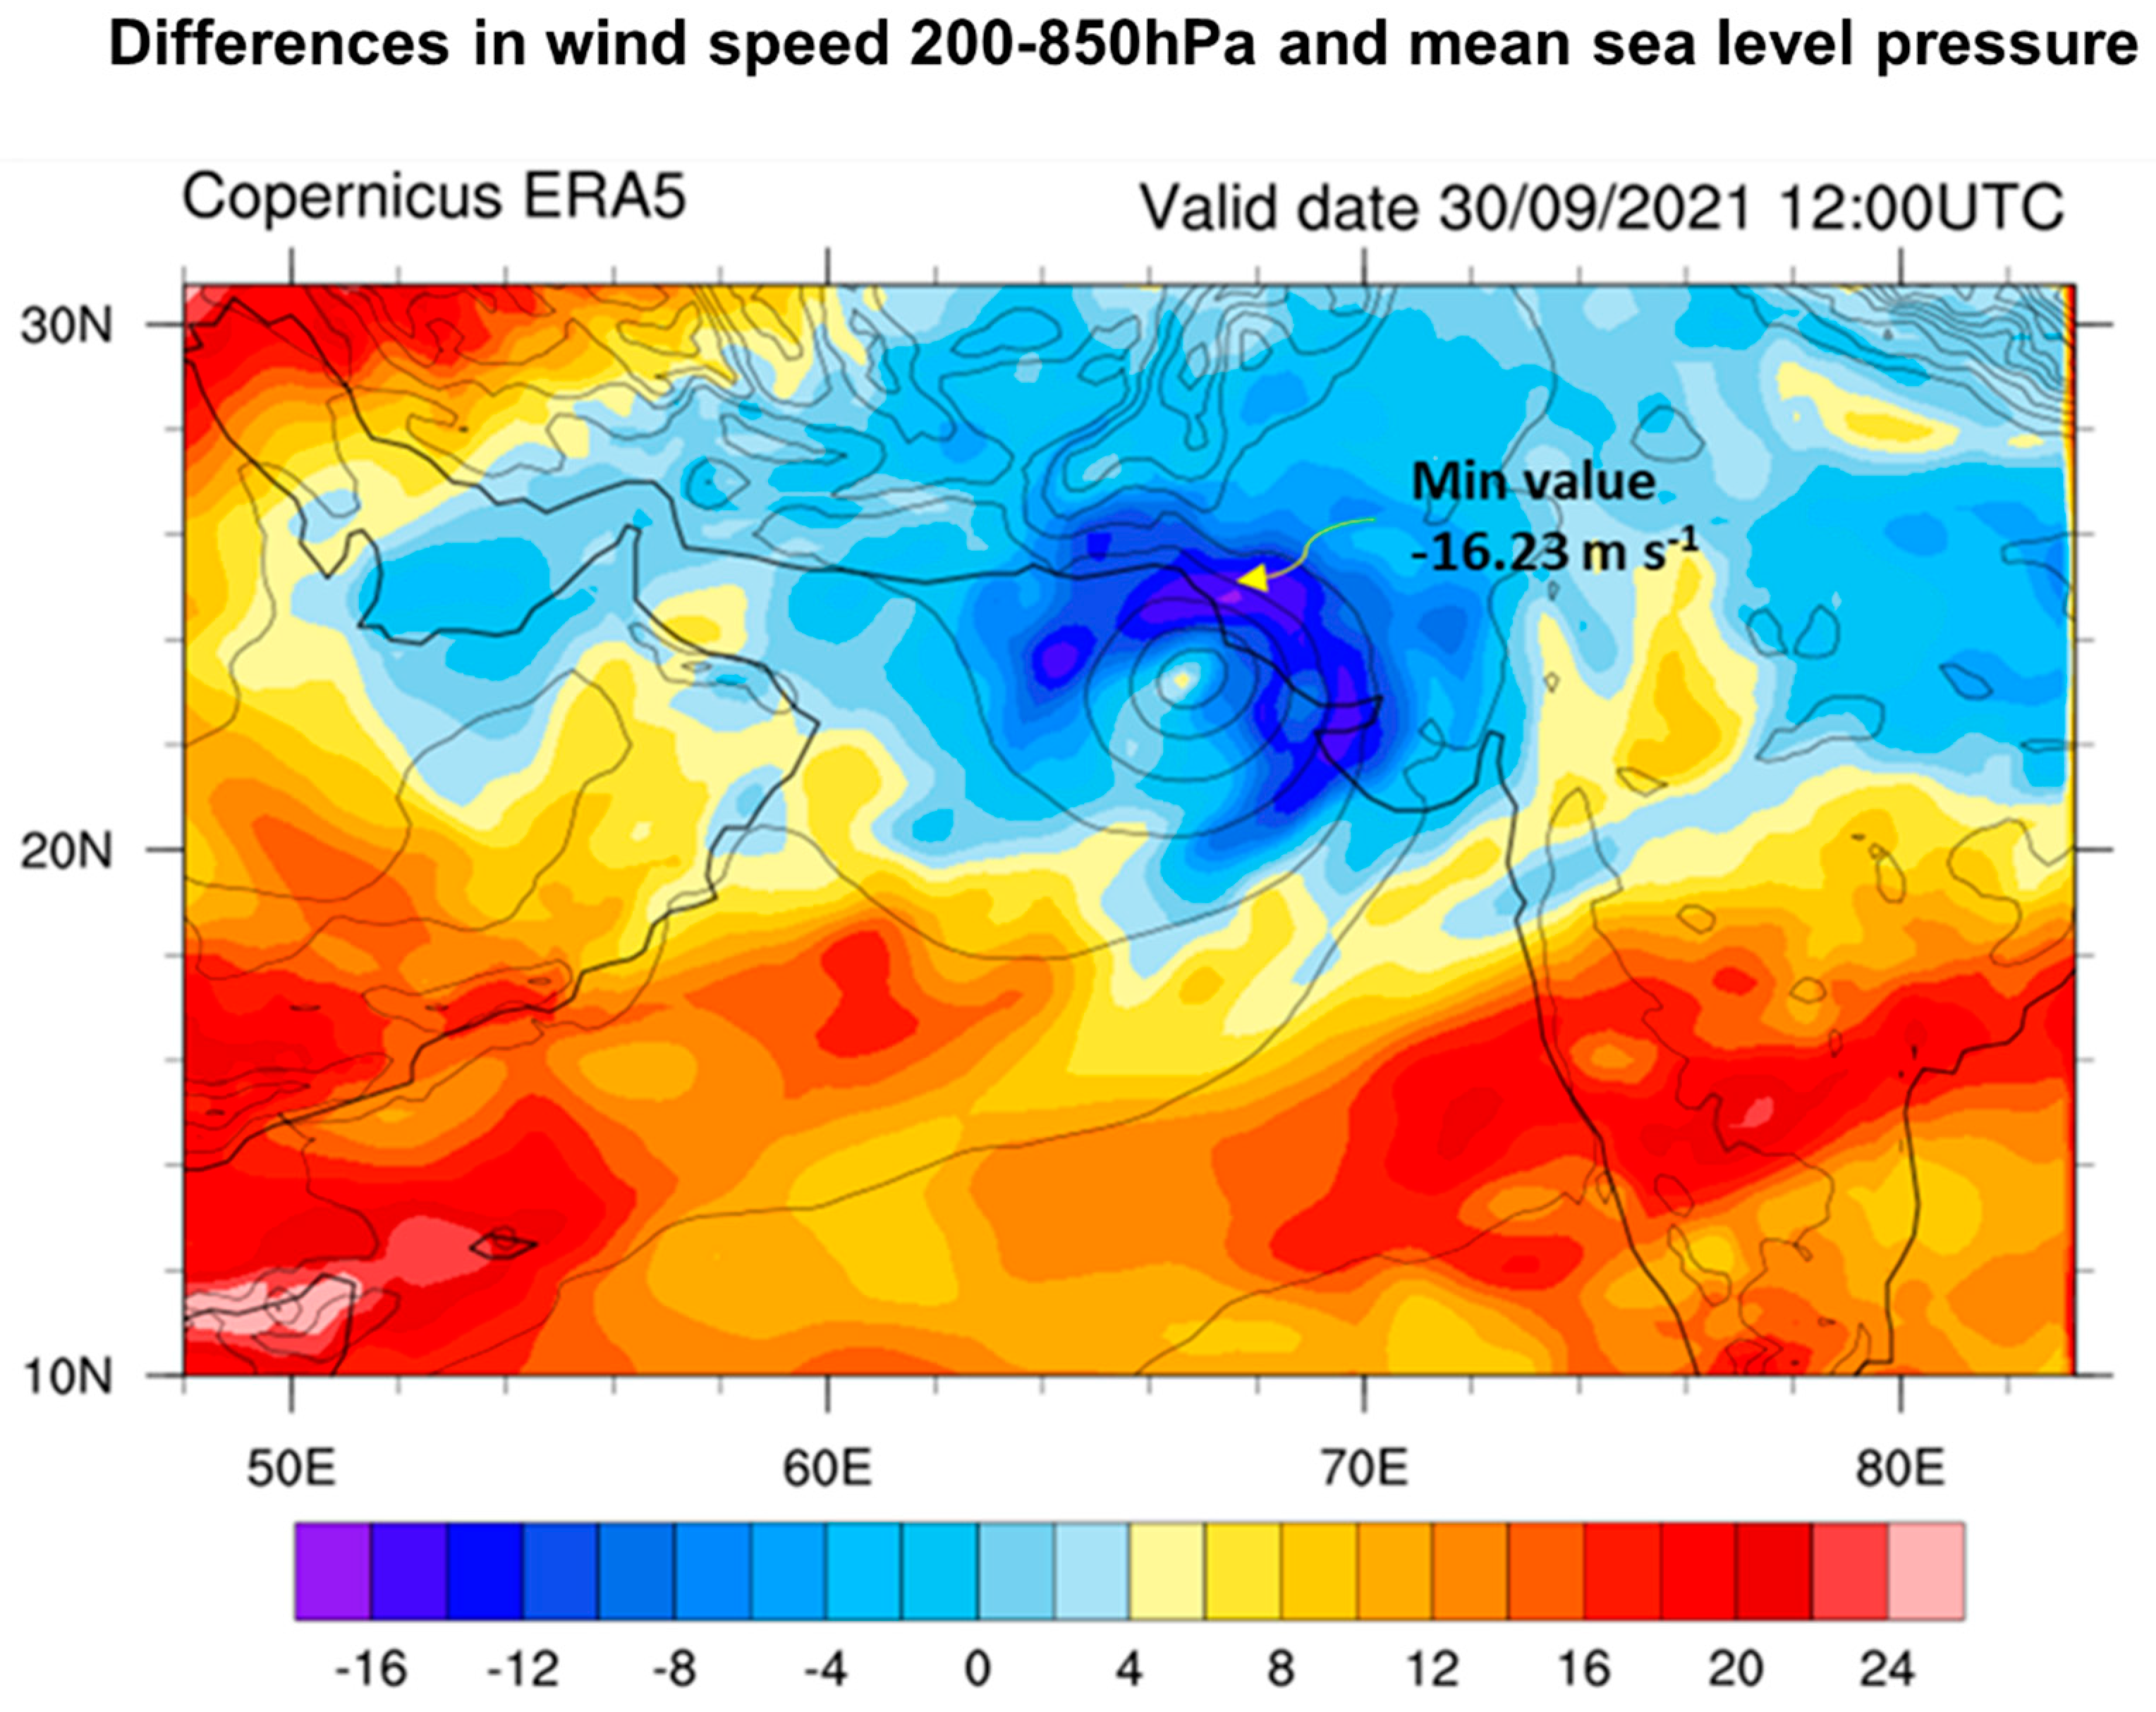
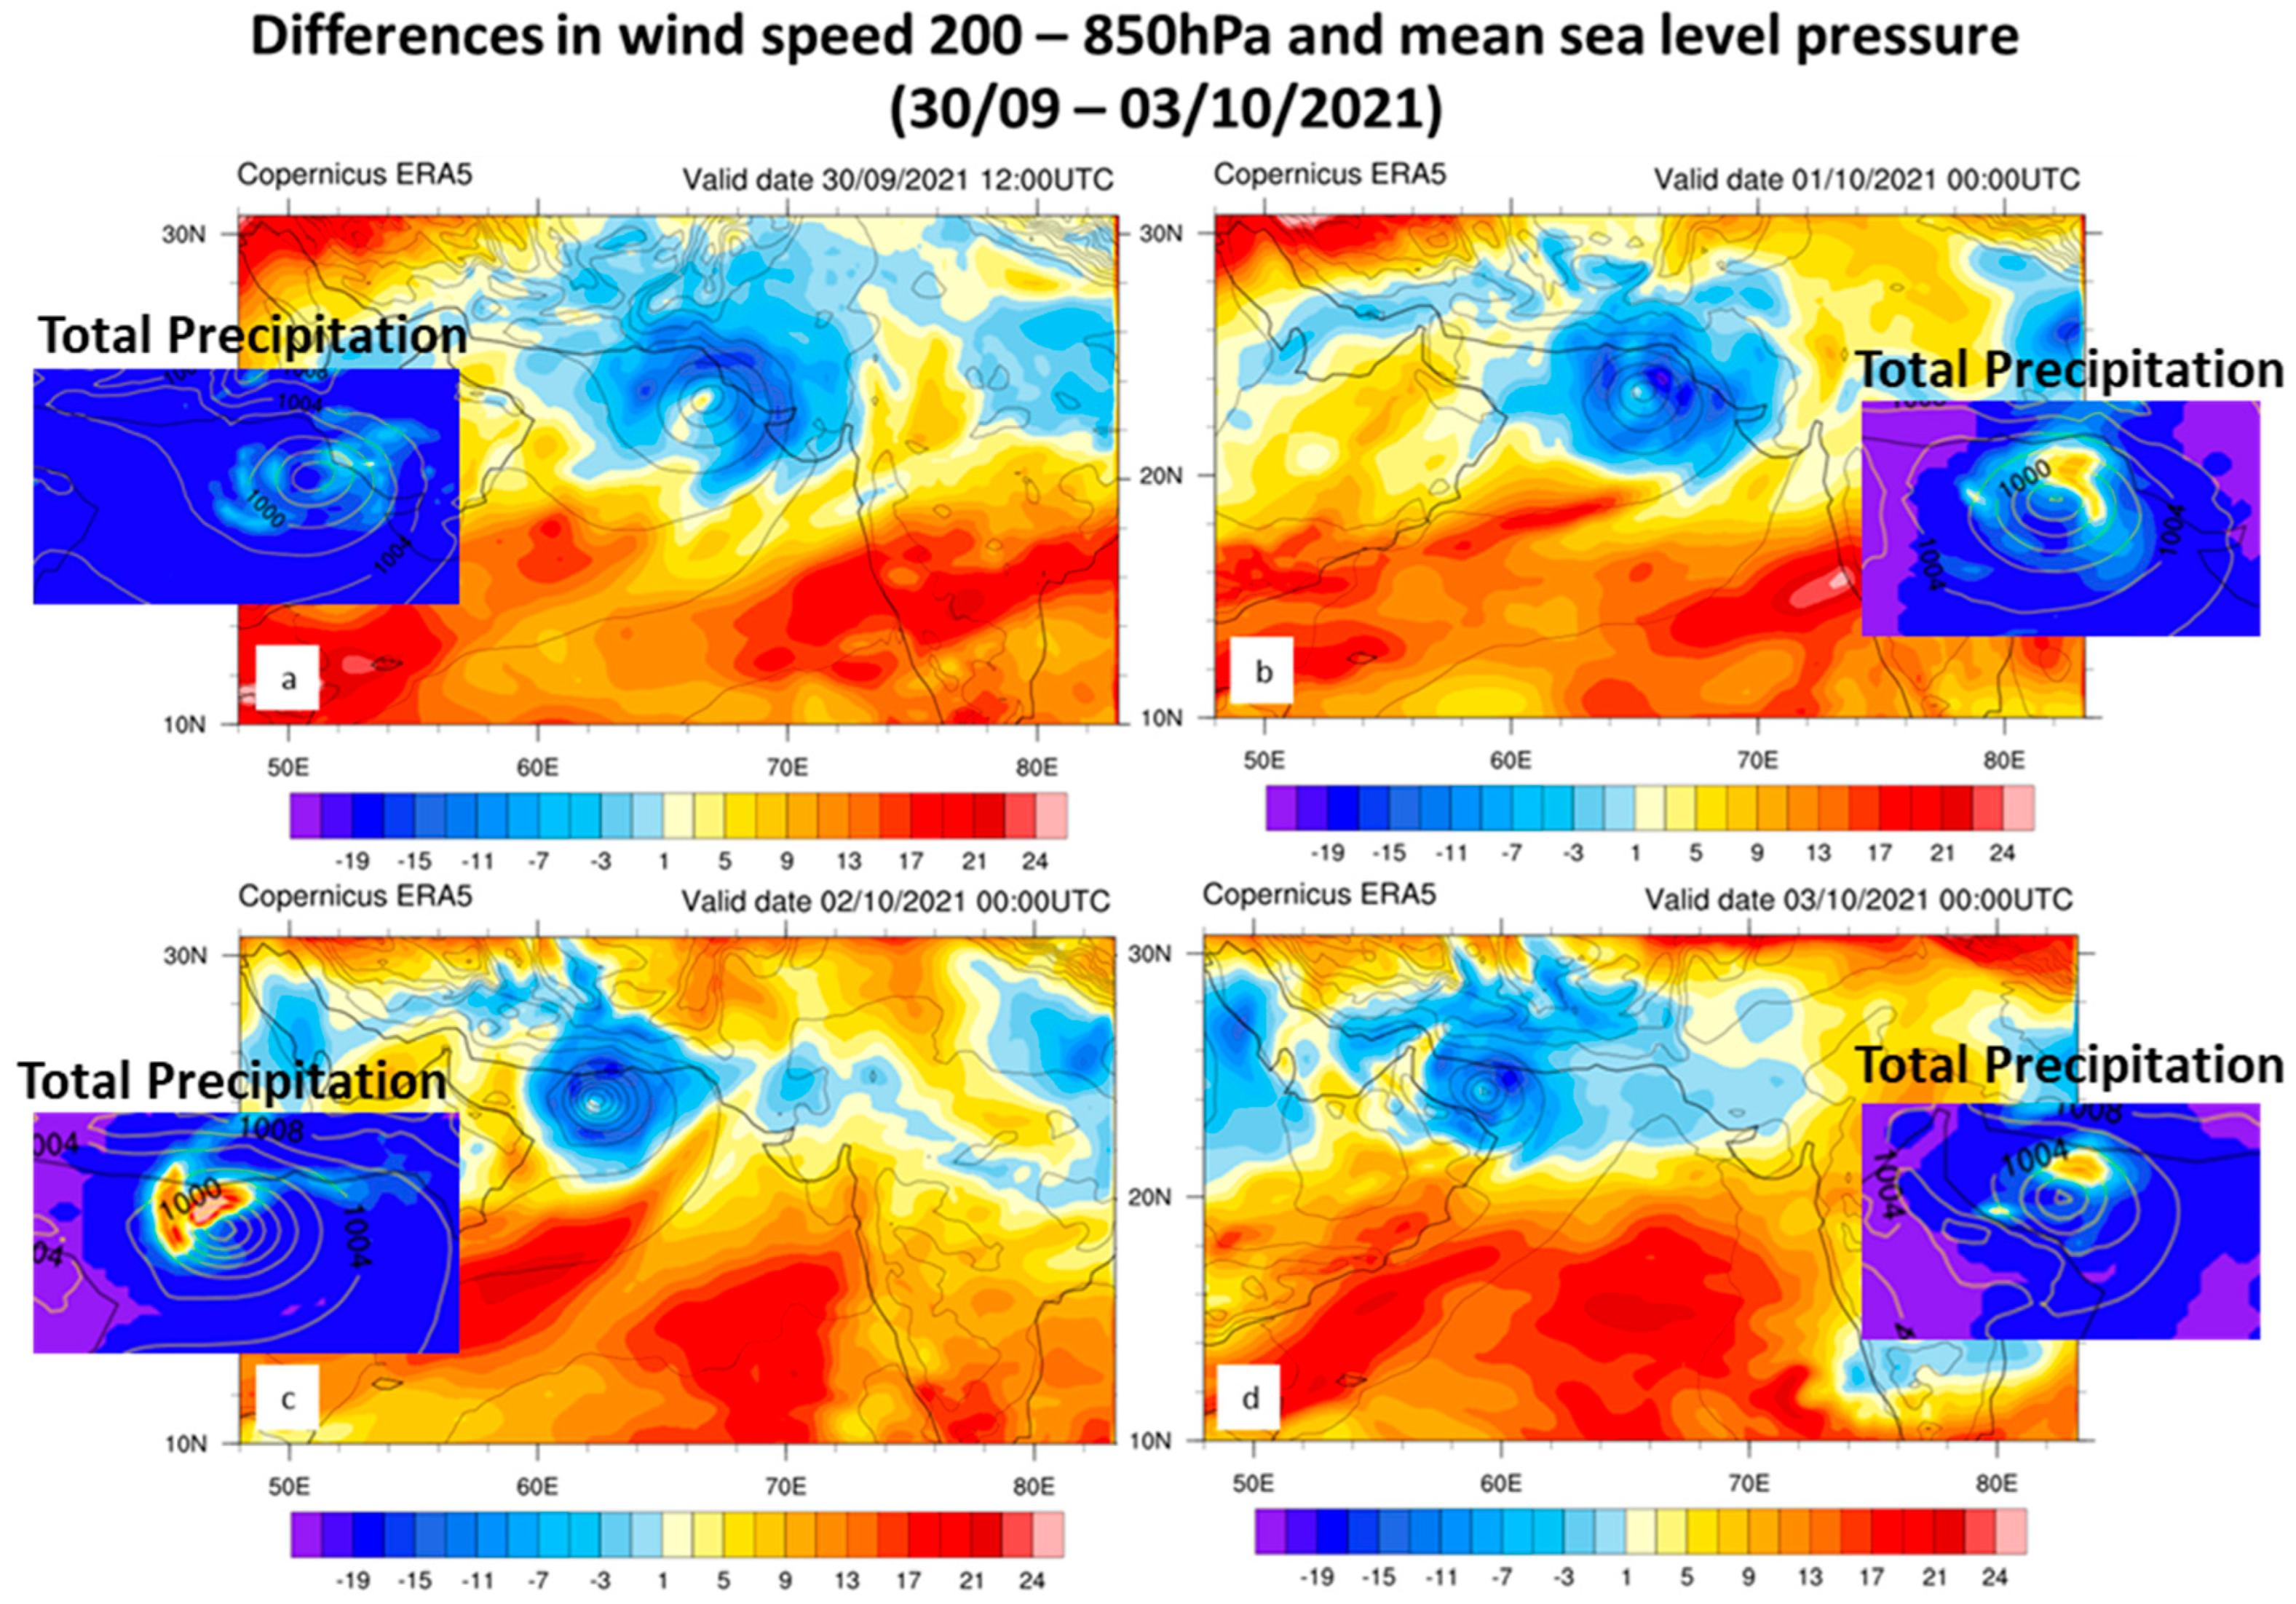
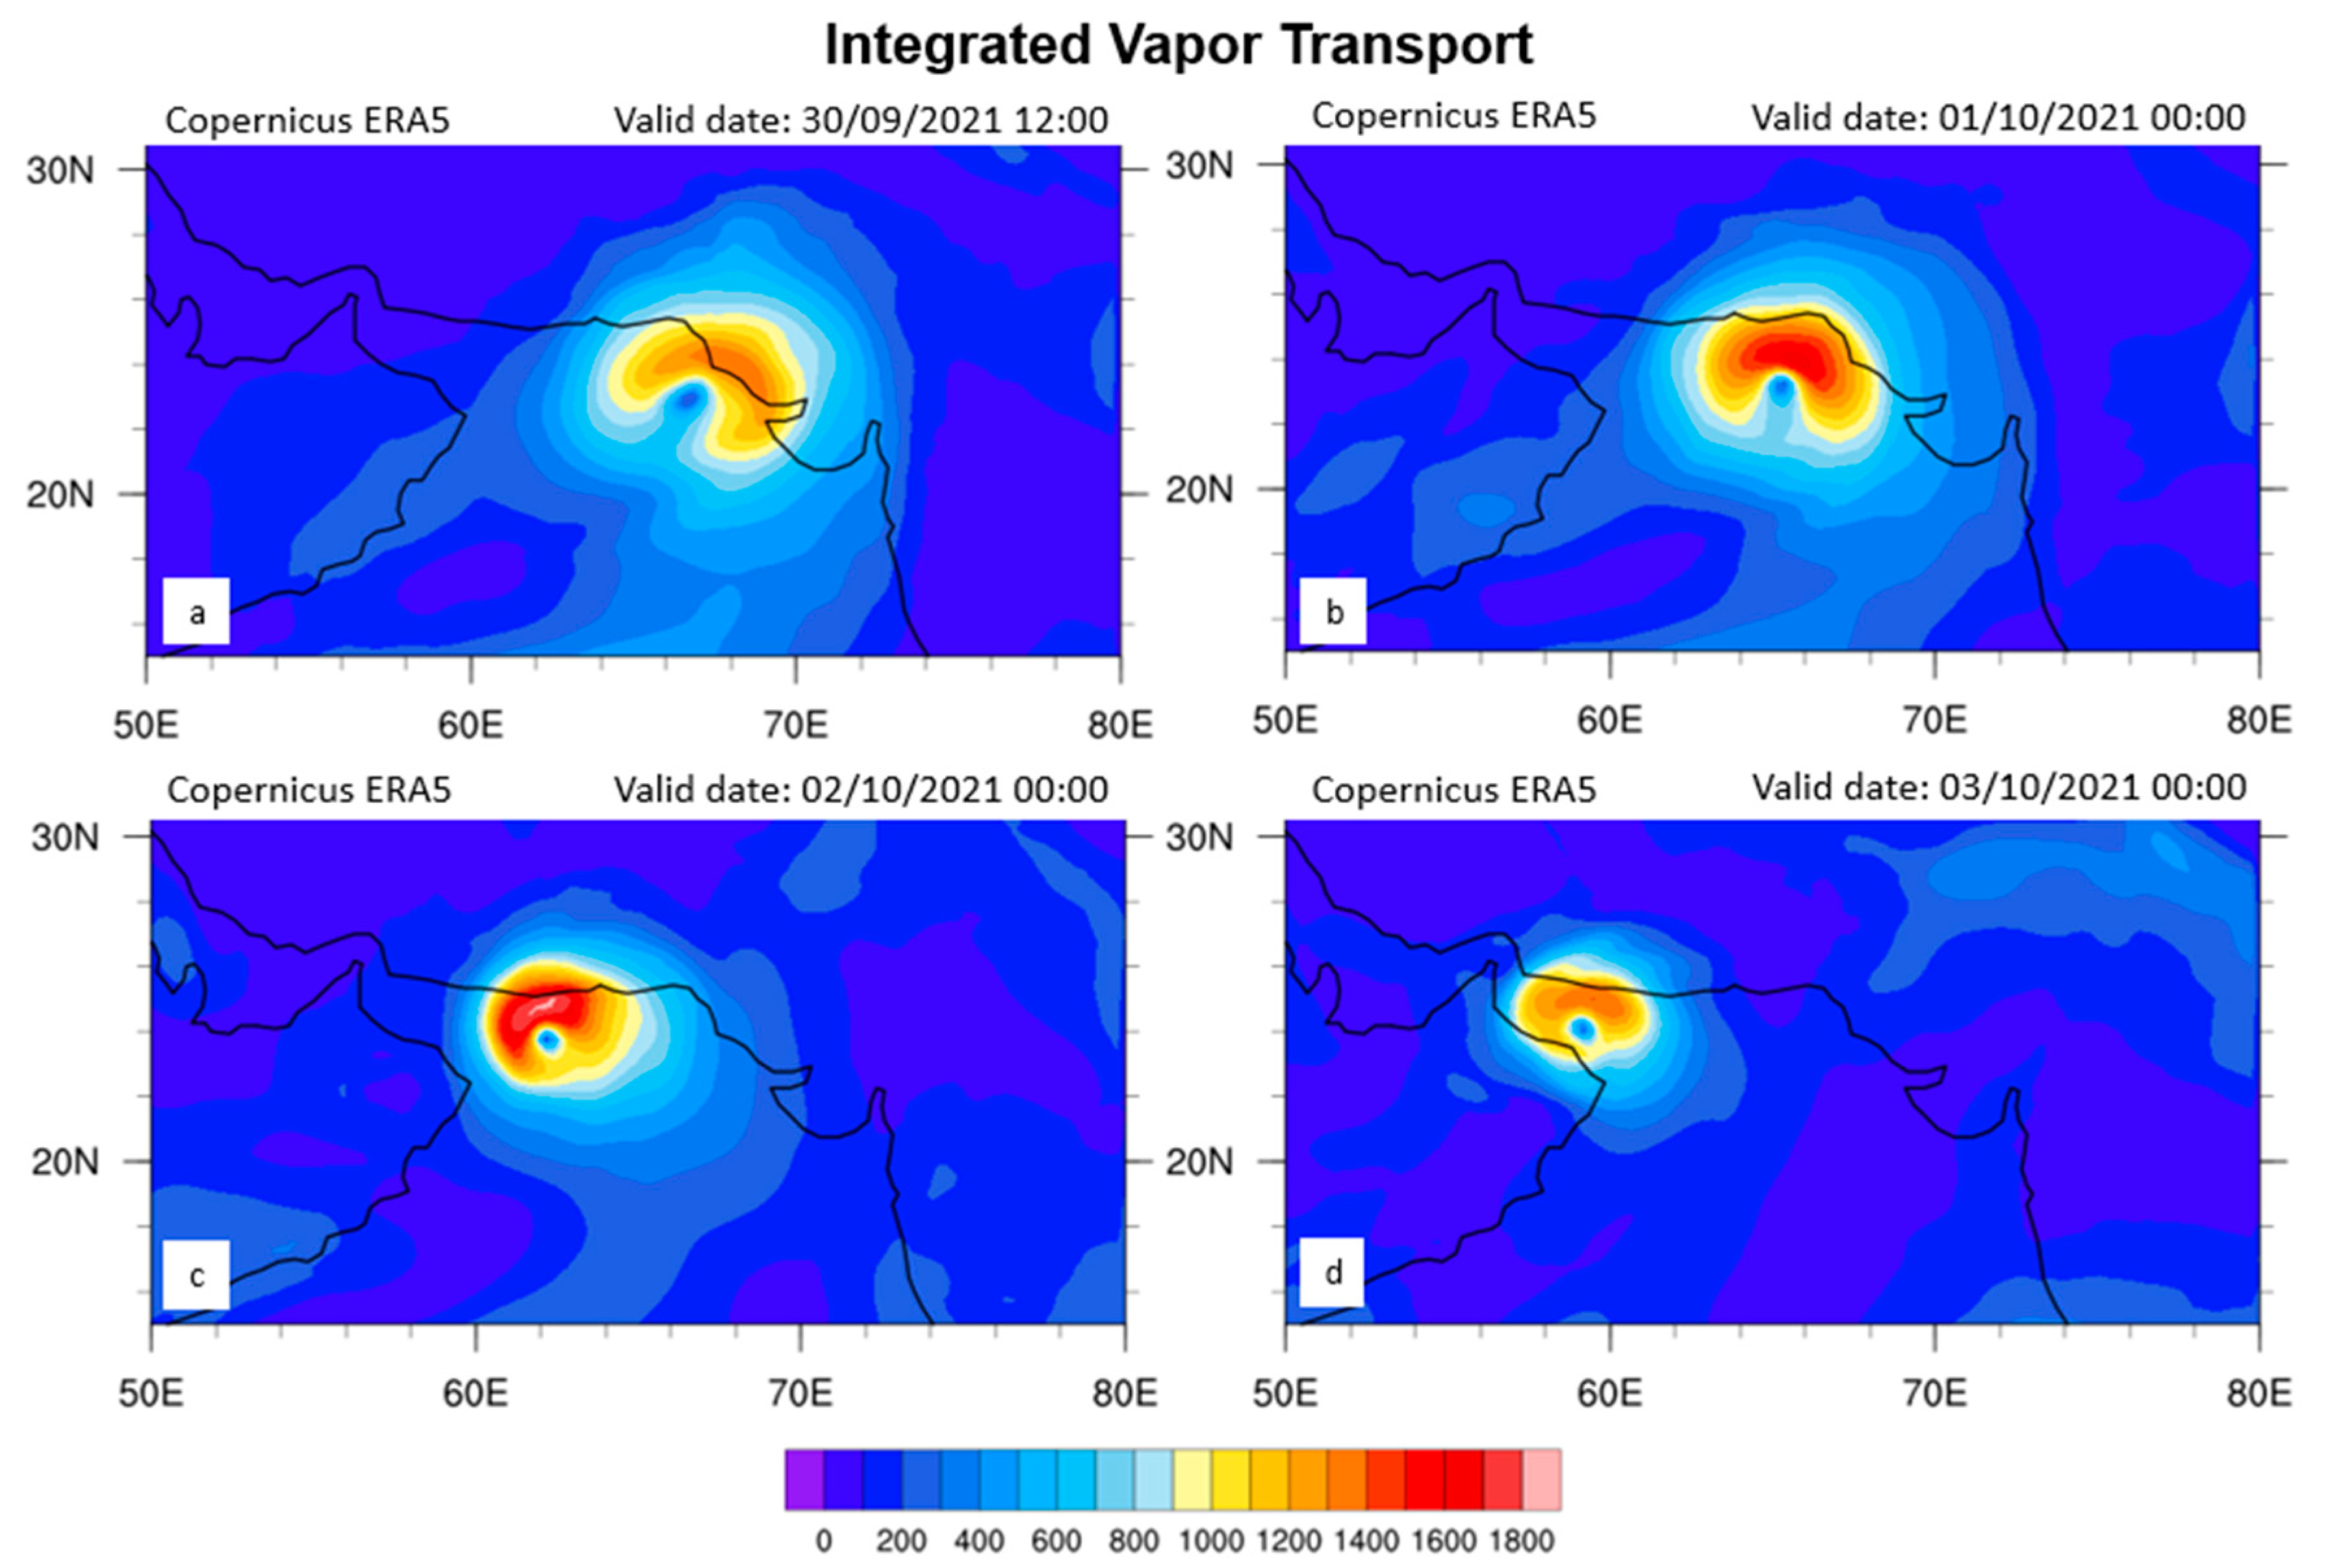
  • Total precipitation maxima were found in the regions with minimum 200–850 hPa VWS and IVT maxima.
  • Total precipitation was increased in areas along SST gradients.
  • A great increase in the wadi’s bed load was observed in the downstream areas, specifically on the coastal alluvial fans and gravel plains.
To conclude, this research work could be the basis for further cyclone investigations in the area and the deployment of an attribution study that will aim at disentangling the effect of climate change on the formation and structure of the tropical cyclones.

Author Contributions

Conceptualization, P.K., K.P. and H.B.-R.; methodology, P.K., K.P., H.B.-R., G.V. and C.S.; software, G.V., C.S. and P.-M.S.; validation, G.V., C.S. and P.-M.S.; formal analysis, P.K., K.P., H.B.-R. and P.-M.S.; investigation, P.K., K.P., H.B.-R., P.-M.S. and S.F.; resources, P.K., K.P. and H.B.-R.; data curation, K.P., H.B.-R. and P.-M.S.; writing—original draft preparation, P.K., K.P., H.B.-R. and P.-M.S.; writing—review and editing, P.K., K.P., H.B.-R. and S.F.; visualization, G.V., C.S. and P.-M.S.; supervision, P.K. and K.P.; project administration, P.K. and K.P.; funding acquisition, K.P. All authors have read and agreed to the published version of the manuscript.

Funding

This research received no external funding.

Institutional Review Board Statement

Not applicable.

Informed Consent Statement

Not applicable.

Data Availability Statement

The GFS-ANL data of the NCEP used in this study are publicly available at: https://www.ncdc.noaa.gov/data-access/model-data/model-datasets/global-forcastsystem-gfs (accessed on 30 March 2023). The ERA5 reanalysis dataset is also available at https://cds.climate.copernicus.eu/cdsapp#!/dataset/reanalysis-era5-complete?tab=overview (accessed on 30 March 2023). The SUAFS model data presented in this study are available on request from the corresponding author P.K. (under the MoU agreement between SUAD and HUA).

Acknowledgments

The climate reanalysis dataset was generated using Copernicus Climate Change Service Information [2023]. The authors are grateful to the European Center for Medium-Range Weather Forecasts (ECMWF) and the Copernicus for the free access to the ERA5 data and observations needed for the completion of this study. We would also like to thank the European Organization for the Exploitation of Meteorological Satellites (EUMETSAT) for providing satellite images. The authors, equally, thank Sorbonne University Abu Dhabi for hosting SUAFS and providing the right technical support from 2017 to 2022.

Conflicts of Interest

The authors declare no conflicts of interest.

References

  1. Frank, W.M.; Roundy, P.E. The role of tropical waves in tropical cyclogenesis. Mon. Weather Rev. 2006, 134, 2397–2417. [Google Scholar] [CrossRef]
  2. Ramsay, H. The global climatology of tropical cyclones. In Oxford Research Encyclopedia of Natural Hazard Science; Oxford University Press: Oxford, UK, 2017. [Google Scholar] [CrossRef]
  3. Mohapatra, M.; Srivastava, A.K.; Balachandran, S.; Geetha, B. Inter-annual variation and trends in tropical cyclones and monsoon depressions over the north Indian Ocean. In Observed Climate Variability and Change over the Indian Region, 1st ed.; Rajeevan, M.N., Nayak, S., Eds.; Springer: Singapore, 2017; pp. 89–106. [Google Scholar] [CrossRef]
  4. Dhavale, S.; Mujumdar, M.; Roxy, M.K.; Singh, V.K. Tropical cyclones over the Arabian Sea during the monsoon onset phase. Int. J. Climatol. 2022, 42, 2996–3006. [Google Scholar] [CrossRef]
  5. Chowdhury, R.; Prasanna Kumar, S.; Narvekar, J.; Chakraborty, A. Back-to-back occurrence of tropical cyclones in the Arabian sea during October–November 2015: Causes and responses. J. Geophys. Res. Oceans 2020, 125, e2019JC015836. [Google Scholar] [CrossRef]
  6. Singh, V.K.; Roxy, M.K.; Deshpande, M. Role of warm ocean conditions and the MJO in the genesis and intensification of extremely severe cyclone Fani. Sci. Rep. 2021, 11, 3607. [Google Scholar] [CrossRef]
  7. Hoarau, K.; Chalonge, L. A Climatology of Intense Tropical Cyclones in the North Indian Ocean Over the Past Three Decades (1980–2008). In Indian Ocean Tropical Cyclones and Climate Change, 1st ed.; Charabi, Y., Ed.; Springer: Dordrecht, The Netherlands, 2010; pp. 3–7. [Google Scholar] [CrossRef]
  8. Fritz, H.M.; Blount, C.; Albusaidi, F.B.; Al-Harthy, A.H.M. Cyclone Gonu storm surge in the Gulf of Oman. In Indian Ocean Tropical Cyclones and Climate Change, 1st ed.; Charabi, Y., Ed.; Springer: Dordrecht, The Netherlands, 2010; pp. 255–263. [Google Scholar] [CrossRef]
  9. Terry, J.; Al Ruheili, A.; Boldi, R.; Gienko, G.; Stahl, H. Cyclone Shaheen: The exceptional tropical cyclone of October 2021 in the Gulf of Oman. Weather 2022, 77, 364–370. [Google Scholar] [CrossRef]
  10. Mukherjee, P.; Ramakrishnan, B. Investigation of unique Arabian Sea tropical cyclone with GPU-based WRF model: A case study of Shaheen. J. Atmos. Sol.-Terr. Phys. 2023, 246, 106052. [Google Scholar] [CrossRef]
  11. Jaiswal, N.; Jishad, M.; Deb, S.K.; Varma, A.K.; Agarwal, N.; Sharma, R. Analysis of atmospheric and oceanic conditions during unusual occurrence of tropical cyclone Gulab and Shaheen in North Indian Ocean. J. Earth Syst. Sci. 2023, 132, 109. [Google Scholar] [CrossRef]
  12. AlRuheili, A.M. A tale of Shaheen’s cyclone consequences in Al Khaboura City, Oman. Water 2022, 14, 340. [Google Scholar] [CrossRef]
  13. Kabir, R.; Ritchie, E.A.; Stark, C. Tropical Cyclone Exposure in the North Indian Ocean. Atmosphere 2022, 13, 1421. [Google Scholar] [CrossRef]
  14. Lin, I.I.; Camargo, S.J.; Patricola, C.M.; Boucharel, J.; Chand, S.; Klotzbach, P.; Chan, J.C.; Wang, B.; Chang, P.; Li, T.; et al. ENSO and tropical cyclones. In El Niño Southern Oscillation in a Changing Climate, 1st ed.; McPhaden, M.J., Santoso, A., Cai, W., Eds.; American Geophysical Union: Washington, DC, USA, 2021; pp. 377–408. [Google Scholar] [CrossRef]
  15. Hersbach, H.; Bell, B.; Berrisford, P.; Hirahara, S.; Horányi, A.; Muñoz-Sabater, J.; Nicolas, J.; Peubey, C.; Radu, R.; Schepers, D.; et al. The ERA5 global reanalysis. Q. J. R. Meteorol. Soc. 2020, 146, 1999–2049. [Google Scholar] [CrossRef]
  16. Klaes, K.D.; Holmlund, K. An update on EUMETSAT programmes and plans. In Earth Observing Systems XXI; SPIE: Bellingham, WA, USA, 2016; Volume 9972, pp. 378–389. [Google Scholar] [CrossRef]
  17. Aminou, D.M.A.; Ottenbacher, A.; Jacquet, B.; Pasternak, F.; Coste, P. Meteosat second generation: Inflight calibration of the imaging radiometer SEVIRI. In Earth Observing Systems VI; SPIE: Bellingham, WA, USA, 2002; Volume 4483, pp. 248–257. [Google Scholar] [CrossRef]
  18. Skamarock, W.C.; Klemp, J.B.; Dudhia, J.; Gill, D.O.; Liu, Z.; Berner, J.; Huang, X.Y. A Description of the Advanced Research WRF Model Version 4; NCAR Tech Note, NCAR/TN–556+ STR; UCAR: Boulder, CO, USA, 2021. [Google Scholar] [CrossRef]
  19. Malakar, P.; Kesarkar, A.P.; Bhate, J.N.; Singh, V.; Deshamukhya, A. Comparison of reanalysis data sets to comprehend the evolution of tropical cyclones over North Indian Ocean. Earth Space Sci. 2020, 7, e2019EA000978. [Google Scholar] [CrossRef]
  20. Mohanty, U.C.; Osuri, K.K.; Routray, A.; Mohapatra, M.; Pattanayak, S. Simulation of Bay of Bengal tropical cyclones with WRF model: Impact of initial and boundary conditions. Mar. Geod. 2010, 33, 294–314. [Google Scholar] [CrossRef]
  21. Nadimpalli, R.; Osuri, K.K.; Mohanty, U.C.; Das, A.K.; Kumar, A.; Sil, S.; Niyogi, D. Forecasting tropical cyclones in the Bay of Bengal using quasi-operational WRF and HWRF modeling systems: An assessment study. Meteorol. Atmos. Phys. 2020, 132, 1–17. [Google Scholar] [CrossRef]
  22. Chin, M.; Ginoux, P.; Kinne, S.; Torres, O.; Holben, B.N.; Duncan, B.N.; Martin, R.V.; Logan, J.A.; Higurashi, A.; Nakajima, T. Tropospheric aerosol optical thickness from the GOCART model and comparisons with satellite and Sun photometer measurements. J. Atmos. Sci. 2002, 59, 461–483. [Google Scholar] [CrossRef]
  23. Alam, M.M. Sensitivity study of planetary boundary layer parameterization schemes for the simulation of tropical cyclone ‘Fani’ over the Bay of Bengal using high resolution WRF-ARW model. J. Eng. Sci. 2020, 11, 1–18. [Google Scholar] [CrossRef]
  24. Qi, F.; Fei, J.; Ma, Z.; Chen, J.; Huang, X.; Cheng, X. Comparison of simulated tropical cyclone intensity and structures using the WRF with hydrostatic and nonhydrostatic dynamical cores. Atmosphere 2018, 9, 483. [Google Scholar] [CrossRef]
  25. Prakash, K.R.; Nigam, T.; Pant, V. Estimation of oceanic subsurface mixing under a severe cyclonic storm using a coupled atmosphere–ocean–wave model. Ocean Sci. 2018, 14, 259–272. [Google Scholar] [CrossRef]
  26. Varlas, G.; Katsafados, P.; Papadopoulos, A.; Korres, G. Implementation of a two-way coupled atmosphere-ocean wave modeling system for assessing air-sea interaction over the Mediterranean Sea. Atmos. Res. 2018, 208, 201–217. [Google Scholar] [CrossRef]
  27. Yang, S.; Moon, I.J.; Bae, H.J.; Kim, B.M.; Byun, D.S.; Lee, H.Y. Intense atmospheric frontogenesis by air–sea coupling processes during the passage of Typhoon Lingling captured at Ieodo Ocean Research Station. Sci. Rep. 2022, 12, 15513. [Google Scholar] [CrossRef]
  28. Ma, H.; Cao, X.; Ma, X.; Su, H.; Jing, Y.; Zhu, K. Improving the Wind Power Density Forecast in the Middle-and High-Latitude Regions of China by Selecting the Relatively Optimal Planetary Boundary Layer Schemes. Atmosphere 2022, 13, 2034. [Google Scholar] [CrossRef]
  29. Shikhovtsev, A.Y.; Kovadlo, P.G.; Lezhenin, A.A.; Korobov, O.A.; Kiselev, A.V.; Russkikh, I.V.; Kolobov, D.Y.; Shikhovtsev, M.Y. Influence of Atmospheric Flow Structure on Optical Turbulence Characteristics. Appl. Sci. 2023, 13, 1282. [Google Scholar] [CrossRef]
  30. Hong, S.Y.; Pan, H.L. Nonlocal boundary layer vertical diffusion in a medium-range forecast model. Mon. Weather Rev. 1996, 124, 2322–2339. [Google Scholar] [CrossRef]
  31. Francis, D.; Fonseca, R.; Nelli, N. Key Factors Modulating the Threat of the Arabian Sea’s Tropical Cyclones to the Gulf Countries. J. Geophys. Res. Atmos 2022, 127, e2022JD036528. [Google Scholar] [CrossRef]
  32. Sebastian, M.; Behera, M.R. Impact of SST on tropical cyclones in North Indian Ocean. Procedia Eng. 2015, 116, 1072–1077. [Google Scholar] [CrossRef]
  33. Podestá, G.P.; Brown, O.B.; Evans, R.H. The annual cycle of satellite-derived sea surface temperature in the southwestern Atlantic Ocean. J. Clim. 1991, 4, 457–467. [Google Scholar] [CrossRef]
  34. DeMaria, M.; Kaplan, J. Sea surface temperature and the maximum intensity of Atlantic tropical cyclones. J. Clim. 1994, 7, 1324–1334. [Google Scholar] [CrossRef]
  35. Emanuel, K.A. An air-sea interaction theory for tropical cyclones. Part I: Steady-state maintenance. J. Atmos. Sci. 1986, 43, 585–604. [Google Scholar] [CrossRef]
  36. Yao, J.; Duan, W.; Qin, X. Which features of the SST forcing error most likely disturb the simulated intensity of tropical cyclones? Adv. Atmos. Sci. 2021, 38, 581–602. [Google Scholar] [CrossRef]
  37. Reid, G.C.; Gage, K.S. On the annual variation in height of the tropical tropopause. J. Atmos. Sci. 1981, 38, 1928–1938. [Google Scholar] [CrossRef]
  38. Schade, L.R. Tropical cyclone intensity and sea surface temperature. J. Atmos. Sci. 2000, 57, 3122–3130. [Google Scholar] [CrossRef]
  39. Lin, Y.; Zhao, M.; Zhang, M. Tropical cyclone rainfall area controlled by relative sea surface temperature. Nat. Commun. 2015, 6, 6591. [Google Scholar] [CrossRef] [PubMed]
  40. Finocchio, P.M.; Rios-Berrios, R. The intensity-and size-dependent response of tropical cyclones to increasing vertical wind shear. J. Atmos. Sci. 2021, 78, 3673–3690. [Google Scholar] [CrossRef]
  41. Chen, Q.; Fang, J. Effects of vertical wind shear on intensity and structure of tropical cyclone. J. Trop. Meteorol. 2012, 18, 172. [Google Scholar]
  42. Zehr, R.M. Tropical Cyclogenesis in the Western North Pacific; NOAA Technical Report NESDIS, 61; NOAA: Washington, DC, USA, 1992. Available online: https://repository.library.noaa.gov/view/noaa/13116 (accessed on 12 June 2023).
  43. Elsberry, R.L.; Jeffries, R.A. Vertical wind shear influences on tropical cyclone formation and intensification during TCM-92 and TCM-93. Mon. Weather Rev. 1996, 124, 1374–1387. [Google Scholar] [CrossRef]
  44. Hart, R.E. A cyclone phase space derived from thermal wind and thermal asymmetry. Mon. Weather Rev. 2003, 131, 585–616. [Google Scholar] [CrossRef]
  45. Pang, H.; Fu, G. Case study of potential vorticity tower in three explosive cyclones over Eastern Asia. J. Atmos. Sci. 2017, 74, 1445–1454. [Google Scholar] [CrossRef]
  46. Edwards, J.P. Barotropic Instability in the Inner Core of Tropical Cyclones. Doctoral Dissertation, Colorado State University, Fort Collins, CO, USA, 1994. [Google Scholar]
  47. Xie, X.; Wei, Z.; Wang, B.; Chen, Z.; Oltmanns, M.; Song, X. Extreme air–sea turbulent fluxes during tropical cyclone Barijat observed by a newly designed drifting buoy. Fundam. Res. 2022, in press. [CrossRef]
  48. Chen, B.F.; Lee, C.S.; Elsberry, R.L. On tropical cyclone size and intensity changes associated with two types of long-lasting rainbands in monsoonal environments. Geophys. Res. Lett. 2014, 41, 2575–2581. [Google Scholar] [CrossRef]
  49. Farr, M.B.; Gasch, J.V.; Travis, E.J.; Weaver, S.M.; Yavuz, V.; Semenova, I.G.; Panasiuk, O.; Lupo, A.R. An Analysis of the Synoptic Dynamic and Hydrologic Character of the Black Sea Cyclone Falchion. Meteorology 2022, 1, 495–512. [Google Scholar] [CrossRef]
  50. Yu, E.; Bai, R.; Chen, X.; Shao, L. Impact of physical parameterizations on wind simulation with WRF V3.9.1.1 under stable conditions at planetary boundary layer gray-zone resolution: A case study over the coastal regions of North China. Geosci. Model Dev. 2022, 15, 8111–8134. [Google Scholar] [CrossRef]
  51. Xiong, J.; Yu, F.; Fu, C.; Dong, J.; Liu, Q. Evaluation and improvement of the ERA5 wind field in typhoon storm surge simulations. Appl. Ocean Res. 2022, 118, 103000. [Google Scholar] [CrossRef]
  52. Fairall, C.W.; Bradley, E.F.; Hare, J.E.; Grachev, A.A.; Edson, J.B. Bulk parameterization of air–sea fluxes: Updates and verification for the COARE algorithm. J. Clim. 2003, 16, 571–591. [Google Scholar] [CrossRef]
  53. Yu, L.; Jin, X.; Weller, R. Multidecade Global Flux Datasets from the Objectively Analyzed Air-sea Fluxes (OAFlux) Project: Latent and Sensible Heat Fluxes, Ocean Evaporation, and Related Surface Meteorological Variables. OAFlux Project Tech. Rep. 2008. Available online: https://www.researchgate.net/publication/237440650 (accessed on 23 May 2023).
  54. Wang, C.; Weisberg, R.H.; Yang, H. Effects of the wind speed–evaporation–SST feedback on the El Niño–Southern Oscillation. J. Atmos. Sci. 1999, 56, 1391–1403. [Google Scholar] [CrossRef]
  55. Estoque, M.A. A theoretical study of tropical wave disturbances. J. Meteorol. Soc. Jpn. 1974, 52, 106–119. [Google Scholar] [CrossRef]
  56. Tsujino, S.; Kuo, H.C. Potential vorticity mixing and rapid intensification in the numerically simulated Supertyphoon Haiyan (2013). J. Atmos. Sci. 2020, 77, 2067–2090. [Google Scholar] [CrossRef]
  57. Glennie, K.W. Geology of the Oman mountains. Verh. Koninklink Ned. Geol. Mijnbouwkd. Genootchachp 1974, 1, 423. [Google Scholar] [CrossRef]
  58. Kwarteng, A.Y.; Dorvlo, A.S.; Vijaya Kumar, G.T. Analysis of a 27-year rainfall data (1977–2003) in the Sultanate of Oman. Int. J. Clim. 2009, 29, 605–617. [Google Scholar] [CrossRef]
  59. Al-Hatrushi, S.M.; Kwarteng, A.; Sana, A.; Al-Buloushi, A.S.; MacLachlan, A.; Hamed, K.H. Coastal Erosion in Al Batinah, Sultanate of Oman; Sultan Qaboos University: Muscat, Oman, 2014. [Google Scholar]
  60. Goldenberg, S.B.; Landsea, C.W.; Mestas-Nuñez, A.M.; Gray, W.M. The recent increase in Atlantic hurricane activity: Causes and implications. Science 2001, 293, 474–479. [Google Scholar] [CrossRef]
  61. Varlas, G.; Papadopoulos, A.; Katsafados, P. An analysis of the synoptic and dynamical characteristics of hurricane Sandy (2012). Meteorol. Atmos. Phys. 2019, 131, 443–453. [Google Scholar] [CrossRef]
  62. Tao, D.; Zhang, F. Effect of environmental shear, sea-surface temperature, and ambient moisture on the formation and predictability of tropical cyclones: An ensemble-mean perspective. J. Adv. Model. Earth Syst. 2014, 6, 384–404. [Google Scholar] [CrossRef]
  63. Frank, W.M.; Young, G.S. The interannual variability of tropical cyclones. Mon. Weather Rev. 2007, 135, 3587–3598. [Google Scholar] [CrossRef]
  64. Dibajnia, M.; Soltanpour, M.; Nairn, R.; Allahyar, M. Cyclone Gonu: The most intense tropical cyclone on record in the Arabian Sea. In Indian Ocean Tropical Cyclones and Climate Change, 1st ed.; Charabi, Y., Ed.; Springer: Dordrecht, The Netherlands, 2010; pp. 149–157. [Google Scholar] [CrossRef]
  65. Terry, J.P.; Gienko, G. Quantitative observations on tropical cyclone tracks in the Arabian Sea. Theor. Appl. Climatol. 2019, 135, 1413–1421. [Google Scholar] [CrossRef]
  66. Ramaswamy, V. Influence of Tropical Storms in the Northern Indian Ocean on Dust Entrainment and Long-Range Transport. In Typhoon Impact and Crisis Management, 1st ed.; Tang, D., Sui, G., Eds.; Springer: Berlin/Heidelberg, Germany, 2014; pp. 149–174. [Google Scholar] [CrossRef]
Figure 1. The computational domain of SUAFS. The topography (m) of the area is also illustrated.
Atmosphere 15 00222 g001
Figure 2. Tracks of cyclones and depressions in the North Indian Ocean for the year 2021. (Source: Cyclone e-atlas RSMC India Meteorological Department).
Atmosphere 15 00222 g002
Figure 3. The development of Shaheen through satellite images in infrared. (a) is on 30/09/2021 at 12:00 UTC, (b) on 01/10/2021 at 00:00 UTC, (c) on 02/10/2021 at 00:00 UTC, (d) on 03/10/2021 at 00:00 UTC (Source: EUMETSAT Images, High Rate SEVIRI IR10.8μm).
Atmosphere 15 00222 g003
Figure 4. (a) The SST (K) in the region on 30/09/2021 at 12:00 UTC. (b) The SST (K) on 03/10/2021 at 12:00 UTC. (c) The total precipitation (mm/h) on 03/10/2021 12:00 UTC (Source Copernicus ERA5 data).
Atmosphere 15 00222 g004
Figure 5. Wind shear between 200−850 hPa (in m s−1) on 30/09/2021 at 12:00 UTC.
Atmosphere 15 00222 g005
Figure 6. Phase Space Hart Diagram for TCS (estimated using Copernicus ERA5 Data). The time interval between successive points is 6 h from 30/9/2021 12:00 UTC up to 03/10/2021 12:00 UTC.
Atmosphere 15 00222 g006
Figure 7. (a) Temperature at 850 hPa (K) and Geopotential height (m) at 500 hPa on 30/09/2021 12:00 UTC. (b) Temperature at 850 hPa (K) and Geopotential height (m) at 500 hPa on 01/10/2021 at 06:00 UTC. (c) Vertical velocity in a horizontal cross section of the cyclone and constant Lat 23.25° on 01/10/2021 at 06:00 UTC. (Source: Copernicus ERA5 data).
Atmosphere 15 00222 g007
Figure 8. (a) Specific humidity (kg/kg) and wind vectors at 700 hPa on 30/09/2021 12:00 UTC Based on Copernicus ERA5 data. (b) Potential vorticity at 850 hPa (1 PV = 10−6 m2 s−1 K kg−1) and geopotential height (gpm) on 30/09/2021 12:00 UTC. (Source Copernicus ERA5 data).
Atmosphere 15 00222 g008
Figure 9. Wind shear between 200–850 hPa (in m s−1) from 30/09/2021 12:00 UTC to 03/10/2021 00:00 UTC. (a) 30/09/2021 12:00 UTC, (b) 01/10/2021 00:00 UTC, (c) 02/10/2021 00:00 UTC, (d) 03/10/2021 00:00 UTC. (Source Copernicus ERA5 data).
Atmosphere 15 00222 g009
Figure 10. IVT analysis in kg m−1 s−1. (a) on 30/09/2021 12:00 UTC, (b) on 01/10/2021 00:00 UTC, (c) on 02/10/2021 00:00 UTC, (d) on 03/10/2021 00:00 UTC (Source Copernicus ERA5 data).
Atmosphere 15 00222 g010
Figure 11. (a) The locations and the WMO stations (showing the WMO ID number) used for the comparison against SUAFS model outputs, (b) Time plots of the modeled and observed temperature at 2 m, (c) Time plots of the modeled and observed wind speed at 10 m, (d) Time plots of the modeled and observed mean sea level pressure.
Atmosphere 15 00222 g011
Figure 12. Wind speed at 10 m (m s−1) from SUAFS (a) and from Copernicus ERA5 (b) on 03/10/2021 at 9:00 UTC. The vectors depict the wind direction at 10m.
Atmosphere 15 00222 g012
Figure 13. Simulated (a) latent heat flux and (b) sensible heat flux from SUAFS in W m−2 on 03/10/2021 at 9:00 UTC. The vectors depict the wind direction at 10m.
Atmosphere 15 00222 g013
Figure 14. (a) Vertical velocity, (b) vertical profile of condensational heating rate, (c) vertical profile of potential vorticity on 03/10/2021 at 9:00 UTC, as simulated by SUAFS, (d) Potential Vorticity at 850 hPa from the SUAFS, on 03/10/2021 09:00 UTC in Potential Vorticity Units (1 PVU = 10−6 m2 s−1⋅K kg−1).
Atmosphere 15 00222 g014
Figure 15. The track of cyclone Shaheen as extracted from Copernicus ERA5 data (red) and the SUAFS model (blue). Dots correspond to 3 h time intervals.
Atmosphere 15 00222 g015
Figure 16. The drainage basin of the wadi Hawasnah and the wadi Bani (red line), where the fieldwork took place during November 2021.
Atmosphere 15 00222 g016
Figure 17. (Top): The flood plain of Wadi Hawasnah one month after the cyclone Shaheen passed as viewed from eastwards. (Bottom): Drainage basin as viewed from downstream/westwards. The wadi bedload deposits destroyed the main road.
Atmosphere 15 00222 g017
Table 1. The SUAFS model configuration.
ParameterConfiguration
DynamicsNon-hydrostatic
Model Domain5° N–42° N, 30° E–67° E
Horizontal Grid Distance9 km × 9 km
Horizontal Grid System Arakawa C
Integration Time Step24 s
Vertical coordinatesTerrain—following hydrostatic pressure vertical coordinate with 37 vertical levels
Time integration schemes3rd order Runge—Kutta Scheme
Spatial differencing scheme6th order center differencing
Microphysics WSM 3—class scheme
Radiation schemesRRTM for long wave/Dudhia for shortwave
Surface layer parameterizationMonin-Obukhov Scheme
Planetary boundary layer physicsYonsei University (YSU) Scheme
Land Surface ModelUnified Noah
Cumulus Scheme Kain—Fritsch
Table 2. Bias and root mean square error (model–observations) derived from 10 meteorological stations for temperature (K), wind speed (m s−1) and sea level pressure (hPa) for the period 2–4 October 2021.
(Model—Observations)Temperature at 2 m
(226 Valid obs.)
Wind Speed at 10 m
(155 Valid obs.)
Sea Level Pressure
(202 Valid obs.)
SUAFSERA5SUAFSERA5SUAFSERA5
Bias0.40.21.91.40.22.5
RMSE2.32.23.43.12.93.4
Disclaimer/Publisher’s Note: The statements, opinions and data contained in all publications are solely those of the individual author(s) and contributor(s) and not of MDPI and/or the editor(s). MDPI and/or the editor(s) disclaim responsibility for any injury to people or property resulting from any ideas, methods, instructions or products referred to in the content.

