Role of an Ultra-Large Coal-Fired Power Plant in PM2.5 Pollution in Taiwan

Department of Safety, Health and Environmental Engineering, National Yunlin University of Science and Technology, Yunlin 64002, Taiwan
*
Author to whom correspondence should be addressed.
Atmosphere 2024, 15(1), 56; https://doi.org/10.3390/atmos15010056
Submission received: 17 November 2023
/
Revised: 28 December 2023
/
Accepted: 30 December 2023
/
Published: 31 December 2023
(This article belongs to the Section Air Quality)
Abstract
:Taichung Power Plant (TPP) is Taiwan’s largest coal-fired power plant and is considered a major source of air pollution. During periods of deteriorating air quality, it is often required to reduce the load to reduce emissions. However, frequent power load shedding not only requires cost but also requires safety considerations. Therefore, it is necessary to explore the role that thermal power plant emissions play in air pollution in Taiwan. This study employed the Community Multiscale Air Quality modeling system with the brute-force method to analyze the PM2.5 concentration contributed by TPP. The results showed that among the various air basins in Taiwan, the Yun-Chi-Nan air basin (YCNAB), located to the south of TPP, was most severely affected by TPP’s emissions, with an annual average affected concentration of 1.0 µg m−3 (3.3%). However, when serious PM2.5 pollution events (daily concentration > 70 µg/m3) occurred due to low wind speeds, the Central Taiwan air basin (CTAB), where TPP is located, became the area most severely affected by TPP’s emissions. The low wind speed was caused by the interaction between the easterly wind field around Taiwan and Taiwan’s north–south mountain ranges. When this happens, TPP’s emissions would have a greater impact on the PM2.5 concentration at nearby stations in the CTAB and YCNAB, up to about 11%. Overall, on pollution days caused by low wind speeds, the largest TPP load reduction (40%) still had a certain effect as an emergency measure to improve the high PM2.5 pollution in central and southern Taiwan.
1. Introduction
The global air pollution issue is severe, with 92% of the world’s population living in areas where the air quality failed to meet standards (10 µg/m3) in 2017 [1]. Asian areas, particularly India and China, are heavily impacted by industrial, transportation, residential, and power plant emissions, resulting in elevated levels of PM2.5 [1]. The influence of power plant emissions on air quality is frequently a source of concern, particularly in the case of coal-fired power plants. Pollutants emitted from coal-fired power generation, such as SO2 or NOX, are also important precursors of secondary PM2.5 formation. PM2.5 imposes serious impacts on the environment and human health. World Health Organization reports indicated that PM2.5 is harmful to the respiratory system [2]. Koplitz et al. [3] predicted that due to coal-fired power generation emissions, the annual excess deaths in Southeast Asia will increase from 19,880 people in 2011 to 69,660 people in 2030. Heo et al. [4] indicated that the emissions of primary PM2.5, SO2, and NOX have led to an increase in social costs.
Taichung Power Plant (TPP) is the largest coal-fired power plant in Taiwan and the fourth largest coal-fired power plant in the world [5]. With an installed capacity of 5780 MW, it accounts for 30% of the total coal-fired power generation in Taiwan [6]. Due to its substantial electricity generation and the associated high emissions of pollutants, TPP is frequently regarded as a significant contributor to air pollution. In addition, compared with traffic sources and fugitive sources, power plants are emissions sources with concentrated emissions and simple sources. Therefore, power plant load reduction has become an emergency response measure when air pollution worsens. This measure is explicitly included in the Regulations of Air Pollution Emergency Response Plan and Warning Notification announced by the Taiwan Environmental Protection Administration (TEPA) [7].
Emissions from coal-fired power plants do cause environmental air pollution and increase social costs. However, too frequent load shedding will also increase power plant maintenance costs and safety concerns. Therefore, balancing the two requires exploring the following questions: Do coal-fired power plants have a significant impact on air quality? When will the impact be significant? Therefore, it is necessary to explore the role that TPP’s emissions play in air pollution in Taiwan.
Sensitivity analysis is currently the most widely used method in research studies for analyzing the impact of pollution sources. There are three main methods, namely the brute-force method (BFM), the decoupled direct method, and the tracking method. The BFM method involves conducting a base case simulation and a source zero-out simulation, and then subtracting the two simulation results to obtain the PM2.5 sensitivity of the emission source [8]. The decoupled direct method calculates the sensitivity coefficients to obtain the sensitivity of the emission source [9]. This method was first used in ozone research and has been applied to PM sensitivity studies in recent years [10]. The tracking method involves adding a tracer to a specific emission source to track and evaluate the impact of emissions from that specific emission source. Kwok et al. [11] improved the tracking method with the Community Multiscale Air Quality (CMAQ) modeling system. Both Burr and Zhang [12] and Baker and Kelly [13] used different sensitivity methods for analysis in their studies on the emission impact of coal-fired power plants. However, since the decoupled direct method is not suitable for situations where emission disturbances are too large, and the tracking method cannot capture the nonlinear response of the PM2.5 concentration to emissions [14], this study used the BFM method to simulate the impact of TPP’s emissions.
There are quite a few studies on the simulation assessment of the impact of coal-fired power plants, including exploring the comparison of the impact of coal-fired industry with other industries [12,15,16,17], exploring the role of coal-fired power plant emission reduction in future emission policies [18,19], simply exploring the impact of coal-fired power plant emissions [20,21,22], exploring the changes in the PM2.5 concentration after the closure of coal-fired power plants [23], and exploring the impact of changes in the location of power plants on PM2.5 concentrations [24]. However, most of these studies analyzed the impact of coal-fired power plants on air quality over a longer period of time (season, year) and less frequently analyzed that of high pollution event days. This study focused on the benefits of the load shedding of coal-fired power plants during emergency responses, so this study conducted a more careful analysis of event days with high pollution.
2. Materials and Methods
2.1. Taichung Power Plant
TPP is located in the Central Taiwan air basin (CTAB) (Figure 1). The plant was commissioned in 1990 and currently has 4 gas turbines and 10 coal-fired steam turbines, with an installed capacity of 5780 MW. TPP has installed a variety of air pollution control equipment to reduce its pollutant emissions, including installing electrostatic precipitators to reduce suspended particulate emissions, using low-sulfur coals and installing flue gas desulfurization systems to reduce SO2 emissions, and installing low-NOX burners and selective catalytic reduction systems to reduce NOX emissions. The emissions from TPP are shown in Table 1. From the table, TPP’s significant SOX emissions accounted for 13% of Taiwan’s total SOX emissions, while its NOX emissions also accounted for 6% of Taiwan’s total NOX emissions. It can be seen that TPP is an important source of pollutant emissions in Taiwan.
2.2. Air Quality Modeling System
The air quality model used in this study was CMAQ v5.0.2 [27,28]. The meteorological input required by the system came from the Weather Research and Forecasting model output. The CMAQ settings are shown in Table S1. The simulation period was January, April, July, and October of 2013, which represented the winter, spring, summer, and autumn seasons of that year, respectively. Therefore, the average of these four months was regarded as the annual average for 2013. Considering that pollutants from other countries would be transported to Taiwan, this study used a four-level nested grid for the simulation, as shown in Figure 1. Domain 1 covered Greater East Asia, with a grid resolution of 81 km × 81 km. Domain 2 covered China, Taiwan, Japan, South Korea, and some Southeast Asian countries, with a grid resolution of 27 km × 27 km. Domain 3 covered Taiwan and the Southeast China region, with a grid solution of 9 km × 9 km. Domain 4 covered the entirety of Taiwan, with a grid resolution of 3 km × 3 km. The initial and boundary conditions for the model simulation adopted the built-in data set of CMAQ. Therefore, this study used the four-level nested grid simulation and 7-day pre-run simulation to reduce the impact of using non-realistic boundary and initial conditions, respectively.
In terms of the anthropogenic emissions data, Taiwan’s emissions data were from the Taiwan Emission Data System version 9 (2013 base year emission data), China’s emissions used the Multi-Resolution Emission Inventory for China 2012 database [25], and the data for the rest of East Asia used the MIX database [26]. In terms of the biogenic emissions data, the Taiwan Biogenic Emission Inventory Emission System version 2 [29] and East Asia Biogenic Emission Inventory [30] were used to estimate the biogenic emissions in Taiwan and other parts of East Asia, respectively, combined with meteorological data.
2.3. Performance Evaluation
In order to confirm the accuracy of the model’s simulation results, a performance evaluation of the base case simulation results was performed using observation data from air quality observation stations in Taiwan. The pollutants to be evaluated were PM2.5, NO2, and SO2. The statistical parameters of the error included the mean fractional bias (MFB), mean fractional error (MFE), index of agreement (IOA), and correlation coefficient (R).
2.4. Simulation of the Effect of TPP’s Emissions
This study used the BFM method to analyze the impact of TPP’s emissions on the PM2.5 levels in Taiwan. Therefore, simulations of two cases were performed: a base case, using all the emissions mentioned in Section 2.2, and a zero-out emission case, using all the emissions but turning off TPP’s emissions. The difference between the simulation results of the two cases was the impact of TPP’s emissions.
In addition to analyzing the impact of TPP’s emissions on the concentrations in 2013 and in each season, this study also assessed the impact of TPP’s emissions on various PM2.5 pollution levels. This study referred to the concentration range corresponding to the Air Quality Index (AQI) published by the TEPA and divided the daily average concentration of PM2.5 in the base case into four levels: low pollution level (0–35 µg m−3), medium pollution level (36–54 µg m−3), high pollution level (55–70 µg m−3), and serious pollution level (above 70 µg m−3).
3. Results and Discussion
3.1. Performance Evaluation
The spatial distribution of the annual average PM2.5 concentration of the base case is shown in Figure 2. In the figure, Domain 1–Domain 4 illustrate the overall simulation results from Greater East Asia to Taiwan. The spatial distribution of the PM2.5 concentration in Taiwan (Domain 4) shows a trend of being higher in the west and lower in the east. In western Taiwan, the area south of the CTAB had a higher average annual PM2.5 concentration, ranging from 21 to 45 µg m−3, with the Kao-Ping air basin (KPAB) having the highest PM2.5 concentration.
Overall, the PM2.5 concentration in most parts of western Taiwan was higher than 15 µg m−3, exceeding the annual average standard (15 µg m−3) specified by the TEPA. The PM2.5 concentration in eastern Taiwan was below 12 µg m−3, and it was better than that in western Taiwan. A large part of the reason for the higher PM2.5 concentration in western Taiwan was that the western region was highly developed and had concentrated population and industry, resulting in significant emissions of pollutants in the western region (Figure S1).
The results of the model performance evaluation are shown in Table 2. Comparisons between the observed and simulated values were performed using the daily average concentrations. In addition, due to the high humidity environment in Taiwan, the PM2.5 simulation values in the performance evaluation part of this study were handled in accordance with the PMX calculation developed by Jiang et al. [31]. The PM2.5 concentration calculation for the TPP emission impact assessment conducted in Section 3.2 and later was based on the CMAQ preset algorithm (sum of the Aitken and Accumulation mode particles).
From the table, the MFB and MFE evaluation results of the PM2.5 met the PM performance evaluation goal (MFB ≤ ±30%; MFE ≤ 50%) or criteria (MFB ≤ ±60%; MFE ≤ 75%) proposed by Boylan and Russell [32]. The IOAs of the PM2.5 were falling between 0.7–0.8, which are larger than 0.5, indicating that the agreement between the simulated and observed values was considered acceptable [33]. The Correlations of the PM2.5 were falling between 0.6–0.8. The NO2 and SO2 were also examined using the performance evaluation criteria specified by Boylan and Russell [32]. The results show that the goal and criteria were both met. Overall, the simulated performance of the PM2.5 should be acceptable.
3.2. Impact of TPP’s Emissions on the PM2.5 Concentration
The impact of TPP’s emissions on the annual average PM2.5 concentrations is shown in Figure 3. The main impact area was located in central and southern Taiwan. The impact in coastal areas was 1.0–1.3 µg m−3, which was greater than in inland areas. This was due to the location of TPP along the coast of the CTAB and the northeast monsoon that lasted for more than six months. In addition, since central and southern Taiwan had higher NH3 emissions (Figure S1), it was easier to produce secondary PM2.5 when encountering the NOX and SO2 emitted by TPP that were transported southward by the northeast monsoon. Therefore, it can be seen from Table 3 that TPP’s emissions had the most significant impact on the observation stations of the Yun-Chi-Nan air basin (YCNAB) (1.0 µg m−3), followed by those of the CTAB and KPAB (0.8 µg m−3), and had a significantly smaller impact on the other air basins (<0.3 µg m−3). The average impact of TPP’s emissions on the concentration of PM2.5 at observation stations across Taiwan was 0.5 µg m−3 (accounting for 1.9% of the base case concentration).
Through the results of the seasonal representative months (Figure 3), it is easier to see the transport effect of the northeast monsoon on pollutants emitted by TPP. In January, April, and October, the main areas affected by TPP’s emissions were basically central and southern Taiwan, but there were still differences among them. The wind speed was stronger in January, and the impact of TPP’s emissions could be transported farther south. In April and October, the land wind speed was weak and the wind direction was in the alternating period between the northeast monsoon and the southwest monsoon, so the impact of TPP’s emissions was wider and more toward the inland areas. The impact of TPP’s emissions in summer was smaller than that in other seasons. This was because the higher boundary layer in summer is conducive to the diffusion of pollutants and the high temperature in summer is unfavorable to the formation of NH4NO3 [34]. From Table 4, it can be seen that the impacts of TPP’s emissions on the concentration of PM2.5 at observation stations across Taiwan in January, April, and October were very similar (0.6 µg m−3) and were significantly higher than in July (0.3 µg m−3), nearly double.
3.3. Impact of TPP’s Emissions on Various PM2.5 Pollution Levels
Table 3 and Table 4 show the impact of TPP’s emissions on the PM2.5 concentration for each air basin and for each month, respectively, under different pollution levels in 2013. From Table 3, as the PM2.5 concentration in the base case increased, the impact of TPP’s emissions would also increase. This was the case in any air basin. Further analysis of the impact of TPP’s emissions for each air basin at each pollution level found that at medium and high pollution levels, the air basin most significantly affected by TPP’s emissions was the YCNAB, but at the serious pollution level, it turned into the CTAB. This result shows that the meteorological patterns causing serious pollution events must be significantly different from those at other pollution levels.
From Table 4, the impact also increased along with the pollution level for all the representative months except July. Further analysis of the impact of TPP’s emissions for each month at each pollution level found that the highest impact was in October at medium and above pollution levels, especially at the serious pollution level. Combining this result with the result in the previous paragraph, this means that the high impact of TPP’s emissions should mostly occur in higher pollution events in October, and the main impact areas were in central and southern Taiwan.
3.4. Analysis of Three PM2.5 Pollution Events
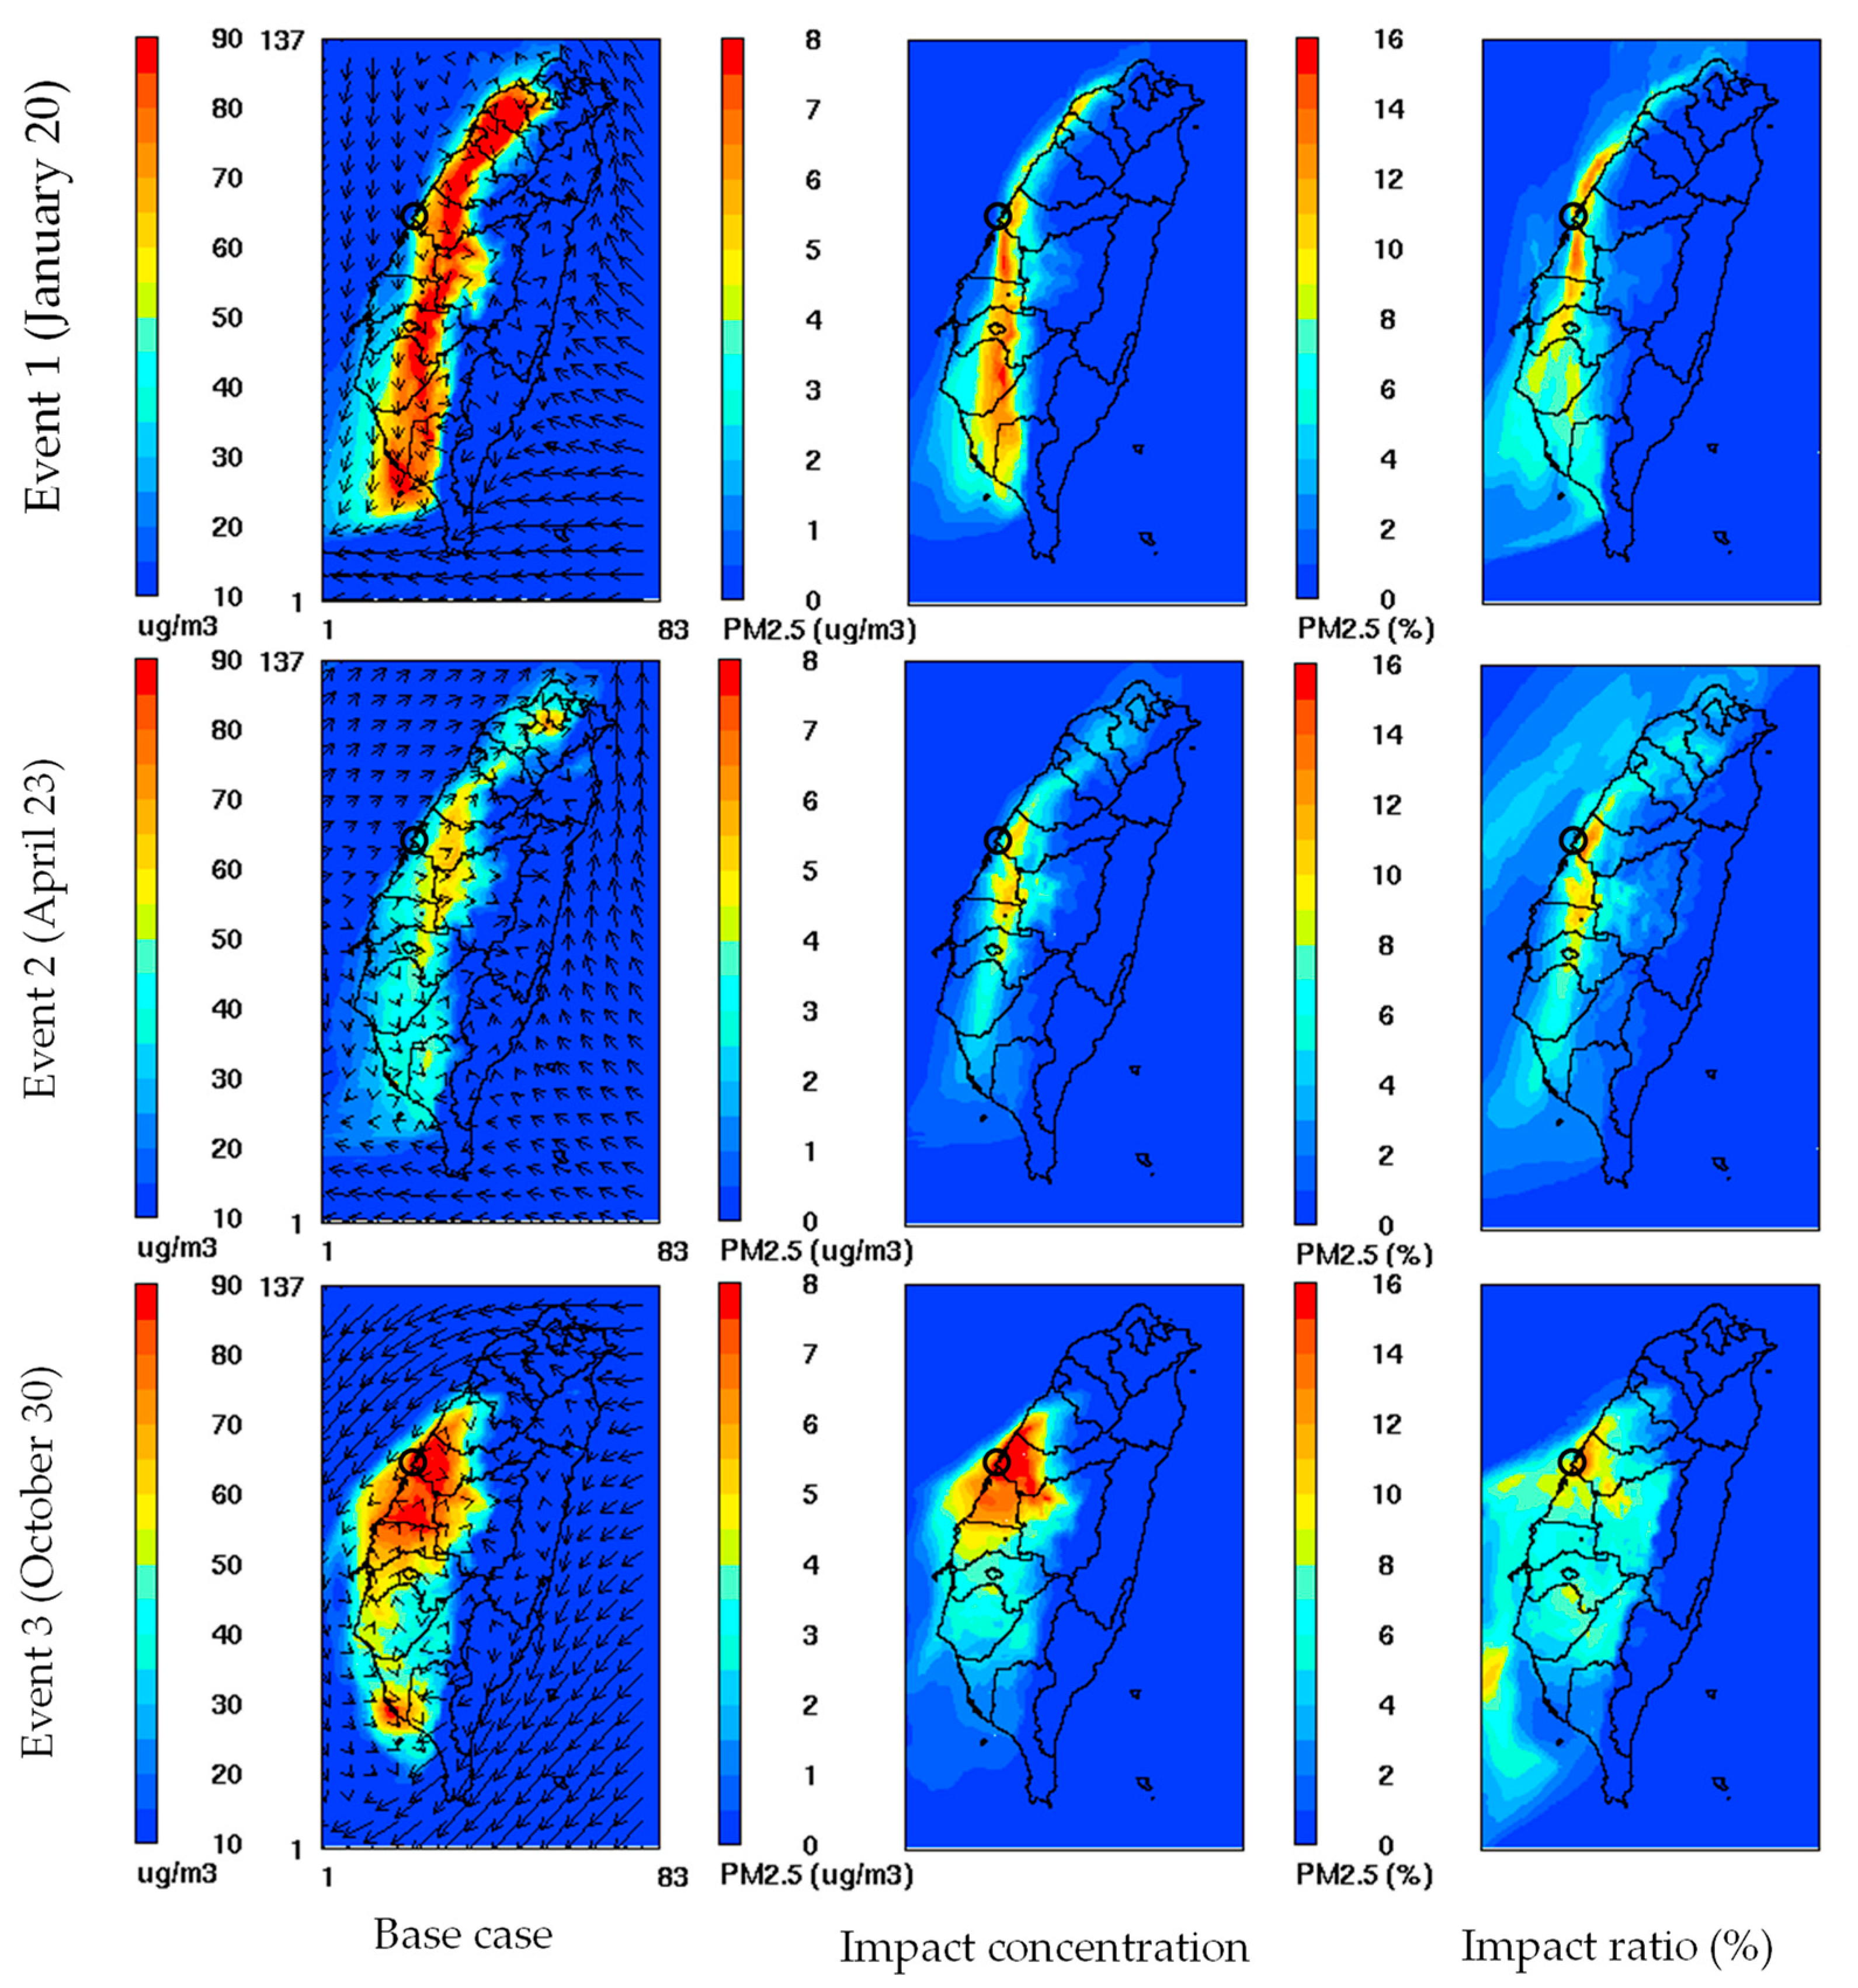
According to the analysis results in the previous section, this section selected an event in January, April, and October, each with relatively high pollution and a greater impact of TPP’s emissions on central and southern Taiwan. Event 1 was 20 January, Event 2 was 23 April, and Event 3 was 30 October. Figure 4 shows the spatial distribution of the impact of TPP’s emissions for each event day. In addition, this study selected several observation stations in western Taiwan to understand the impact of TPP’s emissions. The selected observation stations in order from north to south were Banqiao, Xitun, Changhua, Nantou, Douliu, Shanhua, and Qianzhen stations (Figure 1).
For event 1, the spatial distribution of the concentration in the base case showed that the PM2.5 concentration in western Taiwan showed serious pollution from the north to the south, except for some coastal areas where the pollution was mild (Figure 4). This distribution was very different from that of the monthly average concentration in January (Figure 3). The main differences included high concentrations in northern Taiwan that were similar to those in central and southern Taiwan, and high pollution in central and southern Taiwan that was distributed in more inland areas. The main reason for these differences was that the wind field around Taiwan on the event day was a southeast wind with a relatively strong wind speed, and coupled with the high mountains (Central Mountains) separating the eastern and western parts of Taiwan (Figure 1), a circulation was formed to the west of northern Taiwan (Figure S2). At this time, southerly winds with relatively weak wind speeds could easily cause high pollution on the land in northern Taiwan, while northerly or north–northwesterly winds blew on the land in central and southern Taiwan, causing pollutants to accumulate farther inland. The pollution distribution caused by such wind field circulation can be seen more clearly from the spatial distribution of TPP’s emission impacts. Not only was there a higher impact in the inland areas of southern Taiwan but there was also a slightly higher impact in the coastal areas of northern Taiwan. Therefore, it can be seen from Table 5 that the highest impact of TPP’s emissions was at Changhua and Douliu stations (south of TPP), the second highest impact was at Xitun station (east of TPP), and a slight impact was at Banqiao station (in northern Taiwan).
For event 2, the spatial distribution of the concentration in the base case showed that the PM2.5 concentration in western Taiwan showed medium or high pollution from the north to the south (Figure 4). This distribution was somewhat similar to the monthly average concentration distribution in April (Figure 3), but its high concentrations were distributed in farther inland areas. The main reason for this distribution was that the wind fields in the west and east of Taiwan were dominated by low-pressure and high-pressure systems, respectively, on the event day. Therefore, although the wind blew from the east side, it did not cause circulation on the west side after passing through the Central Mountains. Instead, it merged with the southwest wind on the west side and then continued to blow northeastward (Figure S2). Since the wind in western Taiwan blew from the sea toward the land and the wind speed was weak, the TPP emissions affected surrounding areas and did not significantly affect distant areas. Therefore, it can be seen from Table 5 that the TPP emissions had the greatest impact on the neighboring Douliu, Changhua, and Xitun stations.
For event 3, the spatial distribution of the concentration in the base case showed that the PM2.5 concentration in western Taiwan showed serious pollution from the central to the south (Figure 4). This distribution was very similar to the monthly average concentration distribution in October (Figure 3), but its high concentrations were more distributed in central Taiwan. The main reason for this distribution was that the wind field to the east of Taiwan was an east–northeast wind on the event day. As the air flow bypassed the Central Mountains, a circulation was formed to the west of central and southern Taiwan (Figure S2). Since the wind speed in the circulation was very weak, most pollutants were concentrated around the emission source and were not easily transported to other areas. As can be seen from Figure 4, the high impact of TPP’s emissions was significantly concentrated in the CTAB. From Table 5, the highest impact of TPP’s emissions was at Xitun station, and the second highest impact was at Changhua and Nantou stations.
Based on the above three case analysis results, the occurrence of high pollution events was usually related to low wind speeds. The low wind speed was usually caused by the interaction between the easterly wind field around Taiwan and Taiwan’s north–south mountain ranges. When this happens, TPP’s emissions would have a greater impact on the daily average PM2.5 concentration at nearby observation stations in the CTAB and YCNAB, up to about 11%, while the impact on other distant observation stations would gradually decrease with increasing distance.
3.5. Potential of TPP’s Load Shedding as an Emergency Response Measure
According to the provisions of the Regulations of Air Pollution Emergency Response Plan and Warning Notification, when the air quality deteriorates (AQI > 150), the daily emissions from coal-fired power plants should be reduced by 10–40% depending on the degree of deterioration. This means that TPP’s load reduction can only be limited to a maximum of 40%. Combined with the results in the previous section, the maximum load reduction of TPP should improve the daily PM2.5 concentration of the observation stations in central Taiwan by no more than 5% (~0.4 × 11%), those in southern Taiwan by 3% (~0.4 × 7%), and those in northern Taiwan by 1% (~0.4 × 3%). This result shows that on pollution days caused by low wind speeds, the largest TPP load reduction still had a certain effect on improving the PM2.5 pollution in central and southern Taiwan, but it caused little improvement in northern Taiwan.
4. Conclusions
This study employed the CMAQ to analyze the PM2.5 concentration contributed by TPP, the largest coal-fired power plant in Taiwan. The results showed that the impact of TPP’s emissions on the annual average concentration of PM2.5 at observation stations across Taiwan in 2013 was 0.5 µg m−3 (accounting for 1.9% of the base case concentration). Among the various air basins in Taiwan, the YCNAB, located to south of TPP, was most severely affected by TPP’s emissions, with an affected concentration of 1.0 µg m−3 (3.3%). This was due to the prevailing northeasterly winds in Taiwan in autumn, winter, and spring. However, when serious PM2.5 pollution events (daily concentration > 70 µg/m3) occurred, the CTAB, where TPP is located, became the air basin most severely affected by TPP’s emissions. This was mainly due to low wind speeds that caused pollutants emitted by TPP to be concentrated in the CTAB. The low wind speed was usually caused by the interaction between the easterly wind field around Taiwan and Taiwan’s north–south mountain ranges. When this happens, TPP’s emissions would have a greater impact on the daily average PM2.5 concentration at nearby observation stations in the CTAB and YCNAB, up to about 11%, while the impact on other distant observation stations would gradually decrease with increasing distance. Overall, on pollution days caused by low wind speeds, the largest TPP load reduction (40%) still had a certain effect as an emergency response measure to improve the high PM2.5 pollution in central and southern Taiwan. However, it must be considered whether such benefits are commensurate with the costs and safety concerns of load shedding. In addition, more potential pollution sources need to be considered when conducting emergency emission reduction assessments.
Supplementary Materials
The following supporting information can be downloaded at https://www.mdpi.com/article/10.3390/atmos15010056/s1, Figure S1: Spatial distribution of various pollutant emissions in Taiwan for the base case in the year of 2013 (taking January as an example); Figure S2: Daily wind fields in Domain 3 and surface weather maps during the three event days. The surface weather maps published by the Japan Meteorological Agency. Table S1: Selection of CMAQ configuration options for this study.
Author Contributions
Conceptualization, C.-Y.T. and K.-H.C.; methodology, C.-Y.T. and K.-H.C.; software, C.-Y.T. and T.-F.C.; writing—original draft, C.-Y.T. and T.-F.C.; writing—reviewing and editing, T.-F.C. and K.-H.C. All authors have read and agreed to the published version of the manuscript.
Funding
This research was supported by the Taiwan Ministry of Science and Technology and Taiwan EPA.
Institutional Review Board Statement
Not applicable.
Informed Consent Statement
Not applicable.
Data Availability Statement
Data are contained within the article.
Acknowledgments
This research was carried out with support from the Taiwan Ministry of Science and Technology and the Taiwan EPA (MOST-111-2221-E-224-009, MOST-110-2221-E-224-015-MY2, EPA-112-F-095, EPA-111-A-290).
Conflicts of Interest
The authors declare no conflicts of interest.
References
- Health Effects Institute (HEI). State of Global Air 2019. Available online: https://www.stateofglobalair.org/sites/default/files/soga_2019_report.pdf (accessed on 26 December 2023).
- World Health Organization Regional Office for Europe. Health Relevance of Particulate Matter from Various Sources: Report on a WHO Workshop, Bonn, Germany 26–27 March 2007; World Health Organization Regional Office for Europe: Copenhagen, Denmark, 2007. [Google Scholar]
- Koplitz, S.N.; Jacob, D.J.; Sulprizio, M.P.; Myllyvirta, L.; Reid, C. Burden of Disease from Rising Coal-Fired Power Plant Emissions in Southeast Asia. Environ. Sci. Technol. 2017, 51, 1467–1476. [Google Scholar] [CrossRef] [PubMed]
- Heo, J.; Adams, P.J.; Gao, H.O. Public Health Costs of Primary PM2.5 and Inorganic PM2.5 Precursor Emissions in the United States. Environ. Sci. Technol. 2016, 50, 6061–6070. [Google Scholar] [CrossRef] [PubMed]
- Wikipedia. Available online: https://en.wikipedia.org/wiki/List_of_coal_power_stations (accessed on 10 July 2023).
- Taiwan Power Company. Taiwan Power Company Sustainability Report 2009; Taiwan Power Company: Taipei, Taiwan, 2009. [Google Scholar]
- TEPA. Regulations of Air Pollution Emergency Response Plan and Warning Notification. In Executive Yuan Gazette; Taiwan Environmental Protection Administration: Taipei, Taiwan, 2009; Volume 28. (In Chinese) [Google Scholar]
- Hwang, D.; Byun, D.W.; Odman, M.T. An automatic differentiation technique for sensitivity analysis of numerical advection schemes in air quality models. Atmos. Environ. 1997, 31, 879–888. [Google Scholar] [CrossRef]
- Yang, Y.J.; Wilkinson, J.; Russell, A. Fast, direct sensitivity analysis of multidimensional photochemical models. Environ. Sci. Technol. 1997, 31, 2859–2868. [Google Scholar] [CrossRef]
- Napelenok, S.L.; Cohan, D.S.; Hu, Y.; Russell, A.G. Decoupled direct 3D sensitivity analysis for particulate matter (DDM-3D/PM). Atmos. Environ. 2006, 40, 6112–6121. [Google Scholar] [CrossRef]
- Kwok, R.H.F.; Napelenok, S.L.; Baker, K.R. Implementation and evaluation of PM2.5 source contribution analysis in a photochemical model. Atmos. Environ. 2013, 80, 398–407. [Google Scholar] [CrossRef]
- Burr, M.J.; Zhang, Y. Source apportionment of fine particulate matter over the Eastern U.S. Part I: Source sensitivity simulations using CMAQ with the Brute Force method. Atmos. Poll. Res. 2011, 2, 300–317. [Google Scholar] [CrossRef]
- Baker, K.R.; Kelly, J.T. Single source impacts estimated with photochemical model source sensitivity and apportionment approaches. Atmos. Environ. 2014, 96, 266–274. [Google Scholar] [CrossRef]
- Koo, B.; Wilson, G.M.; Morris, P.E.; Dunker, A.M.; Yarwood, G. Comparison of source apportionment and sensitivity analysis in a particulate matter air quality model. Environ. Sci. Technol. 2009, 43, 6669–6675. [Google Scholar] [CrossRef]
- Zhang, Y.; Wang, W.; Wu, S.Y.; Wang, K.; Minoura, H.; Wang, Z. Impacts of updated emission inventories on source apportionment of fine particle and ozone over the southeastern U.S. Atmos. Environ. 2014, 88, 133–154. [Google Scholar] [CrossRef]
- Ma, Q.; Chi, S.; Wang, S.; Zhao, B.; Martin, R.V.; Brauer, M.; Cohen, A.; Jiang, J.; Zhou, W.; Hao, J.; et al. Impacts of coal burning on ambient PM2.5 pollution in China. Atmos. Chem. Phys. 2017, 17, 4477–4491. [Google Scholar] [CrossRef]
- Shi, Z.; Li, J.; Huang, L.; Wang, P.; Wu, L.; Ying, Q.; Zhang, H.; Lu, L.; Liu, X.; Liao, H.; et al. Source apportionment of fine particulate matter in China in 2013 using a source-oriented chemical transport model. Sci. Total Environ. 2017, 601–602, 1476–1487. [Google Scholar] [CrossRef] [PubMed]
- Hu, J.; Huang, L.; Chen, M.; He, G.; Zhang, H. Impacts of power generation on air quality in China—Part II: Future scenarios. Resour. Conserv. Recycl. 2017, 121, 115–127. [Google Scholar] [CrossRef]
- Wang, Z.; Pan, L.; Li, Y.; Zhang, D.; Ma, J.; Sun, F.; Xu, W.; Wang, X. Assessment of air quality benefits from the national pollution control policy of thermal power plants in China: A numerical simulation. Atmos. Environ. 2015, 106, 288–304. [Google Scholar] [CrossRef]
- Li, X.; Zhang, Q.; Zhang, Y.; Zheng, B.; Wang, K.; Chen, Y.; He, K. Source contributions of urban PM2.5 in the Beijing–Tianjin–Hebei region: Changes between 2006 and 2013 and relative impacts of emissions and meteorology. Atmos. Environ. 2015, 123, 229–239. [Google Scholar] [CrossRef]
- Huang, L.; Hu, J.; Chen, M.; Zhang, H. Impacts of power generation on air quality in China—Part I: An overview. Resour. Conserv. Recycl. 2017, 121, 103–114. [Google Scholar] [CrossRef]
- Dodla, V.B.R.; Gubbala, C.S.; Desamsetti, S. Atmospheric Dispersion of PM2.5 Precursor Gases from Two Major Thermal Power Plants in Andhra Pradesh, India. Aerosol Air Qual. Res. 2017, 17, 381–393. [Google Scholar] [CrossRef]
- Russell, M.C.; Belle, J.H.; Liu, Y. The impact of three recent coal-fired power plant closings on Pittsburgh air quality: A natural experiment. J. Air Waste Manag. Assoc. 2017, 67, 3–16. [Google Scholar] [CrossRef]
- Mou, D.; Herington, M.; Omoju, O.E. The impacts of coal plants relocation on the concentration of fine particulate matter in China. Ene. Environ. 2016, 27, 741–754. [Google Scholar] [CrossRef]
- He, K.B. Multi-resolution Emission Inventory for China (MEIC): Model framework and 1990–2010 anthropogenic emissions. In Proceedings of the International Global Atmospheric Chemistry Conference, Beijing, China, 17–21 September 2012. [Google Scholar]
- Li, M.; Zhang, Q.; Kurokawa, J.I.; Woo, J.H.; He, K.; Lu, Z.; Ohara, T.; Song, Y.; Streets, D.G.; Carmichael, G.R.; et al. MIX: A mosaic Asian anthropogenic emission inventory under the international collaboration framework of the MICS-Asia and HTAP. Atmos. Chem. Phys. 2017, 17, 935–963. [Google Scholar] [CrossRef]
- Byun, D.W.; Ching, J.K.S. Science Algorithms of the EPA Models-3 Community Multiscale Air Quality (CMAQ) Modeling System; U.S. Environmental Protection Agency: Washington, DC, USA, 1999. [Google Scholar]
- Byun, D.W.; Schere, K.L. Review of the governing equations, computational algorithms, and other components of the models-3 Community Multiscale Air Quality (CMAQ) modeling system. Appl. Mech. Rev. 2006, 59, 51–77. [Google Scholar] [CrossRef]
- Chang, K.H.; Yu, J.Y.; Chen, T.F.; Lin, Y.P. Estimating Taiwan biogenic VOC emission: Leaf energy balance consideration. Atmos. Environ. 2009, 43, 5092–5100. [Google Scholar] [CrossRef]
- Chen, T.F.; Chen, C.H.; Yu, J.Y.; Lin, Y.B.; Chang, K.H. Estimation of biogenic VOC emissions in East Asia with new emission factors and leaf energy balance considerations. J. Innov. Technol. 2020, 2, 61–72. [Google Scholar]
- Jiang, W.; Smyth, S.; Giroux, E.; Roth, H.; Yin, D. Differences between CMAQ fine mode particle and PM2.5 concentrations and their impact on model performance evaluation in the lower Fraser valley. Atmos. Environ. 2006, 40, 4973–4985. [Google Scholar] [CrossRef]
- Boylan, J.W.; Russell, A.G. PM and light extinction model performance metrics, goals, and criteria for three-dimensional air quality models. Atmos. Environ. 2006, 40, 4946–4959. [Google Scholar] [CrossRef]
- Willmott, C.J. On the validation of models. Phys. Geogr. 1981, 2, 184–194. [Google Scholar] [CrossRef]
- Stelson, A.W.; Seinfeld, J.H. Relative humidity and temperature dependence of the ammonium nitrate dissociation constant. Atmos. Environ. 1982, 16, 983–992. [Google Scholar] [CrossRef]
Figure 1.
Model simulation domains (left picture), the partition of Taiwan’s seven air basins (right picture), the location of Taichung Power Plant (black triangle in right picture), and the selected observation stations (dots in right picture): (A) Banqiao, (B) Xitun, (C) Changhua, (D) Nantou, (E) Douliu, (F) Shanhua, and (G) Qianzhen. NTAB: North Taiwan air basin, CMAB: Chu-Mia air basin, CTAB: Central Taiwan air basin, YCNAB: Yun-Chi-Nan air basin, KPAB: Kao-Ping air basin, YLAB: Yi-Lan air basin, HDAB: Hua-Dong air basin.
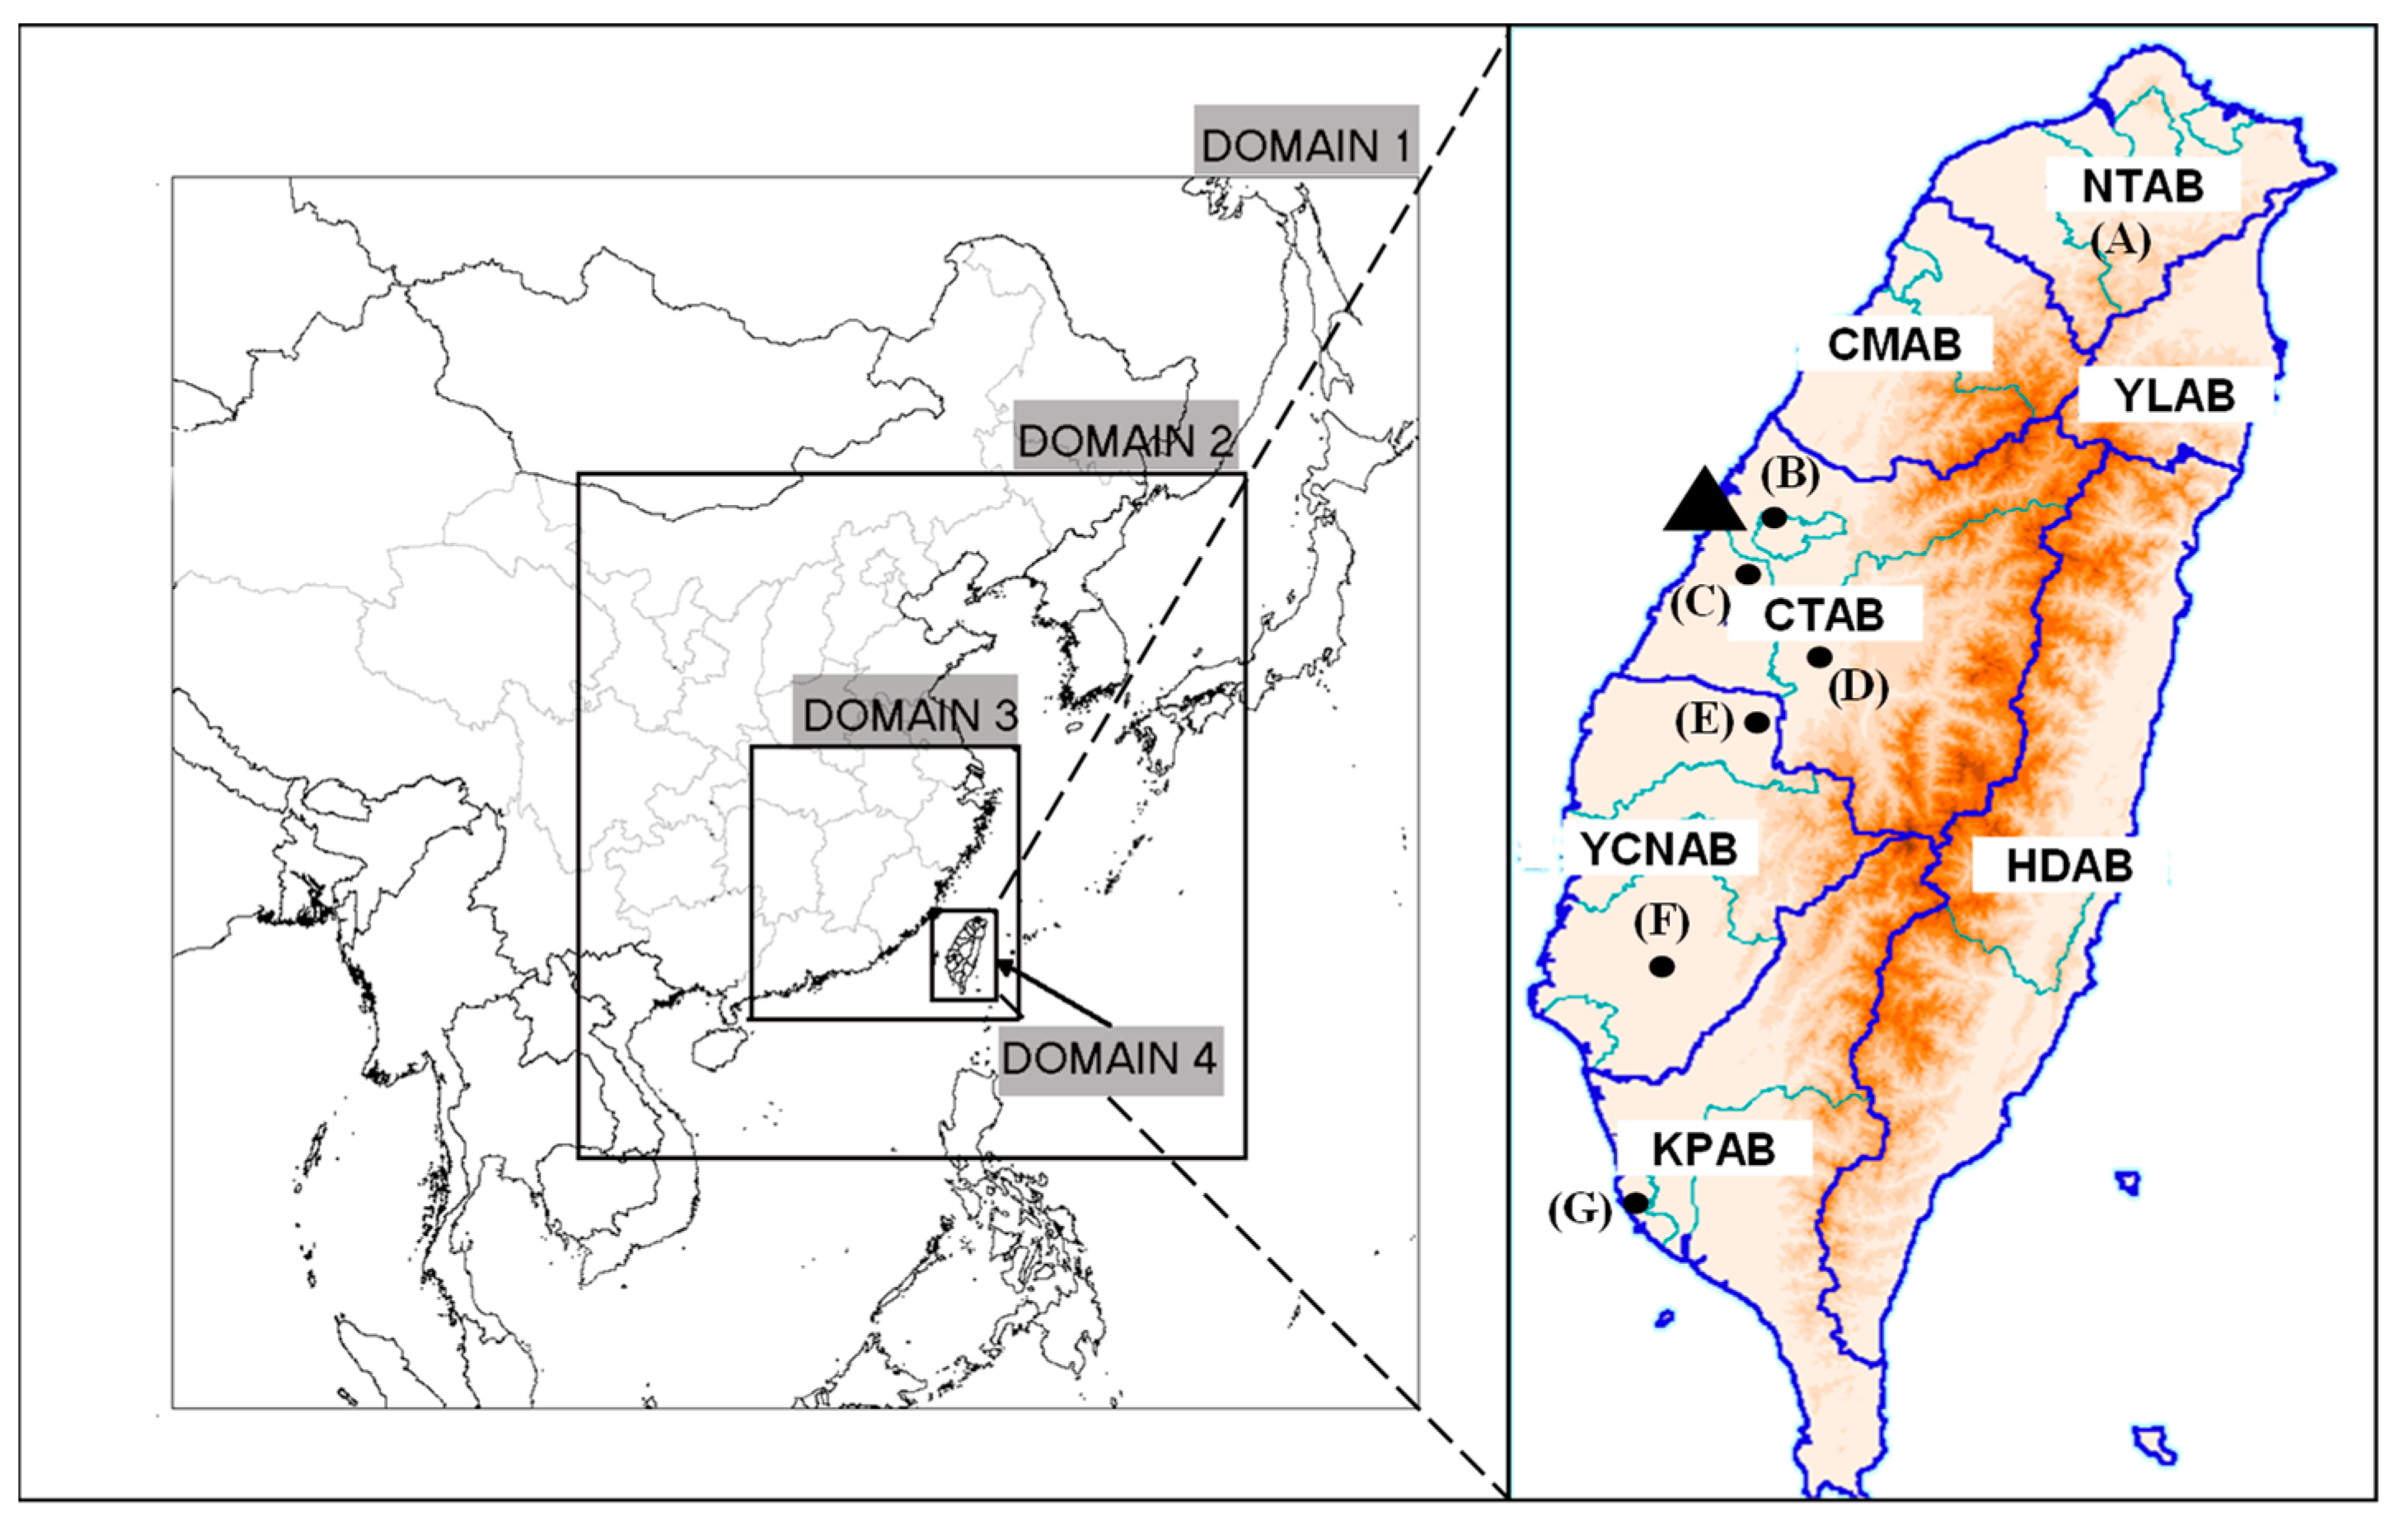
Figure 2.
Spatial distribution of the annual average PM2.5 concentration in 2013 for the four nesting domains.
Figure 2.
Spatial distribution of the annual average PM2.5 concentration in 2013 for the four nesting domains.
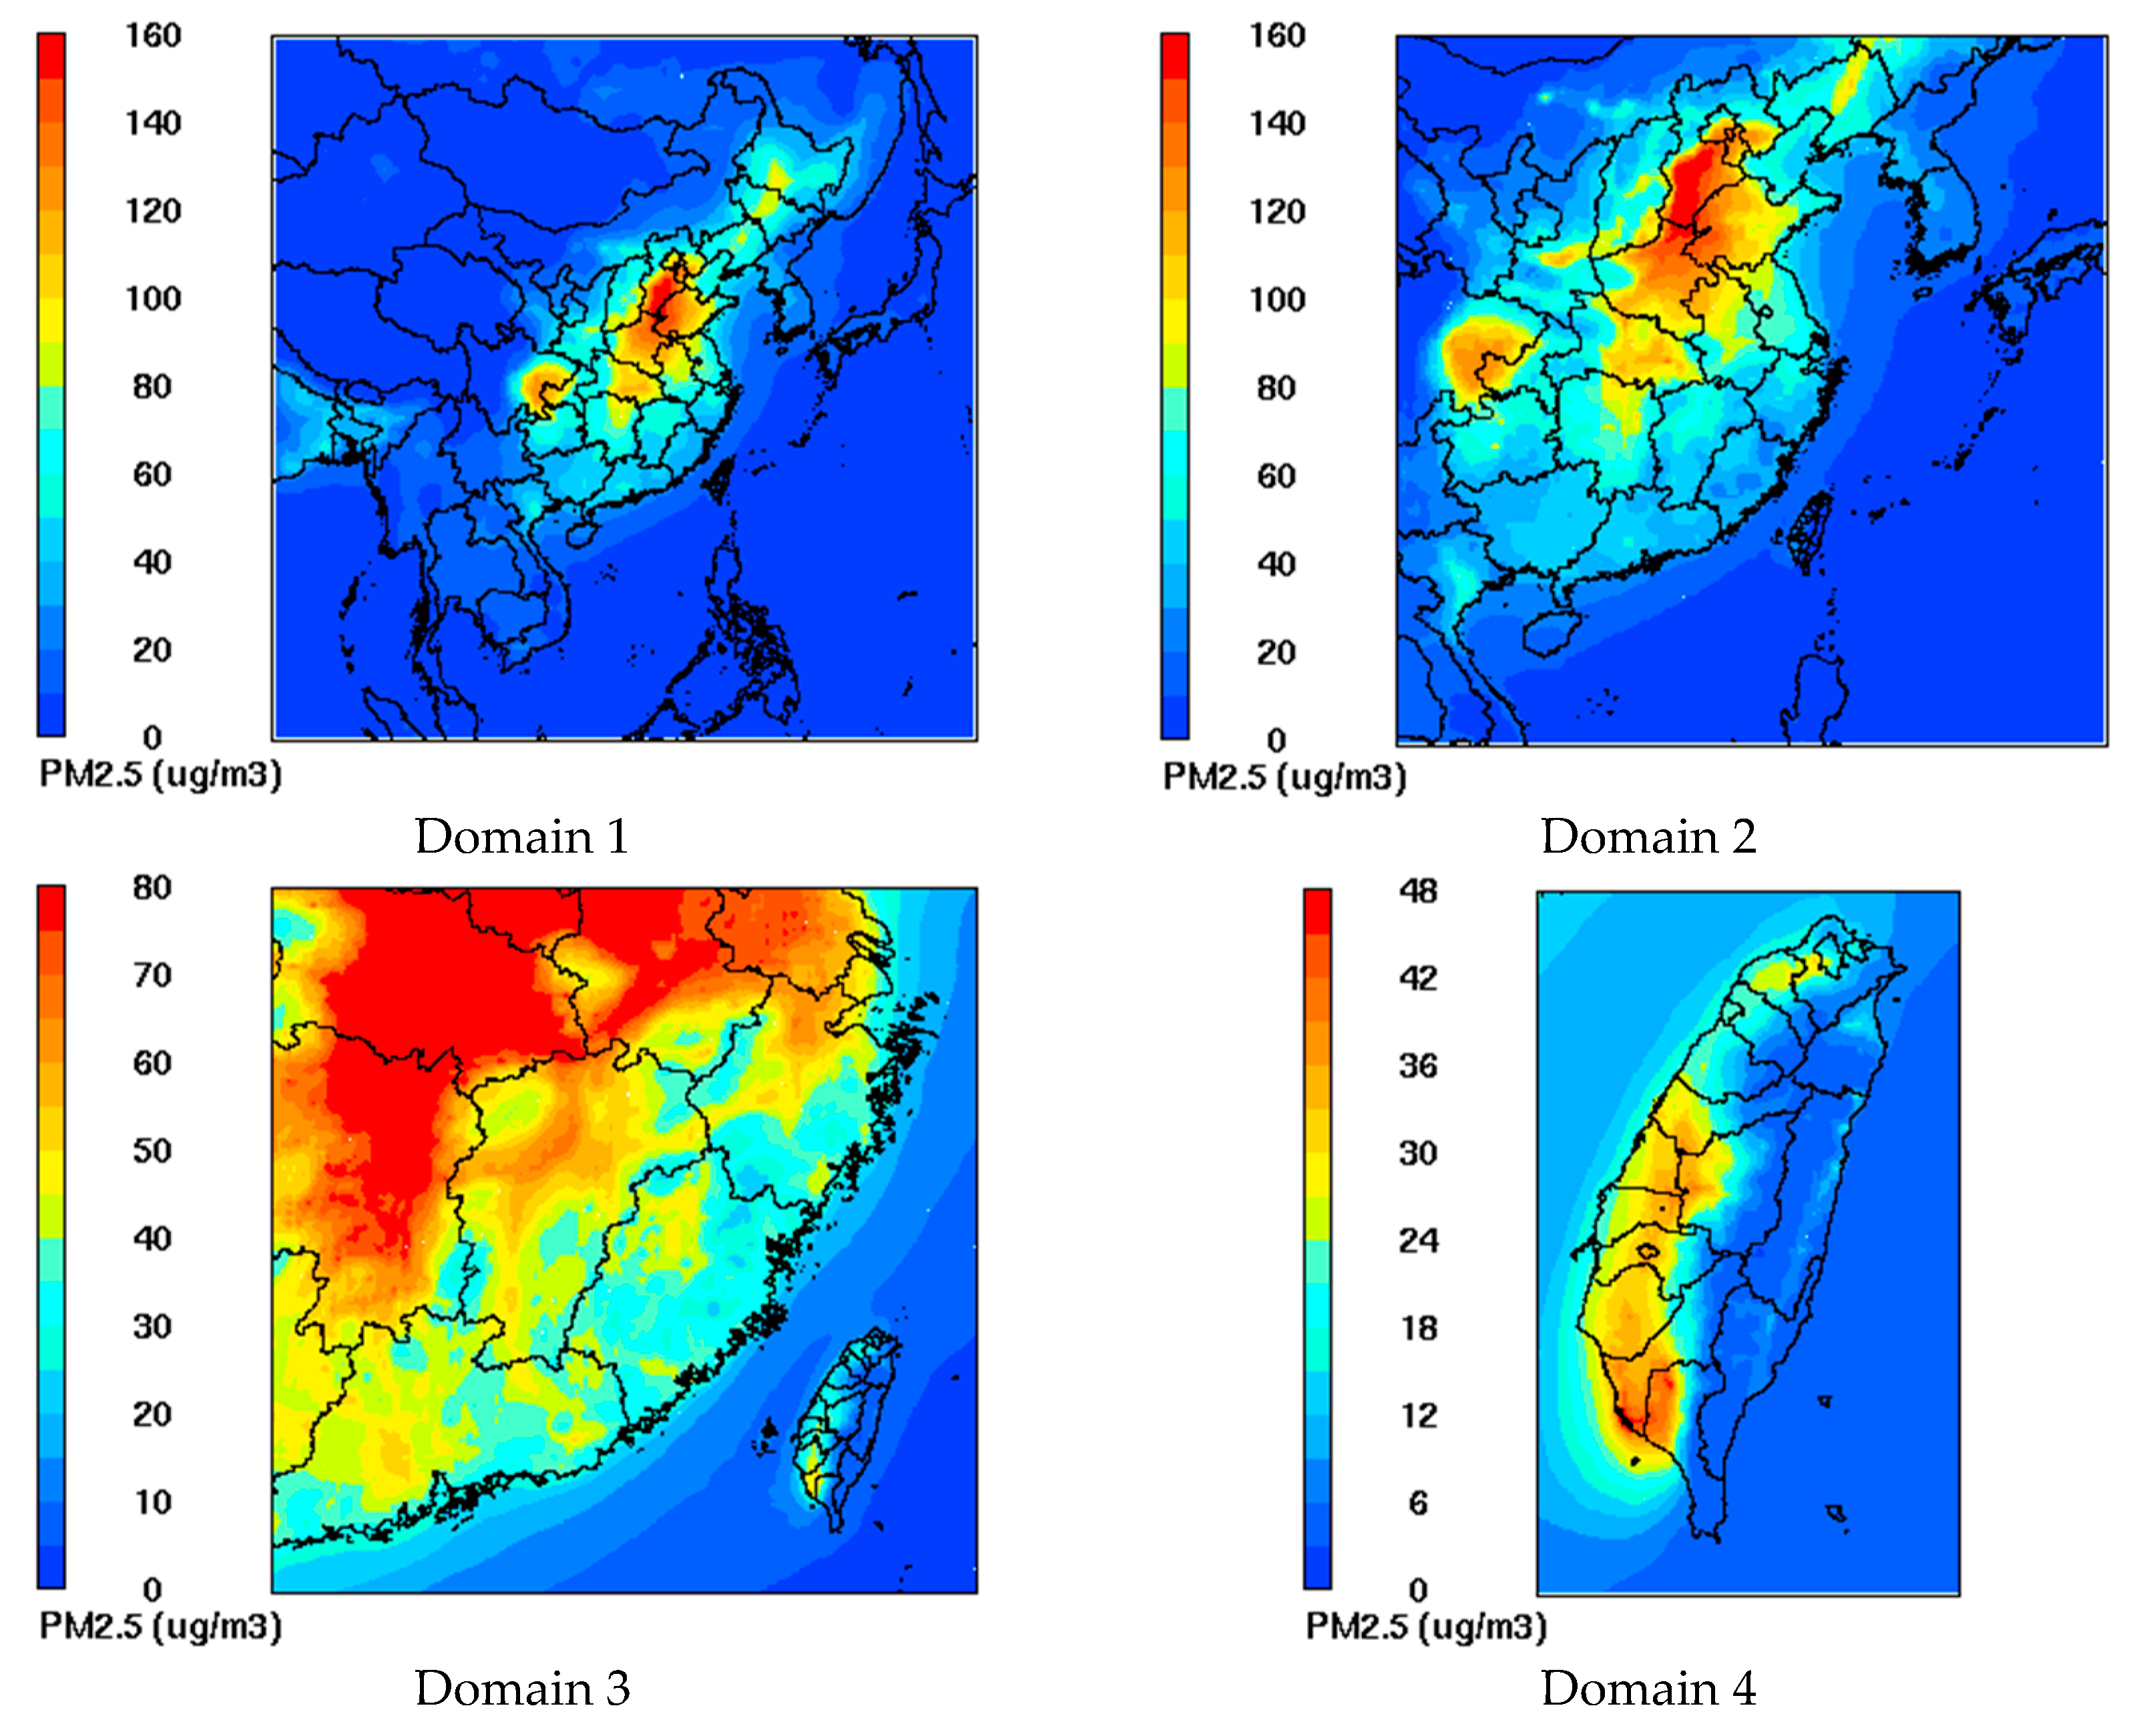
Figure 3.
Impact of TPP’s emissions on the monthly/annual average PM2.5 concentration and monthly wind fields. Black circle represents the location of TPP.
Figure 3.
Impact of TPP’s emissions on the monthly/annual average PM2.5 concentration and monthly wind fields. Black circle represents the location of TPP.
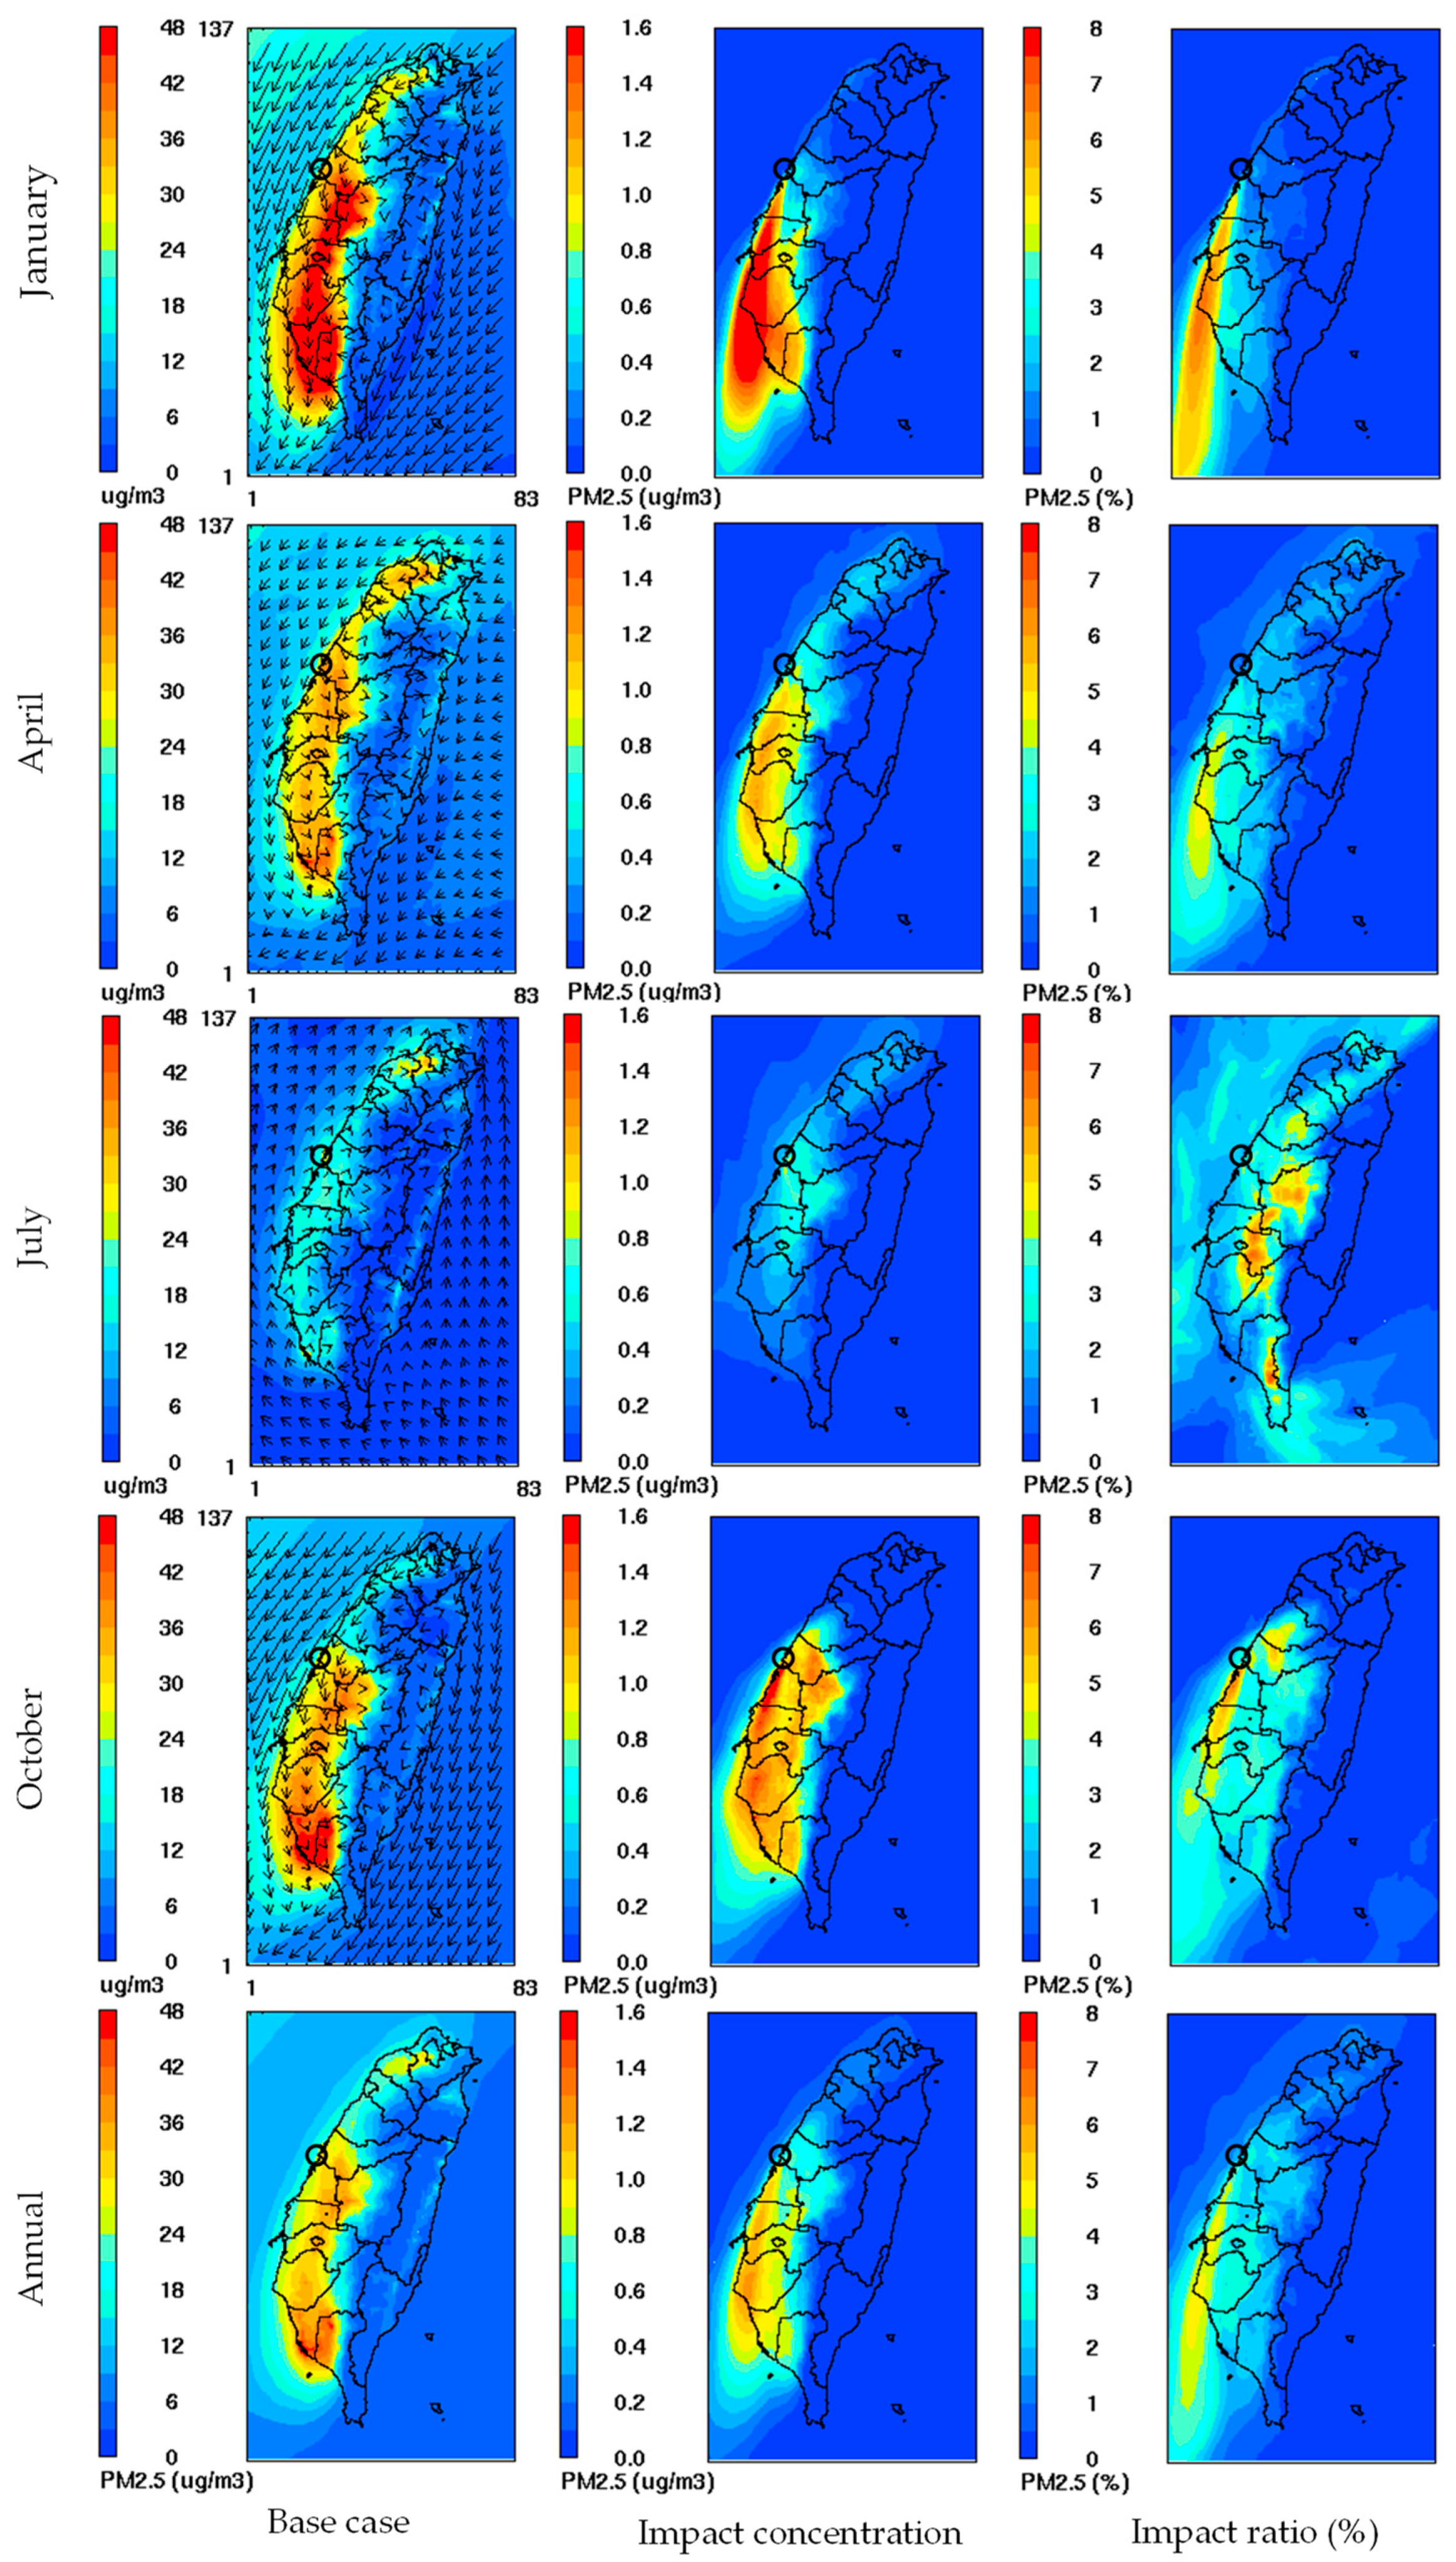
Figure 4.
Impact of TPP’s emissions on the daily average PM2.5 concentration and daily wind fields during the three event days. Black circle represents the location of TPP.
Figure 4.
Impact of TPP’s emissions on the daily average PM2.5 concentration and daily wind fields during the three event days. Black circle represents the location of TPP.

Table 1.
Emissions of various countries used in the study (units: 10 kt/yr).
| Source | PM2.5 | SOX | NOX | NMHC | NH3 |
|---|---|---|---|---|---|
| China 1 | 1212 | 2839 | 2849 | 2292 | 955 |
| Japan 2 | 8.1 | 70.8 | 191.4 | 117.8 | 47.9 |
| Korea 2 | 8.7 | 41.8 | 106.2 | 85.1 | 19.0 |
| Taiwan 3 | 7.72 | 11.69 | 39.94 | 45.72 | 1.89 |
| Taichung Power Plant (TPP) 3 | 0.12 | 1.49 | 2.32 | 0.0003 | - |
| Total power plants 3 | 0.30 | 4.19 | 6.91 | 0.0049 | - |
| TPP vs. Taiwan (%) | 1.6 | 12.7 | 5.8 | 0.0 | - |
| TPP vs. Total power plants (%) | 41.9 | 35.5 | 33.5 | 6.0 | - |
Table 2.
Performance evaluation results of all the observation stations in Taiwan (67 in total) in each month of 2013.
Table 2.
Performance evaluation results of all the observation stations in Taiwan (67 in total) in each month of 2013.
| Sim | Obs | MFB | MFE | IOA | R | |
|---|---|---|---|---|---|---|
| PM2.5 | µg/m3 | µg/m3 | % | % | ||
| January | 32.2 | 35.2 | −22.0 | 42.4 | 0.8 | 0.8 |
| April | 30.3 | 35.3 | −23.6 | 41.3 | 0.7 | 0.6 |
| July | 20.1 | 18.7 | −4.3 | 42.4 | 0.7 | 0.6 |
| October | 27.2 | 31.1 | −32.5 | 47.9 | 0.7 | 0.7 |
| Annual | 27.5 | 30.1 | −20.6 | 43.5 | 0.7 | 0.7 |
| NO2 | ppb | ppb | % | % | ||
| January | 15.7 | 17.6 | −20.6 | 36.2 | 0.7 | 0.8 |
| April | 16.4 | 16.9 | −8.7 | 34.4 | 0.7 | 0.7 |
| July | 16.0 | 10.6 | 36.1 | 46.2 | 0.5 | 0.8 |
| October | 13.9 | 12.7 | −4.8 | 39.2 | 0.6 | 0.7 |
| Annual | 15.5 | 14.4 | 0.5 | 39.0 | 0.6 | 0.7 |
| SO2 | ppb | ppb | % | % | ||
| January | 2.7 | 3.4 | −42.8 | 60.0 | 0.6 | 0.6 |
| April | 2.6 | 3.4 | −37.8 | 55.7 | 0.6 | 0.6 |
| July | 2.2 | 3.4 | −60.4 | 71.0 | 0.5 | 0.6 |
| October | 2.8 | 3.2 | −49.3 | 66.2 | 0.5 | 0.6 |
| Annual | 2.6 | 3.3 | −47.6 | 63.3 | 0.6 | 0.6 |
Table 3.
Summary of the impact of TPP’s emissions on the PM2.5 concentration for each air basin under different pollution levels in 2013.
Table 3.
Summary of the impact of TPP’s emissions on the PM2.5 concentration for each air basin under different pollution levels in 2013.
| Air Basin | Medium PM2.5 Level (36–54 µg/m3) | High PM2.5 Level (55–70 µg/m3) | Serious PM2.5 Level (>70 µg/m3) | Annual Avg. | ||||
|---|---|---|---|---|---|---|---|---|
| Base µg/m3 | Impact µg/m3 (%) | Base µg/m3 | Impact µg/m3 (%) | Base µg/m3 | Impact µg/m3 (%) | Base µg/m3 | Impact µg/m3 (%) | |
| NTAB | 42.2 | 0.4 (1.0) | 61.7 | 0.9 (1.4) | 79.4 | 1.4 (1.8) | 21.7 | 0.2 (0.8) |
| CMAB | 43.0 | 0.6 (1.3) | 59.7 | 1.6 (2.6) | 87.1 | 1.8 (2.0) | 22.3 | 0.3 (1.3) |
| CTAB | 43.6 | 1.0 (2.2) | 61.0 | 1.4 (2.3) | 89.1 | 3.7 (4.2) | 30.6 | 0.8 (2.4) |
| YCNAB | 43.0 | 1.5 (3.4) | 61.9 | 1.9 (3.1) | 84.1 | 2.4 (2.8) | 29.0 | 1.0 (3.3) |
| KPAB | 45.0 | 1.0 (2.2) | 61.4 | 1.5 (2.5) | 86.8 | 1.7 (2.0) | 39.5 | 0.8 (2.0) |
| YLAB | 41.2 | 0.1 (0.2) | - | - | - | - | 12.0 | <0.1 (0.2) |
| HTAB | 36.0 | <0.1 (0.0) | - | - | - | - | 8.7 | <0.1 (0.1) |
| Taiwan | 43.5 | 0.9 (2.1) | 61.4 | 1.5 (2.4) | 86.6 | 2.2 (2.6) | 27.0 | 0.5 (1.9) |
Table 4.
Impact of TPP’s emissions on the PM2.5 concentration for each month under different pollution levels in 2013.
Table 4.
Impact of TPP’s emissions on the PM2.5 concentration for each month under different pollution levels in 2013.
| Month | Medium PM2.5 Level (36–54 µg/m3) | High PM2.5 Level (55–70 µg/m3) | Serious PM2.5 Level (>70 µg/m3) | Monthly Avg. | ||||||||
|---|---|---|---|---|---|---|---|---|---|---|---|---|
| Base µg/m3 | Impact µg/m3 (%) | Base µg/m3 | Impact µg/m3 (%) | Base µg/m3 | Impact µg/m3 (%) | Base µg/m3 | Impact µg/m3 (%) | |||||
| January | 43.8 | 0.6 | (1.3) | 61.9 | 1.3 | (2.1) | 86.1 | 1.8 | (1.8) | 33.0 | 0.6 | (1.7) |
| April | 43.5 | 1.0 | (2.3) | 61.3 | 1.3 | (2.0) | 80.1 | 1.5 | (0.8) | 30.4 | 0.6 | (1.9) |
| July | 41.5 | 0.8 | (2.0) | 59.8 | 1.6 | (2.7) | 83.7 | 0.7 | (0.7) | 18.3 | 0.3 | (1.7) |
| October | 44.2 | 1.1 | (2.6) | 61.0 | 1.9 | (3.1) | 90.3 | 3.7 | (4.1) | 26.5 | 0.6 | (2.3) |
| Annual | 43.5 | 0.9 | (2.1) | 61.4 | 1.5 | (2.4) | 86.6 | 2.2 | (2.6) | 27.0 | 0.5 | (1.9) |
Table 5.
Impact of TPP’s emissions on the daily PM2.5 concentrations under the three events.
| Site Name | Event 1 (20 January) | Event 2 (23 April) | Event 3 (30 October) | |||
|---|---|---|---|---|---|---|
| Base µg/m3 | Impact µg/m3 (%) | Base µg/m3 | Impact µg/m3 (%) | Base µg/m3 | Impact µg/m3 (%) | |
| Banqiao | 63.7 | 0.5 (0.7) | 67.9 | 1.7 (2.5) | 9.9 | 0.0 (0.0) |
| Xitun | 75.0 | 4.3 (5.8) | 51.2 | 4.3 (8.4) | 99.8 | 10.5 (10.5) |
| Changhua | 58.0 | 6.3 (10.9) | 45.0 | 4.9 (10.9) | 86.8 | 7.4 (8.5) |
| Nantou | 74.7 | 2.3 (3.1) | 56.9 | 3.3 (5.7) | 77.3 | 5.2 (6.8) |
| Douliu | 66.7 | 5.6 (8.3) | 45.8 | 5.1 (11.0) | 73.8 | 4.3 (5.8) |
| Shanhua | 48.4 | 3.5 (7.3) | 37.3 | 2.1 (5.5) | 52.8 | 2.9 (5.6) |
| Qianzhen | 83.5 | 3.9 (4.6) | 45.6 | 1.6 (3.4) | 75.8 | 1.5 (1.9) |
Disclaimer/Publisher’s Note: The statements, opinions and data contained in all publications are solely those of the individual author(s) and contributor(s) and not of MDPI and/or the editor(s). MDPI and/or the editor(s) disclaim responsibility for any injury to people or property resulting from any ideas, methods, instructions or products referred to in the content. |
© 2023 by the authors. Licensee MDPI, Basel, Switzerland. This article is an open access article distributed under the terms and conditions of the Creative Commons Attribution (CC BY) license (https://creativecommons.org/licenses/by/4.0/).
Share and Cite
MDPI and ACS Style
Tsai, C.-Y.; Chen, T.-F.; Chang, K.-H. Role of an Ultra-Large Coal-Fired Power Plant in PM2.5 Pollution in Taiwan. Atmosphere 2024, 15, 56. https://doi.org/10.3390/atmos15010056
AMA Style
Tsai C-Y, Chen T-F, Chang K-H. Role of an Ultra-Large Coal-Fired Power Plant in PM2.5 Pollution in Taiwan. Atmosphere. 2024; 15(1):56. https://doi.org/10.3390/atmos15010056
Chicago/Turabian StyleTsai, Chang-You, Tu-Fu Chen, and Ken-Hui Chang. 2024. "Role of an Ultra-Large Coal-Fired Power Plant in PM2.5 Pollution in Taiwan" Atmosphere 15, no. 1: 56. https://doi.org/10.3390/atmos15010056
Note that from the first issue of 2016, this journal uses article numbers instead of page numbers. See further details here.