Article

On the Precursor Environments to Mountain Lee Wave Clouds in Central Iberia under CMIP6 Projections

by
Javier Díaz-Fernández
1,2,
Carlos Calvo-Sancho
2,
Pedro Bolgiani
1,
Juan Jesús González-Alemán
3,
José Ignacio Farrán
2,
Mariano Sastre
1,* and
María Luisa Martín
2,4
1
Department of Earth Physics and Astrophysics, Faculty of Physics, Complutense University of Madrid, 28040 Madrid, Spain
2
Department of Applied Mathematics, Faculty of Computer Engineering, University of Valladolid, 40005 Segovia, Spain
3
State Meteorological Agency (AEMET), 28040 Madrid, Spain
4
Institute of Interdisciplinary Mathematics (IMI), Complutense University of Madrid, 28040 Madrid, Spain
*
Author to whom correspondence should be addressed.
Atmosphere 2024, 15(1), 128; https://doi.org/10.3390/atmos15010128
Submission received: 20 November 2023 / Revised: 16 January 2024 / Accepted: 17 January 2024 / Published: 20 January 2024

Abstract

:
Mountain lee waves present significant hazards to aviation, often inducing turbulence and aircraft icing. The current study focuses on understanding the potential impact of global climate change on the precursor environments to mountain lee wave cloud episodes over central Iberia. We examine the suitability of several Global Climate Models (GCMs) from CMIP6 in predicting these environments using the ERA5 reanalysis as a benchmark for performance. The dataset is divided into two periods: historical data (2001–2014) and projections for the SSP5–8.5 future climate scenario (2015–2100). The variations and trends in precursor environments between historical data and future climate scenarios are exposed, with a particular focus on the expansion of the Azores High towards the Iberian Peninsula, resulting in increased zonal winds throughout the Iberian Peninsula in the future. However, the increase in zonal wind is insufficient to modify the wind pattern, so future mountain lee wave cloud events will not vary significantly. The relative humidity trends reveal no significant changes. Moreover, the risk of icing precursor environments connected with mountain lee wave clouds is expected to decrease in the future, due to rising temperatures. Our results highlight that the EC-EARTH3 GCM reveals the closest alignment with ERA5 data, and statistically significant differences between the historical and future climate scenario periods are presented, making EC-EARTH3 a robust candidate for conducting future studies on the precursor environments to mountain lee wave cloud events.

1. Introduction

Mountain lee waves have a significant impact on aviation safety, as the turbulence and icing conditions associated can be dangerous for departure and arrival operations near airports [1,2,3]. Mountain lee waves produce wind shear and turbulence, both of which can be dangerous to aircraft [4]. Furthermore, mountain waves can cause aircraft icing in addition to turbulence. Condensation is promoted in updrafts by collision and coalescence processes [5], which increase the liquid water content, occasionally producing wave clouds linked to the phases of the mountain lee waves [6]. When these wave clouds occur in areas with temperatures below 0 °C, supercooled liquid droplets can collide with the aircraft’s surface, causing ice to accumulate on the surface of an aircraft, presenting significant safety concerns for pilots and operators that require careful attention and preparation to ensure the safe and effective operation of aircraft in these weather conditions [1]. Turbulence and icing events can contribute to aircraft loss of control, which is one of the leading causes of aviation accidents. [7,8].
Mountain lee wave clouds are formed when an air mass is dynamically forced to rise up the windward slopes of a mountain, meeting static stable conditions leeward and resulting in the formation of waves through the restoring forces of gravity and buoyancy [9,10]. The characteristics of these waves depend on several factors, such as atmospheric stability, wind speed, and the height of the mountain range [11,12,13]. Mountain lee wave clouds can extend for hundreds of kilometers downstream from the mountain range [14]. Larger and higher mountain ranges tend to produce stronger and more persistent lee wave clouds. Under favorable conditions, these waves are typically visible as alternating cloud bands due to the decreasing temperatures and increasing liquid water content in the updrafts [2,15].
According to Bolgiani et al. [2] and Díaz-Fernández et al. [13], the synoptic conditions that precede the development of mountain lee wave clouds in the center of the Iberian Peninsula are characterized by a convergence of the Azores Anticyclone and a cyclone or relatively low over central Europe. This pattern favors northerly and north-westerly flows at 500 hPa, which are typically accompanied by cold air advection (maritime or continental) across the area.
In this study, future changes in the precursor environments to mountain lee wave cloud events and icing precursor environments connected with them are analyzed under a climate change context over the Guadarrama mountain range (an area near the Adolfo Suarez Madrid Barajas airport in central Iberia) in order to benchmark different Global Climate Models (GCMs) against ERA5 and determine if the GCMs selected may be used as initial conditions. Therefore, it should be noted that it is not the goal of this work to identify mountain lee wave cloud or icing events through GCMs, since this would be impossible owing to the restricted horizontal resolution of current GCMs. Díaz-Fernández et al. [13,16] established a methodology for analyzing and simulating several mountain lee wave cloud episodes. From their studies, three basic variables, i.e., wind speed and direction and humidity were determined for mountain lee wave cloud formation in central Iberia. Moreover, the temperature was also analyzed to study icing precursor environments connected with mountain lee wave clouds. Here, from several GCMs of the Coupled Model Intercomparison Project Phase 6 (CMIP6), these variables are evaluated to identify differences and/or trends between current and future precursor environments to mountain lee wave cloud events.
The World Climate Research Programme manages the Coupled Model Intercomparison Project Phase 6 (CMIP6) models, which comprise the most recent state-of-the-art global future climate scenarios [17,18]. Several aspects of CMIP’s sixth phase have been enhanced over prior CMIP phases; for example, computation efficiency has been increased in the present phase to minimize coding errors in the parameterization of clouds, convection, and turbulence. In addition, spatial resolution, physical parameterization, and biogeochemical cycle modeling have been improved [18]. CMIP6 GCMs have been used in several types of future climate projection studies, including ice extent, heat fluxes, and temperatures over the Arctic [19], temperature and precipitation changes over Africa [20], global surface temperature changes [21], and wind energy resource studies over Europe [22]. Nonetheless, to the author’s knowledge, this is the first research where the precursor environments to mountain lee wave clouds are studied using future climate projections from GCMs.
The structure of this work is as follows. Section 2 provides a description of the database and methods. Section 3 discusses the most relevant results about synoptic patterns, distributions, and trends for the main atmospheric variables related to precursor environments to mountain lee wave clouds. Finally, Section 4 summarizes the main conclusions.

2. Datasets and Methodology

The precursor environments to mountain lee wave clouds under CMIP6 projections are here studied in the vicinity of the Guadarrama mountains (Figure 1). This mountain range is in the middle of the Iberian Peninsula. It is 80 km long and extends northeast to southwest. Its highest peak, Peñalara, is located on the southern face and has a height of 2428 m. This area is distinguished by the presence of Adolfo Suarez Madrid-Barajas Airport, Spain’s main and busiest airport and the sixth in Europe. The orographic barrier has an important influence on the climatology and meteorology of the airport’s surroundings since the predominant wind direction is from the northwest and mountain lee wave clouds develop on the leeward side.
The methodology for the present study is based on Díaz-Fernández et al. [13,16], who used a dataset of 68 observed mountain lee wave cloud events in wintertime (November to March) to produce a characterization of the associated conditions near the Guadarrama mountain range between 2001 and 2014. Because icing precursor environments were also studied, the winter months were chosen as the melting level is lower, increasing the possibility of icing connected with mountain lee wave clouds [13]. The former results are based on HARMONIE-AROME [23] and WRF-ARW [24] high-resolution simulations fed with the ERA5 data as initial and boundary conditions. The ERA5 reanalysis employs a horizontal grid resolution of 0.25°, a temporal resolution of 6 h, and 137 hybrid levels for the vertical resolution, covering the period from 1950 up to the present [25]. Based on the results of Díaz-Fernández et al. [13,16], and taking the reanalysis resolution and setup into account, the ERA5 can be considered an appropriate benchmark to which other GCMs can be compared when the precursor environments to mountain lee wave clouds are simulated. In the current study, atmospheric variables from ERA5 are used to characterize the precursor environments that produced the 68 mountain lee wave cloud events observed by Díaz-Fernández et al. [13], establishing the main mesoscale features of mountain lee wave cloud episodes in the study area. It is worth noting that, although we will use the term “wave cloud precursor environments” throughout this publication, this refers primarily to the precursor environments that precede and favor the development of mountain lee wave cloud events.
According to the 68 mountain lee wave cloud events observed by Díaz-Fernández et al. [13,16], a mesoscale atmospheric configuration will be a precursor to mountain lee wave cloud events in the whole domain of study if the following conditions are met by the ERA5 dataset (based on frequency percentiles):
  • Wind direction between 256° (95th percentile, p95) and 016° (5th percentile, p5).
  • Wind speed greater than 5.6 m/s (p5).
  • Relative humidity higher than 5% (p5).
These criteria are based on the decision tree created by Díaz-Fernández et al. [13], which was developed for high-resolution simulations of lee wave clouds. Please note that the conditions here produced are those shown by ERA5 and are adapted for the domain of study of this work. Thus, following the sequence derived from the development of mountain lee wave clouds, wind direction is required to be perpendicular to the Guadarrama mountains (between 256° –016°). The wind speed must then be enough to ascend over the mountains (more than 5.6 m/s), and the relative humidity must be greater than 5% averaging the whole domain. It is worth noting that a stable atmosphere over the mountain is required for the development of mountain lee waves [9,13]. However, because of the low spatial resolution of the CMIP6 GCMS over the Guadarrama mountains, atmospheric stability is not taken into consideration in the current paper.
The percentiles, based on the ERA5 characterization, are chosen as thresholds to include 90% of the variables involving observed mountain lee wave cloud events as per Díaz-Fernández et al. [13,16]. Note that ERA5 is unable to reproduce real atmospheric variables required in mountain lee wave cloud generation (i.e., low relative humidity or wind speed thresholds) due to its low resolution. For the entire spatial domain (018° W/001° E ×35° N/52° N), these conditions shall be met at 700 hPa since this altitude presents the highest values of liquid water content identified in mountain lee wave clouds research in the same location by Bolgiani et al. [2] and Díaz-Fernández et al. [26]. The temporal domain is also derived from the previously mentioned results, i.e., from November to March. All these conditions are applied to the ERA5 dataset to be used as a benchmark.
For the first time (to the author’s knowledge), the events with identified wave cloud precursor environments are then compared to historical data from 2001 to 2014 (hereafter, HIST), and an SSP5-8.5 future climate scenario (hereafter, S5-8.5), from 2015 to 2100, using CMIP6 GCMs data. The SSP5-8.5 CMIP6 future climate projection is based on a scenario where CO2 emissions will increase quickly until 2080, then gradually decrease until the end of the century, with a radiative forcing peaking at 8.5 W/m2 by 2100, resulting in a global mean air temperature increase around 5 °C compared to the pre-industrial era and about 4 °C compared to our current period [18]. This scenario allows us to investigate the long-term consequences of persistent high emissions on regional and global precursor environments (wind and relative humidity) to mountain lee wave cloud events.
From all the CMIP6 GCMs, the models considered for the current analysis have six-hourly data for both the HIST and S5-8.5 future climate scenario. Also, only GCMs with 700 hPa wind speed and direction, specific humidity, and temperature data available are retrieved to analyze the wave cloud and icing precursor environments (Additionally, the 500 and 700 hPa geopotential height is used to study the synoptic configuration in mountain lee wave cloud events. Considering these restrictions, the EC-EARTH3 [27], MPI-ESM1.2-HR [28], and MRI-ESM2.0 [29] GCMs are selected, which are shortly outlined below. These databases are downloaded through the Earth System Grid Federation data portal: https://esgf-node.llnl.gov/ (accessed on 17 January 2024).
The EC-EARTH3 is a global climate model that is developed by a consortium of European climate modeling centers with the purpose of simulating the Earth’s climate system and its interactions, including the atmosphere, oceans, land surface, and cryosphere. The EC-EARTH3 model features a 0.703° horizontal resolution and 91 vertical resolution layers [27]. The Max Planck Institute for Meteorology in Germany created the MPI-ESM1.2-HR global climate model using several atmospheric, land surface, and ice–ocean submodels [30,31,32]. It has 95 vertical levels and a 0.93° horizontal resolution [28]. Finally, the MRI-ESM2.0 global climate model was created by Japan’s Meteorological Research Institute and consists of various submodels of the major components of the Earth system, such as the atmosphere, oceans, land surface, aerosols, and atmospheric chemistry [33]. The horizontal resolution is 1.125° and has 80 vertical layers, from the surface to the top of the model at 0.01 hPa, in a hybrid sigma-pressure coordinate system [29].
Because the selected GCMs have different horizontal grid resolutions, all models’ datasets are regridded to a common 0.703° latitude/longitude grid, which is the EC-EARTH3 spatial resolution (based on initial results, to assess the climate change signal on wave cloud precursor environments. To match the grid resolution of GCMs, ERA5 atmospheric variables are also regridded to a 0.703° latitude/longitude grid. Then, the GCM datasets are combined into a multi-model ensemble mean (hereinafter ENS).
Considering the abovementioned required conditions, several datasets for GCMs and ERA5 are created containing the dates with wave cloud precursor environments. Large-scale pattern composites (geopotential heights at 500 and 700 hPa) from ERA5, the three chosen GCMs and the ENS are examined to study the precursor spatial patterns associated with mountain lee wave cloud formation in both HIST and S5-8.5 [34]. The non-parametric Mann–Whitney test [35] is applied over the domain’s grid points to statistically evaluate the significant differences (5% significance level) between the 500 and 700 hPa geopotential heights from GCMs for each period. In addition, the difference between S5-8.5 and HIST is estimated to assess the magnitude of changes for both periods.
At 700 hPa, wind and relative humidity variables are analyzed to assess wave cloud precursor environments in accordance with Díaz-Fernández et al. [13,16]. First, as Carvalho et al. [22] have done, differences in wind speed median values at 700 hPa are analyzed to determine the degree of similarity between the simulated (GCMs) and referenced (ERA5) data over the HIST period. The distributions of wind direction and speed, as well as relative humidity, at 700 hPa for HIST and S5-8.5 periods, are then evaluated and compared using the Mann–Whitney test. Temperatures are also computed and compared in order to examine icing precursor environments connected with mountain lee wave clouds.
Finally, the non-parametric Mann–Kendall trend test [36,37] is applied to identify significant trends at 700 hPa in the wave cloud (wind and relative humidity) and icing (temperature) precursor environments from the HIST to the S5-8.5 period (2001–2100). The p-value used is 0.05.

3. Results and Discussion

3.1. Historical and Future Scenario Wave Cloud Precursor Environments Characterization

For each model, the days complying with the defined wave cloud precursor environments are selected (Table 1). While ERA5 reports 116 days, MRI-ESM2.0HIST reports 112 days, with both detecting a yearly average of 8 events. EC-EARTH3HIST and MPI-ESM1.2-HRHIST yield more days with wave cloud precursor environments (12 and 11, respectively) every year. On the other side, under the S5-8.5 scenario, the MRI-ESM2.0 shows the fewest number of days with suitable wave cloud precursor environments. However, none of the datasets show any statistically significant trends in the frequency of days with wave cloud precursor environments when applying the Mann–Kendall test.
Geopotential height composites at 500 and 700 hPa for episodes with wave cloud precursor environments detected in the ERA5 and the GCMs datasets for HIST and S5-8.5 periods are shown in Figure 2. The geopotential heights at both levels show statistically significant differences (higher than 15 dam; p-value = 0.01) between EC-EARTH3HIST and EC-EARTH3S5-8.5 (Figure 2d), displaying a tendency for an increased future zonal wind component as the Azores High seems to be closer to the Iberian Peninsula and troughs are shorter than in the HIST period. In contrast, there are no significant differences between HIST and S5-8.5 periods at both levels in the MRI-ESM2.0 (p-value ≈ 0.6), MPI-ESM1.2-HR (p-value ≈ 0.8), and ENS (p-value ≈ 0.1) (Figure 2g,j,m), which is inconsistent with the S5-8.5 climate change scenario. Furthermore, throughout the HIST period, the synoptic pattern most similar to the ERA5 (Figure 2a) results is the EC-EARTH3HIST (Figure 2b) with no statistically significant differences (p-value ≈ 0.7). This result suggests that the EC-EARTH3 produces more realistic atmospheric distributions when compared to the other results. The remaining GCMs do not sufficiently adjust to the ERA5 in the HIST period (p-value < 0.05). The ENS does not perform adequately either since the EC-EARTH3 only contributes 33% of the ENS results and the poor performance of the other GCMs prevails. Cresswell-Clay et al. [38] used observational and reanalysis data to examine the variation of the Azores High over the winter months in the twentieth century. According to their results, the size and intensity of the Azores High near the Iberian Peninsula increases, influencing precipitation distributions over Western Europe. This is in line with the Azores High expansion seen in Figure 2b,c.
Differences in the median values between each GCM minus the ERA5 wind speed are calculated for the whole domain. The wind speed median differences for MPI-ESM1.2-HRHIST and MRI-ESM2.0HIST are 2.22 m/s and 3.28 m/s, respectively, whereas the differences between ERA5 and EC-EARTH3HIST are 0.28 m/s. This latter result is in line with Carvalho et al. [22], who evaluated wind energy resources at 100 m across Europe using a set of CMIP6 future climate projections. In their study, the computed wind speed median difference between EC-EARTH3HIST and the ERA5 is 0.30 m/s, being the best result among all the GCMs evaluated, as in the current study. According to Pierce et al. [39], Almazroui et al. [20], and Carvalho et al. [22], who compared individual models and multi-model ensemble mean with observations, the multi-model ensemble mean strategy usually yields better and more realistic results than single-model experiments because uncertainties from individual models are minimized. However, the best results are here obtained when considering the EC-EARTH3 and ENS datasets. As a result, the subsections that follow only look further into these two databases.
Distributions (wind roses and violin plots) of wind speed and direction, relative humidity, and temperature at 700 hPa for the selected dates with wave cloud precursor environments are presented in Figure 3 and Figure 4 for ERA5, EC-EARTH3HIST, EC-EARTH3S5-8.5, ENSHIST, and ENSS5-8.5. The wind rose distributions (Figure 3a–e) reveal a predominant northwest wind direction, presenting wave cloud precursor environments in over 65% of the cases for both EC-EARTH3 and ENS datasets, and only 51% of the episodes for ERA5. The Mann–Whitney test [35] reveals statistically significant differences in wind direction in the overall domain mean among all datasets. These wind roses reflect the results shown for the geopotential height composite information (Figure 2), with the prevalence of zonal winds. Díaz-Fernández et al. [13] used the numerical weather prediction models WRF-ARW and HARMONIE-AROME to characterize several mountain lee wave cloud events in the Guadarrama mountain range. They found a prevailing interval of wind direction between 295° and 003° in 80% of the mountain lee wave cloud events in accordance with the wind rose distribution shown for the ERA5 dataset (Figure 3a).
The wind speed distributions for events with wave cloud precursor environments of the five used datasets are shown in Figure 4a. Before delving into this figure, it must be noted that the bias (simulated minus reference data) between ENSHIST and ERA5 is −1.6 m/s and 0.3 m/s between EC-EARTH3HIST and ERA5. As for the synoptic results, the wind speed distribution for EC-EARTH3HIST shows values closer to ERA5. There are significant differences in wind speed between the EC-EARTH3S5-8.5 and EC-EARTH3HIST (p-value = 0.01) with higher wind speed values for the EC-EARTH3S5-8.5, in line with the climate change scenario considered. However, no statistically significant changes exist between ENSHIST and ENSS5-8.5, in accordance with the differences already shown for the synoptic composites (Figure 2h,i). The wind speed distribution agrees with the one found by Díaz-Fernández et al. [13], who characterized the wind speed in mountain lee wave cloud events in the Guadarrama mountain range with high-resolution models. Furthermore, the wind speed increase for the EC-EARTH3S5-8.5 dataset is consistent with the results by Andrés-Martín et al. [40], who used the WRF model to investigate changes in surface wind speed across the Iberian Peninsula with a CMIP6 ensemble (in which the GCMs used here are involved), yielding surface wind speed increases (+0.06 m/s per decade) by the end of the century under the SSP5-8.5 scenario. On the other hand, Carvalho et al. [22] determined a slight reduction in future wind speed at 100 m (under the SSP5-8.5 scenario) compared to their CMIP6 historical data in practically all of Europe. However, they found higher wind speed in their CMIP6 ensemble (15 members, including the GCMs used in this work) than ERA5 during the HIST period. This discrepancy can be linked to future changes in the planetary boundary layer; however, in the present study, the planetary boundary layer is not taken into consideration since wave cloud precursor environments are analyzed at 700 hPa.
To analyze the potential cloudiness involved in the events with wave cloud precursor environments, the relative humidity distributions for the five datasets are derived (Figure 4b). The median relative humidity values for ERA5, EC-EARTH3HIST, and ENSHIST are all significantly different (p-value = 0.01). Between ERA5 and HIST data, the relative humidity bias is 6.1% (ENSHIST) and 1.9% (EC-EARTH3HIST). Again, there are no statistically significant differences in relative humidity between ENSHIST and ENSS5-8.5 (p-value = 0.57). However, the relative humidity decreases in EC-EARTH3S5-8.5 compared to EC-EARTH3HIST. Finally, the temperature distribution (Figure 4c) is also evaluated to determine icing precursor environments connected with mountain lee wave clouds [21]. Notably, the EC-EARTH3HIST median temperature is −1.4 °C lower than the ERA5 median temperature and the ENSHIST median temperature is slightly closer to ERA5 (bias = −1.0 °C). Both ENS and EC-EARTH3 produce increases in temperature of +1.5 °C and +2.8 °C, respectively, for the HIST and S5-8.5 periods. As a result, the risk of icing precursor environments connected with mountain lee wave clouds at 700 hPa is expected to be reduced in the future in central Iberia. A temperature underestimation is noted in EC-Earth3 relative to ERA5, which was also identified by Döscher et al. [25] with a −2 °C surface temperature bias across the Iberian Peninsula between 1980 and 2010. The slight decrease in relative humidity would be consistent with a temperature increase if the vapor pressure was constant [41,42].
Based on the previous distribution patterns and composite results, and assuming that ERA5 is a reliable benchmark for reproducing precursor environments to mountain lee wave clouds, it is reasonably inferred that EC-EARTH3 is the most suitable GCM for assessing future wave cloud precursor environments. This result is based mainly on the fact that EC-EARTH3HIST data closely align with ERA5 data. Furthermore, statistical analysis demonstrates significant differences in EC-EARTH3 data between the HIST and S5-8.5 periods across all variables, in contrast to the ENS data.

3.2. Trends in Wave Cloud Precursor Environments

Considering the results shown in the previous sections, the 2001–2100 trends in wind components, wind speed, relative humidity, and temperature are derived for the EC-EARTH3 and ENS. Under the prevalent wind directions (northwestern winds), zonal wind trends for the selected mountain wave events in EC-EARTH3 (Figure 5a) show a statistically significant overall increase on northwestern Iberia, and particularly on the windward side of the Guadarrama mountain range, with increasing zonal wind values above 4 m/s. Figure 5d depicts a statistically significant rise in zonal wind trends for ENS in northwestern Iberia; however, these increases are lower (up to 2 m/s) than EC-EARTH3 and far from the Guadarrama area. Meridional wind trends also show a statistically significant positive tendency around +2 m/s for both datasets. This would mean that the overall meridional wind intensity will be lower under the S5-8.5 scenario. However, for EC-EARTH3, the area covers the Iberian south and east, as well as a small region in the center, just leeward of the Guadarrama mountain range (Figure 5b), while for ENS, the area includes almost the whole research domain (Figure 5e). Furthermore, the wind speed trends for the selected events reveal statistically significant increases (approximately +2 m/s) in a few spots on northwestern Iberia for EC-EARTH3 (Figure 5c) but no trend for ENS over Iberia (Figure 5f). It should be noted that, despite the increasing trend in zonal winds on the windward side of the Guadarrama mountain range, the EC-EARTH3HIST (ENSHIST) zonal wind has a bias of 1.9 m/s (3.9 m/s) greater than ERA5 at 700 hPa (not shown). Even though some results seem to be discordant, a possible explanation may be the balancing effect between atmospheric variables. While more intense zonal winds may mean fewer atmospheric situations with wave cloud precursor environments in the Guadarrama mountains, this increase is not enough to modify the wind pattern (northwestern winds) associated with wave cloud precursor environments, as shown in Figure 3 and by the absence of a statistically significant trend in the frequency of events with wave cloud precursor environments between the HIST and S5-8.5 periods.
The results herein presented agree with those of Döscher et al. [27] in a global study, who showed EC-EARTH3 zonal wind values 2 m/s greater than ERA5 for the 1980 to 2010 period. Also, in the currently selected domain, they recorded zonal winds around 2 m/s greater than ERA5 from 2001 to 2014. Additionally, the obtained wind trends are in line with the geopotential height composite results because a greater increase in zonal winds implies more westerly winds in the future, as seen in Figure 2c, due to the Azores High’s greater proximity to the Iberian Peninsula.
The relative humidity and temperature trends for EC-EARTH3 and ENS are also shown. For EC-EARTH3 (Figure 6a), there are statistically significant decreases in relative humidity (−5%) in the south of Iberia and increases in temperature (Figure 6b) in the entire domain, ranging from +6 °C in the south to +4 °C in northern Iberia. The decreases in relative humidity in the south of Iberia could be connected with the expansion of the Azores High towards the Iberian Peninsula observed in Figure 2c. This decrease in relative humidity might be connected to the temperature rises; however, the vapor pressure should be further studied to fully comprehend these results.
On the other hand, Figure 6c also depicts relative humidity decreases in northeastern Iberia as well as statistically significant temperature rises (Figure 6d), but smaller than EC-EARTH3. As a result, it is expected that there would be a lower likelihood of icing precursor environments connected with mountain lee wave clouds at 700 hPa in the whole domain under the S5-8.5 scenario. Future increases in temperatures may have an influence on stability conditions [26,43], which could influence the occurrence of mountain lee wave cloud events in the future.

4. Conclusions

This study focuses on the analysis of precursor environments to mountain lee wave cloud events on the south side of the Guadarrama mountain range, near the Adolfo Suarez Madrid Barajas Airport. A dataset of 68 mountain lee wave clouds events observed in 2001–2014 is considered and thresholds for wind speed and direction and relative humidity using the ERA5 reanalysis are determined. These criteria are then used to search for episodes with wave cloud precursor environments over the winter (November to March) using several CMIP6 GCMs for both HIST (2001–2014) and S5-8.5 scenario (2015–2100) data. Then, the atmospheric variables related to wave cloud event precursor environments are analyzed and compared between the GCMs selected and the ensemble of these. Finally, trends for the S5-8.5 scenario are calculated. The results yield several conclusions, the most important of which are listed below:
  • Events with wave cloud precursor environments are defined based on wind direction (256° − 016°), wind speed (>5.6 m/s), and relative humidity (>4.7%) thresholds from the ERA5 dataset. Based on them, an average of 11 events per year are identified for EC-EARTH3S5-8.5 and MPI-ESM1.2-HRS5-8.5, and 9 events for MRI-ESM2.0S5-8.5. However, no statistically significant trends in the occurrence of these events are found in any dataset.
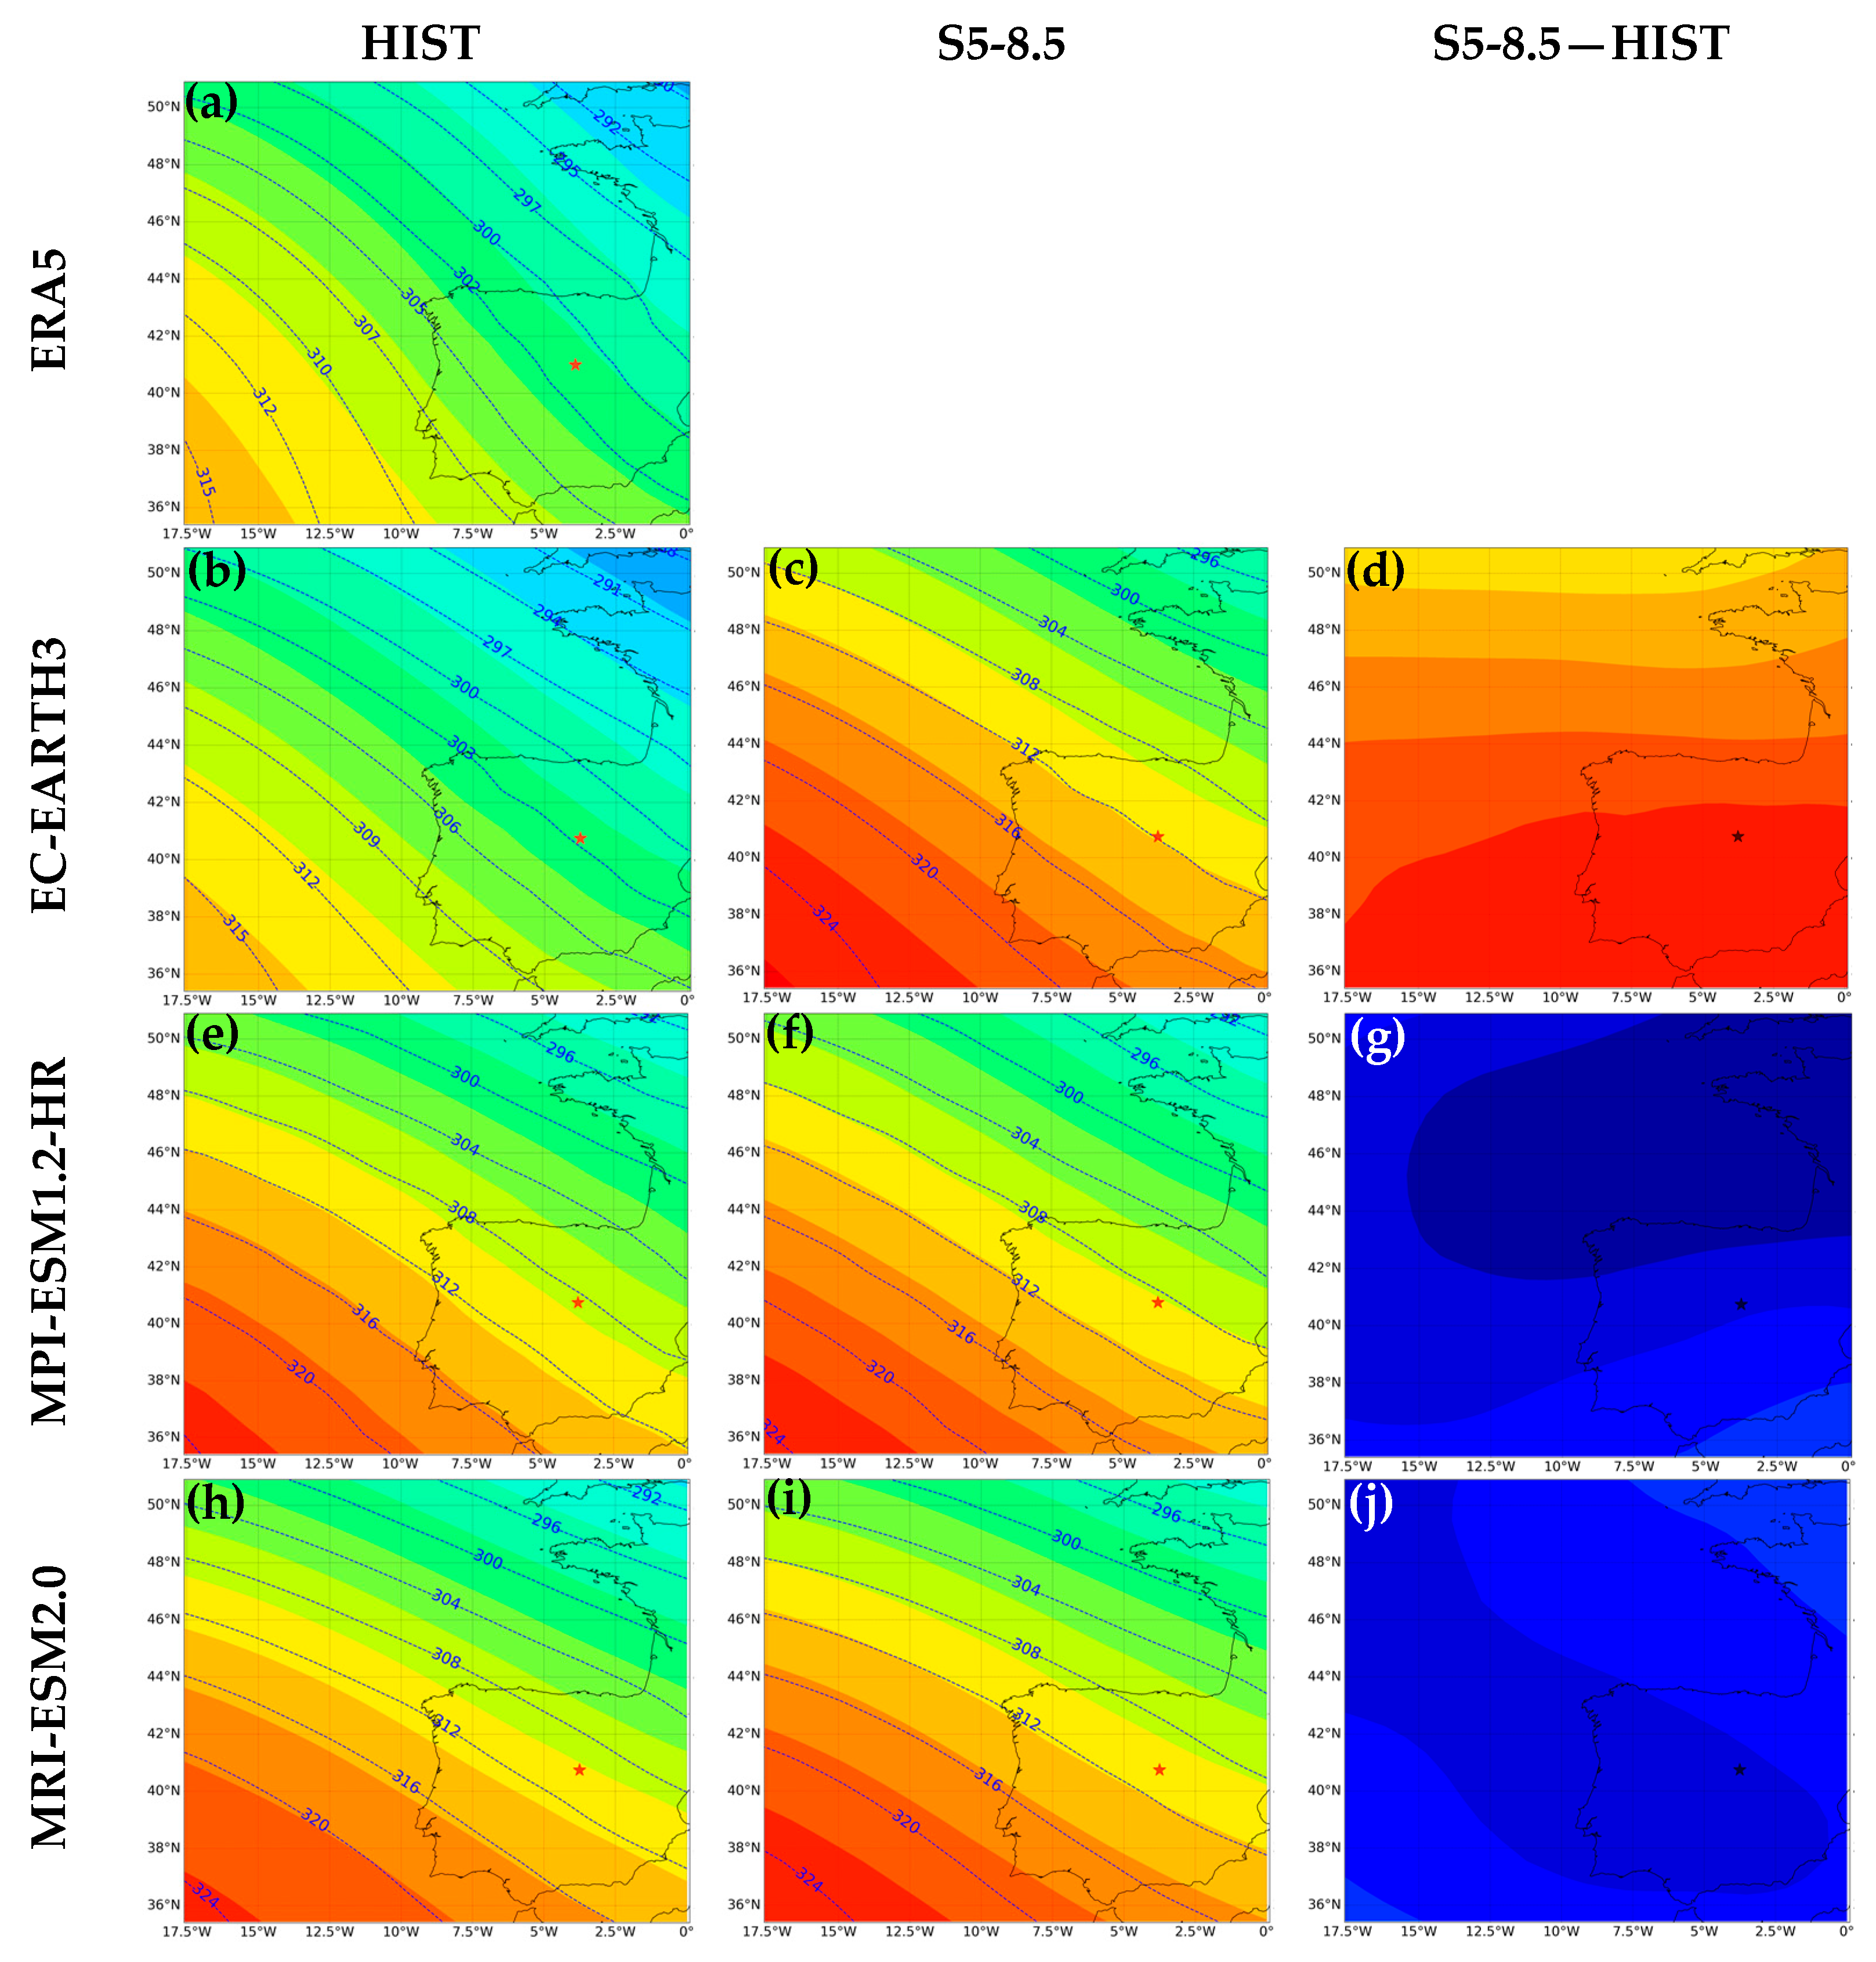
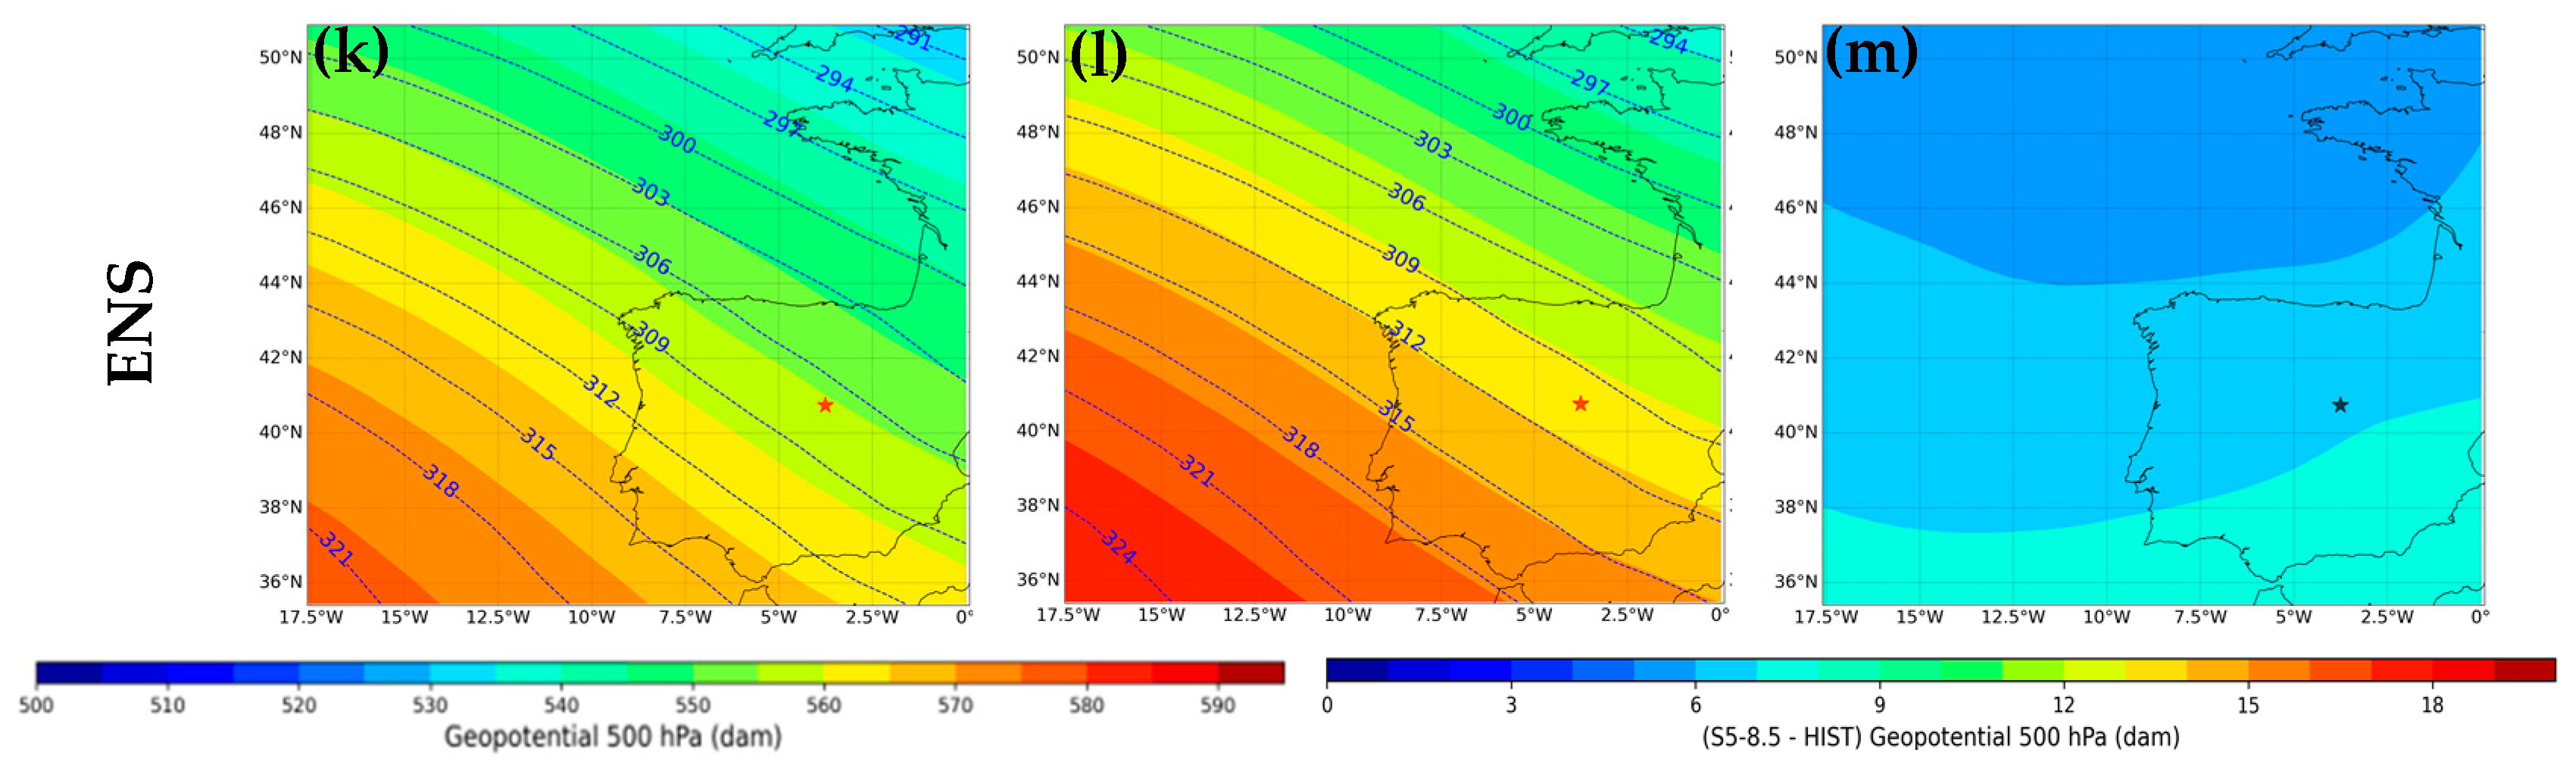
  • For the S5-8.5 period, the geopotential height composites at 500 and 700 hPa for the wave cloud precursor environments detected in the three datasets show an increase in zonal winds. Expansion of the Azores High towards the Iberian Peninsula and shorter troughs than the ERA5 and HIST period are noted, with these differences being more pronounced for the EC-EARTH3 dataset. Furthermore, the EC-EARTH3HIST synoptic pattern composite is the most like ERA5.
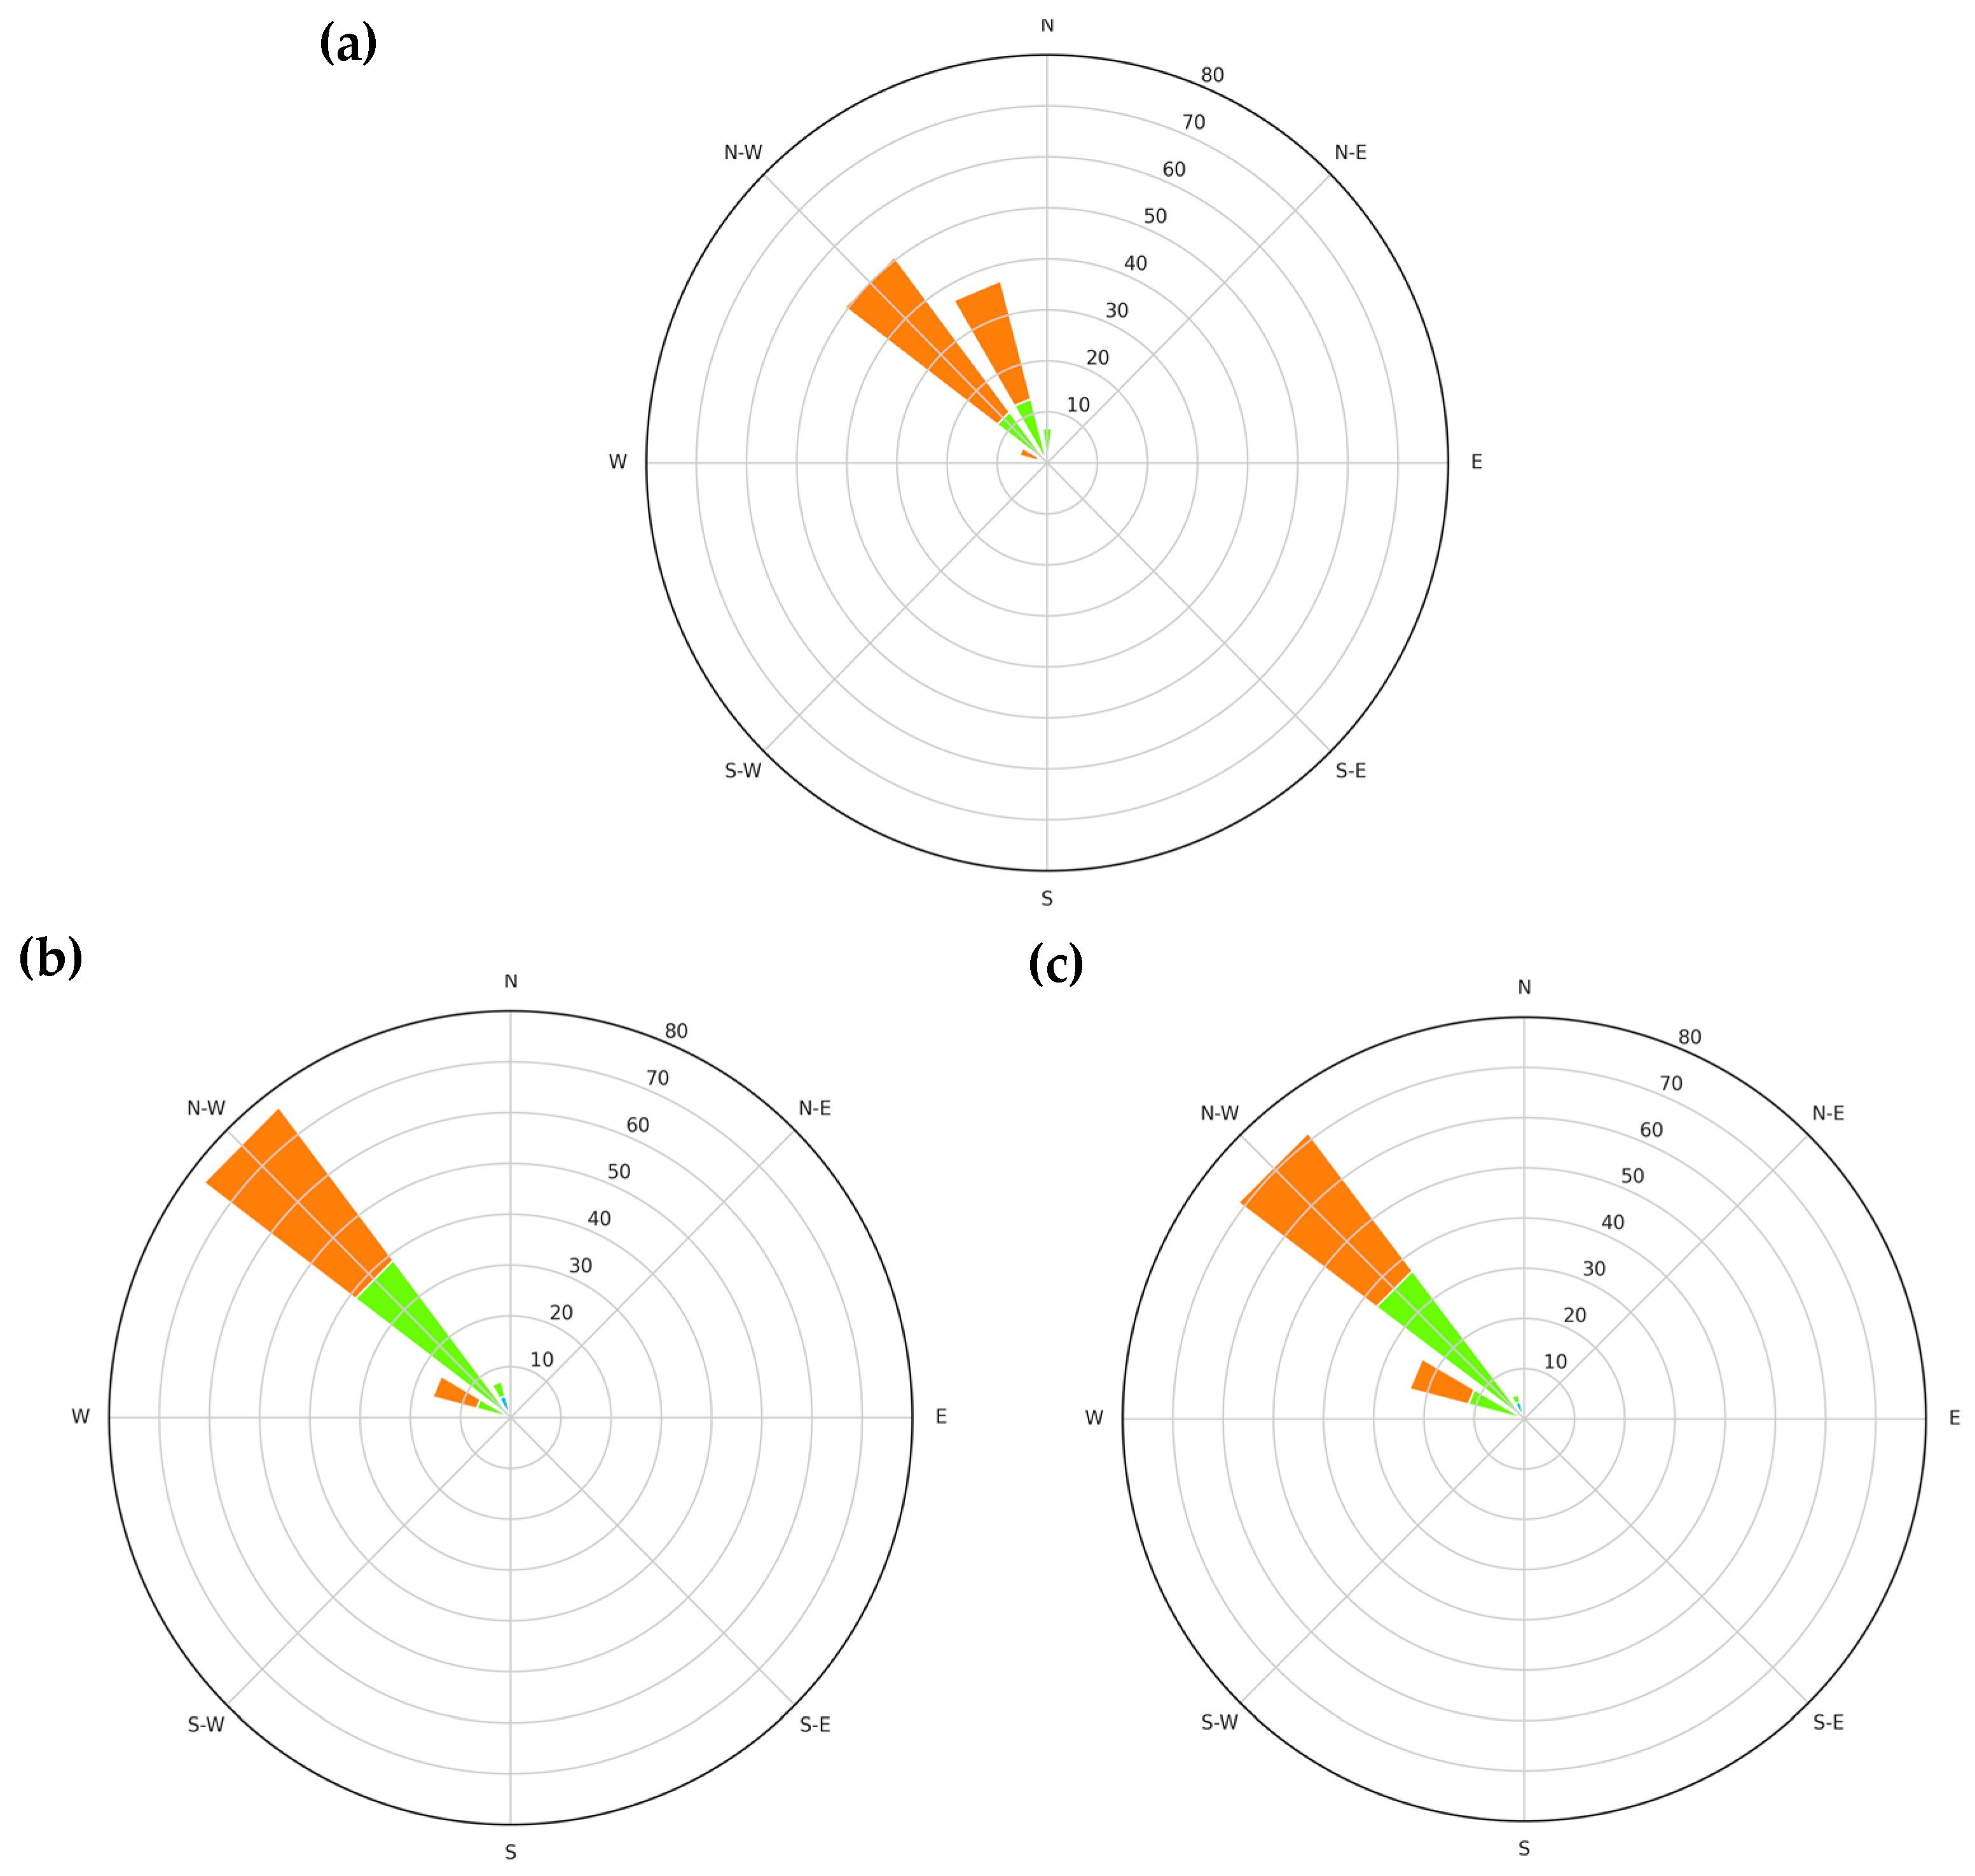
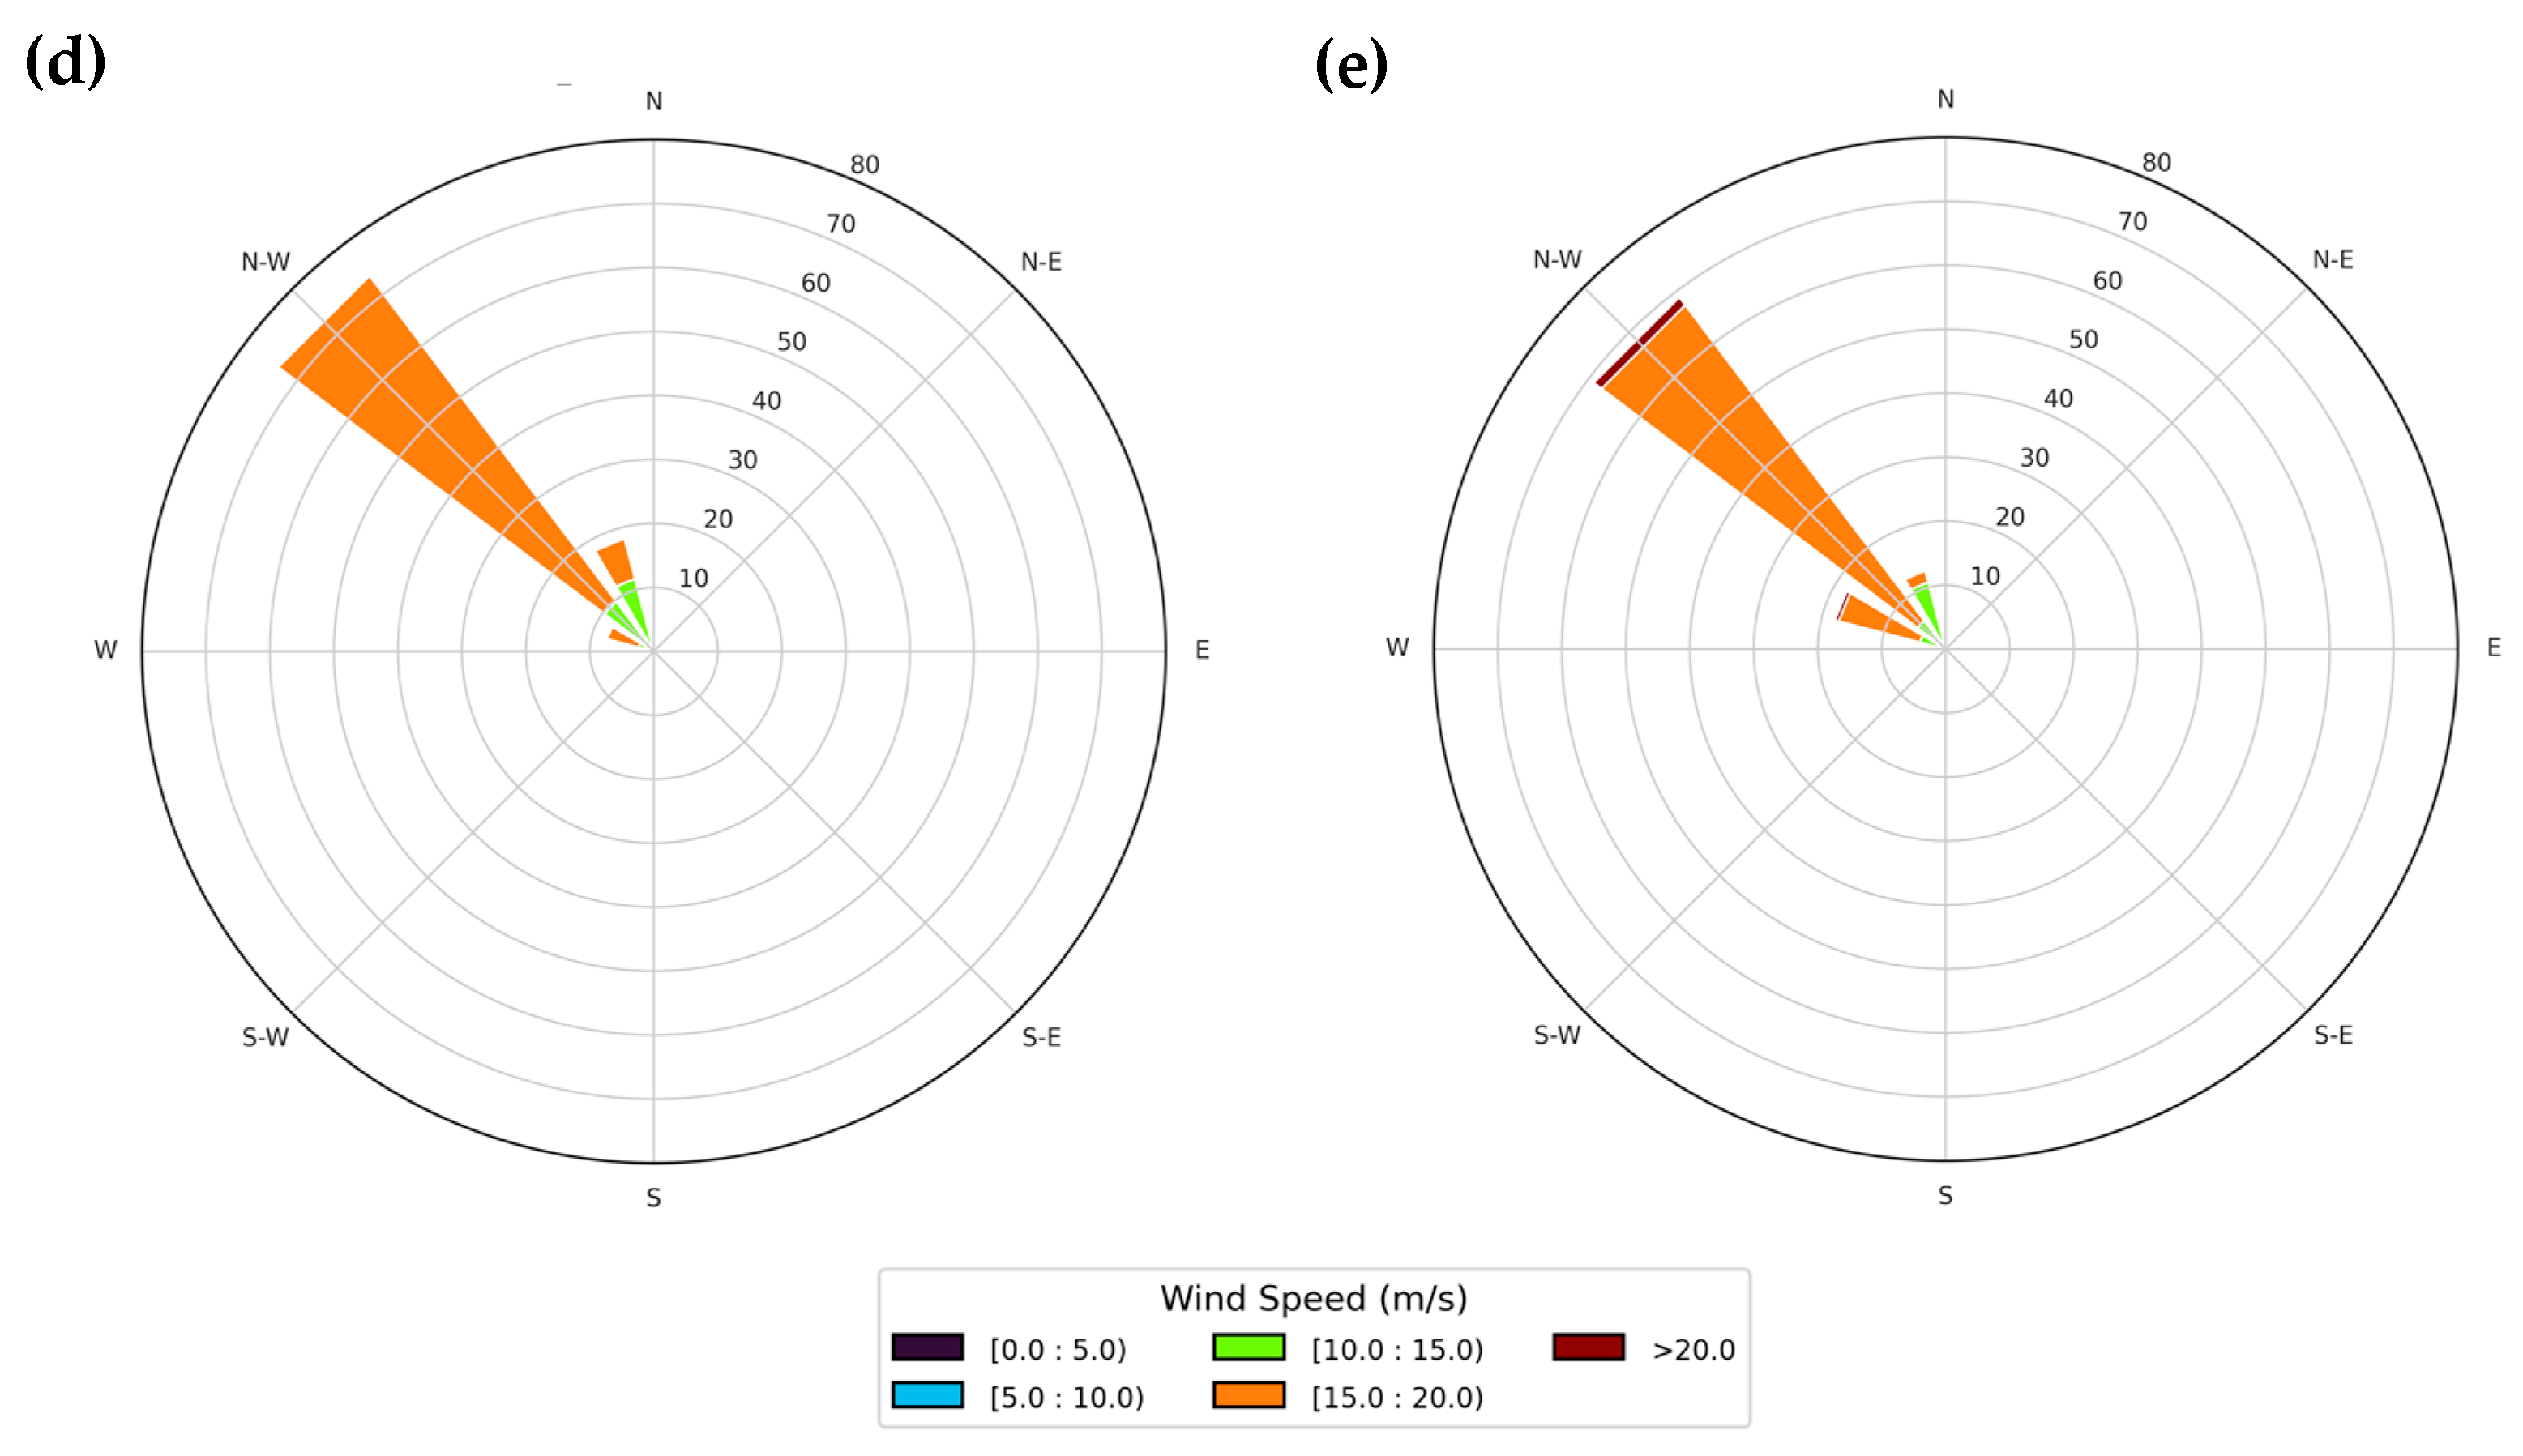
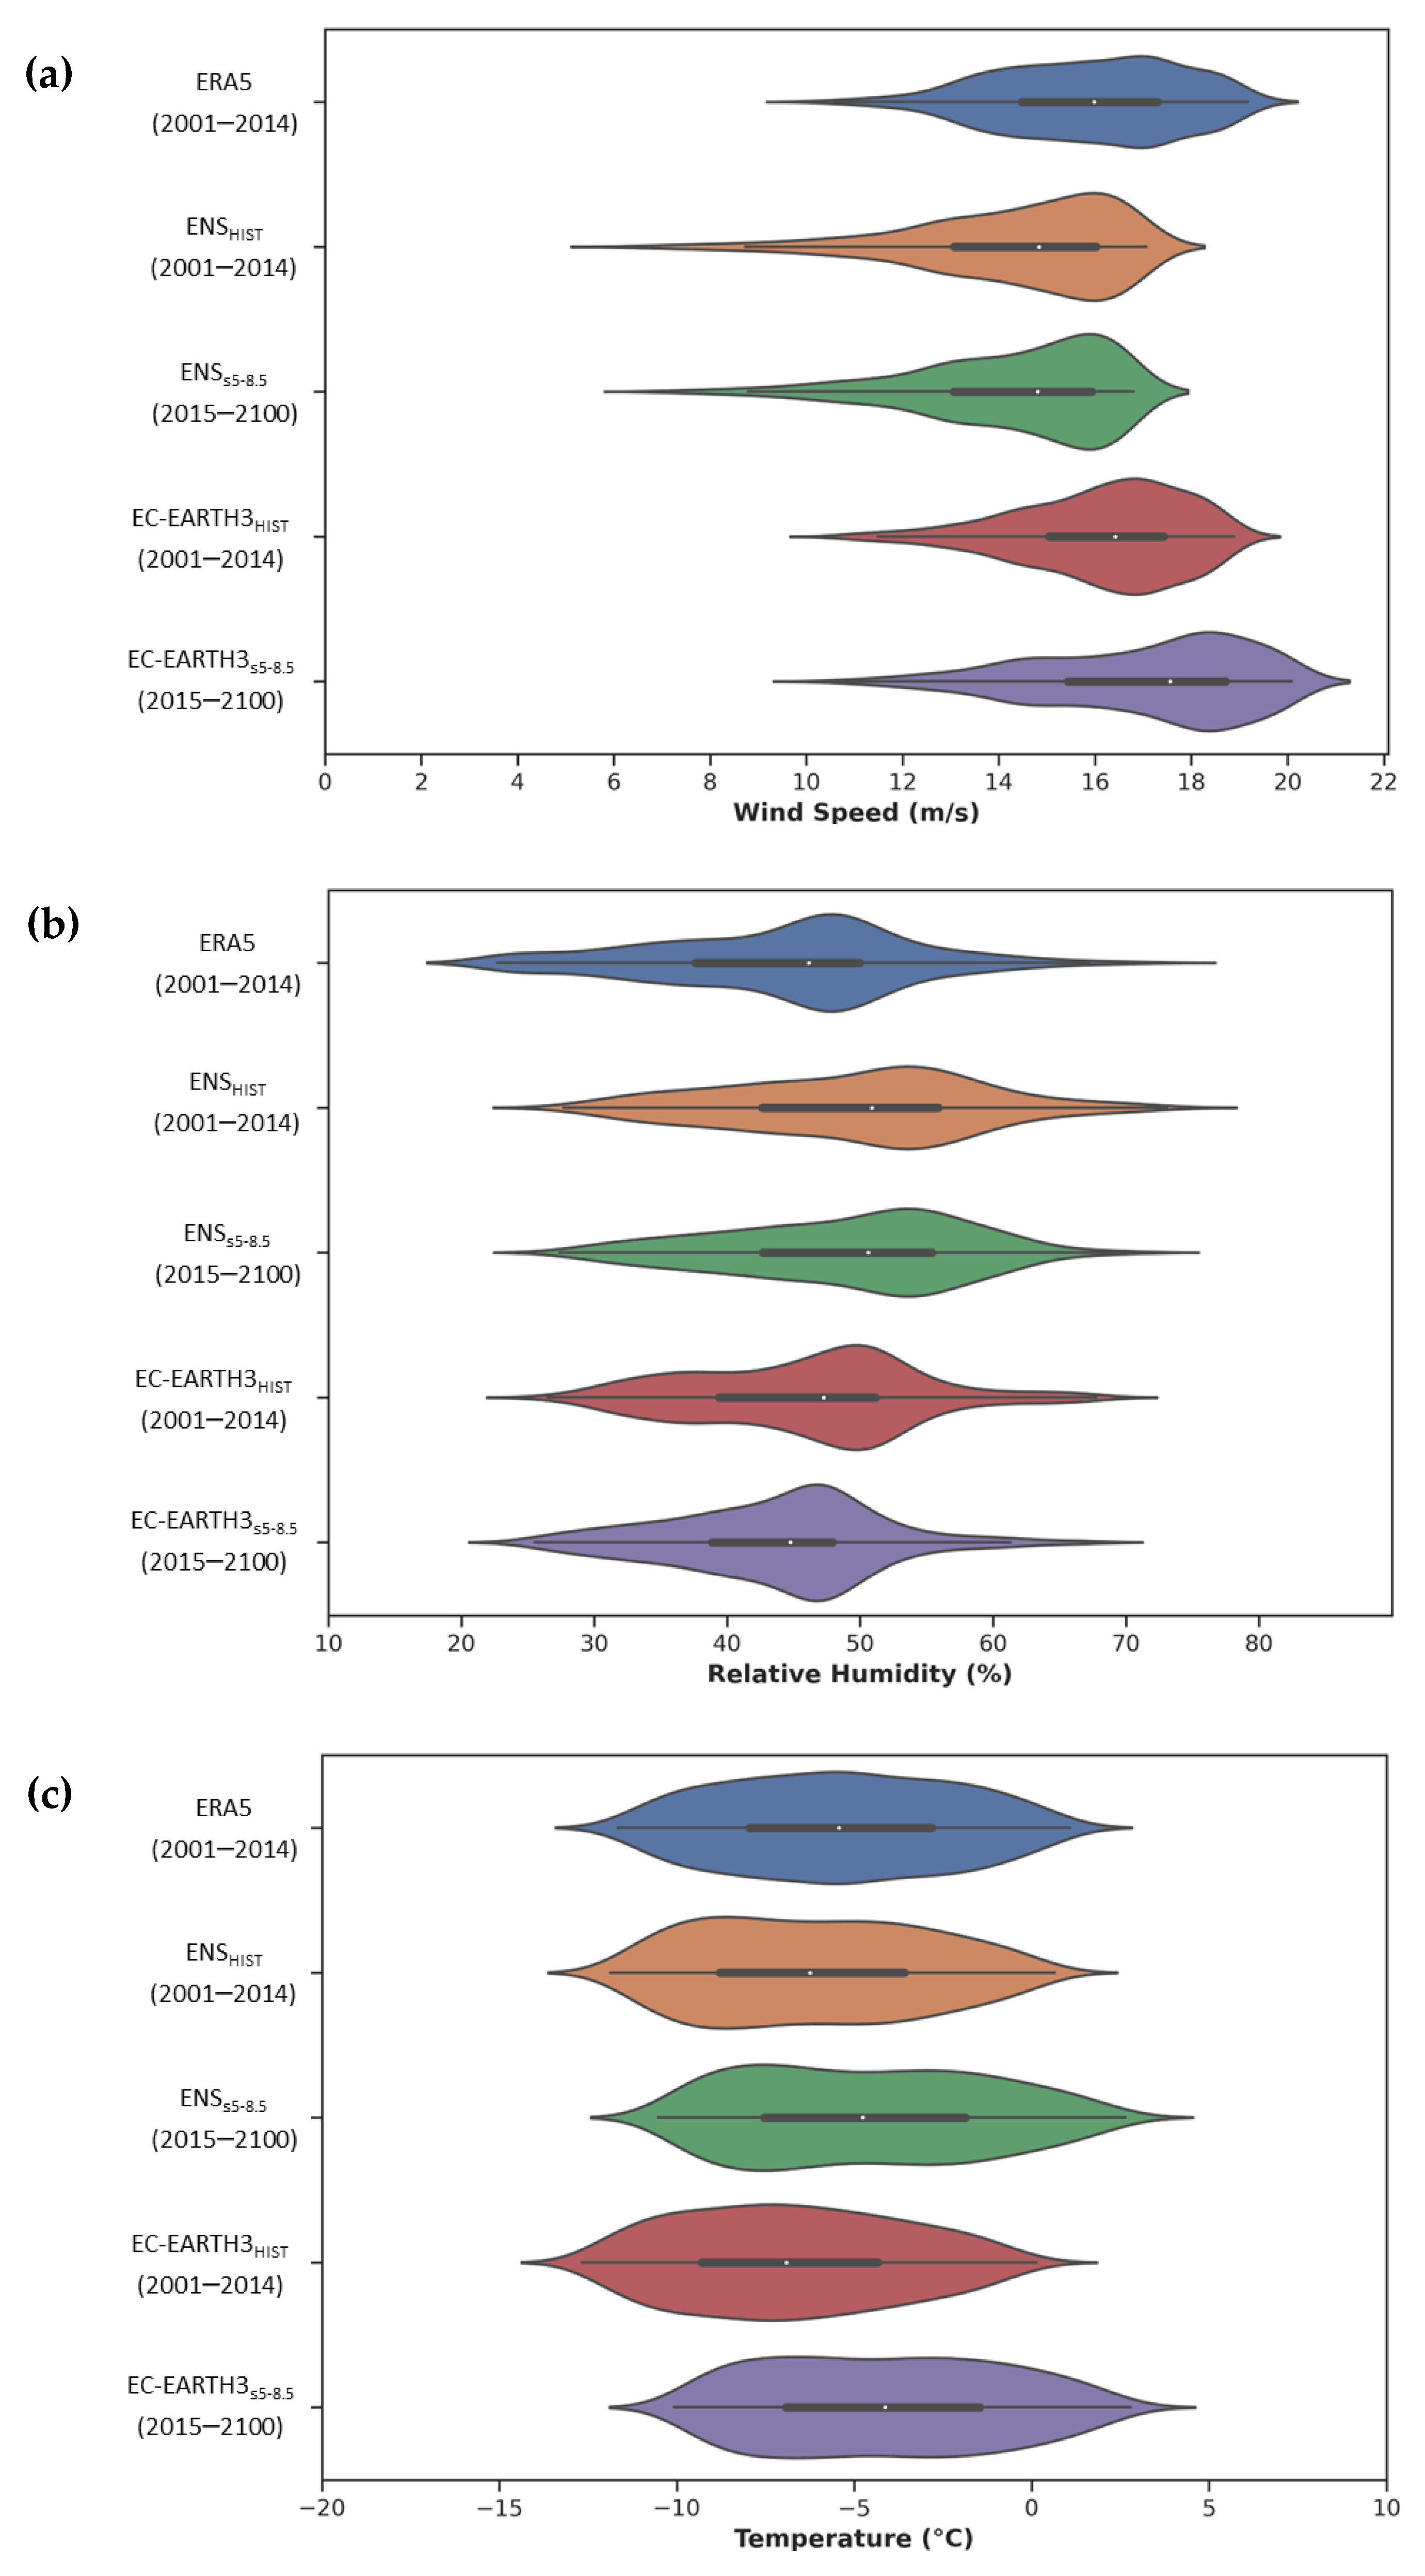
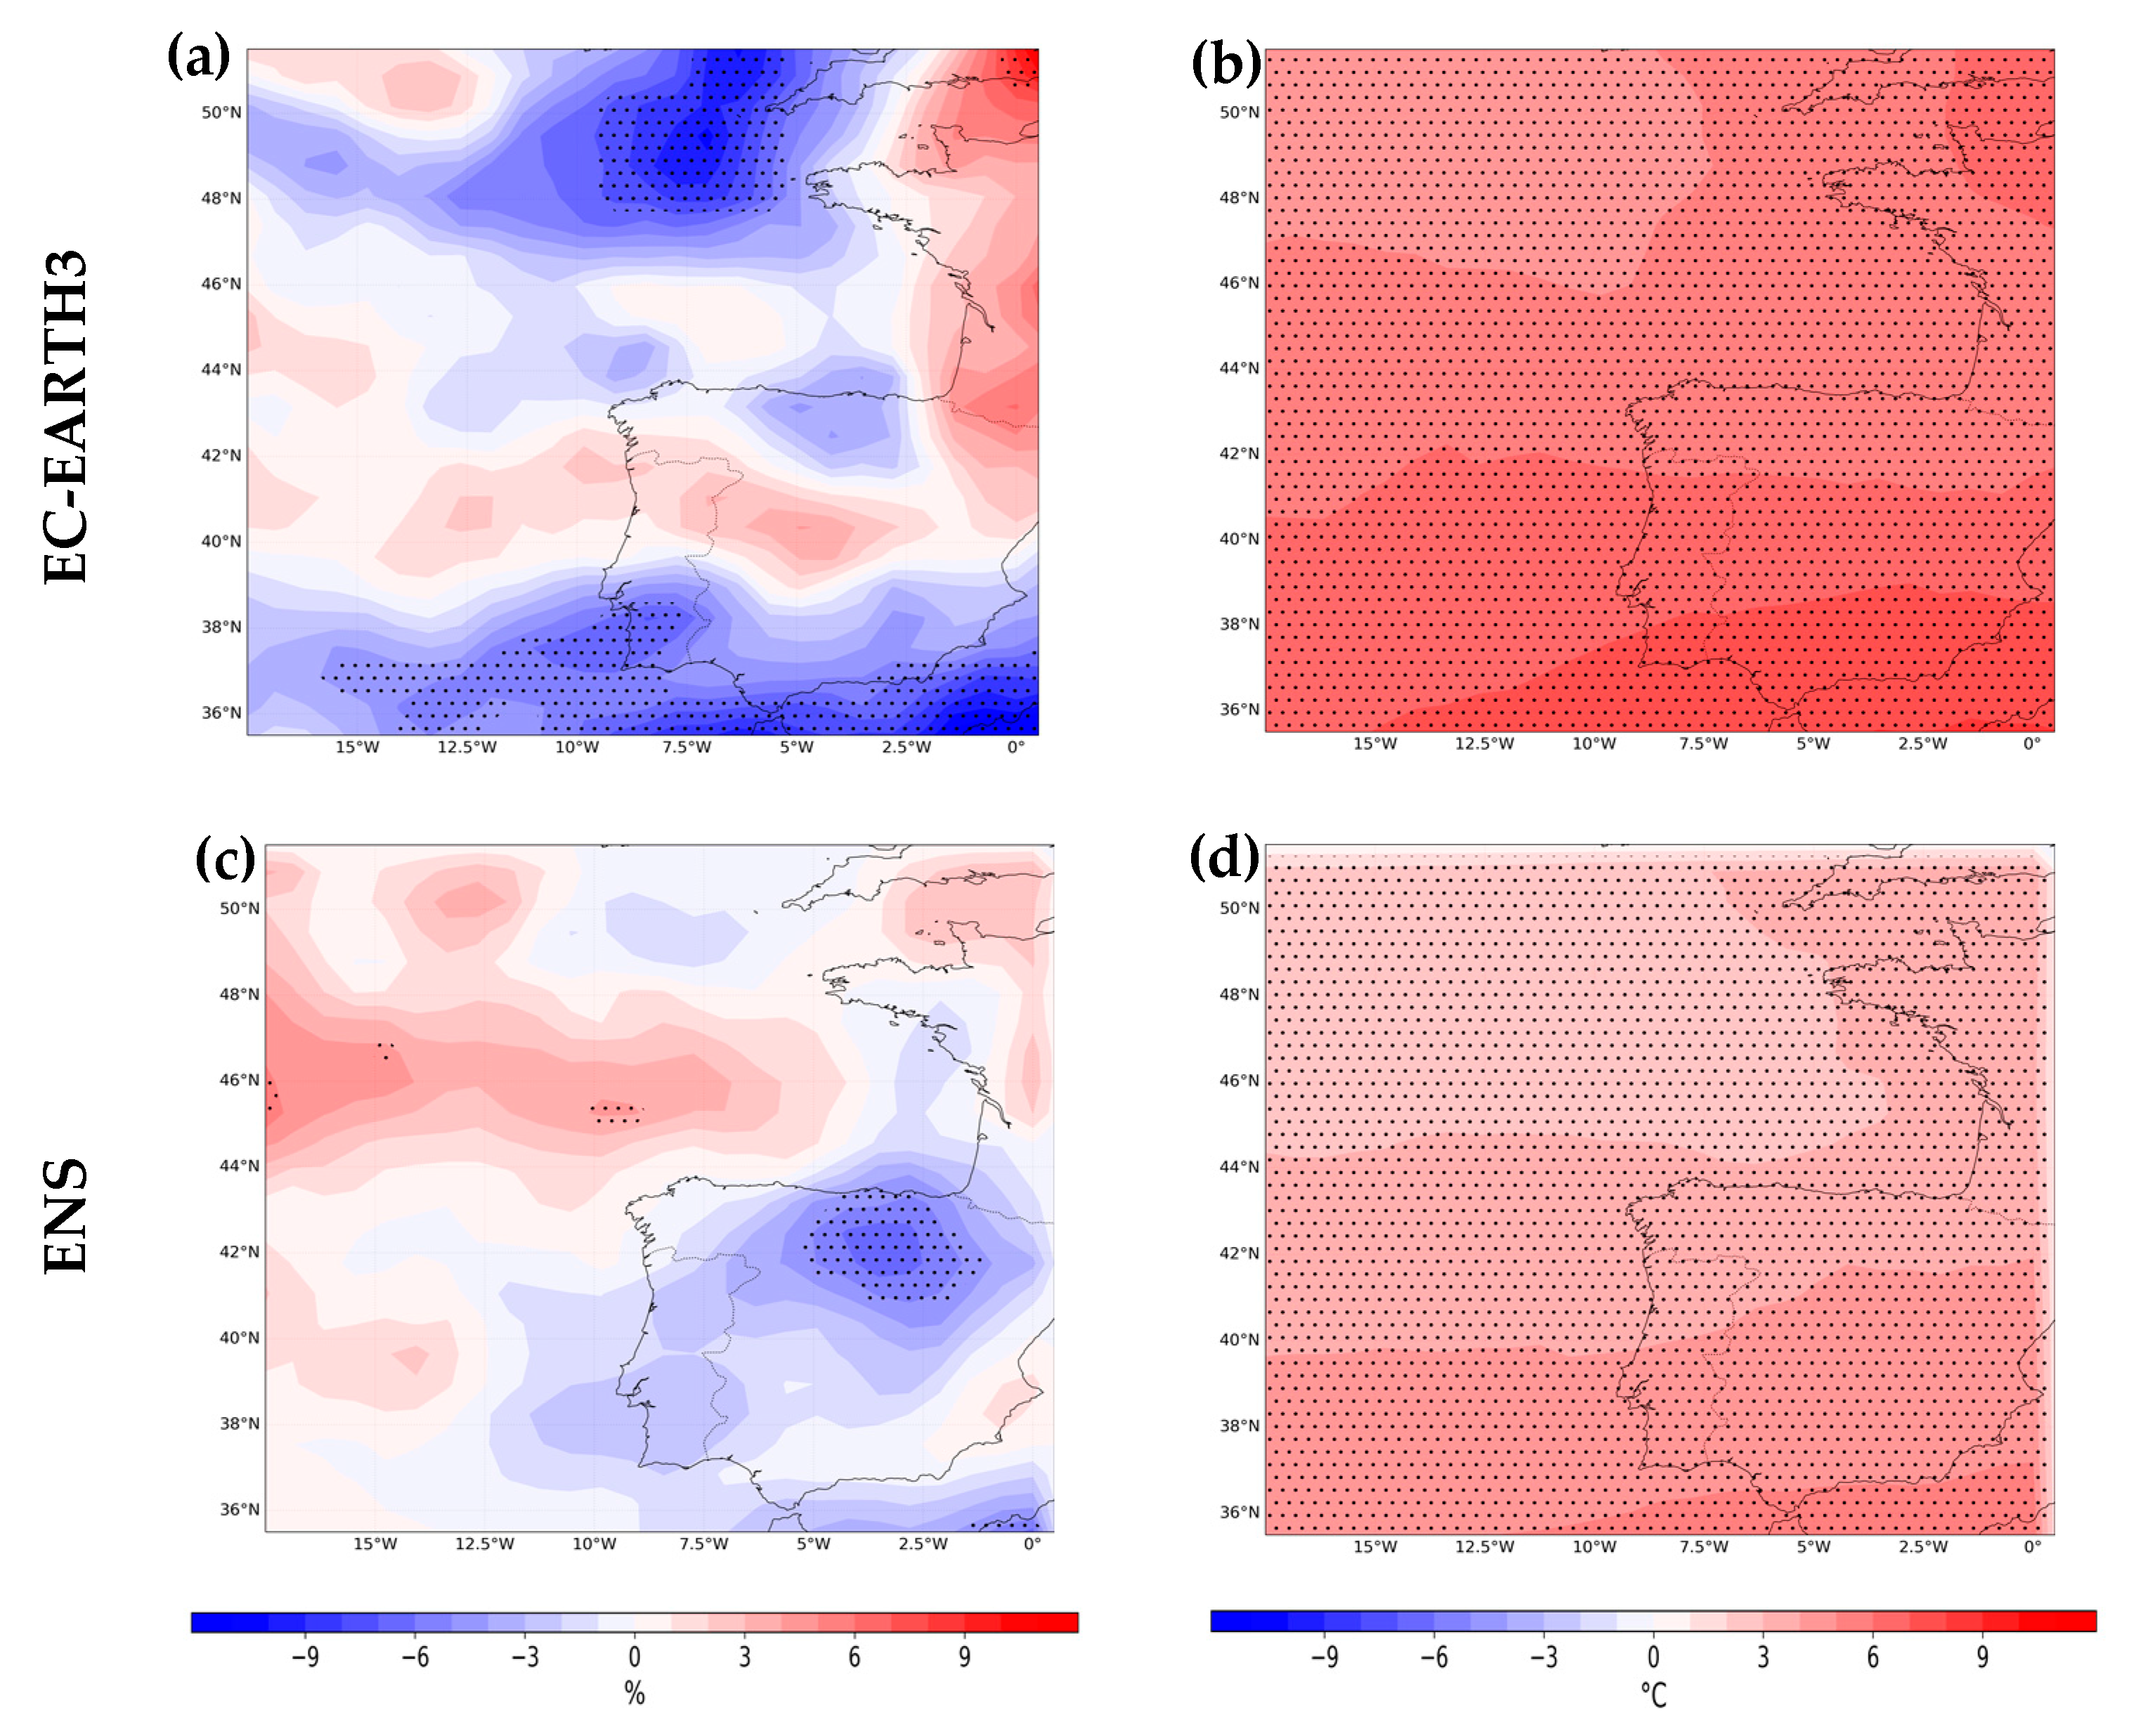
  • Wind rose distributions display a prevailing northwestern wind direction in all datasets, with statistically significant differences between them. The EC-EARTH3S5-8.5 wind speed is greater than the EC-EARTH3HIST wind speed. The relative humidity significantly differs among the EC-EARTH3 datasets, showing lower relative humidity for the EC-EARTH3S5-8.5. Otherwise, there are no significant differences between ENSHIST and ENSS5-8.5.
  • The EC-EARTH3 is the most adequate GCM for forecasting the future behavior of wave cloud precursor environments because the historical data for the selected atmospheric variables are closer to the reference data (ERA5). Moreover, there are statistically significant differences between EC-EARTH3HIST and EC-EARTH3S5-8.5 in all variables studied, contrary to the other GCMs and the ENS.
  • Icing precursor environments connected with mountain lee wave clouds at 700 hPa in the study domain are expected to decrease in the future, since the temperature median value in EC-EARTH3S5-8.5 is 2.8 °C higher than in EC-EARTH3HIST.
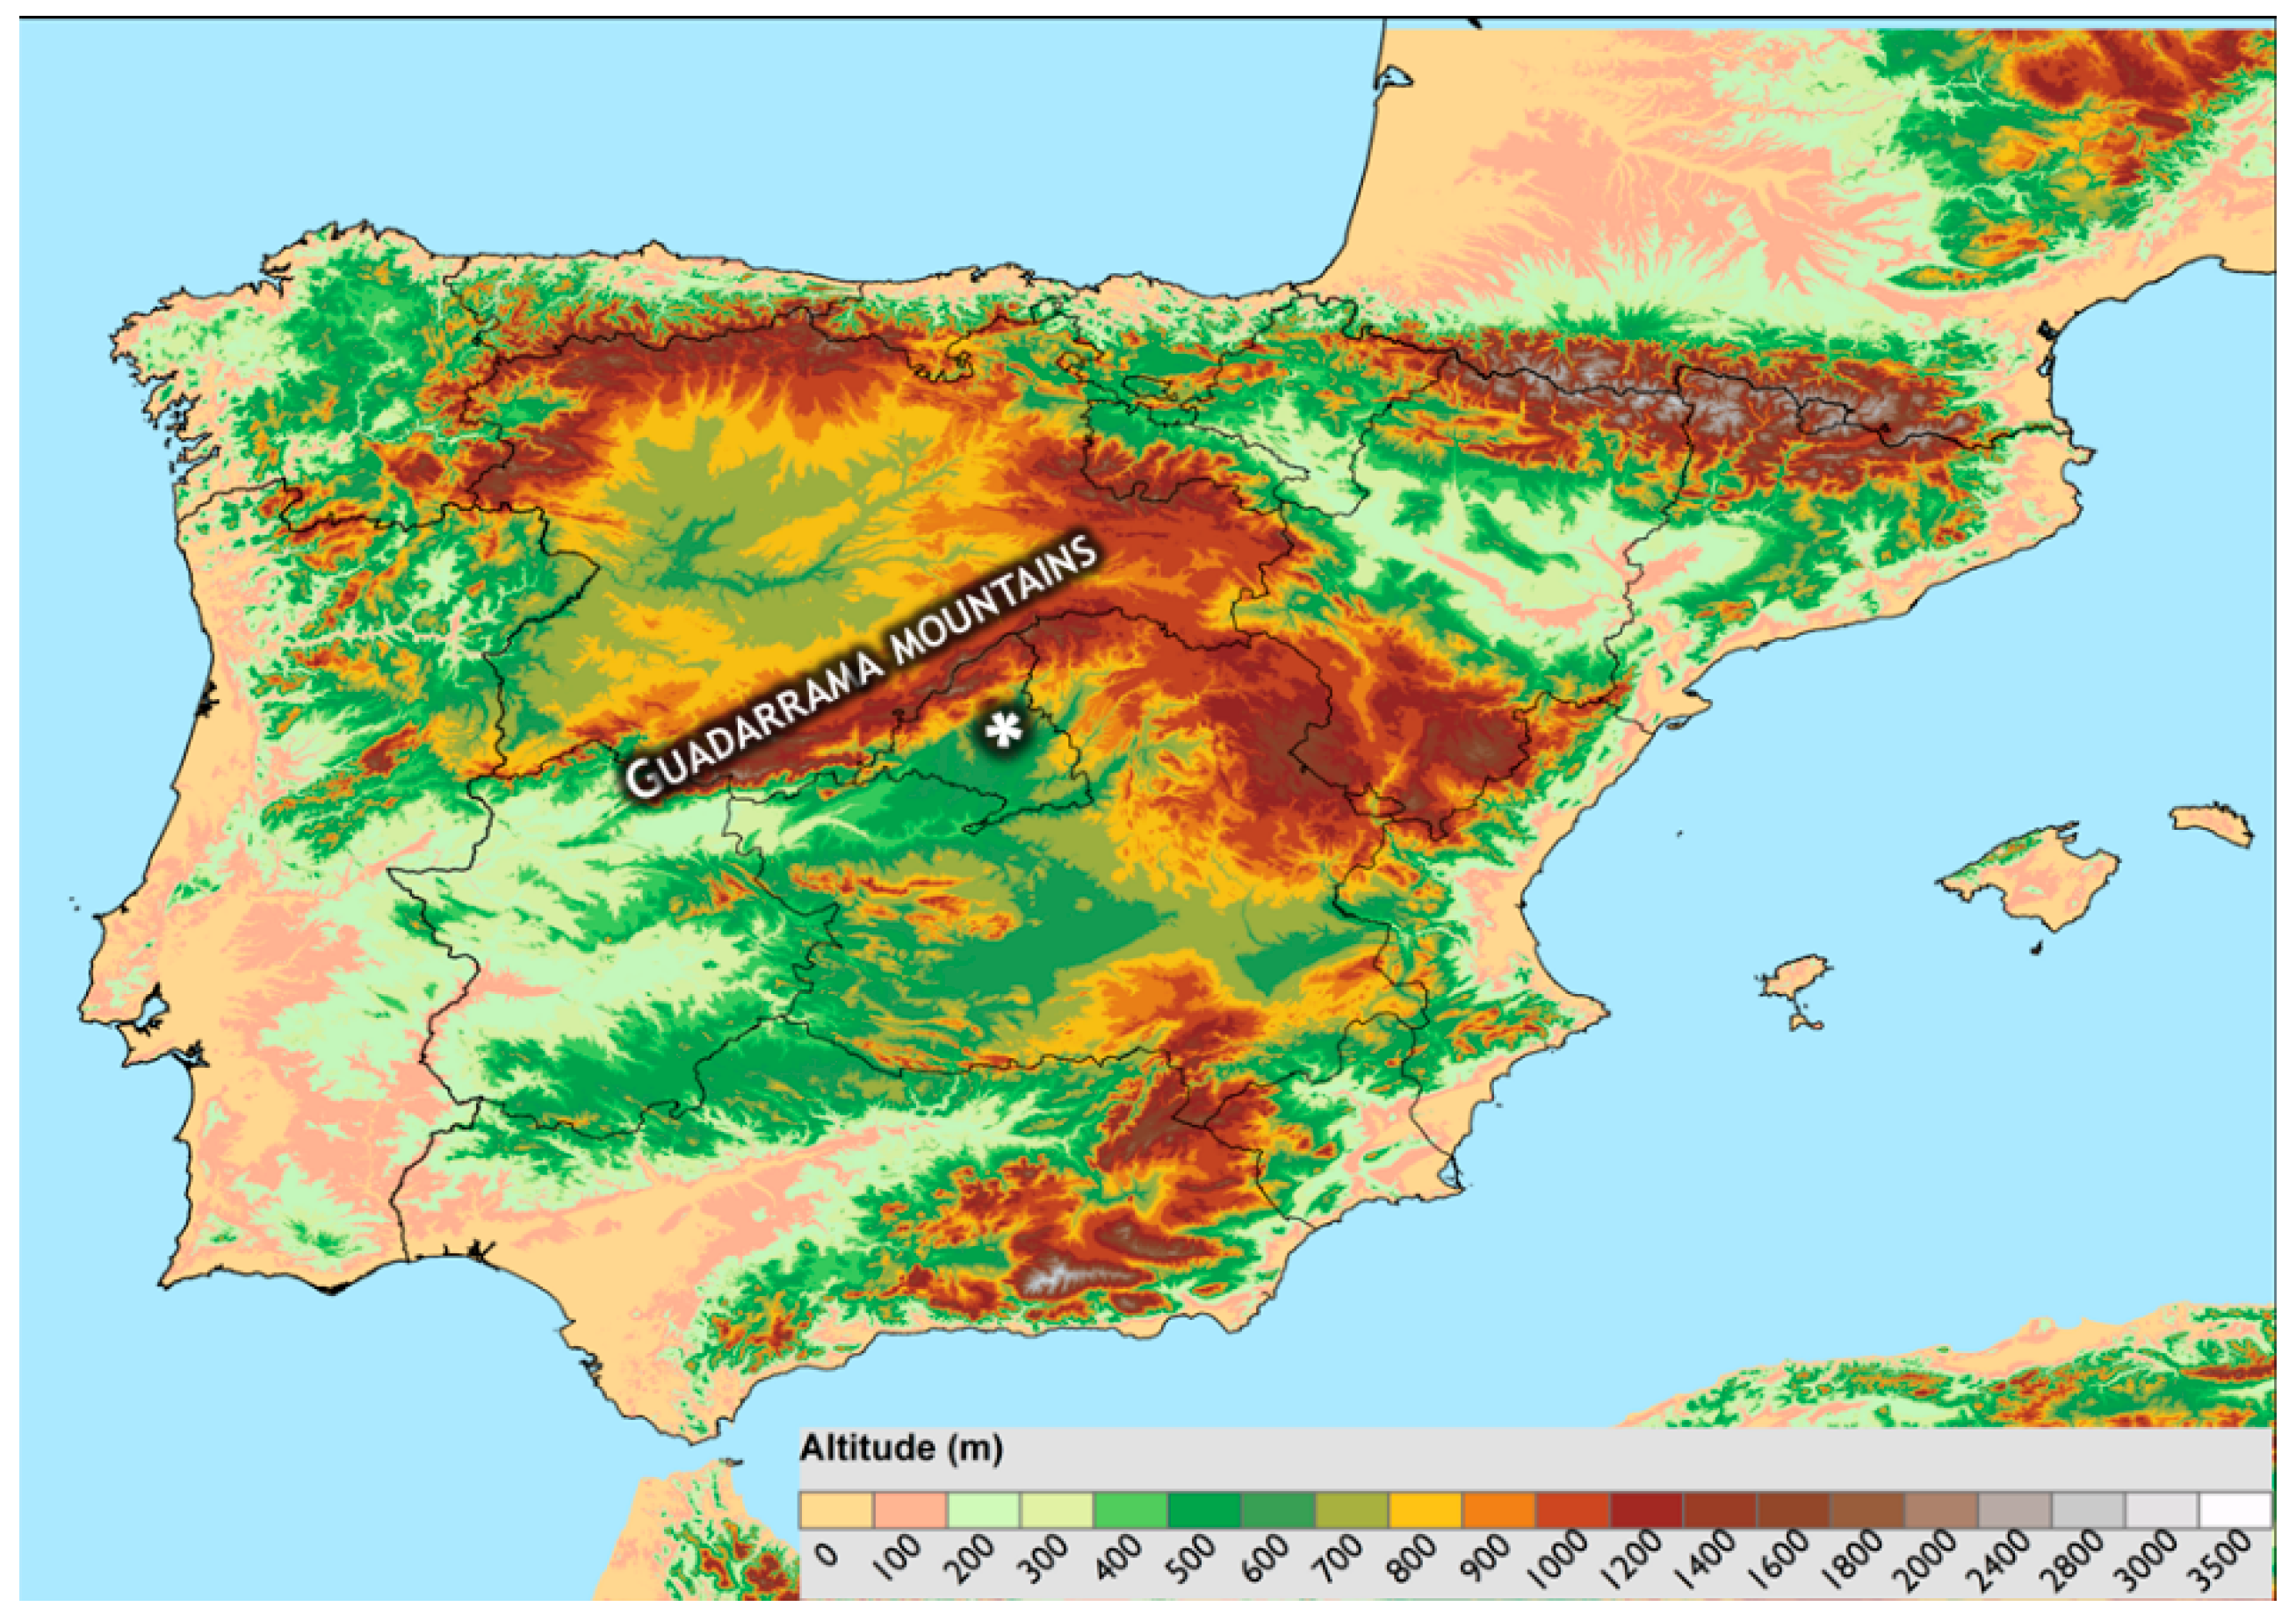
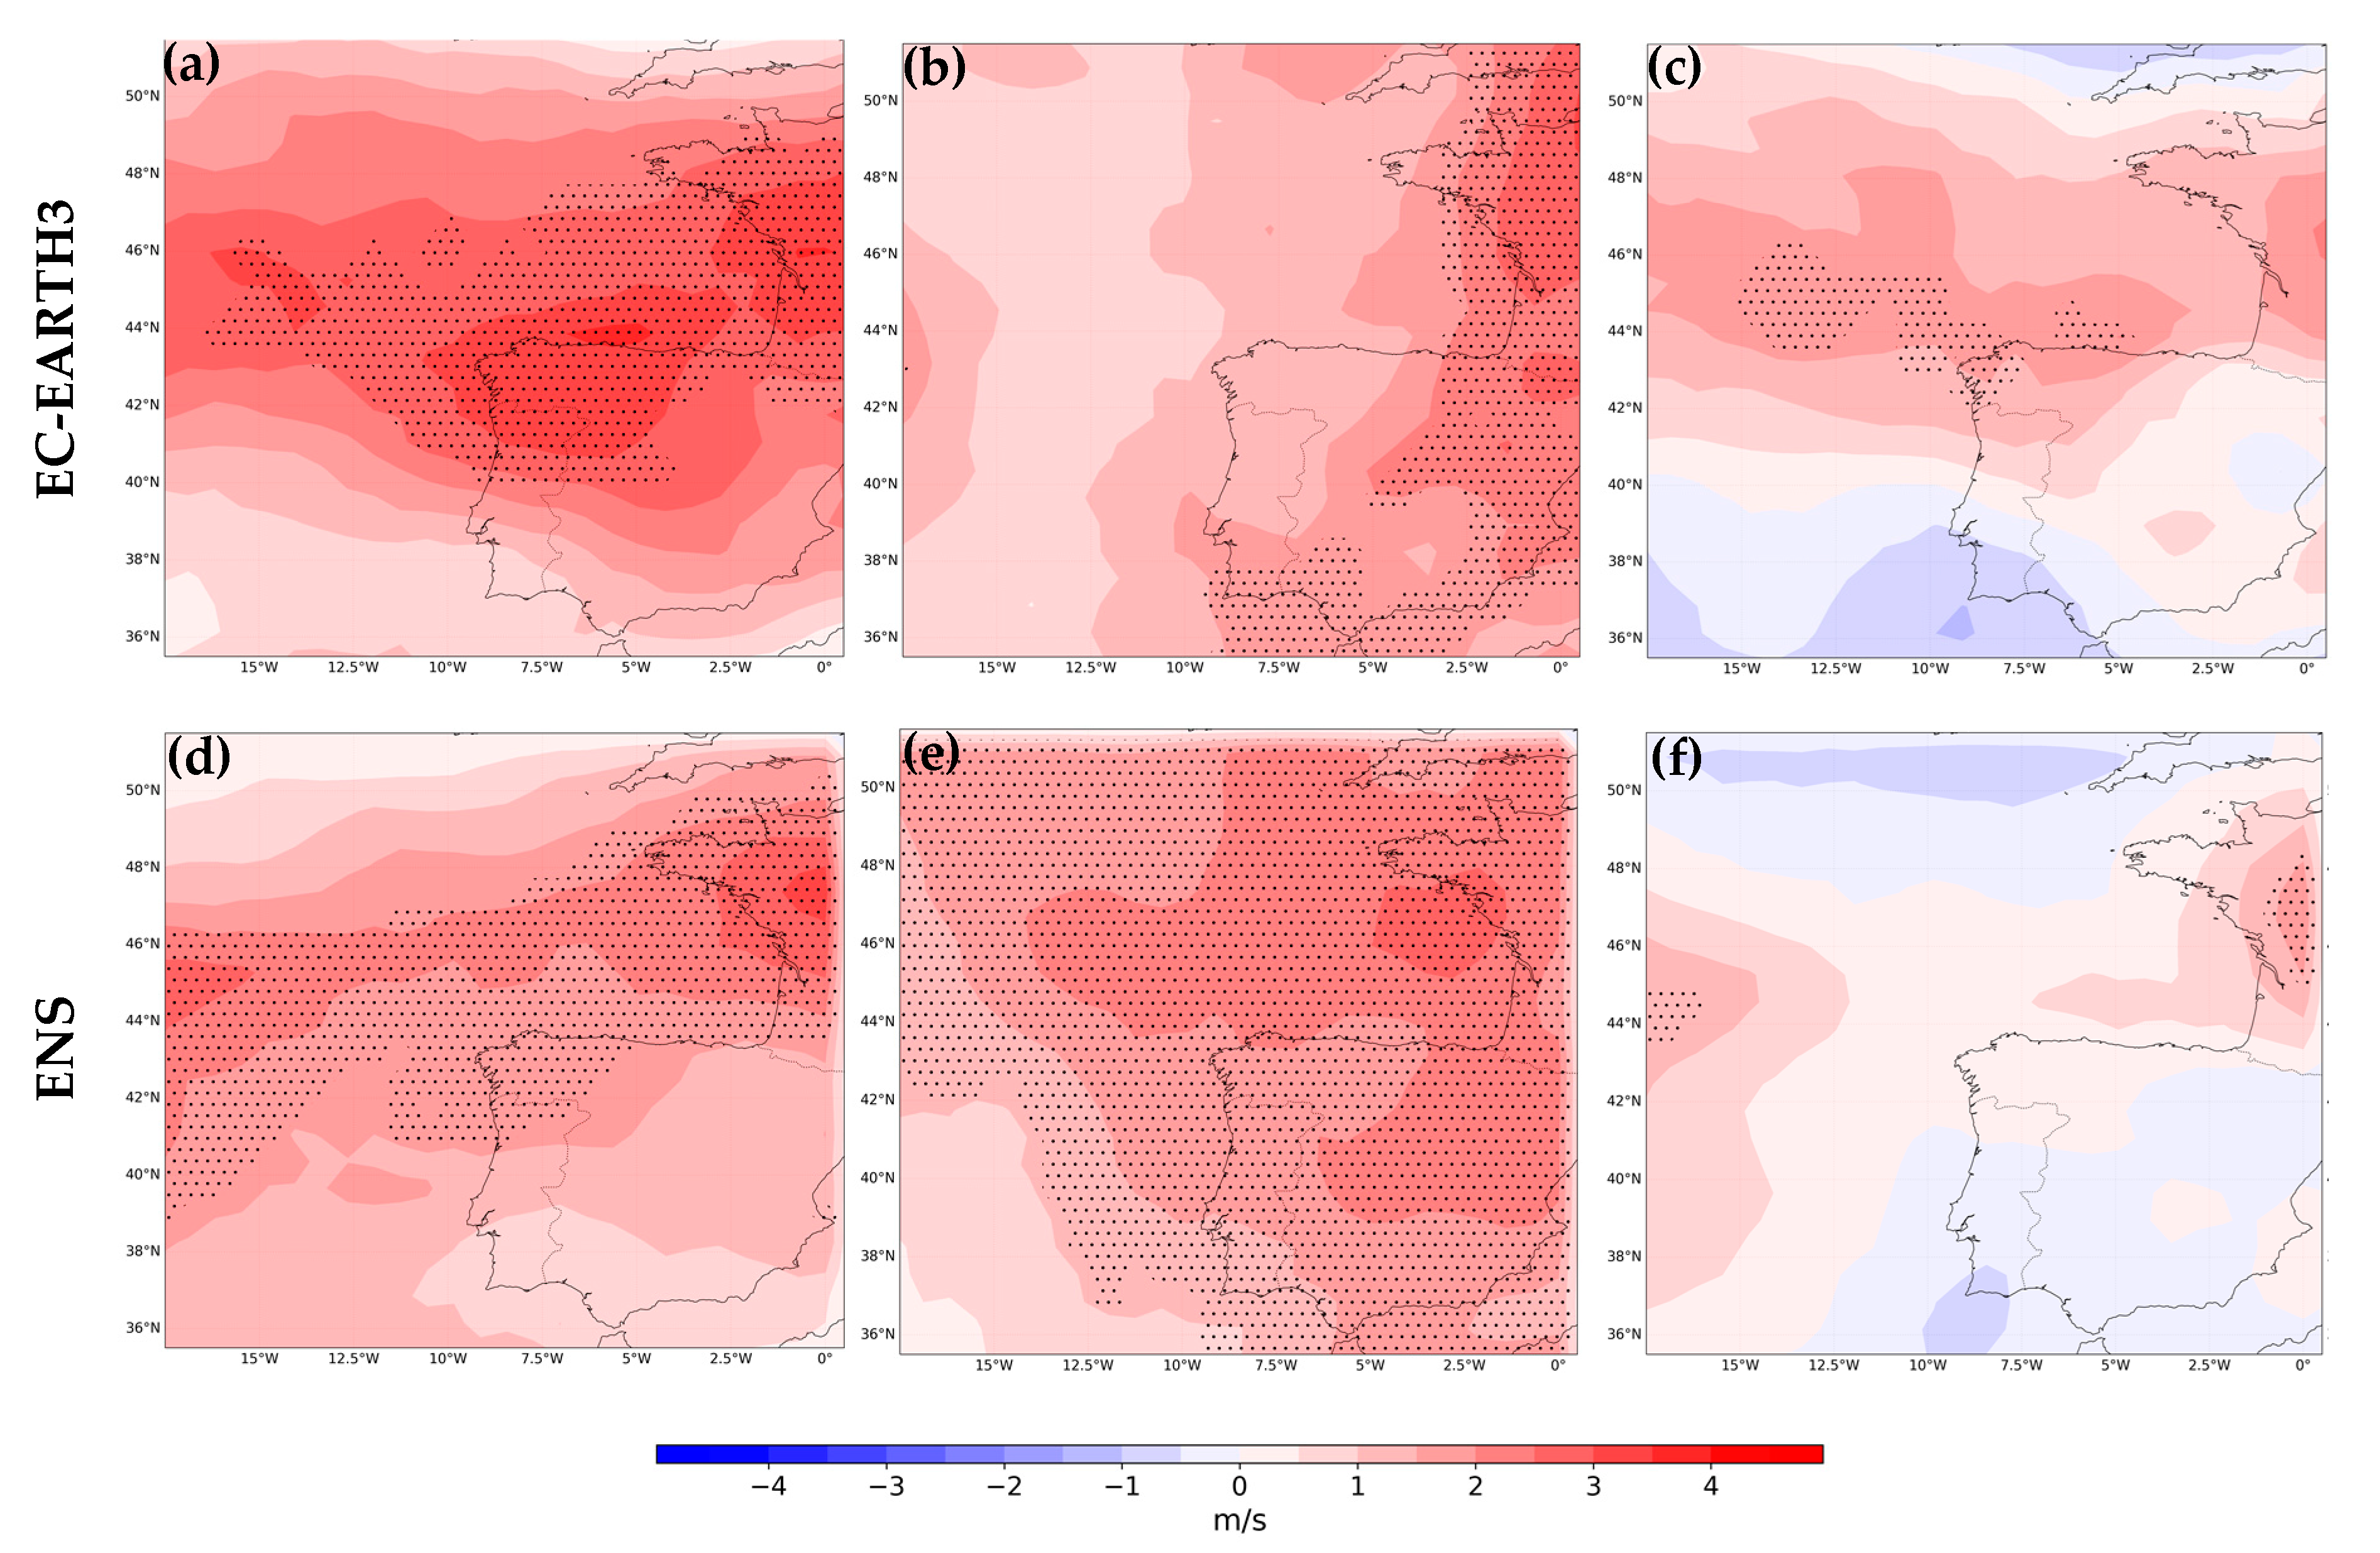
  • According to geopotential height composites and other relevant climate studies, zonal wind trends show a significant increasing tendency (over 4 m/s) windward of the Guadarrama mountain range under the predominant wind direction.
Although an increase in zonal winds may result in fewer wave events in the Guadarrama mountains, it is not enough to change the wind pattern (northwesterly winds) associated with the wave cloud precursor environments. Also, significant temperature rises will influence the icing precursor environments connected with mountain lee wave clouds, reducing the chance of aircraft icing situations. This research could be extended in the future to include additional mountain systems in the Iberian Peninsula, as well as the evaluation of other potential SSPs. Additionally, it can be helpful to improve the horizontal resolution of GCMs and incorporate other atmospheric variables involved in the formation of mountain lee wave clouds, such as atmospheric stability and liquid water content.

Author Contributions

Investigation, data curation, and writing—original draft preparation, J.D.-F. and C.C.-S.; supervision, writing—review and editing, funding acquisition, and conceptualization, M.L.M., P.B. and M.S.; investigation and data curation, J.J.G.-A. and J.I.F. All authors have read and agreed to the published version of the manuscript.

Funding

The work is funded by the Ministerio de Ciencia e Innovación of Spain, through the PID2019-105306RB-I00/AEI/10.13039/501100011033 project.

Institutional Review Board Statement

Not applicable.

Informed Consent Statement

Not applicable.

Data Availability Statement

Data are contained within the article.

Acknowledgments

Javier Díaz-Fernández thanks the Spanish Ministerio de Ciencia, Innovación y Universidades for granting a Margarita Salas contract from Complutense University of Madrid using Next Generation funding from the EU. Carlos Calvo-Sancho acknowledges the grant support from the Spanish Ministerio de Ciencia, Innovación y Universidades (FPI programs PRE2020-092343). Moreover, this research has been supported by the Ministerio de Ciencia e Innovación project PID2019-105306RB-I00/AEI/10.13039/501100011033 and the ECMWF Special Projects (SPESMART and SPESVALE). We thank the World Climate Research Programme, which coordinated and promoted CMIP6 through its Working Group on Coupled Modelling. We acknowledge the Earth System Grid Federation (ESGF) for conserving and publishing the CMIP6 GCMs dataset. We also acknowledge the ECMWF and the Copernicus Climate Change Service for providing and making available the ERA5 reanalysis data used in this study.

Conflicts of Interest

The authors declare no conflict of interest.

References

  1. Buck, R. Aircraft Icing Handbook; Safety Education and Publishing Unit: Hong Kong, 2000. [Google Scholar]
  2. Bolgiani, P.; Fernández-González, S.; Martin, M.L.; Valero, F.; Merino, A.; García-Ortega, E.; Sánchez, J.L. Analysis and numerical simulation of an aircraft icing episode near Adolfo Suárez Madrid-Barajas International Airport. Atmos. Res. 2018, 200, 60–69. [Google Scholar] [CrossRef]
  3. European Union Aviation Safety Agency. Annual Safety Review; European Union Aviation Safety Agency (EASA): Cologne, Germany, 2022. [Google Scholar] [CrossRef]
  4. Wallace, J.M.; Hobbs, P.V. Atmospheric Science: An Introductory Survey; Elsevier: Amsterdam, The Netherlands, 2006; Volume 92. [Google Scholar]
  5. Geresdi, I.; Rasmussen, R. Freezing drizzle formation in stably stratified layer clouds. Part II: The role of giant nuclei and aerosol particle size distribution and solubility. J. Atmos. Sci. 2005, 62, 2037–2057. [Google Scholar] [CrossRef]
  6. Moran, J.M. Meteorology: The Atmosphere and the Science of Weather, 5th ed.; Prentice-Hall: Hoboken, NJ, USA, 1996; ISBN 9780023838415. [Google Scholar]
  7. Gent, R.W.; Dart, N.P.; Cansdale, J.T. Aircraft icing. Philosophical Transactions of the Royal Society of London. Series A: Mathematical. Phys. Eng. Sci. 2000, 358, 2873–2911. [Google Scholar] [CrossRef]
  8. Lankford, T.T. Aircraft Icing: A Pilot’s Guide; McGraw Hill Professional: New York, NY, USA, 2000. [Google Scholar]
  9. Whiteman, C.D. Mountain Meteorology: Fundamentals and Applications; Oxford University Press: Oxford, UK, 2000. [Google Scholar]
  10. Lin, Y.L. Mesoscale Dynamics; Cambridge University Press: Cambridge, UK, 2007; Volume 630. [Google Scholar]
  11. Scorer, R.S. Theory of waves in the lee of mountains. Q. J. R. Meteorol. Soc. 1949, 75, 41–56. [Google Scholar] [CrossRef]
  12. Nína, G.P.; Jón Kristjánsson, E.; Ólafsson, H. The effect of upstream wind direction on atmospheric flow in the vicinity of a large mountain. Q. J. R. Meteorol. Soc. 2005, 131, 1113–1128. [Google Scholar]
  13. Díaz-Fernández, J.; Bolgiani, P.; Santos-Muñoz, D.; Sastre, M.; Valero, F.; Sebastián-Martín, L.I.; Martín, M.L. On the characterization of mountain waves and the development of a warning method for aviation safety using WRF forecast. Atmos. Res. 2021, 258, 105620. [Google Scholar] [CrossRef]
  14. Broutman, D.; Rottman, J.W.; Eckermann, S.D. A hybrid method for wave propagation from a localized source, with application to mountain waves. Q. J. R. Meteorol. Soc. 2001, 127, 129–146. [Google Scholar] [CrossRef]
  15. Smith, R.B.; Skubis, S.; Doyle, J.D.; Broad, A.S.; Kiemle, C.; Volkert, H. Mountain waves over Mont Blanc: Influence of a stagnant boundary layer. J. Atmos. Sci. 2002, 59, 2073–2092. [Google Scholar] [CrossRef]
  16. Díaz-Fernández, J.; Bolgiani, P.; Santos-Muñoz, D.; Quitián-Hernández, L.; Sastre, M.; Valero, F.; Martín, M. Comparison of the WRF and HARMONIE models ability for mountain wave warnings. Atmos. Res. 2022, 265, 105890. [Google Scholar] [CrossRef]
  17. Meehl, G.A.; Covey, C.; McAvaney, B.; Latif, M.; Stouffer, R.J. Overview of the coupled model intercomparison project. Bull. Am. Meteorol. Soc. 2005, 86, 89–93. [Google Scholar]
  18. Eyring, V.; Bony, S.; Meehl, G.A.; Senior, C.; Stevens, B.; Stouffer, R.J.; Taylor, K.E. Overview of the Coupled Model Intercomparison Project Phase 6 (CMIP6) experimental design and organisation. Geosci. Model Dev. Discuss. 2015, 8. [Google Scholar] [CrossRef]
  19. Koenigk, T.; Brodeau, L.; Graversen, R.G.; Karlsson, J.; Svensson, G.; Tjernström, M.; Wyser, K. Arctic climate change in 21st century CMIP5 simulations with EC-Earth. Clim. Dyn. 2013, 40, 2719–2743. [Google Scholar] [CrossRef]
  20. Almazroui, M.; Saeed, F.; Saeed, S.; Nazrul Islam, M.; Ismail, M.; Klutse, N.A.B.; Siddiqui, M.H. Projected change in temperature and precipitation over Africa from CMIP6. Earth Syst. Environ. 2020, 4, 455–475. [Google Scholar] [CrossRef]
  21. Long, S.M.; Hu, K.M.; Li, G. Surface Temperature Changes Projected by FGOALS Models under Low Warming Scenarios in CMIP5 and CMIP6. Adv. Atmos. Sci. 2021, 38, 203–220. [Google Scholar] [CrossRef]
  22. Carvalho, D.; Rocha, A.; Costoya, X.; DeCastro, M.; Gómez-Gesteira, M. Wind energy resource over Europe under CMIP6 future climate projections: What changes from CMIP5 to CMIP6. Renew. Sustain. Energy Rev. 2021, 151, 111594. [Google Scholar] [CrossRef]
  23. Bengtsson, L.; Andrae, U.; Aspelien, T.; Batrak, Y.; Calvo, J.; de Rooy, W.; Køltzow, M.Ø. The HARMONIE–AROME model configuration in the ALADIN–HIRLAM NWP system. Mon. Weather. Rev. 2017, 145, 1919–1935. [Google Scholar] [CrossRef]
  24. Skamarock, W.C.; Klemp, J.B. A time-split nonhydrostatic atmospheric model for weather research and forecasting applications. J. Comput. Phys. 2008, 227, 3465–3485. [Google Scholar] [CrossRef]
  25. Hersbach, H.; Bell, B.; Berrisford, P.; Hirahara, S.; Horányi, A.; Muñoz-Sabater, J.; Thépaut, J.N. The ERA5 global reanalysis. Q. J. R. Meteorol. Soc. 2020, 146, 1999–2049. [Google Scholar] [CrossRef]
  26. Díaz-Fernández, J.; Quitián-Hernández, L.; Bolgiani, P.; Santos-Muñoz, D.; García Gago, Á.; Fernández-González, S.; Martín, M.L. Mountain waves analysis in the vicinity of the Madrid-Barajas airport using the WRF model. Adv. Meteorol. 2020, 2020, 8871546. [Google Scholar] [CrossRef]
  27. Döscher, R.; Acosta, M.; Alessandri, A.; Anthoni, P.; Arsouze, T.; Bergman, T.; Zhang, Q. The EC-Earth3 earth system model for the coupled model intercomparison project 6. Geosci. Model Dev. 2022, 15, 2973–3020. [Google Scholar] [CrossRef]
  28. Mauritsen, T.; Bader, J.; Becker, T.; Behrens, J.; Bittner, M.; Brokopf, R.; Roeckner, E. Developments in the MPI-M Earth System Model version 1.2 (MPI-ESM1. 2) and its response to increasing CO2. J. Adv. Model. Earth Syst. 2019, 11, 998–1038. [Google Scholar] [CrossRef]
  29. Yukimoto, S.; Kawai, H.; Koshiro, T.; Oshima, N.; Yoshida, K.; Urakawa, S.; Ishii, M. The Meteorological Research Institute Earth System Model version 2.0, MRI-ESM2. 0: Description and basic evaluation of the physical component. J. Meteorol. Soc. Jpn. 2019, 97, 931–965. [Google Scholar] [CrossRef]
  30. Jungclaus, J.H.; Fischer, N.; Haak, H.; Lohmann, K.; Marotzke, J.; Matei, D.; Von Storch, J.S. Characteristics of the ocean simulations in the Max Planck Institute Ocean Model (MPIOM) the ocean component of the MPI-Earth system model. J. Adv. Model. Earth Syst. 2013, 5, 422–446. [Google Scholar] [CrossRef]
  31. Notz, D.; Haumann, F.A.; Haak, H.; Jungclaus, J.H.; Marotzke, J. Arctic sea-ice evolution as modeled by Max Planck Institute for Meteorology’s Earth system model. J. Adv. Model. Earth Syst. 2013, 5, 173–194. [Google Scholar] [CrossRef]
  32. Stevens, B.; Giorgetta, M.; Esch, M.; Mauritsen, T.; Crueger, T.; Rast, S.; Roeckner, E. Atmospheric component of the MPI-M Earth system model: ECHAM6. J. Adv. Model. Earth Syst. 2013, 5, 146–172. [Google Scholar] [CrossRef]
  33. Yoshimura, H.; Yukimoto, S. Development of a simple coupler (Scup) for earth system modeling. Pap. Meteorol. Geophys. 2008, 59, 19–29. [Google Scholar] [CrossRef]
  34. Fernández-González, S.; Sánchez, J.L.; Gascón, E.; López, L.; García-Ortega, E.; Merino, A. Weather features associated with aircraft icing conditions: A case study. Sci. World J. 2014, 2014, 279063. [Google Scholar] [CrossRef]
  35. Mann, H.B.; Whitney, D.R. On a test of whether one of two random variables is stochastically larger than the other. Ann. Math. Stat. 1947, 18, 50–60. [Google Scholar] [CrossRef]
  36. Mann, H.B. Non-parametric tests against trend. Econometrica 1945, 13, 245–259. [Google Scholar] [CrossRef]
  37. Kendall, M.G. Rank Correlation Methods; Charles Griffin: London, UK, 1948. [Google Scholar]
  38. Cresswell-Clay, N.; Ummenhofer, C.C.; Thatcher, D.L.; Wanamaker, A.D.; Denniston, R.F.; Asmerom, Y.; Polyak, V.J. Twentieth-century Azores High expansion unprecedented in the past 1,200 years. Nat. Geosci. 2022, 15, 548–553. [Google Scholar] [CrossRef]
  39. Pierce, D.W.; Barnett, T.P.; Santer, B.D.; Gleckler, P.J. Selecting global climate models for regional climate change studies. Proc. Natl. Acad. Sci. USA 2009, 106, 8441–8446. [Google Scholar] [CrossRef] [PubMed]
  40. Andrés-Martín, M.; Azorín-Molina, C.; Fernández-Álvarez, J.C.; Sheng, C.; Gimeno, L.; Vicente-Serrano, S.; Bedoya-Valestt, S.; Utrabo-Carazo, E. Projected near-surface wind speed changes over the Iberian Peninsula: Comparison of CMIP6 GCMS and a downscaled RCM using WRF. In Proceedings of the CLIVAR 2023: Towards and Integrated View of Climate, Madrid, Spain, 24–26 January 2023. [Google Scholar]
  41. Bolton, D. The computation of equivalent potential temperature. Mon. Weather. Rev. 1980, 108, 1046–1053. [Google Scholar] [CrossRef]
  42. Lawrence, M.G. The relationship between relative humidity and the dewpoint temperature in moist air: A simple conversion and applications. Bull. Am. Meteorol. Soc. 2005, 86, 225–234. [Google Scholar] [CrossRef]
  43. Koch, S.E.; O’Handley, C. Operational forecasting and detection of mesoscale gravity waves. Weather. Forecast. 1997, 12, 253–281. [Google Scholar] [CrossRef]
Figure 1. Orography of the Iberian Peninsula (m). White star indicates the Adolfo Suarez Madrid-Barajas Airport.
Atmosphere 15 00128 g001
Figure 2. The 500 hPa geopotential height (colored; dam) and 700 hPa geopotential height (blue contours; dam) composites for events with wave cloud precursor environments for (a) ERA5, (b) EC-EARTH3HIST, (c) EC-EARTH3S5-8.5, (e) MPI-ESM1.2-HRHIST, (f) MPI-ESM1.2-HRS5-8.5, (h) MRI-ESM2.0HIST, (i) MRI-ESM2.0S5-8.5, (k) ENSHIST and (l) ENSS5-8.5. 500 hPa geopotential height differences (S5-8.5—HIST) for (d) EC-EARTH3, (g) MPI-ESM1.2-HR, (j) MRI-ESM2.0, and (m) ENS. Star indicates the Guadarrama mountain range and Adolfo Suarez Madrid-Barajas Airport surroundings.
Atmosphere 15 00128 g002aAtmosphere 15 00128 g002b
Figure 3. Wind direction rose distribution and wind speed (colors) for events with wave cloud precursor environments for (a) ERA5, (b) ENSHIST, (c) ENSS5-8.5, (d) EC-EARTH3HIST, and (e) EC-EARTH3S5-8.5. Concentrical circumferences represent the percentage of occurrence.
Atmosphere 15 00128 g003aAtmosphere 15 00128 g003b
Figure 4. Violin plots for the five datasets (ERA5 = blue; ENSHIST = orange; ENSS5-8.5 = green; EC-EARTH3HIST = red; and EC-EARTH3S5-8.5 = purple) for (a) wind speed, (b) relative humidity, and (c) temperature. Median values are represented by white points.
Atmosphere 15 00128 g004
Figure 5. 100-year trend estimates (2001–2100) in events with wave cloud precursor environments for (a) zonal wind, (b) meridional wind, and (c) wind speed for EC-EARTH3; and (d) zonal wind, (e) meridional wind, and (f) wind speed for ENS. Black dotting denotes statistically significant trends (p < 0.05) according to Mann–Kendall trend test.
Atmosphere 15 00128 g005
Figure 6. As Figure 5, but for (a) relative humidity and (b) temperature for EC-EARTH3; and (c) relative humidity and (d) temperature for ENS.
Atmosphere 15 00128 g006
Table 1. Days with wave cloud precursor environments for each model and period.
HISTS5-8.5
ERA5116 (8/year)-
EC-EARTH3169 (12/year)942 (11/year)
MPI-ESM1.2-HR157 (11/year)927 (11/year)
MRI-ESM2.0112 (8/year)756 (9/year)
ENS146 (10/year)942 (11/year)
Disclaimer/Publisher’s Note: The statements, opinions and data contained in all publications are solely those of the individual author(s) and contributor(s) and not of MDPI and/or the editor(s). MDPI and/or the editor(s) disclaim responsibility for any injury to people or property resulting from any ideas, methods, instructions or products referred to in the content.

