
The Impact of Trees on the UHI Effect and Urban Environment Quality: A Case Study of a District in Pisa, Italy

Department of Energy, Systems, Territory and Constructions Engineering, University of Pisa, 56122 Pisa, Italy
*
Author to whom correspondence should be addressed.
Atmosphere 2024, 15(1), 123; https://doi.org/10.3390/atmos15010123
Submission received: 24 December 2023
/
Revised: 15 January 2024
/
Accepted: 17 January 2024
/
Published: 19 January 2024
(This article belongs to the Special Issue Urban Microclimate: Thermal Comfort, Air Quality and Green Building as Drivers of Healthy Urban Design)
Abstract
:As the urban heat island effect has become a worldwide phenomenon commonly affecting densely built-up areas, public administrations need efficient strategies to mitigate its impact on human well-being and public health. The aim of this study was to define a replicable method to estimate the ecosystem services provided by public street trees as a supporting tool in the decision-making process of urban greenery management. We compared three street arrangements characteristic of a residential district in Pisa, Italy: (1) with large trees, (2) with small trees, and (3) without trees. First, the software i-Tree Eco was used to assess the benefits of public trees located in the case-study area when provided with the three scenarios. Second, the comparison was held on the field, and we collected data with a wet bulb globe temperature meter in order to evaluate the differences in pedestrian thermal comfort among the street arrangements. The results confirmed the importance of urban vegetation, as it has major impacts on carbon sequestration and storage, pollution removal, air humidity and quality, and shade, given bigger trees and canopy sizes. The loss of ecosystem services compared to the presence of large trees varied between 40% and 50% (no trees) and 30% and 40% (small trees).
1. Introduction
Rapid urban expansion is accelerating the urban heat island (UHI) phenomenon, one of the main environmental impacts of urbanisation, directly affecting human health and the well-being of city dwellers, contributing to the worsening of environmental quality [1,2,3,4,5]. The UHI- and climate change-predicted effects may cause thermally stressful conditions and a critical barrier to walking activity in the urban environment (UE) [6]. In the meantime, avoidance behaviours, such as avoiding spaces without vegetation that can provide shade during the hottest hours of the day, can occur [7,8]. Different scales of street- and block-scale design factors also impact the physiological thermal comfort of pedestrians [9]. As a key strategy to address sustainable urban development, the UE has indicated and promoted the dissemination and application of nature-based solutions, such as the implementation of green infrastructures that can deliver a wide range of regulating ecosystem services [10,11,12]. Consequently, the outdoor thermal comfort of city inhabitants and visitors must be taken into account for sustainable urban planning [4] as an essential factor during the programming and design phase of city development [13,14].
Human thermal comfort is defined as the condition of the mind that expresses satisfaction with the thermal environment [14]. The assessment of human thermal comfort has been under development since the twentieth century, when the first models were developed, such as wet bulb globe temperature (WBGT) [15,16,17], which is widely used to evaluate the outdoor heat index [4,18,19]. Vegetative enhancement in the form of tree planting has been found to be a highly effective strategy for cooling urban environments and for increasing human thermal comfort, therefore, urban life quality [20,21]. The preservation of healthy trees and new plantings provide a multitude of ecosystem services in urbanised regions with the mitigation of the UHI effect [22,23,24]. It was demonstrated that most large cities are warming at double the rate of proximate rural areas, a trend which arises due to decreases in vegetation, increases in dark building materials, and rising heat emissions [25,26]. Therefore, heat waves, in combination with drought, are common and intrinsically linked. High temperatures increase evapotranspiration, resulting in more rapid soil drying and increased drought severity. These summer conditions have caused a well-documented increase in human mortality [27] and widespread tree mortality, especially in new plantings, due to the short-term effects of high-temperature stress on plant physiology [28,29,30]. These effects vary among species and within genotypes. The choice of tree species for city planting must be based on heat and drought stress tolerance, total air quality, air temperature reduction, shading/leaf area, stormwater control measurement, energy conservation, carbon storage, low allergenicity, low biogenic volatile organic compound emissions over leaf mass ratios, and long relative life spans [11,20,22,31,32,33]. Therefore, it becomes essential to preserve the woody vegetation present in the city and increase it with new plantations. At the same time, mature urban trees could also cause disservices, such as damage to structures and risk to human safety, due to a critical combination of tree defects and environmental factors [34]. However, this reason cannot be of greater importance than the benefits that trees provide, so it is necessary to maintain a balance between the benefits of risk reduction and the costs of that risk reduction, not only financially but also in terms of amenity loss (pines characterise the Italian landscape and are species tolerant to low water availability) and ecosystem impoverishment [35,36]. Another aspect is linked to the tree compensation rate (how many new trees are needed to compensate for the removal of healthy or hazardous trees), which needs to consider the future benefits provided by both the removed trees and newly planted trees [37]. This calculation cannot be based on simply the number of trees, especially if the size of the species is very different, so other parameters, such as the leaf area or the volume of the canopy at maturity, must be used [37]. Furthermore, the compensation site cannot be justified if new trees are planted outside the urban environment because this would cause the loss of some expected benefits [38].
The aim of this work was to estimate the tree ecosystem services provided in a residential neighbourhood of Pisa, Tuscany, Italy, on three different urban street arrangements: with large public trees, in the absence of trees (the replacement of felled trees outside the district), and the replacement of large trees with small trees. This was to provide results supporting the green management and preservation of big tree populations in the urban context over time.
2. Materials and Methods
After a preliminary phase focused on the identification of the case-study area features, the work was organised into two steps: the assessment of the benefits (i.e., carbon storage and sequestration, pollution removal, and rainfall interception capacity measured in terms of the difference between the volume of water absorbed by the land with and without vegetation, i.e., runoff avoidance) provided by public trees based on a green census provided by the Pisa municipality and calculated with i-Tree Eco, an open source tool from the USDA forest service based on the urban forest effect (UFORE) model [39], and the evaluation of heat stress at a local scale based on data collected on the field.
2.1. Case study: Porta a Lucca, Pisa
Pisa is the capital city of the Pisa province in Tuscany. Located at a mean altitude of 4 m above sea level, the city lies over an area of 185.18 km2. With approximately 89,000 inhabitants and a population density of approximately 482.26 inhabitants/km2 [40], Pisa is one of the most populated municipalities in Tuscany. The conformation of the territory is homogeneous due to its geomorphological features as an alluvial plain originating from the Arno River, bordered on the south-west of the Ligurian Sea and on the north-east of the mountainous relief of Monti Pisani (the Pisan mountains).
The weather in Pisa is characterised by a Mediterranean climate mainly influenced by two factors: the proximity to the sea, which tends to mitigate both winter cold and summer heat, and the continental nature of the Valdarno (a valley formed by the Arno River). The average annual maximum surface air temperature is 20.3 °C, and the annual rainfall is 879 mm; these values, calculated using a three-decade database (1991–2020), appear to have an increasing trend compared to previous decades, leading to a forecast of the growth of extreme events in the future, such as heat waves and heavy rainfall [41].
The case-study area was located in a residential district of Pisa named ‘Porta a Lucca’ (Figure 1a), characterised by public greenery (mainly represented by street trees) and valuable properties with private gardens located in a suburban area separating the historic centre from the surrounding rural regions.
The district covers an area of approximately 0.82 km2. The vegetation of Porta a Lucca, as reported in the green census provided by the Pisa municipality (completed in 2019), is mainly represented by trees located along the public avenues and, to a lesser extent, by school gardens and green areas resulting from recent urban renewals. Among a pool of 44 species recorded, the predominant one was represented by the Stone Pine (Pinus pinea L.), which is a population predominately planted in the 1970s [42]. Moreover, there are younger trees from other species with a high prevalence of Acer negundo, Acer campestre, Platanus × acerifolia, Tilia platyphyllos, and Morus alba.
Three street arrangement types were identified as representative of the case-study area:
- Street arrangement 1 (SA1), with large street trees, i.e., Stone pine (Pinus pinea L.);
- Street arrangement 2 (SA2), with small street trees, i.e., Privet sapling (Ligustrum lucidum);
- Street arrangement 3 (SA3), without street trees;
- Note that the presence (or absence) of trees in the definition of a street arrangement concerns only public-owned vegetation (i.e., trees along sidewalks or groups of trees in small parking areas next to the roads) since this study focuses on how urban green management can affect the microclimate, therefore excluding vegetation in private properties.
These patterns were studied in sections of four selected roads: Via Giovanni Pisano (V1) and Via Francesco Baracca (V2), Via Fratelli Rosselli (V3), and Via Ugo Rindi (V4) (Figure 1b).
The selection of roads was based on the following criteria: historical presence of lines of trees along the roads, at least since the 1970s [42]; orientation and position, in order to consider different exposures to wind and sunlight over a significant subsection of the area (V1 and V2 cross the area from the north to south, V3 cross the area from the east to west, and V4 borders the district on the historic centre from the east to west); traffic load, in order to define a sample of data including the main (V4), complementary (V1), and secondary (V2 and V3) roads (classification according to the Pisa traffic masterplan [43]). Furthermore, between 2016 and 2025, the Pisa green masterplan [44] scheduled the substitution of old trees in various areas of the city; changes have started and are still ongoing on selected roads, rendering them representative of the ongoing evolution in the Porta a Lucca district.
2.2. Assessment of Tree Benefits: Tools, Modeling Approach, and Data Input
In order to assess the benefits provided by trees, we identified eight parameters: carbon storage capacity (t), gross carbon sequestration capacity (t/yr), runoff avoidance (m3/yr), total pollution removal capacity (t/yr), and particular pollution removal capacity, i.e., O3, NO2, SO2, and PM2.5 (kg/yr). The analyses of these parameters were conducted on three scenarios with the purpose of observing the variation of tree benefits at different compositions of public tree populations:
- Scenario 0 (S0, Figure 2a): a prevalence of large trees, mainly represented by Stone pines;
- Scenario 1 (S1, Figure 2b): felling of 386 Stone pine trees on four roads (V1, V2, V3, and V4) and the replacement with trees outside of the Porta a Lucca district (reduction in the number of large trees and in the total number of trees in the area);
- Scenario 2 (S2, Figure 2c): felling of 386 Stone pine trees on the four roads and the replacement with a higher number of smaller trees, i.e., 471 Privet saplings (reduction in the number of large trees and increase in the total number of trees in the area).
The input data used in S0 were obtained from the green census provided by the Pisa municipality, which consisted of a geographical dataset of trees covering the urban territory. Significant information about the trees provided in the census included species, diameter at breast height (DBH), total height, and GPS location. The input data used in the remaining two scenarios were obtained by modifying the census database as mentioned above. The census represents the tree heritage of the city in 2019. In recent years, the Pisa municipality has started a green management policy that supports the felling and replacement of large old trees, either inside or outside the district. Therefore, S1 and S2 appear to be models capable of describing the effects of the evolving urban greenery setting.
The number of trees varied among the three scenarios from 1427 in S0 to 1043 in S1, ending in 1514 in S2.
The three scenarios were studied using i-Tree Eco. In order to set the environmental features of the case-study area, the software requires a historical series of meteorological data and information about the hourly concentration of pollutants to be defined. Although this information is stored in the open i-Tree database, data on the Italian territory are not constantly updated. Since new data has to be processed and validated by the USDA and considering the expected time of processing of approximately six months, we chose to use the most recent data available for Pisa, i.e., the meteorological and air quality information detected using the meteorological station Pisa San Giusto (managed by the Italian air force) in 2015.
The algorithm used in i-Tree Eco to assess ecosystem services was based on the relationship between biodiversity and ecosystem function according to a three-step workflow: (1) providing a data input with information on the physical tree population (i.e., the number and species of trees, tree size, location, leaf area, etc.); (2) processing the function (i.e., the gas exchange) of the structural data with the local weather data; (3) conversion of the function results into services (i.e., carbon storage, carbon sequestration, air pollution removal, and avoided runoff), based on other local data (i.e., pollution concentration) [45]. Detailed methods and equations are provided in Nowak [46].
2.3. Evaluation of Heat Stress: Tools, Modeling Approach, and Data Input
In order to evaluate the heat stress at a local scale, the wet bulb globe temperature (WBGT) was chosen as the index of pedestrian thermal comfort. On the one hand, this variable responds to determinant components of the outdoor climate, such as humidity, air temperature, sun radiation and wind, providing a comprehensive index of heat stress. On the other hand, it lacks in the assessment of evaporative cooling, a further element conditioning the heat stress. Considering that there are well-established limit values indicating when a risk for human health occurs, depending on different contexts and metabolic activities, the WGBT still represents a convenient index as long as measurement protocols are followed, such as standards defined by international and European community law EN ISO 7243:2017 [15,16].
We used a WBGT meter (model: ExTECH HT200 manufactured by GEASS srl) operating in the discrete data detection mode, activated by a single user along the selected roads, choosing at least three monitoring points to be representative of each distinct street arrangement type (Table 1): with large trees (Figure 3a), with small trees (Figure 3b), and without trees (Figure 3c).
The campaign of measurement was held one day per week in the summer of 2023 from July to September; the user of the WBGT meter walked at a slow pace from one monitoring point to the next and collected data during three timeslots: in the morning (from 9 to 10 a.m.), at midday (from 1 to 2 pm), and in the late afternoon (from 5 to 6 pm).
A monitoring point was considered suitable if its distance from private trees and buildings minimised interference with their cast shadows during the detection timeslots. In V2 and V3, the sidewalks had two kinds of covers: concrete paving covering all the surface, with trees planted in holes of minimal areas, or concrete paving next to trenches extending along the entire length of the sidewalk in which the trees were planted. In these two roads, the same number of monitoring points with the two types of sidewalk covers were selected to obtain an average value across different kinds of soil surfaces.
All monitoring points were positioned within an area that allowed a pedestrian to move from one point to the next and wait at each one for the required time for the instrument to stabilise. This allowed for approximately 1 h of walking to conclude the campaign without exceeding the timeslot.
The WBGT meter used on the field could detect the globe temperature (Tg), dry bulb temperature (Ta), and relative humidity (RH); these last two were used to calculate the wet bulb temperature (Tw). The WBGT in the outdoors with solar radiation, WBTG [°C], is calculated using the following equation:
WBGTO = 0.7 * Tw + 0.2 × Tg + 0.1 × Ta
The indoor and outdoor WBGT without solar radiation, WBTGI [°C], is calculated via the following equation:
WBGTI = 0.7 × Tw + 0.3 × Tg
The analyses of heat stress were conducted with the purpose of comparing the differences among the street arrangement types. Therefore, the average values of the parameters were calculated over the points representing the same street arrangement before calculating the WBGT for each type. The resulting values were compared with the maximums established with the EN ISO 7342:2017 [13,14].
The wind speeds and shadows cast by nearby buildings can affect the data detected using the WBGT meter. The campaign of measurement was conducted to avoid these interferences. A day was considered suitable for measurement if the forecast was for slow winds and sky cover varying inside a limited range (not exceeding two levels of cloud cover measured in okta) over the day.
An interval of seven days was assumed among the detection days to maximise the variation of daytime overnight between two consecutive days of measurement.
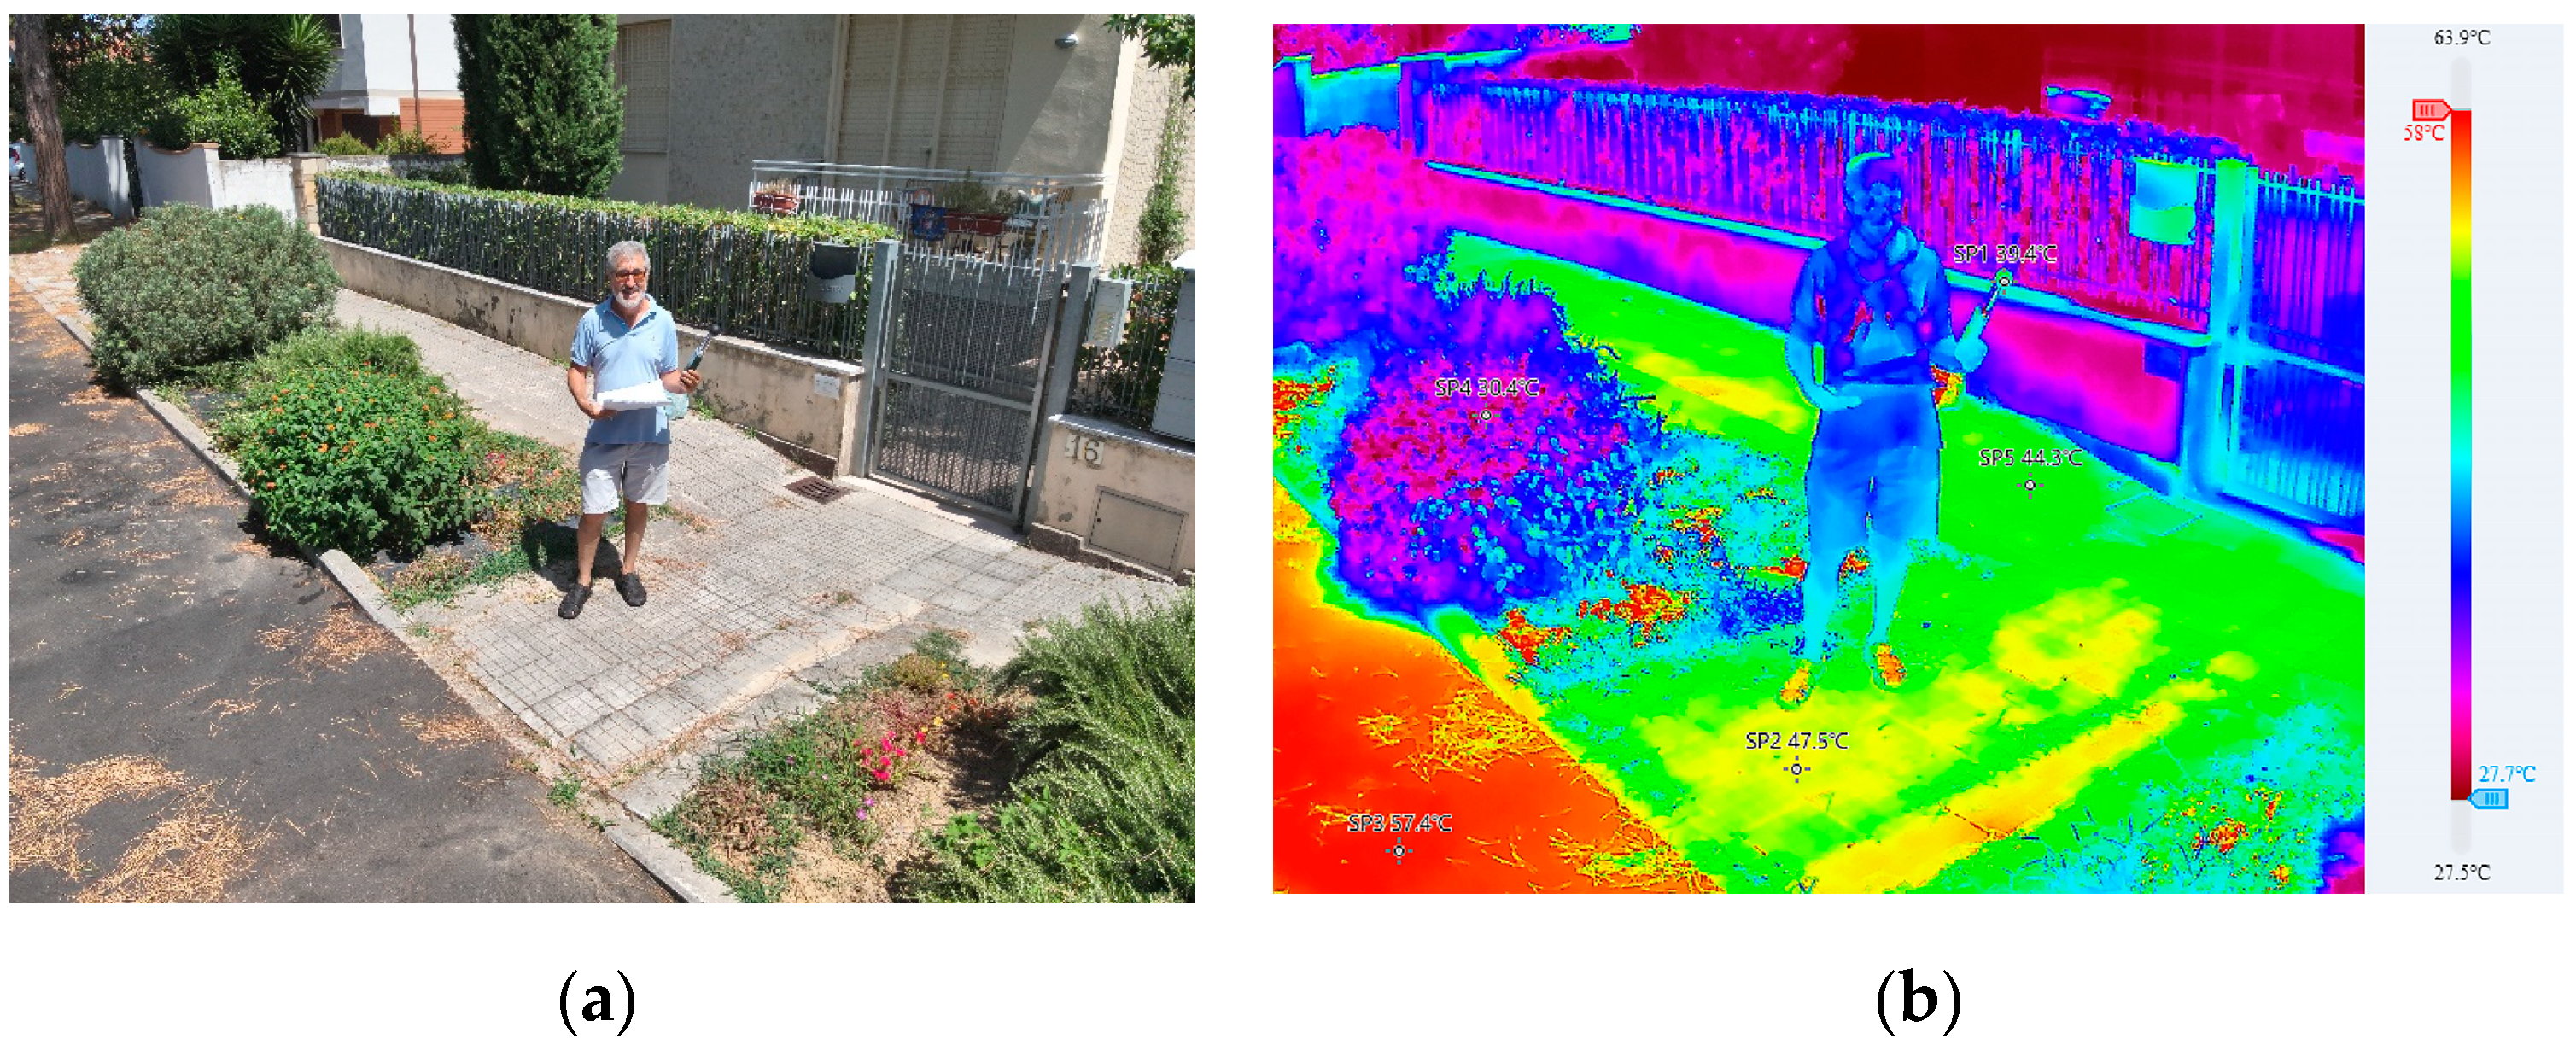
On July 26, in conjunction with the WBGT detection, a thermographic camera (model Mavic 3T, manufactured by DJI) was used to acquire thermal images in three monitoring points representing each street arrangement during the three timeslots. The results were used for a qualitative comparison of temperatures among the surfaces heated with different amounts of sun radiation. The calibration of thermal images was performed according to the international standard ASTM E2847-21 [47], using the following parameters: distance between the camera and the target, i.e., the globe of the WBGT meter; humidity, as detected with the WBGT meter; emissivity of the black globe of the WBGT meter (0.99); reflected temperature, corresponding to Ta detected with the WBGT meter.
A root mean square analysis was conducted over the collected data to ensure result consistency.
3. Results
The results of the assessment of tree benefits conducted with the i-Tree Eco tool are illustrated in the first part of this section, followed by the results of the heat stress analysis.
3.1. Assessment of Tree Benefits: Results of the Comparison among the Three Scenarios
The features of tree populations used to assess the tree benefits depending on different species were: leaf area, canopy cover, and carbon storage. The percentage changes among the three scenarios are shown in Table 2.
On the one hand, as predicted, the reduction in the number of trees in the S1 results demonstrated a loss of carbon storage capacity based on the reduction in leaf area and canopy cover. On the other hand, although the number of trees in S2 was higher than in the other scenarios, the increment due to the Privet saplings (small trees) was not enough to compensate for the felling of the Stone pines (big trees). In S2, there were 387 fewer Stone pines and 471 more Privet saplings than in S0, resulting in 87 trees more than the starting scenario. As shown in the table, the loss of carbon storage with small trees was 2.6% better than the one without trees, representing a loss of approximately 40% in S1 and S2 compared to the carbon storage provided in S0.
Similarly, the benefits measured in terms of avoided runoff, pollution removal, gross carbon sequestration, and CO2-equivalent sequestration appear to be decreased in S1 and S2, as shown in Table 3 and Table 4 for a more detailed analysis of pollutant removal.
The loss of benefits due to the increase in Privet sapling number (S2) was, on average, 10 percentage points lower than the loss in the case of felling with replacement trees outside the case-study area (S1), even though there was a common decrease in benefits compared to the scenario with large trees (S0), varying in a range between −20.7% (CO2-eq. sequestration) and −46.3% (PM2.5).
3.2. Evaluation of Heat Stress: Results
In Figure 4, there are the reported average values of dry bulb temperature (Ta) in the morning (a), at noon (b), and in the afternoon (c) over time.
In Figure 5, there are the reported average values of globe temperature (Tg) in the morning (a), at noon (b), and in the afternoon (c) over time.
Figure 6 shows the average values of wet bulb temperature (Tw) in the morning (a), at noon (b), and in the afternoon (c) over time.
As seen, the graphs have a similar trend: higher values were recorded near small trees (SA2) and without trees (SA3), and lower temperatures were recorded in proximity to the large trees. Also note that on August 31st, lower temperatures were recorded due to the worsening of the weather during the week.
According to the limits established by European community law [15,16], a non-acclimatised person walking at a slow pace (up to 2.5 km/h, such as common pedestrians) should not be exposed to a WGBT over 29 °C. Meanwhile, the limit corresponds to 30 °C for an acclimatised one. Exceeding values may correspond to a risk to human health. In Table 5, the calculated WGBT values are reported, highlighting, in a darker shade, the street arrangement approach (in yellow) or crossing the aforementioned limits (in orange and red, respectively). It is apparent how SA2 and SA3 are similar, both exceeding the critical values during the hotter days. Even though WGBT in SA1 also crossed the first threshold, the event was observed in fewer occurrences than in the other street arrangements. Moreover, the values near the large trees never reached the second threshold.
4. Discussion and Conclusions
This research demonstrates how counterproductive it is to cut down large, non-dangerous trees and replace them with small trees or compensate by planting them outside the urban area. All the considered ecosystem benefits are lost, and thus, the quality of life in cities decreases.
As in other case studies, i-Tree Eco was used to qualify and quantify the ecosystem benefits of the existing adult trees based on their size and health conditions [45,48].
Among the three scenarios studied in the district, the one providing the least benefits was S1, with the replacement of large trees outside of the case-study area. Even though the total effects of the replacement could be relevant at an urban scale, they can be considered non-significant at a local scale, where benefits are measured particularly in terms of pollutant removal as long as air particulate movements are limited in built-up areas.
Furthermore, the replacement of large trees with smaller ones (S2) resulted in a decrease in benefits, even under the hypothesis of increasing the population of trees. The most penalised effect was the pollutant removal capacity, particularly PM2.5. This must be considered when evaluating tree street replacement in accordance with conclusions provided by Jao et al. [38] and considering the volume of traffic on the roads affected by tree substitution.
The procedure used to assess the tree benefits (through i-Tree Eco) can be easily replicated by local administrations as a tool to support the decision-making process on urban greenery management, given the availability of the recently updated green census and the climatic and meteorological data on the geographical area of interest. The use of i-Tree Eco can serve to highlight the species with better ecosystem service performance, encouraging public administrations to promote their planting in urban greenery policies in accordance with Rossi et al. [45].
On the one hand, most Italian cities nowadays have digitalised green censuses, which are recurrently updated. On the other hand, even though i-Tree Eco is open software, it does not yet have widespread usage in Europe (but it does in the UK); therefore, the i-Tree database may not contain recent data or any data at all for a particular case-study area, requiring data to be inserted by the local user. Considering that the validation of input data may require a time of up to six months, this may represent a limitation in the application of the method. In order to increase the confidence of the results, the i-Tree Eco database must be provided with updated meteorological data and pollutant information. Further limitations of this study include the discrete data detection mode, which needed to be averaged, mitigating errors through statistical analysis, and the absence of an anemometer, which means excluding windy days from the measurement. Adding a mobile weather station set in a continuous detection mode would have been useful as a basis for comparison with the discretely collected values to enhance data confidence. Moreover, an evaluation of BVOC emissions could be implemented with i-Tree Eco, given that modelling should consider that the location planted and the amount of the ozone that a tree intercepts and uptakes may be greater than any ozone produced through BVOCs [31,32]. Recommendations for future study direction could include the extension of tree benefit assessment over a longer period, namely a year, in order to study how seasonal fluctuations may affect patterns in air quality and the UHI. Moreover, the analysis could be extended to a wider area in order to evaluate the compensation effects in the case of replacements planned outside the case-study area.
In accordance with Speak and Salbitano [8], the average differences in the air temperature of over 2–3 °C were observed between treeless places and the two street arrangements with trees, demonstrating the ability of tree shade and evapotranspiration to cool the local environment. Unlike the research that evaluated species richness, we highlighted that the size of trees has an important role in thermal comfort where there is paving. We can conclude, like other studies, that shade is the most important element for comfort [8], and the transpiration evaporation and solar radiation shielding effect of greenery can significantly improve the outdoor thermal environment [16]. This study contributes to the hypothesis of Bowler et al. [48] that urban trees may act to cool the environment at the local scale.
In accordance with Galenieks [49], a comparative analysis of different street tree arrangements reveals that environments prioritising tree protection offer better performance in terms of pedestrian thermal comfort and walkability.
Although there are similar studies on carbon sequestration and storage, it is difficult to compare the results, given the different climates, geographical settings, and compositions of tree populations, which are significant parameters to input that influence the output [50,51].
In conclusion, in cities, pollution and extreme events are among the most important risk factors. In this context, integrating mitigation and adaptation measures can help to avoid locking a city into counterproductive infrastructure and policies. Findings from this study can be applied to green censuses by public administrations to simulate and compare future scenarios to orient decision-making processes for the enhancement of ecosystem service provisions in an urban environment. Recommendations for adaptive planning can be drawn at two scales: the neighbourhood and site scale.
At the neighbourhood scale, benefits depend on the preservation of large trees and their gradual substitution (when they become truly dangerous) so as not to suddenly change the microclimate.
At the site scale, green infrastructures showed four times more influence in reducing the outdoor thermal heat stress on hot summer days compared to moderate summer days and offer benefits in different ways. Planting trees in the city centre could be the best adaptation strategy, and if not possible, a green façade or green roofs would also help.
More studies are definitely needed in this regard to address further questions on this topic and broaden our understanding of the potential benefits of green spaces in urban environments.
Author Contributions
Conceptualization, G.F. and A.A.; methodology, A.A., G.F., F.M. and F.C.; software, G.F.; validation, F.M. and F.C.; formal analysis, G.F.; investigation, A.A., G.F., F.M. and F.C.; resources, A.A., G.F., F.M. and F.C.; data curation, A.A. and F.M.; writing—original draft preparation, G.F.; writing—review and editing, A.A.; visualization, F.C.; supervision, F.C.; project administration, F.C.; funding acquisition, F.C. All authors have read and agreed to the published version of the manuscript.
Funding
This research received no external funding; it was only financed by Ateneo funds.
Institutional Review Board Statement
Ethical review and approval were waived for this study due to not being applicable for studies not involving humans or animals.
Informed Consent Statement
Not applicable.
Data Availability Statement
The tree census analysed during the study was provided by the municipality of Pisa, which one can contact to request its use only for scientific purposes.
Acknowledgments
We thank the municipality of Pisa for providing the urban tree census and Eng. R. Iannelli for the surveys produced with a drone equipped with a thermal camera.
Conflicts of Interest
The authors declare no conflicts of interest.
References
- Rajendra, K.; Awasthi, A.; Singh, C.; Bhushan, B. Systematic exploration of heat wave impact on mortality and urban heat island: A review from 2000 to 2022. Urban Clim. 2023, 51, 101622. [Google Scholar] [CrossRef]
- Masson, V.; Lemonsu, A.; Hidalgo, J.; Voogt, J. Urban climates and climate change. Annu. Rev. Environ. Resour. 2020, 45, 411–444. [Google Scholar] [CrossRef]
- Barrao, S.; Serrano-Notivoli, R.; Cuadrat, J.M.; Tejedor, E.; Saz Sánchez, M.A. Characterization of the UHI in Zaragoza (Spain) using a quality-controlled hourly sensor-based urban climate network. Urban Clim. 2022, 44, 101207. [Google Scholar] [CrossRef]
- Molla, M.B. Urbanization process in developing countries: A review on urban ecosystem degradation and public health effect. Res. J. Agric. Environ. Manag. 2015, 4, 291–298. [Google Scholar]
- Haddad, S.; Paolini, R.; Ulpiani, G.; Synnefa, A.; Hatvani-Kpvacs, G.; Garshasbi, S.; Fox, J.; Vasilakopoulou, K.; Nield, L.; Santamouris, M. Holistic approach to assess co-benefits of local climate mitigation in a hot humid region of Australia. Sci. Rep. 2020, 10, 14216. [Google Scholar] [CrossRef]
- Speak, A.F.; Salbitano, F. Summer thermal comfort of pedestrian in diverse urban settings: A mobile study. Build. Environ. 2022, 208, 108600. [Google Scholar] [CrossRef]
- Vanos, J.K.; Warland, J.S.; Gillespie, T.J.; Kenny, N.A. Review of the physiology of human thermal comfort while exercising in urban landscapes and implications for bioclimatic design. Int. J. Biometeorol. 2010, 54, 319–334. [Google Scholar] [CrossRef]
- Speak, A.; Montagnani, L.; Wellstein, C.; Zerbe, S. Forehead temperatures as an indicator of outdoor thermal comfort and the influence of tree shade. Urban Clim. 2021, 39, 100965. [Google Scholar] [CrossRef]
- Kim, Y.J.; Brown, R.D. A multilevel approach for assessing the effects of microclimatic urban design on pedestrian thermal comfort: The High Line in New York. Build. Environ. 2021, 205, 108244. [Google Scholar] [CrossRef]
- Rehan, R.M. Cool city as a sustainable example of heat island management case study of the coolest city in the world. HBRC J. 2016, 12, 191–204. [Google Scholar] [CrossRef]
- Marando, F.; Salvatori, E.; Sebastiani, A.; Fusaro, L.; Manes, F. Regulating ecosystem services and green infrastructures: Assessment of urban heat island effect mitigation in the municipality of Rome, Italy. Ecol. Model. 2019, 392, 92–102. [Google Scholar] [CrossRef]
- Maes, J.; Sanders, J. Nature-Based Solutions for Europe’s Sustainable Development. Conserv. Lett. 2015, 10, 121–124. [Google Scholar] [CrossRef]
- Coccolo, S.; Kämpf, J.; Scartezzini, J.-L.; Pearlmutter, D. Outdoor human comfort and thermal stress: A comprehensive review on models and standards. Urban Clim. 2016, 18, 33–57. [Google Scholar] [CrossRef]
- ANSI/ASHRAE Standard 55-2010; Thermal Environment Conditions for Human Occupancy. ASHRAE: Atlanta, GA, USA, 2010; p. 55.
- Budd, G.M. Wet-bulb globe temperature (WBGT)—Its history and its limitations. J. Sci. Med. Sport 2008, 11, 20–32. [Google Scholar] [CrossRef]
- Blazejczyk, K.; Epstein, Y.; Jendritzky, G.; Staiger, H.; Tinz, B. Comparison of UTCI to selected thermal indices. Int. J. Biometeorol. 2012, 56, 515–535. [Google Scholar] [CrossRef]
- Ghalhari, G.F.; Heidari, H.; Dehghan, S.F.; Asghari, M. Consistency assessment between summer simmer index and other heat stress indices (WBGT and Humidex) in Iran’s climates. Urban Clim. 2022, 43, 101178. [Google Scholar] [CrossRef]
- Mazzotta, A.; Mutani, G. Environmental high performance urban open spaces paving: Experimentations in Urban Barriera. In Proceedings of the 6th International Building Physics Conference, Turin, Italy, 14–17 June 2015; pp. 669–674. [Google Scholar] [CrossRef]
- Kumar, P.; Sharma, A. Assessing outdoor thermal comfort conditions at an urban park during summer in the hot semi-arid region of India. Mater. Today Proc. 2022, 61, 356–369. [Google Scholar] [CrossRef]
- Tsilini, V.; Papantoniou, S.; Kolokotsa, D.-D.; Maria, E.-A. Urban gardens as a solution to energy poverty and urban heat island. Sustain. Cities Soc. 2014, 14, 323–333. [Google Scholar] [CrossRef]
- Moss, J.L.; Doick, K.J.; Smith, S.; Shahrestani, M. Influence of evaporative cooling by urban forests on cooling demand in cities. Urban For. Urban Green. 2019, 37, 65–73. [Google Scholar] [CrossRef]
- Lanza, K.; Stone, B., Jr. Climate adaptation in cities: What trees are suitable for urban heat management? Landsc. Urban Plan. 2016, 153, 74–82. [Google Scholar] [CrossRef]
- O’Malley, C.; Piroozfar, P.; Far, E.R.P.; Pomponi, F. Urban Heat Island (UHI) mitigating strategies: A case-based comparative analysis. Sustain. Cities Soc. 2015, 19, 222–235. [Google Scholar] [CrossRef]
- Barwise, Y.; Kumar, P. Designing vegetation barriers for urban air pollution abatement: A practical review for appropriate plantspecies selection. Clim. Atmos. Sci. 2020, 3, 12. [Google Scholar] [CrossRef]
- Berland, A.; Shiflett, S.A.; Shuster, W.D.; Garmestani, A.S.; Goddard, H.C.; Herrmann, D.L.; Hopton, M.E. The role of trees in urban stormwater management. Landsc. Urban Plan. 2017, 162, 167–177. [Google Scholar] [CrossRef]
- Akbari, H.; Pomerantz, M.; Taha, H. Cool surfaces and shade trees to reduce energy use and improve air quality in urban areas. Sol. Energy 2001, 70, 295–310. [Google Scholar] [CrossRef]
- Stone, B., Jr. Urban and rural temperature trends in proximity to large U.S. cities: 1951-2000. Int. J. Climatol. 2007, 27, 1801–1807. [Google Scholar] [CrossRef]
- Kovats, R.S.; Haiat, S. Heat stress and public health: A critical review. Ann. Rev. Publ. Health 2008, 29, 41–55. [Google Scholar] [CrossRef]
- Margalef-Marrase, J.; Pérez-Navarro, M.A.; Lloret, F. Relationship between heatwave-induced forest die-off and climatic suitability in multiple tree species. Glob. Chang. Biol. 2020, 26, 3134–3146. [Google Scholar] [CrossRef]
- Teskey, R.; Wertin, T.; Bauweraerts, I.; Ameye, M.; McGuire, M.A.; Steppe, K. Responses of tree species to heat waves and extremeheat events. Plant Cell Environ. 2015, 38, 1699–1712. [Google Scholar] [CrossRef]
- Ren, Y.; Ge, Y.; Gu, B.; Min, Y.; Tani, A.; Chang, J. Role of Management Strategies and Environmental Factors in Determining the Emissions of Biogenic Volatile Organic Compounds from Urban Greenspaces. Environ. Sci. Technol. 2014, 48, 6237–6246. [Google Scholar] [CrossRef]
- Calfapietra, C.; Fares, S.; Manes, F.; Morani, A.; Sgrigna, G.; Loreto, F. Role of Biogenic Volatile Organic Compounds (BVOC) emitted by urban trees on ozone concentration in cities: A review. Environ. Pollut. 2013, 183, 71–80. [Google Scholar] [CrossRef]
- Nowak, D.J.; Crane, D.E.; Stevens, J.C. Air pollution removal by urban trees and shrubs in the United States. Urban For. Urban Green. 2006, 4, 115–123. [Google Scholar] [CrossRef]
- Ellison, M. Quantified tree risk assessment used in the management of amenity trees. J. Arboricult. 2005, 31, 57–65. [Google Scholar] [CrossRef]
- Manzanera, J.A.; Gómez-Garay, A.; Pintos, B.; Rodríguez-Rastrero, M.; Moreda, E.; Zazo, J.; Martínez-Falero, E.; García-Abril, A. Sap flow, leaf-level gas exchange and spectral responses to drought in Pinus sylvestris, Pinus pinea and Pinus halepensis. iForest 2017, 10, 204–214. [Google Scholar] [CrossRef]
- Stewart, M.G.; O’Callaghan, D.; Hartley, M. Review of QTRA and risk-based cost-benefit assessment of tree management. Arboric. Urban For. 2013, 39, 165–172. [Google Scholar] [CrossRef]
- Novak, D.J.; Aevermann, T. Tree compensation rates: Compensating for the loss of future tree values. Urban For. Urban Green. 2019, 41, 93–103. [Google Scholar] [CrossRef]
- Jao, J.; Chen, N.; Guo, F.; Liu, M.; Chen, W.; He, X. Variation in ecosystem service of street tree assemblages can guide sustainable urban development. J. Plant Ecol. 2022, 15, 1241–1256. [Google Scholar] [CrossRef]
- Hirabayashi, S.; Kroll, C.; Nowak, D. Component-based development and sensitivity analyses of an air pollutant dry deposition model. Environ. Model. Softw. 2011, 26, 804–816. [Google Scholar] [CrossRef]
- Demo ISTAT: Bilancio Demografico Mensile e Popolazione Residente per Sesso, Anno 2022. Available online: https://demo.istat.it/app/?i=D7B&l=it&a=2022 (accessed on 18 December 2023).
- Climatologia di Pisa 1991-2020 | Consorzio LaMMA. Available online: https://www.lamma.toscana.it/clima-e-energia/climatologia/clima-pisa (accessed on 18 December 2023).
- Regione Toscana Portale La Toscana Attraverso le foto Aeree. Available online: http://www502.regione.toscana.it/geoscopio/ortofoto.html (accessed on 18 December 2023).
- Piano del Traffico. Comune di Pisa. Available online: https://www.comune.pisa.it/it/ufficio/piano-del-traffico (accessed on 9 January 2024).
- Masterplan del Verde Pubblico 2016–2025. Available online: https://www.comune.pisa.it/it/ufficio/relazionihttps://www.comune.pisa.it/it/ufficio/piano-del-traffico (accessed on 9 January 2024).
- Rossi, L.; Menconi, M.E.; Grohmann, D.; Brunori, A.; Nowak, D.J. Urban Planning Insights from Tree Inventories and Their Regulating Ecosystem Services Assessment. Sustainability 2022, 14, 1684. [Google Scholar] [CrossRef]
- Nowak, D.J. Understanding i-Tree: Summary of programs and methods. In General Technical Reports NRS-200; Department of Agriculture, Forest Service, Northern Research Station: Madison, WI, USA, 2020. [Google Scholar]
- ASTM E2847-21; Standard Test Method for Calibration and Accuracy Verification of Wideband Infrared Thermometers. ASTM International Standards: West Conshohocken, PA, USA, 2021. [CrossRef]
- Bowler, D.E.E.; Buyung-Ali, L.L.; Knight, T.M.M.; Pullin, A.S. Urban greening to cool towns and cities: A systematic review of the empirical evidence. Landsc. Urban Plan. 2010, 97, 147–155. [Google Scholar] [CrossRef]
- Galenieks, A. Importance of urban street tree policies: A comparison of neighbouring Southern California cities. Urban Urban Green 2017, 22, 105–110. [Google Scholar] [CrossRef]
- Russo, A.; Escobedo, F.J.; Timilsina, N.; Schmitt, A.O.; Varela, S.; Zerbe, S. Assessing urban tree carbon storage and sequestration in Bolzano, Italy. Int. J. Biodivers. Sci. Ecosyst. Serv. Manag. 2014, 10, 54–70. [Google Scholar] [CrossRef]
- Zheng, S.; Zhao, L.; Li, Q. Numerical simulation of the impact of different vegetation species on the outdoor thermal environment. Urban For. Urban Green. 2016, 18, 138–150. [Google Scholar] [CrossRef]
Figure 1.
(a) Aerial view of Pisa. The red dashed line identifies the Porta a Lucca district; (b) aerial view of Porta a Lucca: Via Giovanni Pisano (1), Via Francesco Baracca (2), Via Fratelli Rosselli (3), and Via Ugo Rindi (4).
Figure 1.
(a) Aerial view of Pisa. The red dashed line identifies the Porta a Lucca district; (b) aerial view of Porta a Lucca: Via Giovanni Pisano (1), Via Francesco Baracca (2), Via Fratelli Rosselli (3), and Via Ugo Rindi (4).
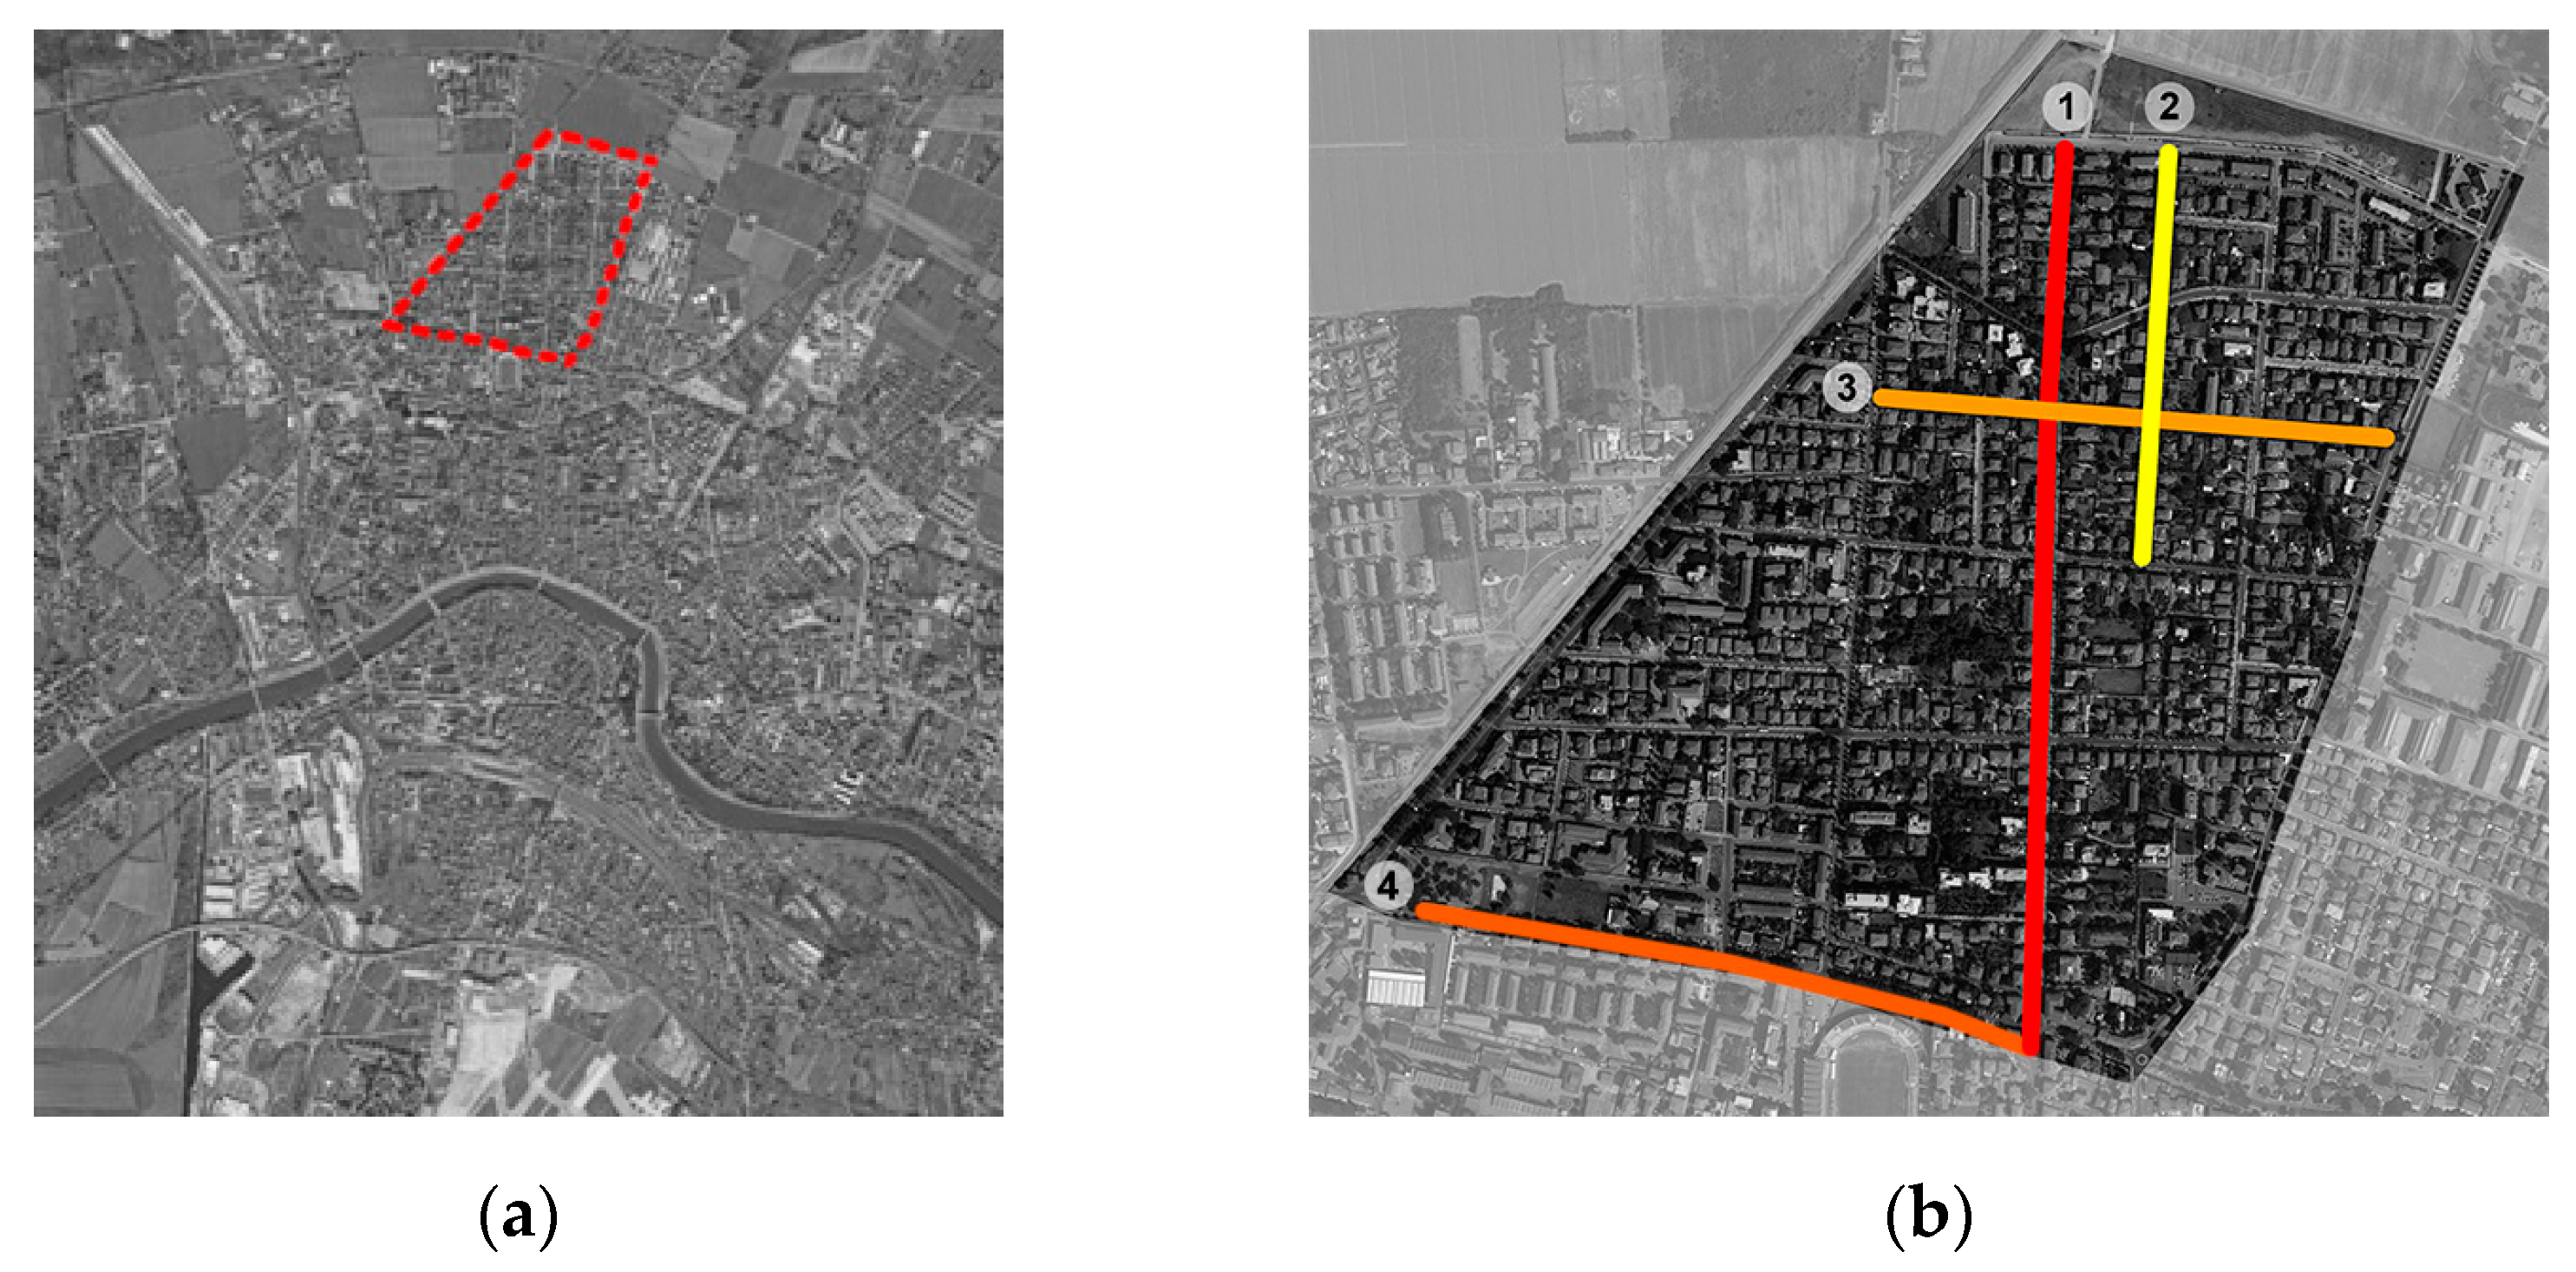
Figure 2.
Maps of the three scenarios. Yellow represents the trees remaining unchanged over the analysis. (a) S0: dataset of trees as provided in the census; the green depicts the Stone pines scheduled to be replaced along the four observed roads; (b) S1: dataset of trees after the felling of Stone pines; (c) dataset of trees after the felling of Stone pines and replacement with Privet saplings (coloured in pink).
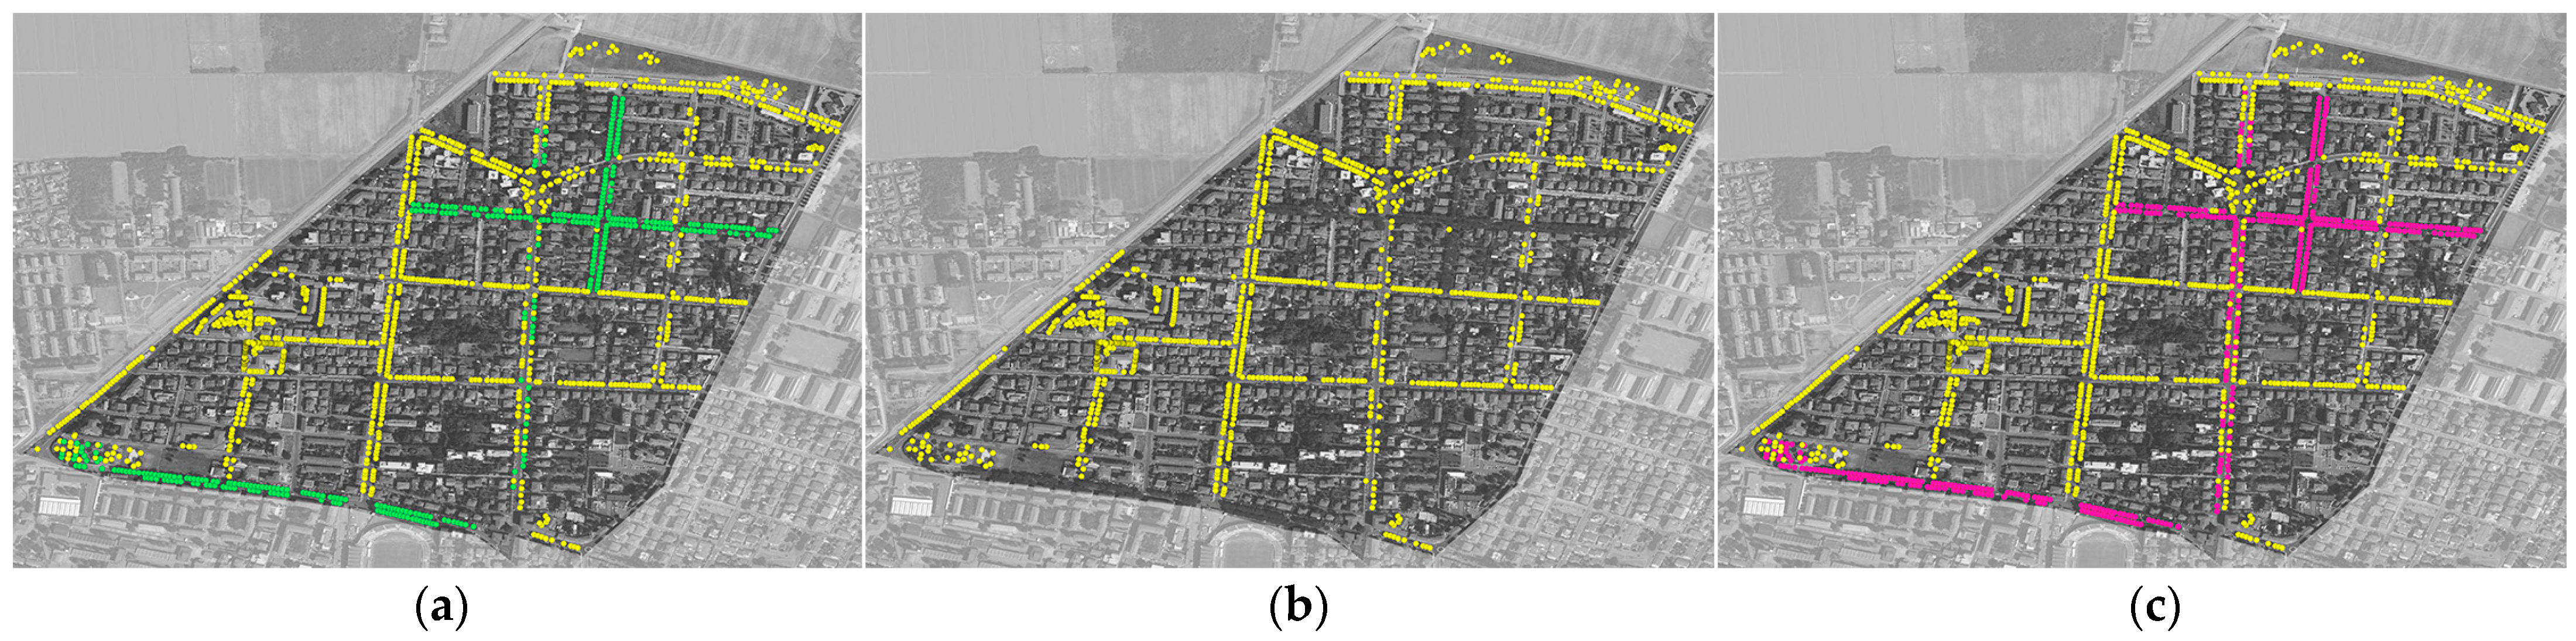
Figure 3.
(a) SA1, street arrangement with large trees; (b) SA2, street arrangement with small trees; (c) SA3, street arrangement without trees.
Figure 3.
(a) SA1, street arrangement with large trees; (b) SA2, street arrangement with small trees; (c) SA3, street arrangement without trees.
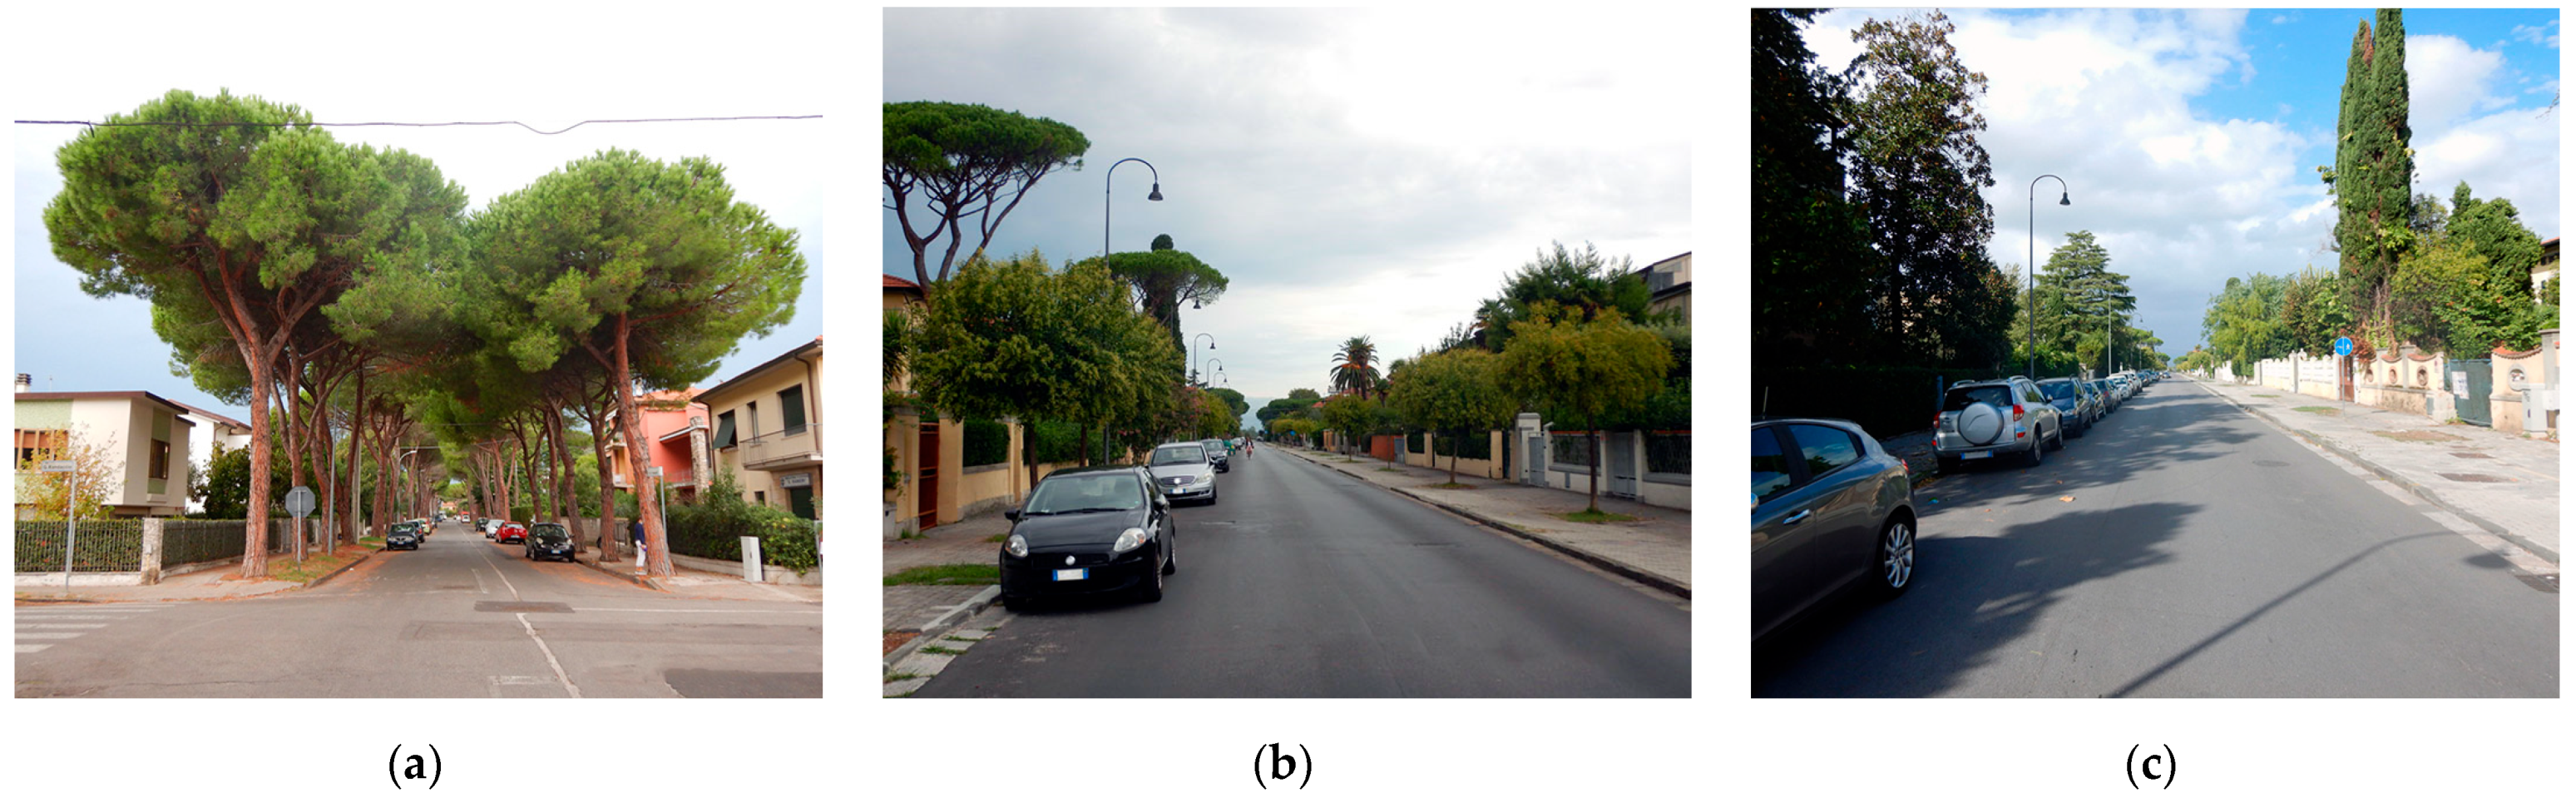
Figure 4.
Comparison of the average values of Ta over time in the three street arrangement types: (a) morning; (b) noon; (c) afternoon.
Figure 4.
Comparison of the average values of Ta over time in the three street arrangement types: (a) morning; (b) noon; (c) afternoon.
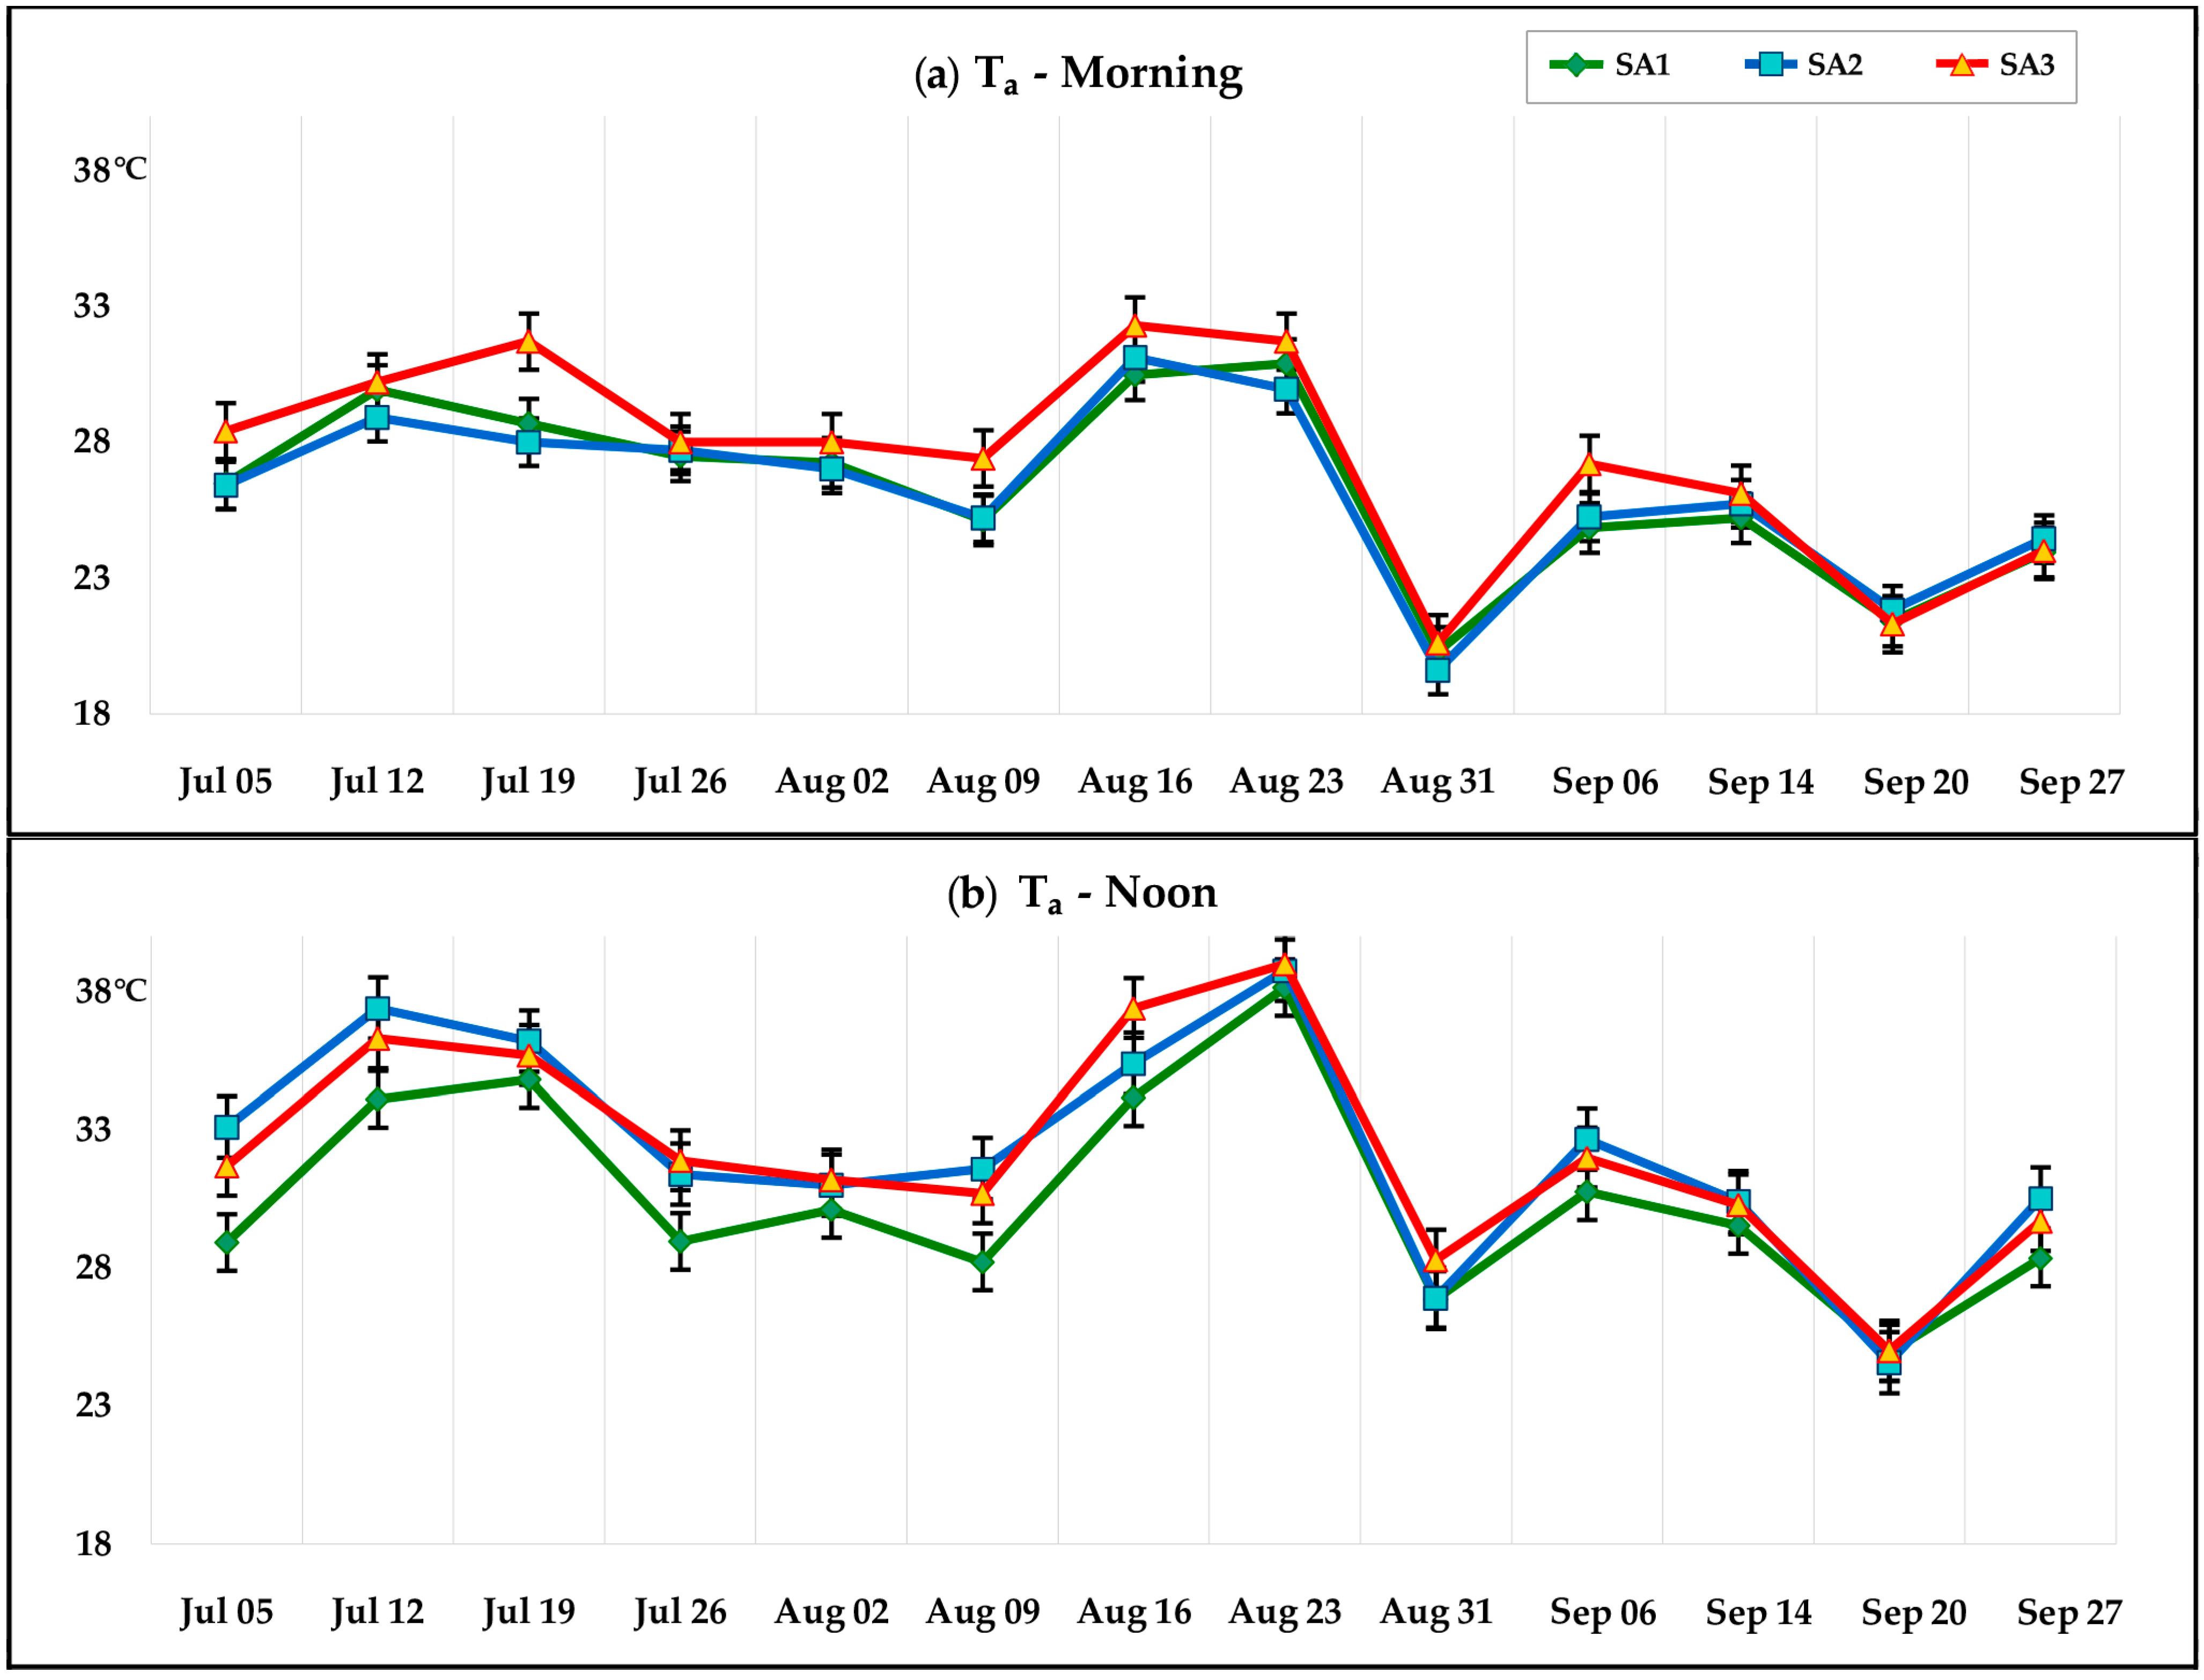
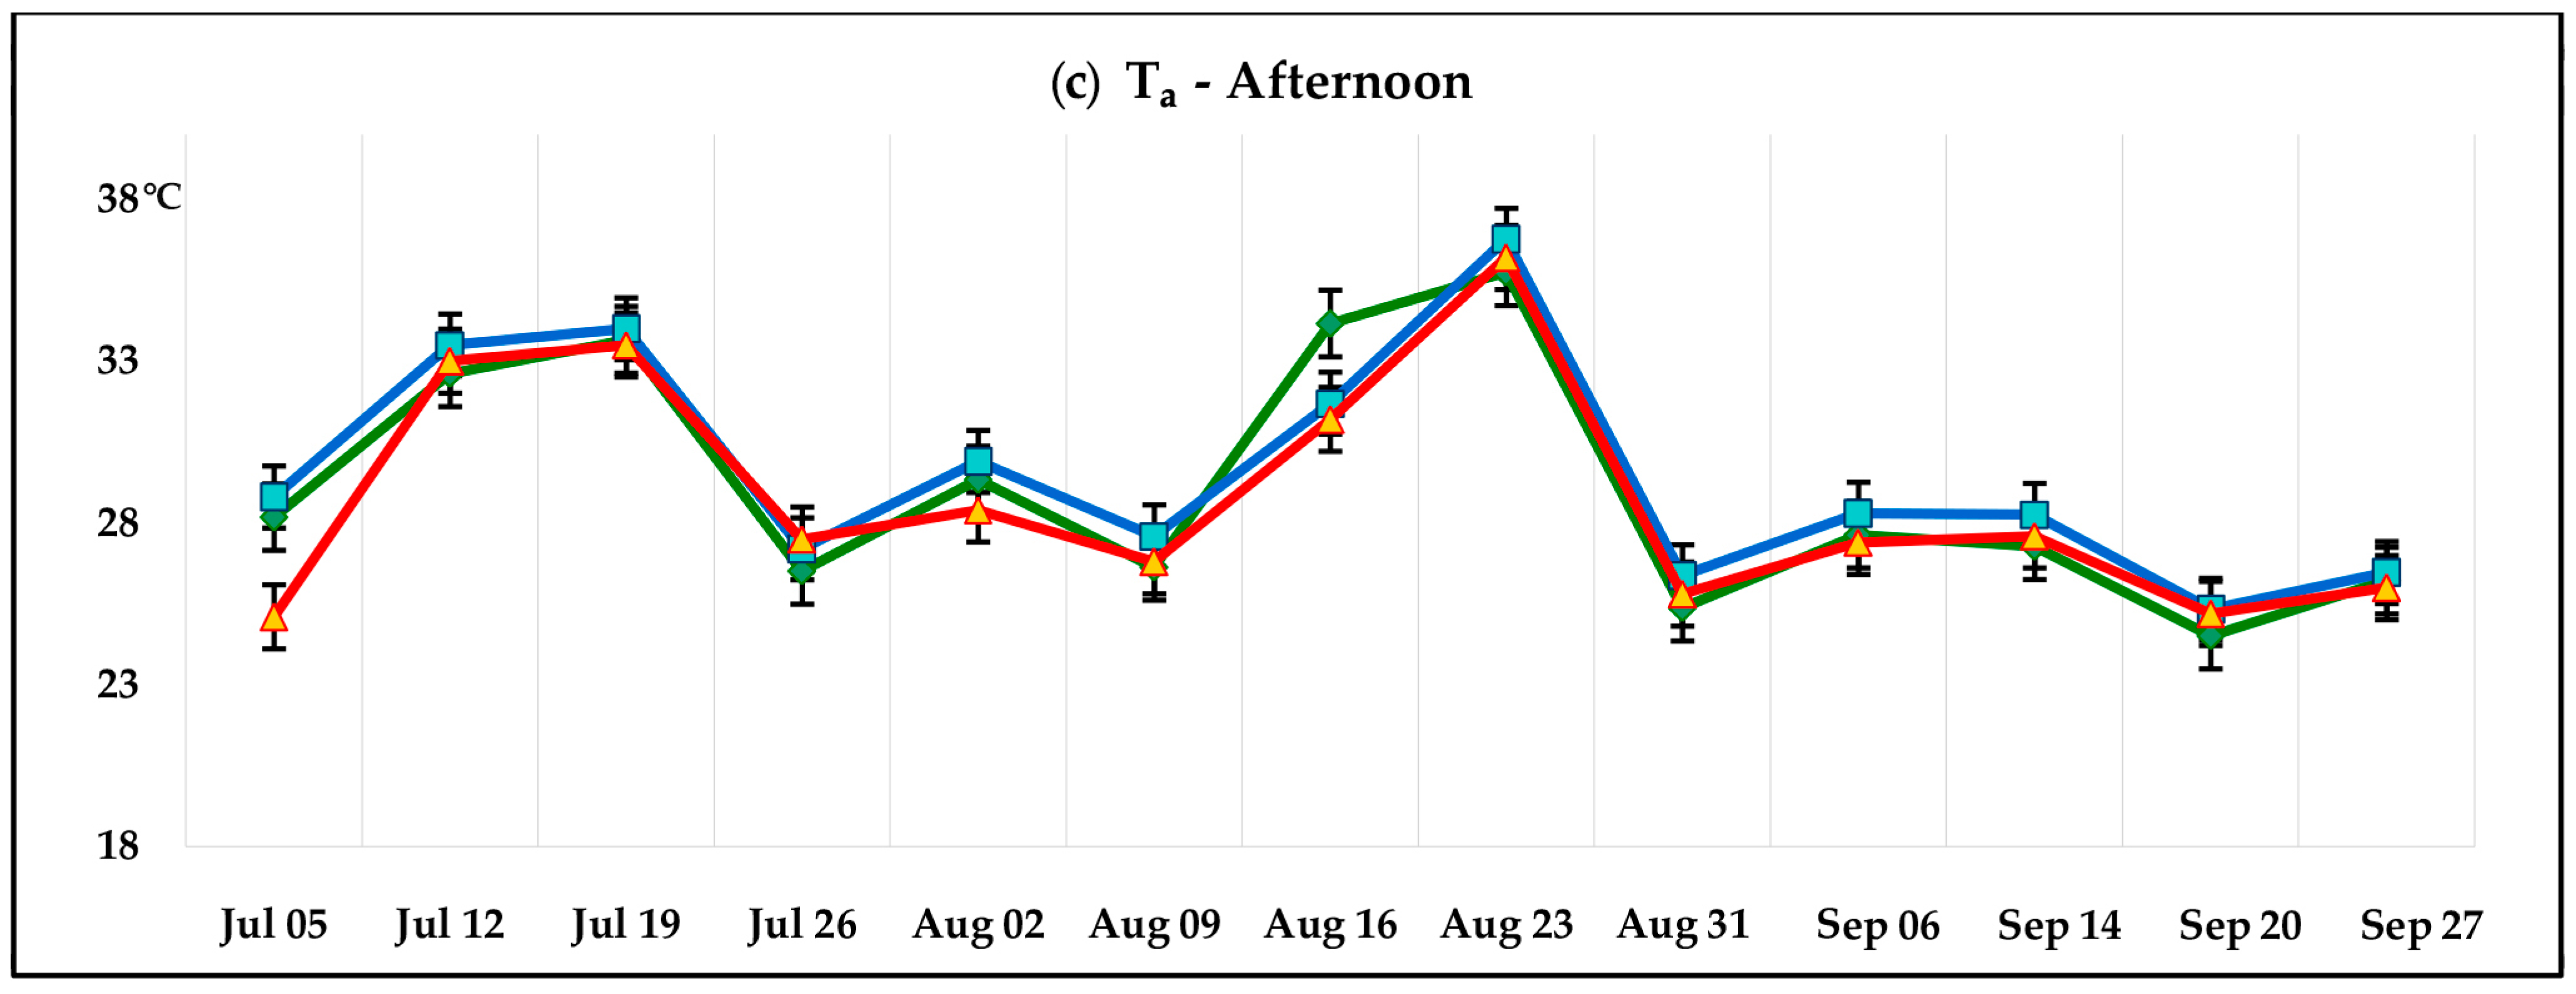
Figure 5.
Comparison of the average values of Tg over time in the three street arrangement types: (a) morning; (b) noon; (c) afternoon.
Figure 5.
Comparison of the average values of Tg over time in the three street arrangement types: (a) morning; (b) noon; (c) afternoon.


Figure 6.
Comparison of average values of Tw over time in the three street arrangement types: (a) morning; (b) noon; (c) afternoon.
Figure 6.
Comparison of average values of Tw over time in the three street arrangement types: (a) morning; (b) noon; (c) afternoon.

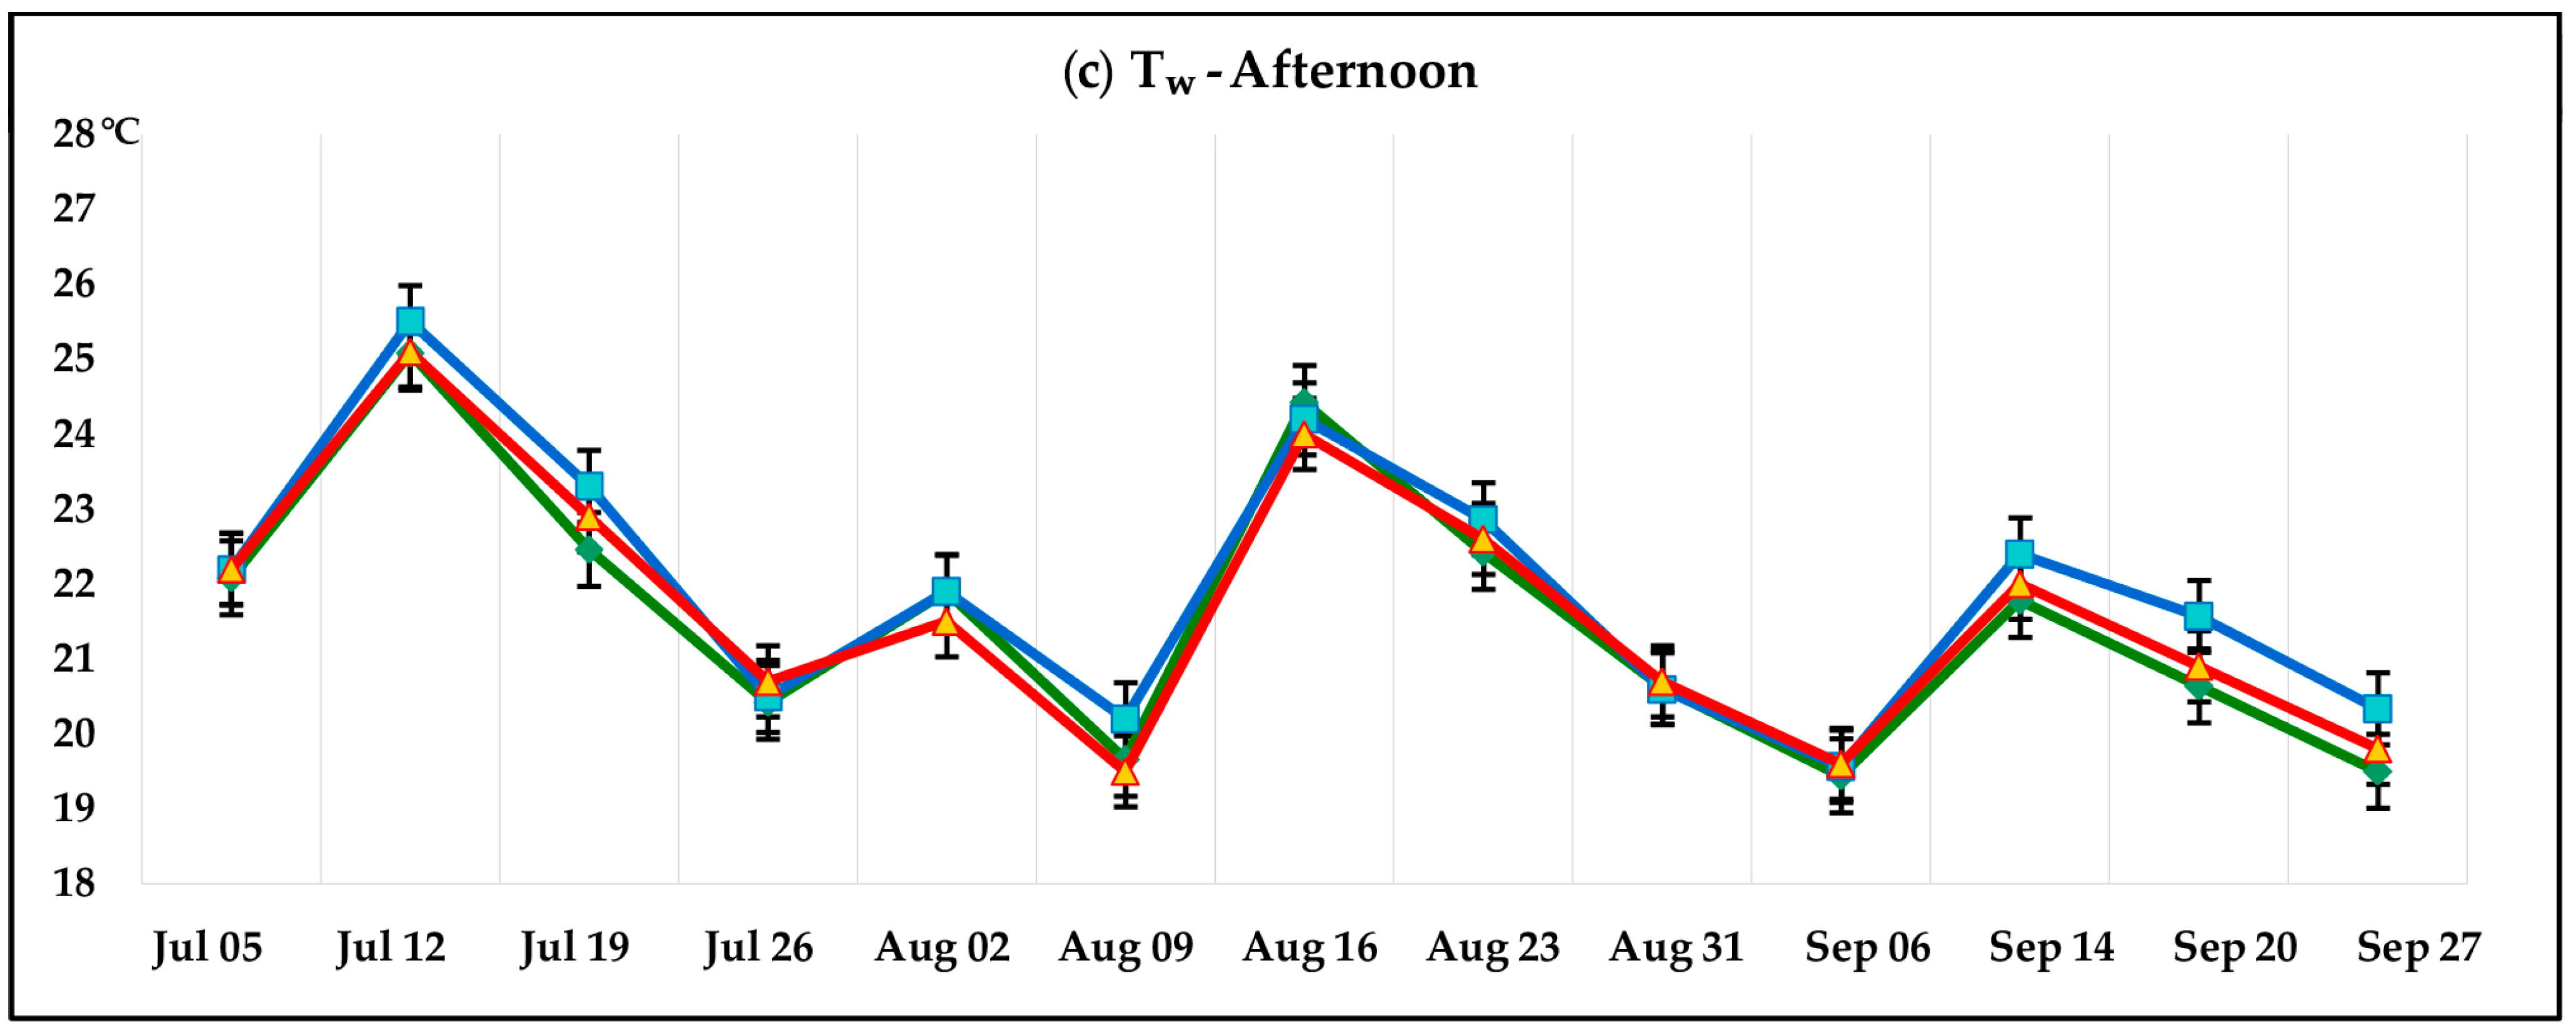
Figure 7.
(a) SA1 monitoring point near a Stone pine; (b) thermogram.
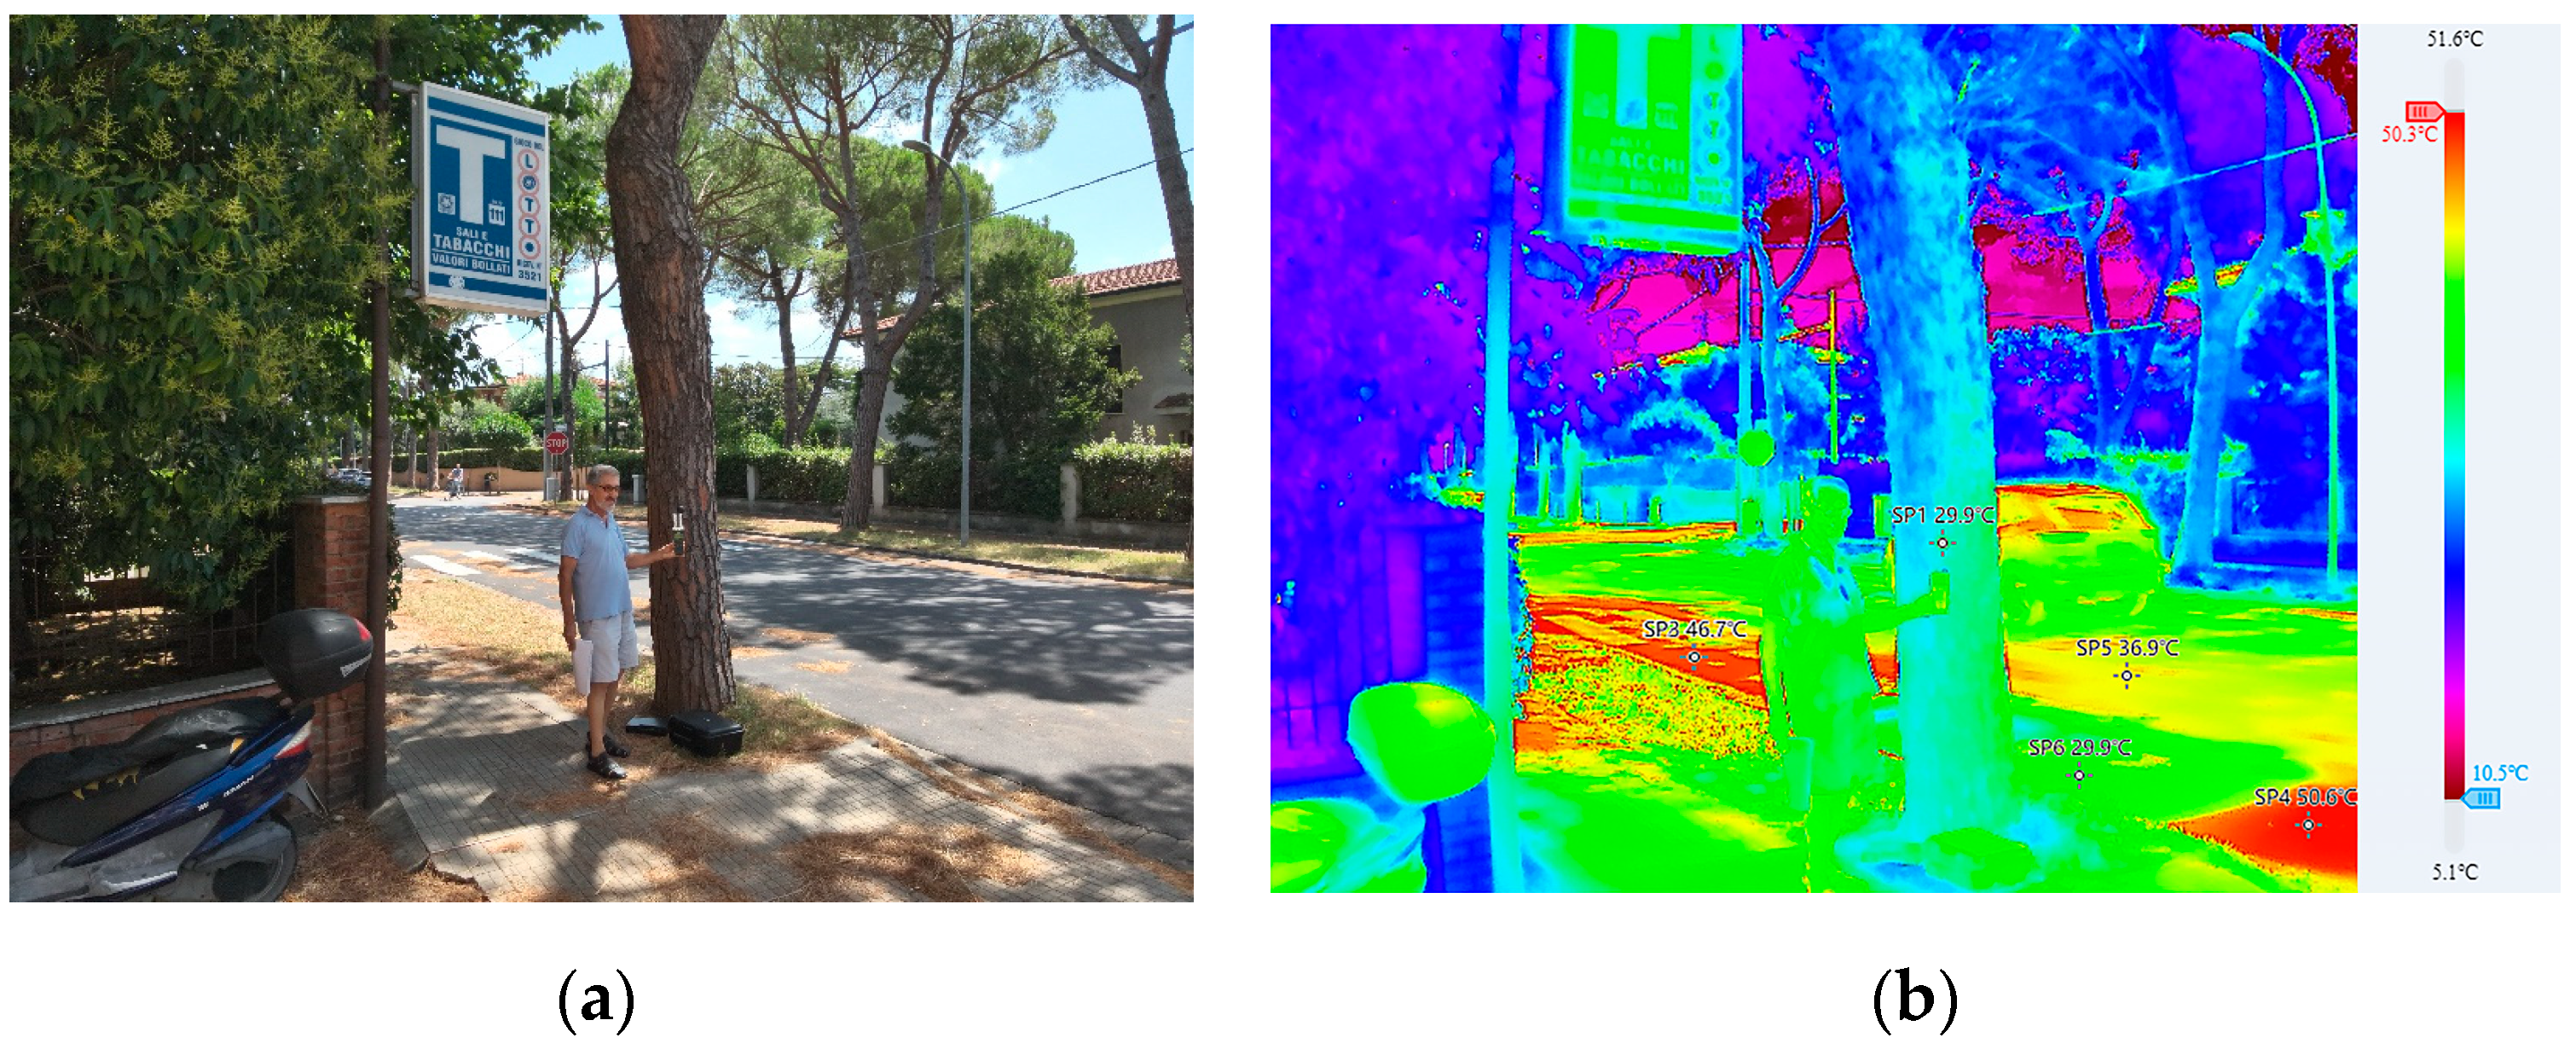
Figure 8.
(a) SA2 monitoring point near a Privet sapling; (b) thermogram.

Figure 9.
(a) SA3 monitoring point without trees; (b) thermogram.

Table 1.
Monitoring point locations and represented street arrangement types.
| Monitoring Point | Road Name | Street Arrangement Type |
|---|---|---|
| 1 | Via Giovanni Pisano | Small trees 1 |
| 2 | Small trees | |
| 3 | Small trees | |
| 4 | No trees | |
| 5 | No trees | |
| 6 | Via Fratelli Rosselli | Large trees 2 |
| 7 | No trees | |
| 8 | Large trees | |
| 9 | Large trees | |
| 10 | No trees | |
| 11 | Large trees | |
| 12 | Via Francesco Baracca | Large trees |
| 13 | Large trees | |
| 14 | No trees | |
| 15 | Large trees | |
| 16 | No trees | |
| 17 | Large trees |
1 Privet sapling (Ligustrum lucidum). 2 Stone pine (Pinus pinea).
Table 2.
Characteristics of tree populations in the Porta a Lucca district in the three different scenarios (the data were processed using i-Tree Eco).
Table 2.
Characteristics of tree populations in the Porta a Lucca district in the three different scenarios (the data were processed using i-Tree Eco).
| Trees (Number) | Leaf Area (ha) | Canopy Cover (m2) | Carbon Storage (t) | |||||||||
|---|---|---|---|---|---|---|---|---|---|---|---|---|
| Species/ Scenario | S0 | S1 | S2 | S0 | S1 | S2 | S0 | S1 | S2 | S0 | S1 | S2 |
| Acer campestre | 106 | 106 | 106 | 0.53 | 0.53 | 0.53 | 1350 | 1350 | 1350 | 2.94 | 2.94 | 2.94 |
| Acer negundo | 249 | 249 | 249 | 3.69 | 3.69 | 3.69 | 8093 | 8093 | 8093 | 41.84 | 41.84 | 41.84 |
| Cupressus sempervirens | 79 | 79 | 79 | 0.28 | 0.28 | 0.28 | 377 | 377 | 377 | 4.82 | 4.82 | 4.82 |
| Ligustrum lucidum | 68 | 68 | 539 | 0.31 | 0.31 | 1.95 | 995 | 995 | 5789 | 2.62 | 2.62 | 10.75 |
| Morus alba | 81 | 81 | 81 | 0.81 | 0.81 | 0.81 | 3279 | 3279 | 3279 | 19.41 | 19.41 | 19.41 |
| Pinus pinea | 410 | 26 | 26 | 10.83 | 0.82 | 0.82 | 19,679 | 1492 | 1492 | 143.31 | 12.96 | 12.96 |
| Platanus × acerifolia | 100 | 100 | 100 | 3.25 | 3.25 | 3.25 | 5932 | 5932 | 5932 | 35.43 | 35.43 | 35.43 |
| Tilia platyphyllos | 82 | 82 | 82 | 2.21 | 2.21 | 2.21 | 59 | 59 | 59 | 0.22 | 0.22 | 0.22 |
| Other species | 252 | 252 | 252 | 2.28 | 2.28 | 2.28 | 9280 | 9280 | 9280 | 59.51 | 59.51 | 59.51 |
| Total | 1427 | 1043 | 1514 | 24.16 | 14.16 | 15.80 | 49,043 | 30,856 | 35,650 | 310.10 | 179.75 | 187.88 |
| Variation (%) with Respect to S0 | - | −26.9 | +6.1 | - | −41.4 | −34.6 | - | −37.1 | −27.3 | - | −42.0 | −39.4 |
Table 3.
Benefits provided by the tree populations in the Porta a Lucca district in the three different scenarios (the data were processed using i-Tree Eco).
Table 3.
Benefits provided by the tree populations in the Porta a Lucca district in the three different scenarios (the data were processed using i-Tree Eco).
| Avoided Runoff (m³/yr) | Pollution Removal (t/yr) | Gross Carbon Sequestration (t/yr) | CO2eq Sequestration (t/yr) | |||||||||
|---|---|---|---|---|---|---|---|---|---|---|---|---|
| Species/ Scenario | S0 | S1 | S2 | S0 | S1 | S2 | S0 | S1 | S2 | S0 | S1 | S2 |
| Acer campestre | 9.15 | 8.28 | 8.77 | 0.01 | 0.01 | 0.01 | 0.32 | 0.32 | 0.32 | 1.17 | 1.17 | 1.17 |
| Acer negundo | 64.20 | 58.04 | 61.49 | 0.06 | 0.06 | 0.06 | 2.48 | 2.48 | 2.48 | 9.10 | 9.10 | 9.10 |
| Cupressus sempervirens | 4.79 | 4.33 | 4.59 | 0.00 | 0.00 | 0.00 | 0.30 | 0.30 | 0.30 | 1.08 | 1.08 | 1.08 |
| Ligustrum lucidum | 5.32 | 4.81 | 32.44 | 0.00 | 0.00 | 0.03 | 0.28 | 0.28 | 1.59 | 1.02 | 1.02 | 5.85 |
| Morus alba | 14.03 | 12.68 | 13.44 | 0.01 | 0.01 | 0.01 | 1.07 | 1.07 | 1.07 | 3.91 | 3.91 | 3.91 |
| Pinus pinea | 188.33 | 12.92 | 13.69 | 0.17 | 0.01 | 0.01 | 4.32 | 0.34 | 0.34 | 15.83 | 1.26 | 1.26 |
| Platanus × acerifolia | 56.55 | 51.13 | 54.16 | 0.05 | 0.05 | 0.05 | 1.53 | 1.53 | 1.53 | 5.62 | 5.62 | 5.62 |
| Tilia platyphyllos | 36.80 | 34.74 | 36.80 | 0.04 | 0.03 | 0.04 | 0.96 | 0.96 | 0.96 | 3.54 | 3.54 | 3.54 |
| Other Species | 39.59 | 35.86 | 37.95 | 0.01 | 0.01 | 0.01 | 1.58 | 1.58 | 1.58 | 5.88 | 5.88 | 5.88 |
| Total | 418.76 | 222.79 | 263.33 | 0.35 | 0.18 | 0.22 | 12.84 | 8.86 | 10.17 | 47.15 | 32.58 | 37.41 |
| Variation (%) with Respect to S0 | - | −46.8 | −37.1 | - | −48.6 | −37.1 | - | −31.0 | −20.8 | - | −30.9 | −20.7 |
Table 4.
Pollution removal provided by the tree populations in the Porta a Lucca district in the three different scenarios (the data were processed using i-Tree Eco).
Table 4.
Pollution removal provided by the tree populations in the Porta a Lucca district in the three different scenarios (the data were processed using i-Tree Eco).
| O3 (kg/yr) | NO2 (kg/yr) | SO2 (kg/yr) | PM2,5 (kg/yr) | |||||||||
|---|---|---|---|---|---|---|---|---|---|---|---|---|
| Species/ Scenario | S0 | S1 | S2 | S0 | S1 | S2 | S0 | S1 | S2 | S0 | S1 | S2 |
| Acer campestre | 5.44 | 5.54 | 5.73 | 2.16 | 2.07 | 2.16 | 0.40 | 0.40 | 0.42 | 0.20 | 0.15 | 0.16 |
| Acer negundo | 38.15 | 38.84 | 40.16 | 15.17 | 14.53 | 15.15 | 2.77 | 2.83 | 2.93 | 1.41 | 1.05 | 1.15 |
| Cupressus sempervirens | 2.85 | 2.90 | 3.00 | 1.13 | 1.08 | 1.13 | 0.21 | 0.21 | 0.22 | 0.10 | 0.08 | 0.09 |
| Ligustrum lucidum | 3.16 | 3.22 | 21.18 | 1.26 | 1.20 | 7.99 | 0.23 | 0.23 | 1.56 | 0.12 | 0.09 | 0.61 |
| Morus alba | 8.34 | 8.49 | 8.77 | 3.31 | 3.18 | 3.31 | 0.61 | 0.62 | 0.64 | 0.31 | 0.23 | 0.25 |
| Pinus pinea | 111.92 | 8.65 | 8.94 | 44.49 | 3.23 | 3.37 | 8.14 | 0.63 | 0.65 | 4.12 | 0.23 | 0.26 |
| Platanus × acerifolia | 33.60 | 34.21 | 35.38 | 13.36 | 12.80 | 13.35 | 2.44 | 2.50 | 2.58 | 1.24 | 0.93 | 1.01 |
| Tilia platyphyllos | 0.17 | 0.17 | 0.18 | 0.07 | 0.06 | 0.07 | 0.01 | 0.01 | 0.01 | 0.01 | 0.00 | 0.01 |
| Other species | 46.21 | 47.04 | 48.65 | 18.37 | 17.60 | 18.36 | 3.36 | 3.43 | 3.56 | 1.70 | 1.28 | 1.40 |
| Total | 249.84 | 149.05 | 171.99 | 99.32 | 55.76 | 64.89 | 18.17 | 10.87 | 12.58 | 9.21 | 4.04 | 4.94 |
| Variation (%) with Respect to S0 | - | −40.3 | −31.2 | - | −43.9 | −34.7 | - | −40.2 | −30.8 | - | −56.2 | −46.3 |
Table 5.
WBGT over time in the three street arrangements.
| WBGT Morning (°C) | WBGT Noon (°C) | WBGT Afternoon (°C) | |||||||
|---|---|---|---|---|---|---|---|---|---|
| Day/Street Arrangement | SA1 | SA2 | SA3 | SA1 | SA2 | SA3 | SA1 | SA2 | SA3 |
| July 5 | 23.9 | 23.8 | 25.4 | 25.2 | 28.8 | 28.5 | 25.0 | 25.4 | 25.4 |
| July 12 | 24.8 | 24.9 | 25.9 | 28.3 | 31.1 | 30.4 | 28.1 | 29.1 | 28.8 |
| July 19 | 25.0 | 25.1 | 27.4 | 27.7 | 29.2 | 29.6 | 26.7 | 27.1 | 27.1 |
| July 26 | 23.3 | 24.1 | 26.2 | 24.6 | 26.6 | 27.0 | 23.0 | 23.2 | 23.5 |
| August 2 | 23.1 | 23.3 | 25.3 | 25.4 | 26.9 | 27.3 | 25.2 | 25.5 | 23.9 |
| August 9 | 21.4 | 21.8 | 23.6 | 23.2 | 26.0 | 26.8 | 22.5 | 23.0 | 22.3 |
| August 16 | 26.8 | 28.0 | 28.5 | 29.2 | 30.6 | 31.6 | 28.5 | 27.5 | 27.7 |
| August 23 | 24.5 | 25.7 | 26.7 | 29.5 | 30.5 | 30.6 | 27.2 | 27.9 | 27.4 |
| August 31 | 18.1 | 18.3 | 19.6 | 23.6 | 23.9 | 25.1 | 22.8 | 23.4 | 23.0 |
| September 7 | 20.4 | 21.0 | 22.7 | 24.4 | 26.2 | 25.4 | 22.3 | 22.4 | 22.1 |
| September 14 | 22.8 | 23.9 | 24.5 | 24.9 | 26.3 | 26.2 | 23.7 | 24.6 | 24.0 |
| September 20 | 19.8 | 19.7 | 19.9 | 21.9 | 22.5 | 22.6 | 21.9 | 22.9 | 22.4 |
| September 27 | 19.9 | 21.3 | 21.4 | 22.7 | 25.2 | 25.8 | 21.9 | 22.4 | 22.2 |
The highlighted cells show the WBGT values approaching and exceeding the limits for human health (pedestrian, according to European community law). Yellow (28.5–29): approaching the limit; orange (29.1–30): risk for non-acclimatised people; red (over 30): risk for acclimatised people.
Disclaimer/Publisher’s Note: The statements, opinions and data contained in all publications are solely those of the individual author(s) and contributor(s) and not of MDPI and/or the editor(s). MDPI and/or the editor(s) disclaim responsibility for any injury to people or property resulting from any ideas, methods, instructions or products referred to in the content. |
© 2024 by the authors. Licensee MDPI, Basel, Switzerland. This article is an open access article distributed under the terms and conditions of the Creative Commons Attribution (CC BY) license (https://creativecommons.org/licenses/by/4.0/).
Share and Cite
MDPI and ACS Style
Frosini, G.; Amato, A.; Mugnai, F.; Cinelli, F. The Impact of Trees on the UHI Effect and Urban Environment Quality: A Case Study of a District in Pisa, Italy. Atmosphere 2024, 15, 123. https://doi.org/10.3390/atmos15010123
AMA Style
Frosini G, Amato A, Mugnai F, Cinelli F. The Impact of Trees on the UHI Effect and Urban Environment Quality: A Case Study of a District in Pisa, Italy. Atmosphere. 2024; 15(1):123. https://doi.org/10.3390/atmos15010123
Chicago/Turabian StyleFrosini, Greta, Agnese Amato, Francesca Mugnai, and Fabrizio Cinelli. 2024. "The Impact of Trees on the UHI Effect and Urban Environment Quality: A Case Study of a District in Pisa, Italy" Atmosphere 15, no. 1: 123. https://doi.org/10.3390/atmos15010123
Note that from the first issue of 2016, this journal uses article numbers instead of page numbers. See further details here.