
Aerosol Optical Depth Retrieval for Sentinel-2 Based on Convolutional Neural Network Method

1
Department of Surveying and Geoinformatics, Nanjing University of Posts and Telecommunications, Nanjing 210023, China
2
Smart Health Big Data Analysis and Location Services Engineering Lab. of Jiangsu Province, Nanjing 210023, China
*
Author to whom correspondence should be addressed.
Atmosphere 2023, 14(9), 1400; https://doi.org/10.3390/atmos14091400
Submission received: 31 July 2023
/
Revised: 3 September 2023
/
Accepted: 4 September 2023
/
Published: 5 September 2023
(This article belongs to the Section Aerosols)
Abstract
:Atmospheric aerosol significantly affects the climate environment and public health, and Aerosol Optical Depth (AOD) is a fundamental optical characteristic parameter of aerosols, so it is important to develop methods for obtaining AOD. In this work, a novel AOD retrieval algorithm based on a Convolutional Neural Network (CNN) method that could provide continuous and detailed aerosol distribution is proposed. The algorithm utilizes data from Sentinel-2 and Aerosol Robotic Network (AERONET) spanning from 2016 to 2022. The CNN AOD data are consistent with the AERONET measurements, with an R2 of 0.95 and RMSE of 0.049 on the test dataset. CNN demonstrates superior performance in retrieving AOD compared with other algorithms. CNN retrieves AOD well on high reflectance surfaces, such as urban and bare soil, with RMSEs of 0.051 and 0.042, respectively. CNN efficiently retrieves AOD in different seasons, but it performs better in summer and winter than in spring and autumn. In addition, to study the relationship between image size and model retrieval performance, image datasets of 32 × 32, 64 × 64 and 128 × 128 pixels were created to train and test the CNN model. The results show that the 128-size CNN performs better because large images contain rich aerosol information.
1. Introduction
Atmospheric aerosols are solid, liquid, or solid–liquid mixed particles suspended in the atmosphere with an aerodynamic diameter of less than 100 µm. These particles are mainly distributed in the stratosphere and troposphere at the lower portion of the atmosphere. Aerosols exhibit a complex and variable composition resulting from a combination of natural emissions and human activities, including anthropogenic aerosols, such as sulfates and biomass-burning aerosols, as well as natural aerosols, such as dust and sea salt, mineral dust, and primary biological aerosol particles [1].
Aerosol, which plays a crucial role in the Earth’s atmospheric system, has a significant influence on radiation balance, climate change, atmospheric environmental quality, and human health [2,3,4,5,6]. Aerosol particles could change Earth’s radiation budget through scattering and absorbing incoming solar radiation [7]. Aerosols also have an indirect effect on climate by altering cloud microstructure [8,9]. In addition to the above-mentioned aerosol cloud microphysical effects, aerosols can also change the atmospheric thermodynamic characteristics through aerosol–radiation interaction, thereby altering the atmospheric circulation, thus affecting the occurrence of clouds and precipitation [10]. For example, black carbon aerosols can heat the atmosphere, evaporate cloud droplets to reduce cloud cover [11], create stable atmospheric stratification [12], weaken convection, and reduce rain showers. High concentrations of aerosol particles seriously affect human health [13,14,15]. A number of studies have shown that the incidence of cardiopulmonary disease is closely related to the content of particulate matter in polluted air [16,17,18], especially the inhalable fine particles, such as PM2.5, which can be inhaled into the lungs, attached to the alveoli, or entered into the blood circulation through the alveoli, posing a great threat to human health [19,20]. Outdoor air pollution, primarily caused by PM2.5, results in the premature deaths of tens of thousands of people worldwide every year [21]. Moreover, the chemical composition of aerosol particles may contain or adsorb toxic gases, viruses, bacteria, and heavy metal elements in the air, which will increase the risk of cancer after entering the human body [22]. Accordingly, the need for monitoring and controlling aerosols has become increasingly crucial. Aerosol Optical Depth (AOD) is a fundamental optical characteristic parameter that is the integral of the extinction coefficient of the atmospheric medium in the vertical direction. AOD is a vital indicator for monitoring aerosols and an indispensable parameter for estimating PM2.5. Therefore, it is important to obtain accurate AOD.
At present, detection instruments, such as multi-band sun-photometers and lidar, are widely used to obtain aerosol property parameters. The accuracy of AOD data provided by the ground-based aerosol network is high. However, continuous spatiotemporal data are difficult to provide due to the limitations of high operating costs, uneven site distribution, and limited spatial coverage. Satellite remote sensing has emerged as an important means for aerosol monitoring and research due to its ability to provide a rapid response and large-area, long-term series monitoring. In the past few decades, several scholars have exerted efforts to explore the properties of aerosols from satellite images and have accomplished numerous achievements [23,24,25,26]. The famous Dark Target (DT) algorithm is a widely used aerosol retrieval algorithm that uses the linear relationship between the visible band and mid-infrared band to estimate the surface reflectance of red and blue bands and retrieves AOD from Moderate Resolution Imaging Spectroradiometer (MODIS) images according to the lookup table [27]. The DT algorithm is highly effective in retrieving AOD and can be used to retrieve AOD on vegetation surface and ocean areas. Nevertheless, this algorithm may not be applicable in desert and snowy regions. Considering the difficulty of utilizing instruments to retrieve aerosols in arid, semi-arid, and urban areas, some scholars developed the Deep Blue (DB) algorithm, which assumes that the surface reflectance of most figures remains unchanged in a relatively short period of time and retrieves AOD by creating a seasonal surface reflectance database [28]. Subsequently, a highly accurate Multi-angle Implementation of Atmospheric Correction (MAIAC) algorithm was developed on the basis of the dynamic time series analysis [29]. This algorithm can be used to retrieve the surface bidirectional reflection factor and AOD on vegetation surface and bright targets [30]. In recent years, people have paid more attention to air pollution, resulting in increased demand for high-accuracy aerosol retrieval, and the emergence of deep learning has brought new options for high-accuracy aerosol retrieval. Deep learning has strong nonlinear fitting ability [31,32] that can discover the potential behavior of the system from long-term observations [33]. This mechanism can be used as a statistical method to extract remote sensing information for quantitative parameter retrieval problems. Chen et al. [34] retrieved AOD in China based on Himawari-8 satellite data and deep neural networks, with a correlation coefficient of up to 0.87. Chen et al. [35] developed an aerosol retrieval model based on Convolutional Neural Network (CNN), and 68% of the retrieved AOD values are within the MODIS expected error (EE) envelope over land of ± (0.05 + 15%). In-depth research on deep learning by scholars shows that deep learning has the superiority of high accuracy in predicting atmospheric parameters [36,37,38,39].
In this paper, a new aerosol retrieval method based on CNN was developed and used Sentinel-2 satellite images from 2016 to 2022 to retrieve AOD. CNN could directly retrieve AOD from satellite images, simplifying the steps of aerosol retrieval and improving its stability and spatiotemporal adaptability. CNN could provide continuous and detailed aerosol distribution to fill the observation gap in the ground-based monitoring network and provide a theoretical basis and application method for the research on climate change and environmental pollution. Section 2 describes the satellite images and ground-based measurement AOD data for the CNN model training and testing. Section 3 gives the details of data processing and CNN model structure. The validation results of the CNN AOD and the CNN performance from different seasons, surface types, and scales are discussed in Section 4. Finally, the conclusions are drawn in Section 5.
2. Materials
2.1. Aerosol Robotic Network (AERONET) Data
AERONET is a global aerosol optical property monitoring network established by the National Aeronautics and Space Administration. This network uses the CIMEL automatic sun-photometer as the basic observing instrument [40], which can observe aerosol characteristics at eight wavelengths from visible to near-infrared every 15 min, and the network consists of more than 1500 sites around the world [41]. These sites have been providing researchers with long-term, stable, and easily accessible aerosol data for decades. AERONET aerosol data are divided into three levels: Level 1.0 (unscreened), Level 1.5 (cloud-cleared and quality controls), and Level 2.0 (automatically cloud-cleared and quality-assured). The number of ground-based AODs available at level 2.0 is limited. Accordingly, level 1.5 data are selected for unified sampling to have sufficient samples. East Asia is the ideal research area for training and testing an AOD retrieval model because of the complex and variable composition of aerosols and abundant distribution of AERONET sites. V3 Level 1.5 data from 22 sites in East Asia from 2016 to 2022 were obtained in this study based on the climate, the land cover types around the sites, and the effectiveness and availability of observation data. Figure 1 shows the distribution of 22 sites used in this work, and Table 1 provides the site name, location, abbreviation, corresponding coordinates, and matched number with satellite images of each site.
2.2. Sentinel-2 Data
Sentinel-2 is an Earth observation mission in the European Space Agency’s Copernicus program, and it consists of two polar-orbiting satellites: Sentinel-2A and Sentinel-2B. Every satellite carries a multi-spectral instrument to acquire 13 spectral bands from visible to shortwave infrared along a 290 km-wide orbital belt. The revisit period is 10 days for each satellite and 5 days for the combined system [42]. Sentinel-2 provides land surface images with spatial resolutions of 10, 20, and 60 m/pixel covering the global land, which is convenient for scholars to apply in remote sensing analysis fields, such as forest monitoring, land cover change monitoring, and natural disaster management. Sentinel-2 is superior for characterizing high spatial resolution and relatively high temporal resolution simultaneously, making it possible to obtain a continuous and detailed aerosol distribution map. The European Space Agency provides free Sentinel-2 Level-1C products, which are the atmospheric apparent reflectance products that have been finely orthorectified and sub-pixel geometric corrected. In this study, Sentinel-2 L1C images from Bands 2, 4, 8, and 12 from 2016 to 2022 were selected (Table 2).
2.3. MODIS and Himawari-8 Data
MODIS has provided scholars with different types of global aerosol products for decades, among which MODIS AOD standard products over land include AOD retrieved by the MAIAC algorithm, DT algorithm, DB algorithm, and combined Dark Target and Deep Blue (DTB) [34]. At present, the MODIS MAIAC aerosol products have been developed for the C6.0 version, and the DT, DB, and DTB aerosol products have been developed for the C6.1 version [28]. In 2015, the Japan Meteorological Agency began operating the geostationary satellite Himawari-8 and providing remote sensing data with a high temporal resolution (10 min) [43]. The MODIS data used in this study are the daily aerosol product MCD19A2 of C6.0 and MOD04_L2 of C6.1 Level 2 with spatial resolutions of 1 and 10 km/pixel, respectively (Table 3). The Himawari-8/AHI level 3 hourly Yonsei Aerosol Retrieval (YAER) product with a spatial resolution of 0.05 °/pixel was used in this work [44]. These aerosol products were selected to evaluate the reasonability of the spatial distribution of the CNN AOD.
3. Methods
3.1. Data Preprocessing
The dataset was constructed using multiple data preprocessing steps, including band interpolation, resampling, pixel screening, and spatiotemporal matching (Figure 2). Considering that CNN AOD must be compared with MODIS aerosol products, MODIS AOD is the AOD at 550 nm, whereas AERONET AOD does not have such a wavelength. Consequently, band interpolation is required. The AERONET AODs at 500 and 675 nm are interpolated into AOD at 550 nm using the Ångström exponent.
where τ500 denotes the AOD at 500 nm, τ675 represents the AOD at 675 nm, α is the Ångström exponent at 500–675 nm, and τ550 indicates the AOD at 550 nm obtained by interpolation.
Considering that Sentinel-2 L1C products are resampled at different ground sampling distances (10, 20, and 60 m/pixel) based on the native resolution of different spectral bands [45], the L1C products must be first resampled to unify the spatial resolution before aerosol retrieval. In this study, all satellite images were resampled to 10 m/pixel. Satellite images are pixel-screened to remove samples containing light, clouds, cloud shadows, and snow from the dataset to improve the quality of samples and minimize the influence of the aforementioned factors. The AERONET AOD data after band interpolation are selected to match with the screened satellite images. Assuming that the aerosol concentration does not change in a short period of time, the average sun-photometer AOD value within ±30 min of the satellite overpass is selected to match with the satellite image. Assuming that the aerosol properties do not change within an area of 1.28 km × 1.28 km, the Sentinel-2 image within the range of 128 × 128 pixels is cropped as a satellite image sample with the AERONET site in the center. The satellite image and ground-based AOD data in the same spatiotemporal are paired together to provide samples for the model.
When training deep learning models, data augmentation methods, such as rotation, scaling, and translation, are frequently used to produce more samples to improve the generalization ability and robustness of the model [46]. The remote sensing images are processed by a horizontal translation of 0.1 to expand the dataset, enabling the model to better learn features from these images and avoid model overfitting. In this study, 2575 pairs of samples were successfully matched from the AERONET AOD data and Sentinel-2 images. Before training, all image samples are resized to 128 × 128 pixels. A total of 2575 pairs of samples are randomly assigned to the training dataset (2060 pairs) and the test dataset (515 pairs) in an 8:2 ratio.
3.2. CNN Model
CNN, which is a deep learning algorithm, consists of a series of convolution and pooling layers that extract relevant features from the input image, followed by one or more fully connected layers that use these features to make a prediction. It has the characteristics of sparse connections, parameter sharing, and translation invariance, greatly minimizing the number of network parameters that need to be optimized, improving the training speed, and facilitating the extraction of partial features in images. CNN is able to capture spatial features and patterns in images using a hierarchical architecture of layers that perform convolution operations and extract features at different levels of abstraction [47]. So, this algorithm has remarkable advantages for image analysis and recognition. The CNN model proposed in this work consists of 10 convolution layers, 4 max-pooling layers, 1 Global max-pooling layer, and 1 fully connected layer, as shown in Figure 3. Every convolutional block is followed by a max-pooling layer to minimize the number of parameters and compress image features to reduce computation and memory consumption. The last max-pooling layer is followed by a Global max-pooling layer, which can flatten the multidimensional image to obtain a feature vector with a size of 512. In addition, dropout regularization is used to randomly turn off some neurons with a certain probability during each iteration of training of the neural network [48]. Accordingly, each neuron does not necessarily participate in network training every time, and the updating of network weights no longer depends on the joint action of implicit nodes with fixed relationships. This approach prevents some features from being effective only under other specific features, reduces the dependence of model on some partial features, and enhances the generalization ability of the model. All convolutional layers use small-size 3 × 3 convolutional filters with size 1 stride and select the “same” padding to maintain the spatial resolution of the feature map. All max-pooling operations are performed over a window of 2 × 2 pixels with size 2 stride and the “same” padding to minimize the spatial resolution of the feature map by half.
The loss function, activation function, and optimizer should be configured before training. After the training data of every iteration is inputted into the model, the model will output the predicted value through forward propagation, and the loss function will calculate the difference between the predicted and the true values. After the loss value is obtained, the model will update each parameter through back propagation to minimize the loss. Accordingly, the predicted value output by the model will be closer to the true value. Mean Absolute Error (MAE) was used as the loss function of the model in this study. The nonlinear activation function ReLU is selected as the activation function to minimize the interdependence between parameters. During the back propagation, the optimizer can guide the model parameters to update in the correct direction. Consequently, the updated parameters maintain the loss value close to the global minimum. The Adam optimization algorithm is used for network training, and the learning rate is set to 0.001 to minimize the MAE between retrieved AOD and true AOD. After the CNN is trained, the model with the smallest MAE between CNN AOD and AERONET AOD is selected as the final CNN model.
3.3. Evaluation Methods
Spearman R, Pearson R, R2, Root Mean Square Error (RMSE), MAE, Within the MSI Expected Error (Within EE), Above EE, and Below EE were used as evaluation indicators in this study. Pearson R is sensitive to outliers and suitable for evaluating linear relationships. On the other hand, Spearman R is not affected by outliers and is suitable for evaluating nonlinear relationships. The model performance can be effectively evaluated using these two correlation coefficients as evaluation indexes.
Random Forest (RF) and VGG16 algorithms are selected for comparison and verification with the CNN model to verify the rationality of the CNN model. RF is an ensemble learning algorithm [49] that can evaluate the importance of every feature in classification problems, judge the interaction between different features, and capture the complex relationship between input feature vectors and output values. VGG is a classic CNN structure that is widely used in computer vision tasks, such as image classification, object detection, and semantic segmentation. VGG16 is a network structure in VGG [50].
4. Results and Discussion
4.1. Overall Validation of the CNN Model
AERONET AODs were used to compare and analyze the AOD retrieved by the CNN model on the training and test datasets. In the training dataset, the retrieved AOD is in good agreement with AERONET AOD, with an R2 of 0.99, RMSE of 0.021, and Within EE of 99%, as shown in Figure 4. Only 1% of the data is higher than EE, indicating a very slight overestimation of the model in the training dataset. The result of CNN performance on the test dataset is similar to that on the training dataset. In the test dataset, R2 is 0.95, RMSE is 0.049, and Within EE is 95%, indicating that CNN can provide accurate AOD concentration and distribution at a relatively fine temporal resolution (5 days). Approximately 3% of AODs are higher than EE, and 2% of AODs are lower than EE, indicating a slight deviation in the CNN AOD.
In the satellite images, the top-of-atmosphere signals are composed of coupled contributions from the surface and atmosphere, hence, the signal-to-noise-ratio of the high-AOD aerosols is larger than that of the low-AOD aerosols [35]. In the test dataset, 52% of the AERONET AODs are in the range of 0 to 0.16, and 48% are in the range of 0.16 to 1.6. The test dataset was divided into two parts to examine the accuracy of the CNN model in retrieving low and high AODs: the low AOD test dataset ([0, 0.16]) and the high AOD test dataset ([0.16, 1.6]). Table 4 illustrates that MAE and RMSE in the low AOD are lower than those in the high AOD. On the other hand, the Within EE in the low AOD is similar to that in the high AOD. This finding indicates that CNN can better retrieve AOD in areas with good air quality. In the low AOD, 6% of AODs are higher than EE and no data is lower than EE. In the high AOD, 1% of AODs are higher than EE and 4% of AODs are lower than EE. The result shows that the CNN model slightly overestimates the low values and underestimates the high values.
The AOD retrieval performance of the CNN model on the test dataset was subdivided by season and land cover type. CNN performs better in summer and winter than in spring and autumn (Table 5). From the perspective of the various validation indicators, the performance of CNN in winter is the best, with an R2, MAE, RMSE, and Within EE of 0.97, 0.024, 0.037, and 97%, respectively. The excellent CNN performance in winter may be related to the large amount of winter data. The performance of CNN in summer is the second best, with an R2 of 0.96 and RMSE of 0.045. On the other hand, the performance of CNN in autumn is similar to that in summer, with an R2 of 0.94 and RMSE of 0.046. The CNN performance in spring is poorer compared with those in the other three seasons, with an R2 of 0.93 and RMSE of 0.062.
CNN efficiently performs AOD retrieval on the different land cover types (Table 6). CNN exhibits excellent retrieval accuracy in the vegetation surface, with an R2 of 0.92 and RMSE of 0.044. When the surface reflectance is high, the satellite sensors can obtain less information about aerosols, making it difficult to retrieve aerosols on high-reflectance surfaces [51]. However, CNN still shows great retrieval performance on land cover types with high surface reflectance, such as urban and bare soil, with an R2 of 0.96 and 0.90 and RMSE of 0.051 and 0.042, respectively.
4.2. Retrieval Performance of the CNN Model at Different Scales
The AOD retrieval performance of the CNN model on the test dataset was subdivided into two scale types: regional scale and ground-based AERONET site scale, to analyze CNN performance in different regions and sites. The retrieval performance of CNN in North China, Taiwan, South Korea, and Japan is shown in Figure 5. There is no analysis of Tibet and Hong Kong here because of the small amount of data in these regions. CNN performed best in South Korea, with an RMSE of 0.037, R2 of 0.92, and Within EE of 98%. Moreover, 2% of AODs are lower than EE, indicating a slight underestimation of CNN in South Korea. In North China, CNN could accurately retrieve AOD with an R2 of 0.97, RMSE of 0.047, and Within EE of 96%. Furthermore, 2% of AODs are higher than EE, whereas 2% are lower than EE, indicating a slight deviation of CNN AOD in North China. The more data in the region, the more regional features the model could capture. The largest amount of data can be found in North China. However, the retrieval performance of CNN in North China is not as good as that in South Korea, which may be because the aerosol concentration in North China is complex and changeable, and it is difficult for CNN to learn the aerosol characteristics in this region. CNN did not perform well in Taiwan, with its RMSE being the highest of the four regions. CNN performed the worst in Japan, with an R2 of 0.78, RMSE of 0.045, and Within EE of 91%, which may be related to the smaller amount of data obtained in Japan. The annual average AOD in Japan is the lowest, and the CNN model slightly overestimates the low AODs with an Above EE of 6% (Table 4), so the CNN tends to overestimate the AOD in Japan, which has an Above EE of 8% and is significantly higher than those in North China and South Korea.
The CNN performance at each site is shown in Figure 6. Given the limited amount of data at TB01 and KR1, only one TB01 data and two KR1 data were divided into the test dataset. Consequently, the retrieval performance at these two sites is not shown. The AOD retrieval accuracy at NC02 is the highest, with an R2, RMSE, and Within EE of 0.98, 0.027, and 99%, respectively. This result may be due to the largest amount of data being at NC02, with up to 311 pairs of samples, from which CNN could capture more accurate image features. Moreover, the land cover type at NC02 is simple and mainly urban. In addition, CNN performed well at TW01, with its RMSE being the lowest among all sites (0.016). The land cover type at TW01 is simple, with the vast majority of the area covered by vegetation, and CNN can obtain more aerosol information in an area with low surface reflectance. The AOD retrieval accuracy at JP4 is the lowest, with an R2 of 0.73, RMSE of 0.095, and Within EE of 67%. CNN overestimated the AOD at JP4 with an Above EE of 33%. The low accuracy of CNN AOD at JP4 is due to two reasons. First, high AOD more frequently occurs in China and South Korea than in Japan [52], and the annual average AOD in Japan is the lowest, so CNN tends to overestimate the AOD in Japan. Second, the data at JP4 are few (only 52 pairs of samples). The deep learning model requires a large number of samples, and CNN would have difficulty exploring the characteristics of the site using only a few samples. In addition, CNN did not perform well at TW03, with its RMSE being the highest of all sites (0.122). TW03 is characterized by a relatively complex land cover type, primarily dominated by urban areas with some vegetation coverage. Moreover, the amount of data obtained at TW03 is small, with only 55 pairs of samples. Accordingly, the accuracy of CNN AOD at TW03 is low. CNN exhibits a slight AOD deviation at most sites. Nonetheless, the CNN AOD at HK01, HK02, KR4, and JP3 reaches 100% Within EE, and no AOD is higher or lower than EE at all. CNN retrieved AOD better at sites with more data, indicating that CNN can obtain more features at sites with more data. Expanding the dataset may help the model to better extract image features related to aerosols, and a large dataset could be made for model training in the future.
4.3. Comparison with Other Models
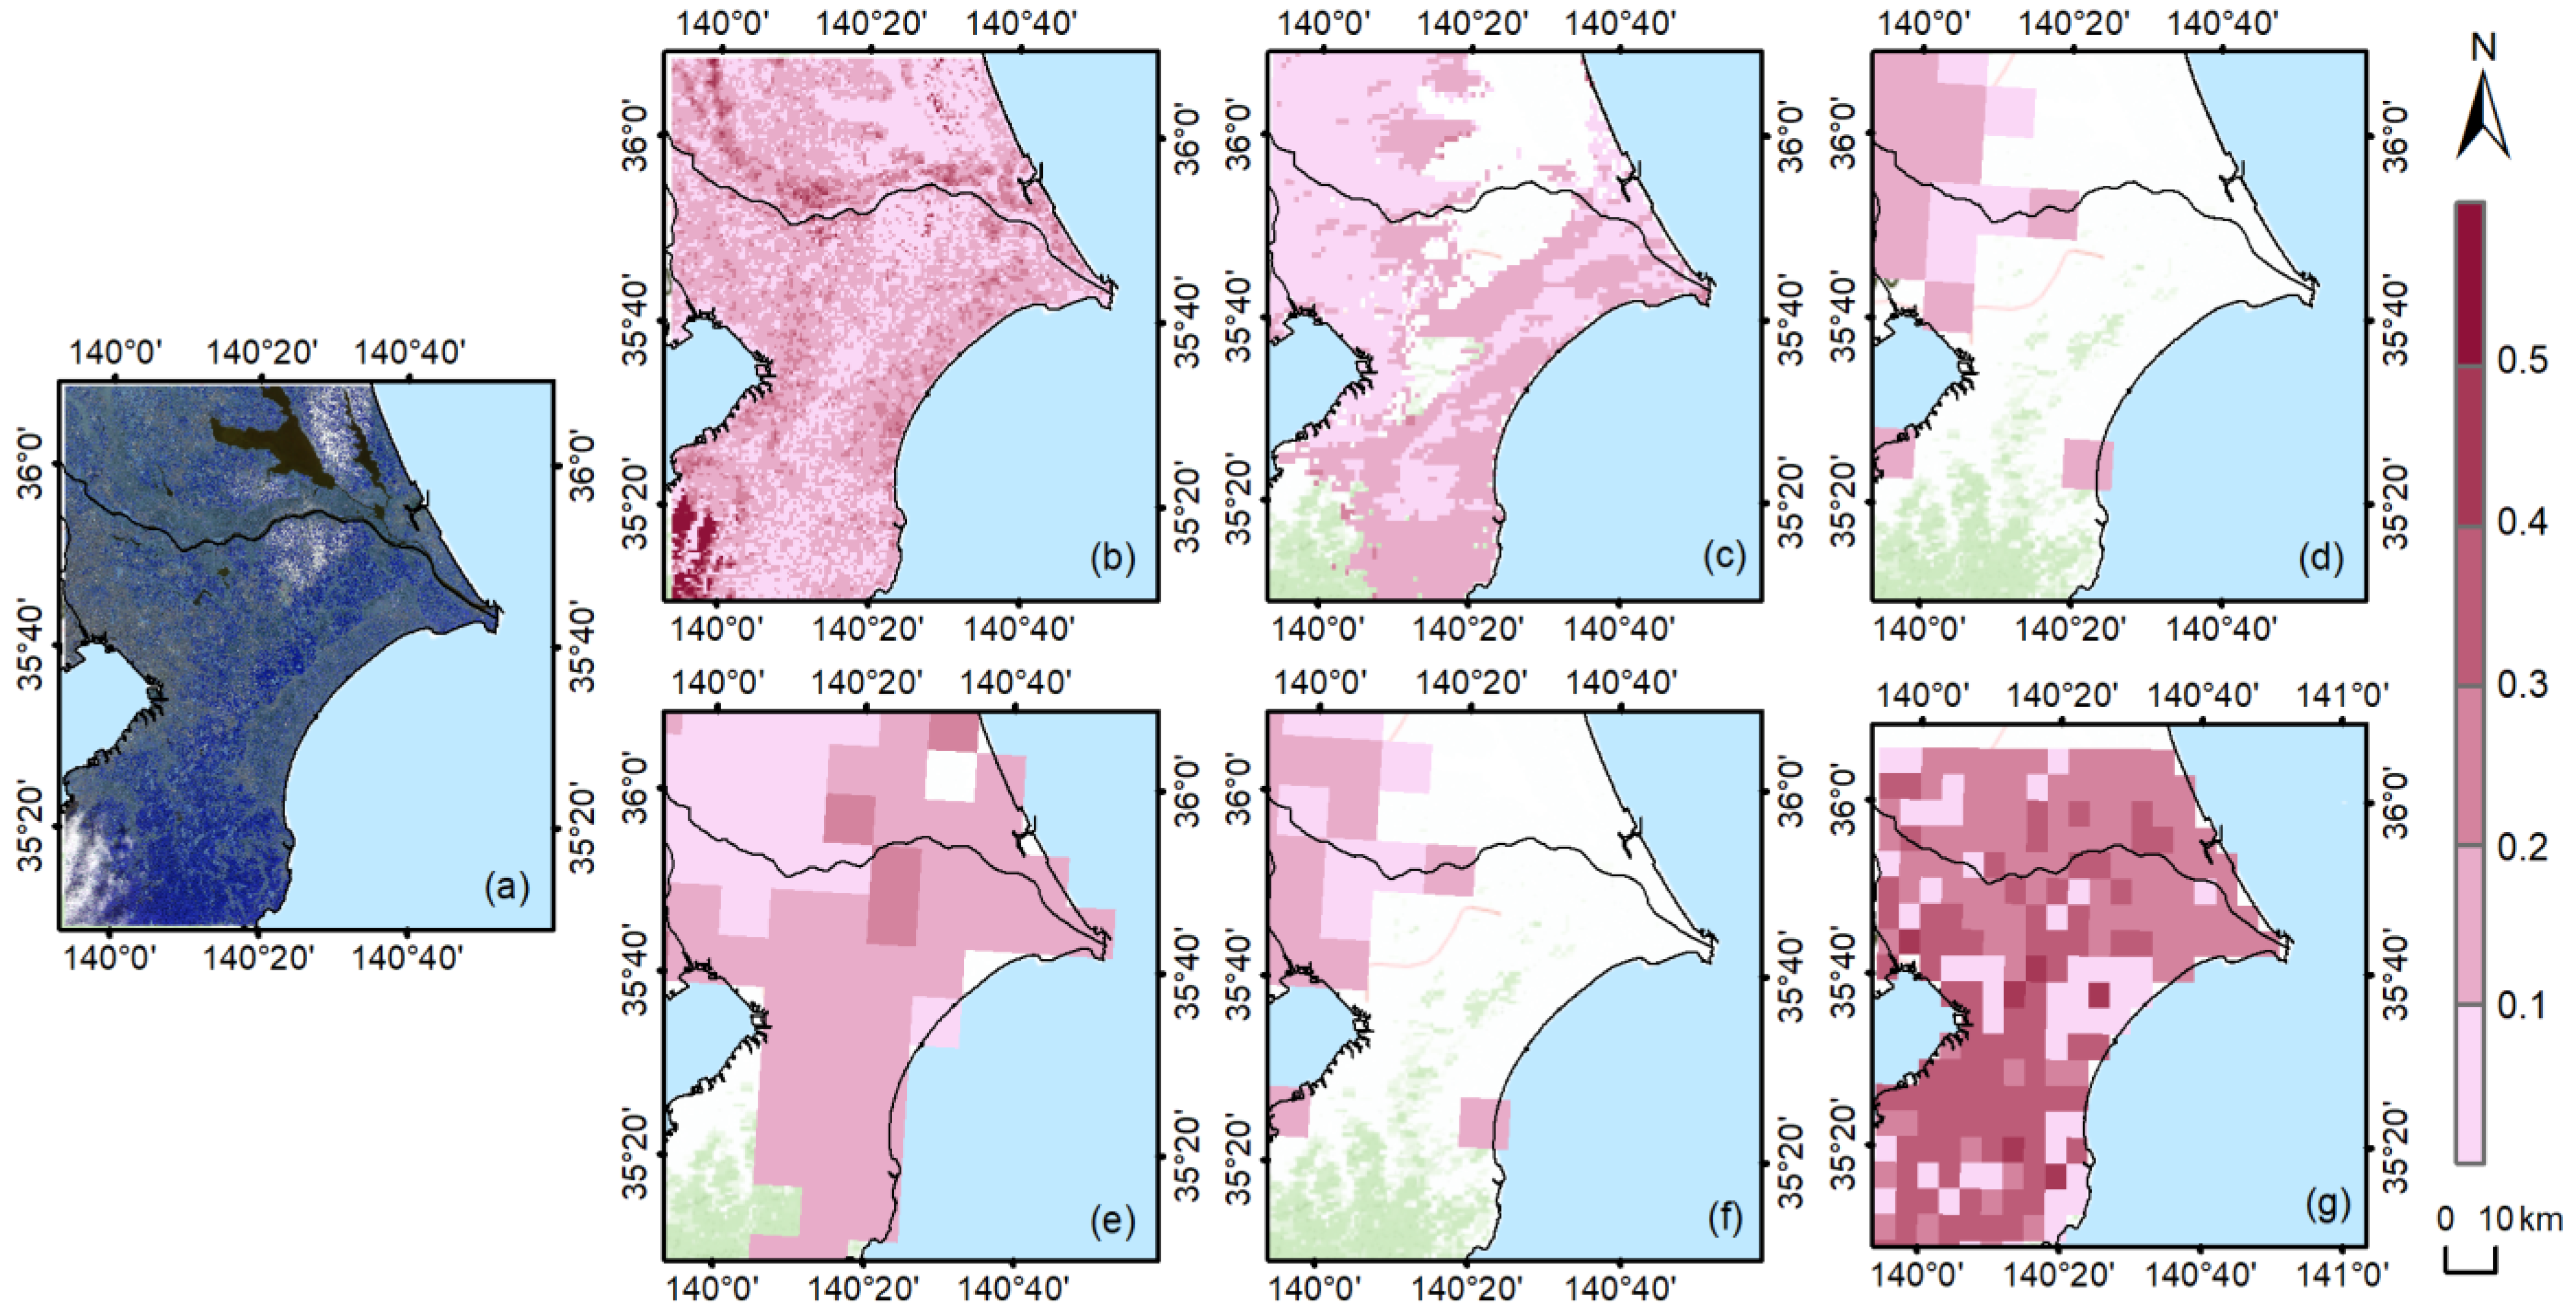
The MODIS and Himawari-8 aerosol products were selected to evaluate the rationality of the spatial distribution of CNN AOD. Figure 7a shows a Sentinel-2 satellite image over Chiba and Ibaraki in Japan on 12 February 2019, with no snow and clouds in most areas, making it suitable for AOD retrieval. Figure 7c–g shows MODIS MAIAC, DT, DB, DTB, and Himawari-8 aerosol products over Japan, with spatial resolutions of 1 km/pixel, 10 km/pixel, 10 km/pixel, 10 km/pixel, and 0.05 °/pixel, respectively. Figure 7b shows the spatial distribution of AOD retrieved by CNN. CNN AODs are calculated with a step size of 64 pixels and an input image size of 128 × 128 to facilitate display and comparison, resulting in a spatial resolution of 640 m/pixel. Figure 7a depicts some cloud and snow cover in the lower left corner and middle upper areas of the image. Incorrect AODs are retrieved by CNN due to the interference of clouds and snow. Except for the cloud and snow coverage area, the spatial distribution of CNN AOD and MODIS AOD is similar, and the overall AOD concentration of the image coverage area is low. Some coastal areas show relatively high AODs due to dense human habitation and intensive industrial agglomeration. On the other hand, inland and southern mountain areas show relatively low AODs. The Himawari-8 aerosol product shows an overall higher AOD, which is not consistent with MODIS AOD and CNN AOD. The MODIS AOD product is more reliable than the Himawari-8 AOD product [34]. Specifically, the CNN AOD that is more similar to MODIS AOD can reasonably reflect the AOD concentration. The distribution maps of the CNN AOD and Himawari-8 AOD cover the entire land. The data coverage rate of the MODIS aerosol products is low, and many no-value regions exist. The CNN AOD and Himawari-8 AOD can provide continuous AOD spatial distribution. Furthermore, the high spatial resolution map of the CNN AOD shows the spatial details that cannot be reflected in the rough spatial resolution of 1 km/pixel, 10 km/pixel, and 0.05 °/pixel. The AOD retrieved by CNN is closer to the ground-based AOD, with an RMSE of 0.049. In contrast, the RMSE values of MODIS MAIAC, DT, DB, and Himawari-8 AOD are 0.15, 0.22, 0.17, and 0.14, respectively, which are less accurate than CNN.
The CNN model was compared with RF and VGG16 to further evaluate the AOD retrieval performance of CNN. The RF and VGG16 algorithms were trained and tested using the dataset produced in this study. The output layer of VGG16 was changed to a fully connected layer with size 1 because it is a classification model that eventually divides into 1000 categories. The AOD retrieval performance of each model is shown in Table 7. The results of MAIAC, DT, DB, and YAER are from a study by Choi et al. [53], in which the MODIS and Himawari-8 aerosol products in East Asia are validated. CNN shows outstanding advantages in AOD retrieval, and all verification indicators are the best values, with an RMSE of 0.049, and significantly lower than those of other models. The R2 of CNN is 0.95, which is higher than those of other models. RF performs well, with an R2 of 0.86, which is higher than the 0.70 of VGG16. The RMSE of RF is 0.085, which is lower than the 0.123 of VGG16. The results show that CNN demonstrates significant advancements in addressing AOD retrieval problems compared with most previous algorithms.
4.4. Retrieval Performance as a Function of Satellite Image Size
Image datasets of 32 × 32, 64 × 64, and 128 × 128 pixels were constructed to explore the relationship between image size and AOD retrieval performance. The model was retrained with datasets of different sizes, and the hyperparameters of CNN were adjusted. The smaller the size, the less information the satellite image contains. Accordingly, the image feature vector of the fully connected layer in the CNN was reduced to 80 when the model was trained with datasets of 64 and 32 sizes. The AOD retrieval performance on the dataset with different sizes is shown in Table 8. The 128-size model works best, with an R2 of 0.95, which is 0.03 and 0.02 higher than those of the 32-size model and 64-size model, respectively. The RMSE of the 128-size model is 0.049, which is 0.016 and 0.011 lower than those of the 32-size model and 64-size model, respectively. The 32-size model performed worst, with the lowest R2, highest MAE, and highest RMSE among the three models, and its overestimation and underestimation are the most severe. The better results of the model trained with a larger image dataset indicate that the 128-size image contains richer aerosol information.
5. Conclusions
In this study, a novel AOD-retrieval model based on CNN was developed, which can directly retrieve AOD from Sentinel-2 satellite images, improving the stability and spatiotemporal adaptability of aerosol retrieval. The CNN model consists of 10 convolutional layers, 4 max-pooling layers, 1 Global max-pooling layer, and 1 fully connected layer. The image features related to aerosol load in Sentinel-2 images of four bands were extracted using the excellent image feature extraction function of CNN. The correlation between the AOD and the remote sensing images was modeled to achieve AOD retrieval. Taking East Asia as the research area, the data of 22 AERONET sites from 2016 to 2022 were obtained, and the satellite image and ground-based AOD data in the same spatiotemporal were paired together to make 2575 pairs of samples. The samples were enhanced by a horizontal shift of 0.1. The model was trained and tested by selecting data in a ratio of 8:2 from samples. The results are as follows:
- (1)
- The proposed model can accurately retrieve AOD, with an R2 of 0.95, RMSE of 0.049, and Within EE of 95% on the test dataset. The AOD-retrieval accuracy of CNN is higher compared with those of the DT, DB, DTB, MAIAC, YAER, RF, and VGG16 algorithms. In addition, CNN could provide continuous and detailed aerosol distribution to fill the observation gap in existing ground-based monitoring networks.
- (2)
- CNN efficiently performs AOD retrieval on different land cover types: vegetation surface, urban, and bare soil. When the surface reflectance is high, the satellite sensors can obtain less information about aerosols, making it difficult to retrieve aerosols on a high-reflectance surface. However, CNN still shows great AOD retrieval potential on surfaces with high surface reflectance, such as urban and bare soil, with an R2 of 0.96 and 0.90 and RMSE of 0.051 and 0.042, respectively.
- (3)
- CNN performs better in summer and winter than in spring and autumn. The performance of CNN in winter is the best, with an R2 of 0.97 and RMSE of 0.037. The performance of CNN in summer is the second best. The CNN performance in spring is poorer compared with those in the other three seasons, with an R2 of 0.93 and RMSE of 0.062.
- (4)
- To investigate the relationship between image size and model retrieval performance, datasets of 32, 64, and 128 sizes were created to train and test the CNN. The 128-size CNN performed better because of the rich AOD information in the 128-size image.
Author Contributions
Conceptualization, methodology, validation, writing, visualization, J.J. and J.L.; writing—review and editing, D.J. All authors have read and agreed to the published version of the manuscript.
Funding
This research was funded by NUPTSF, grant number NY220211.
Data Availability Statement
The AERONET data are available at https://aeronet.gsfc.nasa.gov, Sentinel-2 images can be obtained at https://scihub.copernicus.eu/dhus/#/home, accessed on 1 February 2023, the MODIS aerosol products are available at https://ladsweb.modaps.eosdis.nasa.gov/search/, accessed on 1 February 2023, and the Himawari-8 aerosol products are available at https://www.eorc.jaxa.jp/ptree/, accessed on 1 February 2023.
Acknowledgments
The authors thank the PIs, site managers, and other staff for operations in AERONET sites used in this investigation. They also thank the Finance science and technology project of Hainan province (ZDYF2020206) for its support with AERONET work. The authors are also grateful to ESA for providing Sentinel-2 data. The authors acknowledge MODIS and Himawari-8 groups for the aerosol products.
Conflicts of Interest
The authors declare no conflict of interest.
References
- Xue, Y.; He, X.W.; Xu, H.; Guang, J.P.; Guo, J.P.; Mei, L.L. China Collection 2.0: The aerosol optical depth dataset from the synergetic retrieval of aerosol properties algorithm. Atmos. Environ. 2014, 95, 45–58. [Google Scholar] [CrossRef]
- Zhao, G.; Zhu, Y.; Wu, Z.; Zong, T.; Chen, J.; Tan, T.; Wang, H.; Fang, X.; Lu, K.; Zhao, C.; et al. Impact of aerosol–radiation interaction on new particle formation. Atmos. Chem. Phys. 2021, 21, 9995–10004. [Google Scholar] [CrossRef]
- Dong, B.; Wilcox, L.J.; Highwood, E.J.; Sutton, R.T. Impacts of recent decadal changes in Asian aerosols on the East Asian summer monsoon: Roles of aerosol–radiation and aerosol–cloud interactions. Clim. Dyn. 2019, 53, 3235–3256. [Google Scholar] [CrossRef]
- Mhawish, A.; Banerjee, T.; Broday, D.M.; Misra, A.; Tripathi, S.N. Evaluation of MODIS Collection 6 aerosol retrieval algorithms over Indo-Gangetic Plain: Implications of aerosols types and mass loading. Remote Sens. Environ. 2017, 201, 297–313. [Google Scholar] [CrossRef]
- Charlson, R.J.; Schwartz, S.E.; Hales, J.M.; Cess, R.D.; Coakley, J.A.; Hansen, J.E.; Hofmann, D.J. Climate Forcing by Anthropogenic Aerosols. Science 1992, 255, 423–430. [Google Scholar] [CrossRef]
- Sokolik, I.N.; Toon, O.B. Direct radiative forcing by anthropogenic airborne mineral aerosols. Nature 1996, 381, 681–683. [Google Scholar] [CrossRef]
- Wang, S.H.; Huang, H.Y.; Lin, C.H.; Pani, S.K.; Lin, N.H.; Lee, C.T.; Janjai, S.; Holben, B.N.; Chantara, S. Columnar aerosol types and compositions over peninsular Southeast Asia based on long-term AERONET data. Air Qual. Atmos. Health 2021, 1–12. [Google Scholar] [CrossRef]
- Rosenfeld, D.; Andreae, M.O.; Asmi, A.; Chin, M.; Leeuw, G.; Donovan, D.P.; Kahn, R.; Kinne, S.; Kivekäs, N.; Kulmala, M.; et al. Global observations of aerosol-cloud-precipitation-climate interactions. Rev. Geophys. 2014, 52, 750–808. [Google Scholar] [CrossRef]
- Twomey, S. Pollution and the planetary albedo. Atmos. Environ. 1974, 8, 1251–1256. [Google Scholar] [CrossRef]
- Liu, L.; Cheng, Y.F.; Wang, S.W.; Wei, C.; Pöhlker, M.L.; Pöhlker, C.; Artaxo, P.; Shrivastava, M.; Andreae, M.O.; Pöschl, U.; et al. Impact of biomass burning aerosols on radiation, clouds, and precipitation over the Amazon: Relative importance of aerosol-cloud and aerosol-radiation interactions. Atmos. Chem. Phys. 2020, 20, 13283–13301. [Google Scholar] [CrossRef]
- Koren, I.; Kaufman, Y.J.; Remer, L.A.; Martins, J.V. Measurement of the Effect of Amazon Smoke on Inhibition of Cloud Formation. Science 2004, 303, 1342–1345. [Google Scholar] [CrossRef] [PubMed]
- Li, Z.Q.; Guo, J.G.; Ding, A.J.; Liao, H.; Liu, J.J.; Sun, Y.L.; Wang, T.J.; Xue, H.W.; Zhang, H.S.; Zhu, B. Aerosol and boundary-layer interactions and impact on air quality. Natl. Sci. Rev. 2017, 4, 810–833. [Google Scholar]
- Sun, Z.; Zhu, D. Exposure to outdoor air pollution and its human health outcomes: A scoping review. PLoS ONE 2019, 14, e0216550. [Google Scholar] [CrossRef] [PubMed]
- Matkovic, V.; Mulić, M.; Azabagić, S.; Jevtić, M. Premature Adult Mortality and Years of Life Lost Attributed to Long-Term Exposure to Ambient Particulate Matter Pollution and Potential for Mitigating Adverse Health Effects in Tuzla and Lukavac, Bosnia and Herzegovina. Atmosphere 2020, 11, 1107. [Google Scholar] [CrossRef]
- Keshavarz, F. Molecular level insights into the direct health impacts of some organic aerosol components. New J. Chem. 2021, 45, 6709–6723. [Google Scholar] [CrossRef]
- Brook, R.D.; Rajagopalan, S.; Pope, C.A.; Brook, J.R.; Bhatnagar, A.; Diez-Roux, A.V.; Holguin, F.; Hong, Y.; Luepker, R.V.; Mittleman, M.A.; et al. Particulate matter air pollution and cardiovascular disease: An update to the scientific statement from the American Heart Association. Circulation 2010, 121, 2331–2378. [Google Scholar] [CrossRef]
- Daellenbach, K.R.; Uzu, G.; Jiang, J.; Cassagnes, L.E.; Leni, Z.; Vlachou, A.; Stefenelli, G.; Canonaco, F.; Weber, S.; Segers, A.; et al. Sources of particulate-matter air pollution and its oxidative potential in Europe. Nature 2020, 587, 414–419. [Google Scholar] [CrossRef]
- Schraufnagel, D.E.; Balmes, J.R.; Cowl, C.T.; Matteis, S.D.; Jung, S.; Mortimer, K.; Perez-Padilla, R.; Rice, M.B.; Riojas-Rodriguez, H.; Sood, A.; et al. Air Pollution and Noncommunicable Diseases: A Review by the Forum of International Respiratory Societies’ Environmental Committee, Part 1: The Damaging Effects of Air Pollution. Chest 2019, 155, 409–416. [Google Scholar] [CrossRef]
- Zhu, J.; Zhang, Y.; Xu, X.; Yan, Y.; Zhu, X.; Li, X. Air Pollution and Health Impacts of Atmospheric PM: Application of AirQ+ Model to Jiangsu Province in China. Int. J. Environ. Res. 2022, 16, 74. [Google Scholar] [CrossRef]
- Dhakal, S.; Gautam, Y.; Bhattarai, A. Exploring a deep LSTM neural network to forecast daily PM2.5 concentration using meteorological parameters in Kathmandu Valley, Nepal. Air Qual. Atmos. Health 2021, 14, 83–96. [Google Scholar] [CrossRef]
- Lelieveld, J.; Evans, J.; Fnais, M.; Giannadaki, D.; Pozzer, A. The contribution of outdoor air pollution sources to premature mortality on a global scale. Nature 2015, 525, 367–371. [Google Scholar] [CrossRef] [PubMed]
- Anenberg, S.C.; Schwartz, J.; Shindell, D.; Amann, M.; Faluvegi, G.; Klimont, Z.; Janssens-Maenhout, G.; Pozzoli, L.; Van Dingenen, R.; Vignati, E.; et al. Global air quality and health co-benefits of mitigating near-term climate change through methane and black carbon emission controls. Environ. Health Perspect. 2012, 120, 831–839. [Google Scholar] [CrossRef] [PubMed]
- Song, S.K.; Shon, Z.H.; Choi, Y.N.; Son, Y.B.; Kang, M.; Han, S.B.; Bae, M.S. Global trend analysis in primary and secondary production of marine aerosol and aerosol optical depth during 2000–2015. Chemosphere 2019, 224, 417–427. [Google Scholar] [CrossRef] [PubMed]
- Li, X.; Zhang, C.; Li, W.; Anyah, R.O.; Tian, J. Exploring the trend, prediction and driving forces of aerosols using satellite and ground data, and implications for climate change mitigation. J. Clean. Prod. 2019, 223, 238–251. [Google Scholar]
- Falah, S.; Mhawish, A.; Omar, A.H.; Sorek-Hamer, M.; Lyapustin, A.I.; Banerjee, T.; Kizel, F.; Broday, D.M. Intercomparison of Aerosol Types Reported as Part of Aerosol Product Retrieval over Diverse Geographic Regions. Remote Sens. 2022, 14, 3667. [Google Scholar] [CrossRef]
- Ceamanos, X.; Six, B.; Moparthy, S.; Carrer, D.; Georgeot, A.; Gasteiger, J.; Riedi, J.; Attié, J.L.; Lyapustin, A.; Katsev, L. Instantaneous aerosol and surface retrieval using satellites in geostationary orbit (iAERUS-GEO)—Estimation of 15 min aerosol optical depth from MSG/SEVIRI and evaluation with reference data. Atmos. Meas. Tech. 2023, 16, 2575–2599. [Google Scholar] [CrossRef]
- Kaufman, Y.J.; Wald, A.E.; Remer, L.; Gao, B.; Li, R.; Flynn, L. The MODIS 2.1-μm channel-correlation with visible reflectance for use in remote sensing of aerosol. IEEE Trans. Geosci. Remote Sens. 1997, 35, 1286–1298. [Google Scholar] [CrossRef]
- Jiang, J.; Liu, J.; Jiao, D.; Zha, Y.; Cao, S. Evaluation of MODIS DT, DB, and MAIAC Aerosol Products over Different Land Cover Types in the Yangtze River Delta of China. Remote Sens. 2023, 15, 275. [Google Scholar] [CrossRef]
- Mhawish, A.; Banerjee, T.; Sorek-Hamer, M.; Lyapustin, A.; Broday, D.M.; Chatfield, R. Comparison and evaluation of MODIS Multi-angle Implementation of Atmospheric Correction (MAIAC) aerosol product over South Asia. Remote Sens. Environ. 2019, 224, 12–28. [Google Scholar] [CrossRef]
- Jethva, H.; Torres, O.; Yoshida, Y. Accuracy assessment of MODIS land aerosol optical thickness algorithms using AERONET measurements over North America. Atmos. Meas. Tech. 2019, 12, 4291–4307. [Google Scholar] [CrossRef]
- Mayr, M.J.; Vanselow, K.A.; Samimi, C. Fire regimes at the arid fringe: A 16-year remote sensing perspective (2000–2016) on the controls of fire activity in Namibia from spatial predictive models. Ecol. Indic. 2018, 91, 324–337. [Google Scholar] [CrossRef]
- LeCun, Y.; Bengio, Y.; Hinton, G. Deep learning. Nature 2015, 521, 436–444. [Google Scholar] [CrossRef] [PubMed]
- Lary, D.J.; Alavi, A.H.; Gandomi, A.H.; Walker, A.L. Machine learning in geosciences and remote sensing. Geosci. Front. 2016, 7, 3–10. [Google Scholar]
- Chen, Y.; Fan, M.; Li, M.; Li, Z.; Tao, J.; Wang, Z.; Chen, L. Himawari-8/AHI Aerosol Optical Depth Detection Based on Machine Learning Algorithm. Remote Sens. 2022, 14, 2967. [Google Scholar] [CrossRef]
- Chen, X.; Leeuw, G.D.; Arola, A.; Liu, S.; Liu, Y.; Li, Z.; Zhang, K. Joint retrieval of the aerosol fine mode fraction and optical depth using MODIS spectral reflectance over northern and eastern China: Artificial neural network method. Remote Sens. Environ. 2020, 249, 112006. [Google Scholar] [CrossRef]
- Wei, J.; Yang, F.; Ren, X.C.; Zou, S. A Short-Term Prediction Model of PM2.5 Concentration Based on Deep Learning and Mode Decomposition Methods. Appl. Sci. 2021, 11, 6915. [Google Scholar] [CrossRef]
- Yuan, H.; Xu, G.; Lv, T.; Ao, A.; Zhang, Y. PM2.5 Forecast Based on a Multiple Attention Long Short-Term Memory (MAT-LSTM) Neural Networks. Anal. Lett. 2020, 54, 935–946. [Google Scholar] [CrossRef]
- Yan, X.; Zang, Z.; Luo, N.; Jiang, Y.; Li, Z. New interpretable deep learning model to monitor real-time PM2.5 concentrations from satellite data. Environ. Int. 2020, 144, 106060. [Google Scholar] [CrossRef] [PubMed]
- Choe, T.H.; Ho, C.S. An improvement of PM2.5 concentration prediction using optimised deep LSTM. Int. J. Environ. Pollut. 2022, 69, 3–4. [Google Scholar]
- Wei, X.; Chang, N.; Bai, K.; Gao, W. Satellite remote sensing of aerosol optical depth: Advances, challenges, and perspectives. Crit. Rev. Environ. Sci. Technol. 2019, 50, 1640–1725. [Google Scholar] [CrossRef]
- Eom, S.; Kim, J.; Lee, S.; Holben, B.N.; Eck, T.F.; Park, S.; Park, S.S. Long-term variation of aerosol optical properties associated with aerosol types over East Asia using AERONET and satellite (VIIRS, OMI) data (2012–2019). Atmos. Res. 2022, 280, 106457. [Google Scholar] [CrossRef]
- Li, G.; Mao, Y.; Feng, X.; Chen, Z.; Yang, Z.; Cheng, X. Monitoring ice flow velocity of Petermann glacier combined with Sentinel-1 and −2 imagery. Int. J. Appl. Earth Obs. 2023, 121, 1569–8432. [Google Scholar] [CrossRef]
- Zhang, Z.; Wu, W.; Fan, M.; Tao, M.; Wei, J.; Jin, J.; Tan, Y.; Wang, Q. Validation of Himawari-8 aerosol optical depth retrievals over China. Atmos. Environ. 2019, 199, 32–44. [Google Scholar] [CrossRef]
- Wang, W.; Mao, F.; Pan, Z.; Gong, W.; Yoshida, M.; Zou, B.; Ma, H. Evaluating Aerosol Optical Depth From Himawari-8 With Sun Photometer Network. J. Geophys. Res. Atmos. 2019, 124, 5516–5538. [Google Scholar] [CrossRef]
- Yang, Y.; Chen, Y.; Yang, K.; Cermak, J.; Chen, Y. High-resolution aerosol retrieval over urban areas using sentinel-2 data. Atmos. Res. 2021, 264, 105829. [Google Scholar] [CrossRef]
- Shorten, C.; Khoshgoftaar, T.M. A survey on Image Data Augmentation for Deep Learning. J. Big Data 2019, 6, 60. [Google Scholar] [CrossRef]
- Krichen, M. Convolutional Neural Networks: A Survey. Computers 2023, 12, 151. [Google Scholar] [CrossRef]
- Piotrowski, A.P.; Napiorkowski, J.J.; Piotrowska, A.E. Impact of deep learning-based dropout on shallow neural networks applied to stream temperature modelling. Earth-Sci. Rev. 2020, 201, 103076. [Google Scholar] [CrossRef]
- Mantas, C.J.; Castellano, J.G.; Moral-García, S.; Abellán, J. A comparison of random forest based algorithms: Random credal random forest versus oblique random forest. Soft Comput. 2019, 23, 10739–10754. [Google Scholar] [CrossRef]
- Simonyan, K.; Zisserman, A. Very deep convolutional networks for large-scale image recognition. arXiv 2014, arXiv:1409.1556. [Google Scholar]
- Jia, C.; Sun, L.; Chen, Y.F.; Zhang, X.K.; Wang, W.Y.; Wang, Y.J. Inversion of aerosol optical depth for Landsat 8 OLI data using deep belief network. J. Remote Sens. 2020, 24, 1180–1192. [Google Scholar] [CrossRef]
- Kang, Y.; Kim, M.; Kang, E.; Cho, D.; Im, J. Improved retrievals of aerosol optical depth and fine mode fraction from GOCI geostationary satellite data using machine learning over East Asia. ISPRS J. Photogramm. 2022, 183, 253–268. [Google Scholar] [CrossRef]
- Choi, M.; Lim, H.; Kim, J.; Lee, S.; Eck, T.F.; Holben, B.N.; Garay, M.J.; Hyer, E.J.; Saide, P.E.; Liu, H. Validation, comparison, and integration of GOCI, AHI, MODIS, MISR, and VIIRS aerosol optical depth over East Asia during the 2016 KORUS-AQ campaign. Atmos. Meas. Tech. 2019, 12, 4619–4641. [Google Scholar] [CrossRef]
Figure 1.
Locations of the AERONET sites used in this study.
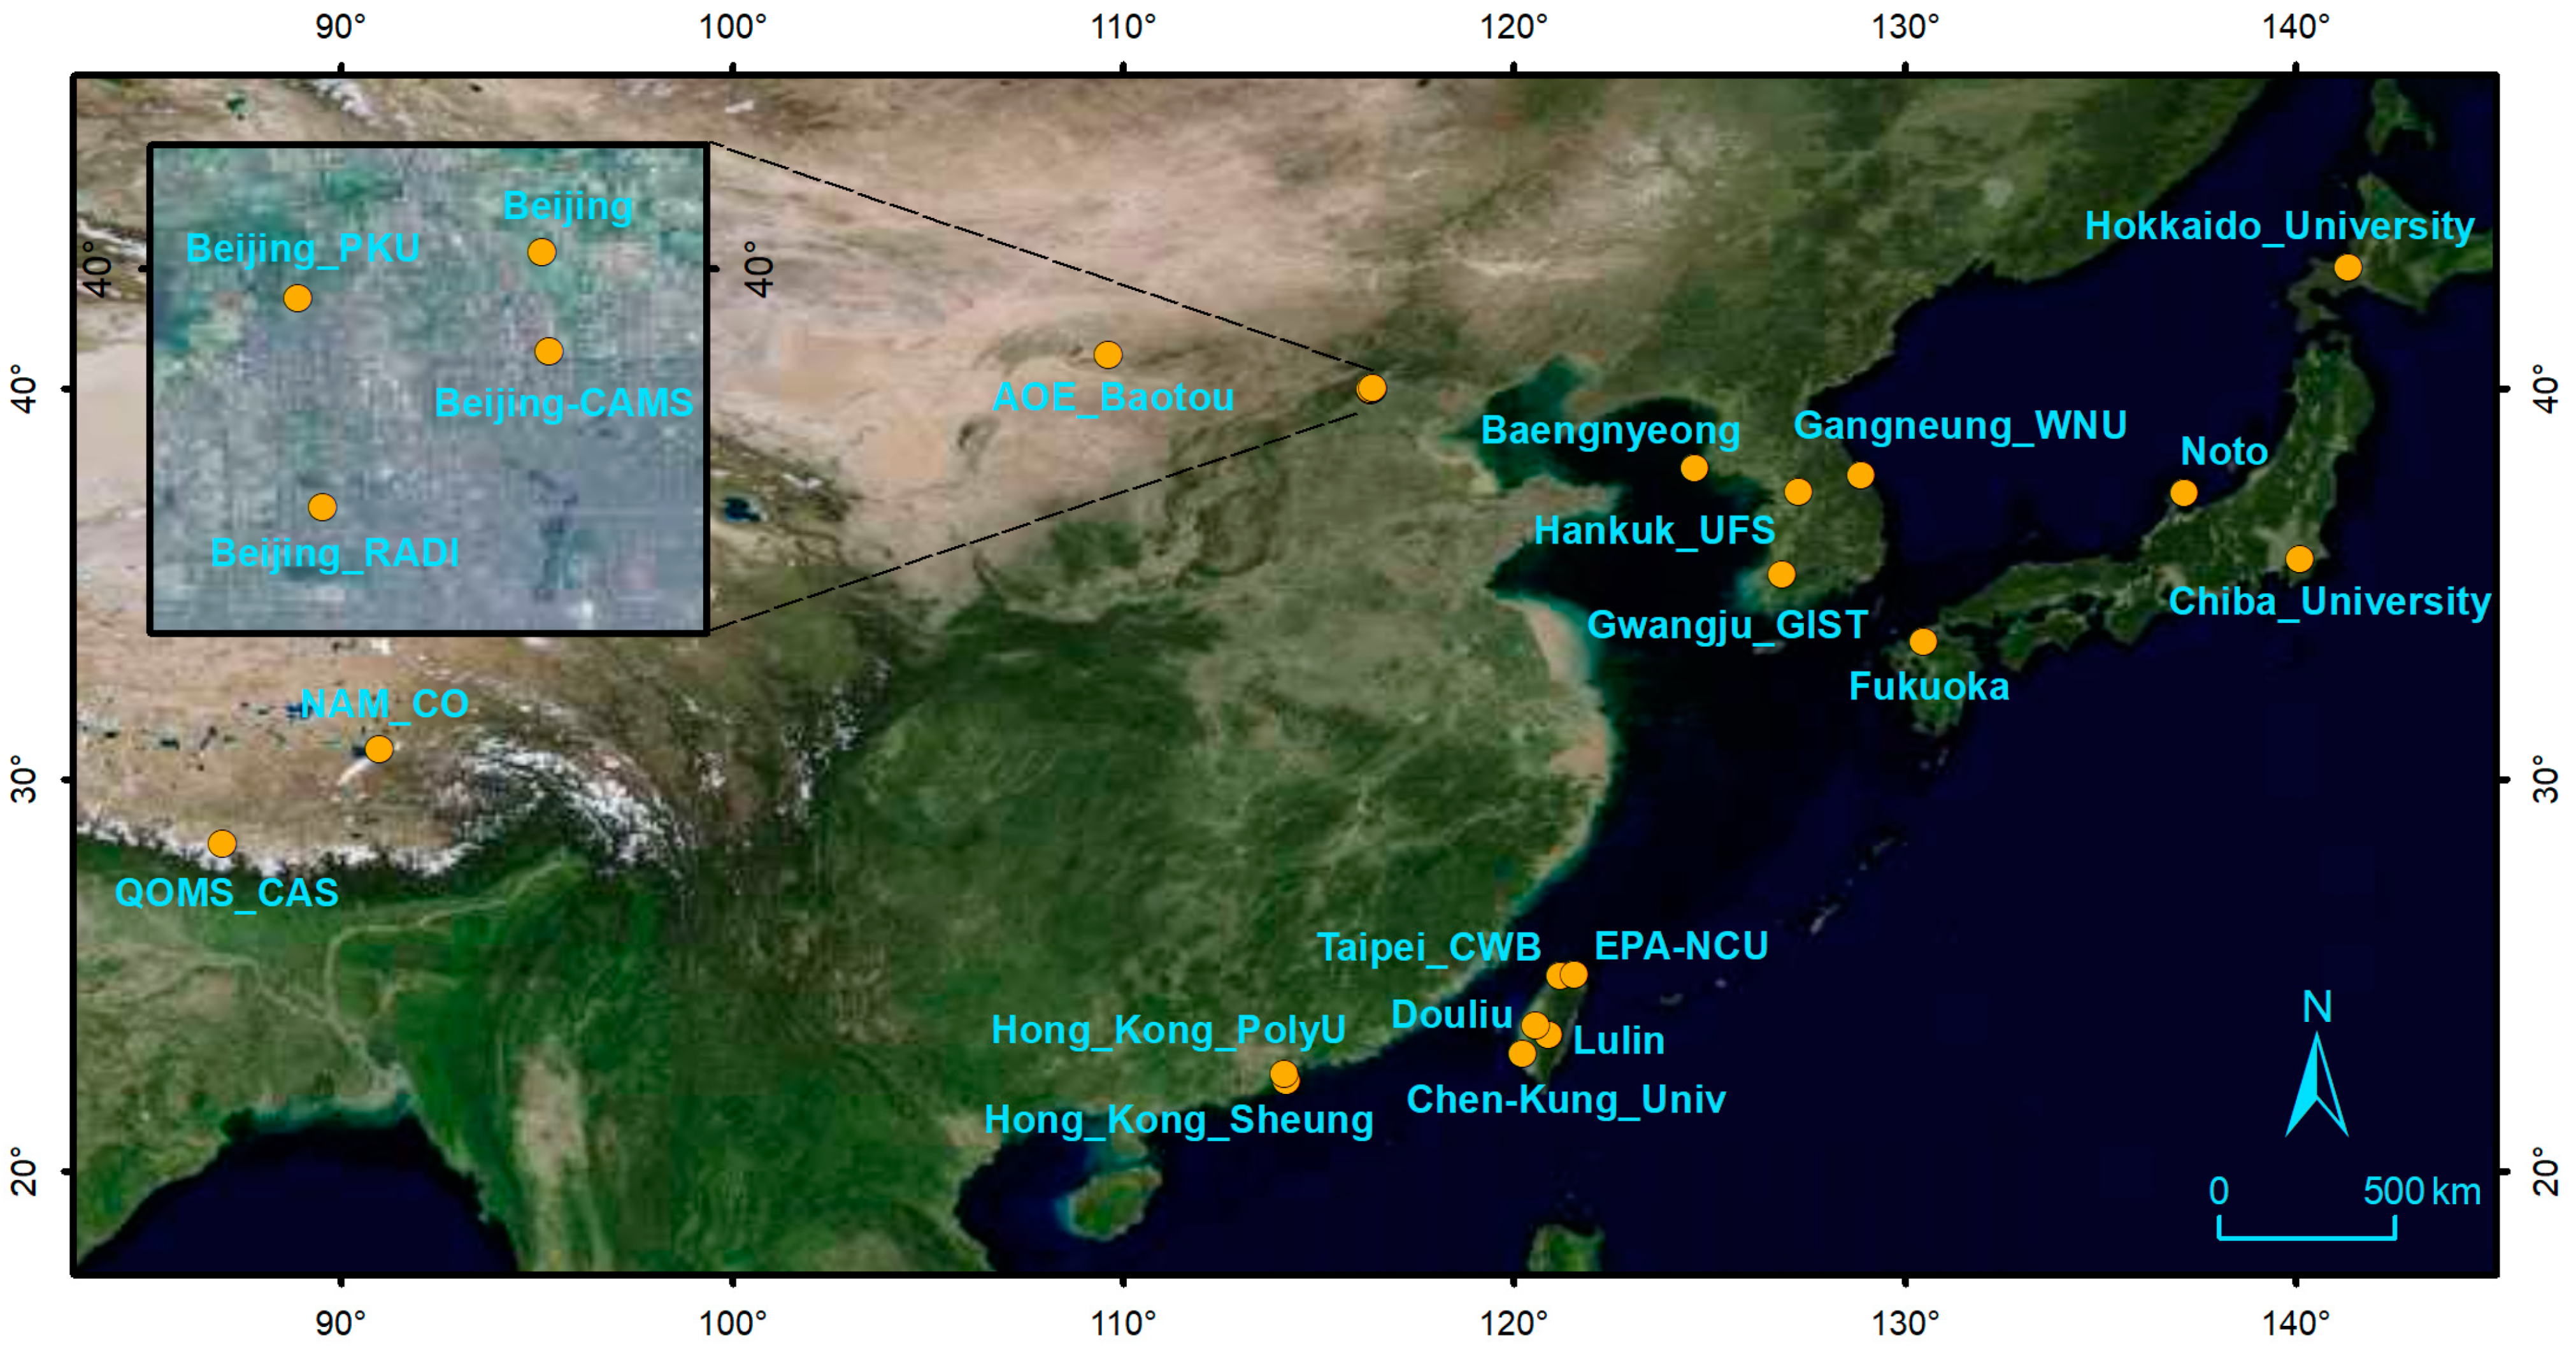
Figure 2.
Flowchart of the CNN model for the Sentinel-2 AOD retrieval.
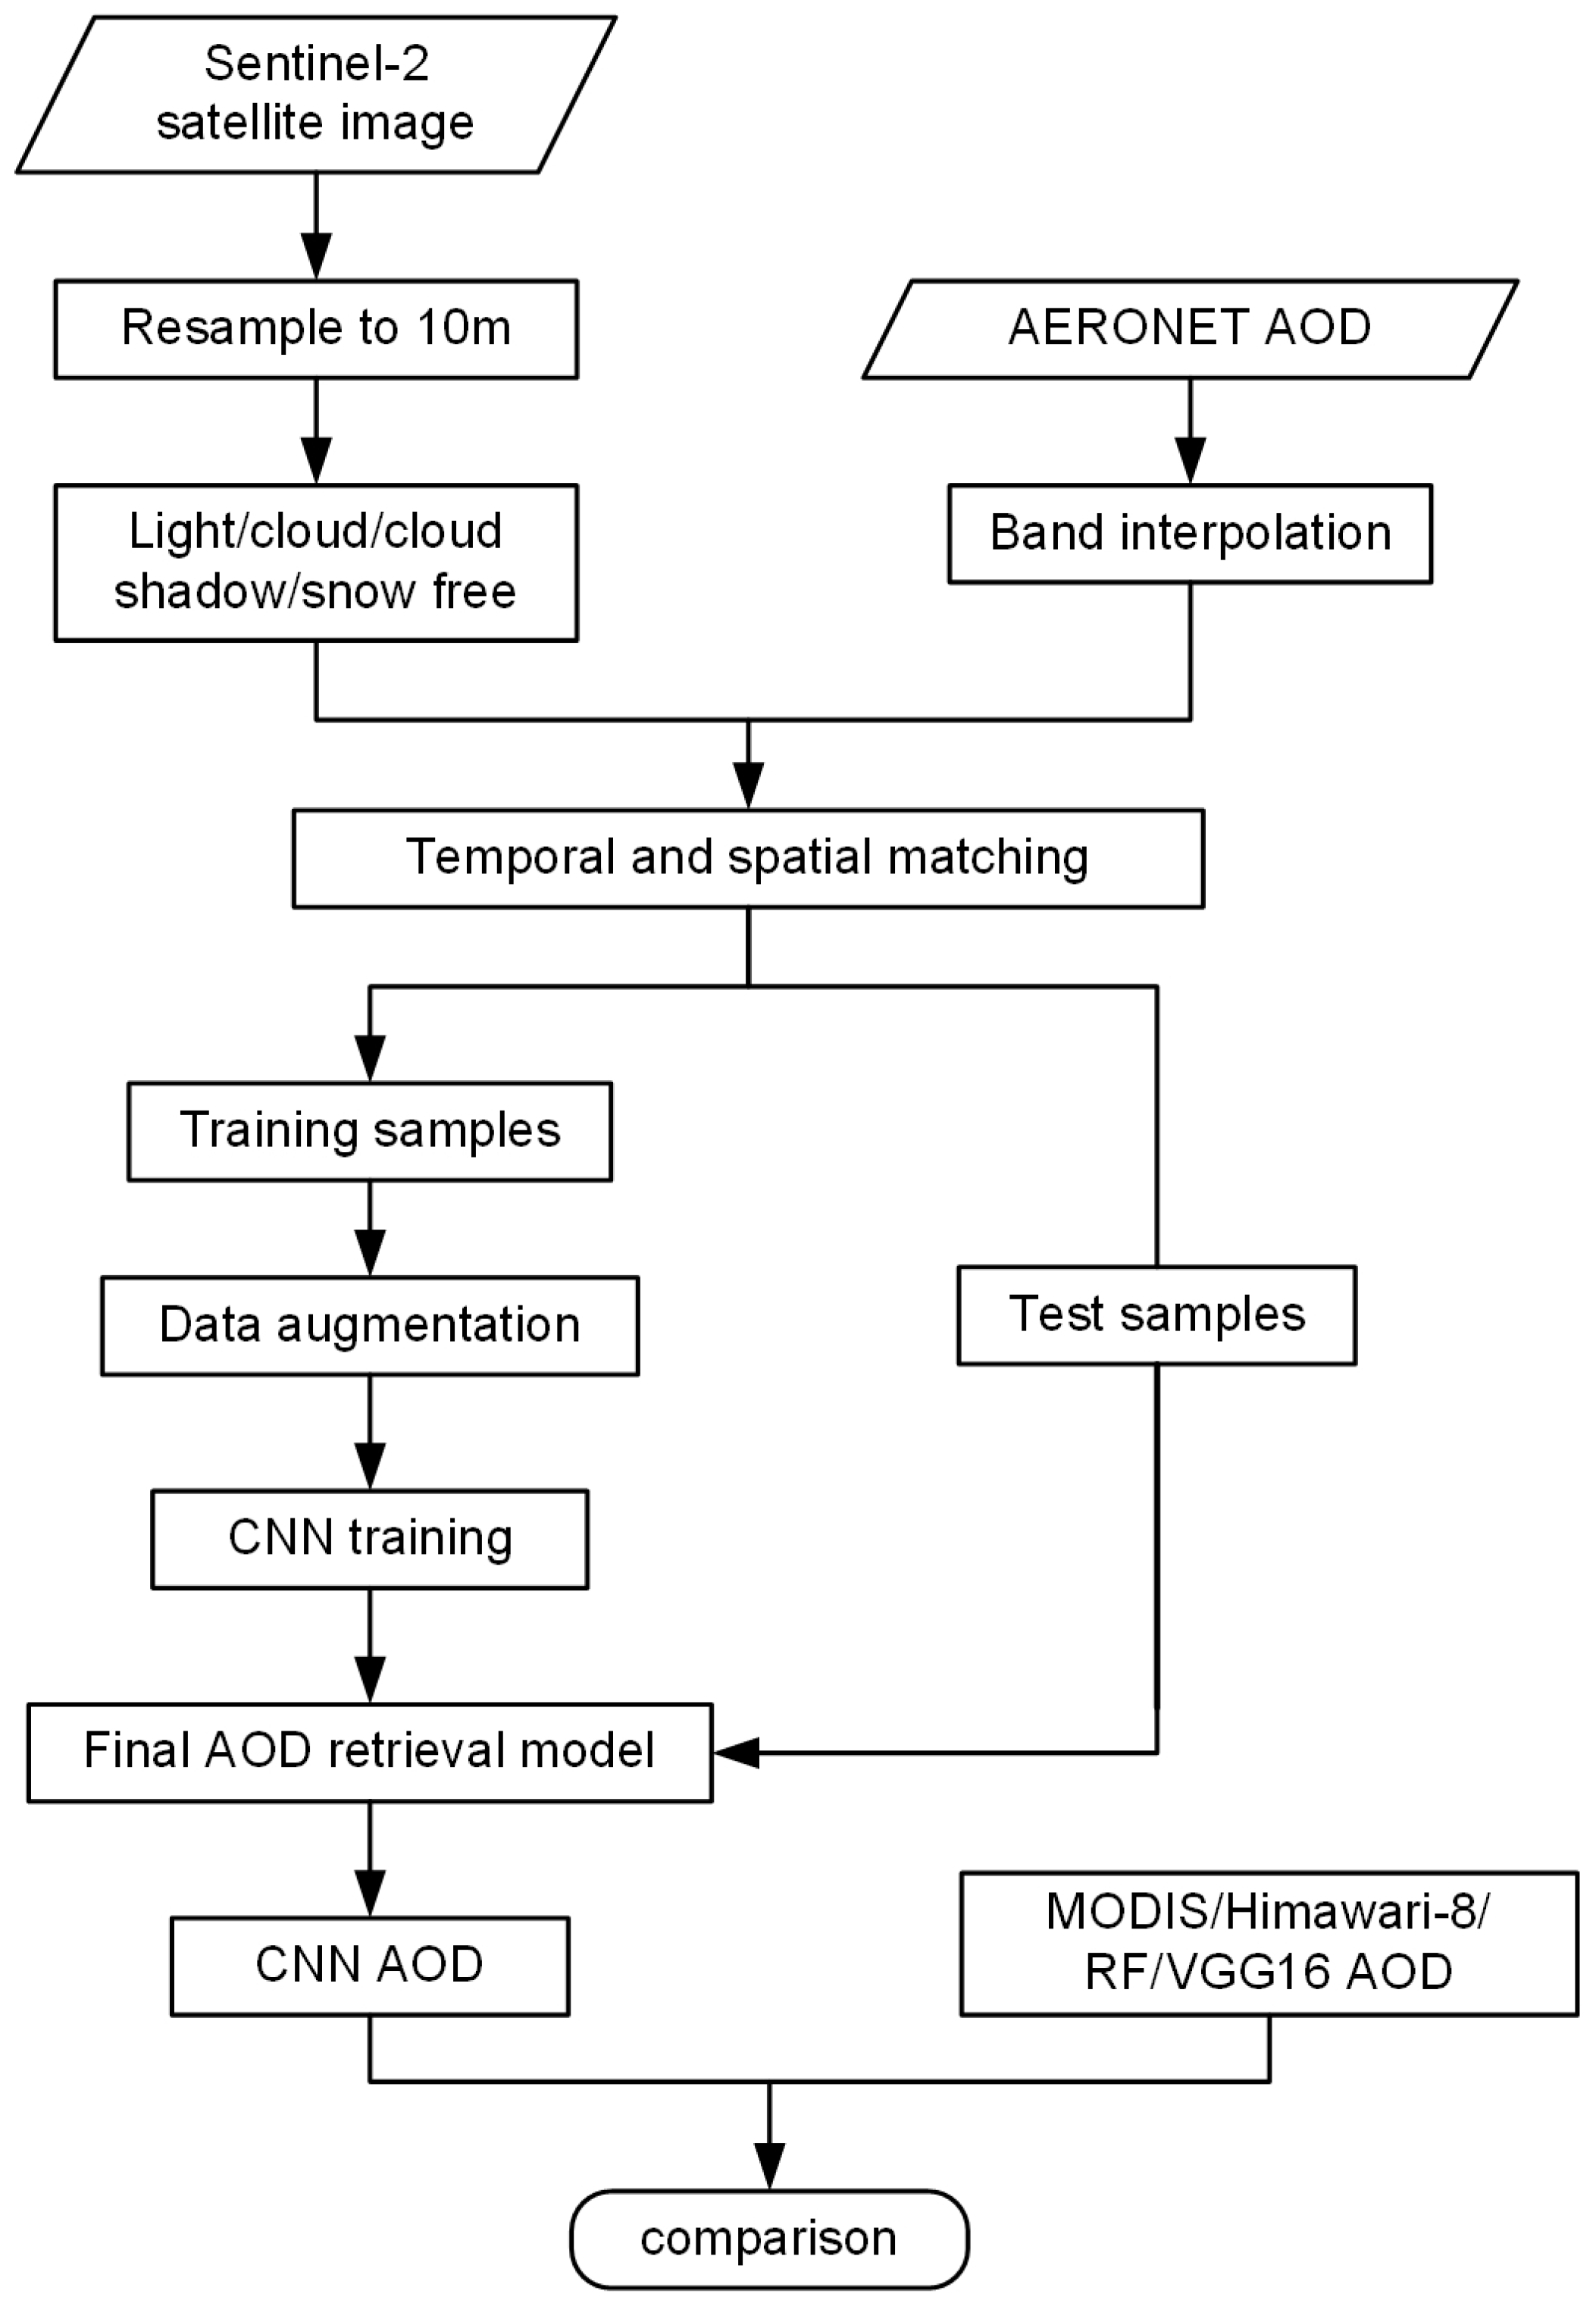
Figure 3.
The network architecture of Sentinel-2 AOD retrieval.

Figure 4.
Scatterplots of the CNN AOD against AERONET AOD for the (a) training dataset and (b) test dataset. The dot color signifies the point density from blue (low) to red (high). The dashed black lines are the 1:1 line, and the dashed red lines are the EE envelopes ± (0.05 + 15%).
Figure 4.
Scatterplots of the CNN AOD against AERONET AOD for the (a) training dataset and (b) test dataset. The dot color signifies the point density from blue (low) to red (high). The dashed black lines are the 1:1 line, and the dashed red lines are the EE envelopes ± (0.05 + 15%).
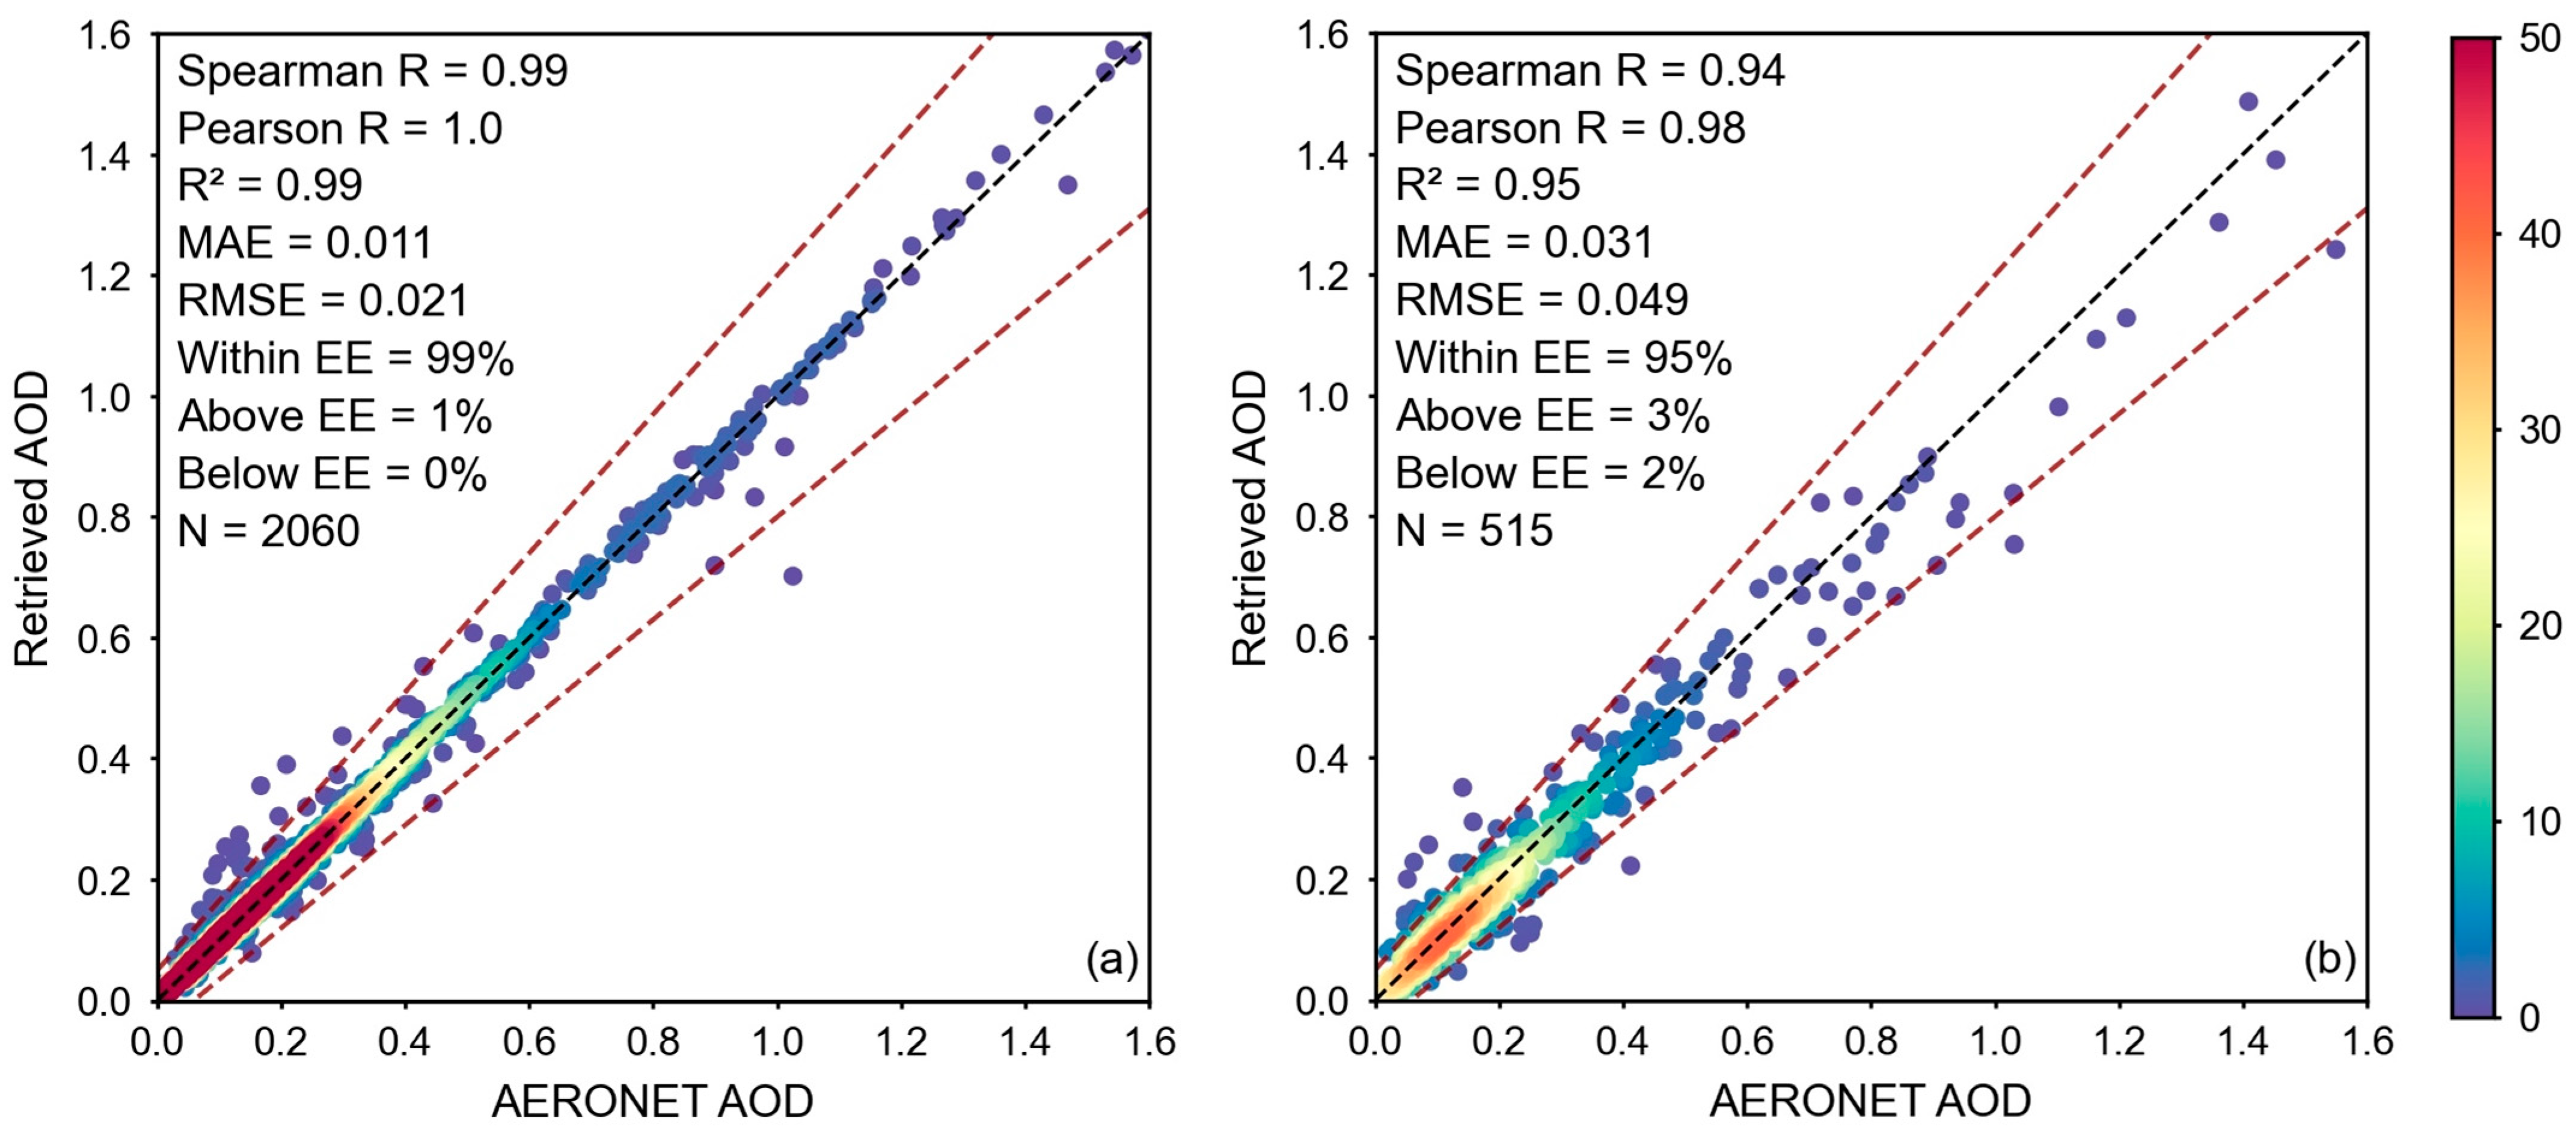
Figure 5.
Scatterplots of the CNN AOD against AERONET AOD for the test dataset at different regional scales. The dot color signifies the point density from blue (low) to red (high). The dashed black lines are the 1:1 line, and the dashed red lines are the EE envelopes ± (0.05 + 15%).
Figure 5.
Scatterplots of the CNN AOD against AERONET AOD for the test dataset at different regional scales. The dot color signifies the point density from blue (low) to red (high). The dashed black lines are the 1:1 line, and the dashed red lines are the EE envelopes ± (0.05 + 15%).
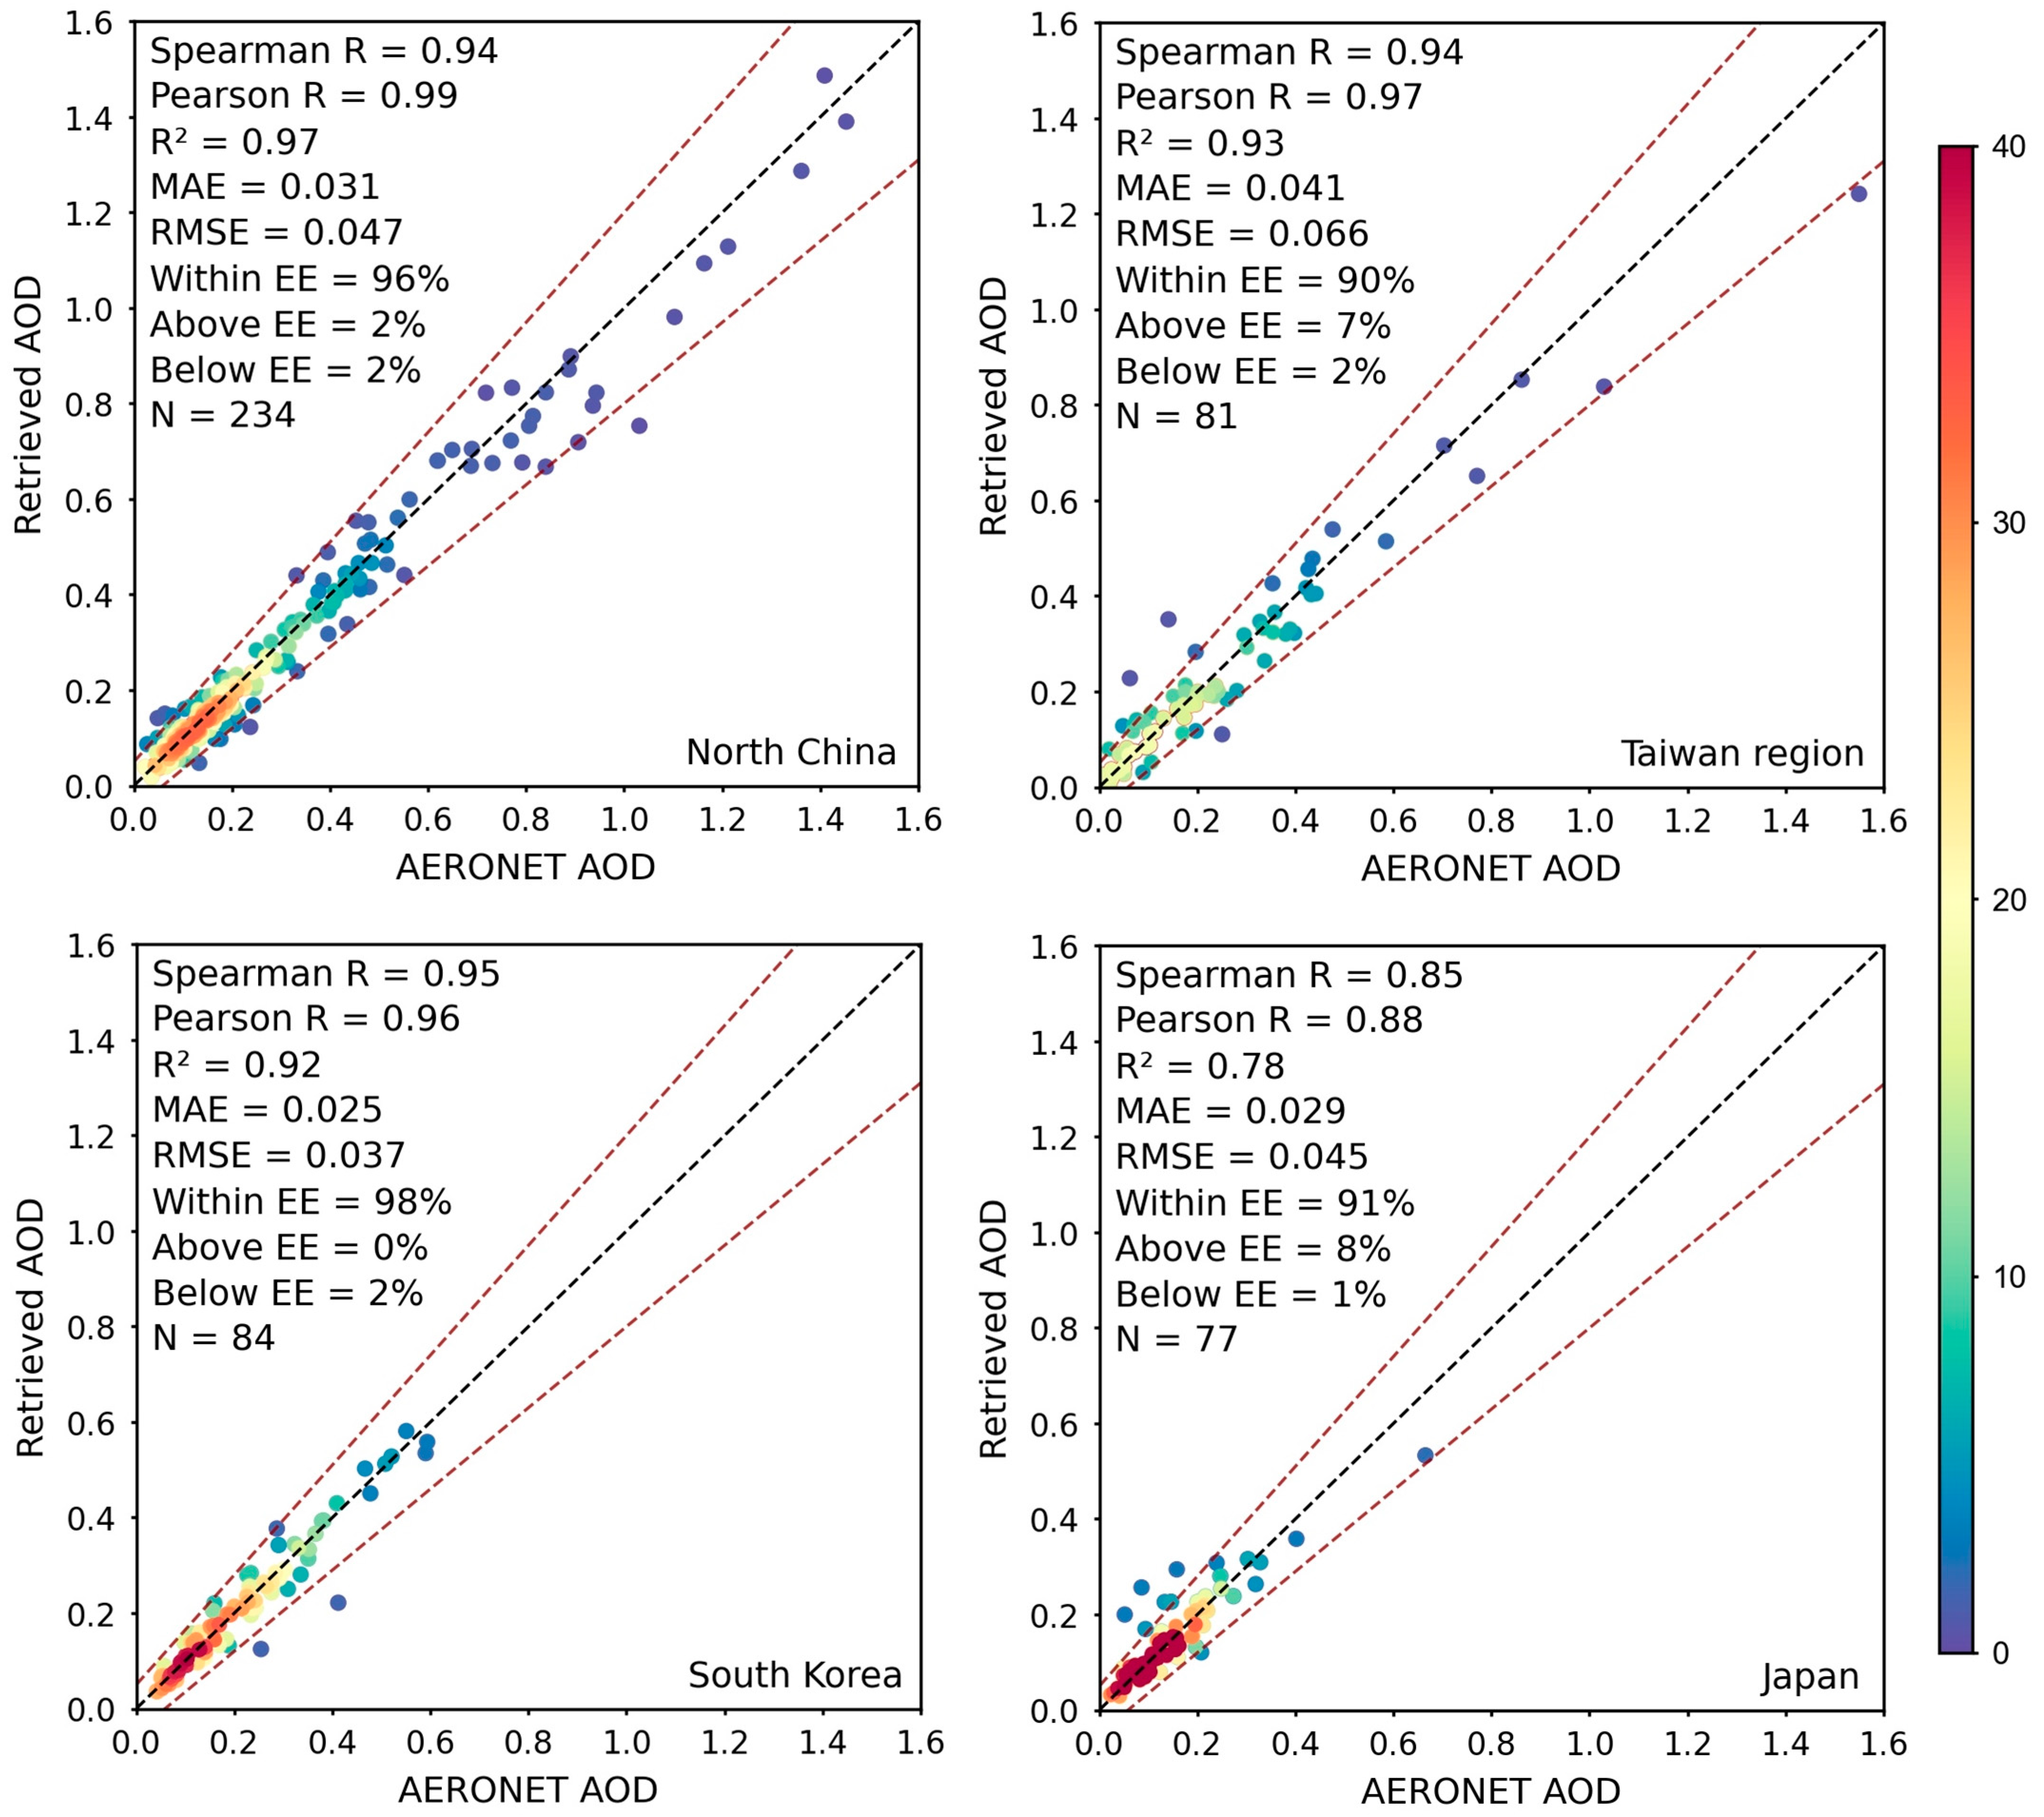
Figure 6.
Scatterplots of the CNN AOD against AERONET AOD for test dataset at each site. The dashed black lines are the 1:1 line, and the dashed red lines are the EE envelopes ± (0.05 + 15%).
Figure 6.
Scatterplots of the CNN AOD against AERONET AOD for test dataset at each site. The dashed black lines are the 1:1 line, and the dashed red lines are the EE envelopes ± (0.05 + 15%).
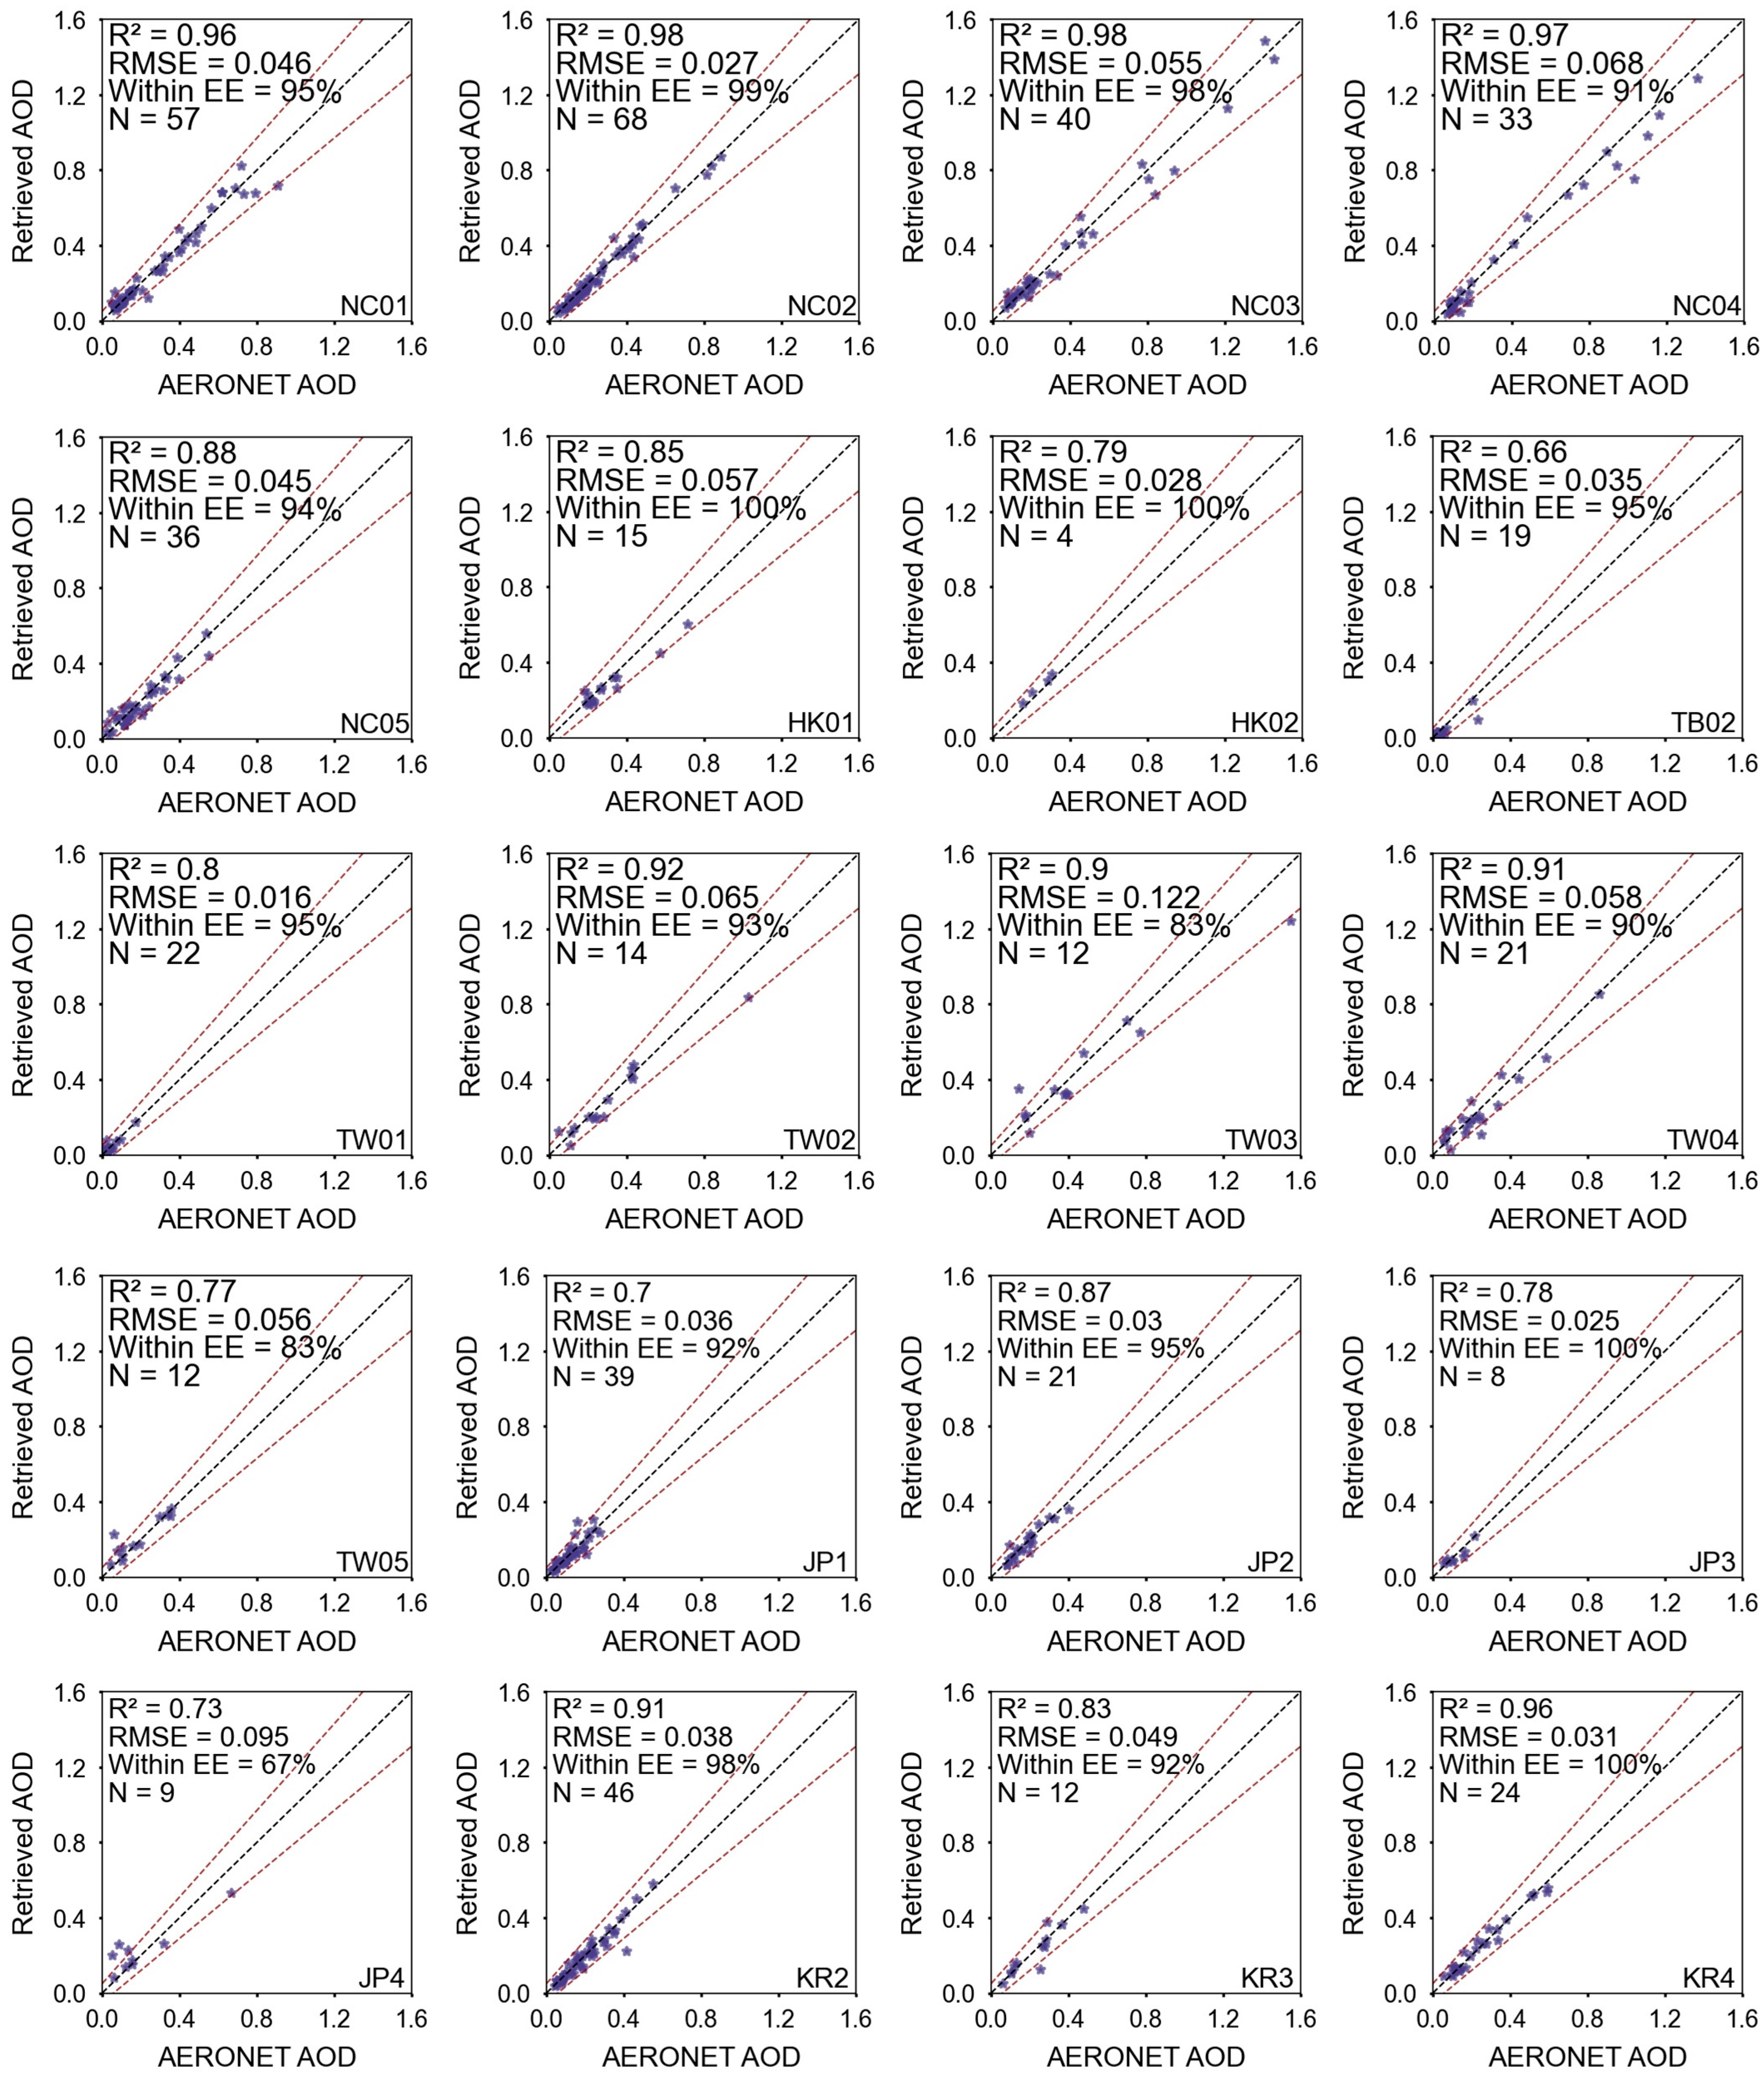
Figure 7.
(a) Sentinel-2 satellite image synthesized by bands 2, 4, and 8; (b) CNN AOD; (c) MODIS MAIAC AOD; (d) DT AOD; (e) DB AOD; (f) DTB AOD; and (g) Himawari-8 AOD over Japan on 12 February 2019.
Figure 7.
(a) Sentinel-2 satellite image synthesized by bands 2, 4, and 8; (b) CNN AOD; (c) MODIS MAIAC AOD; (d) DT AOD; (e) DB AOD; (f) DTB AOD; and (g) Himawari-8 AOD over Japan on 12 February 2019.

Table 1.
Ground-based monitoring sites information.
| Site Name | Location | Abbreviation | Longitude (° E) | Latitude (° N) | Matched Number |
|---|---|---|---|---|---|
| Beijing | North China | NC01 | 116.381 | 39.977 | 289 |
| Beijing-CAMS | North China | NC02 | 116.317 | 39.933 | 311 |
| Beijing_PKU | North China | NC03 | 116.310 | 39.992 | 170 |
| Beijing_RADI | North China | NC04 | 116.379 | 40.005 | 181 |
| AOE_Baotou | North China | NC05 | 109.629 | 40.852 | 202 |
| Hong_Kong_PolyU | Hong Kong | HK01 | 114.180 | 22.303 | 63 |
| Hong_Kong_Sheung | Hong Kong | HK02 | 114.117 | 22.483 | 25 |
| NAM_CO | Tibet | TB01 | 90.962 | 30.773 | 18 |
| QOMS_CAS | Tibet | TB02 | 86.948 | 28.365 | 90 |
| Lulin | Taiwan | TW01 | 120.874 | 23.469 | 90 |
| Chen-Kung_Univ | Taiwan | TW02 | 120.205 | 22.993 | 75 |
| Douliu | Taiwan | TW03 | 120.545 | 23.712 | 55 |
| EPA-NCU | Taiwan | TW04 | 121.185 | 24.968 | 84 |
| Taipei_CWB | Taiwan | TW05 | 121.538 | 25.015 | 52 |
| Chiba_University | Japan | JP1 | 140.104 | 35.625 | 132 |
| Fukuoka | Japan | JP2 | 130.475 | 33.524 | 90 |
| Hokkaido_University | Japan | JP3 | 141.341 | 43.076 | 63 |
| Noto | Japan | JP4 | 137.137 | 37.334 | 52 |
| Baengnyeong | South Korea | KR1 | 124.630 | 37.966 | 15 |
| Gangneung_WNU | South Korea | KR2 | 128.867 | 37.771 | 309 |
| Gwangju_GIST | South Korea | KR3 | 126.843 | 35.228 | 70 |
| Hankuk_UFS | South Korea | KR4 | 127.266 | 37.339 | 141 |
Table 2.
Information of Sentinel-2 data used in this study.
| Bands | Spatial Resolution (m/pixel) | Sentinel-2A | Sentinel-2B | ||
|---|---|---|---|---|---|
| Central Wavelength (nm) | Bandwidth (nm) | Central Wavelength (nm) | Bandwidth (nm) | ||
| Band 2 | 10 | 492.4 | 66 | 492.1 | 66 |
| Band 4 | 10 | 664.6 | 31 | 664.9 | 31 |
| Band 8 | 10 | 832.8 | 106 | 832.9 | 106 |
| Band 12 | 20 | 2202.4 | 175 | 2185.7 | 185 |
Table 3.
Information of MODIS and Himawari-8 data used in this study.
| Dataset | Satellite/Sensor | Contents | Spatial Resolution |
|---|---|---|---|
| MCD19A2 | Terra/MODIS | MAIAC AODs | 1 km/pixel |
| MOD04_L2 | Terra/MODIS | DT AODs | 10 km/pixel |
| Terra/MODIS | DB AODs | 10 km/pixel | |
| Terra/MODIS | DTB AODs | 10 km/pixel | |
| H08 | Himawari-8/AHI | YAER AODs | 0.05°/pixel |
Table 4.
AOD retrieval performance of the CNN model for low and high AOD situations on the test dataset.
Table 4.
AOD retrieval performance of the CNN model for low and high AOD situations on the test dataset.
| Matched Number | MAE | RMSE | within EE | above EE | below EE | |
|---|---|---|---|---|---|---|
| Low AOD | 269 | 0.021 | 0.034 | 94% | 6% | 0% |
| High AOD | 246 | 0.042 | 0.060 | 95% | 1% | 4% |
Table 5.
CNN AOD retrieval errors on the test dataset with respect to seasons.
| Seasons | Matched Number | Spearman R | Pearson R | R2 | MAE | RMSE | within EE |
|---|---|---|---|---|---|---|---|
| Spring | 144 | 0.95 | 0.97 | 0.93 | 0.039 | 0.062 | 94% |
| Summer | 88 | 0.92 | 0.98 | 0.96 | 0.034 | 0.045 | 93% |
| Autumn | 112 | 0.9 | 0.97 | 0.94 | 0.030 | 0.046 | 93% |
| Winter | 171 | 0.95 | 0.99 | 0.97 | 0.024 | 0.037 | 97% |
Table 6.
CNN AOD retrieval errors on the test dataset with respect to land cover types.
| Land Cover Types | Matched Number | Spearman R | Pearson R | R2 | MAE | RMSE | within EE |
|---|---|---|---|---|---|---|---|
| Vegetation surface | 128 | 0.94 | 0.96 | 0.92 | 0.029 | 0.044 | 95% |
| Urban | 331 | 0.94 | 0.98 | 0.96 | 0.032 | 0.051 | 95% |
| Bare soil | 56 | 0.9 | 0.95 | 0.90 | 0.030 | 0.042 | 95% |
Table 7.
AOD retrieval performance of aerosol products and models.
| Method | Satellite | Spearman R | Pearson R | R2 | MAE | RMSE |
|---|---|---|---|---|---|---|
| CNN | Sentinel-2 | 0.94 | 0.98 | 0.95 | 0.031 | 0.049 |
| MAIAC | Terra | / | 0.93 | / | / | 0.150 |
| DT | Terra | / | 0.87 | / | / | 0.220 |
| DB | Terra | / | 0.88 | / | / | 0.170 |
| YAER | Himawari-8 | / | 0.91 | / | / | 0.140 |
| VGG16 | Sentinel-2 | 0.79 | 0.86 | 0.70 | 0.079 | 0.123 |
| RF | Sentinel-2 | 0.88 | 0.93 | 0.86 | 0.054 | 0.085 |
“/” means not given in the literature.
Table 8.
CNN AOD-retrieval errors on the test dataset with sizes of 32, 64, and 128.
| Image Size | Spearman R | Pearson R | R2 | MAE | RMSE | within EE | above EE | below EE |
|---|---|---|---|---|---|---|---|---|
| 32 × 32 | 0.94 | 0.96 | 0.92 | 0.039 | 0.065 | 91% | 5% | 4% |
| 64 × 64 | 0.95 | 0.97 | 0.93 | 0.032 | 0.060 | 94% | 4% | 2% |
| 128 × 128 | 0.94 | 0.98 | 0.95 | 0.031 | 0.049 | 95% | 3% | 2% |
Disclaimer/Publisher’s Note: The statements, opinions and data contained in all publications are solely those of the individual author(s) and contributor(s) and not of MDPI and/or the editor(s). MDPI and/or the editor(s) disclaim responsibility for any injury to people or property resulting from any ideas, methods, instructions or products referred to in the content. |
© 2023 by the authors. Licensee MDPI, Basel, Switzerland. This article is an open access article distributed under the terms and conditions of the Creative Commons Attribution (CC BY) license (https://creativecommons.org/licenses/by/4.0/).
Share and Cite
MDPI and ACS Style
Jiang, J.; Liu, J.; Jiao, D. Aerosol Optical Depth Retrieval for Sentinel-2 Based on Convolutional Neural Network Method. Atmosphere 2023, 14, 1400. https://doi.org/10.3390/atmos14091400
AMA Style
Jiang J, Liu J, Jiao D. Aerosol Optical Depth Retrieval for Sentinel-2 Based on Convolutional Neural Network Method. Atmosphere. 2023; 14(9):1400. https://doi.org/10.3390/atmos14091400
Chicago/Turabian StyleJiang, Jie, Jiaxin Liu, and Donglai Jiao. 2023. "Aerosol Optical Depth Retrieval for Sentinel-2 Based on Convolutional Neural Network Method" Atmosphere 14, no. 9: 1400. https://doi.org/10.3390/atmos14091400
Note that from the first issue of 2016, this journal uses article numbers instead of page numbers. See further details here.