
Simulations of a Heavy Snowfall Event in Xinjiang via the WRF Model Coupled with Different Land Surface Parameterization Schemes

1
Key Laboratory of Meteorological Disasters of Ministry of Education/Collaborative Innovation Center on Forecast and Evaluation of Meteorological Disasters, Nanjing University of Information Science and Technology, Nanjing 210044, China
2
Xinjiang Meteorological Service Center, China Meteorological Administration, Urumqi 830002, China
*
Author to whom correspondence should be addressed.
Atmosphere 2023, 14(9), 1376; https://doi.org/10.3390/atmos14091376
Submission received: 29 July 2023
/
Revised: 22 August 2023
/
Accepted: 28 August 2023
/
Published: 31 August 2023
(This article belongs to the Special Issue Effects of Natural and Anthropogenic Factors on Climate and Environment (2nd Edition))
Abstract
:Frequent heavy snowfall in Xinjiang plays an important role in the land water cycle. In this study, 18 groups of simulation experiments are conducted on the heavy snowfall event in Xinjiang during 9–13 December of 2015 using the Weather Research and Forecasting (WRF) model. In these experiments, the combination of six land surface parameterization schemes (the Noah scheme, Noah-MP scheme, RUC scheme, CLM4 scheme, PX scheme, and TD scheme) with three microphysical parameterization schemes (the WSM6 scheme, Thompson scheme, and Lin scheme) are adopted, where the observed snowfall data are used for performance evaluation. Results show that the simulated snowfall intensity and snowfall range in different areas are very sensitive to the selection of the land surface scheme. The snowfall in southern Xinjiang is overestimated by almost all six schemes, where the Noah-MP scheme performs more reasonably than the others. The Noah scheme shows its advantage in northwestern Xinjiang. The three different microphysical schemes vary significantly in producing snowfall amount. The WSM6 scheme produced the largest snowfall amount, and the Lin scheme resulted in the smallest snowfall amount. In addition, the accumulated snowfall amounts above 10 mm are generally underestimated by all six land surface schemes, while the accumulated snowfall amounts below 10 mm are overestimated by most of the schemes. The Noah-MP scheme performs the best in the simulation of the snowfall amount in the whole region. However, the Noah scheme shows an advantage in areas with a large snowfall amount.
1. Introduction
Land–atmosphere interaction is an important part of the climate system. It responds to the external forces and adjusts to the internal changes, which has a profound impact on the regional weather and climate. Hence, the land surface process is one of the key processes affecting atmospheric circulation and precipitation [1,2,3]. As the land surface has special physical properties, its force on the atmosphere is featured by obvious characteristics such as strong diurnal variations and non-uniformity, which profoundly affects the spatio-temporal distributions and evolutions of local weather [4,5,6]. However, the research on land surface processes affecting weather is still facing great challenges due to the lack of high-resolution observational data and uncertainties in land surface process descriptions [7,8].
The Xinjiang Uygur Autonomous Region is located in the hinterland of the Eurasian continent in middle and high latitudes, where heavy snowfall events occur frequently in winter due to the frequent southward movement of the polar front jet. It is one of the four heavy snowfall prone areas in China [9,10]. Xinjiang is a vast region with complex topography, which consists of a unique mountain-basin structure and a fragile mountain–oasis–desert ecosystem [11]. Since the 21st century, both snowfall and extreme snowfall events in northern Xinjiang have shown a significant increasing trend [12,13]. Altay Prefecture, Tacheng Basin, Ili Valley, and the northern slope of the Tianshan Mountain ranges have witnessed significant increases in snowfall [14,15]. So far, many advances have been made in the research concerning the formation mechanism and the causes of heavy snowfall in Xinjiang [16,17,18].
Numerical simulation remains an important method for assessing the snowfall [19,20]. As a widely used mesoscale model, the Weather Research and Forecasting (WRF) model can provide high-resolution meteorological variables to make up for the limitations of uneven and sparse distribution of meteorological observation stations, and thus, it has become an important tool for precipitation forecasting [21,22,23]. A large number of studies have shown that the WRF model can well reproduce the mesoscale characteristics of precipitation processes and the location of precipitation, which provides an important reference for studying the development mechanism of weather processes [24,25]. It should be noted that the simulation results obtained via the WRF model vary significantly under the different parameterization schemes in terms of the amount and spatial distribution of precipitation. Therefore, an appropriate parameterization scheme is crucial for the simulation results of weather processes [26,27,28,29,30,31,32,33]. For example, Hu et al. conducted an experimental evaluation of the different boundary layer schemes and found that the YSU boundary layer scheme can well solve the overestimation problems for the near-surface temperature and wind speeds [28]. In addition, among the many microphysics schemes, the WSM6 scheme uses a six-class spectral method that can more accurately describe ice crystals and snow particles of different sizes and types, which helps to simulate different snow types [29]. The Thompson scheme considers the aerosol–cloud–precipitation interaction, which is important for simulating the formation and development of snowfall [30]. The Lin scheme is suitable for simulating the snowfall process for a long time because of its high computational efficiency [31]. These three microphysical schemes have been widely used in the numerical simulations of mesoscale weather processes and have good representation, but the applicability of the different schemes in different regions still needs further verification [32,33]. The above research results provide a reference for us to choose the parameterization scheme.
A variety of land surface parameterization schemes have been coupled to the newer version of the WRF model and have been applied to the simulations of multiple rainfall and snowfall events [34,35]. Many studies focused on the simulation of snowfall events in northeast China [36,37,38,39,40]. Yu found that WRF was more sensitive to the choice of the land surface and microphysics scheme than the convective cumulus parameterization scheme when simulating snowfall in northeast China [38]. Furthermore, the simulations of snow water and snow depth using the different land surface parameterization schemes also show the large regional differences [31,39]. Wang and Sun found that in simulating the snow water equivalent, the Noah and Noah-MP schemes were better than the SSIB scheme in northeast China [40].
So far, there have been few studies on the numerical simulations of heavy snowfall events in Xinjiang, especially those considering the impact of the land surface process on heavy snowfall [41]. This study selects a typical heavy snowfall event in Xinjiang from 9 to 13 December 2015 as the study case. A total of 18 groups of experiments are designed for numerical simulations, where the observed snowfall data are used for evaluation. In these experiments, six land surface parameterization schemes and three microphysical parameterization schemes are coupled into the WRF model. The simulation effects of the different land surface parameterization schemes on this heavy snowfall event are compared to determine which combination of the schemes has the best performance. It is expected to provide a theoretical basis and important reference for improving the short-term prediction accuracy of such events.
The remainder of this paper is arranged as follows. In Section 2, the model and experimental design are introduced. In Section 3, the simulation results of snowfall using the different land surface parameterization schemes are compared with the observations. Finally, the conclusions and discussion are provided in Section 4.
2. Experimental Design
The Advanced Research WRF (Version 4.2) model is used in this study. It is a fully compressible non-hydrostatic numerical model which uses the terrain-following hydrostatic pressure coordinate in the vertical direction and the Arakawa C-grid coordinate in the horizontal direction. The third-order Runge–Kutta algorithm and the acoustic integration algorithm are used respectively for low- and high-frequency fluctuations in terms of time integration [42].
We configure the WRF model with a two-way nesting double domain setup at 27 km and 9 km horizontal resolutions. The nested domain and topography are shown in Figure 1. The parent domain (d01) covers the entire Central Asia region with the grid number being 181 × 163. The nested domain (d02) focuses on the Xinjiang region with the grid number being 271 × 241. The black dots in Figure 1 denote the locations of 105 meteorological observation stations. The 1° × 1° Final Operational Global Analysis data from the National Centers for Environmental Prediction (available at https://rda.ucar.edu/datasets/ds083.2/, accessed on 15 February 2023) are used to provide the boundary and initial conditions, with the temporal resolution being 6 h. The model adopts a Lambert projection; the vertical direction is set to 35 layers, and the integral step is 150 s. The simulations in all experiments start from 1200 UTC 8 December to 0000 UTC 13 December 2015, with the first 24 h as the spin-up period.
The study of simulated snowfall events in northeast China shows that snowfall is very sensitive to the choice of the land surface parameterization schemes, and the choice of the microphysical schemes also affects snowfall. Although Xinjiang has a similar latitude to northeast China, it has different land surface elements and weather systems. Therefore, the impact of the land surface parameterization schemes on snowfall in Xinjiang still needs further study. In this study, six common land surface parameterization schemes are adopted to explore the differences among these schemes in the simulation of this heavy snowfall event. The specific schemes are the Noah scheme [43], the Noah scheme with Multi Parameterization (Noah-MP) scheme [44], the Rapid Update Cycle (RUC) scheme [45], the Community Land Model version 4 (CLM4) scheme [46], the Pleim–Xiu scheme [47] (PX), and the Thermal Diffusion scheme [48] (TD). Additionally, three microphysics schemes are also adopted, which are the WRF single-moment 6-class (WSM6) scheme [49], the Thompson scheme [30], and the Lin scheme [50]. As shown in Table 1, a total of 18 groups of experiments using different combinations are designed for comparative analysis. Other physical parameterization schemes include the Kain–Fritsch scheme for cumulus convection [51], the Dudhia and Rapid Radiative Transfer Model schemes for shortwave and longwave radiation options [52,53], the Yonsei University scheme for the boundary layer processes [28], and the Monin–Obukhov scheme for the near-surface layer processes [54].
The observational data are from the Meteorological Unified Service Interface Community developed by the China Meteorological Administration. The data contain hourly snowfall from 105 national meteorological observation stations and are subject to strict quality control.
The statistical measures of the root mean square error (RMSE) and the mean absolute error (MAE) are calculated for evaluation, and the formulas are as follows:
where and are the predicted and observed values at time , respectively, and is the number of meteorological observation stations.
3. Results
3.1. Overview of the Snowfall Event
From 9 to 13 December 2015, a rarely-seen heavy snowfall event occurred in Xinjiang. The favorable atmospheric circulation pattern during this extremely heavy snowfall process has a typical backward-tilting trough structure, accompanied by the eastward-moving Ural low-pressure trough and the southerly low-pressure trough. This heavy snowfall process involves a wide range. A total of 18 observation stations experienced a snowstorm (12.1–24.0 mm), and two observation stations experienced a heavy snowstorm (24.1–48.0 mm). The accumulated snowfall amount at the observation stations is shown in Figure 2. It can be seen that the largest snowfall amount during this heavy snowfall process is centered in the Tianshan Mountains (43.0–45.5° N, 84.0–91.0° E), followed by northwestern Xinjiang (43.0–45.5° N, 80.0–83.5° E), and southern Xinjiang (39.0–42.5° N, 80.0–90.0° E). The snowfall in these areas lasted for more than 20 h. The largest snowfall amount is observed in Urumqi, with the accumulated snowfall amount reaching 46.3 mm.
3.2. Impacts of the Different Land Surface Schemes on Snowfall
In this section, the effects of different combinations of the land surface parameterization schemes with the microphysical schemes on this snowfall event are discussed in three parts according to the microphysical schemes. In addition, it is found that the d02 at higher horizontal resolution achieves a better simulation performance. Therefore, only the simulation results in d02 are analyzed in the following parts.
3.2.1. Thompson Scheme
Figure 3 shows the spatial distributions of the observations and the simulations of the accumulated snowfall amount under the combinations of the different land surface parameterization schemes with the Thompson scheme. The shaded area shows the simulated snowfall, and the marked numbers are the accumulated snowfall observed at the meteorological stations. The results show that all six land surface parameterization schemes can well simulate the large-scale snowfall, especially the heavy snowfall belt. However, the simulation performance on the snowfall range and intensity varies significantly in different regions, especially in the Tianshan Mountains, southern Xinjiang, and northwestern Xinjiang. For the Tianshan Mountains, all six schemes can well reproduce the heavy snowfall process, except in its northern part where the models generally underestimate the snowfall. Comparatively, the PX scheme and the CLM4 scheme simulate the most snowfall, while the Noah-MP scheme and the TD scheme simulate the least snowfall. The CLM4, PX, and RUC schemes seriously overestimate the snowfall in southern Xinjiang, especially the CLM4 scheme. In contrast, the simulation by the Noah-MP scheme is closer to the observation. In northwestern Xinjiang, the simulated heavy snow belts exhibit a scattered distribution, where the simulation by the Noah scheme is relatively closer to the observation. On the whole, the more simulated snowfall by the PX and the CLM4 schemes may be related to the larger soil moisture calculated in the two schemes [35].
Both observations and simulations reveal that the snowfall generally covers the whole of Xinjiang. To evaluate the simulation performance in areas with a relatively larger snowfall amount, 45 meteorological observation stations with an accumulated snowfall amount greater than 3 mm are selected for comparison. In addition, the simulated snowfall data at the grid points closest to these observation stations are adopted as simulated values at these stations. The observed values are further compared with the simulated values, and the correlation coefficients between the observed values and the simulated values at these stations are calculated, as shown in Figure 4. The comparison shows that for an accumulated snowfall amount above 10 mm, all six schemes generally underestimate the snowfall. Comparatively, the Noah scheme has more simulated values close to the observed values. For an accumulated snowfall amount below 10 mm, most schemes overestimate the snowfall. Among them, the Noah-MP scheme, with more simulated values concentrated around the black dotted line, is proved to be the closest to the observation. On the whole, the Noah scheme performs the best as the simulated values are more concentrated in the scatter plot, while the PX scheme has the most scatter-distributed simulated values. The correlation coefficients reveal that the Noah schemes (the RUC and CLM4 schemes) achieve the highest (lowest) correlations with the observations, reaching 0.72 (0.61).
3.2.2. WSM6 Scheme
The selection of the microphysical parameterization scheme is also important for snowfall simulation. Figure 5 shows the spatial distributions of the accumulated snowfall simulated under the combinations of the WSM6 scheme with the different land surface parameterization schemes. Similar to the Thompson scheme, the WSM6 scheme also produces heavy snowfall belts. However, larger snowfall amounts are simulated under the combinations with the WSM6 scheme, especially for the Noah scheme and the CLM4 scheme. Compared with the Thompson scheme, the simulated snowfall intensity under the combination of the WSM6 scheme with the RUC scheme increases significantly in northwestern Xinjiang and southern Xinjiang, while the accumulated snowfall amounts under the combination of the WSM6 scheme with the TD scheme are found more in northwestern Xinjiang and the Tianshan Mountains. It is worth noting that the WSM6 scheme with the Noah-MP scheme has reduced the snowfall intensity in the Tacheng area (45–48° N, 86.5–88.5° E) than in the Thompson scheme. Overall, the WSM6 scheme has increased the snowfall intensity when compared with the Thompson scheme, which is consistent with the conclusion of snowfall simulation over the Himalayas [55].
Similar to the Thompson scheme, the observed and simulated snowfall under the combinations of the WSM6 scheme with the different land surface parameterization schemes are compared, as shown in the scatter plot (Figure 6). Compared with Figure 4, it can be found that the correlation coefficients between the observed and simulated values in the Noah scheme and the RUC scheme decreased significantly, from 0.7 and 0.61 to 0.64 and 0.52, respectively. For an accumulated snowfall amount above 10 mm, the Noah scheme and the CLM4 scheme have improved the underestimation of snowfall.
3.2.3. Lin Scheme
Figure 7 shows the spatial distributions of the accumulated snowfall amount simulated under the combinations of the six land surface parameterization schemes with the Lin scheme. Among the three microphysical schemes, the Lin scheme simulates the least snowfall amount. The six sets of experiments exhibit the most significant reduction in snowfall in the Tianshan Mountains, but all of them can simulate the strongest snowfall around Urumqi. Compared with the Thompson scheme, the PX scheme produces less snowfall in southern Xinjiang, while the Noah scheme simulates more snowfall in northwestern Xinjiang. The underestimation of snowfall by the Lin scheme also appears in northeast China [40], indicating that it may not be sensitive to the selection of region.
Figure 8 shows the scatter plot of the observed and simulated snowfall using the Lin scheme. Compared with the Thompson scheme, although the Lin scheme generally produces less snowfall, there is no significant reduction in the snowfall amount at stations with a heavy snowfall. That is to say, the reduction in snowfall simulated by the Lin scheme is more significant for stations with a smaller snowfall amount. The linear fitting effect shows that the Lin scheme is inferior to the Thompson scheme. Compared with the Thompson scheme, the linear fitting effect for the PX scheme decreases significantly, but no significant reduction is found for the linear fitting effect by the Noah-MP scheme. Comparatively, the linear fitting effects for the Noah scheme, the Noah-MP scheme, and the TD scheme are relatively better, as these three land surface schemes are relatively less affected by the microphysics scheme. The PX scheme performs the worst, with the correlation coefficient being 0.58.
In general, all six land surface parameterization schemes can well simulate this snowfall process and reproduce the strongest snowfall center, among which the Noah and the Noah-MP schemes perform better. The difference of the microphysical schemes is mainly reflected in the snowfall grade, where the largest snowfall amount is found in the WSM6 scheme and the smallest in the Lin scheme. The snowfall intensity and snowfall range vary significantly in different regions, which are very sensitive to the selection of the land surface parameterization scheme, especially for snowfall in the Tianshan Mountains, southern Xinjiang, and northwestern Xinjiang. In this study, all experiments underestimate the snowfall in the northern Tianshan Mountains, whereas the PX scheme and the CLM4 scheme are relatively better. In southern Xinjiang, all experiments seriously overestimate the snowfall, whereas the Noah-MP scheme performs relatively better, and the Noah scheme shows its advantage in northwestern Xinjiang. No scheme can well simulate all the areas with heavy snowfall. For snowfall above 10 mm, all six land surface schemes generally underestimate the snowfall. The Noah scheme gives the most snowfall values that are close to the observed values among the six schemes. For snowfall below 10 mm, most schemes overestimate the snowfall, while the Noah-MP scheme has the least overestimation.
3.3. Comparison and Evaluation
In this section, the RMSE and MAE of the accumulated snowfall amount between the observations and the simulations are calculated, which helps to evaluate which combination of parameterization schemes performs the best in this snowfall event.
Specifically, the RMSE and MAE between the observed and simulated values at 45 meteorological observation stations are used to evaluate the simulation effect of the model on snowfall above 3 mm. In addition, the RMSE and MAE for the accumulated snowfall amount between the observations and simulations at 105 stations in the Thompson scheme are also calculated to evaluate the simulation effect of the model on the entire area (Figure 9). For an accumulated snowfall amount above 3 mm, the RMSE and MAE using the Thompson scheme are the smallest among the three microphysical schemes, followed by the Lin scheme, and the WSM6 scheme produces the largest error. Among the six land surface parameterization schemes, the Noah scheme and the Noah-MP scheme exhibit the smallest errors. The average values of the RMSE and MAE are 6.99 mm and 7.24 mm, respectively, in the Noah scheme, and 5.30 mm and 5.41 mm, respectively, in the Noah-MP scheme. The RUC scheme produces the largest error, whose RMSE and MAE reach 7.84 mm and 5.89 mm, respectively. On the whole, the combination of the Noah scheme with the Thompson scheme has the best simulation effect with the smallest error, with the RMSE and MAE being 6.43 mm and 4.9 mm, respectively. The next successful one is followed by the combination of the Noah-MP scheme with the Thompson scheme, with the RMSE and MAE being 6.96 mm and 5.23 mm, respectively. It should be pointed out that when all stations are considered, the combination of the Noah-MP scheme with the Thompson scheme produces the smallest RMSE and MAE among the 18 groups of experiments, with the RMSE and MAE being 5.20 mm and 3.23 mm, respectively. This indicates that the Noah-MP scheme has the best simulation effect when the snowfall at all stations is considered, while the Noah scheme shows its advantage for the snowfall with larger grades.
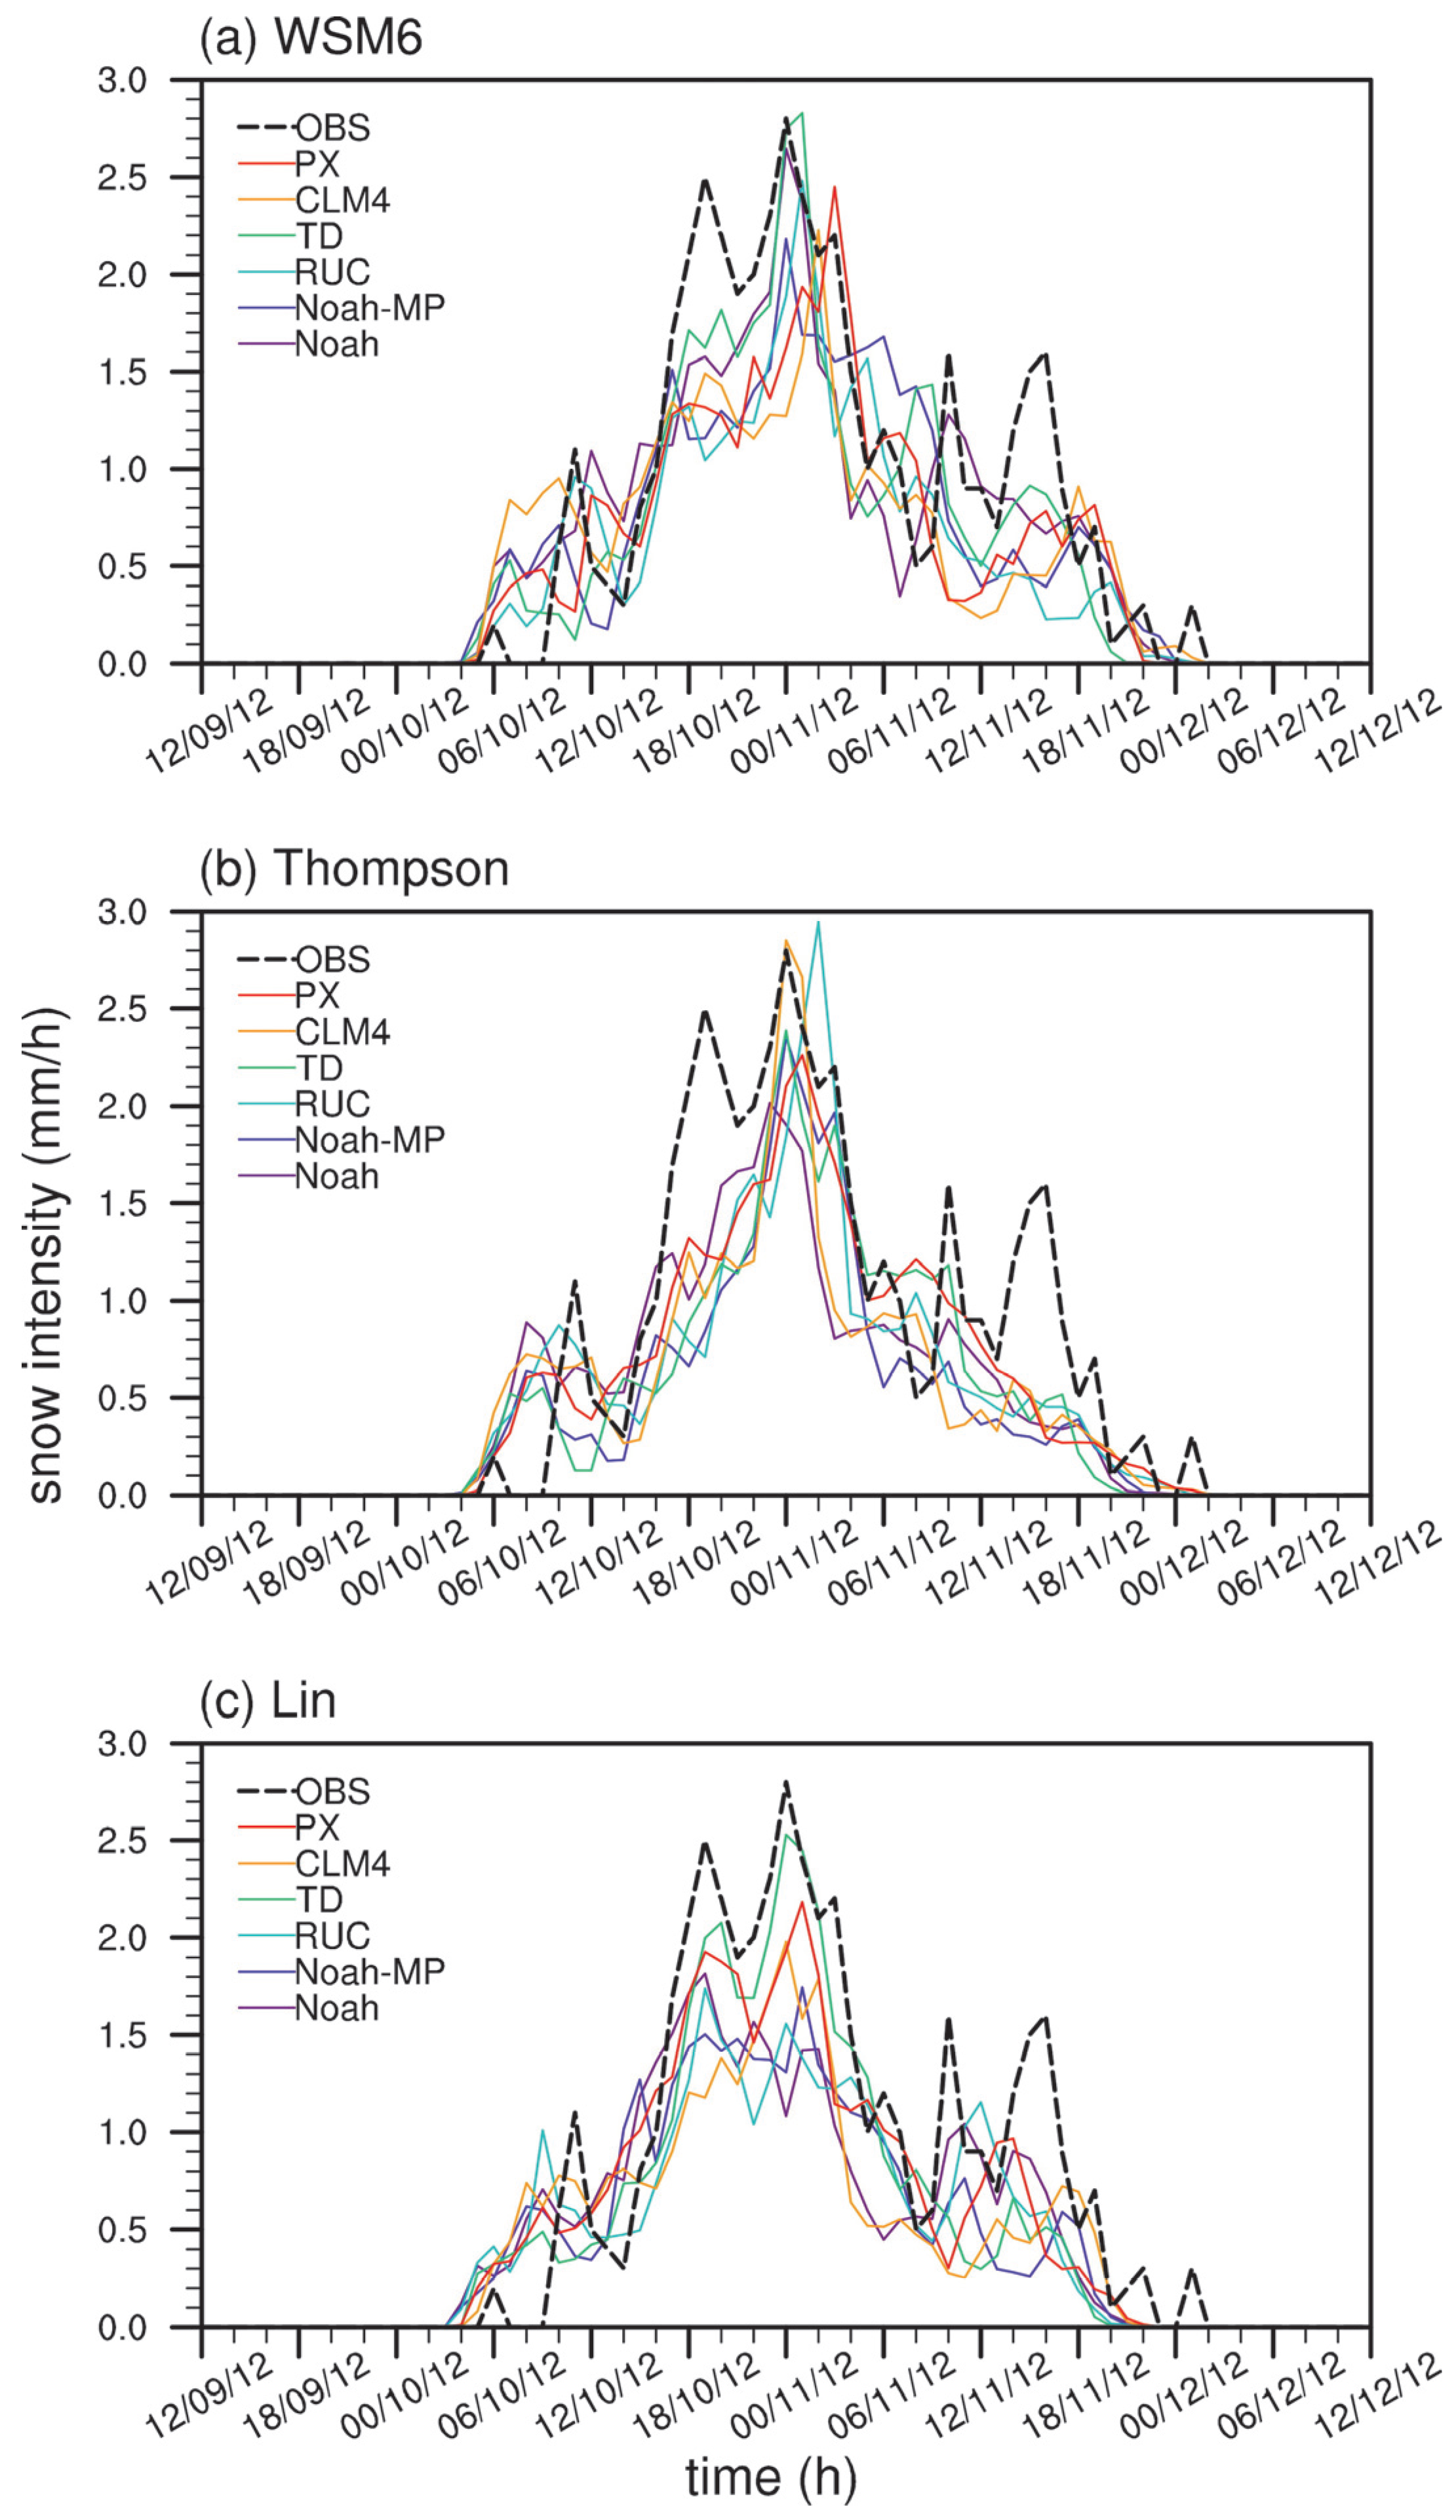
In this heavy snowfall event, Urumqi station (43.79° N, 87.65° E) has recorded the largest snowfall amount, which reaches 46.3 mm. Hence, it is taken as a representative to evaluate the simulation effects of different combinations on the heavy snowfall centers. Figure 10 shows the temporal variations in the observed and simulated hourly snowfall intensity. The heavy snowfall process in Urumqi started at 0600 UTC on 10 December and ended at 0200 UTC on 12 December. All 18 groups of experiments can well simulate the starting and ending of the snowfall process in Urumqi. However, all 18 groups overestimated the snowfall intensity in the early stage but underestimated the snowfall intensity in the peak period. The simulation results using the six land surface parameterization schemes vary greatly in combination with the different microphysical schemes. Specifically, the Noah and TD schemes have the best simulation effects in combinations with the WSM6 scheme; the RUC and CLM4 schemes are closer to the observations in combinations with the Thompson scheme; and the PX and TD schemes have the best simulation effects in combinations with the Lin scheme. Figure 10 displays that the strongest snowfall period in Urumqi is from 1400 UTC on 10 December to 0400 UTC on 11 December, and the simulated snowfall intensity shows the greatest difference among different experiments in this period. In combination with the Lin scheme, the difference among the different land surface parameterization schemes can be up to 2 mm h−1.
4. Conclusions and Discussion
Previous studies have paid little attention to the influence of the land surface processes on heavy snowfall in Xinjiang. In this study, a heavy snowfall event that occurred in Xinjiang during 9–13 December 2015 is taken as the study case. The simulation effects of snowfall using the WRF model that adopts different combinations of the six land surface parameterization schemes with three microphysical schemes are evaluated. Meanwhile, the model outputs are also compared with the observations. The conclusions are as follows.
The simulations of this heavy snowfall event show regional differences, where the snowfall intensity and snowfall range are very sensitive to the selection of the land surface parameterization schemes. In the Tianshan Mountains, the snowfall is generally underestimated, where the PX scheme and the CLM4 scheme perform relatively better. In southern Xinjiang, the snowfall is overestimated by almost all six schemes, while the Noah-MP scheme performs relatively more reasonable than the others. In northwestern Xinjiang, the Noah scheme is superior to the other schemes.
The difference of the microphysical schemes is mainly reflected in the snowfall magnitudes. The simulation of the accumulated snowfall amount is the largest (smallest) in the WSM6 (Lin) scheme. The accumulated snowfall amounts above 10 mm are generally underestimated by all six land surface schemes, and the Noah scheme gives more snowfall values that are close to the observation than the other schemes. However, the accumulated snowfall amounts below 10 mm are overestimated by most schemes, where the Noah-MP scheme has the least overestimation.
For stations with the observed snowfall amount above 3 mm, the combination of the Noah scheme with the Thompson scheme produces the smallest error and thus performs the best, with the RMSE and MAE being 6.96 mm and 5.23 mm, respectively. When the observations at all stations are considered, the RMSE and MAE are the smallest using the combination of the Noah-MP scheme with the Thompson scheme. It indicates that the Noah-MP scheme has the best simulation effect for snowfall in the whole region, while the Noah scheme shows its advantage for snowfall with larger grades. It also confirms that the performance of the WRF model in snowfall simulation depends on the snowfall grades to a certain extent [31].
This study evaluates the effects of the different land surface parameterization schemes on a heavy snowfall event in Xinjiang and further confirms that the snowfall intensity and snowfall range are very sensitive to the selection of the land surface parameterization schemes [38,40]. Meanwhile, obvious regional differences are found in the performance of the different land surface parameterization schemes for snowfall simulations in Xinjiang. The results coincide well with the snowfall underestimation in the Tianshan Mountains by the WRF model [14]. In addition, overestimations and uncertainties in snowfall simulations are newly found in southern and northwestern Xinjiang. This also shows the complexity of the impact of land surface processes on the snowfall in Xinjiang. Hence, this study may provide theoretical and empirical reference for numerical simulation experiments on snowfall events in regions with similar terrain conditions. It also helps determine the impacts of the different physical parameterization schemes on snowfall simulation in Xinjiang, aiming to provide better snowfall forecasts.
Although the Noah-MP scheme has been proven to perform the best in snow simulation for the entire region, it underestimates the snowfall in areas with larger snowfall amounts. This may be related to the snow albedo calculation formula adopted in the Noah-MP scheme [39,56]. The snow albedo is often overestimated when the Noah-MP scheme uses the default calculation formula [57]. The increase in albedo reduces the short-wave solar radiation received by the surface, and then acts to reduce the local surface temperature and inhibit the sensible heat flux. It further affects the atmospheric circulation, which is not conducive to the enhancement of snowfall. This may be one reason for the snowfall underestimation by the Noah-MP scheme. Therefore, we will focus on improving the Noah-MP scheme in the following research to obtain better evaluation results based on more snowfall cases.
Author Contributions
Conceptualization, G.A. and S.W.; methodology, G.A.; software, S.W.; validation, G.A., S.W. and H.Z.; formal analysis, G.A.; investigation, H.Z.; resources, S.W.; data curation, S.W.; writing—original draft preparation, G.A.; writing—review and editing, S.W.; visualization, H.Z.; supervision, H.Z.; project administration, G.A. and S.W; funding acquisition, S.W. All authors have read and agreed to the published version of the manuscript.
Funding
This research was funded by the National Natural Science Foundation of China (grant no. 42075156), the Laoshan Laboratory (LSKJ202202403), and the Strategic Priority Research Program of Chinese Academy of Sciences (XDA20100307).
Institutional Review Board Statement
Not applicable.
Informed Consent Statement
Not applicable.
Data Availability Statement
The datasets generated and analyzed during the current study are not publicly available, but are available from the corresponding author on reasonable request.
Conflicts of Interest
The authors declare no conflict of interest.
References
- Betts, A.K.; Ball, J.H.; Beljaars, A.C.; Miller, M.J.; Viterbo, P.A. The land surface-atmosphere interaction: A review based on observational and global modeling perspectives. J. Geophys. Res. Atmos. 1996, 101, 7209–7225. [Google Scholar] [CrossRef]
- Cardoso, R.M.; Soares, P.M.M.; Miranda, P.M.A.; Belo-Pereira, M. WRF high resolution simulation of Iberian mean and extreme precipitation climate. Int. J. Climatol. 2013, 33, 2591–2608. [Google Scholar] [CrossRef]
- Dan, L.; Cao, F.; Gao, R. The improvement of a regional climate model by coupling a land surface model with eco-physiological processes: A case study in 1998. Clim. Chang. 2015, 129, 457–470. [Google Scholar] [CrossRef]
- Yu, R.; Zhou, T.; Xiong, A.; Zhu, Y.; Li, J. Diurnal variations of summer precipitation over contiguous China. Geophys. Res. Lett. 2007, 34, L01704. [Google Scholar] [CrossRef]
- Chen, G.; Sha, W.; Iwasaki, T. Diurnal variation of precipitation over southeastern China: Spatial distribution and its seasonality. J. Geophys. Res. Atmos. 2009, 114, D13103. [Google Scholar] [CrossRef]
- Fu, Y.; Ma, Y.; Zhong, L.; Yang, Y.; Guo, X.; Wang, C.; Xu, X.; Yang, K.; Xu, X.; Liu, L.; et al. Land-surface processes and summer-cloud-precipitation characteristics in the Tibetan Plateau and their effects on downstream weather: A review and perspective. Natl. Sci. Rev. 2020, 7, 500–515. [Google Scholar] [CrossRef] [PubMed]
- Pielke, R.A.; Avissar, R.; Raupach, M.; Dolman, A.J.; Zeng, X.; Denning, A.S. Interactions between the atmosphere and terrestrial ecosystems: Influence on weather and climate. Glob. Chang. Biol. 1998, 4, 461–475. [Google Scholar] [CrossRef]
- Yin, J.; Guo, S.; Wang, J.; Chen, J.; Zhang, Q.; Gu, L.; Yang, Y.; Tian, J.; Xiong, L.; Zhang, Y. Thermodynamic driving mechanisms for the formation of global precipitation extremes and ecohydrological effects. Sci. China Earth Sci. 2023, 66, 92–110. [Google Scholar] [CrossRef]
- Sun, J.; Wang, H.; Yuan, W.; Chen, H. Spatial-temporal features of intense snowfall events in China and their possible change. J. Geophys. Res. Atmos. 2010, 115, D16110. [Google Scholar] [CrossRef]
- Wang, S.; Ding, Y.; Jiang, F.; Anjum, M.N.; Iqbal, M. Defining indices for the extreme snowfall events and analyzing their trends in northern Xinjiang, China. J. Meteorol. Soc. Jpn. 2017, 95, 287–299. [Google Scholar] [CrossRef]
- Yao, J.; Chen, Y.; Guan, X.; Zhao, Y.; Chen, J.; Mao, W. Recent climate and hydrological changes in a mountain–basin system in Xinjiang, China. Earth Sci. Rev. 2022, 226, 103957. [Google Scholar] [CrossRef]
- Bai, A.; Zhai, P.; Liu, X. Climatology and trends of wet spells in China. Theor. Appl. Climatol. 2007, 88, 139–148. [Google Scholar] [CrossRef]
- Yang, T.; Li, Q.; Liu, W.; Liu, X.; Li, L.; De Maeyer, P. Spatiotemporal variability of snowfall and its concentration in northern Xinjiang, Northwest China. Theor. Appl. Climatol. 2020, 139, 1247–1259. [Google Scholar] [CrossRef]
- Yang, T.; Li, Q.; Hamdi, R.; Zou, Q.; Chen, X.; De Maeyer, P.; Cui, F.; Li, L. Snowfall climatology in the Tianshan Mountains based on 36 cold seasons of WRF dynamical downscaling simulation. Atmos. Res. 2022, 270, 106057. [Google Scholar] [CrossRef]
- Wang, H.; Dong, S.; Wang, M.; Yu, X.; Wang, S.; Liu, J. The Spatiotemporal Characteristics of Urban Snow Disasters in Xinjiang over the Last 60 Years. Atmosphere 2023, 14, 802. [Google Scholar] [CrossRef]
- Wang, M.; Wei, W.; He, Q.; Wang, S.; Ren, Q.; Geng, Y.; Zhao, L. Analyses on integrated detection of the blizzard process in 19–20 March 2012 in Urumqi, Xinjiang China. Meteorol. Atmos. Phys. 2014, 125, 63–73. [Google Scholar] [CrossRef]
- Yang, X.; Li, A.; Zhao, Y.; Wei, J. Spatial-temporal distribution and general circulation of snowstorm in northern Xinjiang from 1961 to 2018. J. Glaciol. Geocryol. 2020, 42, 756–765. [Google Scholar]
- Chen, Z.; Xu, Y.; Zhou, X.; Tang, J.; Kuzyakov, Y.; Yu, H.; Fan, J.; Ding, W. Extreme rainfall and snowfall alter responses of soil respiration to nitrogen fertilization: A 3-year field experiment. Glob. Chang. Biol. 2017, 23, 3403–3417. [Google Scholar] [CrossRef]
- Maussion, F.; Scherer, D.; Finkelnburg, R.; Richters, J.; Yang, W.; Yao, T. WRF simulation of a precipitation event over the Tibetan Plateau, China–an assessment using remote sensing and ground observations. Hydrol. Earth Syst. Sci. 2011, 15, 1795–1817. [Google Scholar] [CrossRef]
- Pryor, S.C.; Letson, F.; Shepherd, T.; Barthelmie, R.J. Evaluation of WRF simulation of deep convection in the US Southern Great Plains. J. Appl. Meteorol. Climatol. 2023, 62, 41–62. [Google Scholar] [CrossRef]
- Pennelly, C.; Reuter, G.; Flesch, T. Verification of the WRF model for simulating heavy precipitation in Alberta. Atmos. Res. 2014, 135, 172–192. [Google Scholar] [CrossRef]
- Bukovsky, M.S.; Karoly, D.J. Precipitation simulations using WRF as a nested regional climate model. J. Appl. Meteorol. Climatol. 2009, 48, 2152–2159. [Google Scholar] [CrossRef]
- Cassola, F.; Ferrari, F.; Mazzino, A. Numerical simulations of Mediterranean heavy precipitation events with the WRF model: A verification exercise using different approaches. Atmos. Res. 2015, 164, 210–225. [Google Scholar] [CrossRef]
- Shi, J.J.; Tao, W.-K.; Matsui, T.; Cifelli, R.; Hou, A.; Lang, S.; Tokay, A.; Wang, N.-Y.; Peters-Lidard, C.; Skofronick-Jackson, G.; et al. WRF simulations of the 20–22 January 2007 snow events over eastern Canada: Comparison with in situ and satellite observations. J. Appl. Meteorol. Climatol. 2010, 49, 2246–2266. [Google Scholar] [CrossRef]
- Jee, J.B.; Kim, S. Sensitivity study on high-resolution WRF precipitation forecast for a heavy rainfall event. Atmosphere 2017, 8, 96. [Google Scholar] [CrossRef]
- Lv, M.; Xu, Z.; Yang, Z.L. Cloud resolving WRF simulations of precipitation and soil moisture over the central Tibetan Plateau: An assessment of various physics options. Earth Space Sci. 2020, 7, e2019EA000865. [Google Scholar] [CrossRef]
- Valappil, V.K.; Kedia, S.; Dwivedi, A.K.; Pokale, S.S.; Islam, S.; Khare, M.K. Assessing the performance of WRF ARW model in simulating heavy rainfall events over the Pune region: In support of operational applications. Meteorol. Atmos. Phys. 2023, 135, 16. [Google Scholar] [CrossRef]
- Hu, X.M.; Klein, P.M.; Xue, M. Evaluation of the updated YSU planetary boundary layer scheme within WRF for wind resource and air quality assessments. J. Geophys. Res. Atmos. 2013, 118, 10490–10505. [Google Scholar] [CrossRef]
- Comin, A.N.; Schumacher, V.; Justino, F.; Fernandez, A. Impact of different microphysical parameterizations on extreme snowfall events in the Southern Andes. Weather Clim. Extrem. 2018, 21, 65–75. [Google Scholar] [CrossRef]
- Thompson, G.; Field, P.R.; Rasmussen, R.M.; Hall, W.D. Explicit forecasts of winter precipitation using an improved bulk microphysics scheme. Part II: Implementation of a new snow parameterization. Mon. Weather Rev. 2008, 136, 5095–5115. [Google Scholar] [CrossRef]
- Liu, L.; Ma, Y.; Menenti, M.; Zhang, X.; Ma, W. Evaluation of WRF modeling in relation to different land surface schemes and initial and boundary conditions: A snow event simulation over the Tibetan Plateau. J. Geophys. Res. Atmos. 2019, 124, 209–226. [Google Scholar] [CrossRef]
- Norris, J.; Carvalho, L.M.; Jones, C.; Cannon, F. WRF simulations of two extreme snowfall events associated with contrasting extratropical cyclones over the western and central Himalaya. J. Geophys. Res. Atmos. 2015, 120, 3114–3138. [Google Scholar] [CrossRef]
- Shikhovtsev, A.Y.; Kovadlo, P.G.; Lezhenin, A.A.; Korobov, O.A.; Kiselev, A.V.; Russkikh, I.V.; Kolobov, D.Y.; Shikhovtsev, M.Y. Influence of Atmospheric Flow Structure on Optical Turbulence Characteristics. Appl. Sci. 2023, 13, 1282. [Google Scholar] [CrossRef]
- Ma, X.; Jin, J.; Liu, J.; Niu, G.Y. An improved vegetation emissivity scheme for land surface modeling and its impact on snow cover simulations. Clim. Dyn. 2019, 53, 6215–6226. [Google Scholar] [CrossRef]
- Zhong, L.; Huang, Z.; Ma, Y.; Fu, Y.; Chen, M.; Ma, M.; Zheng, J. Assessments of Weather Research and Forecasting land surface models in precipitation simulation over the Tibetan Plateau. Earth Space Sci. 2021, 8, e2020EA001565. [Google Scholar] [CrossRef]
- Wang, H.; Yu, E.; Yang, S. An exceptionally heavy snowfall in Northeast China: Large-scale circulation anomalies and hindcast of the NCAR WRF model. Meteorol. Atmos. Phys. 2011, 113, 11–25. [Google Scholar] [CrossRef]
- Fu, D.; Zhang, W.; Xing, Y.; Li, H.; Wang, P.; Li, B.; Shi, X.; Zuo, J.; Yabo, S.; Thapa, S.; et al. Impacts of maximum snow albedo and land cover changes on meteorological variables during winter in northeast China. Atmos Res. 2021, 254, 105449. [Google Scholar] [CrossRef]
- Yu, E. High-resolution seasonal snowfall simulation over Northeast China. Chin. Sci. Bull. 2013, 58, 1412–1419. [Google Scholar] [CrossRef]
- Li, Q.; Yang, T.; Li, L. Quantitative assessment of the parameterization sensitivity of the WRF/Noah-MP model of snow dynamics in the Tianshan Mountains, Central Asia. Atmos. Res. 2022, 277, 106310. [Google Scholar] [CrossRef]
- Wang, S.; Sun, B. The impacts of different land surface parameterization schemes on Northeast China snowfall simulation. Meteorol. Atmos. Phys. 2018, 130, 583–590. [Google Scholar] [CrossRef]
- He, X.; Abulikemu, A.; Mamtimin, A.; Li, R.; Abulimiti, A.; An, D.; Aireti, M.; Zhou, Y.; Sun, Q.; Li, Z.; et al. On the Mechanisms of a Snowstorm Associated with a Low-Level Cold Front and Low-Level Jet in the Western Mountainous Region of the Junggar Basin, Xinjiang, Northwest China. Atmosphere 2023, 14, 919. [Google Scholar] [CrossRef]
- Weisman, M.L.; Davis, C.; Wang, W.; Manning, K.W.; Klemp, J.B. Experiences with 0–36-h explicit convective forecasts with the WRF-ARW model. Weather Forecast. 2008, 23, 407–437. [Google Scholar] [CrossRef]
- Chen, F.; Dudhia, J. Coupling an advanced land surface–hydrology model with the Penn State–NCAR MM5 modeling system. Part I: Model implementation and sensitivity. Mon. Weather Rev. 2001, 129, 569–585. [Google Scholar] [CrossRef]
- Cai, X.; Yang, Z.-L.; Xia, Y.; Huang, M.; Wei, H.; Leung, L.R.; Ek, M.B. Assessment of simulated water balance from Noah, Noah-MP, CLM, and VIC over CONUS using the NLDAS test bed. J. Geophys. Res. Atmos. 2014, 119, 13–751. [Google Scholar] [CrossRef]
- Smirnova, T.G.; Brown, J.M.; Benjamin, S.G.; Kenyon, J.S. Modifications to the rapid update cycle land surface model (RUC LSM) available in the weather research and forecasting (WRF) model. Mon. Weather Rev. 2016, 144, 1851–1865. [Google Scholar] [CrossRef]
- Dai, Y.; Zeng, X.; Dickinson, R.E.; Baker, I.; Bonan, G.B.; Bosilovich, M.G.; Denning, A.S.; Dirmeyer, P.A.; Houser, P.R.; Niu, G.; et al. The common land model. Bull. Am. Meteorol. Soc. 2003, 84, 1013–1024. [Google Scholar] [CrossRef]
- Pleim, J.E.; Xiu, A. Development of a land surface model. Part II: Data assimilation. J. Appl. Meteorol. Climatol. 2003, 42, 1811–1822. [Google Scholar] [CrossRef]
- Shrivastava, R.; Dash, S.K.; Oza, R.B.; Sharma, D.N. Evaluation of parameterization schemes in the WRF model for estimation of mixing height. Int. J. Atmos. Sci. 2014, 2014, 451578. [Google Scholar] [CrossRef]
- Hong, S.Y.; Lim, J.O.J. The WRF single-moment 6-class microphysics scheme (WSM6). Asia Pac. J. Atmos. Sci. 2006, 42, 129–151. [Google Scholar]
- Lin, Y.L.; Farley, R.D.; Orville, H.D. Bulk parameterization of the snow field in a cloud model. J. Appl. Meteorol. Climatol. 1983, 22, 1065–1092. [Google Scholar] [CrossRef]
- Kain, J.S. The Kain–Fritsch convective parameterization: An update. J. Appl. Meteorol. Climatol. 2004, 43, 170–181. [Google Scholar] [CrossRef]
- Dudhia, J. Numerical study of convection observed during the winter monsoon experiment using a mesoscale two-dimensional model. J. Atmos. Sci. 1989, 46, 3077–3107. [Google Scholar] [CrossRef]
- Mlawer, E.J.; Taubman, S.J.; Brown, P.D.; Iacono, M.J.; Clough, S.A. Radiative transfer for inhomogeneous atmospheres: RRTM, a validated correlated-k model for the longwave. J. Geophys. Res. Atmos. 1997, 102, 16663–16682. [Google Scholar] [CrossRef]
- Jiménez, P.A.; Dudhia, J.; González-Rouco, J.F.; Navarro, J.; Montávez, J.P.; García-Bustamante, E. A revised scheme for the WRF surface layer formulation. Mon. Weather Rev. 2012, 140, 898–918. [Google Scholar] [CrossRef]
- Tiwari, S.; Kar, S.C.; Bhatla, R. Dynamic downscaling over western Himalayas: Impact of cloud microphysics schemes. Atmos. Res. 2018, 201, 1–16. [Google Scholar] [CrossRef]
- Oaida, C.M.; Xue, Y.; Flanner, M.G.; Skiles, S.M.; De Sales, F.; Painter, T.H. Improving snow albedo processes in WRF/SSiB regional climate model to assess impact of dust and black carbon in snow on surface energy balance and hydrology over western US. J. Geophys. Res. Atmos. 2015, 120, 3228–3248. [Google Scholar] [CrossRef]
- Abolafia-Rosenzweig, R.; He, C.; McKenzie Skiles, S.; Chen, F.; Gochis, D. Evaluation and Optimization of Snow Albedo Scheme in Noah-MP Land Surface Model Using In Situ Spectral Observations in the Colorado Rockies. J. Adv. Model. Earth Syst. 2022, 14, e2022MS003141. [Google Scholar] [CrossRef]
Figure 1.
The two nested domains (d01 and d02) and topography (shaded). The black dots denote the location of 105 meteorological observation stations.
Figure 1.
The two nested domains (d01 and d02) and topography (shaded). The black dots denote the location of 105 meteorological observation stations.

Figure 2.
85 h accumulated snowfall amount (unit: mm) observed at 105 stations in Xinjiang from 1200 UTC on 9 December to 0000 UTC on 13 December 2015. The snowfall amounts are marked in different colors according to their magnitudes. The red boxes denote three regions with large snowfall amounts, namely (a) northwestern Xinjiang, (b) the Tianshan Mountains, and (c) southern Xinjiang.
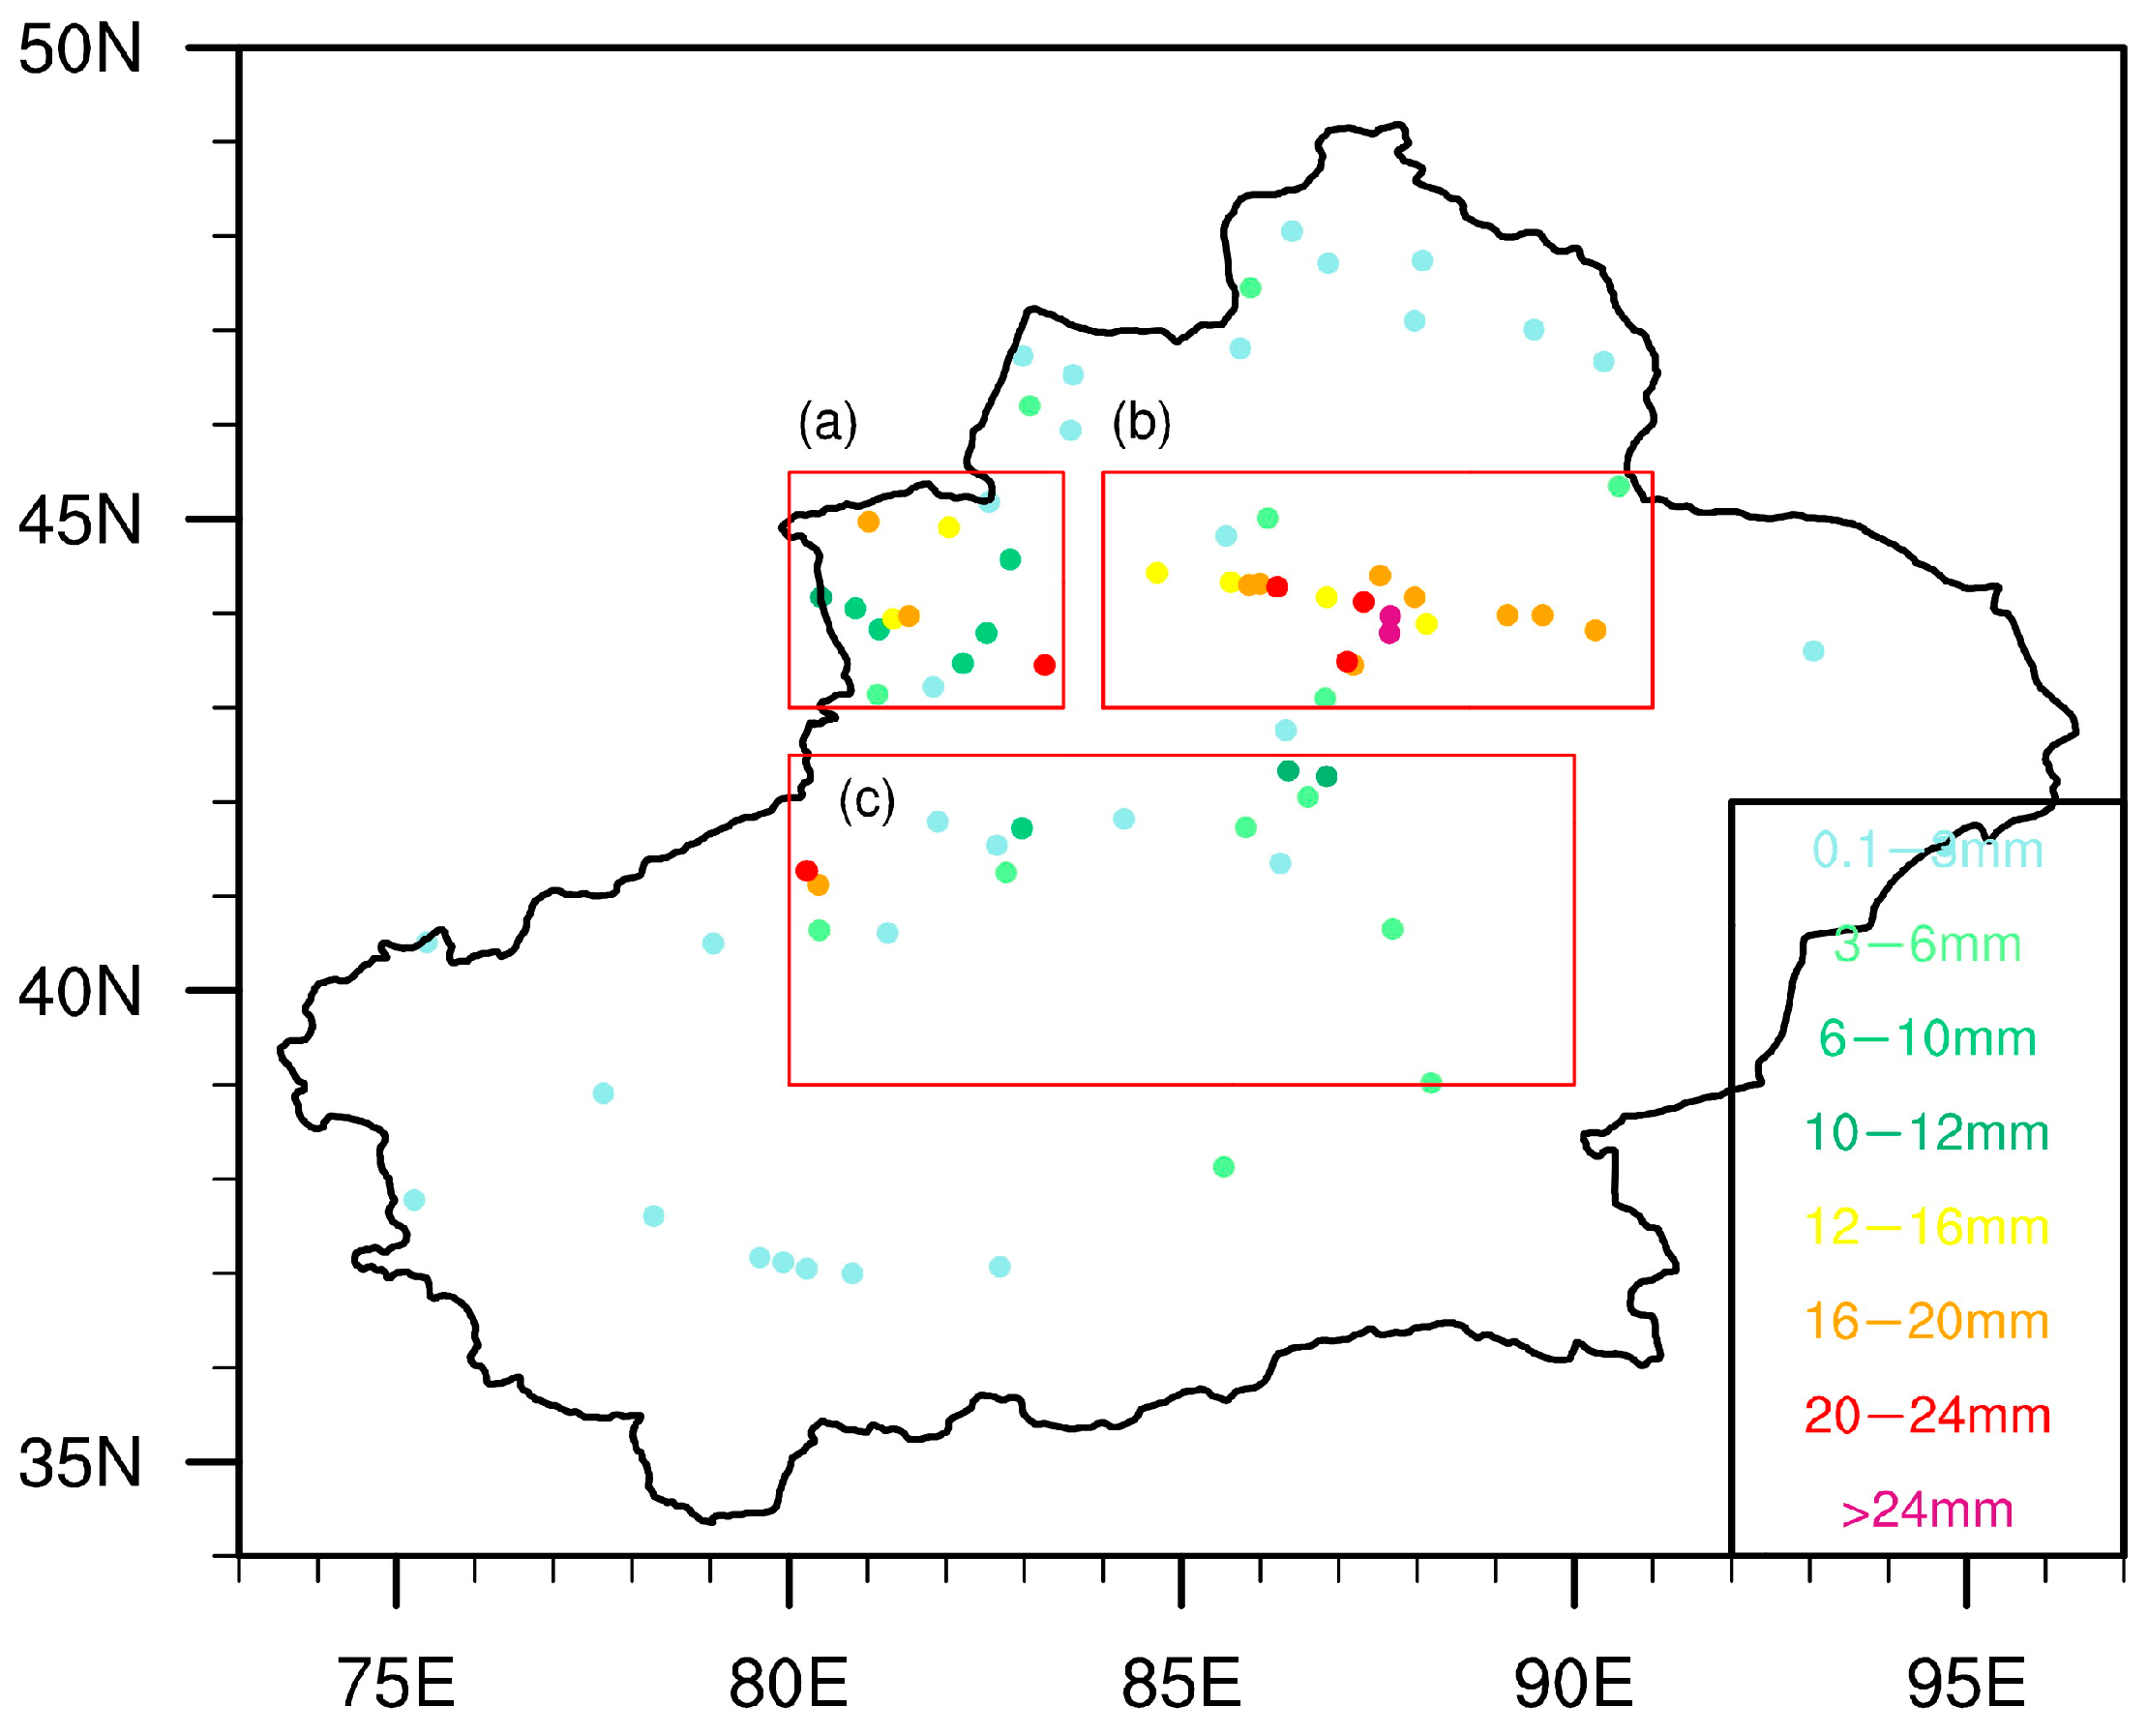
Figure 3.
Spatial distributions of simulated (shading) and observed (marked with numbers, some numbers are omitted to avoid overlapping) 85 h accumulated snowfall amount (unit: mm) under the combinations of the Thompson scheme with the (a) Noah scheme, (b) Noah-MP scheme, (c) RUC scheme, (d) TD scheme, (e) CLM4 scheme, and (f) PX scheme. The snowfall period is from 1200 UTC on 9 December to 0000 UTC on 13 December 2015.
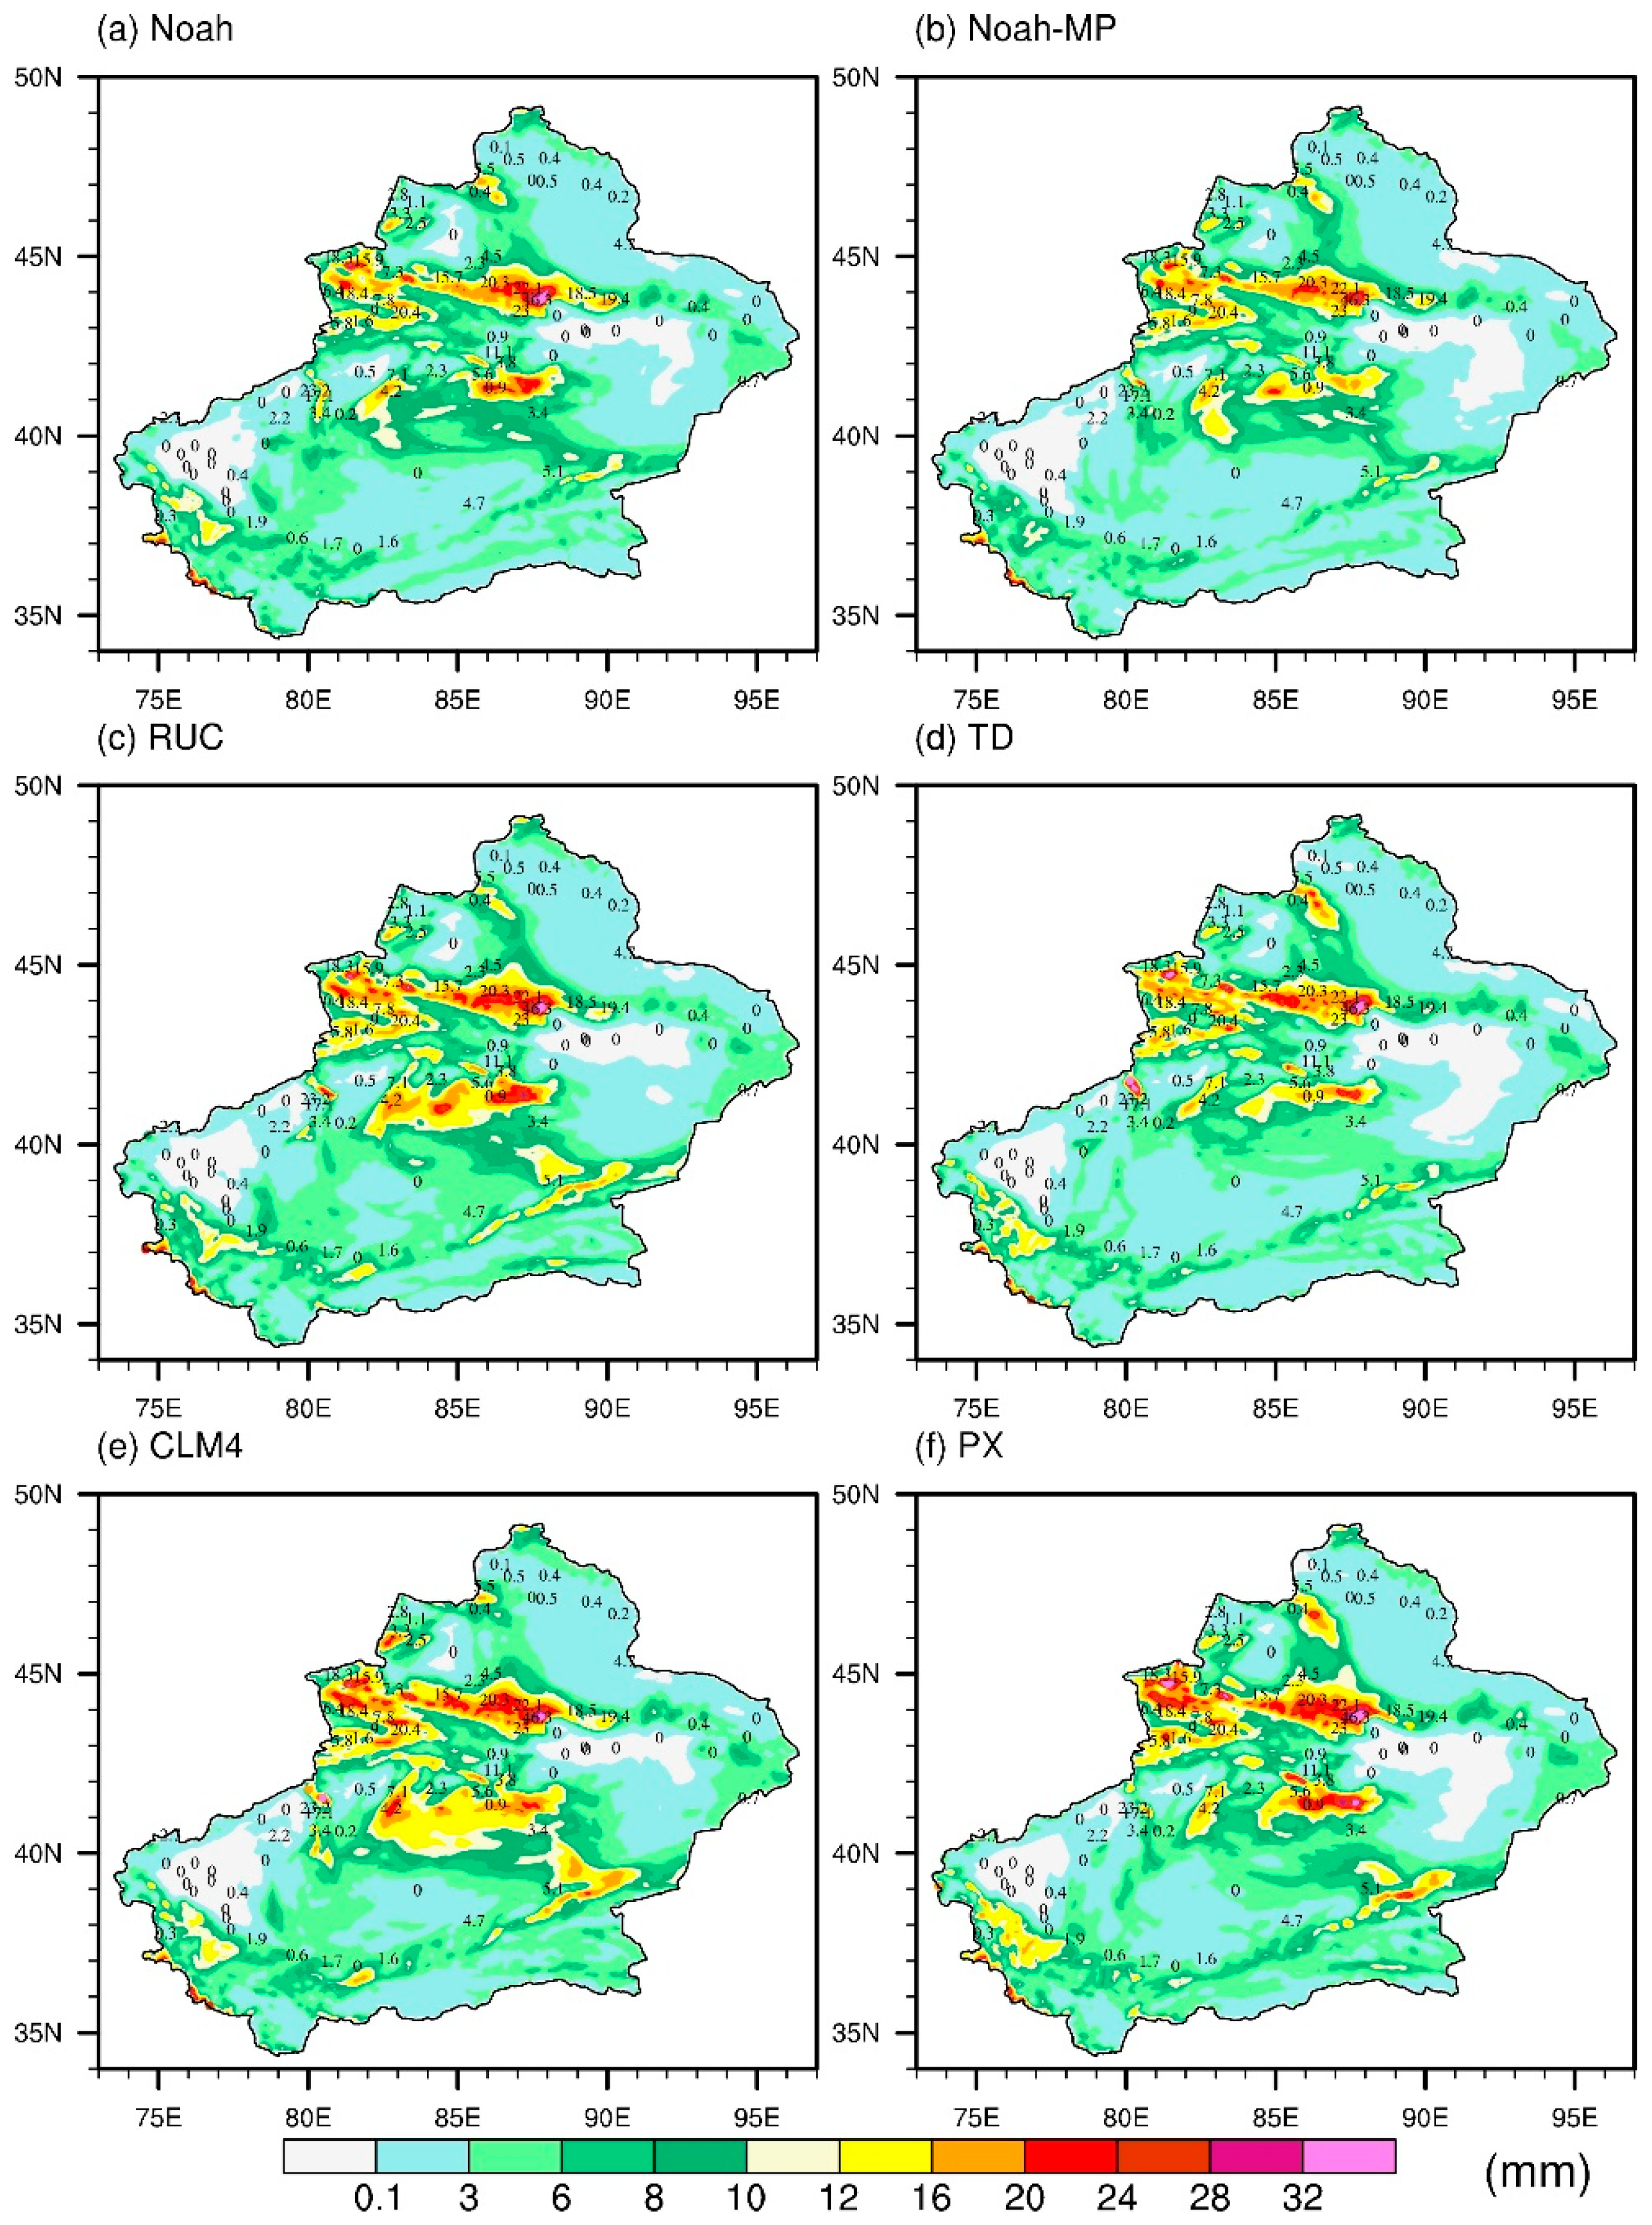
Figure 4.
Scatter plots of the observed values at 45 meteorological observation stations with accumulated snowfall amount greater than 3 mm (black solid circle, unit: mm) and the simulated values at the grid points nearest to these stations under the combinations of the Thompson scheme with the (a) Noah scheme, (b) Noah-MP scheme, (c) RUC scheme, (d) TD scheme, (e) CLM4 scheme, and (f) PX scheme. The black dotted line is the line y = x. The red solid line is a linear fit to the black solid circles. r is the correlation coefficient between the observed and simulated values.
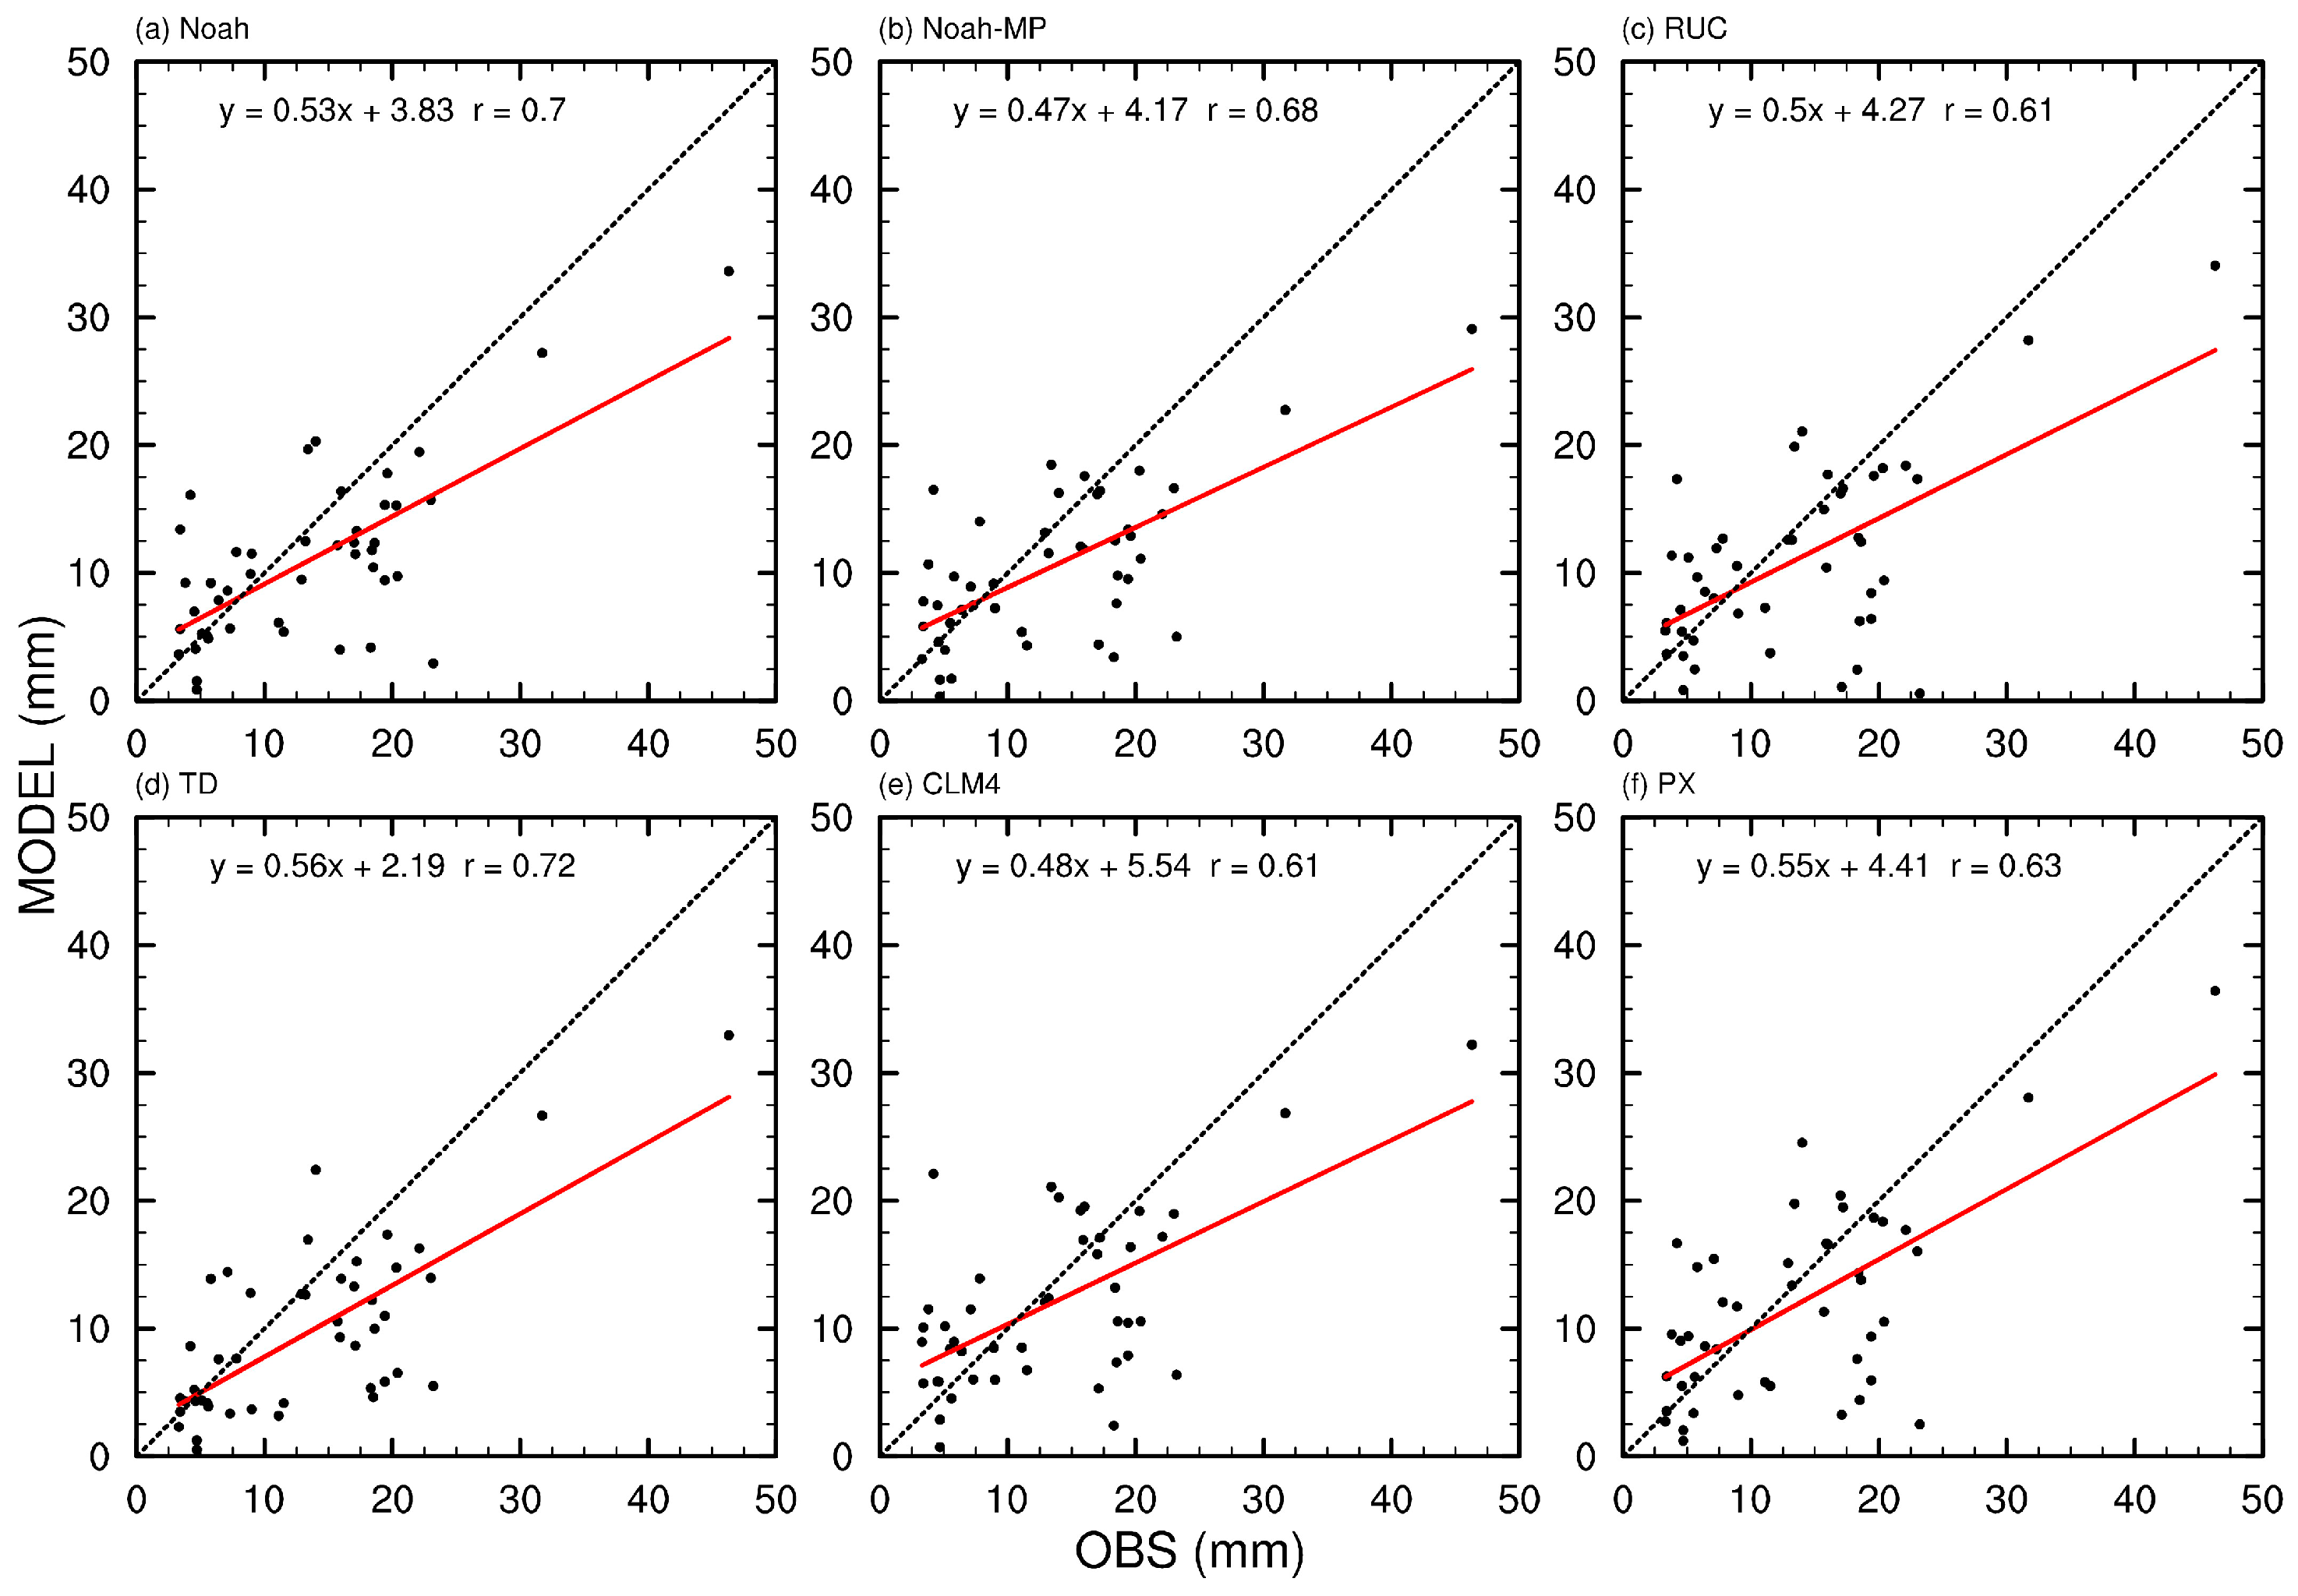
Figure 5.
Spatial distributions of simulated (shading) and observed (marked with numbers, some numbers are omitted to avoid overlapping) 85 h accumulated snowfall amount (unit: mm) under the combinations of the WSM6 scheme with the (a) Noah scheme, (b) Noah-MP scheme, (c) RUC scheme, (d) TD scheme, (e) CLM4 scheme, and (f) PX scheme. The snowfall period is from 1200 UTC on 9 December to 0000 UTC on 13 December 2015.
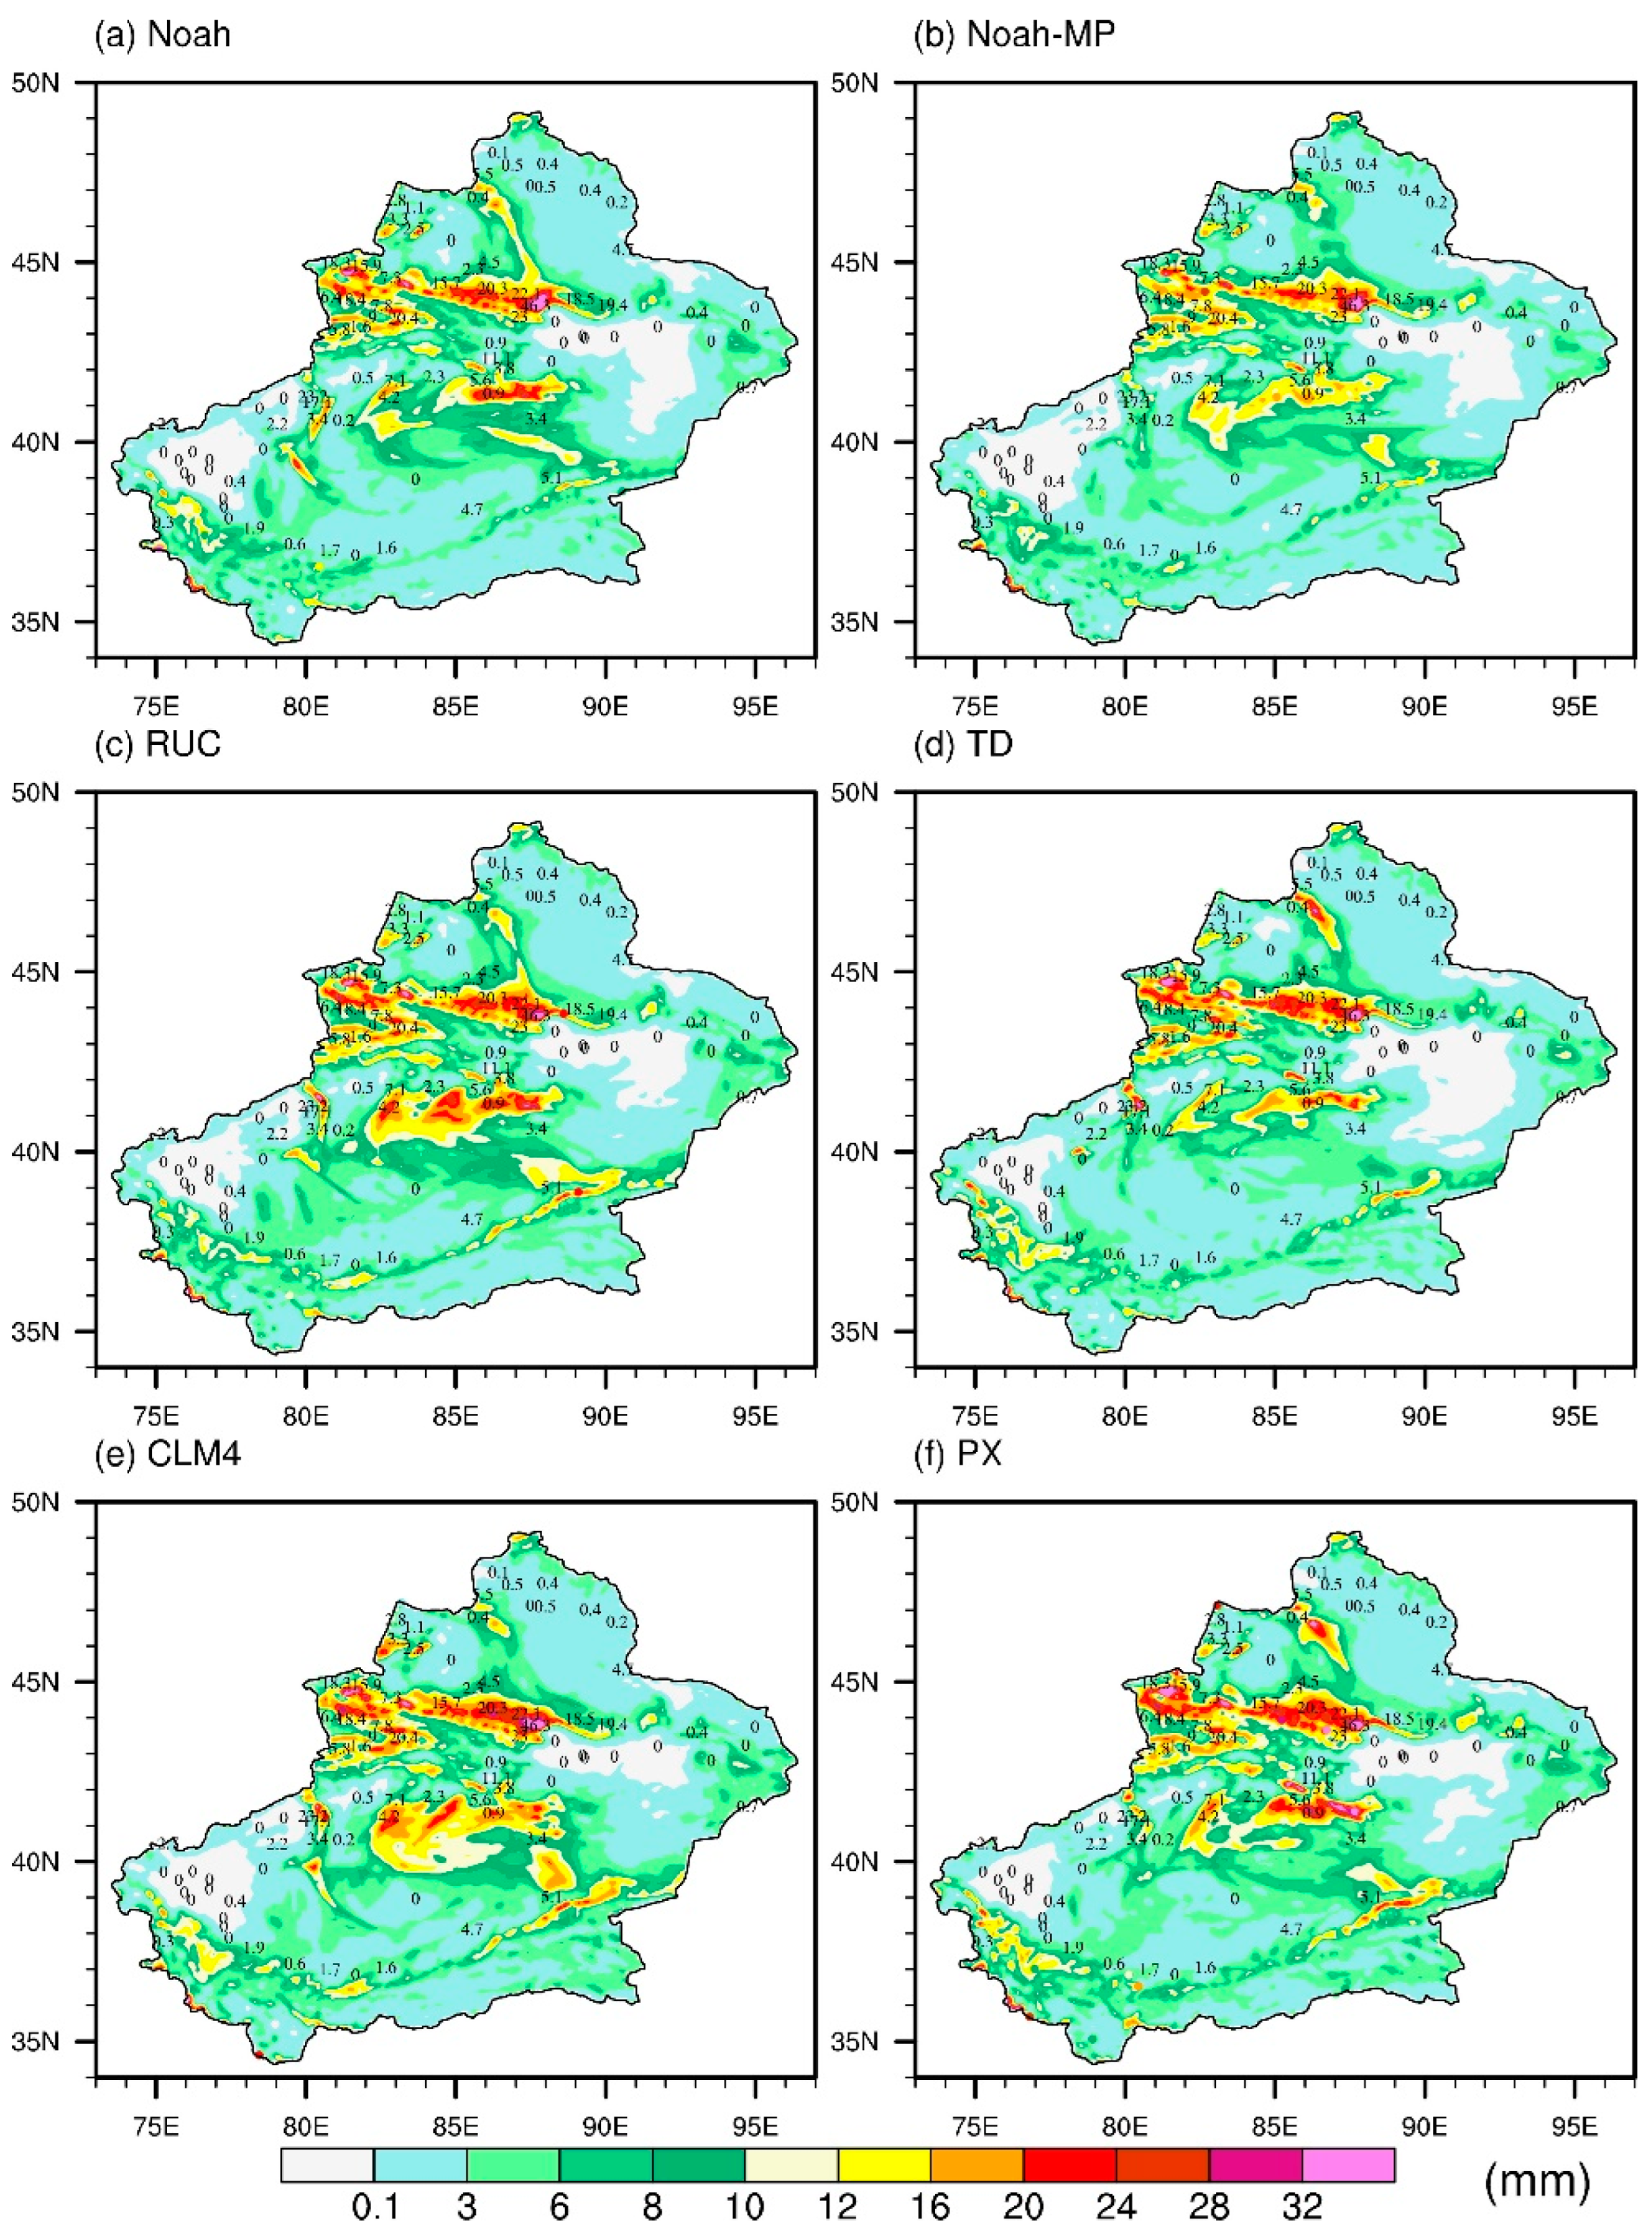
Figure 6.
Scatter plots of the observed values at 45 meteorological observation stations with accumulated snowfall amount greater than 3 mm (black solid circle, unit: mm) and the simulated values at the grid points nearest to these stations under the combinations of the WSM6 scheme with the (a) Noah scheme, (b) Noah-MP scheme, (c) RUC scheme, (d) TD scheme, (e) CLM4 scheme, and (f) PX scheme. The black dotted line is the line y = x. The red solid line is a linear fit to the black solid circles. r is the correlation coefficient between the observed and simulated values.
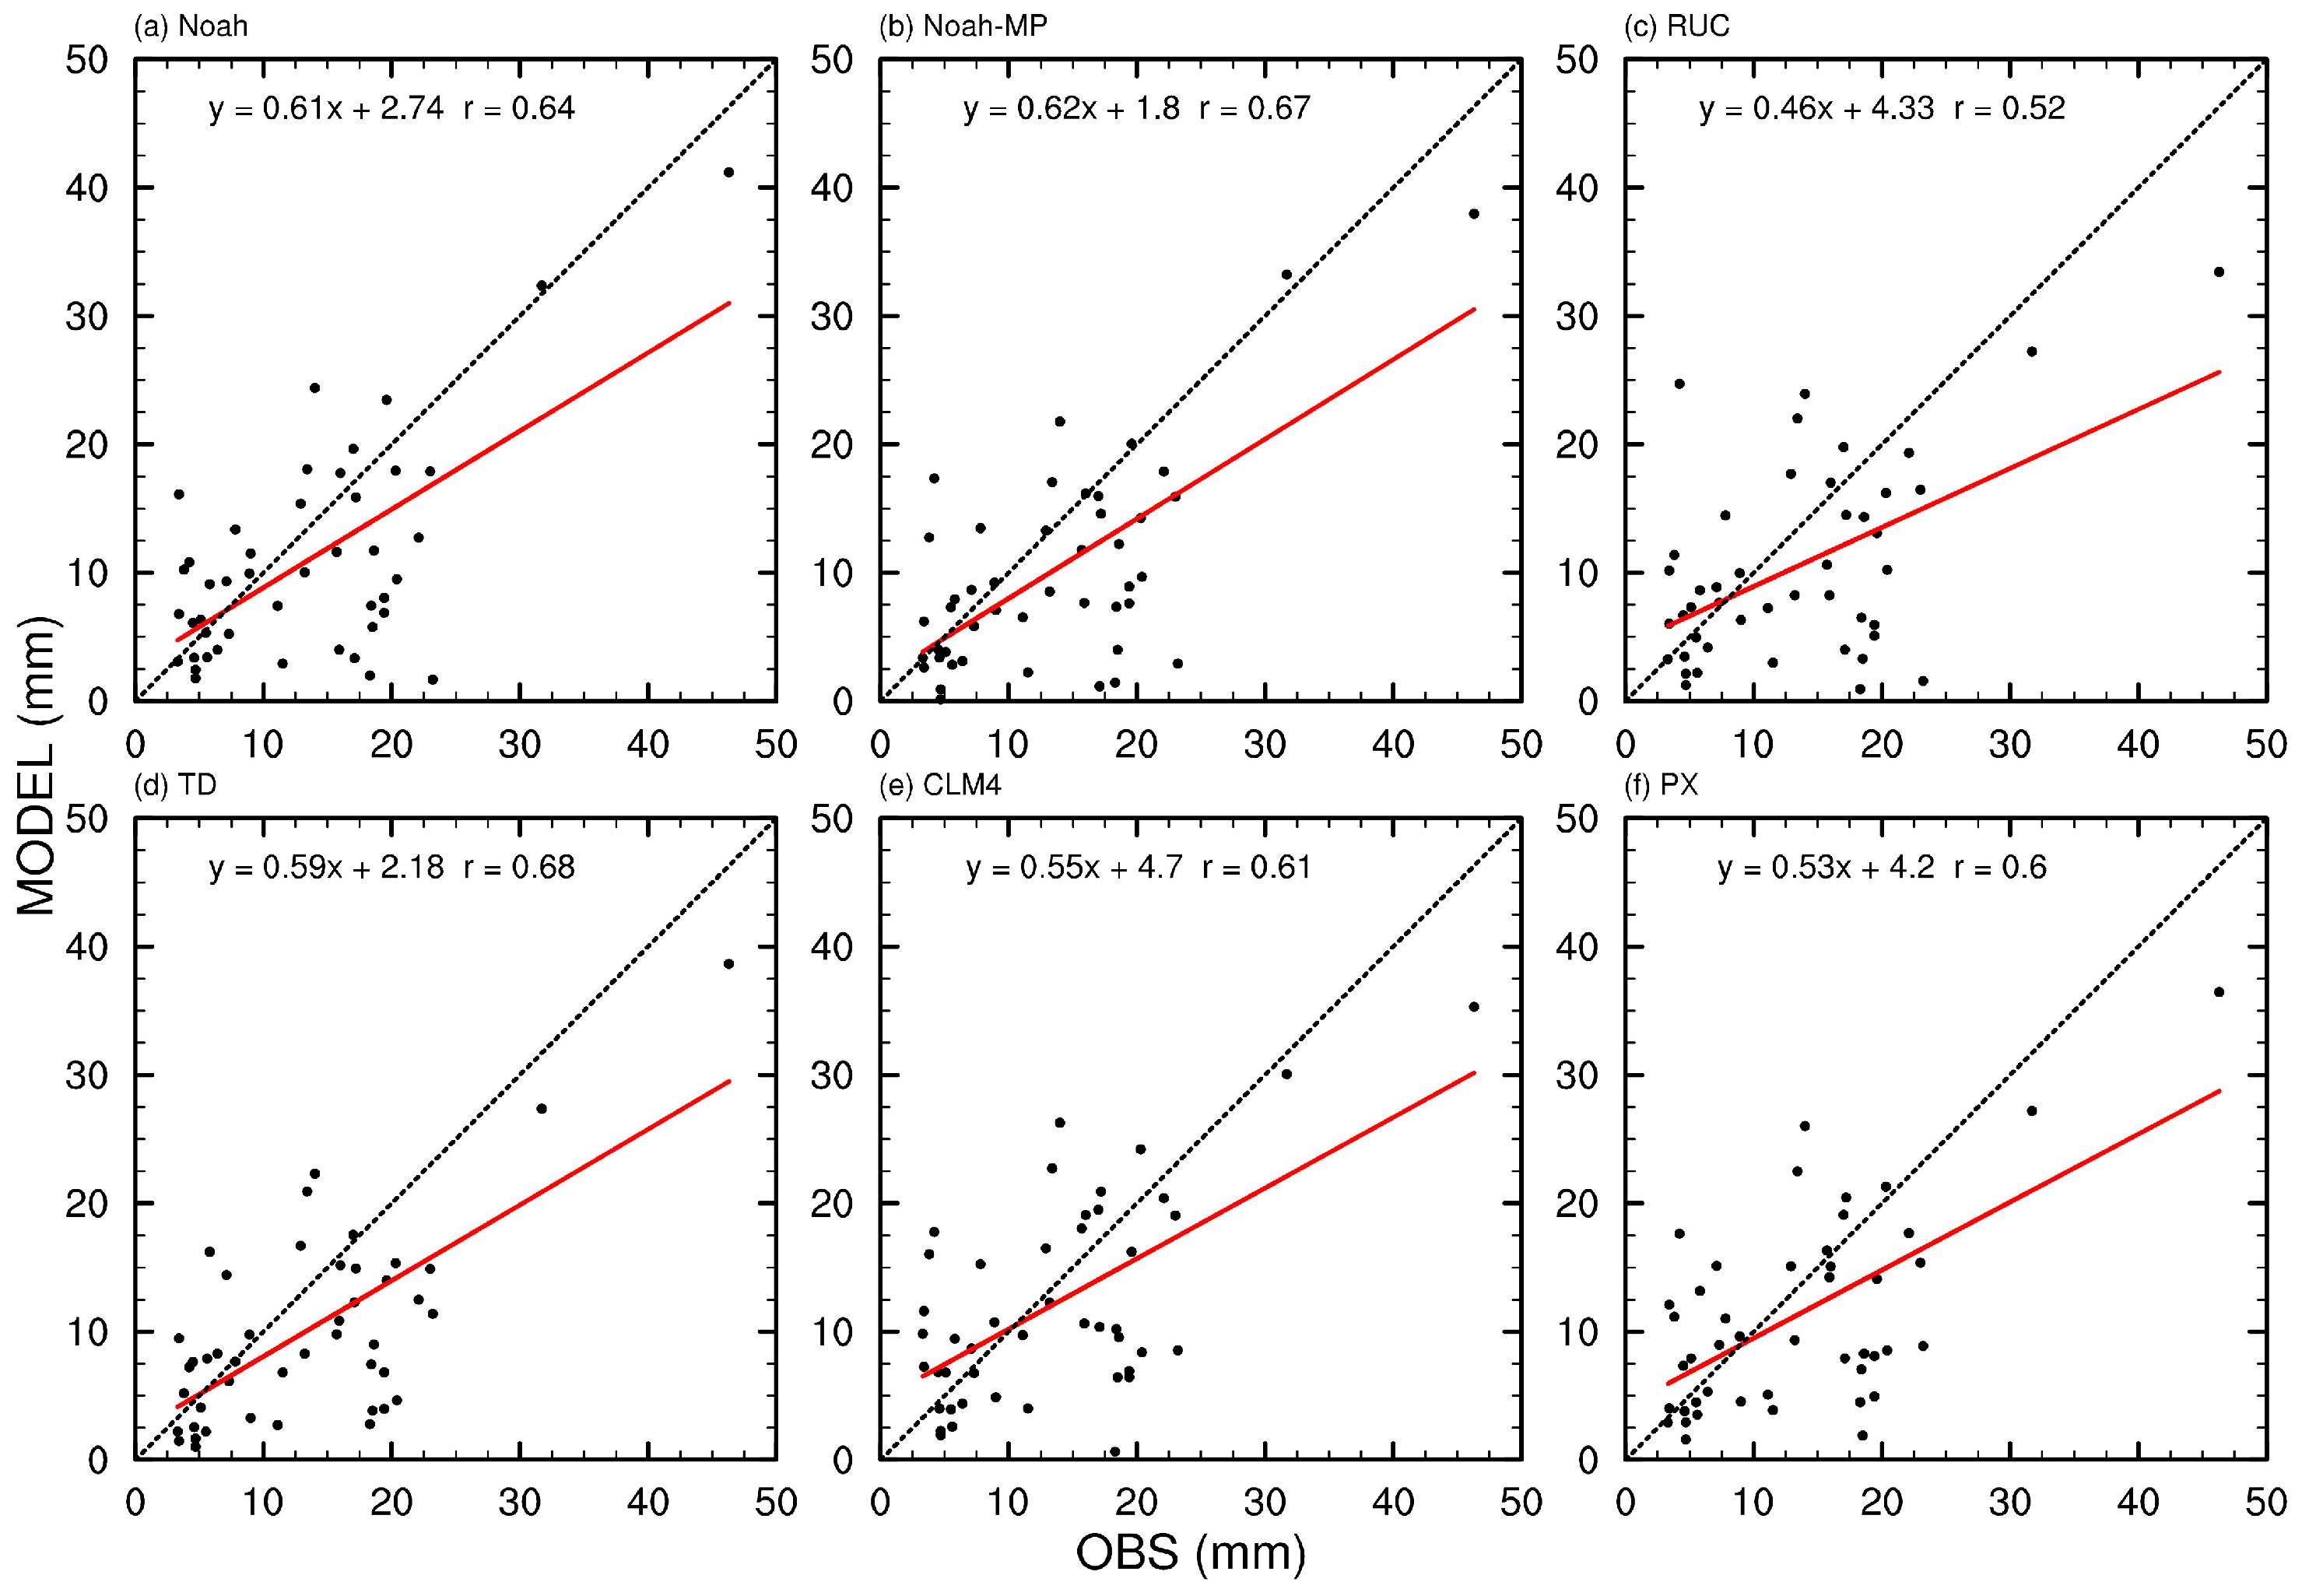
Figure 7.
Spatial distributions of simulated (shading) and observed (marked with numbers, some numbers are omitted to avoid overlapping) 85 h accumulated snowfall amount (unit: mm) under the combinations of the Lin scheme with the (a) Noah scheme, (b) Noah-MP scheme, (c) RUC scheme, (d) TD scheme, (e) CLM4 scheme, and (f) PX scheme. The snowfall period is from 1200 UTC on 9 December to 0000 UTC on 13 December 2015.
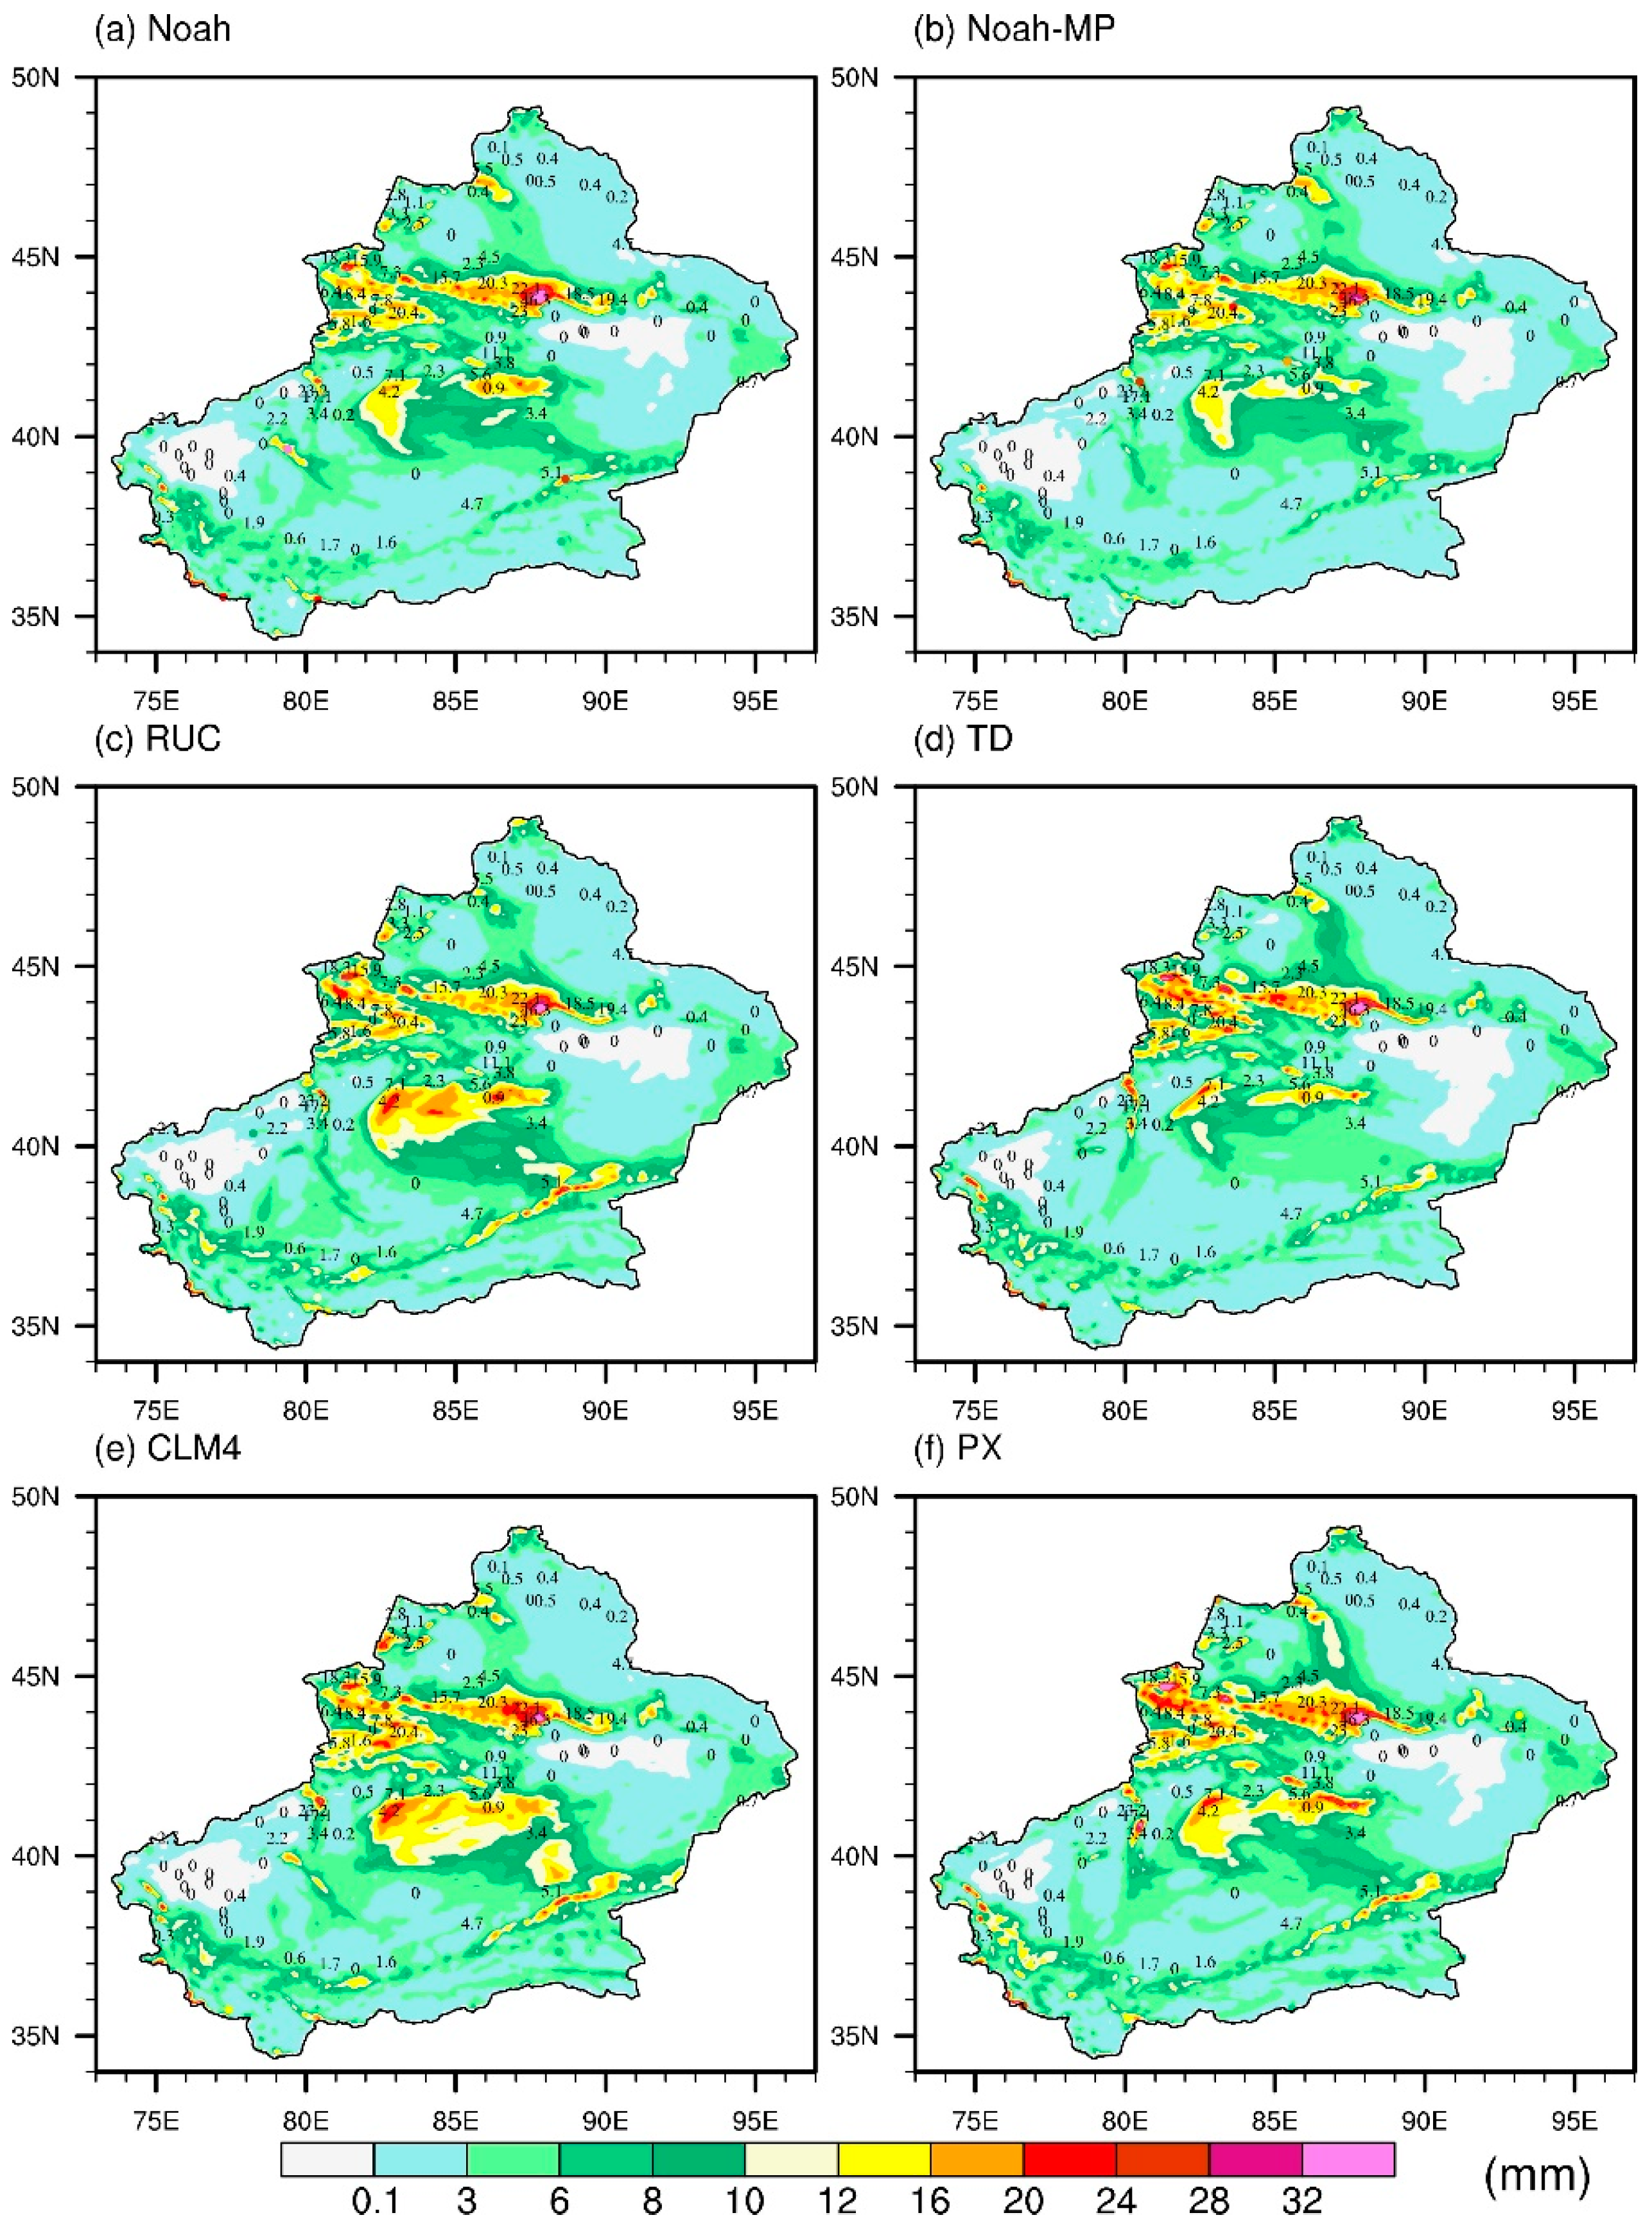
Figure 8.
Scatter plots of the observed values at 45 meteorological observation stations with accumulated snowfall amount greater than 3 mm (black solid circle, unit: mm) and the simulated values at the grid points nearest to these stations under the combinations of the Lin scheme with the (a) Noah scheme, (b) Noah-MP scheme, (c) RUC scheme, (d) TD scheme, (e) CLM4 scheme, and (f) PX scheme. The black dotted line is the line y = x. The red solid line is a linear fit to the black solid circles. r is the correlation coefficient between the observed and simulated values.
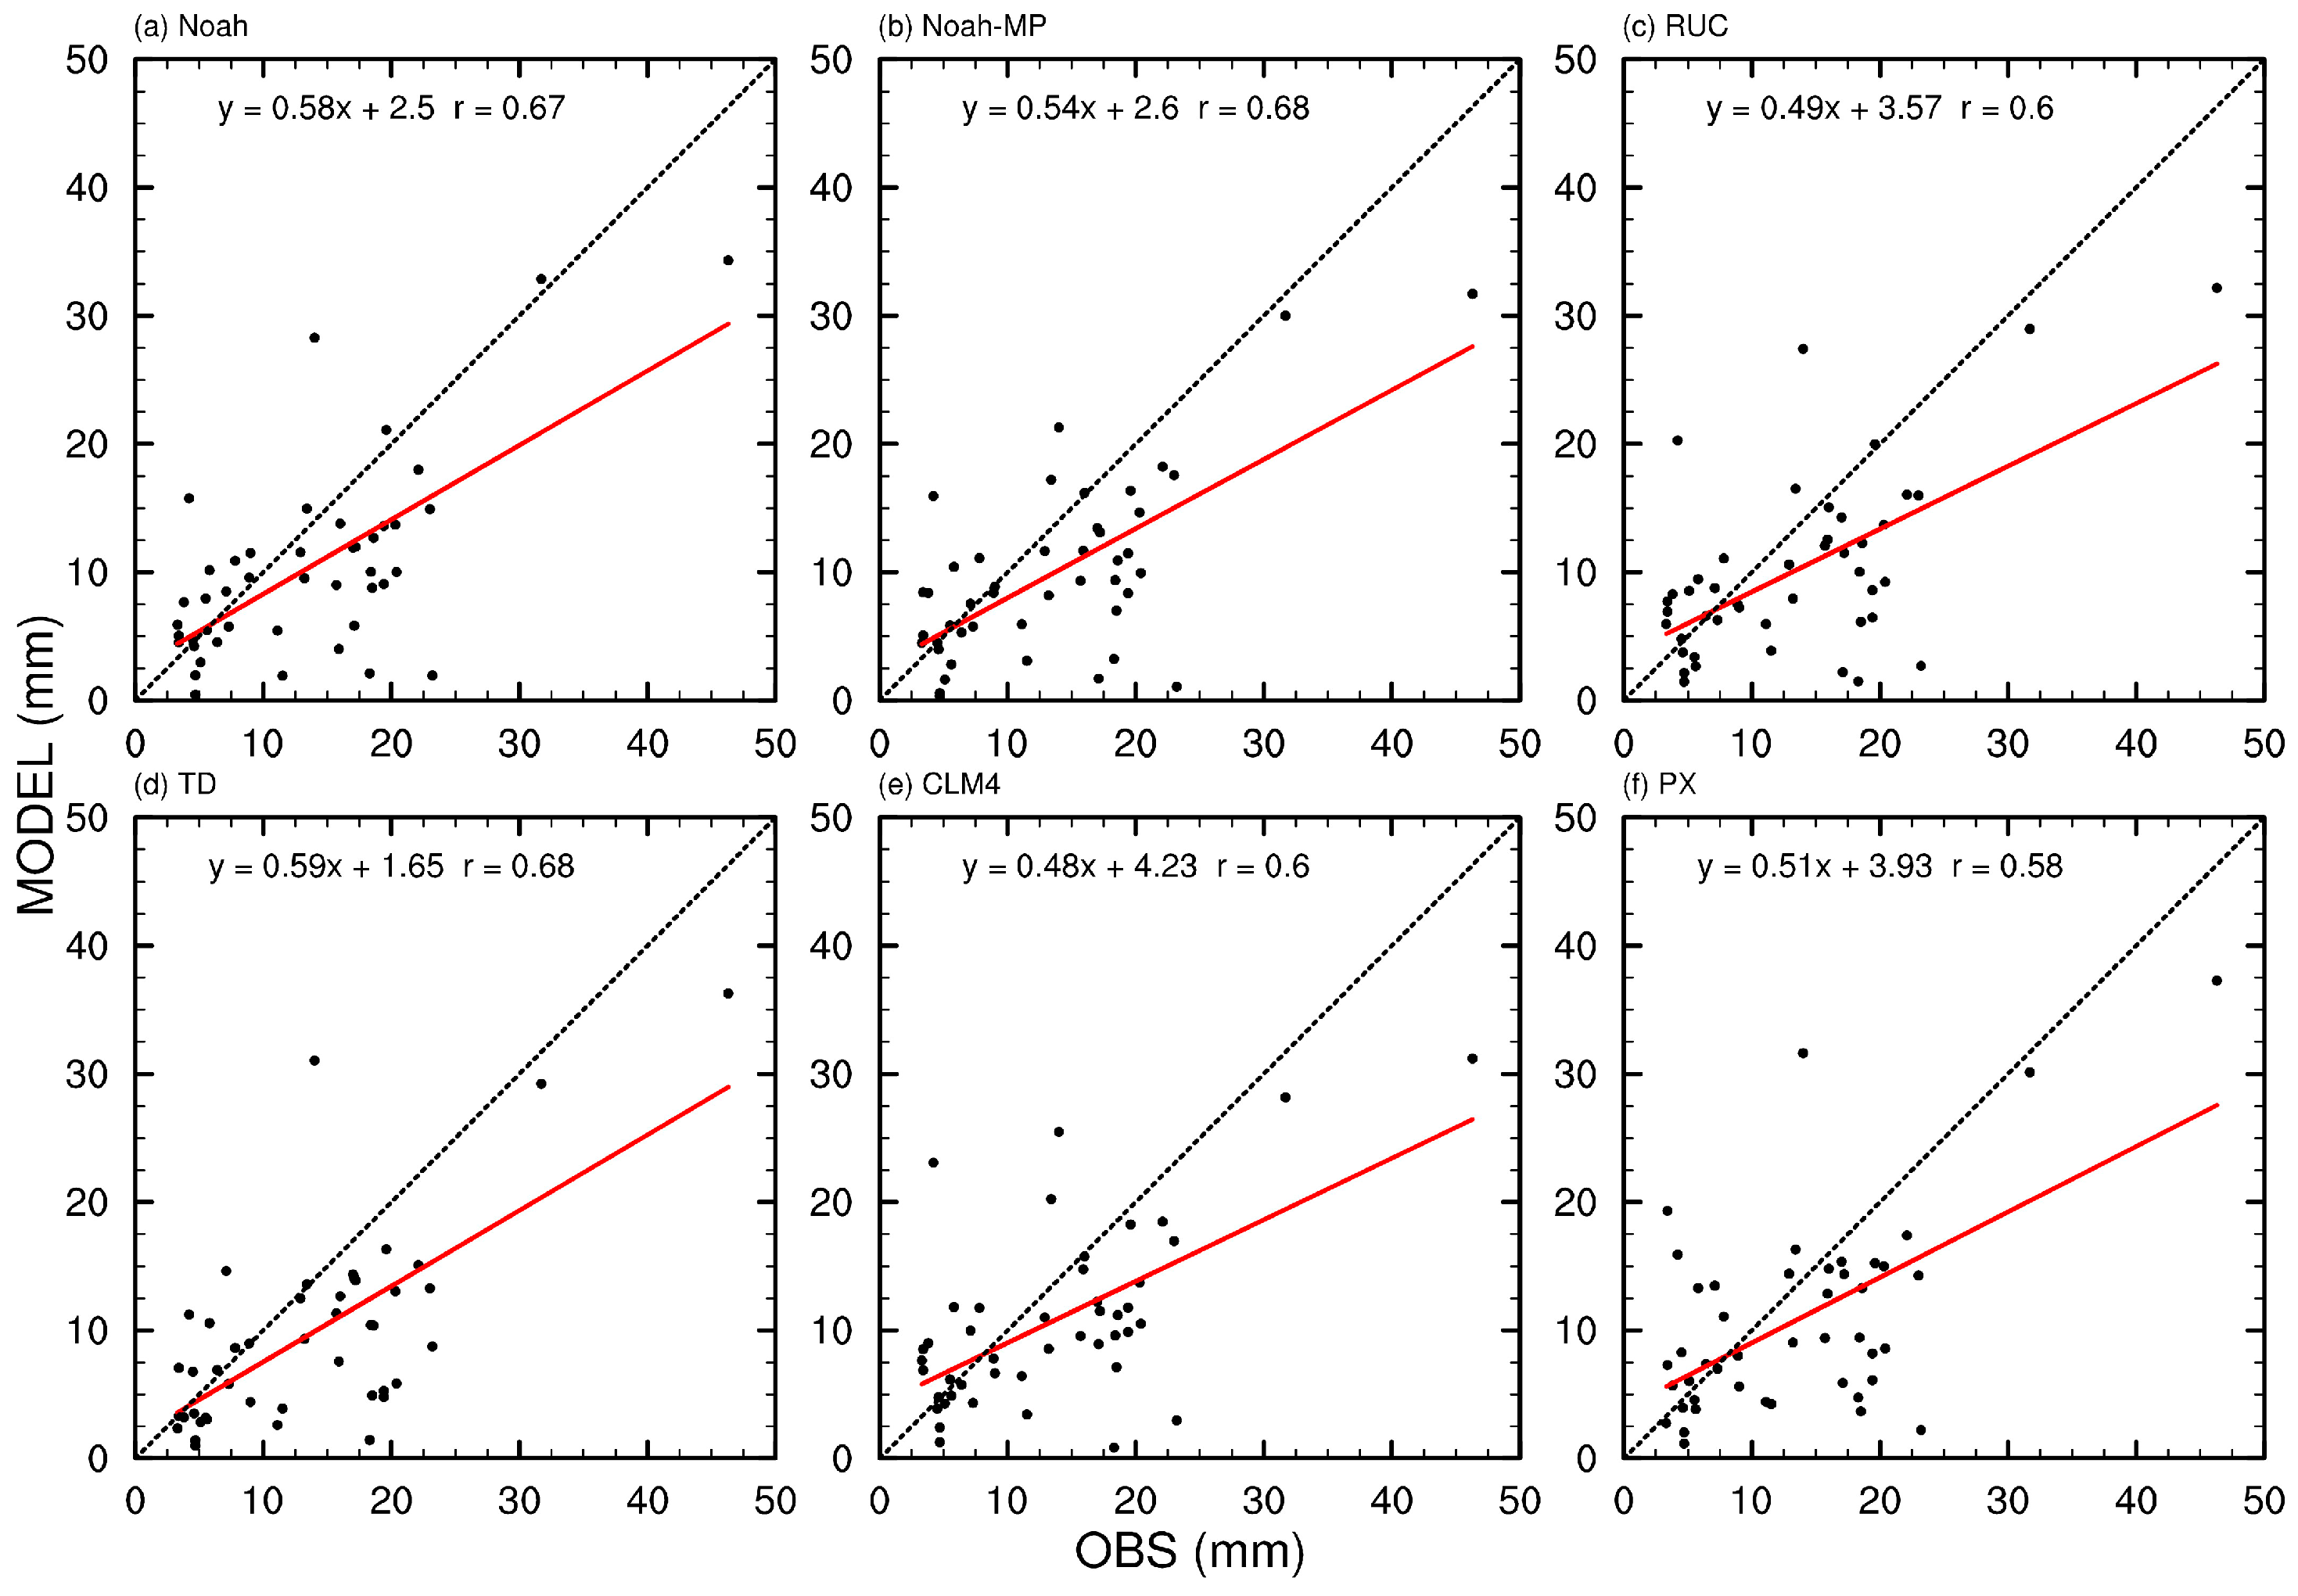
Figure 9.
(a) RMSE and (b) MAE between the observed and simulated values of the accumulated snowfall in Xinjiang from 1200 UTC on 9 December to 0000 UTC on 13 December 2015. Red denotes the results using the Thompson scheme, blue denotes the WSM6 scheme, and green denotes the Lin scheme for an accumulated snowfall amount above 3 mm at 45 stations. The abscissa is the six land surface parameterization schemes. Purple denotes the results for the accumulated snowfall amount at 105 stations using the Thompson scheme.
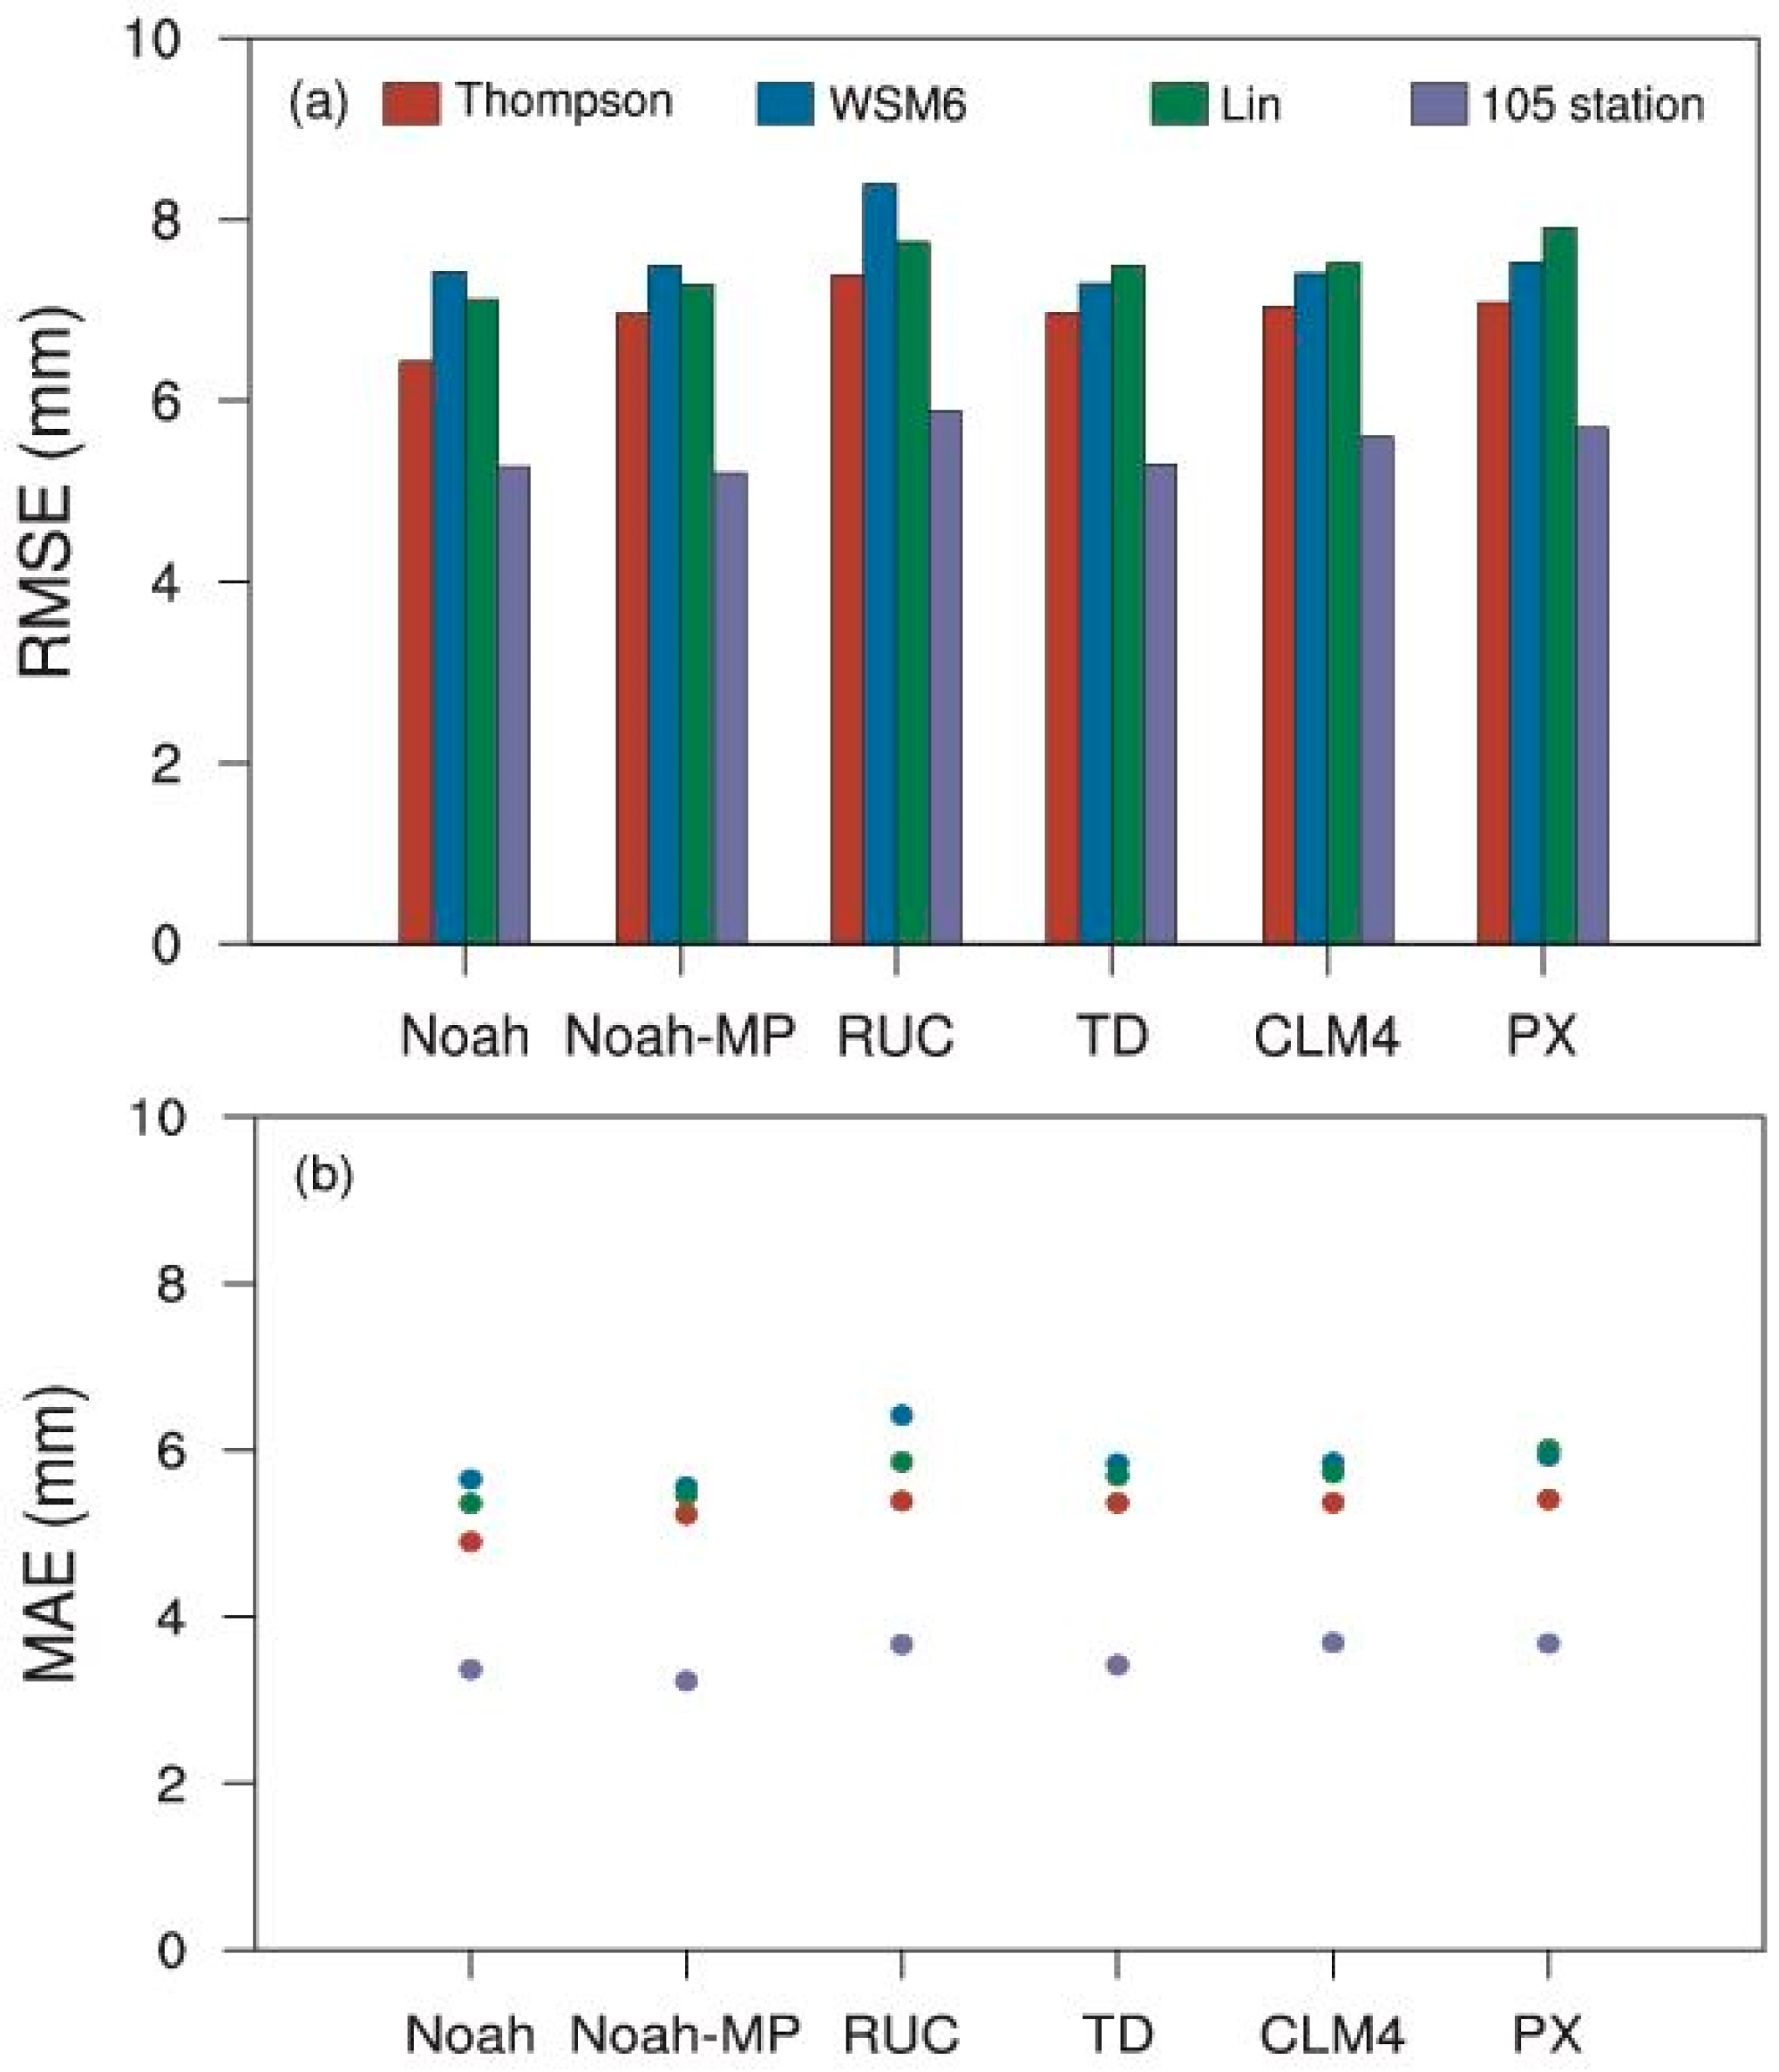
Figure 10.
Temporal variation in hourly snowfall intensity in Urumqi (unit: mm h−1) using the (a) WSM6 scheme, (b) Thompson scheme and (c) Lin scheme. The lines are the observed and simulated values using different land surface parameterization schemes.
Figure 10.
Temporal variation in hourly snowfall intensity in Urumqi (unit: mm h−1) using the (a) WSM6 scheme, (b) Thompson scheme and (c) Lin scheme. The lines are the observed and simulated values using different land surface parameterization schemes.

Table 1.
Different combinations of land surface parameterization schemes and microphysical parameterization schemes used for 18 groups of experiments.
Table 1.
Different combinations of land surface parameterization schemes and microphysical parameterization schemes used for 18 groups of experiments.
| Noah | Noah-MP | RUC | CLM4 | PX | TD | |
|---|---|---|---|---|---|---|
| Thompson | EXP1 | EXP2 | EXP3 | EXP4 | EXP5 | EXP6 |
| WSM6 | EXP7 | EXP8 | EXP9 | EXP10 | EXP11 | EXP12 |
| Lin | EXP13 | EXP14 | EXP15 | EXP16 | EXP17 | EXP18 |
Disclaimer/Publisher’s Note: The statements, opinions and data contained in all publications are solely those of the individual author(s) and contributor(s) and not of MDPI and/or the editor(s). MDPI and/or the editor(s) disclaim responsibility for any injury to people or property resulting from any ideas, methods, instructions or products referred to in the content. |
© 2023 by the authors. Licensee MDPI, Basel, Switzerland. This article is an open access article distributed under the terms and conditions of the Creative Commons Attribution (CC BY) license (https://creativecommons.org/licenses/by/4.0/).
Share and Cite
MDPI and ACS Style
Ai, G.; Wang, S.; Zhi, H. Simulations of a Heavy Snowfall Event in Xinjiang via the WRF Model Coupled with Different Land Surface Parameterization Schemes. Atmosphere 2023, 14, 1376. https://doi.org/10.3390/atmos14091376
AMA Style
Ai G, Wang S, Zhi H. Simulations of a Heavy Snowfall Event in Xinjiang via the WRF Model Coupled with Different Land Surface Parameterization Schemes. Atmosphere. 2023; 14(9):1376. https://doi.org/10.3390/atmos14091376
Chicago/Turabian StyleAi, Guannan, Shuzhou Wang, and Hai Zhi. 2023. "Simulations of a Heavy Snowfall Event in Xinjiang via the WRF Model Coupled with Different Land Surface Parameterization Schemes" Atmosphere 14, no. 9: 1376. https://doi.org/10.3390/atmos14091376
Note that from the first issue of 2016, this journal uses article numbers instead of page numbers. See further details here.