

Numerical Simulation Calculation of Thermal Discharge Water Diffusion in Coastal Nuclear Power Plants


Institute of Coastal Research, Ludong University of China, Yantai 264025, China
*
Author to whom correspondence should be addressed.
Atmosphere 2023, 14(9), 1371; https://doi.org/10.3390/atmos14091371
Submission received: 5 June 2023
/
Revised: 26 July 2023
/
Accepted: 28 August 2023
/
Published: 30 August 2023
(This article belongs to the Section Atmospheric Techniques, Instruments, and Modeling)
Abstract
:Coastal areas have become the primary location for nuclear power plant sites due to the convenience of seawater cooling. In China, the diffusion range of thermal discharge water has always been a hot research topic as the basis for sea use areas. The main physical process of heat loss in the numerical simulation of thermal discharge from power plants is heat exchange between the water surface and air. Currently, the methods for calculating this heat loss include the heat flux method and the water surface heat exchange coefficient method. Taking a power plant in Zhejiang as the research object, the MIKE 3 temperature–salinity module (heat flux method) and MIKE ECO Model (water surface heat exchange coefficient method) were used for modeling, and the diffusion of thermal discharge water under different modules was compared and analyzed. The results show that the calculated area of the water temperature rise envelope between the two modules differed significantly under the same conditions. The surface 4 °C temperature rise area, as calculated using ECO Model, was 45.8% smaller than that of the temperature–salinity module. The MIKE 3 temperature–salinity module can simulate the heat accumulation of water under thermal buoyancy, producing a significant thermal stratification phenomenon; the ECO module does not accurately represent the heat exchange process between the water surface and the air, and it does not adequately capture the significant vertical stratification that occurs in real-world scenarios. On this basis, this study not only lays a foundation for further exploring the impact of thermal discharge water from this powerhouse on the structure of surrounding marine biological communities and dissolved oxygen content in water bodies but also provides scientific evidence for the selection of modules when simulating thermal discharge water with the MIKE model.
1. Introduction
With the increase in energy demand in coastal cities, the number and scale of coastal power plants are increasing, and their impact on marine ecosystems needs to be studied in depth [1,2,3]. The temperature rise caused by thermal discharge can lead to water hypoxia, increase the toxicity of toxic substances in water, increase the ability of organisms to accumulate harmful substances, reduce the survival and reproductive ability of fish and other aquatic organisms, and also bring about a series of water environmental pollution problems such as water eutrophication and water quality deterioration, greatly reducing the self-purification ability of water bodies [4,5,6,7,8].
In today’s rapidly developing computer technology sector, predicting thermal discharge water through numerical simulation has become indispensable in the environmental impact assessment of power plant construction projects. These models have different complexities and modeling methods [9,10,11,12,13]. For example, numerical models show that the diffusion of thermal discharge from power plants is affected by the terrain, and the thermal impact range of coastal power plants is determined by the geographical environment [14]. A three-dimensional thermal discharge model was established for different research areas. The study showed that seasonal discharge volume mainly affects river-type thermal discharge water diffusion [15], while open-sea areas are more affected by wind, tides, and waves [16,17,18].
At present, three-dimensional numerical simulation of lakes, coasts, and shallow reservoirs is booming in thermal effluent research [19,20,21]. Three-dimensional numerical models have been established through calibration and verification using Delft3D-FLOW, GEMSS, and MIKE to simulate and evaluate the diffusion of thermal plumes caused by power plants into the sea [9,22]. Three-dimensional hydrodynamic and temperature numerical simulation has been applied to evaluate the impact of cooling water on several lakes in the Southeastern United States. MIKE 3 software containing a three-dimensional fluid dynamics module has been used to evaluate the impact of cooling water thermal plumes in New York Harbor [23].
The MIKE temperature–salinity module has been widely applied to simulate the spatial distribution of ocean temperature and salinity [24,25,26]. Saeed et al. used the MIKE 3 FM temperature and salinity module to simulate the latitudinal increase in temperature distribution across different layers of the Iranian Sea, showing a decreasing trend from south to north and a gradual reduction in the thickness of the thermocline as one moved northward [27]. Reghu et al. established a three-dimensional temperature and salinity model using MIKE in the vicinity of Kochi Bay. They concluded that no significant vertical variation in temperature and salinity was found in the study area under the influence of the northeast monsoon [28]. Some researchers have combined the MIKE ECO module with experiments conducted in a heat discharge tank under artificial meteorological conditions to study the characteristics of thermal plume diffusion. They have found that the comprehensive heat transfer coefficient method fails to reflect the real physical heat transfer process [29].
Although many researchers use numerical models to analyze thermal pollution problems caused by power plant discharge, a few scholars have studied the calculation effect of the MIKE temperature–salinity module and MIKE ECO module on thermal discharge water combined with actual engineering cases. There are usually two methods for calculating surface heat exchange. One method is the heat flux method [30,31]. This method calculates heat fluxes for four processes: convection, evaporation, long-wave radiation from the Earth, and short-wave radiation from the Sun, considering real-time meteorological conditions. Another method is the water surface heat transfer coefficient method [32,33,34]. The water surface heat transfer coefficient Ks characterizes the combined effects of evaporation, convection, long-wave radiation from the Earth, and solar short-wave radiation from the Sun. The MIKE temperature–salinity module and ECO module, respectively, adopt the heat flux method and the water surface heat transfer coefficient method.
Therefore, this study takes the Zhejiang Jin-Qi-Men Power Plant as the engineering object and utilizes the ECO module and temperature–salinity module in the MIKE model to simulate the thermal plume dispersion of the power plant. The differences in calculation results between the two modules were analyzed. This study helped us to gain a deeper understanding of different modules’ working principles and mathematical foundations. Through continuous comparison and evaluation, we can promote the development of the model, making it more efficient, accurate, and reliable. The findings of this study provide a basis for selecting the MIKE thermal discharge model and serve as a reference for studying the thermal plume dispersion and ecological and environmental impacts of the Jin-Qi-Men coastal nuclear power plant.
2. Materials and Methods
2.1. Overview of the Study Area
The Jin-Qi-Men Nuclear Power Project is on a small peninsula at the southernmost end of Hepu, Nantian Island, Xiangshan County, Ningbo, Zhejiang Province, China. Located on the southern edge of Nantian Island, on the northern coast of Maotouyang, it is separated from the Taizhou Sanmen Nuclear Power Project, which is undergoing construction, in Sanmen Bay. The two are more than 200 km apart by land and less than 50 nautical miles by sea (Figure 1). Jin-Qi-Men Nuclear Power Plant is China’s first self-designed and constructed nuclear power station. When all six units are in operation, the total installed capacity reaches 6500 MW, making it China’s largest nuclear power base regarding the number of units, variety of reactor types, and installed capacity. Phase I of the power plant consists of two units, with a designed discharge capacity of 150 m3/s and a designed temperature rise of 8.2 °C.
The power plant is located in close proximity to a diverse water ecosystem, which plays a crucial role in maintaining the overall environmental balance of the region. The surrounding aquatic environment exhibits rich biodiversity, with various species of plants, animals, and microorganisms thriving in the waters.
The water depth in the engineering sea area near the power plant is relatively significant. A three-dimensional model was adopted considering the vertical change in the water level in the engineering sea area. The calculation range includes the sea area, where the Jin-Qi-Men Nuclear Power Plant is the core water area, and the southern boundary is near Shitang, Wenling. The eastern boundary is set at the −70 m isobath in the outer sea, and the northern boundary is set at Dagang Mountain in Beilun, Ningbo (Figure 1a).
2.2. Model Introduction
MIKE 3 FM and MIKE ECO are sub-modules of the MIKE software package developed by the Danish Hydraulic Institute. The software has been widely used in various fields, including hydrodynamic modeling [35,36,37,38], ecological environmental impact assessment [39,40], and oil spill dispersion [41], among other fields.
The MIKE 3 FM temperature–salinity module considers boundary conditions, water flow dynamics, heat flux, and density changes induced by external forcings. By inputting geographical information, meteorological data, and other relevant parameters, accurate predictions of temperature distribution can be made. The MIKE ECO module can simulate temperature distribution and variations in water bodies, primarily considering the influences of factors such as temperature input, thermal diffusion, external heat sources, and biological activities on the temperature distribution in the marine environment.
This study utilized the temperature–salinity module and the ECO module to investigate the dispersion of the thermal plume from the power plant. Both models are based on the hydrodynamic module, and therefore, they share the same fluid dynamics equations, temperature transport equations, and boundary control equations.
2.2.1. Control Equation
Assuming the fluid statics approximation and the Boussinesq approximation, the momentum equation, continuity equation, heat transport equation, salt transport equation, and equation of state can be described in a Cartesian coordinate system.
- (1)
- MIKE fluid dynamics equation (Equations (1)–(3)) [42]:
- (2)
- MIKE temperature transport equation (Equations (4) and (5)):
- (3)
- Boundary control conditions
Land boundary (Equation (6)):
Flow velocity
Open boundary (Equations (7)–(9)):
Water level
Flow velocity
The open boundary is outside the thermal plume diffusion range, and the temperature rise of the inflow can be considered zero.
2.2.2. The Difference between the Temperature–Salinity Module and the ECO Module
This article uses two modules to study the diffusion of thermal discharge water. The MIKE 3 temperature–salinity module and the MIKE ECO module can predict the impact of thermal discharge water on the marine environment. However, these two modules differ in the treatment of forcing conditions and the sea surface heat exchange calculation method in the thermal plume dispersion calculation process.
The temperature–salinity module refines the heat exchange terms in the numerical simulation of thermal plume dispersion. It divides them into four surface heat exchange processes: latent heat, sensible heat, long-wave radiation from the Earth, and short-wave radiation from the Sun. It also considers the heat transfer phenomenon caused by temperature differences and the thermal convection phenomenon caused by thermal buoyancy during the calculation process. The MIKE ECO module uses a traditional comprehensive heat dissipation coefficient to reflect the intensity of the sea surface heat dissipation effect. However, it lacks consideration of the thermal convection phenomenon caused by thermal buoyancy during the process of calculating thermal discharge water.
The temperature–salinity module establishes an additional transport equation for temperature. In addition, it introduces the generalized eddy viscosity coefficient Richardson number calculation of buoyancy forcing caused by the density gradient through the Munk-Anderson formula and feeds back the calculated temperature into the fluid dynamics equation. The Munk–Anderson formula is as follows (Equations (10) and (11)) [43]:
where represents the vertical eddy viscosity coefficient; is the undamped eddy viscosity; is the Richardson number; , are empirical constants, ; represents the gravitational acceleration; is the seawater density; is the hot water density; and and are the velocity components in the x and y directions, respectively.
3. Model Setup and Verification
3.1. Grid and Water Depth Settings
The calculation domain uses non-uniform triangular grid division, with the maximum grid size in the outer sea area being about 3.6 km. The grid gradually becomes denser, with grid density increasing moving from the outer sea towards the engineering sea area, especially near the drainage outlet. The grid size should ensure the calculation requirements of temperature diffusion migration and the actual area of high-temperature rise. Generally, it should not be greater than 1/3 of the diameter of the drainage outlet. The diameter of the drainage outlet is 10 m, so the minimum grid size in this study is about 3 m. The entire model is evenly divided into six layers along the water depth direction, with the drainage outlet located on the second layer from the bottom. The entire calculation sea area consists of 30,515 grid unit points. See Figure 2 for the grid setup.
The water depth data in the model consist of two parts. The water depth data in the vicinity of the power plant were obtained from the depth data provided by the Navigation Assurance Department of the People’s Liberation Army Navy Headquarters. The ETOPO (U.S. National Geophysical Data Center) Global Relief Model topographic data were used for the large-scale sea area and uniformly processed to mean sea level before interpolation. The water depth distribution after interpolating the sea bed topography in the study area is shown in Figure 3. The topographic data used in the mathematical model accurately reflect the water depth distribution on the seabed.
3.2. Model-Driven Conditions
The initial water level had little effect on the simulation results. The model can stabilize after running for some time. Therefore, the model adopts a cold start mode. That is, the initial flow velocity and water level of the whole field are zero.
The model in this study is driven by water level data at the open boundary, which were predicted using the global tidal model (TPXO9). The model calculates astronomical tides using ten constituents, M2, S2, K1, O1, N2, P1, K2, and Q1, as well as the long-period constituents Mf and Mn. These tidal constituents can generally reflect the realistic astronomical tidal processes in the open-boundary sea areas (Equation (12)).
where represents the water level at the boundary, represents the static water level at the boundary, i ranges from 1 to 10, corresponding to the ten mentioned tidal constituents, represents the amplitude and represents the phase lag of the tidal constituent at the boundary, and represents the angular frequency of the tidal constituent.
3.3. Model Parameter Configuration
This simulation used the relative temperature field prediction mode for numerical simulation, keeping the same parameter input for the MIKE 3 temperature–salinity module and the MIKE ECO module and studying the reliability of the application of the two modes in thermal discharge water simulation. The wind speed, air temperature, and sea surface temperature are the average values observed during multiple summer seasons. The values of the main parameters of the model can be found in Table 1.
The main model parameters affecting heat diffusion are the water vapor heat exchange and diffusion coefficients. The water vapor heat exchange coefficient measures the heat dissipation per unit of water surface area, per unit of time, and per unit of temperature difference. In the numerical simulation of thermal discharge water, the MIKE 3 temperature–salinity module calculates the water vapor heat exchange amount using the heat flux method. The flux data involved were based on the long-term summer averages extracted from the European Centre for Medium-Range Weather Forecasts (ECMWF) as the driving conditions for the model in the engineering marine area (specific values are shown in Table 1). The MIKE ECO module calculates the surface heat dissipation amount through the traditional water surface heat exchange coefficient method. The summer surface comprehensive heat dissipation coefficient of the engineering sea area was calculated as 45 W/m2 °C according to Equations (13)–(16) using actual hydrological and meteorological data observed near the power plant.
The calculation formula for the surface comprehensive heat dissipation coefficient is as follows:
where is the surface comprehensive heat dissipation coefficient; represents the sea temperature at the surface (°C); represents the air temperature above the water surface at 1.5 m (°C); is the saturated water vapor pressure at the sea surface; is the corresponding sea surface saturated water vapor pressure when the water temperature is (hPa); is the corresponding sea surface saturated water vapor pressure when the water temperature is (hPa); is a constant, taken as 0.627 (hPa/°C); is the surface radiation coefficient, taken as 0.97; is the Stefan–Boltzmann constant, taken as 5.67 × 10⁻⁸ (W·m−2·°C−4); is the surface evaporation coefficient (W·m−2·hPa−1); and is the wind speed at 1.5 above the water surface (m/s).
The diffusion coefficient in heat diffusion calculation significantly impacts the temperature rise result. In actual water bodies, the determination of this coefficient is relatively complex. This study used the k–ε model with a good thermal discharge water simulation effect for heat diffusion. One of the advantages of the k–ε model is that it calculates the transmission and dissipation of kinetic energy [44].
3.4. Model Validation
For the sake of model accuracy, in the summer of 2020, four tidal gauge stations (T1, T2, T3, and T4) and three tidal current observation stations (S1, S2, and S3), as well as one temperature observation station, were set up near the nuclear power plant discharge outlets and around Nantian Island. The observational data from these stations were used for model verification. Figure 1b shows the locations of the measurement points.
To judge the quality of the hydrodynamic model simulation results, this paper used the statistical method proposed by Willmott and the Pearson correlation coefficient method to evaluate the results. The Willmott calculation formula is as follows (Equation (17)) [45]:
where is the calculated value of the model; is the measured value; and is the average measured value. The skill value represents the correlation between the deviation of the model simulation value from the measured average and the deviation of the measured value from the measured average. Its value is between 0 and 1. When the skill value is 1, there is no difference between the model simulation values and the measured values. When the skill value exceeds 0.65, the simulation result is evaluated as excellent. The result is very good when the skill value is between 0.65 and 0.5. The result is good when the skill value is between 0.5 and 0.2. When the skill value is less than 0.2, the result is poor, and when the skill value is equal to 0, the calculated value and the measured value are completely inconsistent.
The water level verification used the continuous half-month measured water level data of 4 water level stations from 27 June to 17 July 2020. As can be seen from Figure 4, whether it is the water level variation or the high and low water level values, the calculated values and the measured values are in good agreement, and the time when the high and low water levels appear is also in good agreement. The Pearson correlation coefficient method was used to analyze the correlation between the predicted water level and the measured value, which was above 90%, and the correlation strength was determined to be extremely strong; the skill value was above 0.5, and the model evaluation was very good, indicating that the model calculation results are relatively accurate and reflect the actual tidal wave movement in the research area. They can be used as a hydrodynamic basis for temperature drainage calculations.
The model tidal current verification results are shown in Figure 5. From the perspective of the flow velocity verification results, whether it is the flow velocity variation or the characteristic values of the tidal current during rising and falling tide, the calculation and measurement basically coincide. The Pearson correlation coefficient was above 0.8, and the correlation strength was determined to be relatively strong; the skill value was above 0.8, indicating an excellent model evaluation. The model evaluation is shown in Table 2. Therefore, the calculation accuracy of the tidal current simulation verification is good and reflects the actual changes in tidal currents in the engineering area.
Figure 6 shows the temperature sequence verification for Model 1 and Model 2. The verification results indicate that the calculated results of Model 1 closely match the measured temperatures, with a correlation coefficient exceeding 0.7. However, the matching performance of the calculated results from Model 2 is poorer when compared to Model 1. This is mainly because in the calculation process of Model 2, only the areas affected by heated plumes were considered for heat exchange with the atmosphere, according to the comprehensive heat transfer coefficient method. This resulted in a lack of solar short-wave radiation heating in the calculated regions.
4. Results and Analysis
4.1. Hydrodynamic Characteristics
Figure 7 shows the flow field distribution during the flood and ebb tides during the summer half-month tidal period in the engineering sea area. In the stage of rapid growth, the tidal current in the sea area to the northeast of the plant site is generally a southwestward coastal flow, which merges with part of the northwestward flow in the sea area to the southwest of the plant site and then flows northwestward into Sanmen Bay as a whole. The tidal flow rate in the eastern local sea near the Jin-Qi-Men Channel slightly decreases. After entering Sanmen Bay, it is affected by the constraints of the contracting terrain and has a large flow speed. During ebb tide, when the tidal current flows out of Sanmen Bay, its speed increases. Jin-Qi-Men Channel has a partial increase in flow speed effect on its eastern local sea area. The flow speed decreases to the north and is generally a northeastward coastal flow. The overall flow speed on the west side of the sea area around the plant site is greater than that on the east side, and the flood tide flow speed in Sanmen Bay is greater than that during ebb tide.
4.2. Cross-Sectional Temperature Rise Distribution
We consider now a perpendicular cross-section of the tide direction (Figure 8). The thermal plume’s vertical distribution features near the outlet section are shown in Figure 9. In Model 1, the high-temperature water mass diffuses to the surface due to buoyancy, and the vertical area increases from the bottom to the surface. The high-temperature water mass gathers on the surface, and the maximum diffusion distance across the section in the high-temperature rising zone (1 to 4 °C) is 1739 m. In Model 2, after the thermal plume is discharged, it mixes uniformly in the vertical direction. The area between each layer does not change. The maximum diffusion distance of 1 °C across the cross-section is 1150 m. Due to the uniform distribution of heat in Model 2, the maximum diffusion distance along the cross-section is 30% smaller than that in Model 1.
Table 3 presents the statistics of the vertical temperature rise area at cross-sections. The analysis reveals that, across all temperature rise levels, Model 2 exhibits higher vertical temperature rise areas than Model 1, indicating that Model 2 has larger values in terms of vertical temperature rise area. The difference, represented by Model 2–Model 1, represents the disparity in vertical temperature rise areas between the two models. The maximum difference in temperature rise areas between Model 1 and Model 2 occurs at 2 °C, with a maximum difference of 0.011037.
The analysis identifies the reasons behind this disparity. During the computation process of Model 1, high-temperature water masses are concentrated near the water surface due to the effect of thermal buoyancy. The presence of a substantial amount of warm water intensifies the heat exchange between the thermal plume and the surrounding water. Additionally, water dynamics are stronger at the surface than the deeper layers, providing favorable conditions for the diffusion of the thermal plume. On the other hand, in Model 2, the high-temperature water masses are uniformly distributed in the vertical direction, resulting in less favorable conditions for the diffusion of the thermal plume. Consequently, the vertical temperature rise areas in Model 1 are lower than those in Model 2.
4.3. Planar Temperature Rise Distribution
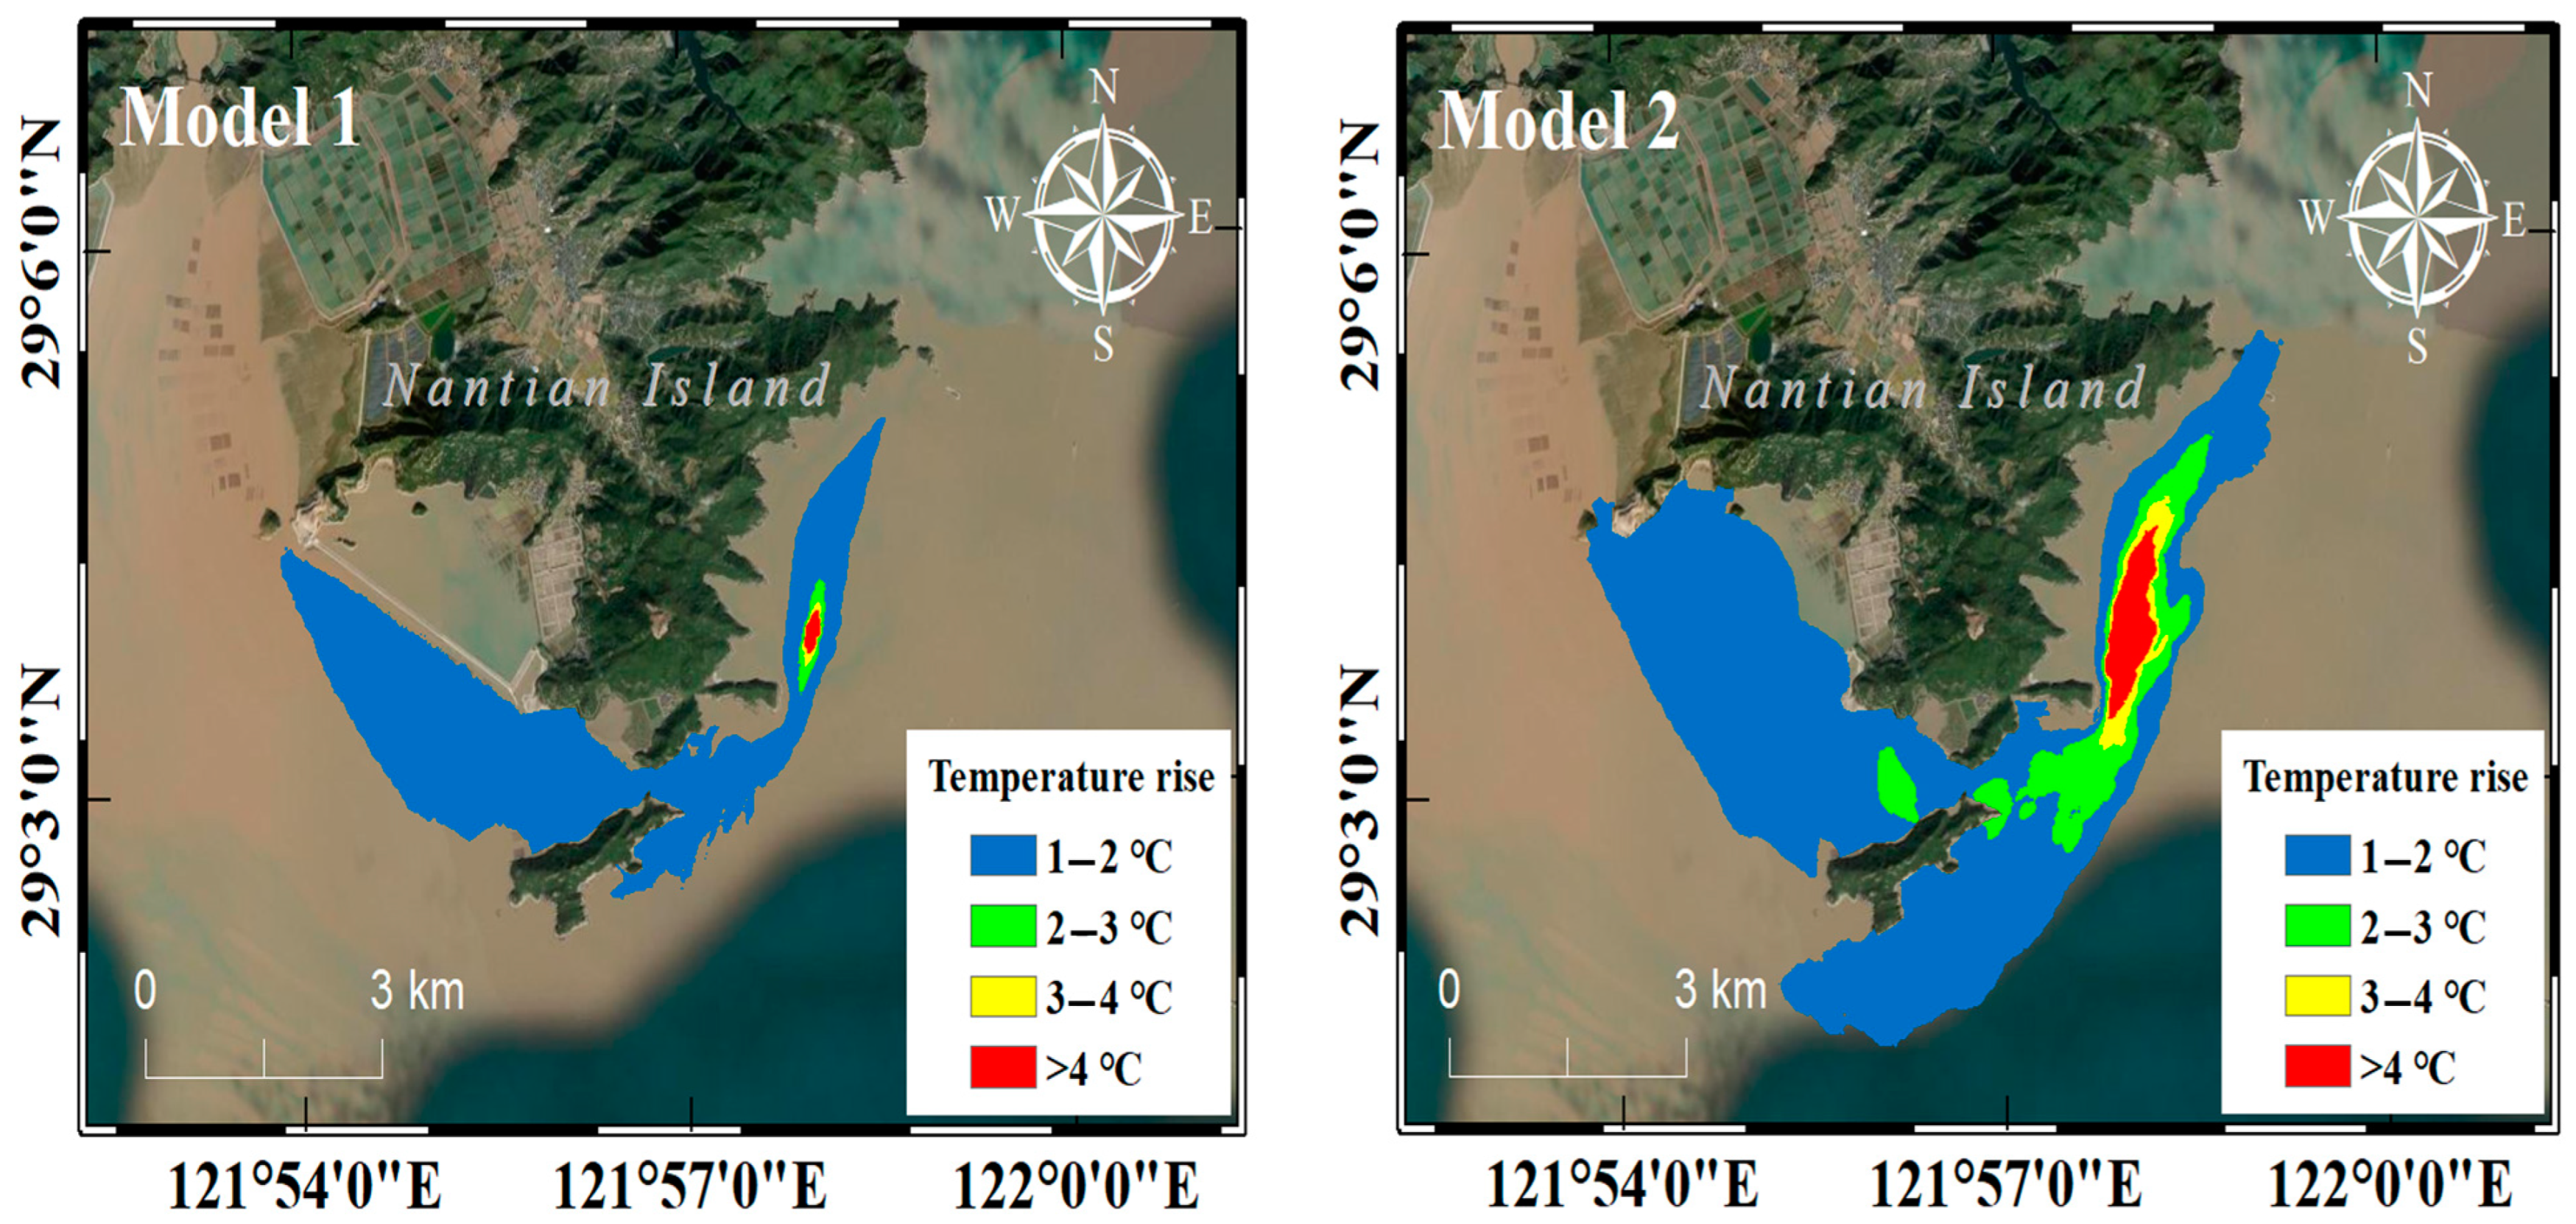
Figure 10, Figure 11 and Figure 12 show the summer half-month tide surface, middle, and bottom layer temperature rise distribution of Model 1 and Model 2. The calculation results of Model 1 show a more obvious thermal stratification phenomenon in the surface and bottom layers of the high-temperature rise area (1 to 4 °C) water. After the thermal plume is discharged at the bottom layer, it is affected by thermal buoyancy, and the high-temperature water mass is concentrated on the surface, making the surface temperature rise range significantly larger than other layers. The surface 4 °C temperature rise area is 1.31 km2, which is significantly larger than the bottom 4 °C temperature rise area of 0.05 km2, and the surface-to-bottom 1 °C, 2 °C, 3 °C, and 4 °C temperature rise areas are significantly reduced. Model 2 only considers the heat transfer process during the calculation process. The thermal plume is uniformly mixed in the vertical direction, and the heat is uniformly distributed in the vertical direction so that the high-temperature water mass is diluted; the surface 4 °C temperature rise area is 0.71 km2, and the bottom 4 °C temperature rise area is 0.68 km2. The similarity of temperature rise areas between each layer can reach 99%, and the surface 4 °C temperature rise area is reduced by 45.8% compared to that of Model 1. The summer half-month tide temperature rise envelope area is shown in Table 4.
Comparing the results of the two models, Model 1 considers the heat exchange in all areas regardless of whether it is affected by hot water. The calculation process considers the impact of thermal buoyancy and produces thermal stratification. Model 2 only considers the heat loss calculation in areas affected by hot water, and the remaining areas remain in their initial state. This is inconsistent with the real physical process. Due to the lack of consideration of thermal buoyancy, the calculated surface high-temperature rise area is small.
5. Discussion
This study took the Zhejiang Jin-Qi-Men Power Plant as the research object. It compared the differences between the MIKE temperature–salinity and ECO modules under the same model driving conditions. The results show that under the condition of maintaining the same water surface heat exchange amount, the temperature–salinity module is affected by thermal buoyancy. The high-temperature water mass gathers on the surface, making the temperature rise envelope area larger than that of the ECO module. This contrasts with the conclusion of Wang S. et al. regarding the temperature envelope area simulated under artificial meteorological conditions [15]. The main reason for this is that Wang S. et al. used artificial meteorological conditions and did not maintain the same water surface heat exchange amount. Therefore, numerical simulation of thermal discharge water should be combined with actual power plant data for research purposes.
In addition, the wastewater pool has an uneven vertical temperature distribution, according to Parshakova et al. [46]. Thermal discharge affects the local water body by changing the density gradient, leading to secondary dynamic action and the formation of a vertical stratified flow [35,47]. Ming Yang et al. introduced the turbulent diffusion coefficient to calculate the vertical stratification of sand content. The simulation results reflect the basic physical phenomenon of density-stratified flow [48]. Therefore, the temperature–salinity module introduced the k-ε turbulence model to calculate the thermal discharge water in this study. The results show obvious thermal stratification phenomena, and the vertical distribution was similar to that found by LOWE et al. based on MIKE 3 temperature–salinity module simulation of thermal discharge water [23]. Based on this, the feasibility of using the ECO module for predicting thermal discharge was investigated. The results indicate that the ECO module has limitations in adequately considering the density gradients caused by thermal buoyancy during the numerical simulation of thermal discharge. This limits the accurate modeling and predictive capabilities of the temperature transport process, resulting in vertically homogeneous mixing of the thermal discharge and a lack of clear vertical stratification, contradicting previous findings. Additionally, the ECO module’s heat exchange term was calculated using a comprehensive heat transfer coefficient method, only involving the areas affected by the heated water, which does not align with the actual physical processes. Therefore, the temperature-salinity module integrated with a turbulence model is more suitable for simulating the dispersion of thermal plumes from power plants.
Our numerical simulation results demonstrate that the thermal plume from nuclear power plants significantly diffuses after being discharged into the receiving water body, leading to evident thermal stratification. Similar observations and validations of this phenomenon have been made in previous studies concerning other thermal power plants with heated cooling water discharges, such as coal power plants and natural gas power plants [46]. This suggests that the occurrence of analogous thermal diffusion phenomena may be widespread among thermal power plants.
It is worth noting that in a previous study, researchers used the MIKE 3 FM model to simulate the cooling water diffusion from a natural gas power plant and found results consistent with our own study [47]. This further strengthens the reliability and reproducibility of our research findings.
In conclusion, our study reveals the substantial diffusion of thermal plumes from nuclear power plants into receiving water bodies, leading to noticeable thermal stratification. This phenomenon appears to be a common concern for various thermal power plants. The consistency of our findings with previous studies using the MIKE 3 FM model enhances the credibility of our results and provides valuable insights for assessing the environmental impacts of heated cooling water discharges from power plants of different types.
6. Conclusions
In summary, there are obvious differences in the calculation results of the two thermal discharge water modules based on MIKE. During the calculation process of the ECO model, only the area affected by the heated water is considered in the calculation of thermal dissipation. In contrast, the remaining area remains in its initial state. The heat flux module simulates the influence of latent heat, sensible heat, and radiation on the heat of water under real-time meteorological conditions. This demonstrates water’s real-time heat accumulation process under meteorological conditions. Whether or not they are affected by the thermal plume, all areas are included in calculating heat flux.
From the perspective of the temperature rise envelope area, during the calculation process of the heat flux module, the area was larger in the surface layer than in the bottom layer due to the influence of thermal buoyancy. The high-temperature water mass was mainly concentrated on the surface of the drainage outlet. However, there was no obvious change in the temperature rise envelope area of the surface layer, mid-layer, or bottom layer calculated according to the comprehensive heat dissipation coefficient method. The results calculated by the temperature–salinity module are more likely to be accurate when using MIKE to predict thermal discharge water. They can better simulate the distribution of actual cooling water and the process of heat loss. Therefore, the temperature–salinity module, which can capture the interactions between salinity and temperature in seawater, is more suitable for simulating thermal dynamics in the environmental impact assessment of industrial activities.
Thermal discharge water from power plants has similar diffusion paths in winter and summer, being mainly affected by the engineering sea area’s tidal rise and fall characteristics. Thermal discharge water has a greater impact on the sea temperature in the northeast and southwest directions. The high-temperature rise area is significantly larger during neap tide than during the other two tidal periods. This study lays the foundation for further exploring ecological issues such as the impact of thermal discharge water from a nuclear power station on the surrounding biological community’s structure and dissolved oxygen content of the surrounding sea area and also provides a scientific basis for the selection of models using MIKE software to simulate future thermal discharge water levels.
Author Contributions
Conceptualization, X.Z.; Methodology, Q.W.; Software, X.Z.; Validation, J.Z.; Formal analysis, H.S., C.Z. and J.Z.; Writing—original draft, X.Z. and H.S.; Writing—review & editing, C.Z. and G.L. All authors have read and agreed to the published version of the manuscript.
Funding
This research received no external funding.
Data Availability Statement
Data are available from the corresponding author upon reasonable request.
Conflicts of Interest
The authors declare no conflict of interest.
References
- Lin, J.; Yan, Q.; Chen, B.; Du, P. Ecological impact of thermal discharge from coastal power plants on plankton biomass in Xiangshan Bay. J. Shanghai Ocean Univ. 2015, 24, 894–905. [Google Scholar]
- Ye, Y.; Chen, K.; Zhou, Q.; Xiang, P.; Huo, Y.; Lin, M. Impacts of Thermal Discharge on Phytoplankton in Daya Bay. J. Coast. Res. 2019, 83, 135–147. [Google Scholar] [CrossRef]
- Qu, C.; Song, J.; Li, N. Causes of jellyfish blooms and their influence on marine environment. Chin. J. Appl. Ecol. 2014, 25, 3701–3712. [Google Scholar]
- Ben Mariem, H.; Chaieb, M. Climate change impacts on the distribution of stipa tenacissima l. Ecosystems in North African arid zone-a case study in Tunisia. Appl. Ecol. Environ. Res. 2017, 15, 67–82. [Google Scholar] [CrossRef]
- Duan, M.; Liu, Z.; Yan, D.; Peng, W.; Baghban, A. Application of lssvm algorithm for estimating higher heating value of biomass based on ultimate analysis. Energy Sources Part A-Recovery Util. Environ. Eff. 2018, 40, 709–715. [Google Scholar] [CrossRef]
- Li, Z.; Han, C.; Wei, D. Empirical research on the relationship between natural gas consumption and economic growth in the Northeast Asia. Energy Environ. 2018, 29, 216–231. [Google Scholar]
- Kumar, R.; Dewan, A. Computational Models for Turbulent Thermal Plumes: Recent Advances and Challenges. Heat Transf. Eng. 2014, 35, 367–383. [Google Scholar] [CrossRef]
- Kowalski, E.; Mazierski, J. Effects of cooling water discharges from a power plant on reservoir water quality. Oceanol. Hydrobiol. Stud. 2008, 37, 107–118. [Google Scholar] [CrossRef]
- Durán-Colmenares, A.; Barrios-Piña, H.; Ramírez-León, H. Numerical modeling of water thermal plumes emitted by thermal power plants. Water 2016, 8, 482. [Google Scholar] [CrossRef]
- Nikulenkov, A.M.; Dvornikov, A.Y.; Rumynin, V.G.; Ryabchenko, V.A.; Vereschagina, E.A. Assessment of allowable thermal load for a river reservoir subject to multi-source thermal discharge from operating and designed beloyarsk NPP Units (South Ural, Russian Federation). Environ. Model. Assess. 2017, 22, 609–623. [Google Scholar] [CrossRef]
- Poornima, E.H.; Rajadurai, M.; Rao, T.S.; Anupkumar, B.; Rajamohan, R.; Narasimhan, S.V.; Rao, V.N.R.; Venugopalan, V.P. Impact of thermal discharge from a tropical coastal power plant on phytoplankton. J. Therm. Biol. 2005, 30, 307–316. [Google Scholar] [CrossRef]
- Chuang, Y.; Yang, H.; Lin, H. Effects of a thermal discharge from a nuclear power plant on phytoplankton and periphyton in subtropical coastal waters. J. Sea Res. 2009, 61, 197–205. [Google Scholar] [CrossRef]
- Bedri, Z.; Bruen, M.; Dowley, A. Bartholomew asterson, Environmental consequences of a power plant shut-down: A three-dimensional water quality model of Dublin Bay. Mar. Pollut. Bull. 2013, 71, 117–128. [Google Scholar] [CrossRef]
- Cheng, Y.; Hao, Q. Effects of Topography on Diffusion of Thermal Discharge in Power Plant. Procedia Environ. Sci. 2011, 11, 618–623. [Google Scholar]
- Wang, S.; Chen, F.; Zhang, W. Numerical Investigation of Temperature Distribution of Thermal Discharge in a River-Type Reservoir. Pol. J. Environ. Stud. 2019, 28, 3909–3917. [Google Scholar] [CrossRef]
- Feng, L.; Chen, B.; Hayat, T.; Alsaedi, A.; Ahmad, B. Modelling the influence of thermal discharge under wind on algae. Phys. Chem. Earth 2015, 79–82, 108–114. [Google Scholar] [CrossRef]
- Yu, Y.; Wang, D.; Wang, Z.; Lai, X. Numerical Simulation of Thermal Discharge Based on FVM Method. J. Ocean Univ. China 2006, 5, 7–11. [Google Scholar]
- Gaeta, M.G.; Samaras, A.; Archetti, R.; Lamberti, A. Numerical Investigation of Thermal Discharge to Coastal Areas Using Telemac-3d: A Case Study for South Italy. In Proceedings of the 36th IAHR World Congress, The Hague, The Netherlands, 28 June–3 July 2015. [Google Scholar]
- Roy, P.; Rao, I.N.; Martha, T.R.; Kumar, K.V. Discharge water temperature assessment of thermal power plant using remote sensing techniques. Energy Geosci. 2022, 3, 172–181. [Google Scholar] [CrossRef]
- Martyanov, S.; Ryabchenko, V. Bottom sediment resuspension in the easternmost Gulf of Finland in the Baltic Sea: A case study based on three–dimensional modeling. Cont. Shelf Res. 2016, 117, 126–137. [Google Scholar] [CrossRef]
- Shi, H.Y.; Li, Q.J.; Sun, J.C.; Gao, G.D.; Sui, Y.; Qiao, S.W.; You, Z.J. Variation of Yellow River runoff and its influence on salinity in Laizhou Bay. J. Ocean Univ. China 2020, 19, 1235–1244. [Google Scholar] [CrossRef]
- Kolluru, V.S.; Buchak, E.M.; Brinkmann, P.E. Hydrodynamic modeling of coastal lng cooling water discharge. J. Energy Eng. 2012, 129, 16–31. [Google Scholar] [CrossRef]
- Lowe, S.A.; Schuepfer, F.; Dunning, D.J. Case study: Three-dimensional hydrodynamic model of a power plant thermal discharge. J. Hydraul. Eng. 2009, 135, 247–256. [Google Scholar] [CrossRef]
- Kitazawa, D.; Yang, J. Numerical analysis of water circulation and thermohaline structures in the Caspian Sea. J. Mar. Sci. Technol. 2012, 17, 168–180. [Google Scholar] [CrossRef]
- Goyal, R.; Rathod, P. Hydrodynamic Modelling for Salinity of Singapore Strait and Johor Strait using MIKE 3FM. In Proceedings of the 2nd International Conference on Environmental Science and Development, Xiamen, China, 25–27 May 2011. [Google Scholar]
- Serio, F.D.; Meftah, M.B.; Mossa, M. Monitoring and modelling of coastal currents and wastewater discharge: A case study. Geo-Eco-Mar. 2014, 20, 1–15. [Google Scholar]
- Saeed, S.; Hosseini, S.-S.; Hosseini, S.A.; Nasimi, S. Numerical simulation of temperature, salinity and density in the Caspian Sea using MIKE 3. J. Biol. Today’s World 2012, 1, 51–62. [Google Scholar]
- Gayathri, R.; Rao, V.R.; Rao, V.D.; Kumaresan, D. A 3D Numerical Modelling Study on Temperature and Salinity Structure along Coastal Waters of Kochi during Northeast Monsoon. J. Coast. Res. 2020, 89, 32. [Google Scholar] [CrossRef]
- Zhang, B.; Ping, J.; Liu, Z.; Jing, Z. Numerical Simulation of Thermal Discharge with Different Heat Exchange Methods on Water Surface. In Proceedings of the 2015 8th International Conference on Intelligent Computation Technology and Automation (ICICTA), Nanchang, China, 14–15 June 2015; pp. 597–600. [Google Scholar]
- Lin, J.; Zhang, S.; Gong, F. Numerical simulation study on site selection evaluation of marine ranching zone in Xiangshan Bay: Effects of thermal water discharged from coastal power plants. J. Shanghai Ocean Univ. 2012, 21, 816–824. [Google Scholar]
- Ahsan, Q.; Li, H.; Blumberg, A.F.; Piehler, G.R. Addressing practical environmental permitting issues through the use of sophisticated 3-d hydrothermal models. Power-Gen Int. 2002, 12, 10–12. [Google Scholar]
- Sojisuporn, P. Application of numerical model to thermal plume dispersion from power plant at kanom, thailand. In Proceedings of the Seventh OMISAR Workshop on Ocean Models, Singapore, 30 September–2 October 2002. [Google Scholar]
- Chen, X.Y.; Zhu, J.; Han, L.X. Defining methods of the heat transfer coefficient and its analysis of sensitiveness. Water Sci. Eng. Technol. 2007, 5, 9–13. [Google Scholar]
- Yu, L.; Yu, J. Numerical research on flow and thermal transport in cooling pool of electrical power station using three depth-averaged turbulence models. Water Sci. Eng. 2009, 2, 1–12. [Google Scholar]
- Wang, C.; Cai, L.; Wu, Y.; Ouyang, Y. Numerical simulation of the impact of an integrated renovation project on the Maowei Sea hydrodynamic environment. Sci. Rep. 2021, 11, 17059. [Google Scholar] [CrossRef]
- Cao, D.; Shen, Y.; Su, M.; Yu, C. Numerical simulation of hydrodynamic environment effects of the reclamation project of Nanhui tidal flat in Yangtze Estuary. J. Hydrodyn. 2019, 31, 603–613. [Google Scholar] [CrossRef]
- Sharbaty, S. Comparison of MIKE 3 Model and Princeton Ocean Model in Wind driven Current patterns under same conditions for the Caspian Sea. Can. J. Comput. Math. Nat. Sci. Eng. Med. 2012, 3, 60–66. [Google Scholar]
- Shi, H.Y.; Li, Q.J.; You, Z.J.; Yang, L.Z.; Fu, Y.C. Study on water exchange capacity of Fangcheng Bay in dry and wet season based on MIKE3 model. Desalin. Water Treat. 2021, 219, 287–296. [Google Scholar] [CrossRef]
- Bui, L.T.; Pham, H.T.H. Linking hydrological, hydraulic and water quality models for river water environmental capacity assessment. Sci. Total Environ. 2023, 857, 159490. [Google Scholar] [CrossRef]
- Cao, L.; Liu, Y. Optimization design and research of simulation system for urban green ecological rainwater by genetic algorithm. J. Supercomput. 2022, 78, 11318–11344. [Google Scholar] [CrossRef]
- Meza-Padilla, R.; Enriquez, C.; Appendini, C.M. Rapid assessment tool for oil spill planning and contingencies. Mar. Pollut. Bull. 2021, 166, 112196. [Google Scholar] [CrossRef]
- Gao, J.L.; Shi, H.B.; Zang, J.; Liu, Y.Y. Mechanism analysis on the mitigation of harbor resonance by periodic undulating topography. Ocean. Eng. 2023, 281, 114923. [Google Scholar] [CrossRef]
- Munk, W.H.; Anderson, E.R. Notes on a theory of the thermocline. J. Mar. Res. 1948, 7, 276–295. [Google Scholar]
- Laguna-Zarate, L.; Barrios-Piña, H.; Ramírez-León, H.; García-Díaz, R.; Becerril-Piña, R. Analysis of Thermal Plume Dispersion into the Sea by Remote Sensing and Numerical Modeling. J. Mar. Sci. Eng. 2021, 9, 1437. [Google Scholar] [CrossRef]
- Willmott, C. On the validation of models. Phys. Geogr. 1981, 2, 184–194. [Google Scholar] [CrossRef]
- Parshakova, Y.N.; Lyubimova, T.P. Computer modelling of technogenic thermal pollution zones in large water bodies. J. Phys. Conf. Ser. 2018, 01, 955. [Google Scholar] [CrossRef]
- Yan, F.; Han, L.; Chen, R.; Zhang, L.; Chen, Q. Water temperature modeling and water temperature stratification pattern of reservoir based on the three-dimensional environment fluid dynamics code model. Adv. Mater. Res. 2014, 1073–1076, 2321–2326. [Google Scholar] [CrossRef]
- Yang, M.; Wang, M.; Zhang, F.; Lai, R. Numerical simulation and experimental study of three-dimensional density-stratified flow. IOP Conf. Ser. Mater. Sci. Eng. 2019, 472, 012080. [Google Scholar] [CrossRef]
Figure 1.
Geographic location map of the study area. (a) The figure illustrates the extent of the study area and the location of the open boundaries. (b) The figure displays the locations of hydrological observation stations and power plant discharge outlets.
Figure 1.
Geographic location map of the study area. (a) The figure illustrates the extent of the study area and the location of the open boundaries. (b) The figure displays the locations of hydrological observation stations and power plant discharge outlets.
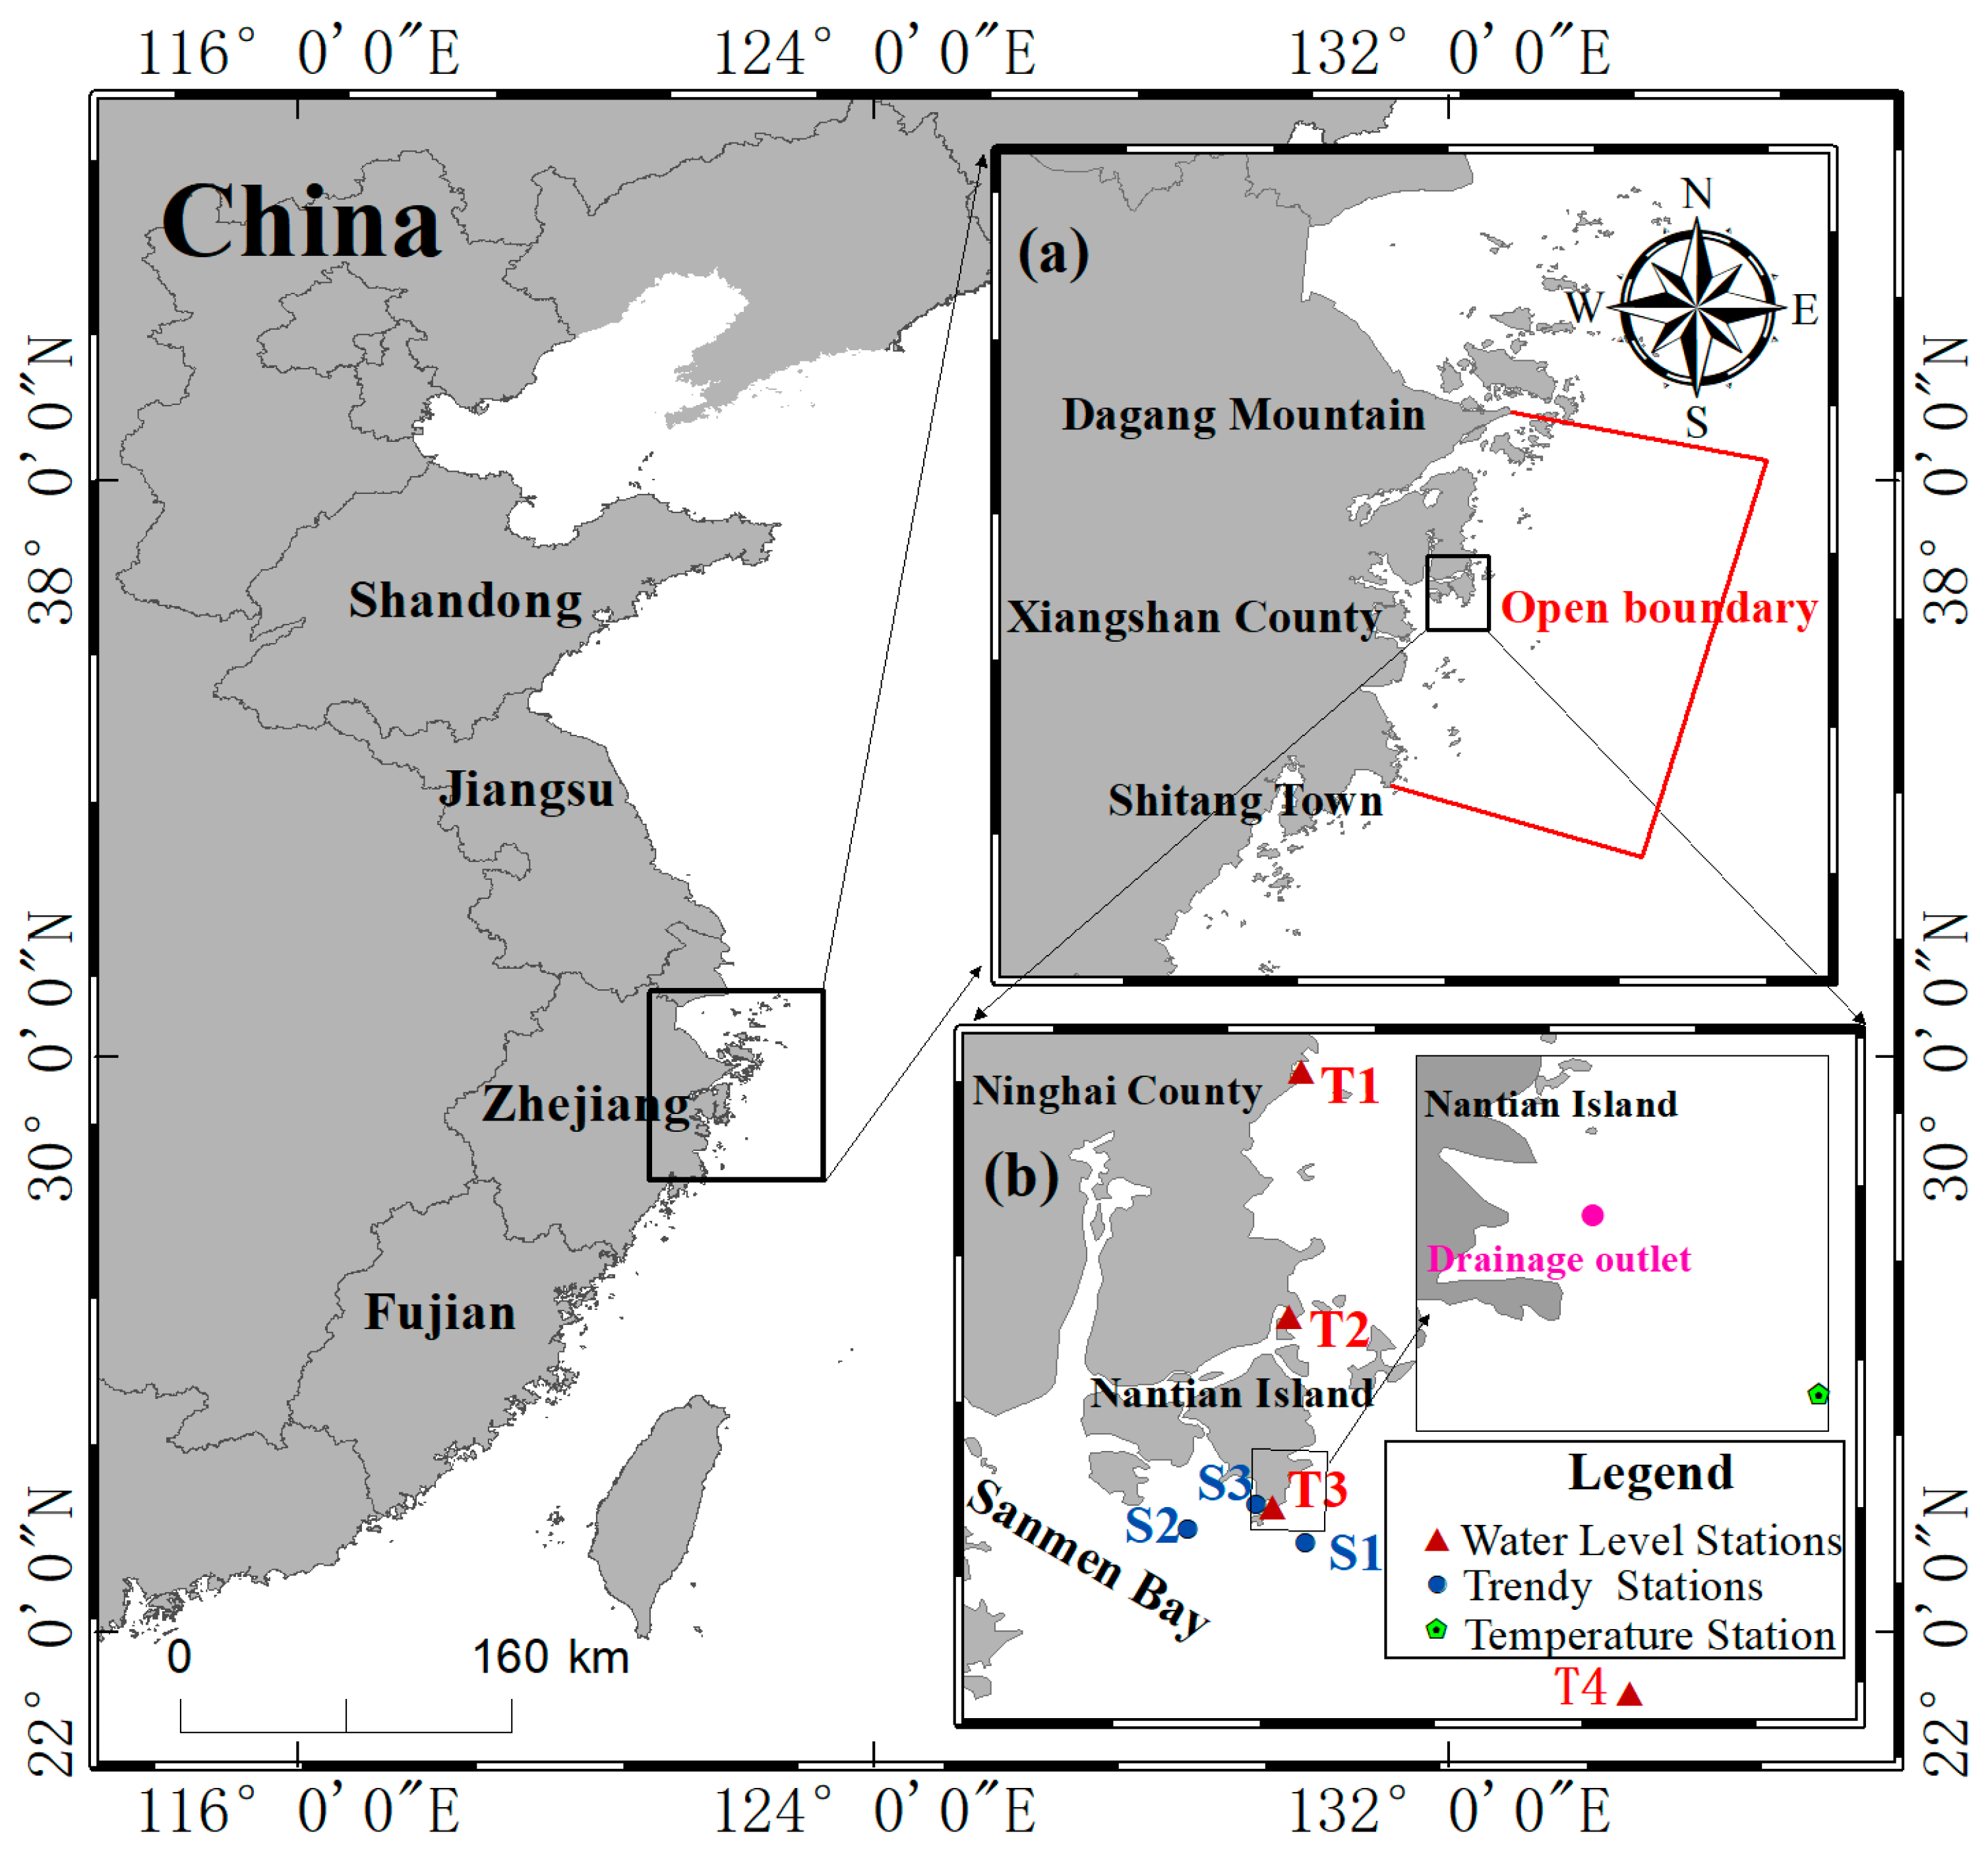
Figure 2.
Model grid setup: (a) the grid distribution in the area near the power plant; and (b) the grid refinement at the drainage outlet.
Figure 2.
Model grid setup: (a) the grid distribution in the area near the power plant; and (b) the grid refinement at the drainage outlet.
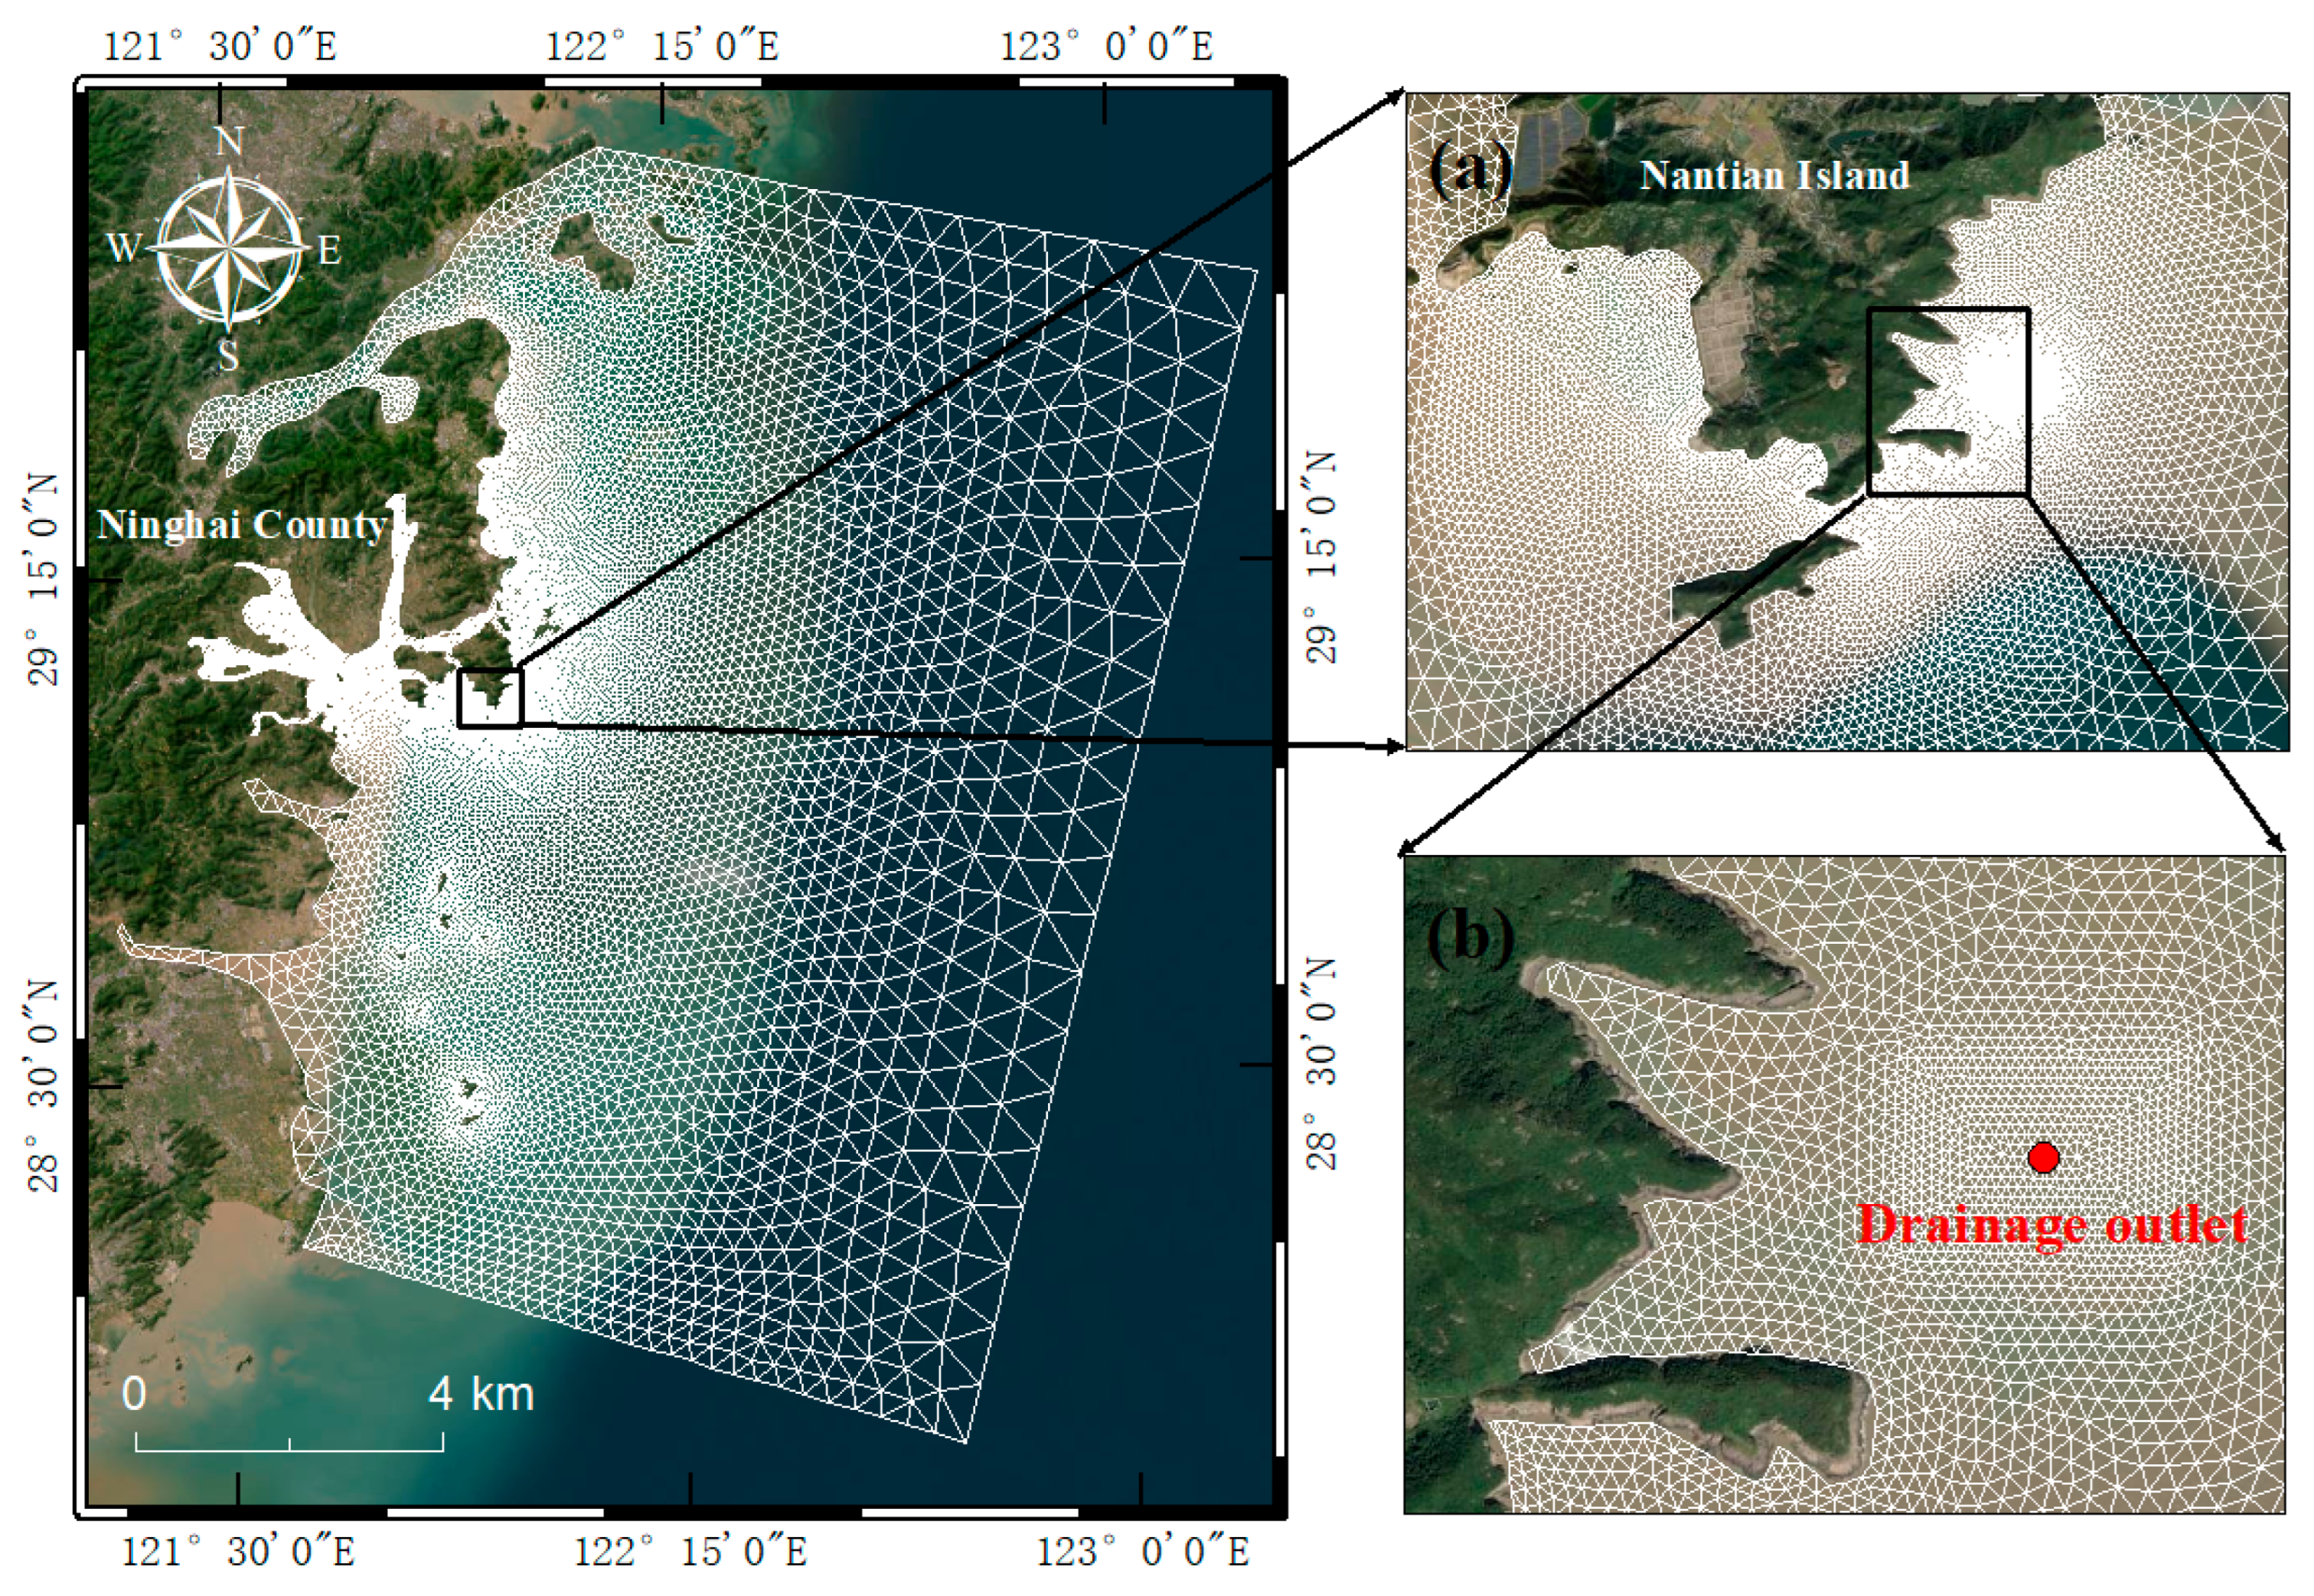
Figure 3.
Distribution of water depth in the study area: (a) the distribution of water depth in the water near the power plant.
Figure 3.
Distribution of water depth in the study area: (a) the distribution of water depth in the water near the power plant.
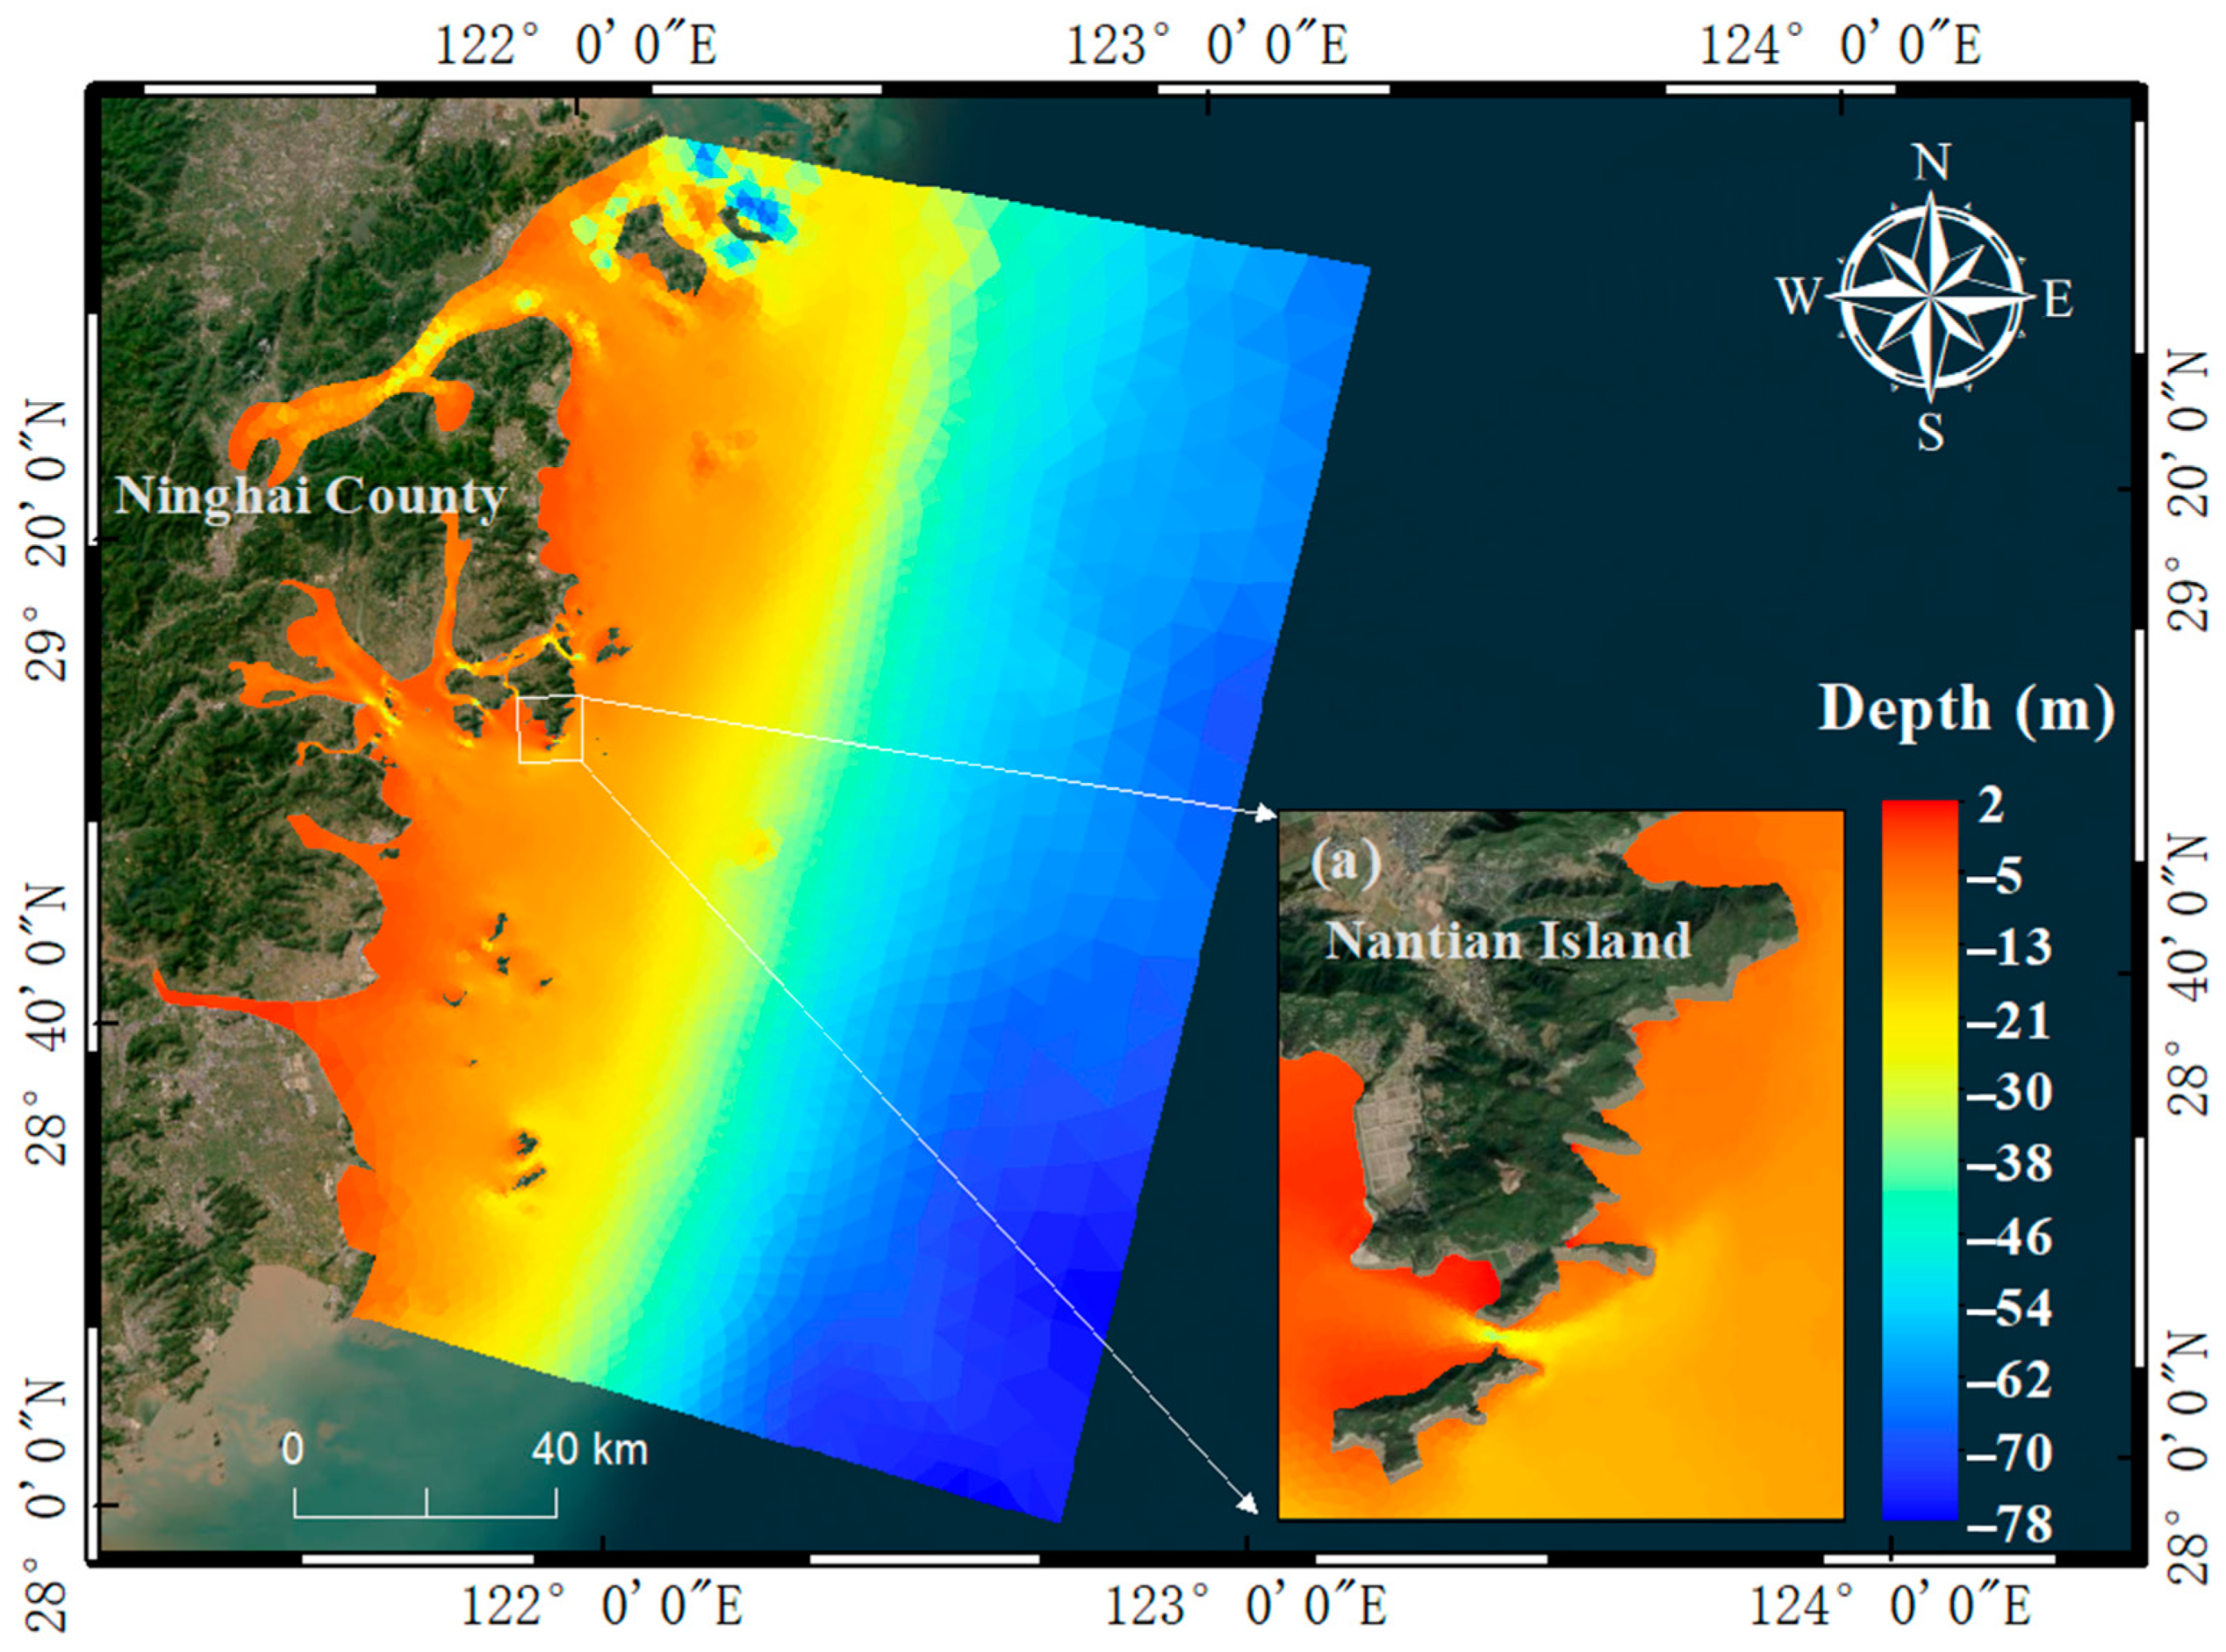
Figure 4.
T1, T2, T3, and T4 water level verification.
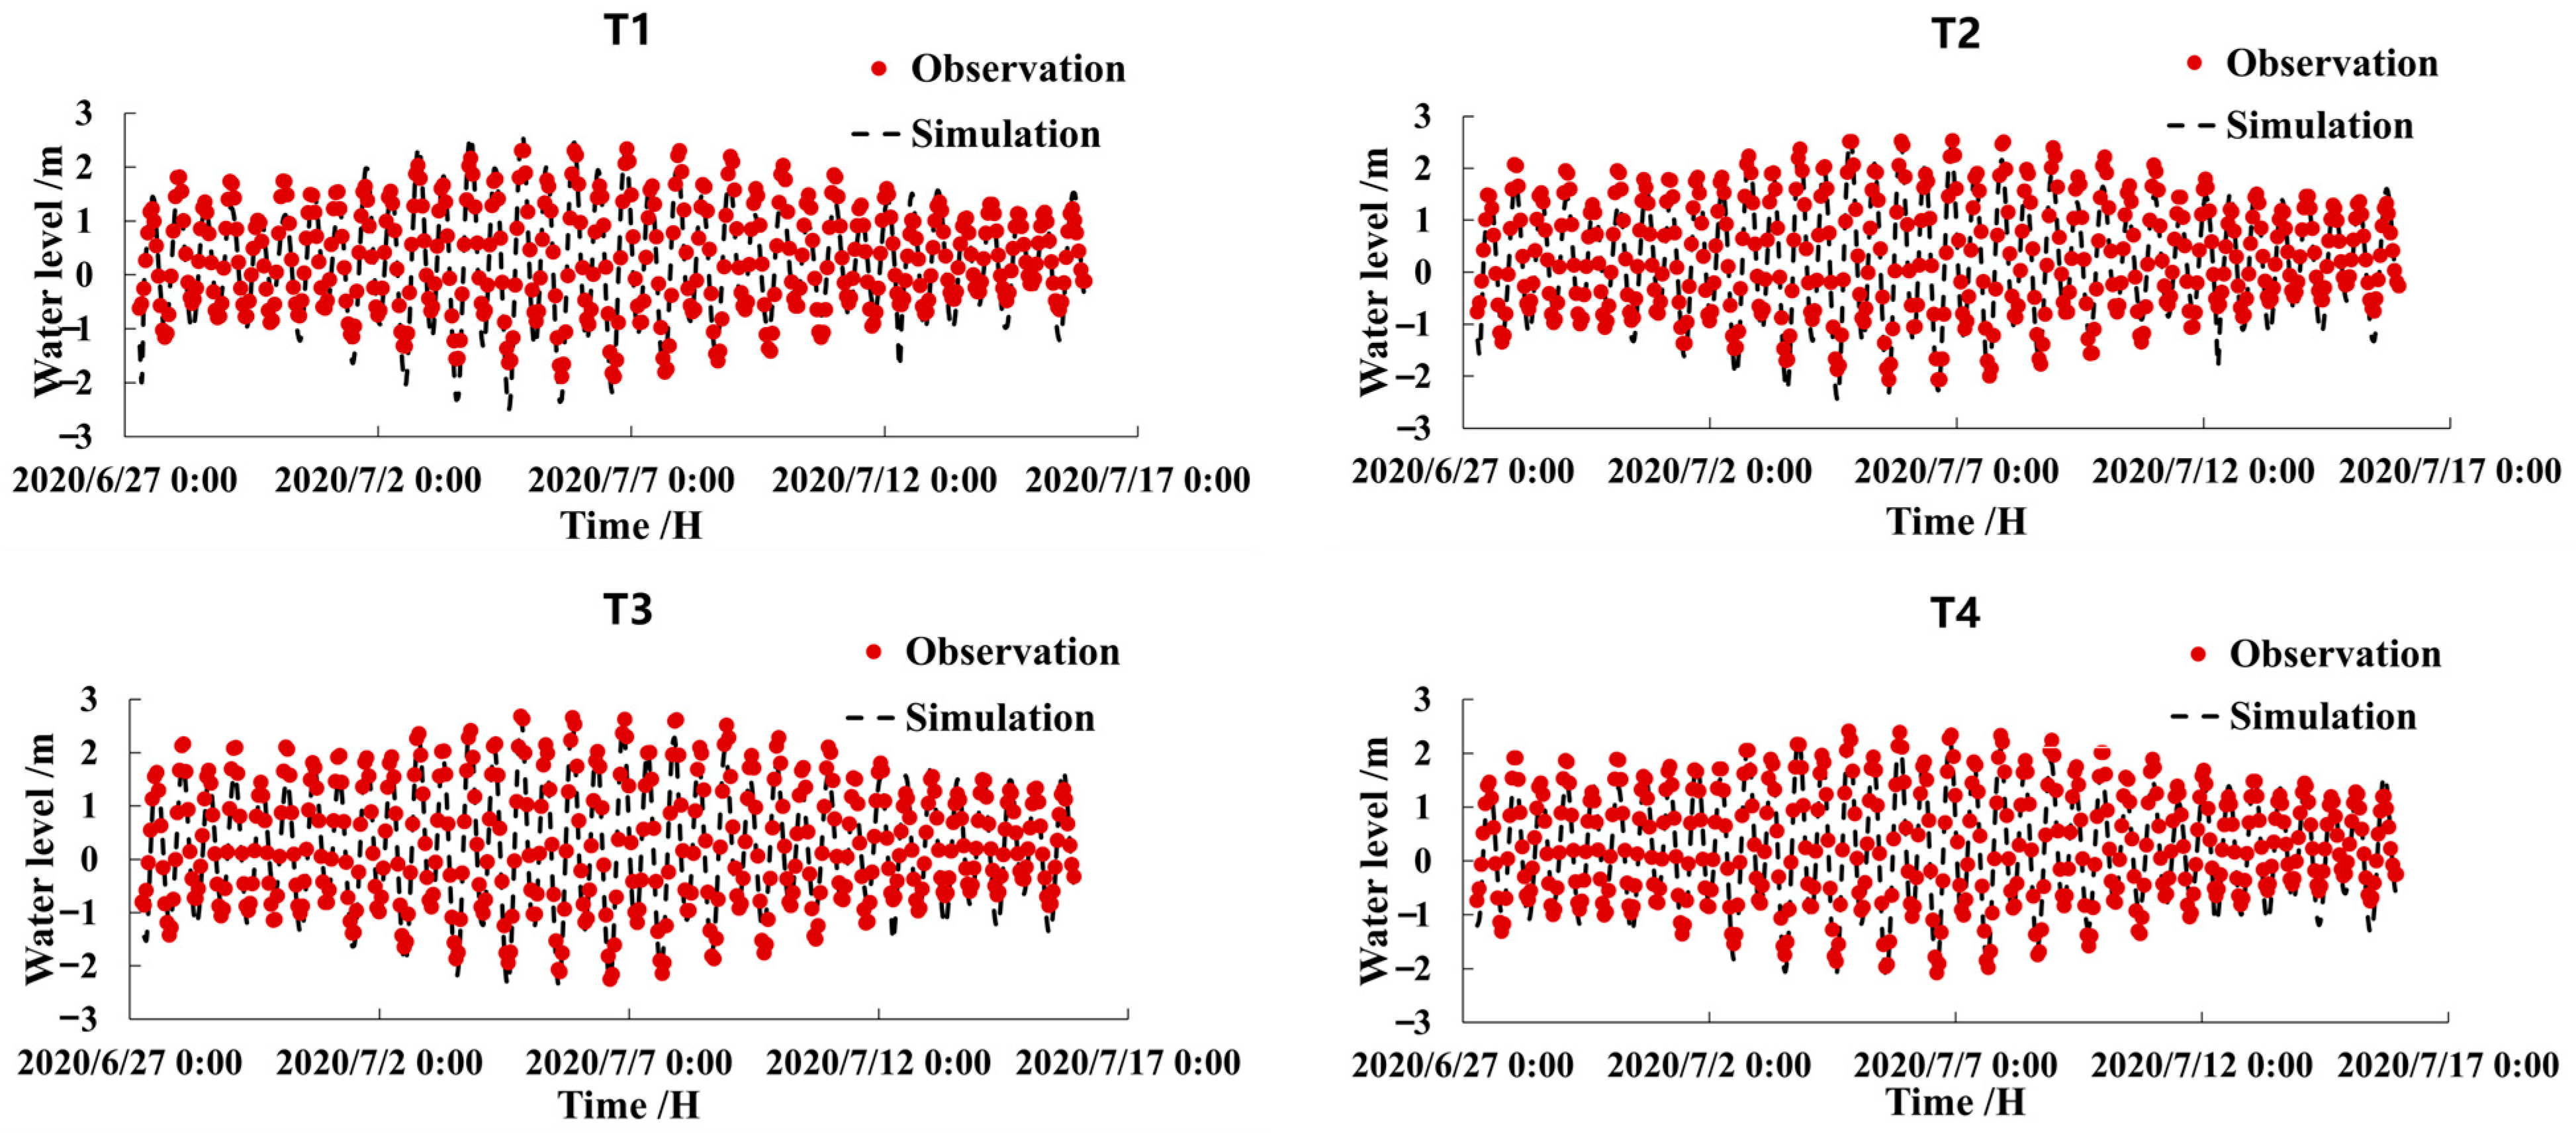
Figure 5.
S1, S2, and S3 surface tidal current verification.
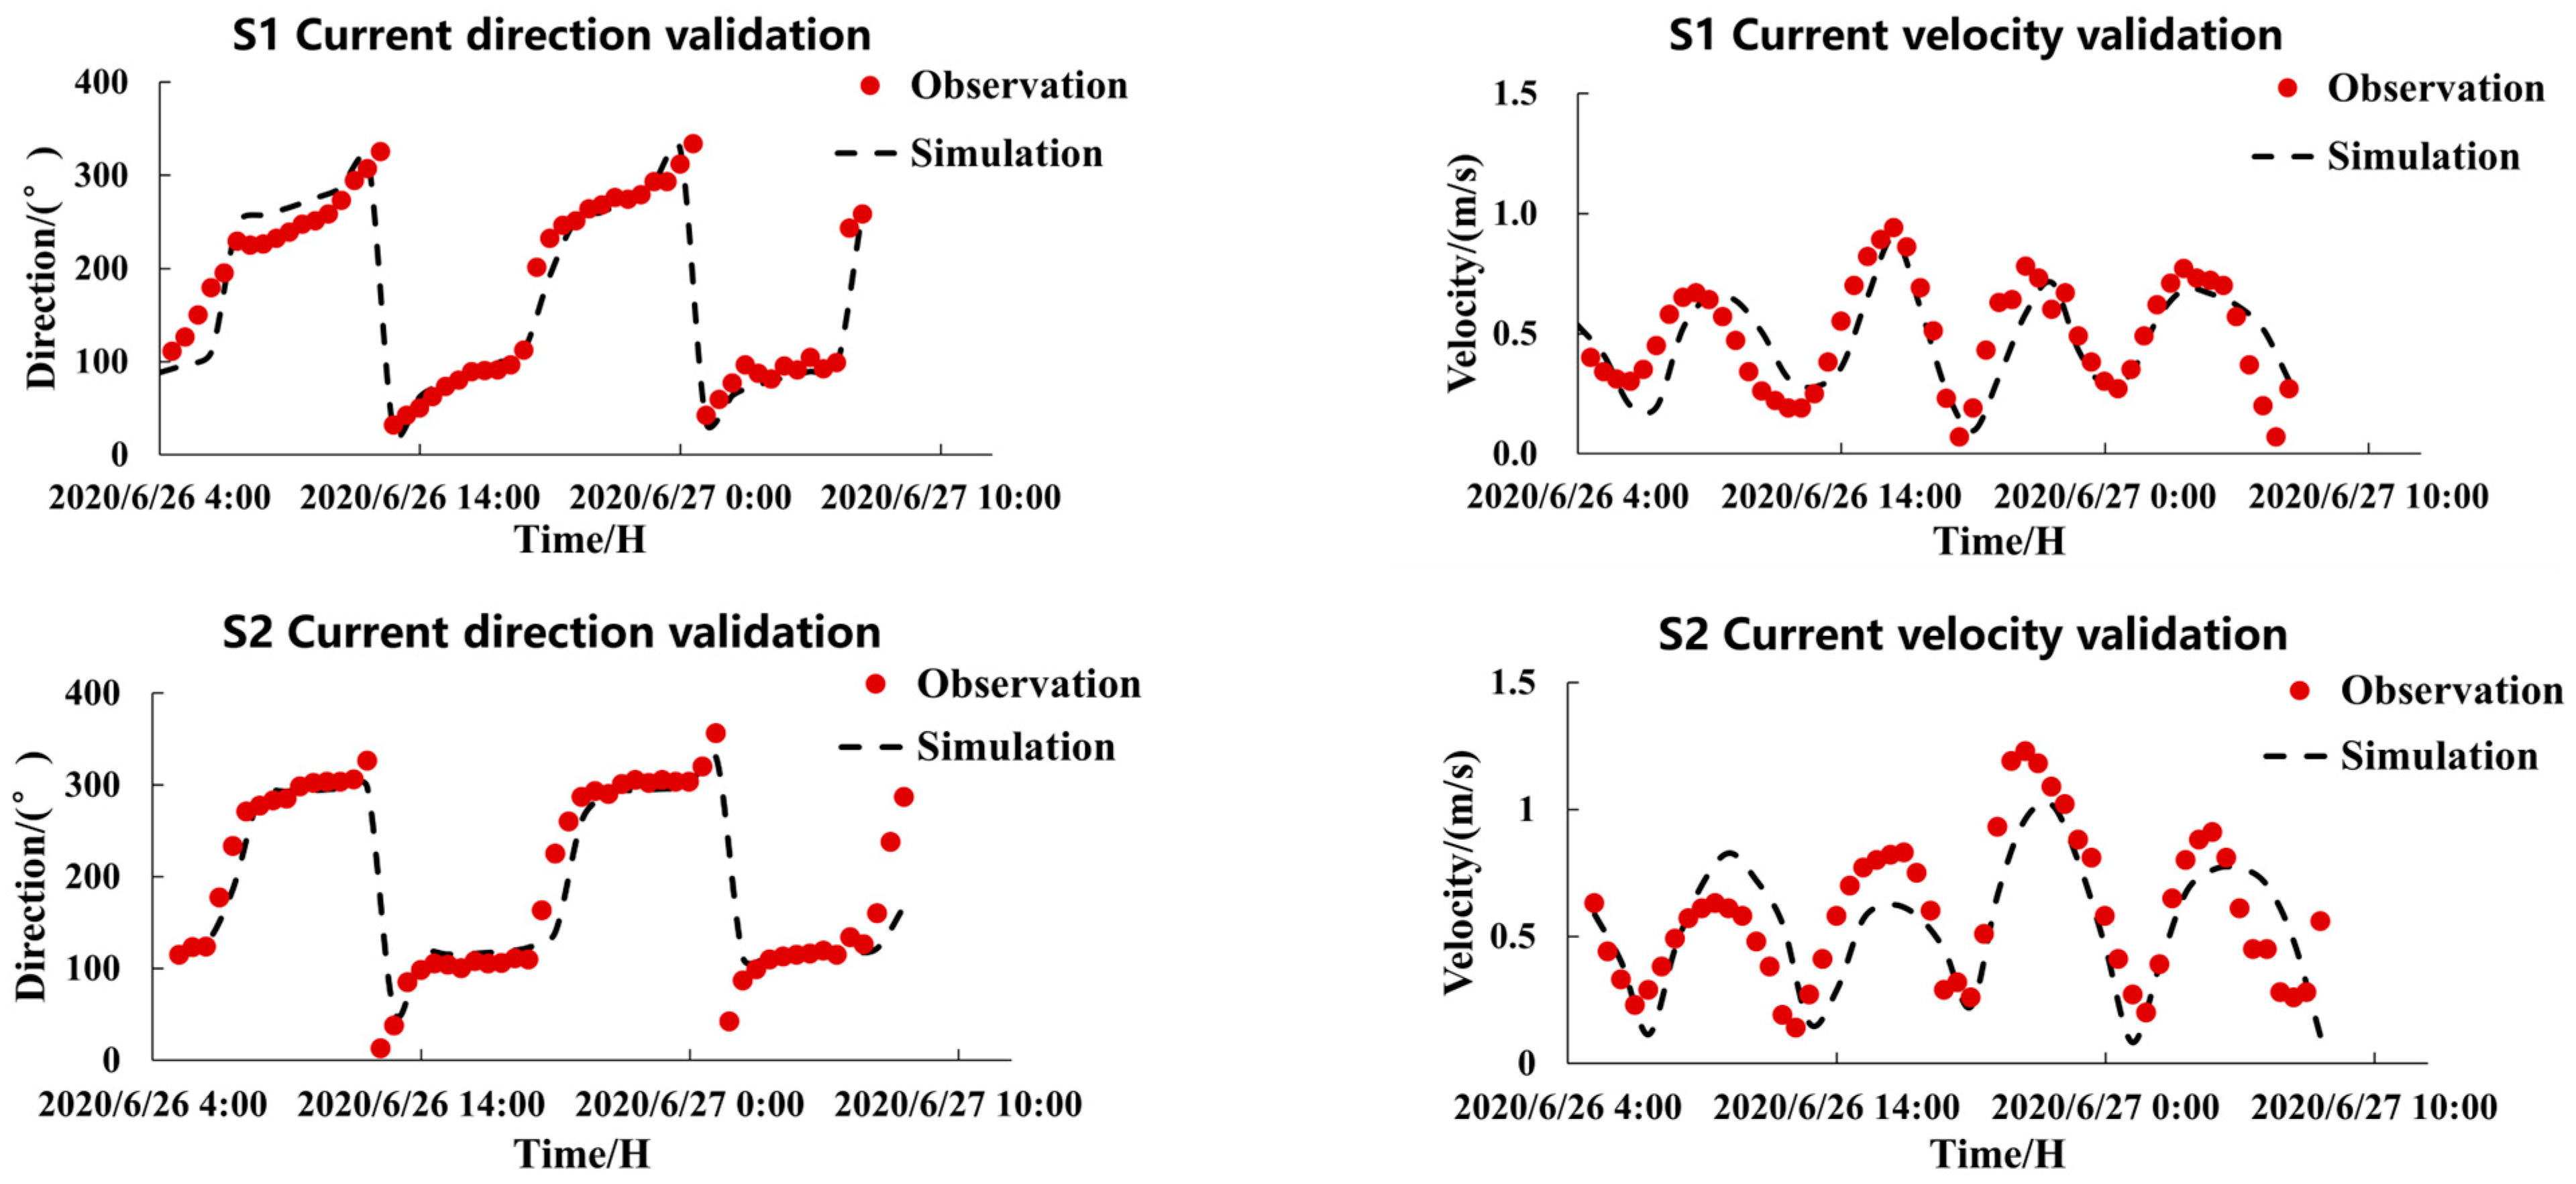

Figure 6.
Verification of temperature sequences for Model 1 and Model 2.
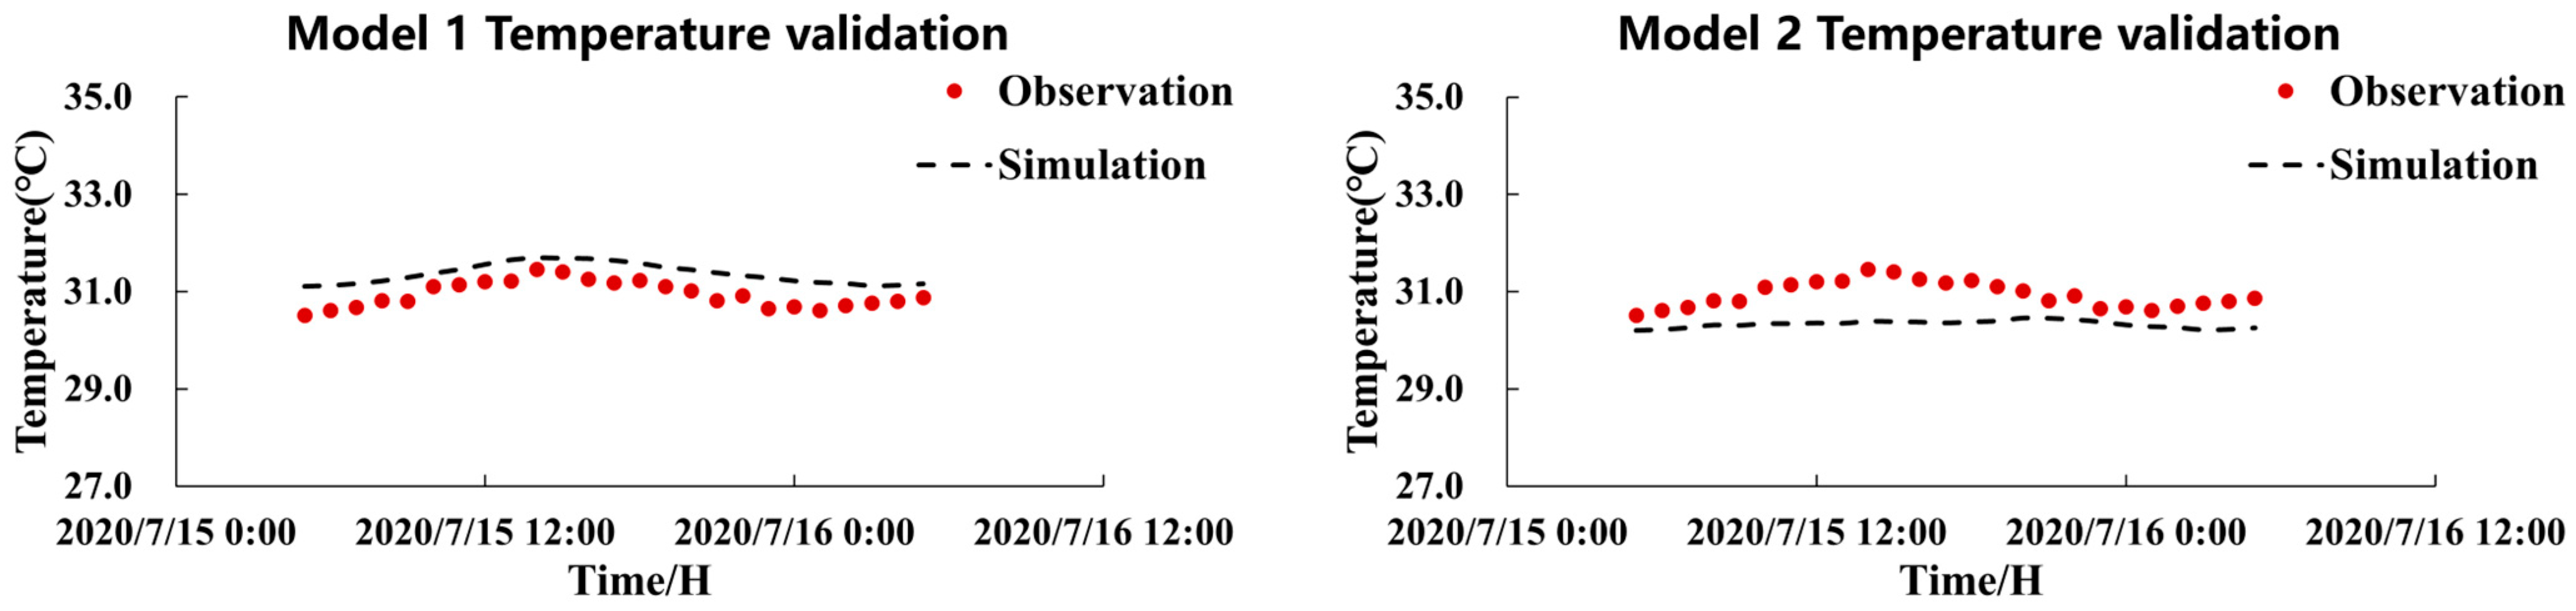
Figure 7.
Characteristics of flow field distribution during rapid rise and fall of semi-monthly tide in summer: (a) the distribution of rapid tidal currents rising in the water near the project site; and (b) the distribution of rapid tidal currents ebbing in the water near the project site.
Figure 7.
Characteristics of flow field distribution during rapid rise and fall of semi-monthly tide in summer: (a) the distribution of rapid tidal currents rising in the water near the project site; and (b) the distribution of rapid tidal currents ebbing in the water near the project site.

Figure 8.
Sectional position map (red dot is the outlet; arrow is the flow velocity vector).
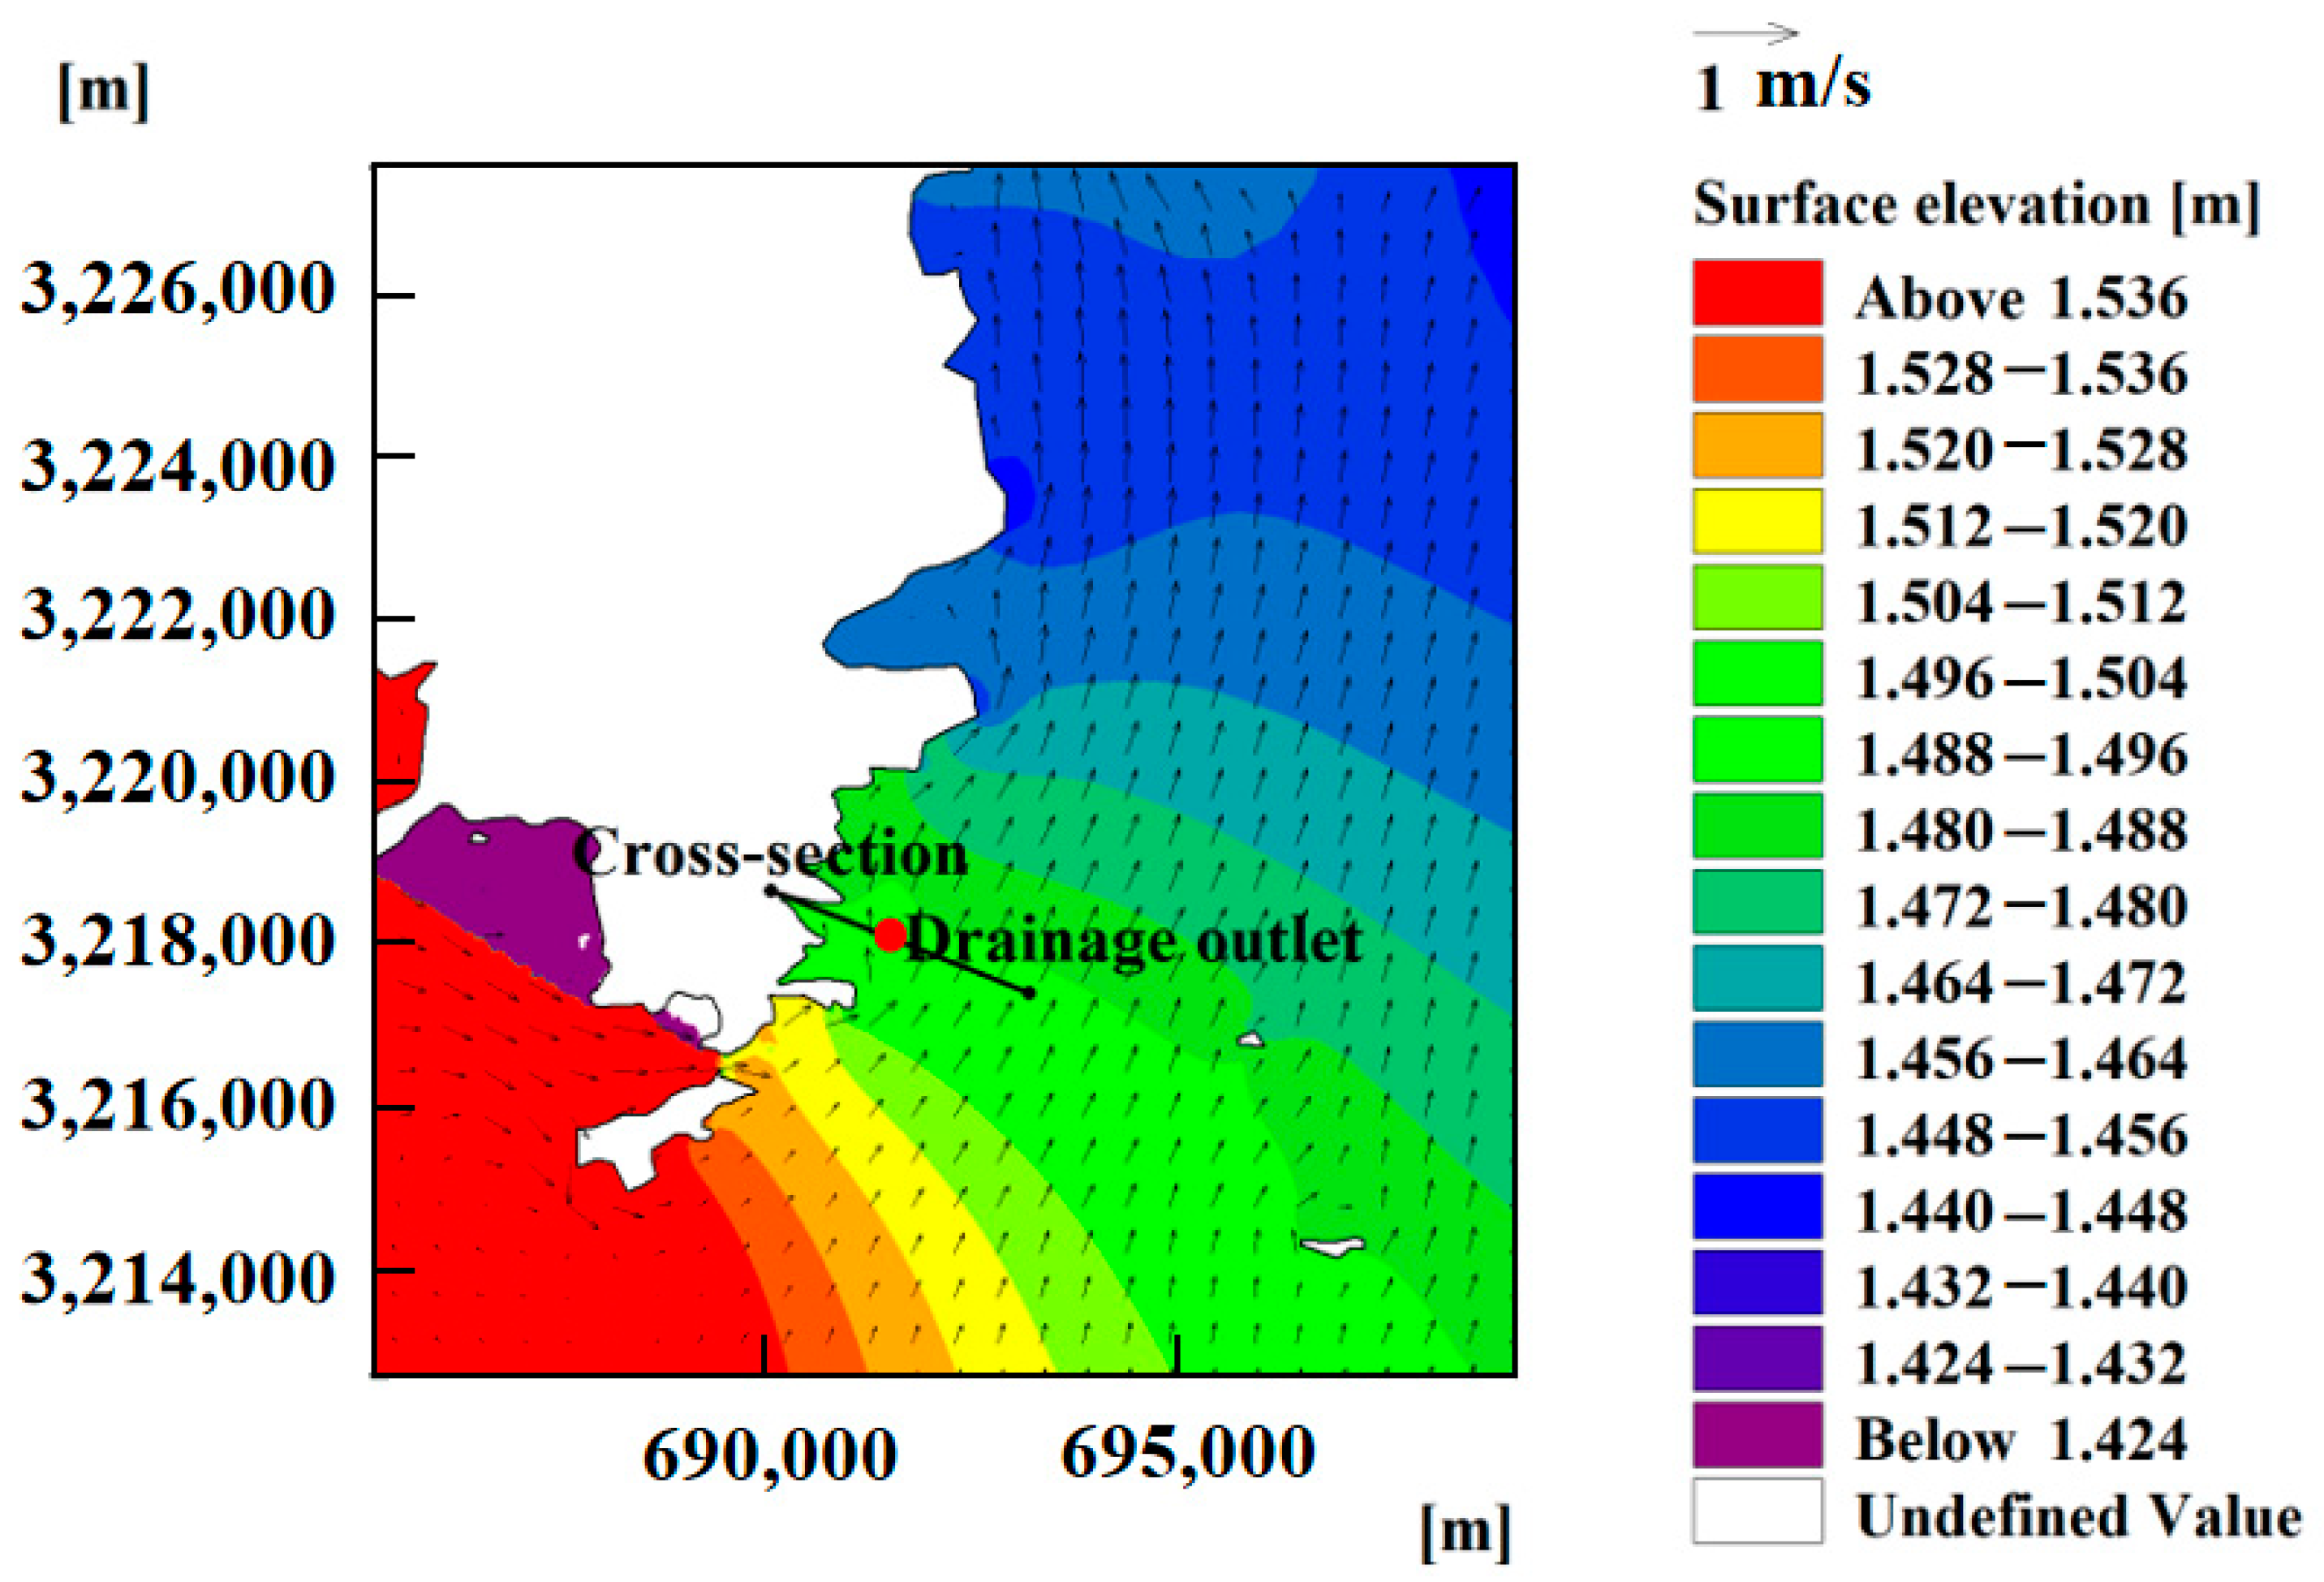
Figure 9.
Vertical temperature rise distribution comparison chart (black dot is the outlet).
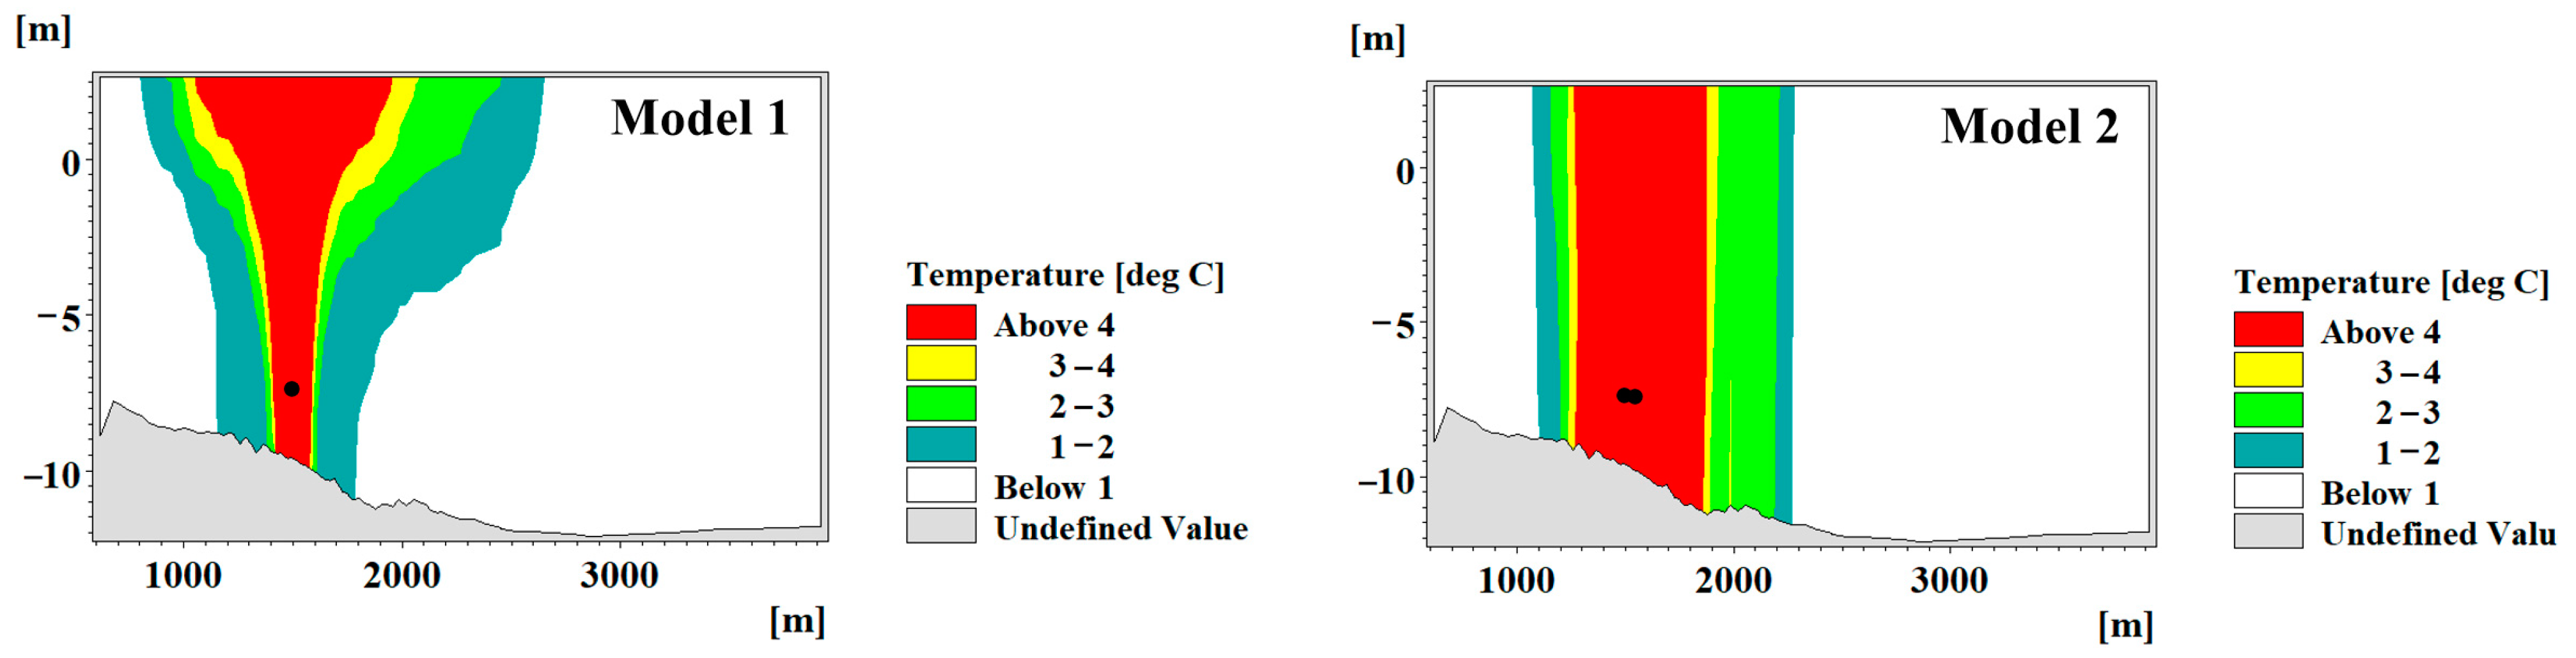
Figure 10.
Comparison chart of surface temperature rise envelope during summer semi-monthly tide.
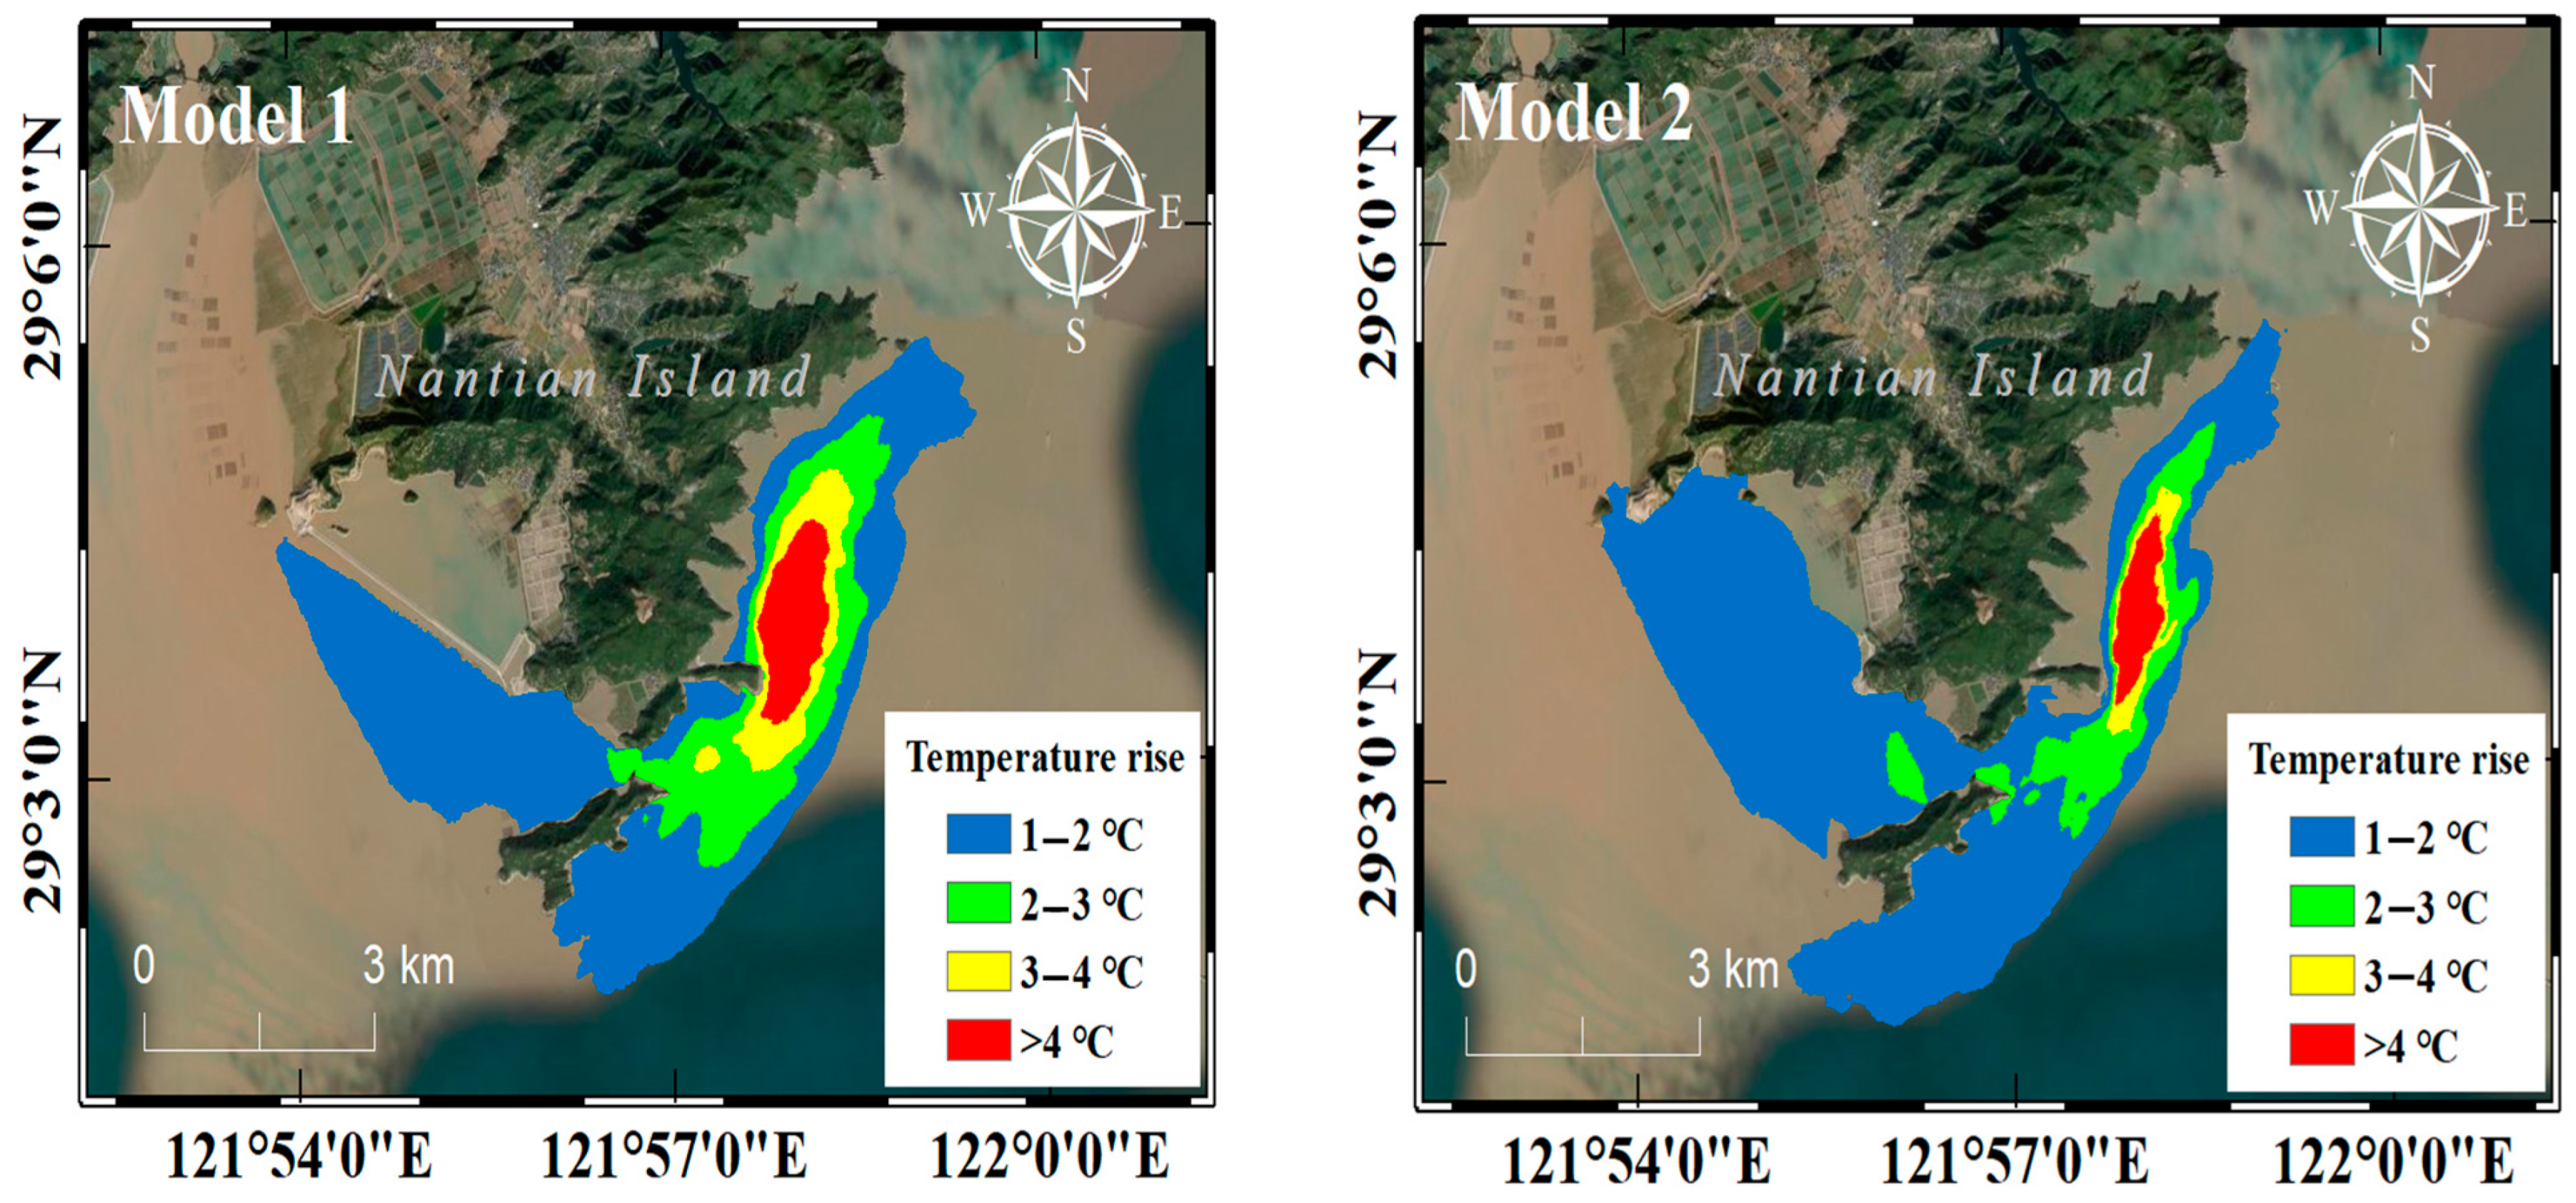
Figure 11.
Comparison of mid-layer temperature rise envelope during summer half-moon tide.
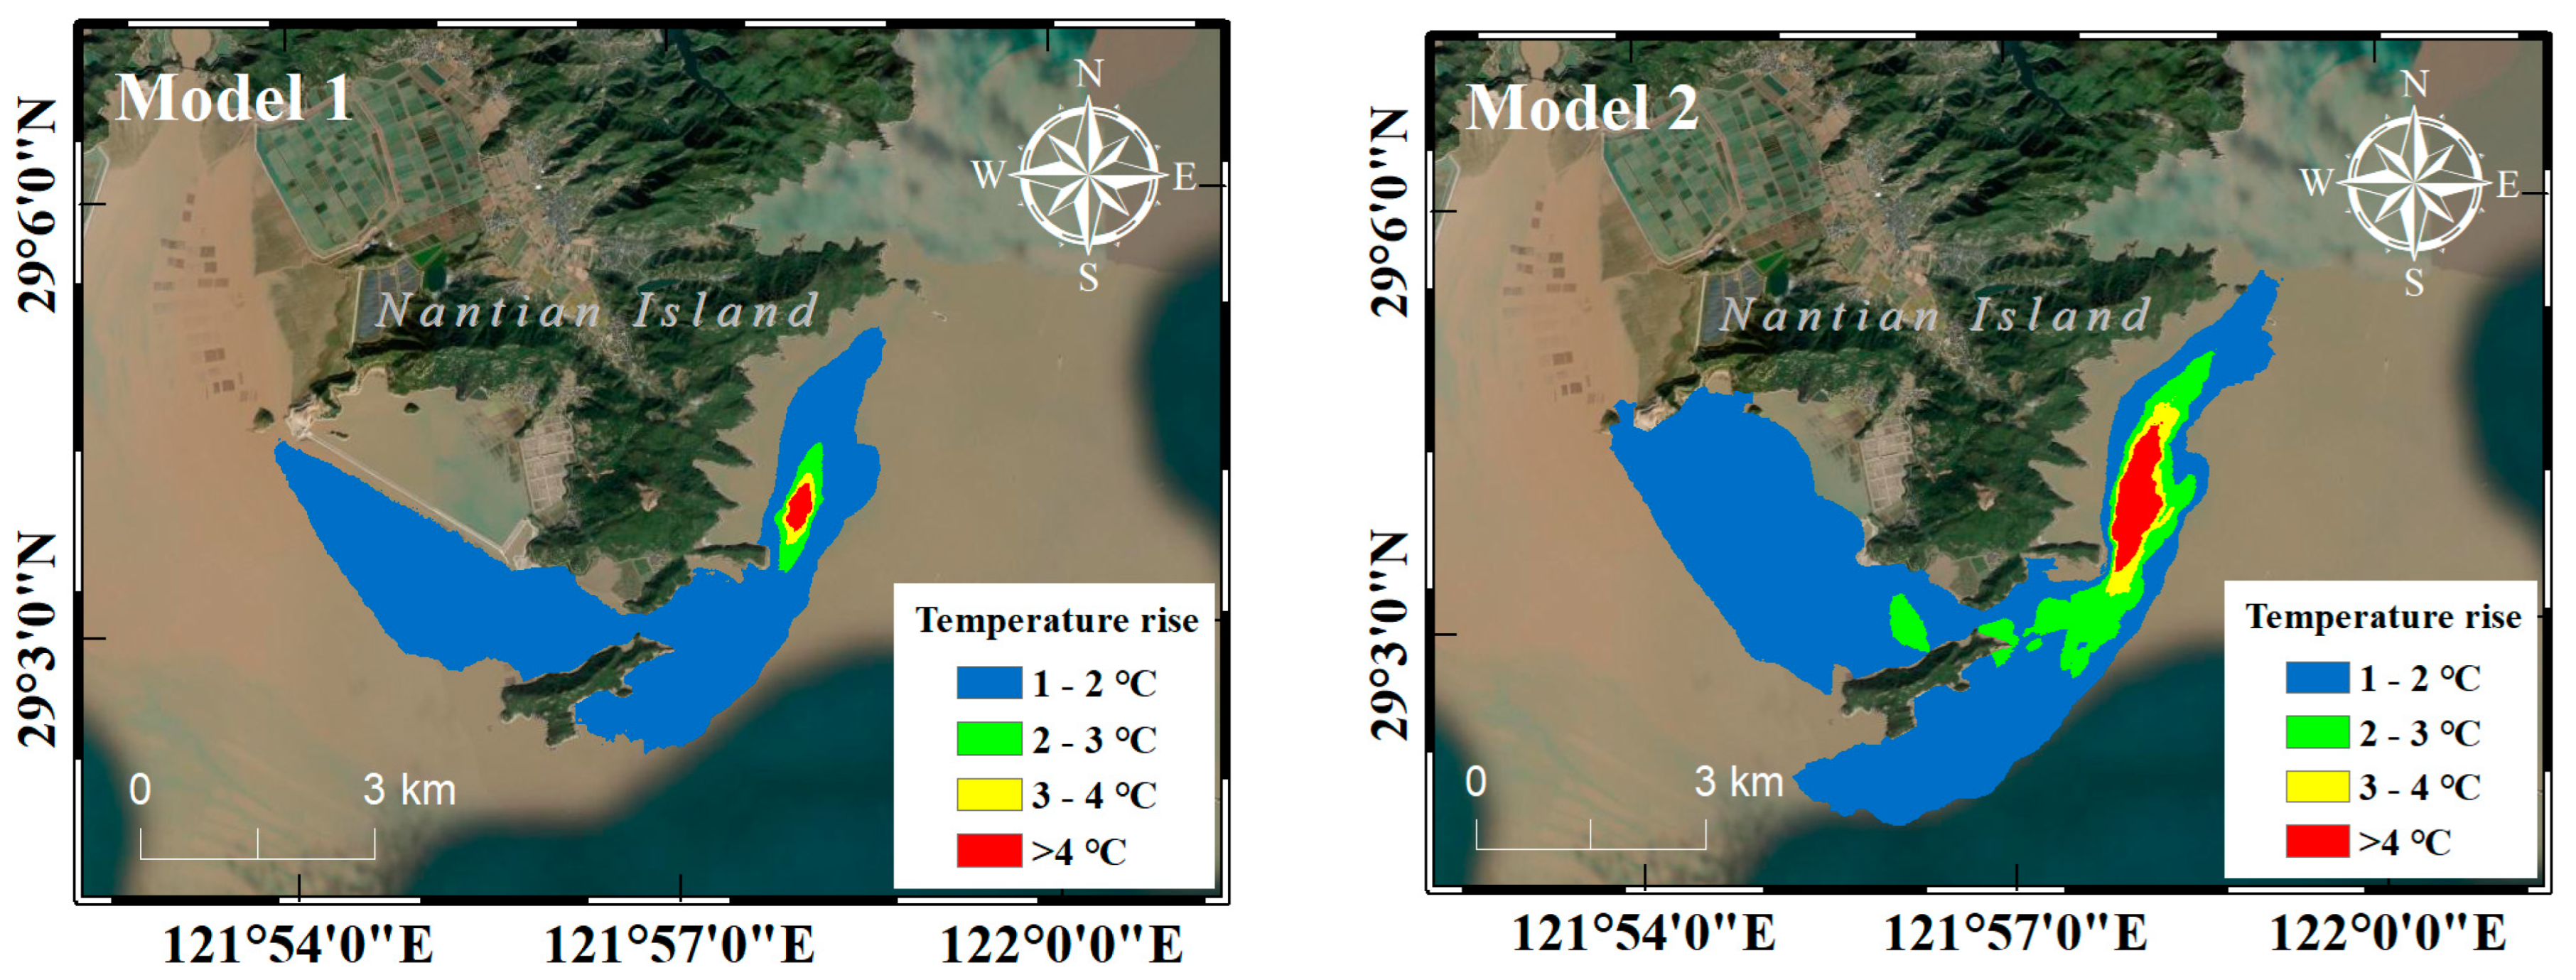
Figure 12.
Comparison of bottom layer temperature rise envelope during summer half-moon tide.

Table 1.
Model parameter settings.
| Model | Model 1 | Model 2 |
|---|---|---|
| Temperature and Salt Module | ECO Module | |
| Diffusion coefficient | k−ε turbulence models | |
| Coriolis force coefficient | ||
| Summer surface heat exchange amount | Latent heat flux: 20 W/m2 °C | Comprehensive heat dissipation of water surface: 45 W/m2 °C |
| Sensible heat flux: 12 W/m2 °C | ||
| Long-wave radiation flux: −17 W/m2 °C | ||
| Short-wave radiation flux: 30 W/m2 °C | ||
| Water surface temperature | 30 °C | |
| Air temperature | 32 °C | |
| Wind speed | 3.32 m/s | |
| power plant discharge volume | 150 m3/s | |
| Drainage temperature rise | 8.2 °C | |
Table 2.
Model validation evaluation table.
| Evaluation Items | Site Name | Skill Value | Model Evaluation | Pearson Correlation Coefficient |
|---|---|---|---|---|
| Water level | T1 | 0.5 | Very good | 1.0 |
| T2 | 0.5 | Very good | 0.9 | |
| T3 | 0.6 | Very good | 1.0 | |
| T4 | 0.6 | Very good | 1.0 | |
| Flow velocity | S1 | 0.9 | Excellent | 0.8 |
| S2 | 0.8 | Excellent | 0.8 | |
| S3 | 0.9 | Excellent | 0.8 | |
| Flow direction | S1 | 1.0 | Excellent | 1.0 |
| S2 | 1.0 | Excellent | 1.0 | |
| S3 | 0.9 | Excellent | 0.9 | |
| Temperature | Model 1 | 0.8 | Excellent | 0.7 |
| Model 2 | 0.6 | Excellent | 0.5 |
Table 3.
Statistics of the vertical temperature rise area for Model 1 and Model 2 (km2).
| Model | 1 °C | 2 °C | 3 °C | 4 °C |
|---|---|---|---|---|
| Model 1 | 0.031864 | 0.017612 | 0.012696 | 0.009568 |
| Model 2 | 0.033712 | 0.028649 | 0.022336 | 0.016069 |
| 0.001848 | 0.011037 | 0.009641 | 0.006501 |
Table 4.
Statistics of temperature rise envelope area during summer half-moon tide for Model 1 and Model 2 (km2).
Table 4.
Statistics of temperature rise envelope area during summer half-moon tide for Model 1 and Model 2 (km2).
| Model | Tide Type | Vertical Position | 1 °C | 2 °C | 3 °C | 4 °C |
|---|---|---|---|---|---|---|
| Model 1 | Summer half-moon tide | Surface layer | 17.75 | 5.89 | 2.62 | 1.31 |
| Mid-layer | 12.16 | 0.55 | 0.23 | 0.13 | ||
| Bottom layer | 8.53 | 0.17 | 0.09 | 0.05 | ||
| Model 2 | Summer half-moon tide | Surface layer | 18.91 | 2.89 | 1.20 | 0.71 |
| Mid-layer | 18.89 | 2.82 | 1.17 | 0.70 | ||
| Bottom layer | 18.76 | 2.70 | 1.13 | 0.68 |
Disclaimer/Publisher’s Note: The statements, opinions and data contained in all publications are solely those of the individual author(s) and contributor(s) and not of MDPI and/or the editor(s). MDPI and/or the editor(s) disclaim responsibility for any injury to people or property resulting from any ideas, methods, instructions or products referred to in the content. |
© 2023 by the authors. Licensee MDPI, Basel, Switzerland. This article is an open access article distributed under the terms and conditions of the Creative Commons Attribution (CC BY) license (https://creativecommons.org/licenses/by/4.0/).
Share and Cite
MDPI and ACS Style
Zhang, X.; Shi, H.; Zhan, C.; Zhu, J.; Wang, Q.; Li, G. Numerical Simulation Calculation of Thermal Discharge Water Diffusion in Coastal Nuclear Power Plants. Atmosphere 2023, 14, 1371. https://doi.org/10.3390/atmos14091371
AMA Style
Zhang X, Shi H, Zhan C, Zhu J, Wang Q, Li G. Numerical Simulation Calculation of Thermal Discharge Water Diffusion in Coastal Nuclear Power Plants. Atmosphere. 2023; 14(9):1371. https://doi.org/10.3390/atmos14091371
Chicago/Turabian StyleZhang, Xuri, Hongyuan Shi, Chao Zhan, Jun Zhu, Qing Wang, and Guoqing Li. 2023. "Numerical Simulation Calculation of Thermal Discharge Water Diffusion in Coastal Nuclear Power Plants" Atmosphere 14, no. 9: 1371. https://doi.org/10.3390/atmos14091371
Note that from the first issue of 2016, this journal uses article numbers instead of page numbers. See further details here.