Article

Research on Solid Oxide Fuel Cell System Model Building and 3D Testing Based on the Nodal Idea

1
Guangdong Energy Group Science and Technology Research Institute Co., Ltd., Guangzhou 511466, China
2
Key Laboratory of Image Processing and Intelligent Control of Education Ministry, School of Artificial Intelligence and Automation, Huazhong University of Science and Technology, Wuhan 430074, China
3
Guangdong Energy Group Co., Ltd., Guangzhou 510630, China
4
Guangdong Huizhou Lng Power Co., Ltd., Huizhou 516081, China
*
Author to whom correspondence should be addressed.
These authors contributed equally to this work.
Atmosphere 2023, 14(8), 1261; https://doi.org/10.3390/atmos14081261
Submission received: 14 July 2023 / Revised: 3 August 2023 / Accepted: 4 August 2023 / Published: 8 August 2023
(This article belongs to the Special Issue Recent Developments in Carbon Emissions Reduction Approaches)

Abstract

:
The Solid Oxide Fuel Cell (SOFC) system is a highly intricate system characterized by multiple variables and couplings. Developing an accurate model for the SOFC independent power generation system is of paramount importance. Conducting experimental studies on the SOFC system is costly, and it carries certain risks due to the requirements for pure hydrogen, high-temperature environments, and other factors. To address these challenges, a high-performing model that precisely reflects the inherent characteristics of the SOFC is essential for dynamic static analysis and the identification of optimal operating points. This paper presents a SOFC system model based on current controls, which was implemented in the MATLAB/Simulink environment, and it utilized a nodal approach for modeling. The model incorporated a cold air bypass, which enabled the more precise control of the SOFC reactor’s inlet and outlet temperatures. Furthermore, a 3D test and verification method are proposed in order to focus on the influence of input parameters on the four electrical characteristics, and four thermal characteristics, of output parameters. By conducting one-dimensional, two-dimensional, and three-dimensional studies of these output parameters, a more intuitive understanding of the system’s response to changes in input parameters was obtained. Under conditions wherein all other variables were kept constant, the entire system attained its maximum efficiency at approximately FU = 0.8, BP = 0, and AR = 6. The outcomes of this study have significant implications for exploring the optimal operating point in the SOFC independent power generation system in an in-depth manner. It provides valuable insights for enhancing the system’s efficiency and performance.

1. Introduction

The energy crisis has emerged as a crucial and extensively discussed global issue in the 21st century. Since the advent of the Third Industrial Revolution, human society has witnessed a continuous expansion of technological inventions, and the proliferation of production tools. Consequently, the exploitation and utilization of fossil resources, such as coal, oil, and natural gas, have gained significant attention. These readily available and cost-effective sources of energy have become vital for modernizing societies worldwide. As industrialization progresses, the demand for energy has surged. Currently, fossil energy contributes to more than 80% of global energy consumption, with oil accounting for approximately 35%, followed by coal at about 23%, and natural gas at approximately 21% [1]. However, the excessive exploitation of fossil fuels has led to environmental pollution and concerns regarding energy surplus reserves, prompting extensive research and the development of new energy sources [2]. Renewable energy has emerged as a promising alternative to traditional non-renewable sources, and thus, it has received significant attention in research. Among the new energy technologies, fuel cell technology stands out as one of the most prominent and promising options in recent years. Fuel cells, as an efficient and low-emission energy conversion technology, have drawn widespread attention, and it has been the focus of several research projects. For instance, solid oxide fuel cells utilize solid oxide as an electrolyte which directly converts hydrogen and oxygen into electricity; then, heat is produced under high-temperatures. Compared with traditional combustion power generation, fuel cells not only significantly reduce greenhouse gas emissions, thus mitigating climate change, but they also possess a high degree of energy efficiency, holding potential for revolutionary advancements in the energy industry. Amid the global focus on environmental protection and energy crises, fuel cell research and its application have become crucial [3]. They not only explore cleaner, more efficient, and sustainable energy solutions to address environmental challenges, but they also present an opportunity for the energy industry to usher in a greener, environmentally-friendly future, thus contributing positively to humanity’s sustainable development.

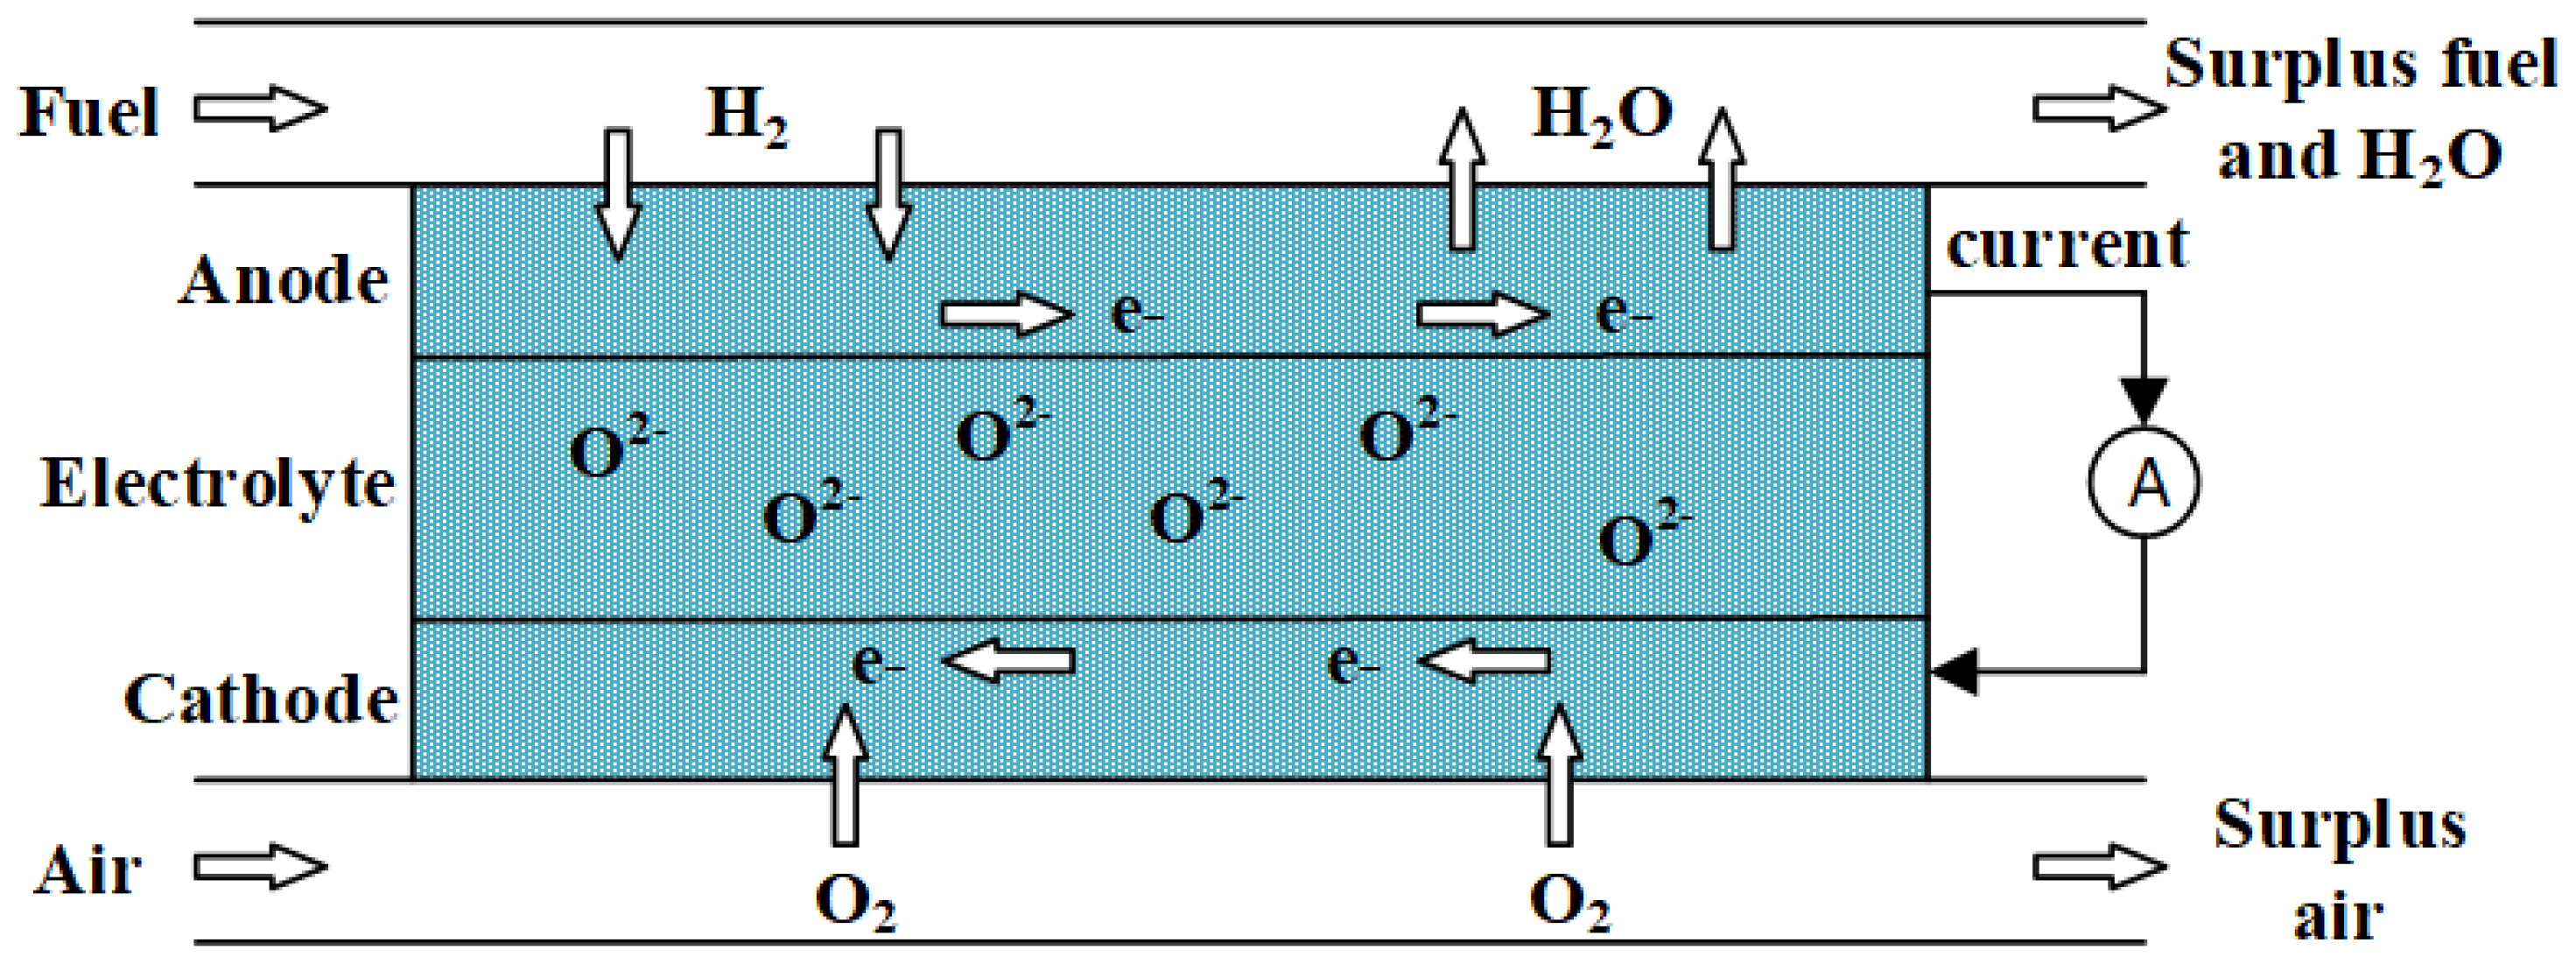
1.1. SOFC Power Generation Principle and Characteristics

Fuel cells were initially proposed by scientist William Grove in 1839, and significant progress has been achieved since Bacon’s pioneering work in the 1950s. The fundamental principle of Solid Oxide Fuel Cells (SOFCs) is a straightforward electrochemical reaction between hydrogen and oxygen within the SOFC reactor. The reaction replaces traditional hydrogen and oxygen combustion with the generation of electric energy instead of heat energy [4]. However, a challenge arises due to the considerable distance between the electrodes and the limited gas contact area, leading to a hindered current flow. To address this, the electrode structure is typically designed to be porous, maximizing the contact area between the fuel gas, electrode material, and electrolyte. Figure 1 illustrates the Solid Oxide Fuel Cell, developed by Huazhong University of Science and Technology. This solid oxide fuel cell has a length of 1.32 m, a width of 0.68 m, a height of 1.65 m, and it can provide an output power of 5 kW.
In terms of its structure, the Solid Oxide Fuel Cell (SOFC) shares similarities with other fuel cells, comprising cathodes, anodes, and an electrolyte, as depicted in Figure 2. The operational principle involves feeding pure hydrogen to the anode side and air to the cathode side, employing calcium oxide as the electrolyte. SOFCs operate at elevated temperatures (around 800–1000 K). On the anode’s side, hydrogen is adsorbed onto the catalyst’s surface and it loses its electrons, becoming hydrogen ions. These hydrogen ions, in turn, travel through an external circuit to the cathode, generating an electric current. Moreover, on the cathode’s side, oxygen from the air combines with electrons at the porous cathode interface, forming oxygen ions. These oxygen ions cross the electrolyte layer, eventually combining with hydrogen ions on the anode’s side to produce water. By continuously supplying fuel and air to the reactor, this electrochemical reaction can sustainably produce a direct current, effectively supplying power to external loads.
Currently, the primary drawback of Solid Oxide Fuel Cells (SOFC) lies in their high cost. However, SOFC self-contained power systems offer numerous advantages. Firstly, the fundamental principle of SOFC is straightforward, involving an electrochemical process between hydrogen and oxygen. Additionally, SOFC systems demonstrate high efficiency, making them suitable for both small-scale power supplies and large commercial institutions.
Moreover, SOFCs operate with low noise levels, typically ranging from 30 to 60 decibels, depending on factors such as size, design, operating conditions, and additional equipment configuration. This characteristic makes them especially convenient for deployment in densely populated areas and urban settings. As they are electrochemical devices, SOFCs do not rely on mechanical movements or vibrating components, resulting in a stable operation without noticeable mechanical vibrations.
SOFCs also offer the advantage of being environmentally friendly, a crucial aspect given the global focus on environmental protection. The reaction between hydrogen and oxygen in SOFCs only produces pure water, making them particularly appealing for applications in automobiles. By utilizing SOFCs in vehicles, the adverse impact of exhaust emissions on the urban environment and climate can be significantly reduced.

1.2. SOFC Modeling at Home and Abroad

In pursuit of continuous improvement in the production of SOFC system materials, establishing a high-precision mathematical model holds paramount importance for accurately depicting the dynamic and static performance of the SOFC system. Such a model is crucial for conducting in-depth research, designing, and optimizing the performance of SOFCs. Significant progress has been made in modeling SOFC systems to date. For instance, D. McLarty et al. constructed an SOFC model with the assumption that the inlet comprised hydrogen and water [5]. On the other hand, Gemmen et al. considered more complex fuel components at the inlet, such as methane, ethanol, and natural gas. They also took into account the generation of hydrogen through external or internal reforming with regard to the reactor’s reaction [6,7]. Additionally, Achenbach developed a three-dimensional flat SOFC temperature model to study the temperature distribution. This model focused on the heat convection exchange between battery and fuel gas, while also considering the heat released via the electrochemical reaction inside the SOFC [8]. More comprehensive models have been developed, such as the SOFC models, ranging from 1D to 3D models, as noted by Hofmann et al. [9]. Their research focused on the application of new materials to SOFC through the 1D model, the differences between forward and reverse airflow using the 2D model, and the impact of cross airways on SOFC characteristics using the 3D model. Campanari and Koyama et al. adopted a multi-node approach by dividing the SOFC into several fixed nodes, using the same flow plate, in the direction of the gas flow. This allowed for a detailed analysis of the changes occurring in each physical quantity within the single cell sheet during construction [10,11]. In P. Iora’s model, dynamic equations of mass conservation, energy conservation, and mole fraction conservation laws were employed to construct the reactor model. These dynamic equations were approximated as quasi-static forms [12]. Some researchers have specifically targeted the Auxiliary Power Unit (APU) application of SOFCs. For instance, Petruzzi et al. primarily focused on establishing an SOFC system model for APU application, although their model did not include a fuel processor and gas supply pipeline [13]. Keegan et al. developed a flat SOFC model in the MATLAB/Simulink environment to study the application of automatic APU systems. Although they analyzed the system’s performance, their investigation into the dynamic and static performance of the system was not extensive [14]. In addition to modeling the SOFC stack, researchers have also focused on modeling peripheral auxiliary components, such as gas supply lines, blowers, mass flowmeters, and reformers. Murshed et al. conducted research on a flat SOFC model that included peripheral auxiliary equipment like blowers, reformers, combustion chambers, and heat exchangers [15]. Adhikari et al. constructed a model encompassing peripheral auxiliary equipment like heat exchangers, combustors, blowers, and fuel reformers; they also installed a super capacitor to model electrical management [16]. Mueller et al.’s SOFC model primarily comprises a core reactor, combustor, two heat exchangers, and a controller. They also explored the fuel flow control model based on external load power [17].

2. SOFC Model Building

To conduct comprehensive and in-depth research on the SOFC system, it is crucial to develop a detailed and rational model of the SOFC’s independent power generation system. Such a model should accurately represent the inherent characteristics of the SOFC system, allowing for analysis of output voltage, heat exchanger temperature, and combustion chamber temperature control; this will form the basis for analyzing the system’s dynamic and static performance [18]. Given the high cost and certain experimental risks associated with domestic SOFC system experiments, simulation experiments based on an accurate and realistic model comprise a valuable research method. Monitoring and controlling the working temperature of the reactor are essential. Although controlling the input of cold air is a common approach for regulating the temperature of the reactor in SOFC systems, achieving precise control over the maximum reaction temperature and maximum temperature gradient, solely by adjusting the input of cold air, is challenging. To address this, the model proposed in this paper introduces a parallel main air inlet, along with a traditional bypass air line. The bypass air pipe incorporates an internal flow valve, and the inlet temperature is jointly controlled by the main air pipe and the bypass air pipe, significantly enhancing the accuracy of temperature control in the fuel cell stack [19]. An existing model forms the basis of this study, and in the simulation environment provided by MATLAB/Simulink, a 5 kW solid oxide fuel cell system model is developed. The model takes into account the conservation of mass, energy, mole fraction, heat conduction, and heat radiation, in accordance with relevant physical laws.

2.1. SOFC System Composition

The peripheral auxiliary subsystem, also known as the Balance of Plant (BOP) system, is an indispensable component of the SOFC system. This paper focuses on an investigation of an improved SOFC independent power generation system, as illustrated in Figure 3. The system comprises essential elements such as the combustion chamber, heat exchanger, blower, shunt, mixer, gas transmission pipeline, tail gas treatment system, water tank, and electronic control unit. This well-designed SOFC system structure offers several advantages, including simple configuration, ease of implementation, high energy utilization, and seamless integration during production. The incorporation of this design allows for better monitoring and control of system parameters like flow rate, temperature, and pressure, significantly enhancing the overall energy recovery rate of the entire system [20].
The system comprises five main subsystems, as follows: the power reactor subsystem, the fuel supply subsystem, the air supply subsystem, the electronic control subsystem, and the exhaust gas recovery subsystem. In the fuel supply subsystem, pure hydrogen gas is introduced to provide sufficient fuel for the core reactor’s electrochemical reactions. The reactor subsystem’s primary function is to convert chemical energy into electrical energy through electrochemical reactions between hydrogen and oxygen from the air, supplying power to external loads. The air supply subsystem plays a crucial role in providing the SOFC reactor with the necessary oxygen for electrochemical reactions while also regulating the reactor’s operating temperature [21]. Moreover, the electronic control subsystem is responsible for adjusting the reactor’s power output to meet external power demand and the internal power needs of the SOFC system. The voltage and current output from the reactor undergo a transformation through rectifiers, voltage regulators, and boost converters, which provide the power supply for the electrical equipment. As for the exhaust gas recovery subsystem, it consists of components such as a combustion chamber, hydrogen heat exchanger, air heat exchanger, water tank, and exhaust gas treatment system. In addition to heating fuel and air, this subsystem utilizes waste heat to warm water in the tank; this can be produced daily and used in everyday life. The exhaust gas recovery subsystem significantly enhances the energy recovery utilization rate of the entire SOFC system [22].

2.2. Modeling Methods and Processes

Due to the complex and robust nature of the SOFC independent power generation system, a MATLAB/Simulink simulation environment was employed to establish individual sub-component models such as the reaction reactor, combustion chamber, heat exchanger, blower, and so on. These sub-models are then integrated to form a dynamic model of the entire SOFC system. The state variable signal transmission between each sub-component module is consistent with the real SOFC independent power generation system, and each sub-model operates independently, allowing for easy additions, deletions, and modifications. In terms of material properties, each subsystem in the SOFC system is composed of basic solid and fluid materials. For solid substances, which lack fluidity and mixing, the primary focus of modeling is on their temperature characteristics. On the other hand, fluid substances require consideration of temperature characteristics as well as fluid flow rate, volume fraction, total number of moles, and mole fraction when developing the models [23]. In this paper, the nodal approach is primarily employed to construct the model for each subsystem. The method involves dividing a device, such as a heat exchanger, into N nodes along the direction of gas flow, as depicted in Figure 4. For this study, we adopted five nodes, but the number of nodes can be reasonably adjusted based on the specific modeling requirements. In theory, there is no limit to the number of nodes that can be used. Each node is further divided into a solid control unit and a fluid control unit based on material properties. These two units are the fundamental components that directly contribute to the general model using conservation laws, such as the energy conservation law and mass conservation law [19]. Employing this node division method reduces the complexity and difficulty associated with modeling the SOFC system.

2.2.1. General Model Equation

Regarding the control units (solid and fluid) considered for the model in this paper, the following assumptions are made [24]:
(1)
All the gases involved meet the ideal gas equation of state.
(2)
All characteristic parameters of the gas are uniformly distributed during gas flow.
(3)
The SOFC system is absolutely independent and sealed, and there is no heat transfer with the external environment.
(4)
There is no material accumulation and precipitation in the reactor, combustion chamber, or other devices.
(5)
The SOFC has a 100% current efficiency rate.
(6)
The hysteresis characteristics of the gas in each gas supply pipeline are replaced with an inertia link and a delay link.
Solid control unit.
When modeling the solid control unit, we solely focused on its temperature characteristics. The temperature model used for the solid control unit is expressed, as follows [25]:
ρ s V s C s d T d t = Q ˙ i n
V s is the volume, C s is the specific heat capacity, T is the temperature, ρ s is the density, and Q ˙ i n is the heat transfer energy of this component and other components adjacent to it. In this model, two cases are considered. The first case involves heat transfer energy between two adjacent solids, which is calculated based on Fourier’s law, as follows:
Q ˙ = k s s · S a r e a · ( T 2 T 1 ) L
k s s is the heat transfer coefficient between solid matter and solid matter; S a r e a is the contact area between solid matter and solid matter; T 1 and T 2 are the temperatures of two control units, respectively; and L is the distance between them. Another scenario involves a fluid adjacent component. In this case, the heat transfer energy between the two can be calculated using the following formula:
Q ˙ i n = S a r e a · h g s · ( T 2 T 1 )
S a r e a is the heat transfer surface area, h g s is the heat transfer coefficient between the solid material and fluid material, T 1 and T 2 are the temperatures of the solid control unit and fluid control unit, respectively.
Fluid control unit.
In the fluid control unit, the temperature characteristics, velocity characteristics, and mole fraction characteristics are considered.
(1)
Temperature characteristics
In accordance with the relevant physical laws, we specified that there would be no thermal expansion of the liquid within the temperature range under consideration; hence, the thermometer of the fluid control unit is calculated, as follows [26]:
N C V d T d t = N ˙ i n h i n N ˙ o u t h o u t + Q ˙ i n
N is the quantity of the fluid substance, C V is the constant specific heat capacity of the fluid, T is the temperature of the fluid control unit, N ˙ i n and N ˙ o u t are the velocity of the fluid inflow and outflow, respectively, h i n and h o u t are the molar specific enthalpy of fluid inflow and outflow, and Q ˙ i n is the energy transfer between this unit and adjacent units, which can be calculated using Equation (3). The molar specific enthalpy of the fluid can be calculated, as follows:
h = X i h i , i { H 2 , O 2 , H 2 O , N 2 }
The molar ratio enthalpy of the component substance is the integral of C P , i T , as follows:
h i = h i , 298.15 + 298.15 T C P , i ( T ) d T , i { H 2 , O 2 , H 2 O , N 2 }
h i , 298.15 is the molar specific enthalpy of the component at a standard temperature of 298.15. In the SOFC’s independent power generation system model presented in this paper, the fluid primarily consists of four types of gases, as follows: hydrogen, oxygen, water vapor, and nitrogen. The fluid control unit typically involves a mixture of more than two gases. The formula for calculating the constant specific heat capacity of the fluid is as follows:
C V = X i C P , i ( T ) R , i { H 2 , O 2 , H 2 O , N 2 }
C P , i ( T ) is the molar specific heat capacity of the component substance at a constant pressure, and the empirical formula is as follows [27]:
C p , H 2 T = 56.505 22,222.6 T 0.75 + 116,500 T 1 560,700 T 1.5
C p , O 2 T = 37.432 2.0102 × 10 5 T 1.5 178,570 T 1.5 + 2,368,800 T 2
C p , H 2 O T = 143.05 58.04 T 0.25 + 8.2751 T 0.5 0.036989 T
C p , N 2 T = 30.6675 0.013 T + 3.308 × 10 5 T 2 2.32 × 10 8 T 3 + 5.6048 × 10 12 T 4
(2)
Velocity characteristics
In accordance with the pertinent laws, the outlet velocity of a fluid passing through a systemic component can be calculated, as follows:
N ˙ o u t = N ˙ i n + R i , i { H 2 , O 2 , H 2 O , N 2 }
R i is the molar reaction rate of a fluid material, N ˙ i n and N ˙ o u t are the velocities of fluid inflow and outflow, respectively.
(3)
Mole fraction properties
In accordance with the relevant conservation law, when the fluid flows normally, the mole fraction of its internal components has the following calculation relation:
N d X i d t = N ˙ i n X i , i n N ˙ o u t X i , o u t + R i , i { H 2 , O 2 , H 2 O , N 2 }
N is the amount of substance in the fluid. In accordance with the ideal gas equation of state, the following equation is given:
N = R T P V
P , V , and T are the pressure, volume and temperature of the fluid control unit, respectively, and R is the universal gas constants.

2.2.2. Model of Each System Component

The SOFC independent power generation system model established in this paper mainly includes the following subsystem models [28]:
(1)
Heat exchanger model
In this study, a convective heat exchanger is employed, wherein cold air flow and high-temperature air flow travel in opposite directions. Due to the significant temperature difference between these airflows, they undergo a heat exchange when passing through the metal pipeline. The heat exchange in the convective heat exchanger is purely physical, unlike the electric reactor and combustion chamber, where chemical reactions take place. Therefore, the gas in the heat exchanger only experiences temperature changes that affect pressure changes. To model the equivalent heat exchanger, it is divided into N nodes, and the heat exchanger model is constructed by connecting multiple nodes in series, in accordance with the airflow direction. The fluid temperature can be calculated using Equation (4), and the solid temperature can be calculated using Equation (1).
(2)
Reactor model
The reactor model is divided into N nodes in accordance with the finite element division method, and the reaction relation, mathematical formula, and parameter type involved in each node are the same. The N child nodes are connected in series to form the reactor model. Since there is hydrogen and oxygen in the reactor, an electrochemical reaction will occur, and this reaction is an exothermic reaction. The modified model is as follows:
ρ P E N V P E N C P E N d T P E N d t = Q ˙ i n , P E N + Q ˙ r e a c t W ˙ o u t
Q ˙ r e a c t is the total energy released during the electrochemical reaction, and the calculation formula is as follows:
Q ˙ r e a c t = R H 2 O · h H 2 O ( T )
R H 2 O is the formation rate of water vapor, which can be calculated, as follows:
R H 2 O = i · S n o d e 2 F
i is the current density flowing through the node, S n o d e is the area of the node, and F is the Faraday constant. In Equation (15), W ˙ o u t is the electric energy generated by the reactor, which is the output power of a single battery. The calculation formula is as follows [29]:
W ˙ o u t = i · S n o d e · V c e l l
V c e l l is the voltage at the node, which is the single cell voltage.
(3)
Combustion chamber model
During electrochemical reactions in the reactor, there is typically an excess of hydrogen and air injected. Consequently, the remaining hydrogen that is not consumed during the reaction in the reactor undergoes complete combustion in the combustion chamber. The high-temperature flue gas produced in the combustion chamber serves as the heat source for the heat exchanger. For analytical convenience, and to reduce computational complexity, it is assumed that there is no heat exchange between the components of the combustion chamber and the external environment [30]. The reaction rate of each substance in the combustion chamber can be calculated using the following formula:
R H 2 = 2 R O 2 = R H 2 O = X ˙ i n X H 2 , i n .
The molar flow rate of the combustor outlet gas can be calculated using the general Equation (12), the mole fraction can be calculated using the general Equation (13), and the temperature can be calculated using the general Equation (4).
(4)
Lag model of the gas supply system
The design of gas supply systems in SOFC power systems mainly includes the hydrogen supply system, air supply system, and bypass air supply system. When controlling the gas flow rate using a gas flow meter, the changes in gas flow are not instantaneous; rather, they exhibit a certain time delay. In accordance with the modeling approach discussed in this paper, the dynamic response process of the gas supply system is simplified as a first-order inertia link and a delay link to reduce computational complexity. Its transfer function is as follows:
G ( s ) = 1 T s + 1 e τ s
τ is the delay time, and T is the inertia time constant. In this study, the value of τ is set to 10 s, and the value of T is set to 0.5.

2.3. Integration of SOFC Models

After constructing the sub-models for the aforementioned system components, the dynamic model of the SOFC independent power generation system is assembled by interconnecting and encapsulating them in MATLAB/Simulink, following the structure illustrated in Figure 3. This model’s structure is relatively intricate, involving the encapsulation of numerous sub-modules. The reliability and accuracy of the mechanism model for each system component, which is based on various conservation laws, are directly dependent on the model’s parameters [31]. Regarding other characteristic parameters such as molar mass, density, pressure, the specific heat capacity of certain solids or gases, heat conductivity among different substances, and the activation energy of electrodes, these parameters are entirely determined by the properties of the substance types present in the sub-models of each system component. In this paper, reliable results from peer-reviewed sources are directly referenced for these parameter values [32]. The dimensions of each system component used in this model precisely match the corresponding component dimensions of the actual system. As a result, the characteristic parameters and geometric dimensions studied in this paper for each system component sub-model are accurate and reliable.
In order to further validate the SOFC stack, real-time experimental data were collected with the test bench temperature, which was maintained at 973 K and 923 K. In MATLAB, under identical experimental conditions, the constructed single cell model was simulated at the same time. A comparison and analysis of the experimental data and simulation data were conducted, resulting in the U-I-P characteristic curve shown in Figure 5.
From Figure 5, it can be observed that when the experimental conditions are identical to the simulation conditions, the output data collected from the experimental tests closely match the data collected under simulation conditions. Consequently, the solid oxide fuel cell system model constructed in this study is deemed to be accurate.

3. SOFC Performance Testing and Verification

3.1. SOFC Performance Indicators

This paper focuses on the investigation of three key performance indicators of SOFC, as follows: operating parameters, thermal output characteristics, and electrical output characteristics. Utilizing the model established earlier, the thermoelectric output characteristics of SOFC are the result of fine-tuning under various operating parameters. The SOFC system can achieve the real-time monitoring of the external load power demand by adjusting the fuel utilization. Additionally, regulating the temperature of the core stack can be accomplished by introducing excess air into the system. Moreover, the electricity in the stack temperature gradient can be further adjusted through the bypass valve. Various parameters can be adjusted to enhance the output efficiency of the system. As an independent power generation system, the SOFC system must primarily meet the electricity demand of external loads. Moreover, it is essential to ensure that the core reactor’s temperature remains within the rated value to ensure the system operates safely, stably, efficiently, and in an energy-saving manner.

3.1.1. Operation Parameters and Their Ranges

(1)
Fuel utilization rate ( F U ).
F U = R H 2 N ˙ H 2 = n I s 2 F N ˙ H 2 .
R H 2 is the hydrogen reaction rate, N ˙ H 2 is the hydrogen flow rate, n is the number of cells in the model, I s is the output current. The fuel utilization rate generally ranges between 0.6 and 0.9. As can be seen from the above formula, when the current output of the reactor is set as a fixed value, the fuel utilization rate is inversely proportional to the molar flow rate of hydrogen. When the fuel utilization rate is lower than 0.6, the molar flow rate of hydrogen is high and too much hydrogen is pumped into the reactor, resulting in an increase in power generation cost and a waste of fuel, which also leads to the low efficiency of the system. However, when the fuel utilization rate is higher than 0.9, less hydrogen is injected into it, which may easily lead to unstable electrical output or power generation failure [33].
(2)
Air excess ratio ( A R ).
A R = N ˙ O 2 R O 2 = 4 F X O 2 N ˙ a i r n I s .
N ˙ O 2 is the molar velocity of oxygen, R O 2 is the electrochemical reaction rate of oxygen, and the air excess ratio is equal to the ratio of the two. X O 2 is the mole fraction of oxygen in the air, N ˙ a i r is the air velocity at the outlet of the blower, and n , I s , and F have the same meanings as in Equation (21). The optimal range for the excess air ratio is typically between 6 to 12. When setting the stack as a fixed value, there exists a positive relationship between the output current, excess air ratio, and the molar flow rate of air. If the excess air ratio falls below six, the molar flow velocity of air is low, resulting in a lower intake of cold air into the stack. As a consequence, the electric reactor heats up slowly, which may lead to the stack temperature exceeding its rated value. On the other hand, if the excess air ratio exceeds 12, the molar velocity of air becomes very high, and an excessive amount of cold air enters the stack, leading to a rapid loss of temperature in the reactor. Consequently, the reactor may fail to reach the temperature required for normal electrochemical reactions.
(3)
Bypass valve opening ( B P ).
B P = N ˙ a i r , b y N ˙ a i r .
N ˙ a i r , b y is the air flow rate of the bypass subsystem, N ˙ a i r is the molar flow rate of the total air, the bypass valve opening is equal to the ratio of the two, the value of the bypass valve opening is generally 0.0–0.3, if the value of the bypass valve opening is higher than 0.3, this will result in a low reactor inlet air temperature, thus affecting the performance of the SOFC system.
(4)
Reactor current ( I s ):
The stack current is determined by the power demand of the load outside the SOFC system. For the 5 KW SOFC independent power generation system studied in this paper, the normal working reactor current range is generally 10–80 A.

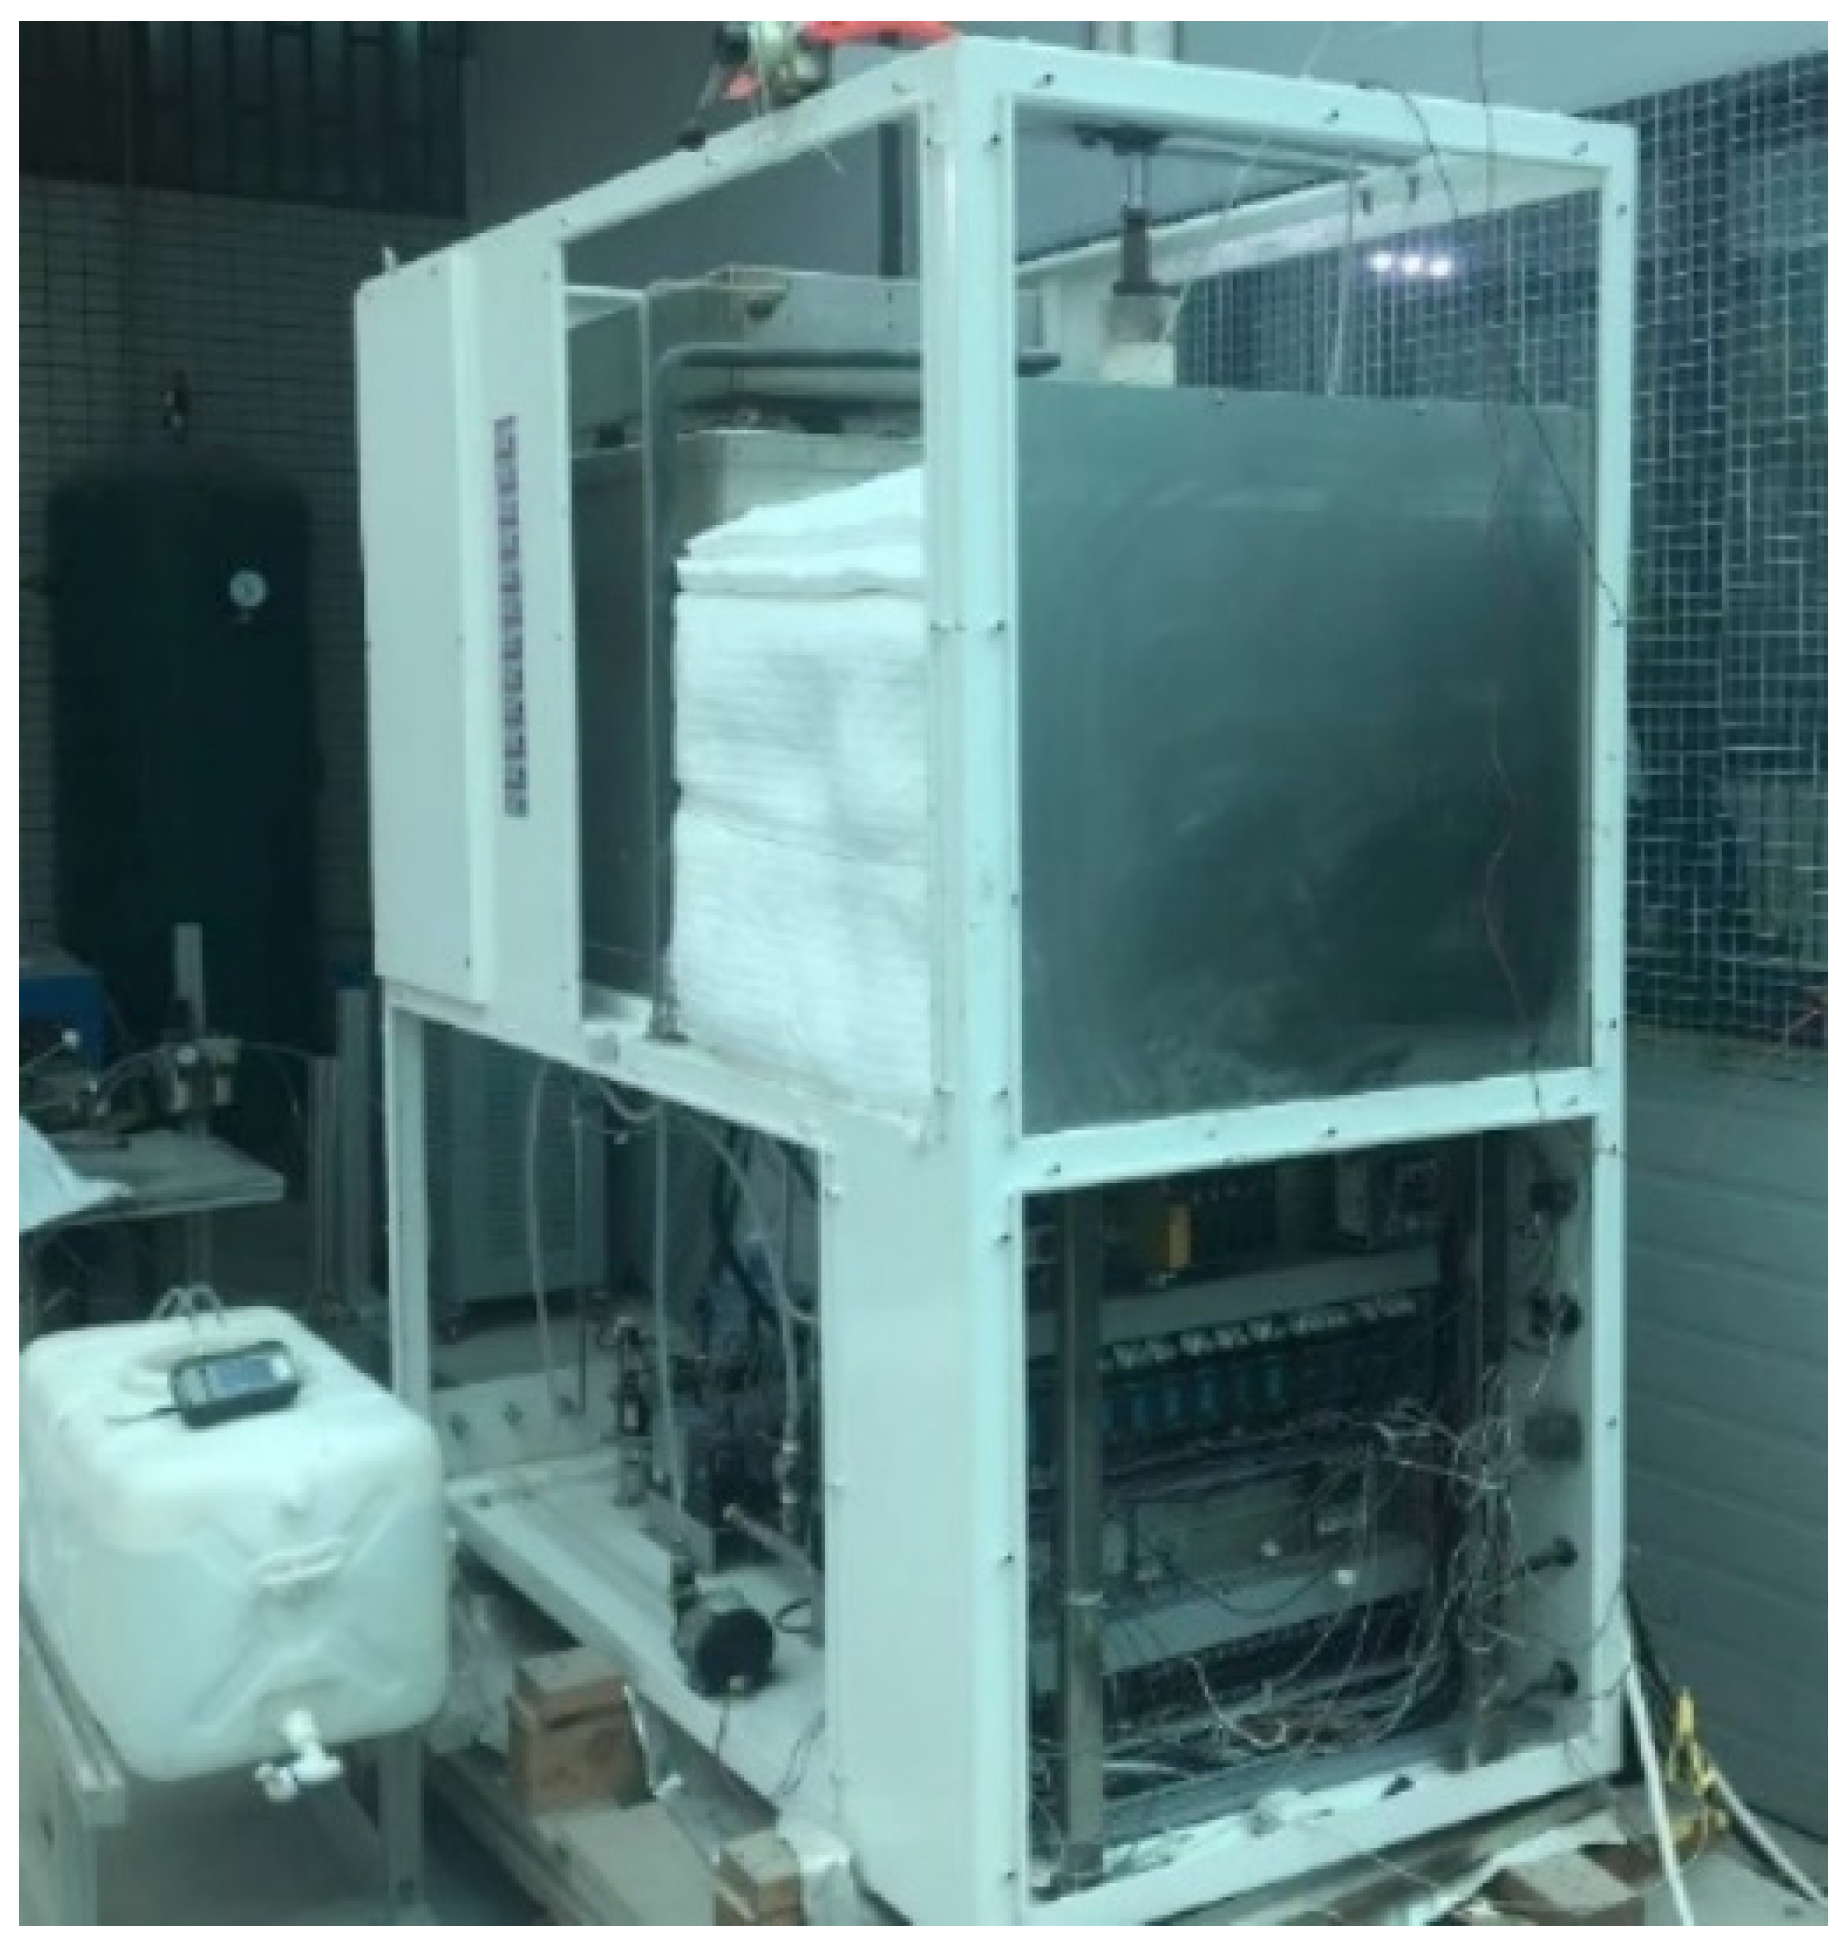
3.1.2. SOFC Static Performance Tests

Based on the model established in Section 2, the research on the performance of the SOFC system involves a significant number of charts and a large amount of data. Therefore, it is not convenient to display each one individually. Using different currents, since the influence trend of each input parameter of the SOFC system exhibits a consistent performance, we take I s = 60   A as an example for analysis. Under this current, we selected the condition of FU = 0.75 ,   AR = 9 ,   B P = 0.15 to analyze the operation of the SOFC independent power generation system for 30,000 s, as shown in the Figure 6.
Based on the analysis in Figure 6, it is observed that the temperature gradually increases from node 1 to node 5. At the same time, as the reactor operates normally, the rate of electric push heating gradually slows down and eventually stabilizes. This model’s behavior aligns with the actual situation.
Figure 7 presents the heat exchanger divided into five nodes along the direction of gas flow. Each node is further divided into gas control, cold air, cold fuel gas (exhaust), and solid control units (fuel pipes, air pipes, exhaust pipe), resulting in a total of six temperature indices. By gathering the temperature parameters of the five nodes in the heat exchanger, the variation in temperature over time is depicted, as follows.
Figure 7 illustrates a gradual increase in temperature from node 1 to node 5. The fuel temperature at node 1 is only 850 K, whereas at node 5, it reaches 1150 K, at approximately 880 degrees Celsius, which closely aligns with the actual behavior of an SOFC reactor at its normal reaction temperature. The temperature difference between the two parameters also diminishes as heat transfer deepens. Furthermore, Figure 7 presents the temperature representation of each parameter across the five nodes. It shows a similar transformation trend for each parameter, with a gradual increase from node 1 to node 5, eventually stabilizing at the SOFC reactor’s reaction temperature.

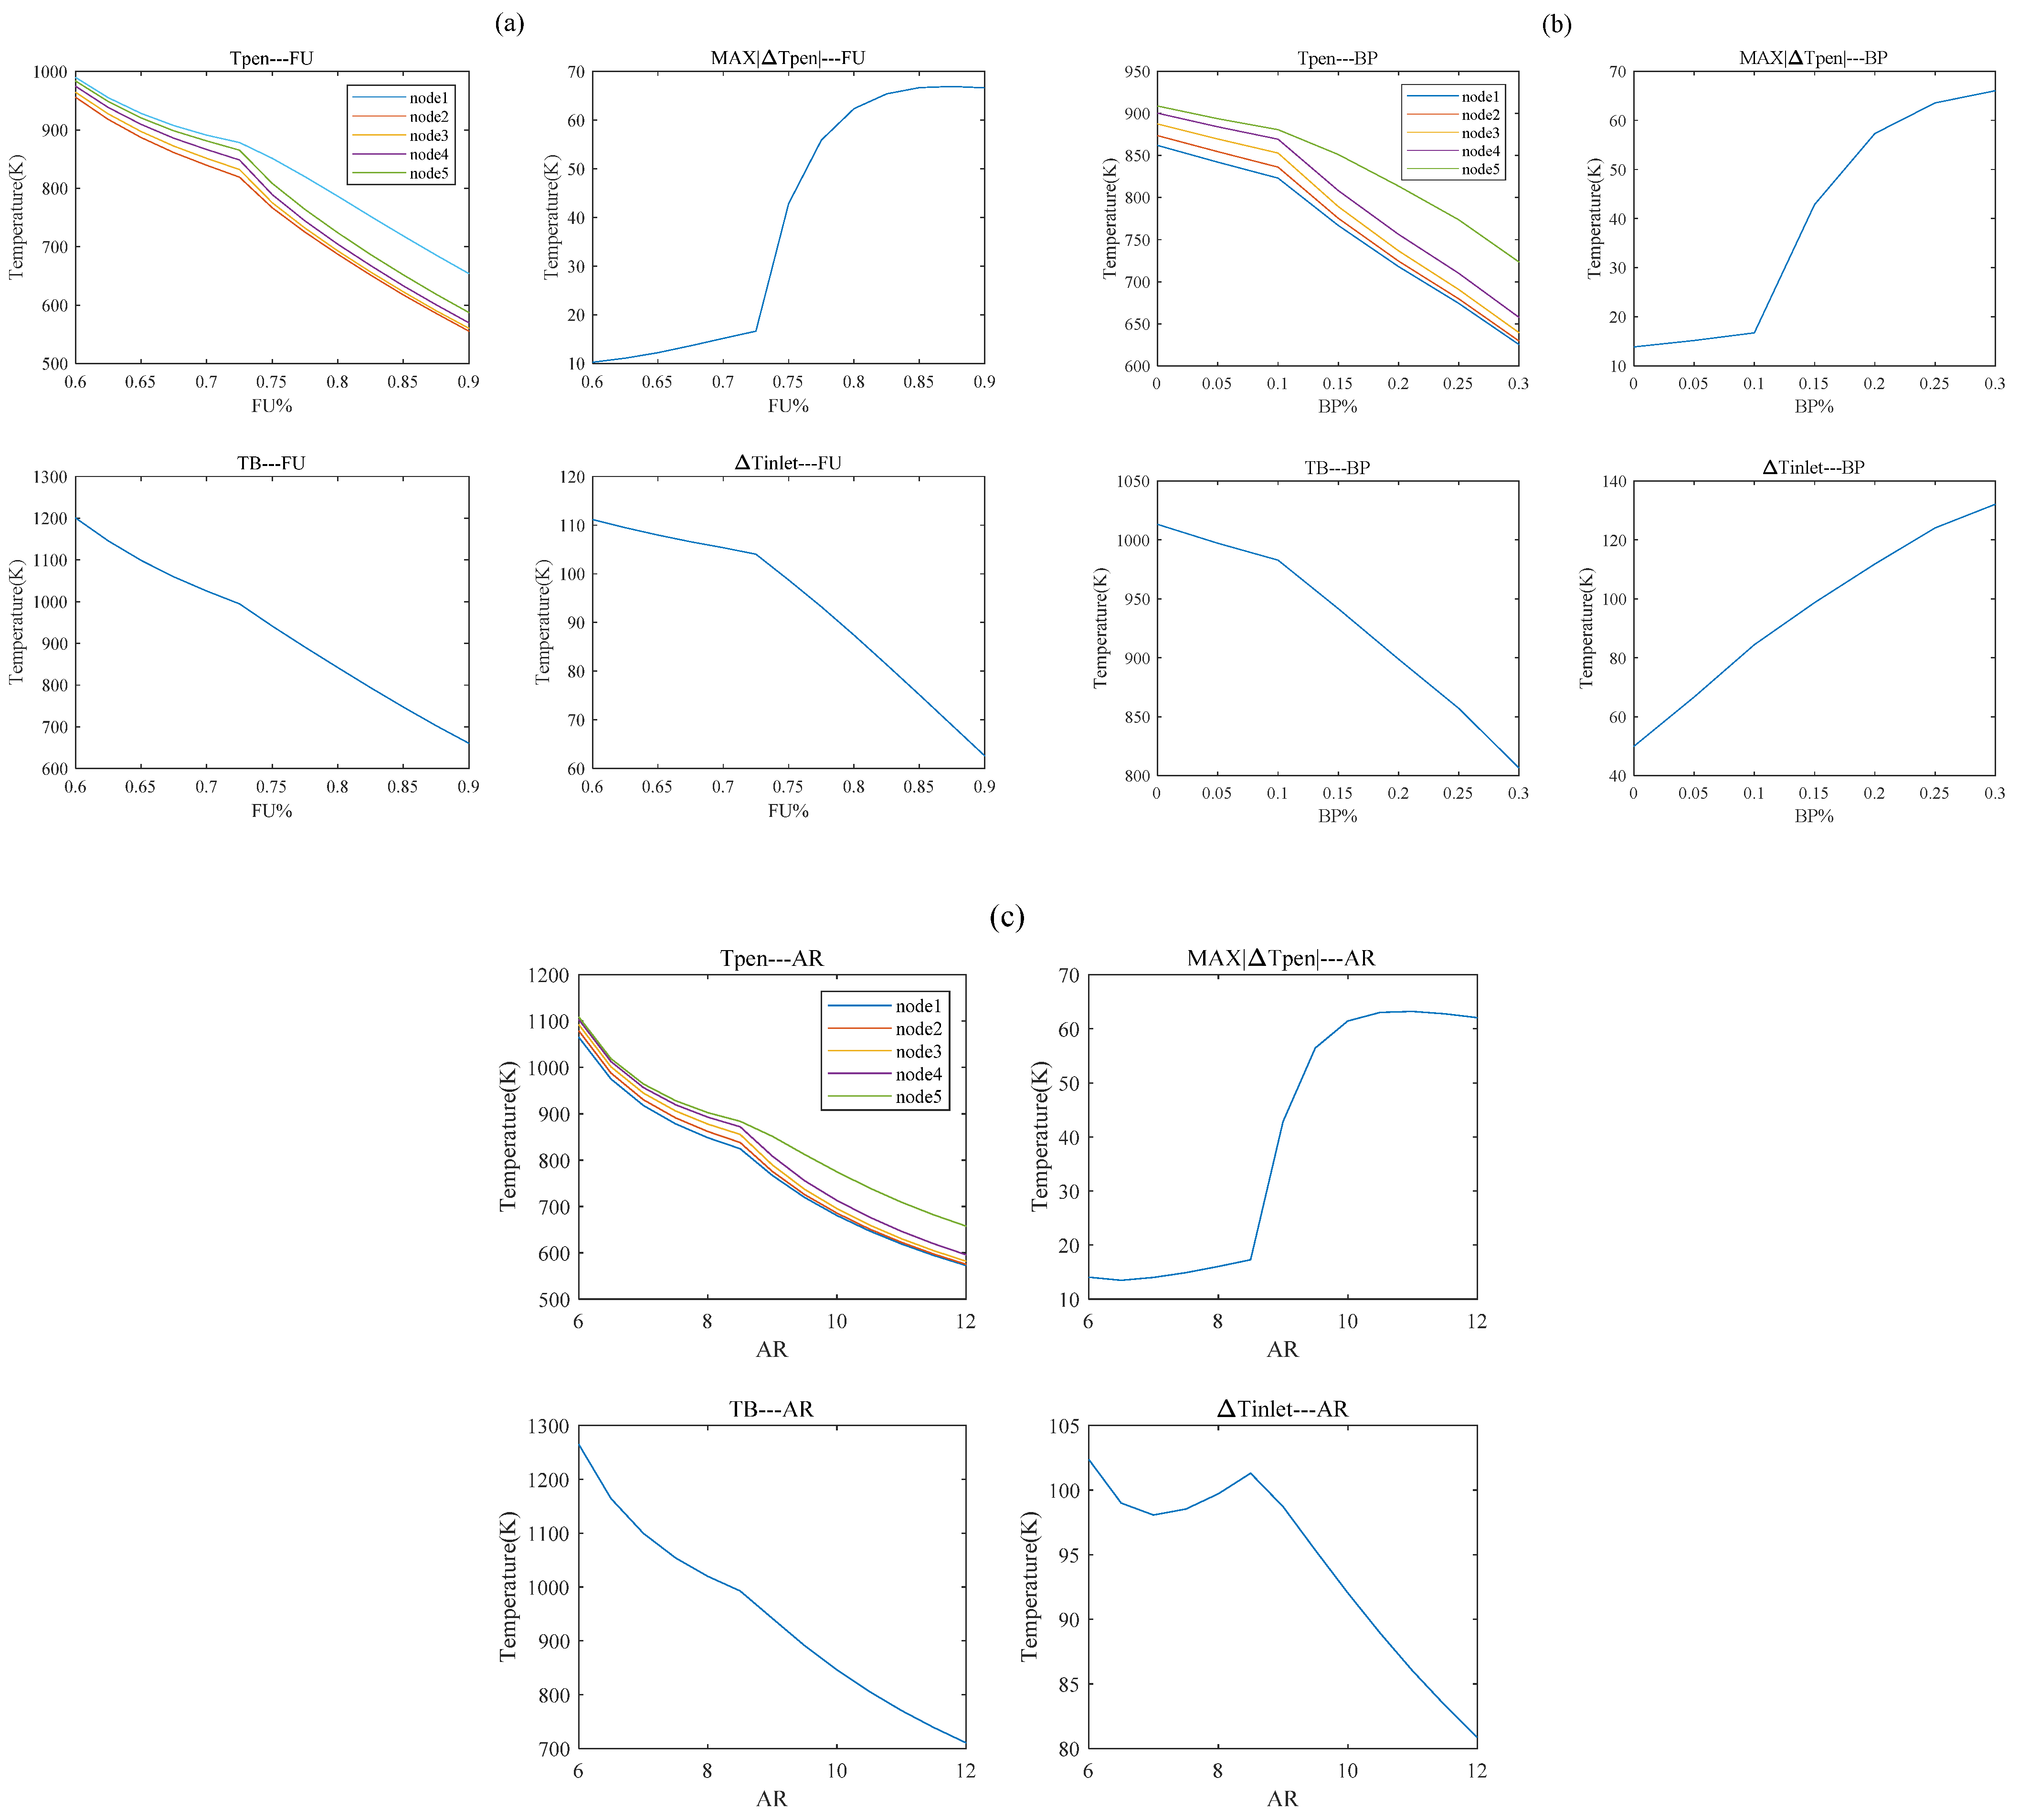
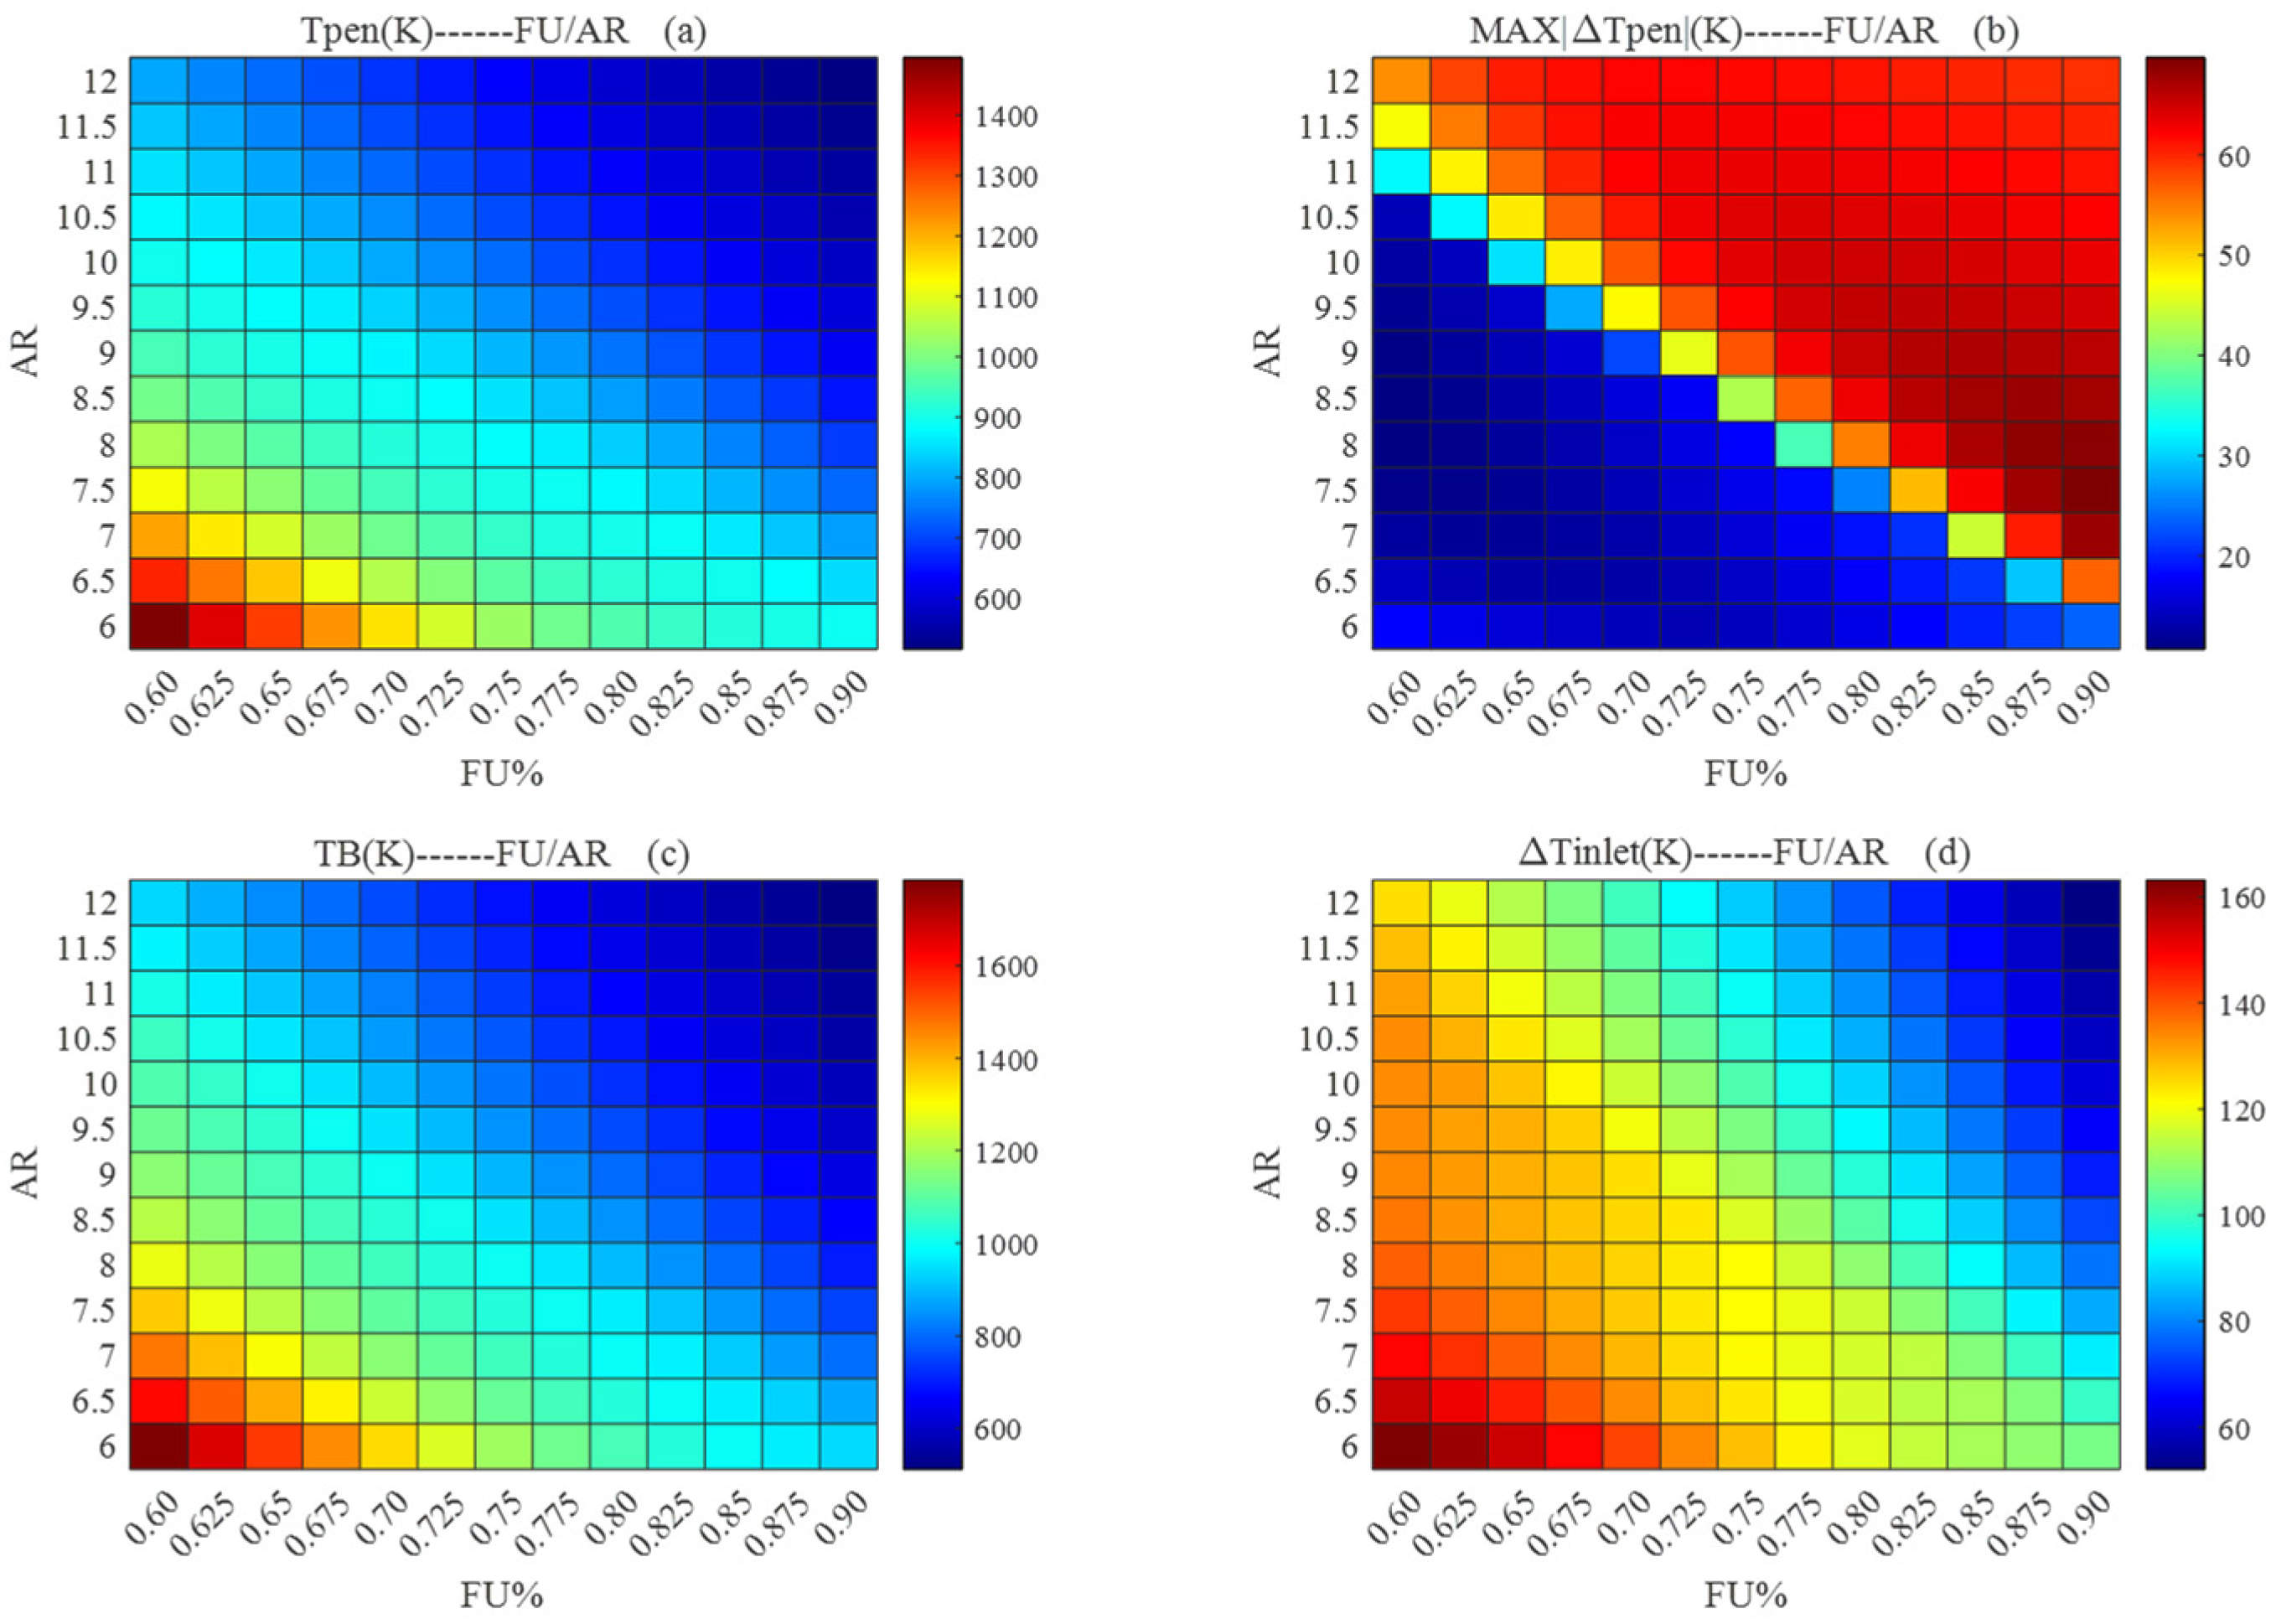
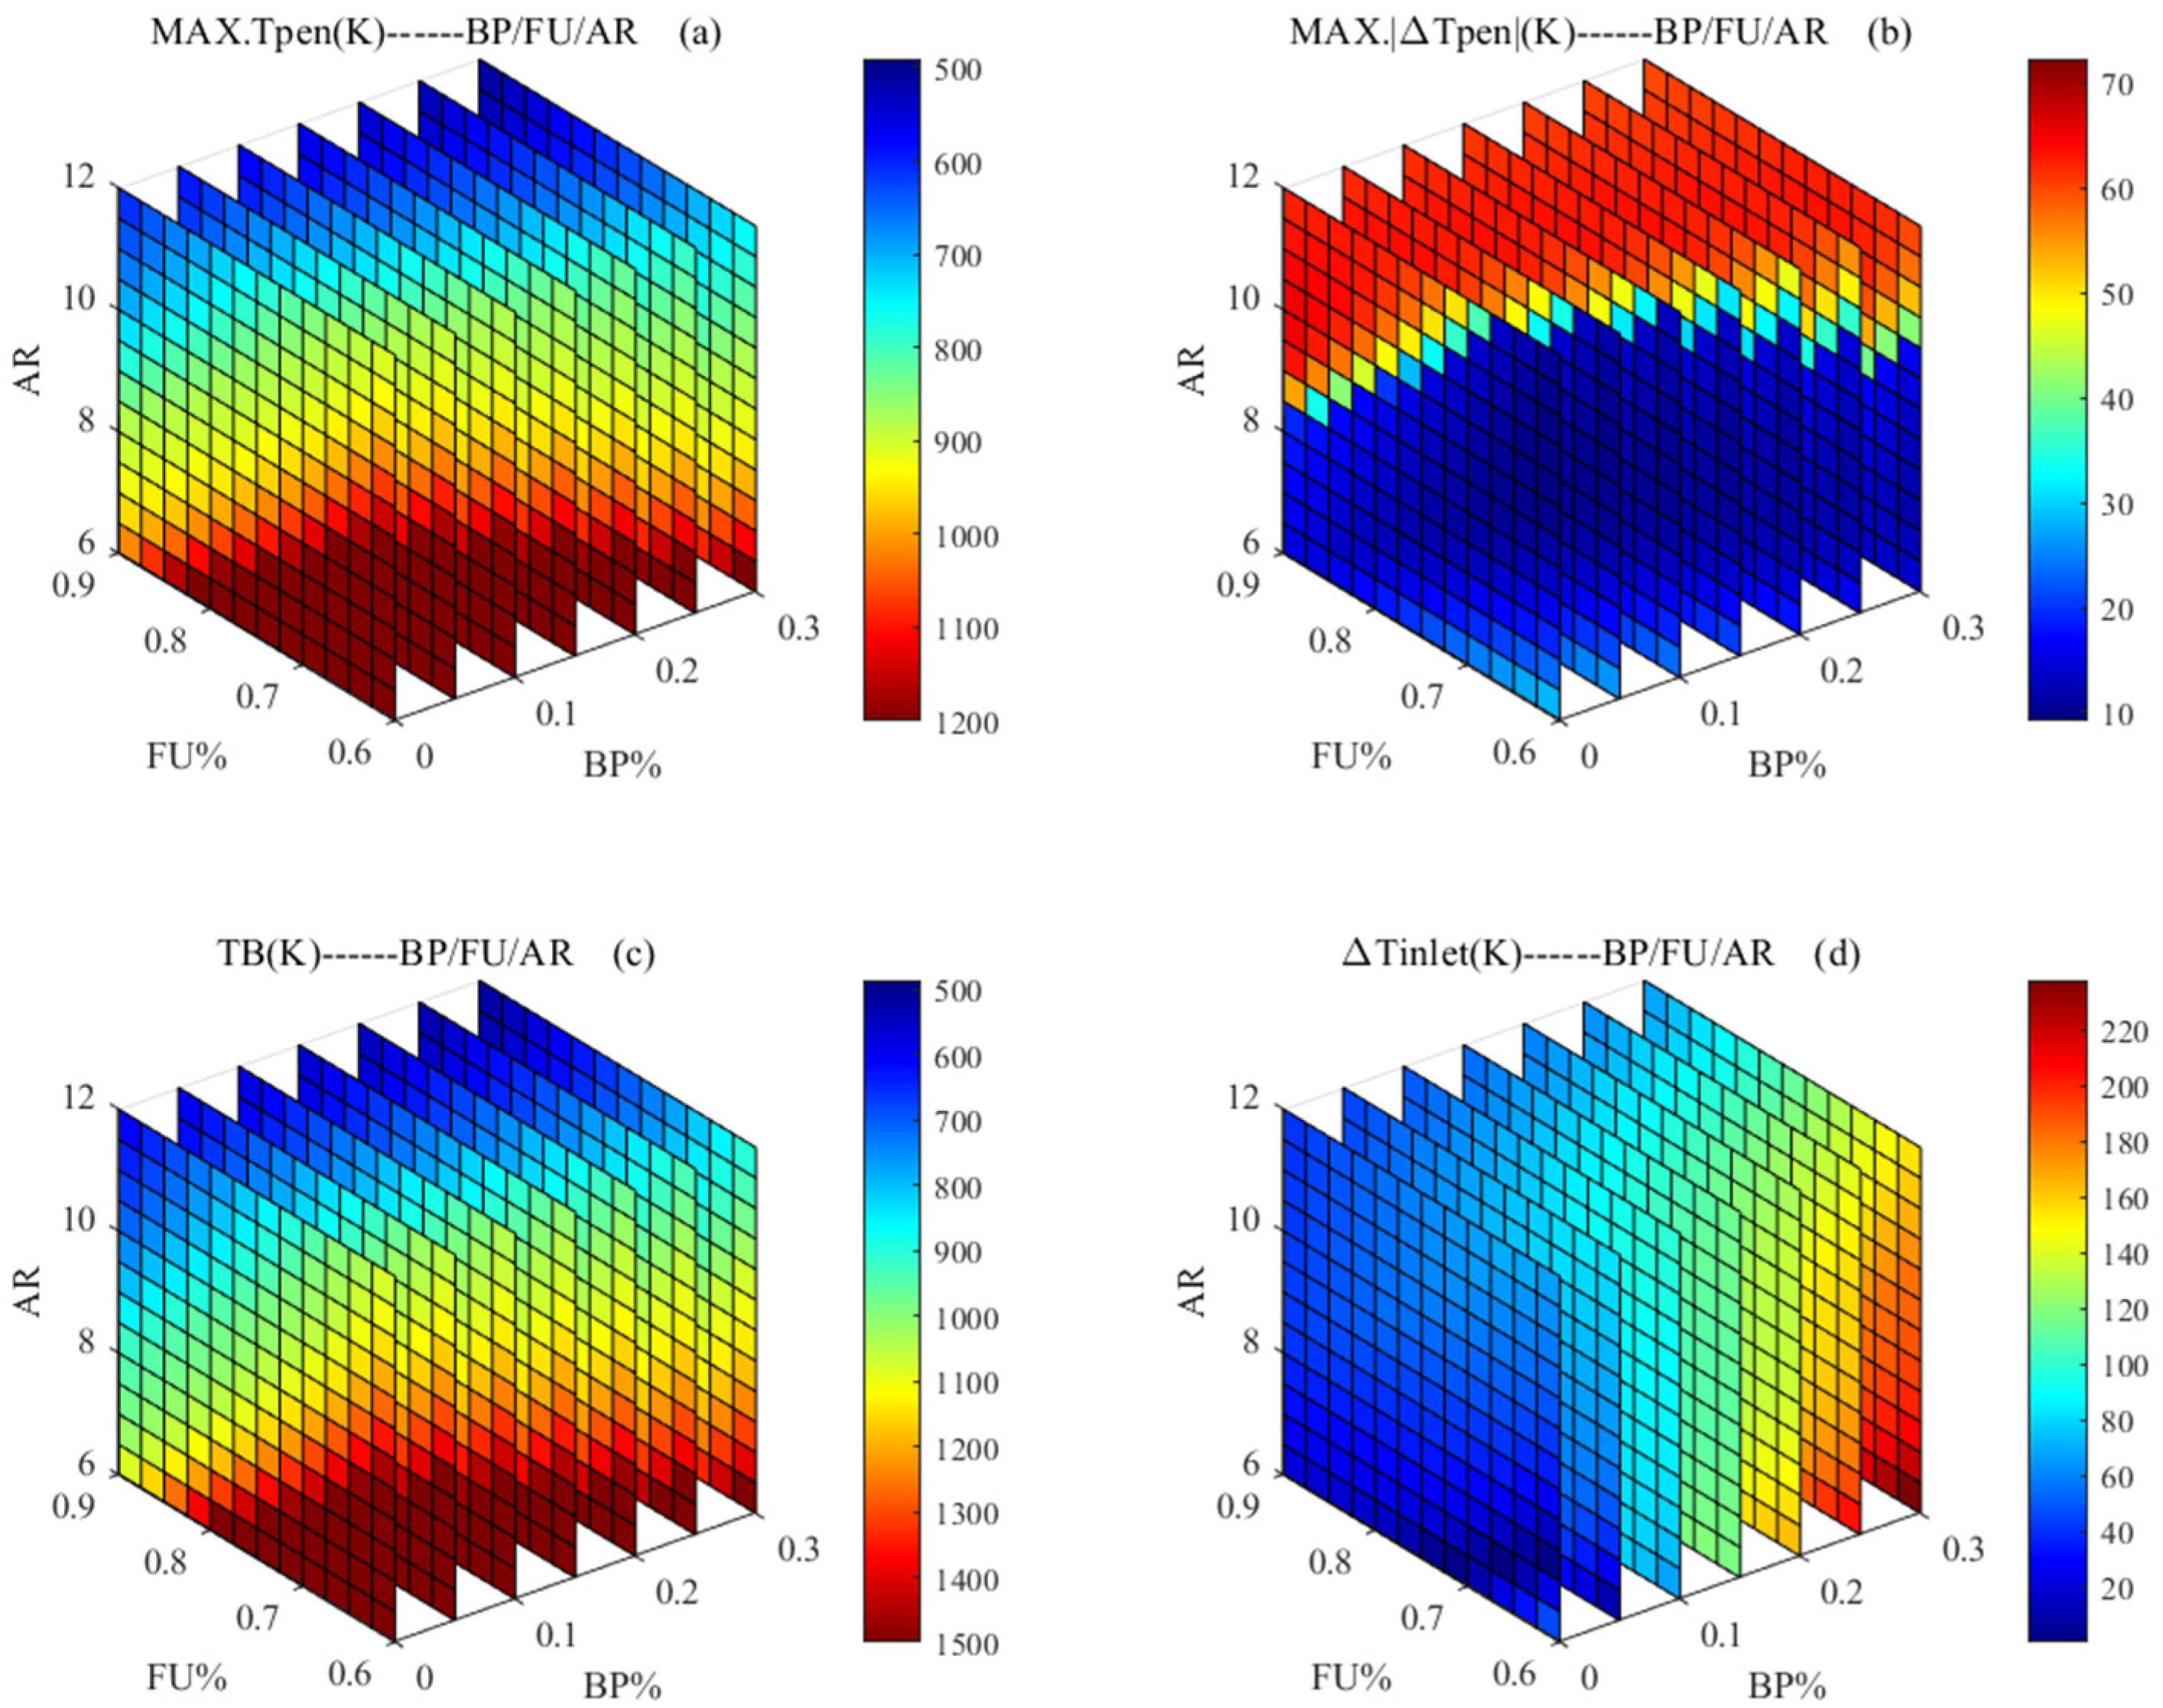
3.2. Thermal Output Characteristics and Their Ranges

The SOFC operates using electrochemical reactions at high temperatures. To ensure the absolute safety of the reactor, it is crucial to limit the highest temperature of the SOFC reactor within a specific working range. Additionally, the temperature gradient inside the reactor should not be too large, as excessive temperature gradients can lead to thermal stress and reactor damage. For the peripheral BOP system, the temperature difference between the hydrogen temperature and the air temperature at the inlet of the point reactor should also be controlled within certain limits, and the maximum temperature of the combustor must stay within the material’s maximum bearing range [34]. It is evident that temperature safety and control are fundamental prerequisites for the smooth operation of the entire SOFC stack. Taking the above considerations into account, this paper defines and sets four thermal characteristic parameters in the system, with their respective value ranges, as follows.

3.2.1. Thermal Output Characteristic Parameters

(1)
Maximum operating temperature of PEN( M a x . T P E N ).
M a x . T P E N = max { T P E N ( i ) } , { i = 1,2 , , N 1 } .
In the process of building the SOFC single cell model, it is divided into N nodes. The maximum working temperature of the PEN(Positive-Electrolyte-Negative) is the maximum temperature of all nodes, and the value range of the maximum working temperature of PEN is M a x . T P E N 1173   K , which was the maximum temperature of the reactor material obtained through the experiment.
(2)
Maximum operating temperature gradient of PEN( M a x . | Δ T P E N | ).
M a x . | Δ T P E N | = max | T P E N ( i + 1 ) T P E N ( i ) | , { i = 1,2 , , N 1 } .
The maximum operating temperature gradient of the PEN is the maximum temperature gradient in the battery. The SOFC independent power generation system generally requires M a x . Δ T P E N 8   K c m 1 . This value is set using the ultimate tension method and mechanical strength estimation, which concerns material safety.
(3)
Gas temperature difference at the reactor inlet ( Δ T i n l e t ):
Δ T i n l e t = max | T H E , f u e l T H E , a i r | .
The inlet gas difference between the anode and cathode of the reactor is defined as the inlet temperature difference of the reactor, which is also equal to the difference between the outlet gas temperature of the hydrogen heat exchanger and that of the air heat exchanger. The range of gas temperatures at the inlet of the reactor is Δ T i n l e t 200   K , which was verified by the experimental conditions.
(4)
Combustion chamber temperature ( T B ).
The combustor temperature can be calculated using the temperature model in Equation (1), which concerns the solid control unit set up in Section 2, and its value range is 870   K T B 1270   K ; 1270   K is the maximum temperature that the combustor material can bear.

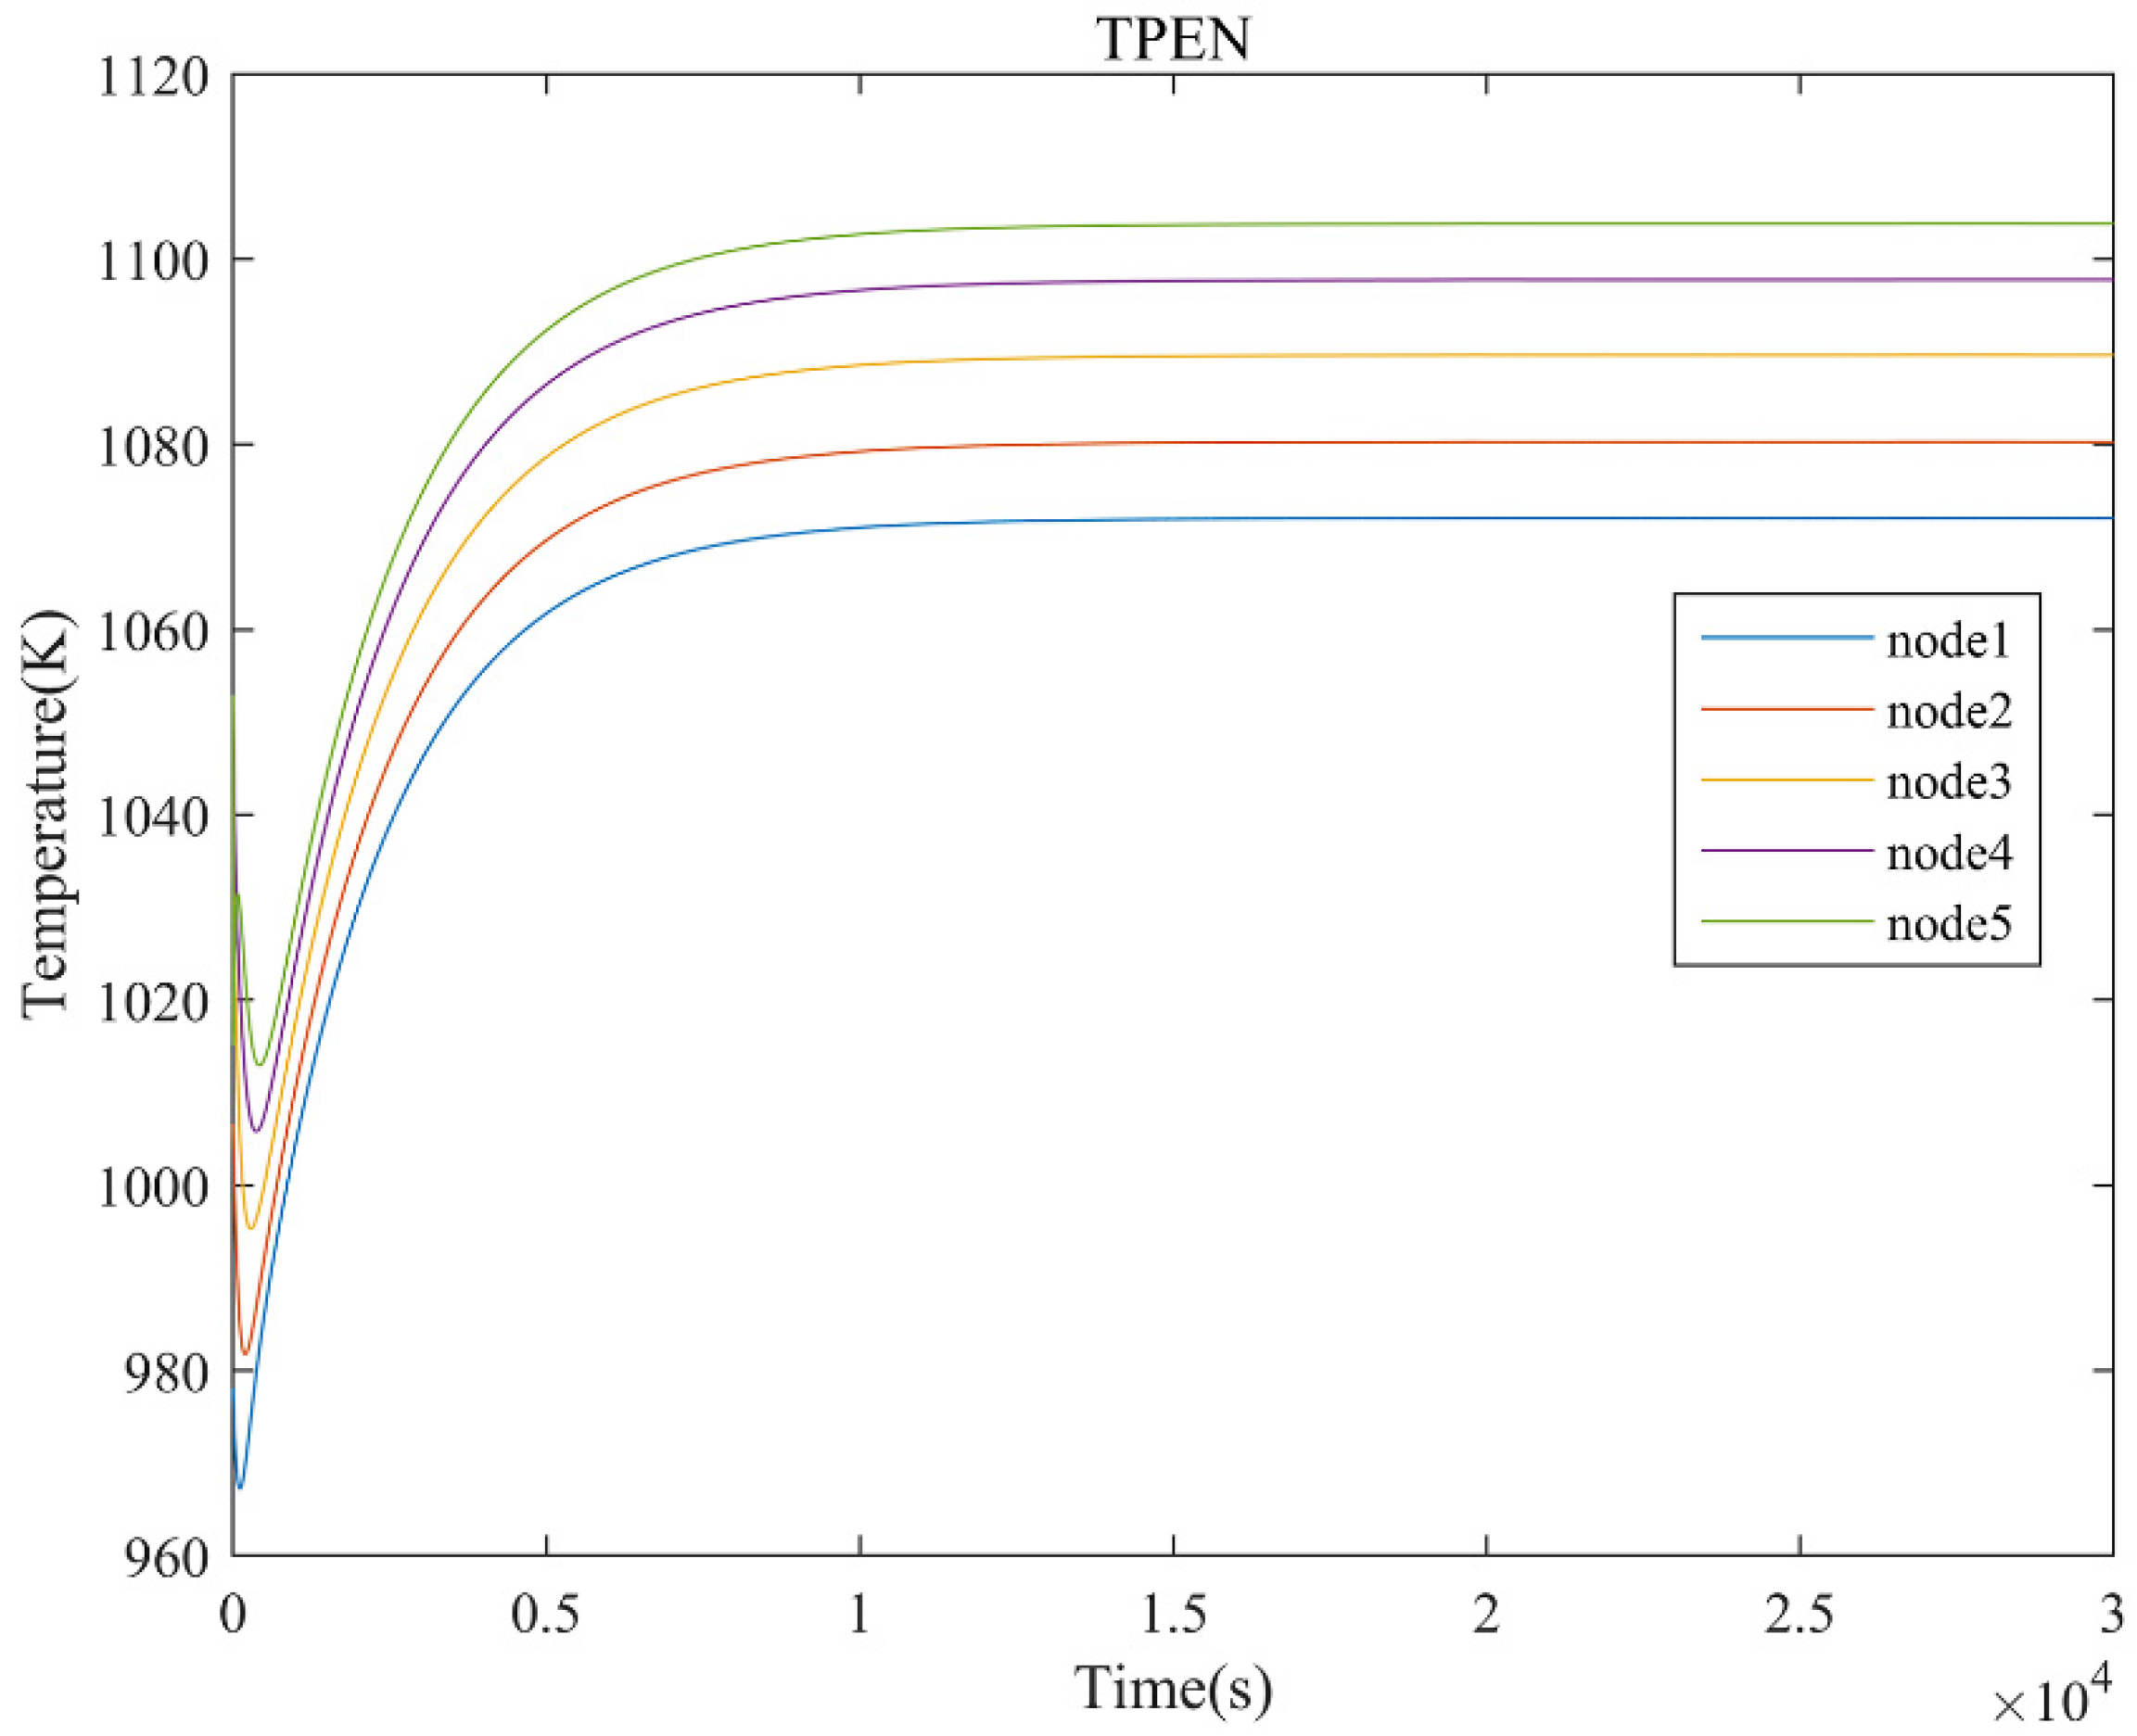
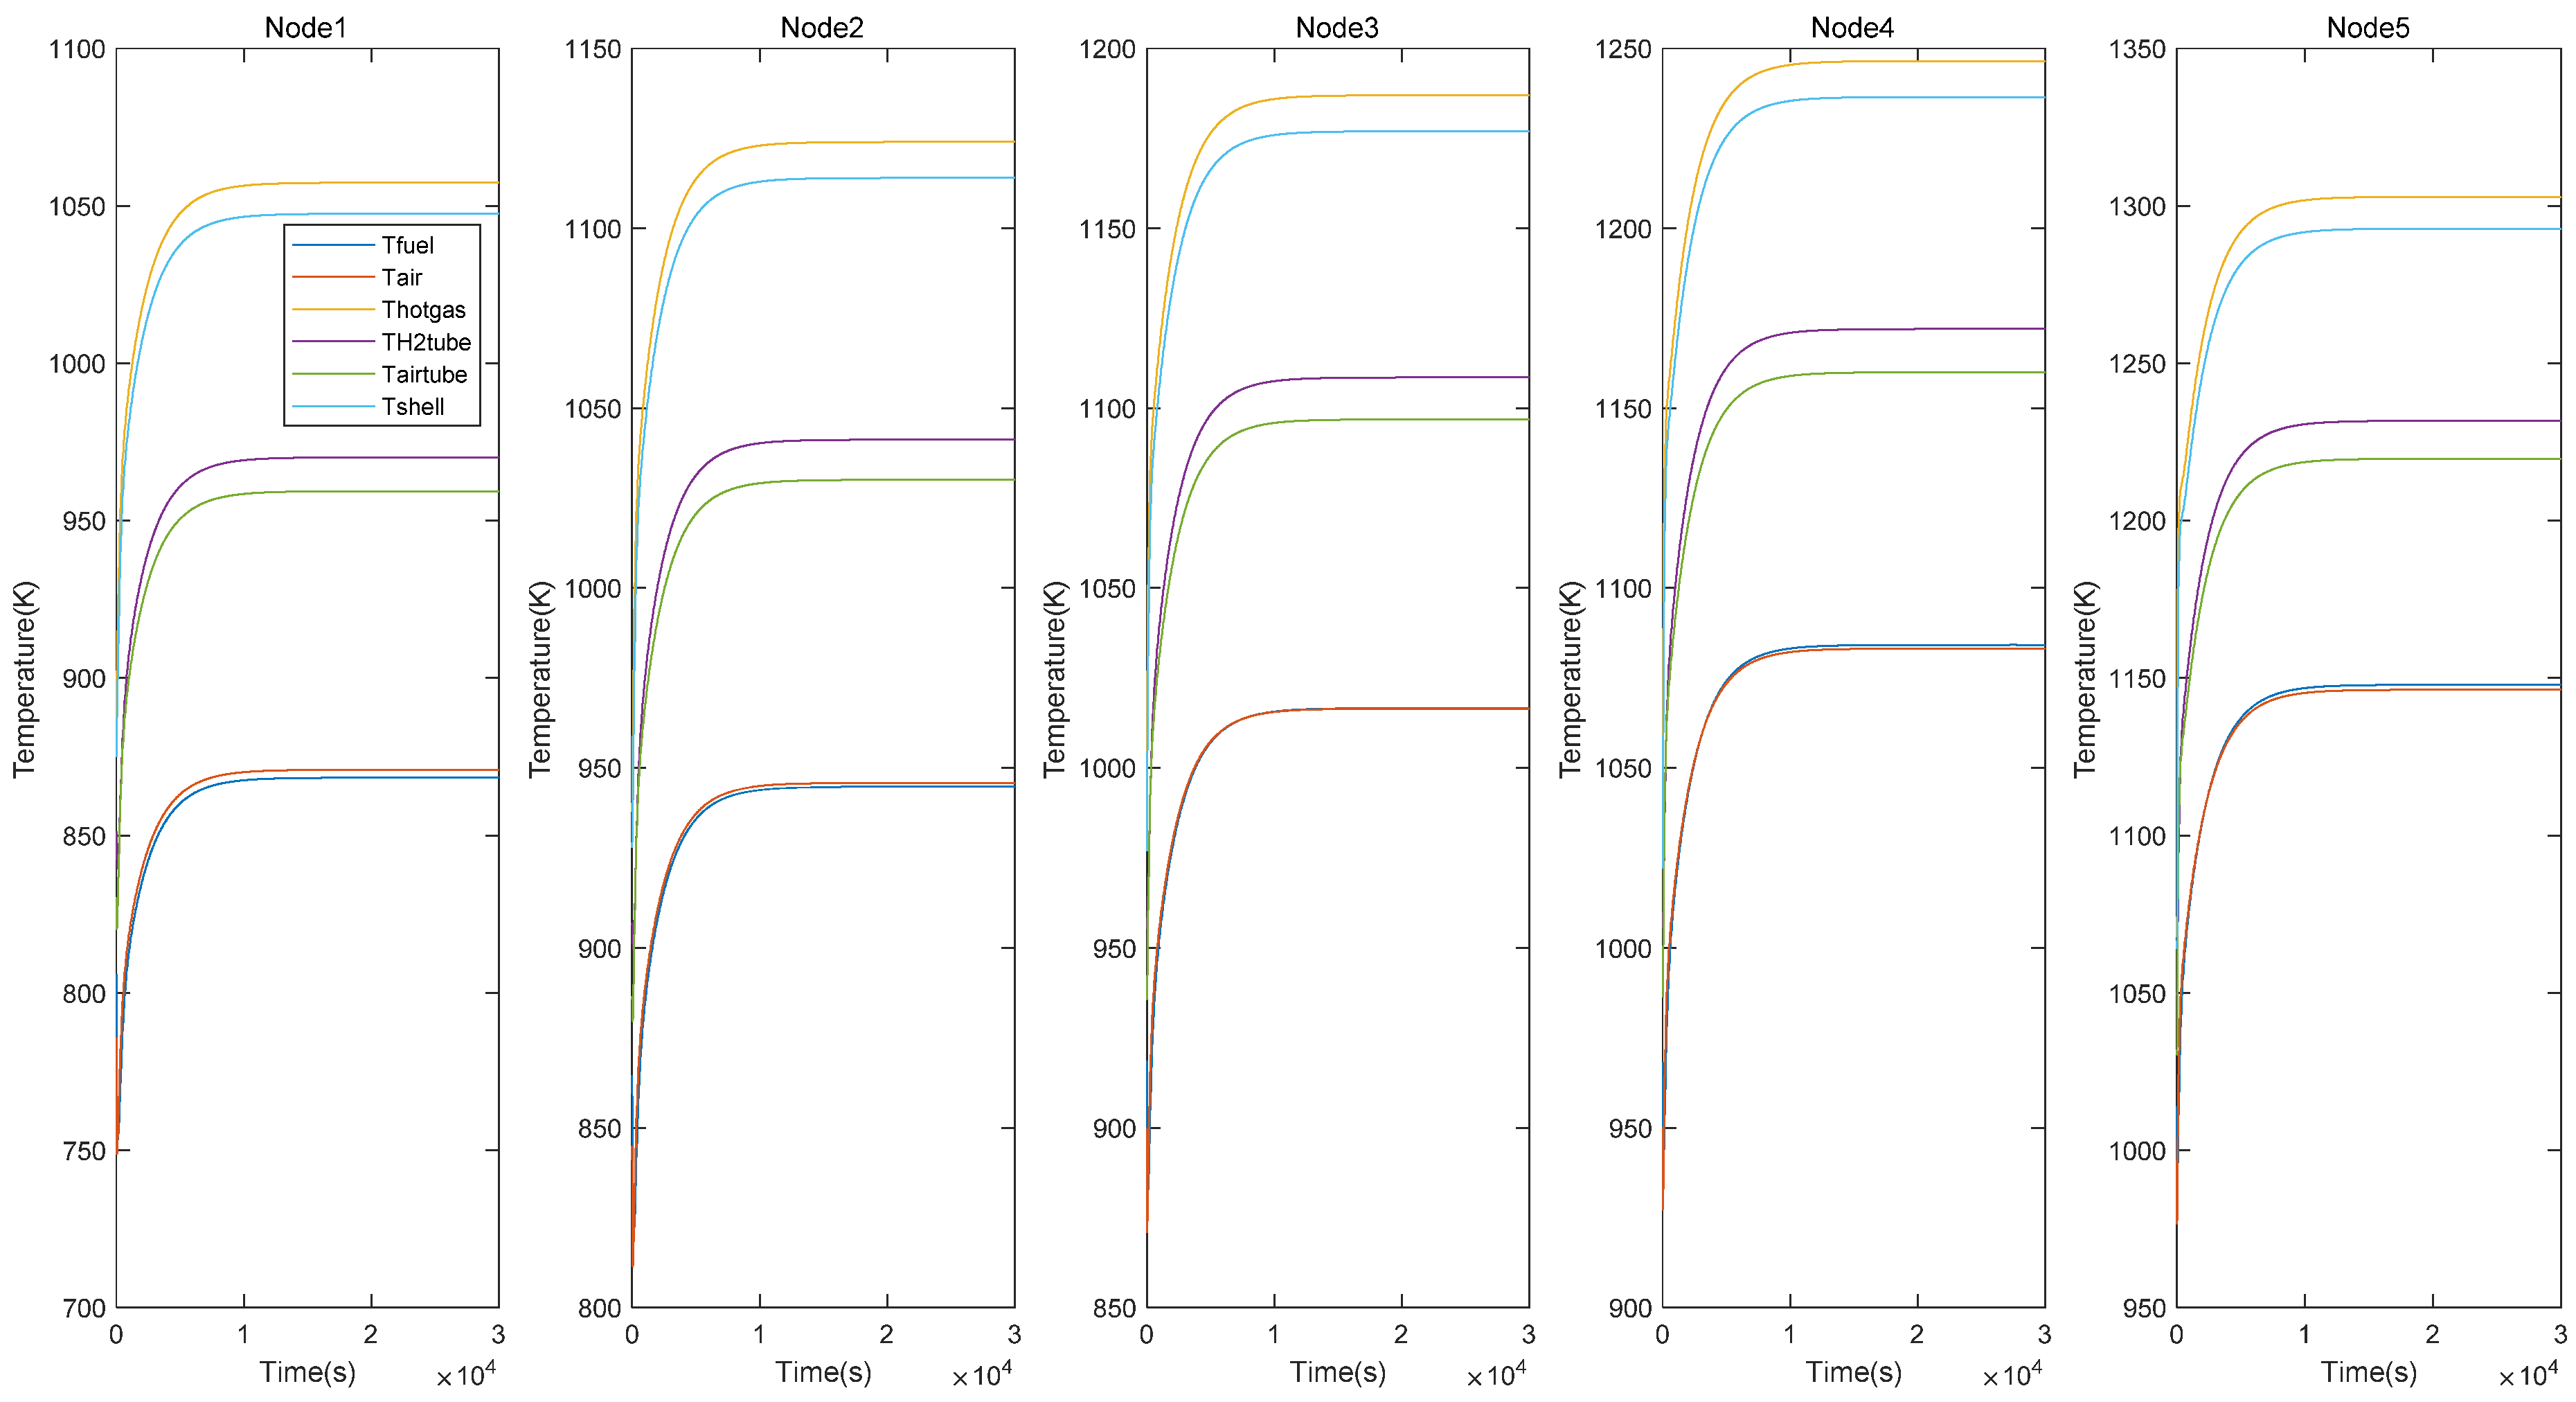
3.2.2. One-Dimensional Test and Verification of Heat Output Characteristics

The static thermal characteristics of the SOFC system were tested and verified using the Simulink model of the 5 kW class SOFC independent power generation system, considering the existing experimental conditions and relevant data. Under one-dimensional testing and verification, it was necessary to keep I s = 60   A unchanged, and change the value of one of the three parameters ( F U = 0.75 , B P = 0.15 and A R = 9 ) to explore its influence on M a x . T P E N , M a x . | Δ T P E N | , Δ T i n l e t , and T B . The results are shown in Figure 8.
The SOFC system imported a decreased level of hydrogen along the F U direction; the greater the level of unreacted hydrogen that moves along the F U direction into the combustion chamber, the less fuel that is produced. Therefore, the combustion chamber temperature showed a downward trend, and the combustion chamber produced a high temperature flue gas reduction. Moreover, if the temperature is not great enough, the gas in the heat exchanger exhibits a low reactor temperature, therefore, the reactor temperature shows a downward trend. From the reactor temperature and combustion chamber temperature shown in Figure 8a, it is evident that the high temperature area is concentrated in the low value F U area, and the reactor temperature and combustion chamber temperature have similar variation trends along the coordinate axis. If the F U is too small, the fuel flow into the SOFC system will be too large, and the preheating capacity of fuel and air is significantly different. The temperature difference between the two when they enter the reactor will gradually increase as the F U decreases. However, if the F U is too large, the concentration of hydrogen downstream of the cell decreases, and the current density of the cell decreases at the outlet. As a result, the reaction in a single cell is not uniform, and the PEN temperature gradient increases so that the temperature gradient of the high-temperature PEN is concentrated in the high-value F U region.
Figure 8b verifies that with an increase in B P , the cold air flow into the reactor and combustor also increases, which leads to the gradual reduction of reactor and combustor temperatures. For the PEN temperature gradient, a B P that is too large will lead to a decrease in hydrogen concentration downstream of the cell sheet and an increase in PEN temperature gradient. With an increase in B P , the cooling ability of the air entering the cathode of the reactor increases so that the temperature difference at the inlet of the reactor increases. In general, when the current output is constant, with an increase of B P , the system voltage, power, and system efficiency generally show a decreasing trend.
The air flow at the inlet of the SOFC system increases along the A R direction, and the increase in A R reduces the hydrogen concentration downstream of the battery sheet and the battery current density at the outlet, thus making the reaction in a single cell sheet uneven and the PEN temperature gradient increase. This causes the temperature gradient of the high temperature PEN to be concentrated in the high value A R region, as shown in Figure 8c. However, if the A R is too small, it will cause the fuel to flow into the SOFC system in too large a quantity, meaning that the air flow will be too low; the preheating capacity of fuel and air is obviously different, therefore, the temperature difference between the two in the reactor inlet gradually increases.

3.2.3. Two-Dimensional Test and Verification of Heat Output Characteristics

The static thermal characteristics of the SOFC system were tested and verified using the Simulink model of the 5 KW class SOFC independent power generation system, considering the existing experimental conditions and relevant data. Using two-dimensional testing and verification methods, it was necessary to keep I s = 60   A and B P = 0.15 unchanged. We changed the value of F U and A R , and we explored its influence on M a x . T P E N , M a x . | Δ T P E N | , Δ T i n l e t , and T B . The results are shown in Figure 9.
The variation trend of the maximum working temperature of PEN with F U or A R has been concluded above, and the high temperature region mainly consists of the low value A R and F U region, which is the dark red part of the lower-left corner of Figure 9a. Since SOFC system is a multi-coupled and multi-variable system, understanding the trend concerning temperature change with multi-variables can help to better understand its thermal characteristics, which can provide the basis for finding the optimal operating point in its steady state. Figure 9c shows the two-dimensional thermal map of the combustion chamber temperature. It is evident that this is very consistent with the trend of temperature change in the two figures in Figure 9d, and both of them are A R and F U regions with low values. Therefore, when A R and F U are selected as the operating variables, the adjustment of the maximum PEN operating temperature and combustion chamber temperature can almost be regarded as the same constraint process so that the system can run safely and stably. Figure 9d shows the two-dimensional thermal diagram of the gas temperature difference at the reactor inlet, and its temperature variation trend was the same as the reactor temperature and combustor temperature after one week. Figure 9b shows the two-dimensional thermal map of the reactor temperature gradient. The high-temperature region mainly comprises the high-value A R and F U region, which is the dark red part of the upper-right corner of the picture. The temperature change trend is in opposition to the reactor temperature and combustion chamber temperature. Therefore, in general, under specific output conditions, if A R and F U are selected as control variables, it is evident that there is a competitive relationship between M a x . T P E N , T B , Δ T i n l e t , and M a x . | Δ T P E N | , which are two opposing regulation processes.

3.2.4. Three-Dimensional Test and Verification of Heat Output Characteristics

The static thermal characteristics of the SOFC system were tested and verified using the Simulink model of the 5 KW class SOFC independent power generation system, considering the existing experimental conditions and relevant data. Using three-dimensional testing and verification methods, we kept I s = 60   A unchanged, and we changed the value of F U , A R , B P to explore its influence on M a x . T P E N , M a x . | Δ T P E N | , Δ T i n l e t , and T B . The results are shown in Figure 10.
As shown in Figure 10a, the maximum operating temperature of PEN is in the high temperature region, when all three variables are minimum values. Therefore, for this temperature constraint, the operation strategy of the three variables is the same, that is, neither too small nor too large. When it is too small, the temperature is too high, the reactor overheats, internal deformation easily occurs, as does damage, resulting in leakage and other faults. When it is too large, the temperature is too low, the electrochemical reaction degree is not enough, the reactor output voltage is low, and the system efficiency is low. Therefore, it is necessary to select appropriate parameter values in combination with other constraints.
Figure 10b shows the 3D thermal map of the maximum operating temperature gradient of PEN. As shown in the figure, the high-value area is mainly concentrated in the high-value F U and high-value A R areas, and it also tends to increase as the B P increases . The variation trend contrasts with the combustor temperature and reactor temperature.
Figure 10c shows the 3D thermal diagram of the combustion chamber temperature. As is evident from the figure, when all three variables are minimum values, the combustor temperature is in the high temperature region, which is the same as the change trend of the maximum operating temperature of PEN. Therefore, for the combustor temperature constraint, the operation strategy of the three variables is the same as the previous maximum operating temperature of PEN. That is, it cannot be too small or too large; if it is too small, the exhaust gas temperature of the combustion chamber is too high, and the preheating temperature of the fuel and air is too high, resulting in the high internal temperature of the reactor. This may cause internal deformation and damage, which can easily cause air leakage and other faults. If it is too large, if the temperature is too low, if the gas preheating is not sufficient, the degree of electrochemical reaction is not enough, and the reactor output voltage is low, then the system efficiency is low. Therefore, it is necessary to select appropriate parameter values in combination with other constraints.
From Figure 10d, it is evident that the high temperature region of the gas temperature difference at the inlet of the reactor is concentrated in the low-value A R and F U regions, and the high-value B P region. With the increase in B P , the flow of cold air in the bypass valve increases and mixes with the preheated air, which reduces the inlet air temperature and increases the temperature difference at the gas inlet. The increase in A R reduces the reactor temperature. If the excess ratio of A R is too small, it will cause the air flow into the SOFC system to be too low. The preheating capacity of air and fuel is obviously different, thus, when the two are placed into the reactor, the inlet temperature difference gradually increases. However, if the F U is too small, the fuel flow will be too large and fuel preheating will not be sufficient. As a result, the preheating capacity of air and fuel would also be significantly different, and the temperature difference between them would increase gradually upon entering the reactor inlet.

3.3. Electrical Output Characteristics and Their Ranges

The electrical characteristic parameters studied in this paper for the SOFC independent power generation system mainly comprise net output power and output efficiency. During a normal operation, the SOFC’s efficiency typically falls within the range of 30% to 60%. Different input parameters have a comprehensive impact on the SOFC’s operating temperature and output efficiency. Therefore, when ensuring the SOFC’s thermal safety, it is essential to conduct a comprehensive analysis of SOFC efficiency under various power conditions.

3.3.1. Electrical Output Characteristic Parameters

The SOFC system’s net output power calculation formula is as follows:
P n e t = U s I s P b l
U s is the reactor voltage, I s is the reactor current, and P b l is the blower power consumption.
The calculation formula of blower power consumption is as follows:
P b l = C ¯ b l N ˙ a i r .
As is evident from the above equation, the power of the blower is proportional to the flow rate of the air. The calculation formula of the ratio coefficient C ¯ b l is as follows:
C ¯ b l = C p , a i r T a i r , i n η b l P b l , o u t P b l , i n γ 1 γ 1 .
In the above equation, C p , a i r is the constant pressure specific heat capacity of air; T a i r , i n is the temperature at which the air enters, generally room temperature; η b l is the efficiency of the blower; P b l , o u t and P b l , i n are the inlet and outlet pressures of the blower, respectively; and γ is the specific heat ratio of air, generally 1.4. Finally, the output efficiency of the SOFC independent power generation system is calculated using the following formula:
η s y s = P n e t N ˙ H 2 L H V H 2 × 100 %
L H V H 2 is the low calorific value of hydrogen, which is generally 241.83 KJ mol−1.

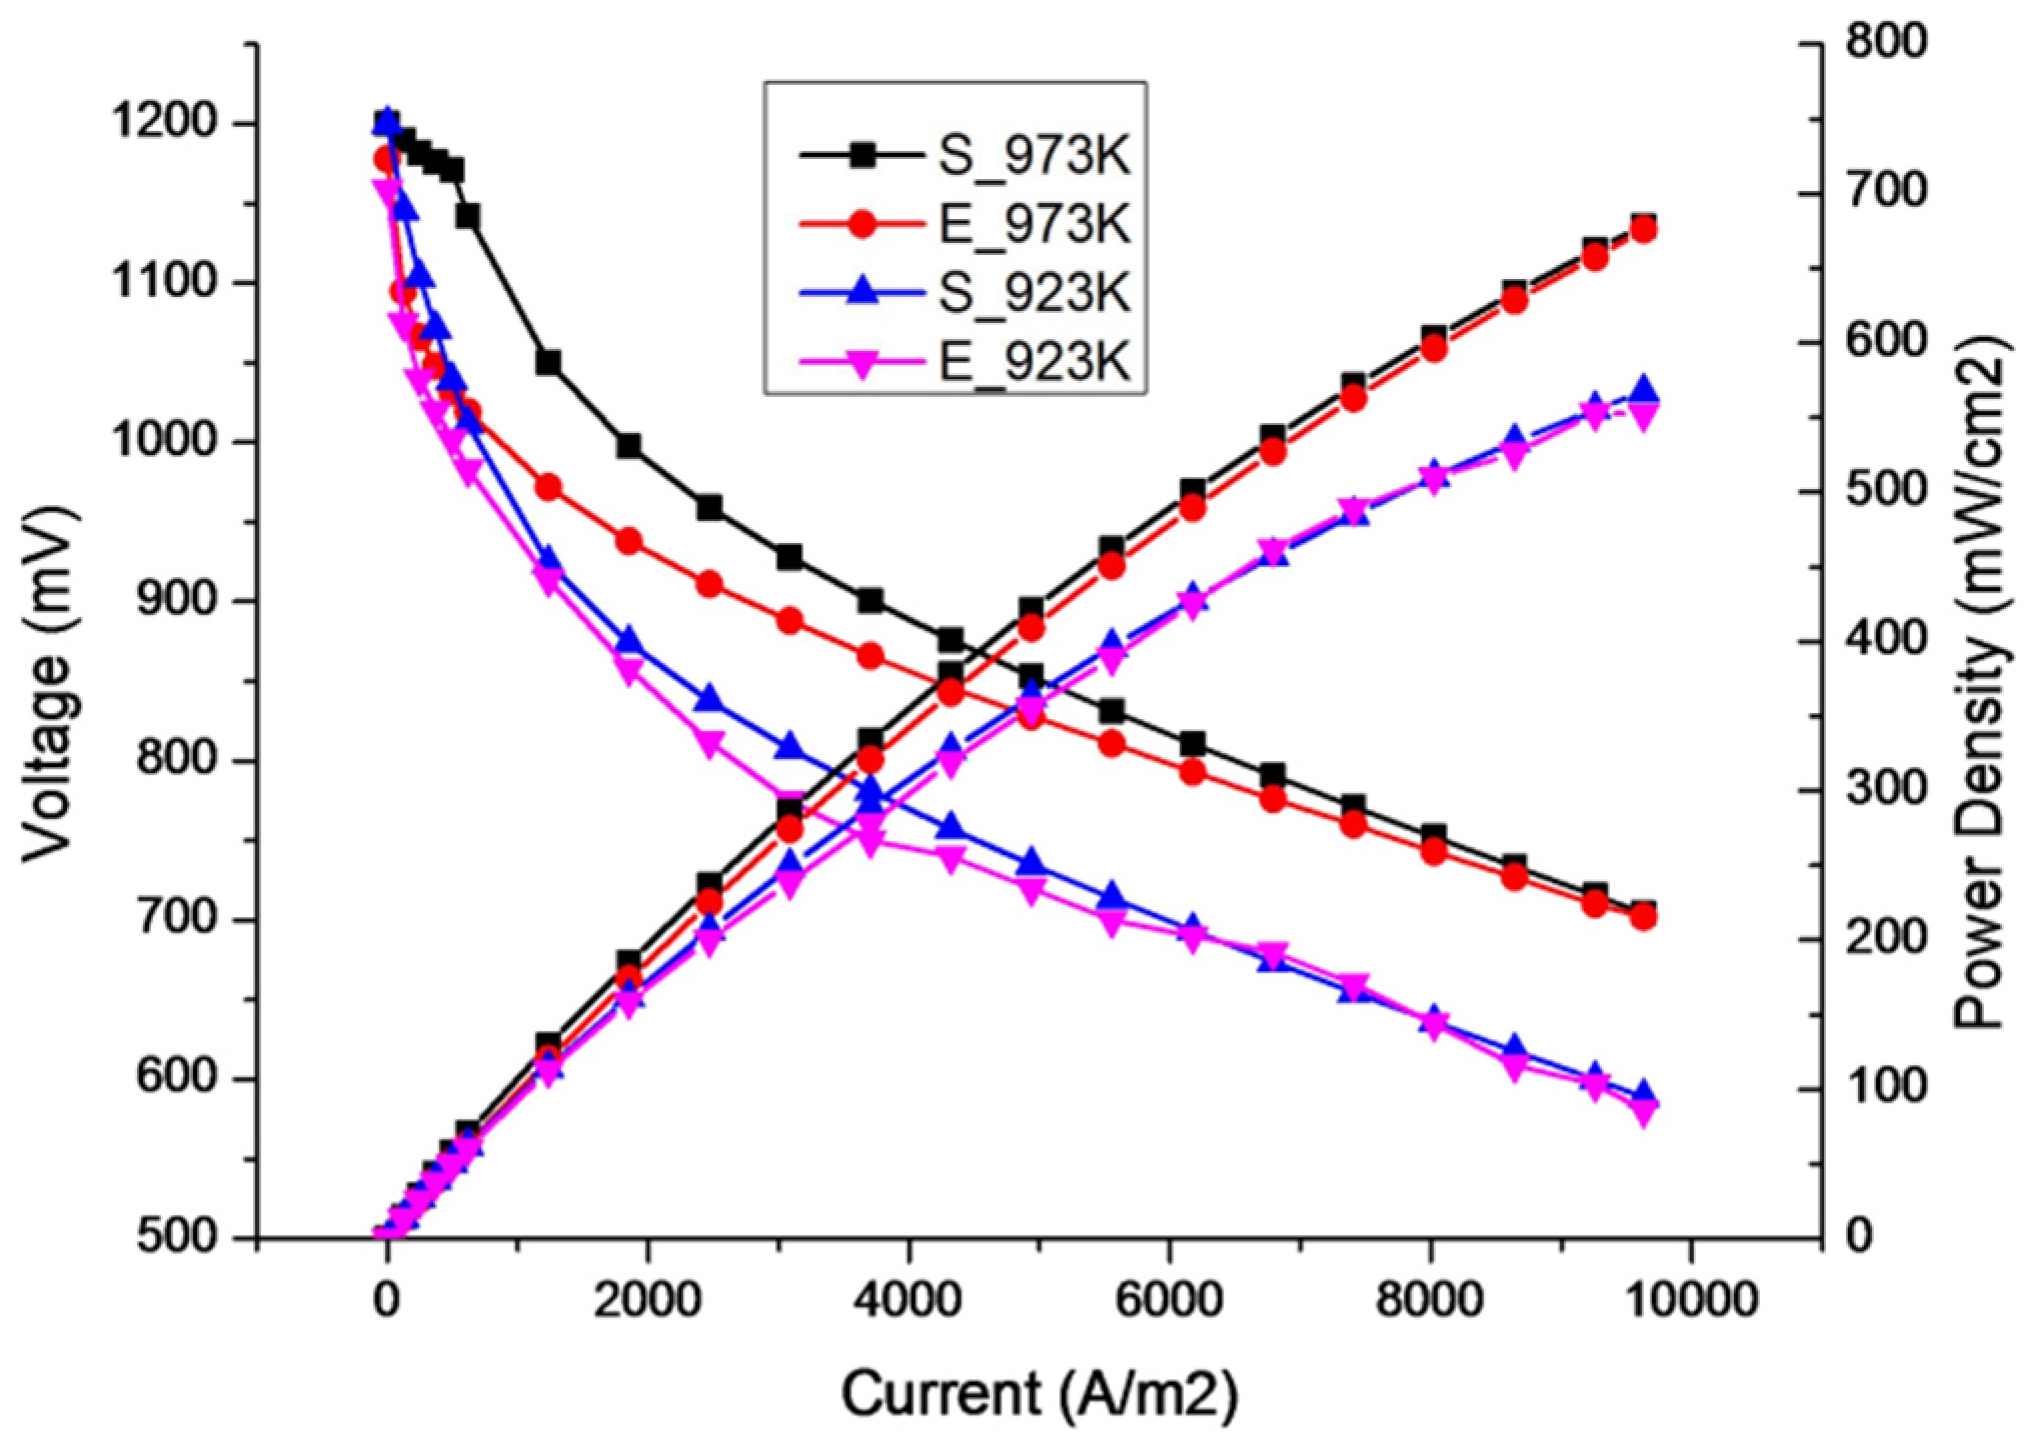
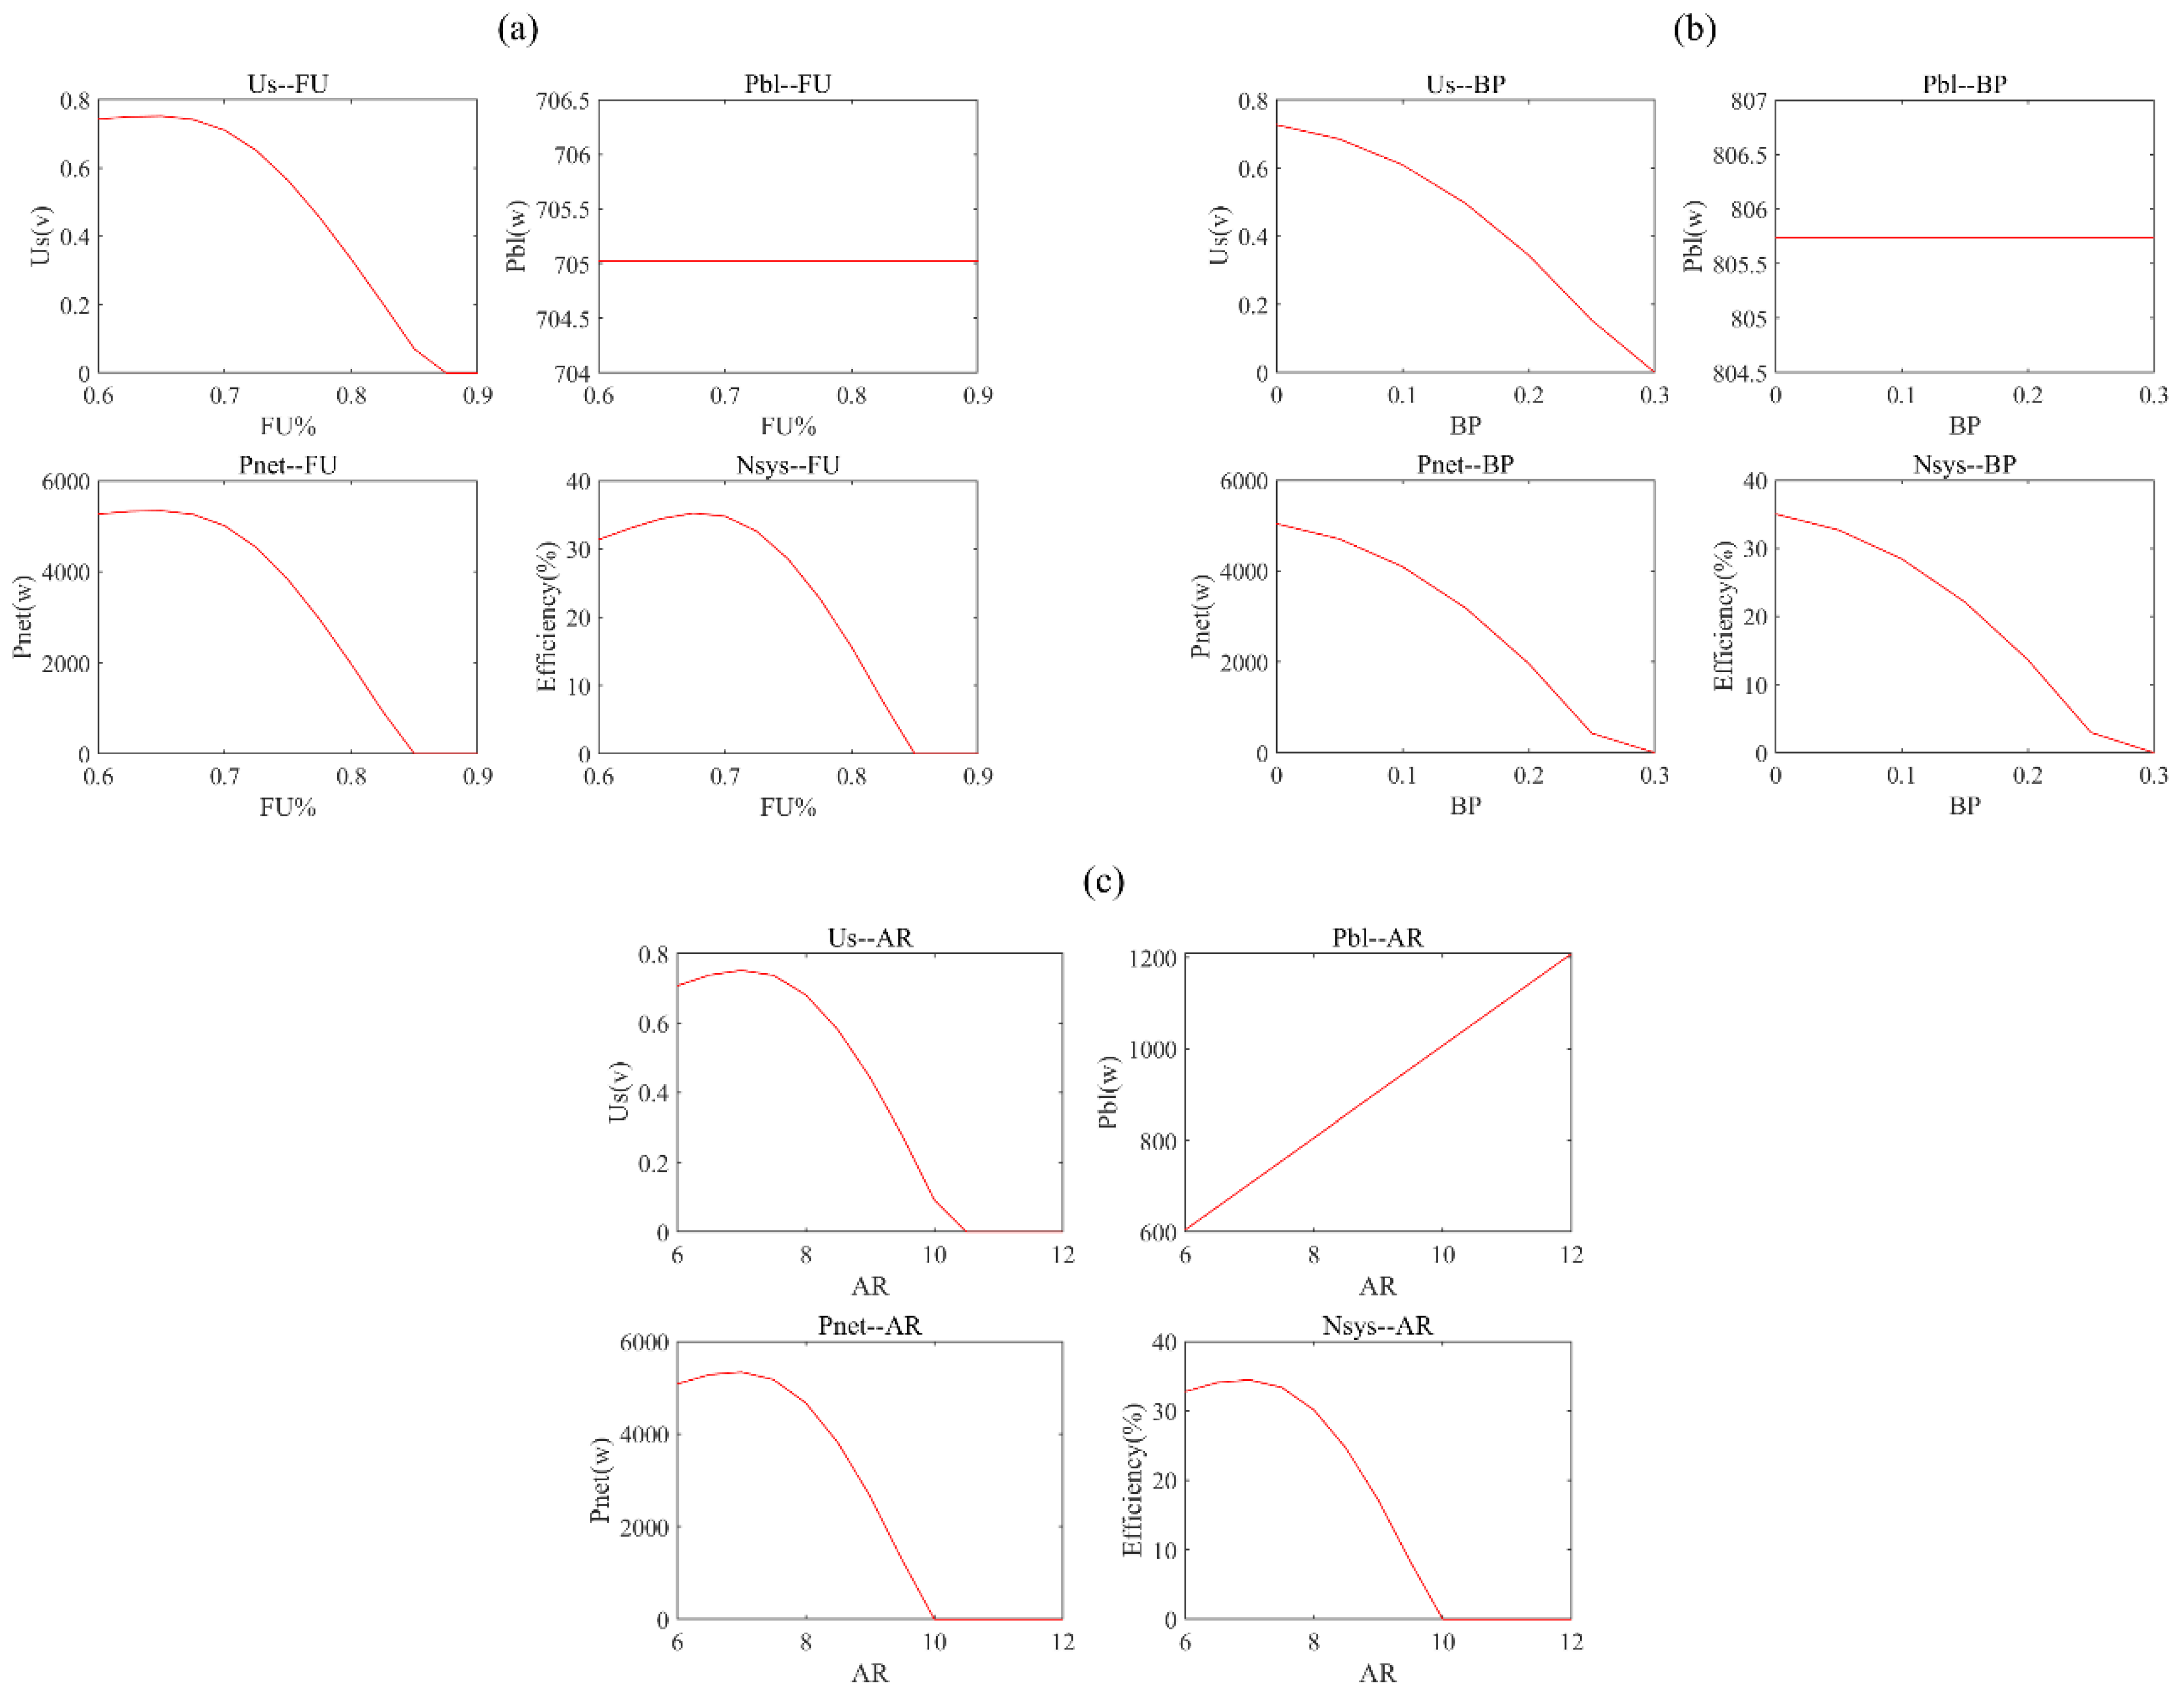
3.3.2. One-Dimensional Test and Verification of Electrical Output Characteristics

The static thermal characteristics of the SOFC system were tested and verified using the Simulink model of the 5 KW class SOFC independent power generation system, considering the existing experimental conditions and relevant data. Using one-dimensional testing and verification methods, we kept I s = 60   A unchanged, and we changed one of the three parameters F U = 0.75 , B P = 0.15 , A R = 9 to explore its influence on U s , P b l , P n e t , and η s y s . The results are shown in Figure 11.
As is evident from Figure 11a, the power consumed by the blower is a fixed value because the power consumed by the blower is only related to A R . When the current output is a constant value, combined with the previous static thermal characteristics, with the increase of the fuel utilization rate, F U , the reactor temperature decreases, and the associated reactor voltage also decreases. As a result, the net power output continues decreasing. As is evident in the figure, the reactor voltage, system net output power, and system efficiency exhibit the same downward trend. Under the premise of keeping all other conditions unchanged, the entire system reaches its maximum efficiency at approximately FU = 0.7.
As is evident from Figure 11a,b, the power consumed by the blower is a fixed value, because the power consumed by the blower is only related to A R . When the current output is a constant value, with the increase in B P due to the increase of cold air in the bypass valve, combined with the previously obtained influence of B P on the static thermal output characteristics, the overall temperature in the reactor decreases, and the voltage, power, and system efficiency decrease overall, as shown in Figure 11c.
As is evident from Figure 11c, high power, high voltage, and high system efficiency are generally located in the low value A R region. The main reasons for this are as follows: the increase in A R reduces the reactor’s temperature, and thus, it reduces the voltage. Since the model only considers the main blower power consumption in the SOFC system, although the blower power consumption is directly proportional to A R , it has little influence on the output power of the whole system. Under the current Is, the net output power of the system is basically the same as the voltage variation of the reactor. For system efficiency, along the direction of A R , when F U is fixed, the total energy input of the system is fixed, and the change in system efficiency is the same as the net output power of the system, which is not affected by other factors. Under the premise of keeping all other conditions unchanged, the entire system reaches its maximum efficiency at approximately AR = 7.

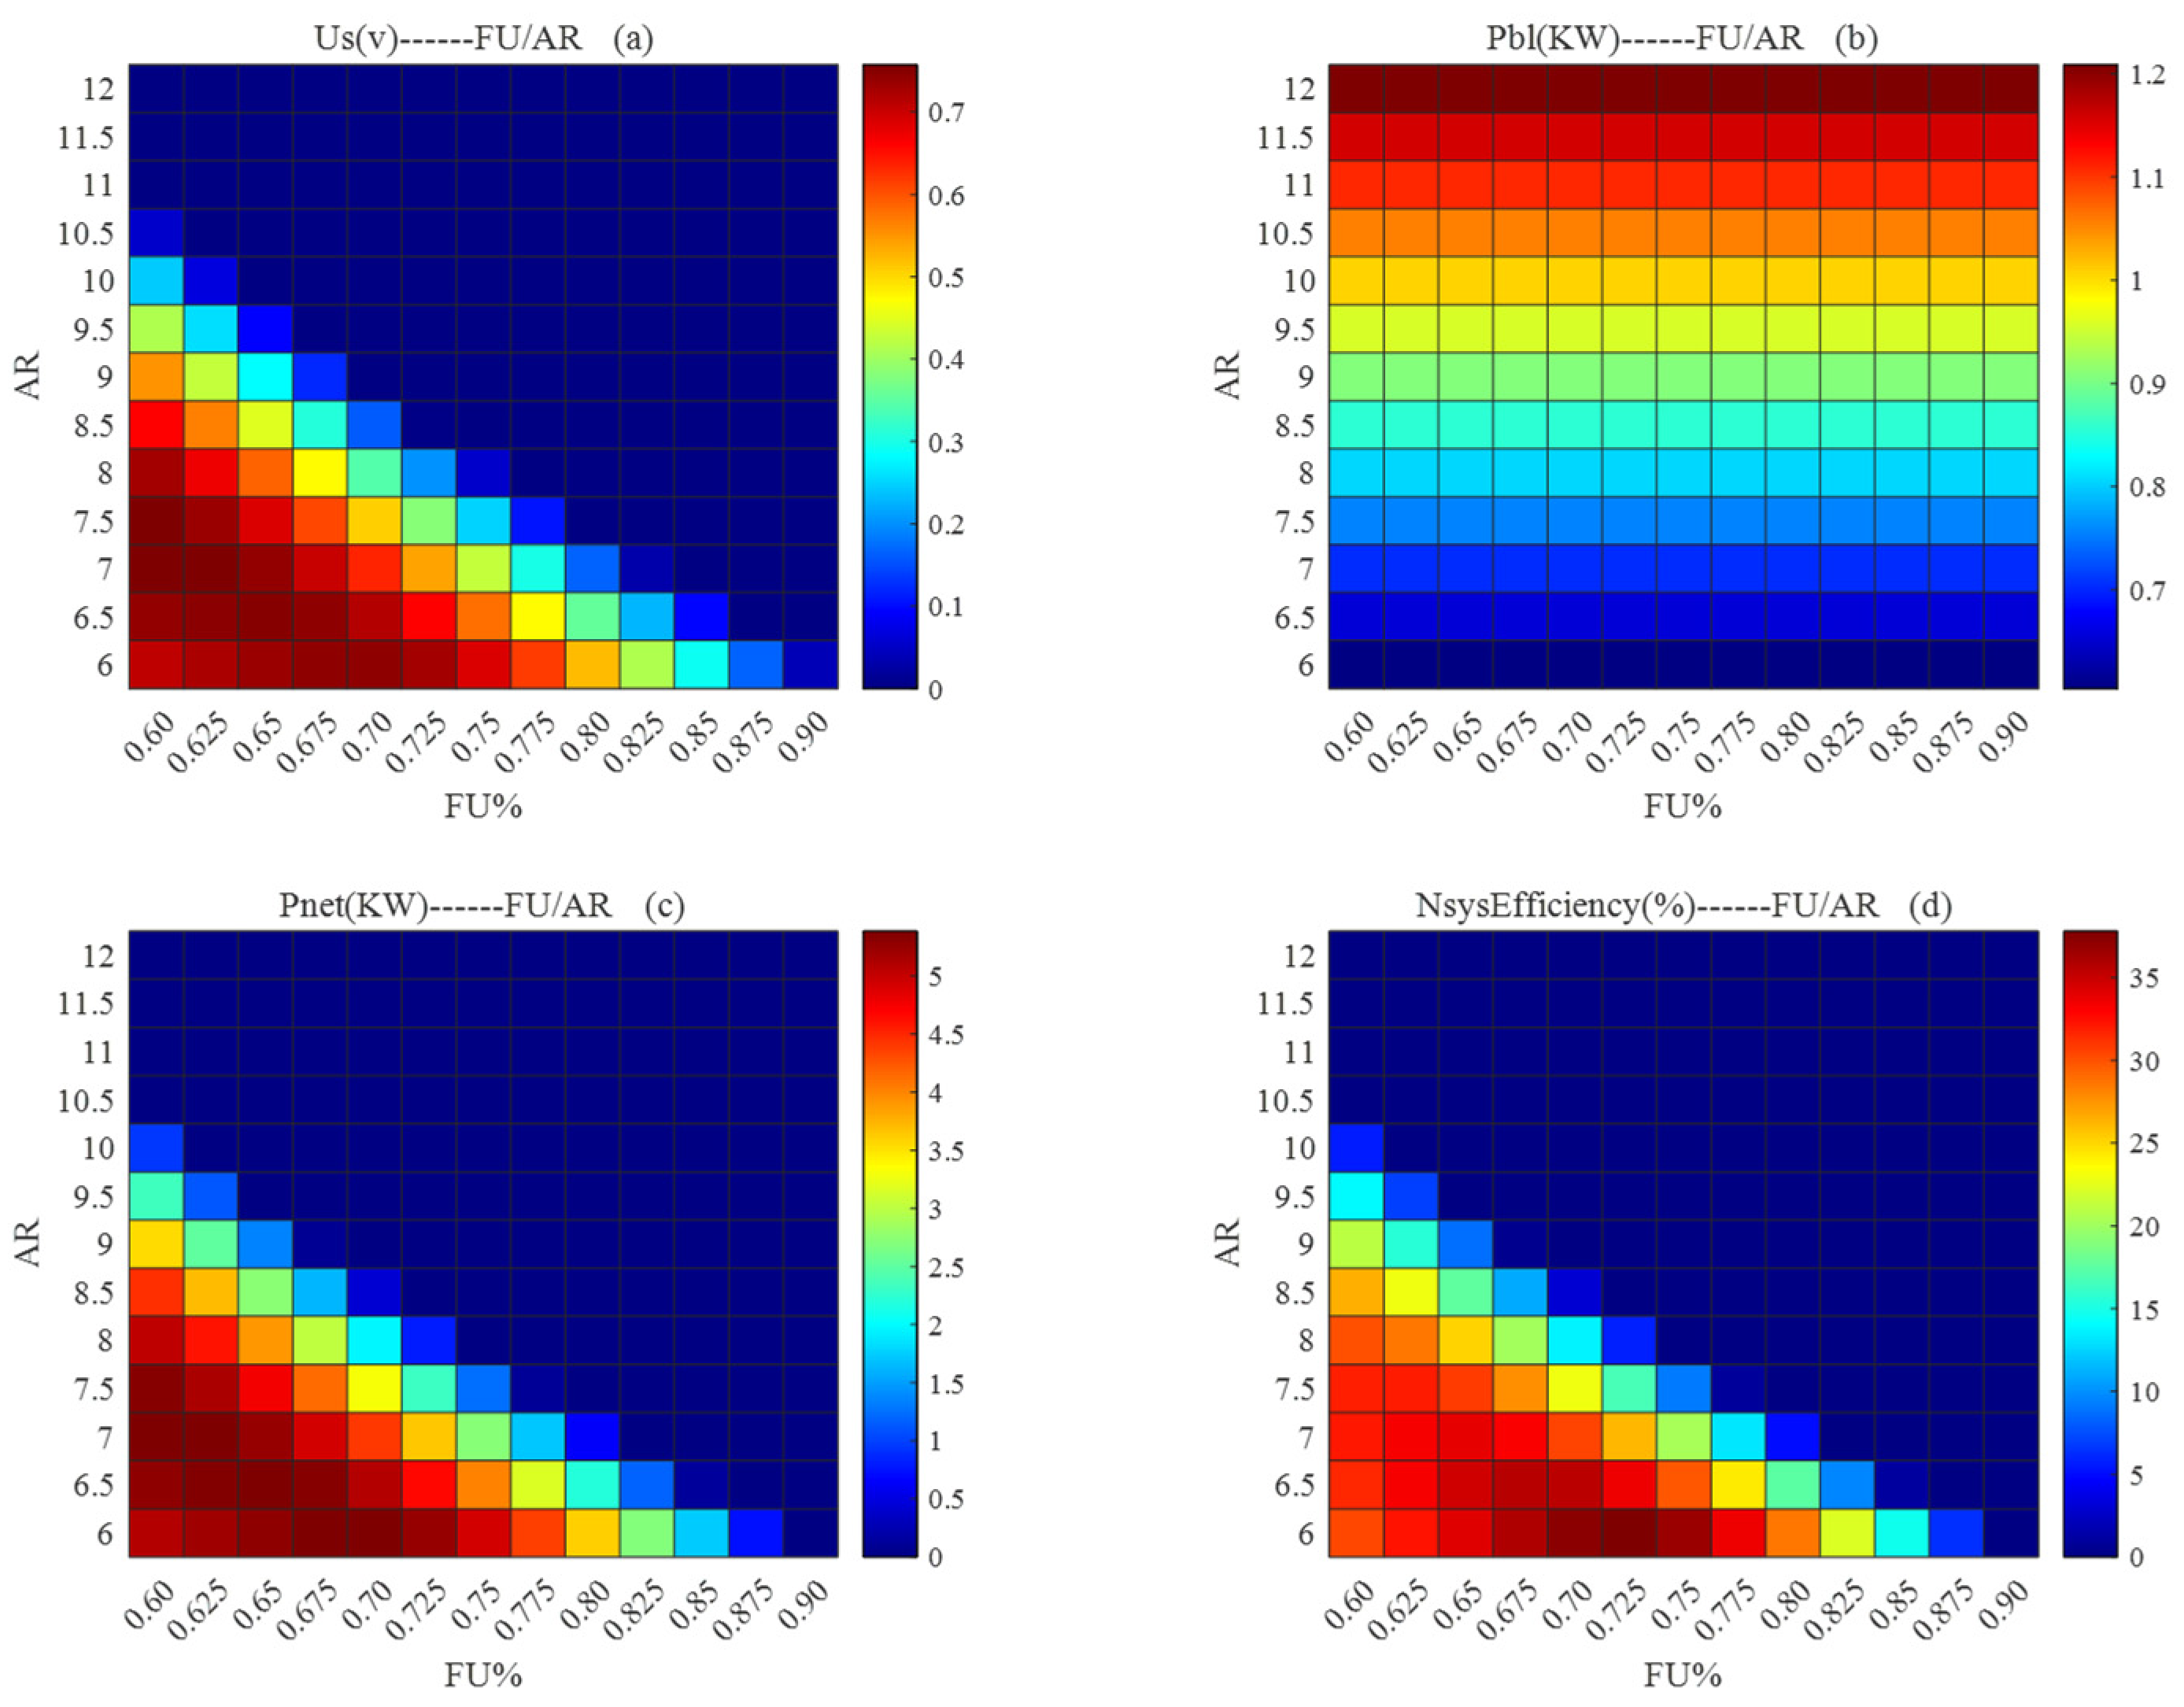
3.3.3. Two-Dimensional Test and Verification of Electrical Output Characteristics

The static thermal characteristics of the SOFC system were tested and verified using the Simulink model of the 5 KW class SOFC independent power generation system, considering the existing experimental conditions and relevant data. Under two-dimensional testing and verification conditions, we kept I s = 60   A and B P = 0.15 unchanged. We changed the value of F U and A R , and we explored its influence on U s , P b l , P n e t , and η s y s . The results are shown in Figure 12.
Figure 12a shows the two-dimensional thermal diagram of the reactor’s voltage, and its variation trend is essentially the same as that in Figure 12d. Figure 12d is a two-dimensional diagram of the output efficiency of the system. When the total energy input is constant, its power variation trend is the same as the net output power, and it is not affected by other factors. High voltage and high system efficiency are generally in the low value A R region. This is because the increase in A R reduces the reactor temperature, and thus, the voltage. As is evident from Figure 12b, the power consumed by the blower increases as the A R value increases; this is because a larger A R value means that a larger amount of air needs to be fed into the whole system and a larger power is consumed using the natural blower. Figure 12c is a two-dimensional diagram of the net output power of the system. The high-power area mainly comprises the low-value A R and F U areas, which can be seen in the dark red part of the lower-left corner of the picture. When the F U or A R exceeds a certain threshold, the system cannot work properly, and the net output power is 0. Therefore, when subsequently selecting the optimal operating point, the F U and A R must not exceed the threshold, as it affects the normal operation of the system. Under the premise of keeping all other conditions unchanged, the entire system achieves its maximum efficiency at approximately FU = 0.725 and AR = 6.

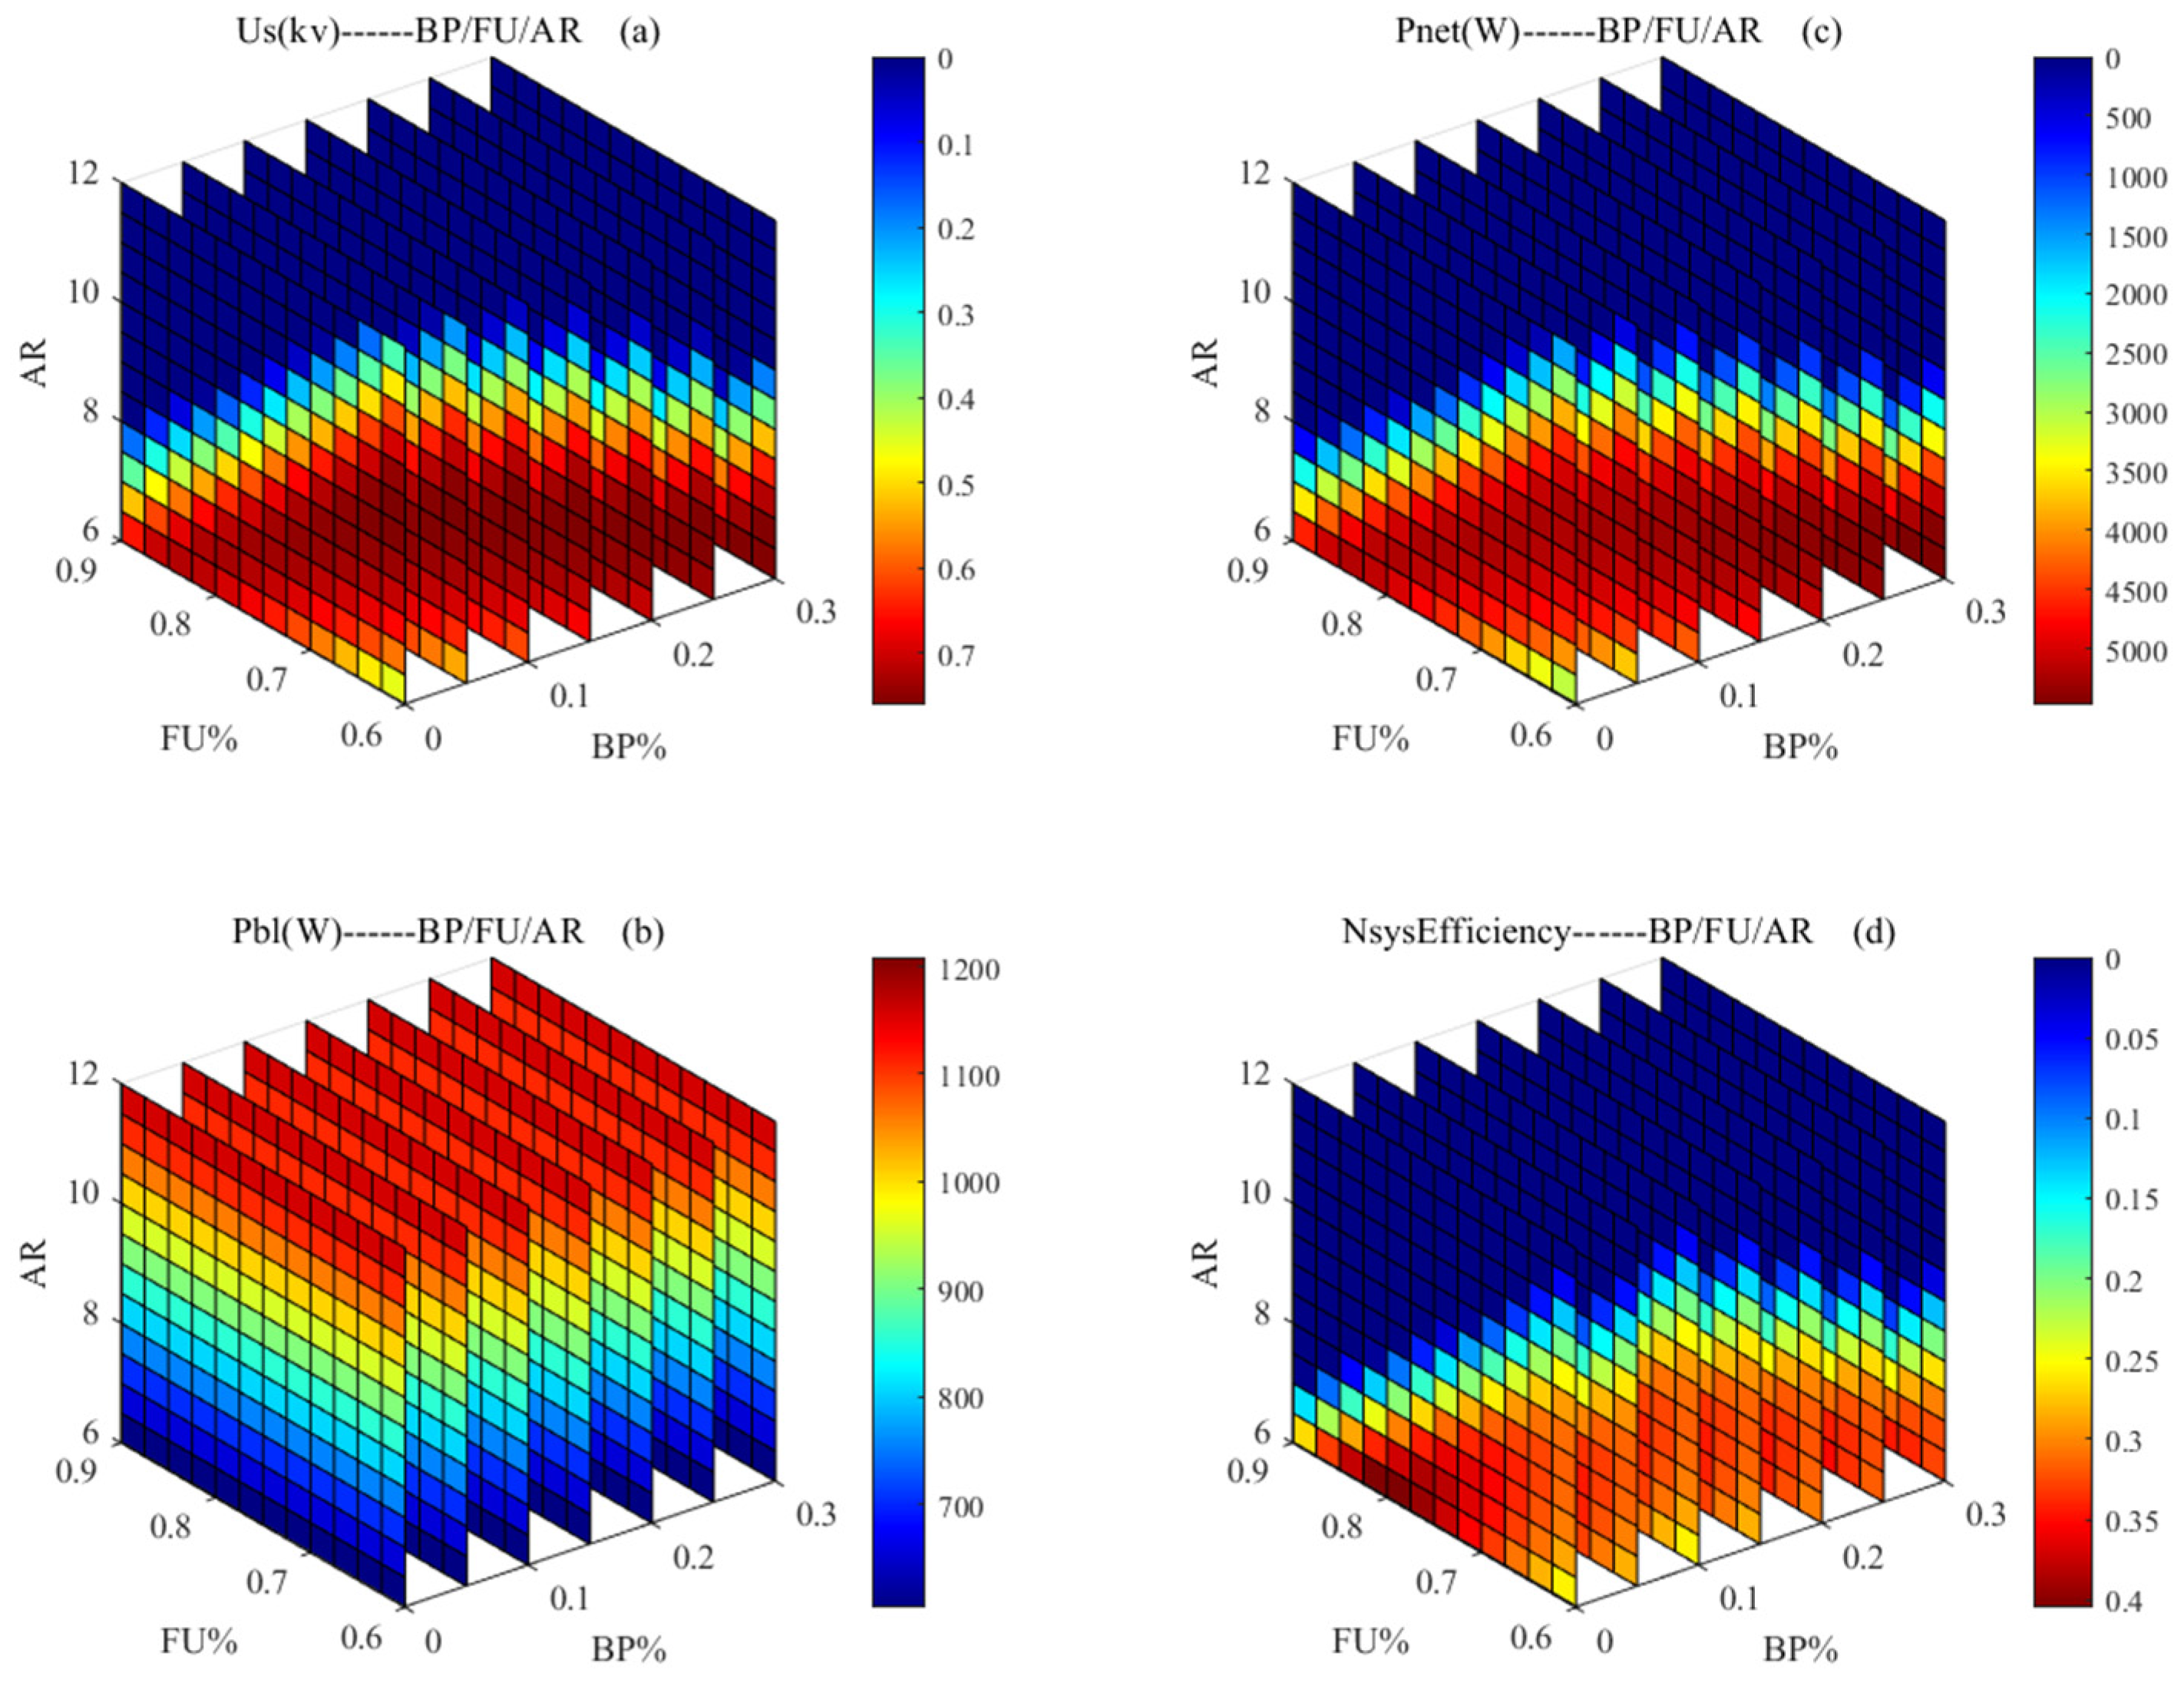
3.3.4. Three-Dimensional Test and Verification of Electrical Output Characteristics

The static thermal characteristics of the SOFC system are tested and verified using the Simulink model of the 5 kW class SOFC independent power generation system, considering the existing experimental conditions and relevant data. Under three-dimensional testing and verification conditions, we kept I s = 60   A unchanged, and we changed the values of F U , A R , and B P to explore its influence on U s , P b l , P n e t and η s y s . The results are shown in Figure 13.
Figure 13a shows the 3D thermal diagram of the reactor voltage. As the SOFC system is a multi-coupled system, and the three operating variables have different influence trends on temperature, compared with the previous one-dimensional and two-dimensional diagrams, the three-dimensional diagram can show the relationship between the stack voltage changes and the three operating variables in a more intuitive way. It is convenient to observe the voltage change of the reactor when the three operating variables change at the same time in order to find the static optimal operating point faster. The change in trend, shown in Figure 13c, is essentially the same as that shown in Figure 13a. This is because when the system output current is certain, the net output power of the system is positively correlated with the output voltage. As is evident from the 3D figure, the high output values are all in the areas with small F U , B P , and A R values. The reason for this is that with the increase in F U , A R , and B P , the voltage temperature of the reactor decreases, causing the output voltage to also decrease. Moreover, as the parameter increases, the output voltage and net output power of the system becomes 0 when it exceeds a certain threshold. Figure 13b shows the 3D thermal map of the power consumed by the blower. With great certainty, it can be asserted that the simultaneous change in F U , B P , or both, will not change the value of the power consumed by the blower, and its value is only related to A R .
Figure 13d shows the 3D diagram of system efficiency. In accordance with the above modeling formula, system efficiency is the ratio of net output power to the chemical energy of hydrogen gas. With the increase in F U , when the amount of hydrogen gas is constant, the reactor temperature and combustor temperature decrease, which leads to a decrease in the net output power of the SOFC system and a decrease in system efficiency. With the increase in A R , the air inputted into the system far exceeds the amount of air required by the system, and the excess air removes a considerable amount of heat, thus reducing the voltage of the reactor. Under the condition where the output current of the system remains unchanged, a reduction in the output power of the system will inevitably lead to a reduction in the output efficiency of the system. As is evident from the figure, the increase in B P also slightly reduces the output efficiency of the system, but the influence of B P on the system’s efficiency is limited, to a much lower extent than the influence of F U and A R changes on system efficiency. Under the premise of keeping all other conditions unchanged, the entire system achieves its maximum efficiency at approximately FU = 0.8, BP = 0, and AR = 6.

4. Conclusions

This paper establishes a model of an SOFC independent power generation system based on current control. Firstly, the model wasa constructed using the principles of energy conservation, mass conservation, and mole fraction conservation laws, defining system components such as the core reactor and the heat exchanger. The nodal idea was employed during the modeling process, and experimental results demonstrate the model’s excellent compatibility with actual SOFC systems. Compared with traditional SOFC models, this model incorporated a cold air bypass, to enable the more precise control of the reactor’s inlet and outlet temperatures. The inclusion of the bypass offers theoretical precision in controlling the reactor’s temperature.
In this paper, in accordance with the characteristics of the SOFC system, the fuel utilization rate, F U , the air excess ratio, A R , and the bypass valve opening, B P , were used in combination as a means of regulation. At the same time, the working range was set by referencing actual situations. The variation range of FU is 0.6–0.9, the variation range of BP is 0–0.3, and the variation range of AR is 6–12. The output parameters of the thermal characteristics and electrical characteristics of the system were studied comprehensively using output one-dimensional, two-dimensional, and three-dimensional graphs.
Using one-dimensional output plots, we can intuitively observe the range of the influence of a single input variable on the output parameters, while keeping all other conditions unchanged. The entire system reaches its maximum efficiency at approximately FU = 0.7, BP = 0, or AR = 7. With the aid of two-dimensional heatmaps, we can visually assess the interaction effects of two parameters on the output parameters, while keeping all other conditions unchanged. The system achieves its maximum efficiency at approximately FU = 0.725 and AR = 6. Furthermore, using three-dimensional plots, a comprehensive and intuitive analysis of the relationship between SOFC system outputs and various parameters is possible. This facilitates the identification of the optimal operating point, under the premise of keeping all other conditions unchanged. The entire system reaches its maximum efficiency at approximately FU = 0.8, BP = 0, and AR = 6. It is important to note that these results are not entirely identical to the previous results, as the SOFC is a multi-coupled system, and the range of influence of each parameter changes as the system varies. This highlights the significance of this study in terms of providing a deeper understanding of the complex behavior of the SOFC system and its response to parameter variations.

Author Contributions

Conceptualization, M.L. and K.Z.; methodology, X.L.; software, Z.C.; validation, M.R., L.H. and X.W.; formal analysis, K.X.; investigation, K.X.; resources, C.C.; data curation, S.L.; writing—original draft preparation, K.Z.; writing—review and editing, M.L.; visualization, M.R.; supervision, Z.C.; project administration, K.X.; funding acquisition, L.H. All authors have read and agreed to the published version of the manuscript.

Funding

This research was funded by [Guangdong Key Areas R&D Program] grant number [2022B0111130004] and [the National Key Research and Development Program of China] grant number [2022YFB4003605].

Conflicts of Interest

The authors declare no conflict of interest.

References

  1. Wang, Z.L. Energy crisis in the post-petroleum era. Resour. Hum. Settl. 2008, 9, 34–36. [Google Scholar]
  2. Peng, H.; Behnam, S. Application of the improved chaotic grey wolf optimization algorithm as a novel and efficient method for parameter estimation of solid oxide fuel cells model. Int. J. Hydrogen Energy 2021, 46, 36454–36465. [Google Scholar]
  3. Wang, L.S.; Ying, L. Fuel Cell, 2nd ed.; Metallurgical Industry Press: Beijing, China, 2005. [Google Scholar]
  4. Yi, L.B. Fuel Cell: Efficient and Environmentally Friendly Power Generation; Chemical Industry Press: Beijing, China, 2000. [Google Scholar]
  5. McLarty, D.; Brouwer, J.; Samuelsen, S. A spatially resolved physical model for transient system analysis of high temperature fuel cells. Int. J. Hydrogen Energy 2013, 38, 7935–7946. [Google Scholar] [CrossRef] [Green Version]
  6. Aguiar, P.; Adjiman, C.S.; Brandon, N.P. Anode-supported intermediate temperature direct internal reforming solid oxide fuel cell. I: Model-based steady-state performance. J. Power Sources 2004, 138, 120–136. [Google Scholar]
  7. Gemmen, R.S.; Johnson, C.D. Effect of load transients on SOFC operation: Current reversal on loss of load. J. Power Sources 2005, 144, 152–164. [Google Scholar]
  8. Achenbach, E. Three-dimensional and time-dependent simulation of a planar solid oxide fuel cell stack. J. Power Sources 1994, 49, 333–348. [Google Scholar]
  9. Hofmann, P.; Panopoulos, K.D. Detailed dynamic Solid Oxide Fuel Cell modeling for electrochemical impedance spectra simulation. J. Power Sources 2010, 195, 5320–5339. [Google Scholar] [CrossRef]
  10. Campanari, S.; Iora, P. Comparison of finite volume SOFC models for the simulation of a planar cell geometry. Fuel Cells 2005, 5, 34–51. [Google Scholar] [CrossRef]
  11. Ota, T.; Koyama, M.; Wen, C.; Yamada, K.; Takahashi, H. Object-based modeling of SOFC system: Dynamic behavior of micro-tube SOFC. J. Power Sources 2003, 118, 430–439. [Google Scholar] [CrossRef]
  12. Iora, P.; Aguiar, P.; Adjiman, C.S.; Brandon, N.P. Comparison of two IT DIR-SOFC models: Impact of variable thermodynamic, physical, and flow properties. Steady-state and dynamic analysis. Chem. Eng. Sci. 2005, 60, 2963–2975. [Google Scholar]
  13. Park, J.; Li, P.; Bae, J. Analysis of chemical, electrochemical reactions and thermo-fluid flow in methane-feed internal reforming SOFCs: Part I—Modeling and effect of gas concentrations. Int. J. Hydrogen Energy 2012, 37, 8512–8531. [Google Scholar]
  14. Pregelj, B.; Vrečko, D.; Petrovčič, J.; Jovan, V.; Dolanc, G. A model-based approach to battery selection for truck onboard fuel cell-based APU in an anti-idling application. Appl. Energy 2015, 137, 64–76. [Google Scholar] [CrossRef]
  15. Murshed, A.K.; Huang, B.; Nandakumar, K. Control relevant modeling of planer solid oxide fuel cell system. J. Power Sources 2007, 163, 830–845. [Google Scholar]
  16. Adhikari, P.; Abdelrahman, M. Modeling, Control, and Integration of a Portable Solid Oxide Fuel Cell System. J. Fuel Cell Sci. Technol. 2012, 9, 11010–11014. [Google Scholar] [CrossRef]
  17. Mueller, F.; Brouwer, J.; Jabbari, F.; Samuelsen, S. Dynamic Simulation of an Integrated Solid Oxide Fuel Cell System Including Current-Based Fuel Flow Control. J. Fuel Cell Sci. Technol. 2006, 3, 144–154. [Google Scholar]
  18. Zabaniotou, A. Agro-residues implication in decentralized CHP production through a thermochemical conversion system with SOFC. Sustain. Energy Technol. Assess. 2014, 6, 34–50. [Google Scholar]
  19. Fardadi, M.; Mueller, F.; Jabbari, F. Feedback control of solid oxide fuel cell spatial temperature variation. J. Power Sources 2010, 195, 4222–4233. [Google Scholar] [CrossRef]
  20. Sorrentino, M.; Pianese, C. Model-based development of low-level control strategies for transient operation of SOFC systems. J. Power Sources 2011, 196, 9036–9045. [Google Scholar] [CrossRef]
  21. Lanzini, A.; Leone, P. Experimental investigation of direct internal reforming of biogas in solid oxide fuel cells. Int. J. Hydrogen Energy 2010, 35, 2463–2476. [Google Scholar] [CrossRef]
  22. Kazempoor, P.; Dorer, V.; Ommi, F. Evaluation of hydrogen and methane-fuelled solid oxide fuel cell systems for residential applications: System design alternative and parameter study. Int. J. Hydrogen Energy 2009, 34, 8630–8644. [Google Scholar]
  23. Sembler, W.J.; Kumar, S. Optimization of a Single-Cell Solid-Oxide Fuel Cell Using Computational Fluid Dynamics. J. Fuel Cell Sci. Technol. 2011, 8, 21007–21012. [Google Scholar]
  24. Xi, H. Dynamic Modeling and Control of Planar SOFC Power Systems; The University of Michigan: Ann Arbor, MI, USA, 2007. [Google Scholar]
  25. Jiang, J.H. Dynamic Modeling and Control of Plate Solid Oxide Fuel Cell System; Huazhong University of Science and Technology Library: Wuhan, China, 2013. (In Chinese) [Google Scholar]
  26. Mueller, F. The Dynamics and Control of Integrated Solid Oxide Fuel Cell Systems: Transient Load Following and Disturbance Rejection; University of California: Irvine, CA, USA, 2008. [Google Scholar]
  27. Larminie, J.; Dicks, A. Fuel Cell Systems Explained, 2nd ed.; John Wiley & Sons Ltd.: Chichester, UK, 2003. [Google Scholar]
  28. Cao, H.L. Dynamic Modeling and Control of Solid Oxide Fuel Cell Power Generation System; Huazhong University of Science and Technology Library: Wuhan, China, 2012. [Google Scholar]
  29. He, W.; Wang, B.; Zhao, H.; Jiao, Y. Doubling the diffusivity measurement efficiency in solid oxide fuel cells (SOFCs) via a bi-sensor electrochemical cell. J. Power Sources 2011, 23, 9985–9998. [Google Scholar]
  30. Lu, N.; Li, Q.; Sun, X.; Khaleel, M.A. The modeling of a standalone solid-oxide fuel cell auxiliary power unit. J. Power Sources 2006, 161, 938–948. [Google Scholar]
  31. Mueller, F.; Fardadi, M.; Shaffer, B.; Brouwer, J.; Jabbari, F. Transient Performance of Integrated SOFC System Including Spatial Temperature Control. In Proceedings of the ASME 2010 Eighth International Fuel Cell Science, Engineering and Technology Conference, Brooklyn, NY, USA, 14–16 June 2010. [Google Scholar]
  32. Ni, M.; Leung, D.Y.; Leung, M.K. Electrochemical modeling and parametric study of methane fed solid oxide fuel cells. Energy Convers. Manag. 2009, 50, 268–278. [Google Scholar]
  33. Zhang, L. Optimization and Control of SOFC System for High Efficiency Load Tracking; Huazhong University of Science and Technology Library: Wuhan, China, 2015. [Google Scholar]
  34. Zabihian, F.; Fung, A.S. Thermodynamic sensitivity analysis of hybrid system based on solid oxide fuel cell. Sustain. Energy Technol. Assess. 2014, 6, 51–59. [Google Scholar]
Figure 1. Physical diagram of the SOFC system.
Atmosphere 14 01261 g001
Figure 2. Schematic diagram of the SOFC system.
Atmosphere 14 01261 g002
Figure 3. SOFC system structure.
Atmosphere 14 01261 g003
Figure 4. Schematic diagram of the nodes and control units.
Atmosphere 14 01261 g004
Figure 5. Validation of SOFC experiments (E) against model simulations and (S) through curve fitting.
Atmosphere 14 01261 g005
Figure 6. Tpen changes over time.
Atmosphere 14 01261 g006
Figure 7. Time variation of each temperature in HEX1.
Atmosphere 14 01261 g007
Figure 8. One-dimensional test diagram of the thermal output characteristics of the SOFC (ac).
Atmosphere 14 01261 g008
Figure 9. Two-dimensional test diagram of the thermal output characteristics of the SOFC.
Atmosphere 14 01261 g009
Figure 10. Three-dimensional test diagram of the thermal output characteristics of the SOFC.
Atmosphere 14 01261 g010
Figure 11. One-dimensional test diagram of the electrical output characteristics of the SOFC (ac).
Atmosphere 14 01261 g011
Figure 12. Two-dimensional test diagram of the electrical output characteristics of the SOFC.
Atmosphere 14 01261 g012
Figure 13. Three-dimensional test diagram of the electrical output characteristics of the SOFC.
Atmosphere 14 01261 g013
Disclaimer/Publisher’s Note: The statements, opinions and data contained in all publications are solely those of the individual author(s) and contributor(s) and not of MDPI and/or the editor(s). MDPI and/or the editor(s) disclaim responsibility for any injury to people or property resulting from any ideas, methods, instructions or products referred to in the content.

