
Estimation of Road Transportation Emissions in Colombia from 2010 to 2021
by
 , , , and
Laura Mantilla-Romo
1,2,3,
Yiniva Camargo-Caicedo
1,2,
Sindy Bolaño-Diaz
1,2,
Fredy Tovar-Bernal
1,2 and
Angélica Garrido-Galindo
1,2,* 1
Programa de Ingeniería Ambiental y Sanitaria, Facultad de Ingeniería, Universidad del Magdalena, Santa Marta 470001, Colombia
2
Grupo de Investigación en Modelación de Sistemas Ambientales (GIMSA), Facultad de Ingeniería, Universidad del Magdalena, Santa Marta 470001, Colombia
3
Programa +Mujer, +Ciencia, +Equidad, MINCIENCIAS (Colombia) en Alianza con la Organización de los Es-tados Iberoamericanos para la Educación, la Ciencia y la Cultura (OEI), MINCIENCIAS, Bogotá 110010, Colombia
*
Author to whom correspondence should be addressed.
Atmosphere 2023, 14(7), 1167; https://doi.org/10.3390/atmos14071167
Submission received: 7 June 2023
/
Revised: 7 July 2023
/
Accepted: 13 July 2023
/
Published: 19 July 2023
(This article belongs to the Special Issue Traffic Related Emission)
Abstract
:This work aimed to estimate the emissions associated with the transport sector in Colombia during the 2010–2021 period for the following four groups of pollutants: greenhouse gases or GHG (CO2, CH4, N2O), ozone precursors (CO, NMVOC, NOx), acidifying gases (NH3, SO2), and aerosols (PM, BC), based on the data provided by the Ministry of Mines and Energy. The estimate of emissions from road transportation was calculated using a standardized method with a top-down approach consistent with the 2006 IPCC Guidelines for National GHG Inventories and the EEA/EMEP Emission Inventory Guidebook 2019. Total annual emissions and the emissions for regions were estimated, and a comparison was made between estimated emissions and the emissions calculated by the Emissions Database for Global Atmospheric Research (EDGAR). Total annual emissions by road transport showed a progressive increase except for the annual emissions in 2020, which registered a reduction due to the COVID-19 lockdown. The highest yearly emissions were reported in 2021, with the most significant contributions by GHG (33,109.29 Gg CO2, 201.55 Gg CO2 Eq. CH4, and 512.43 Gg CO2 Eq. N2O). The Andean region was the one with the highest contributions of total emissions within the four groups of pollutants (57–66%), followed by the Caribbean (12–20%) and the Pacific region (14–18%). The most-used fuel was gasoline, with an increase of 103% for personal cars and motorcycles throughout the study period. These results contribute to decision-making at local, regional, and national levels regarding energy transition opportunities and strategies to adopt in the transport sector.
1. Introduction
Emerging nations have increased alert levels for urban air pollution in their main cities globally. Air pollution can come from many sources of emission, both natural and anthropogenic, including industrial processes, power generation [1], vehicles emissions [2], agricultural activities [3,4], burning forests [5], sea aerosols [6], and biogenic emissions [7], among others. In earlier studies such as those carried out by Sunil Gulia et al. [8], the scientific evidence regarding air pollution’s health impact and data on air quality have been considered for inclusion in the recommendations of the WHO Global Air Quality Guidelines about the primary pollutants responsible for urban air quality deterioration. Therefore, air pollution brings severe consequences for sustainable development and climate change [1,9], as well as for human welfare and the environment [10].
It is estimated that between 59% and 85% of the primary pollutants in the atmosphere of megacities originate from emissions from vehicle sources, with contributions of 59–65% of nitrogen oxides, 67% of carbon oxide, and 85% of particulate matter [9,11,12]. Also, transportation is the second-largest source of energy-related CO2 emissions globally, contributing 25% of the total. The emissions [13,14] above are attributed to population growth and the increase of vehicles for mobility with the consequent increase in road infrastructure, making carbon emissions from road transport one of the main issues related to environmental management [15,16]. Then, it is necessary to respond to Sustainable Development Goal 13: climate action should be oriented toward taking urgent action to combat climate change and its impacts with targets such as integrating climate change measures into national policies and strategies, in addition to promoting mechanisms for raising the capacity for effective climate change-related planning and management in the least-developed countries [17,18]. Since fuel combustion emissions control from the transport sector plays an essential role in mitigating global climate change [19], it is necessary to quantify the sectorial emissions to understand the magnitude of the problem in each country and achieve substantial progress.
Some of the most relevant pollutants in air quality are nitrogen oxides (NOx), sulfur dioxide (SO2), carbon monoxide (CO), particulate matter (PM), and volatile organic compounds (VOC), these being some of the compounds generated by various anthropogenic activities, such as the use of fossil fuels by road vehicles [2]. So, it is possible to affirm that the transport sector emits CO2 and non-CO2 pollutants. These can be classified into four main groups: (i) greenhouse gases (GHG) that include carbon dioxide (CO2), methane (CH4), and nitrous oxide (N2O), with methane emissions associated with leakage from the filling of fuel vehicles; (ii) ozone precursors gases, such as carbon monoxide (CO), non-methane volatile organic compounds (NMVOC), nitrogen oxides (NOx) emitted by internal combustion engines, and evaporative emissions; (iii) acidifying gases, such as ammonia (NH3) and sulfur dioxide (SO2); (iv) aerosols, including primary and secondary particulate matter (PM as PM10 and PM2.5), and black carbon (BC), with this last example resulting from diesel engine operation, non-exhaust emissions from tires, brakes, and road abrasion, and combusting heavy distillate fuels [20].
Therefore, within the strategies adopted in Colombia for air pollution reduction associated with transportation, it is worth noting the improvement of fuel quality due to current regulations about its sulfur composition, which seek to reduce SOx emissions produced in vehicle combustion, and the viability of the entry of vehicle fleets with better technology, leading to reduced air pollution and greater efficiency in fuel consumption. In this sense, Law 1205/2008 established that for the diesel transportation systems, the fuel sulfur composition should have been less than 3000 ppm from 1 July 2008 until 31 December 2008. Starting from 1 January 2009, the diesel composition should have had less than 2500 ppm sulfur up until 31 December 2009. Subsequently, diesel with less than 500 ppm sulfur was used until 31 December 2012. As of this date, diesel with less than 50 ppm sulfur must be used [21].
However, for the Integrated Mass Transportation Systems (SITM, in Spanish) of all urban centers in the country, diesel with less than 50 ppm sulfur must be used as of 1 January 2010. Since 2010, the reduction has been 50 ppm of sulfur in diesel and 270 ppm in gasoline [21]. Subsequently, Law 1972/2019 established the sulfur content of diesel between 15–10 ppm until 1 January 2023; by 1 December 2025, it must be 10 ppm sulfur. It also established that as of 1 January 2023, the mobile sources with a diesel cycle engine manufactured, assembled, or imported into the country, with a national operating range, will have to follow the pollutant emission standards corresponding to Euro VI technology. And finally, from 1 January 2035, all diesel-powered vehicles circulating in the country must comply with the pollutant emission standards corresponding to Euro VI technology [22]. Recently, Resolution 40103/2021 established progressive changes in the sulfur content standard in gasoline, indicating that until 30 April 2021, it would be 300 ppm, and from 1 May 2021, it would be 100 ppm. After 31 December 2021, it would be 50 ppm, and finally, from 31 December 2030, it will be 10 ppm [23]. It is important to specify that before the validity of this resolution, the fuel quality standard listed in Tables S2 and S3 of the supplementary material was forced.
On the other hand, the vehicle emission standards have been applied in Colombia since 1996 with the passing by the Ministries of Environment and Transportation of Resolution 005/1996. However, this regulation was repealed in 2008 by Resolution 910/2008, which established the maximum permissible levels of pollutant emissions that mobile sources must comply with. Resolution 910/2008 was partially modified by Resolution 1111/2013 due to the air quality data of the country’s largest urban center’s registered PM10 values that exceeded the maximum permissible standard established for Colombia, affecting population health [24,25,26]. The cause of this situation was associated with diesel vehicle emissions; therefore, more restrictive regulations were established [27]. Resolution 762/2022 was recently issued by the Ministry of the Environment, which repealed the previous resolutions [28]. The preceding is in response to document CONPES 3943/2018 guidelines. This document indicates that gasoline with a 50-ppm sulfur content will be distributed as of 2021, which allows the adoption of emission standards equivalent to Euro IV technologies that reduce particulate emissions by up to 80% compared to the previous Euro III standard [29].
It is crucial to indicate that according to Perez 2023 in Colombia, the deaths attributable to PM2.5 exposure reached an average of 7754 deaths by the year 2018, with the causes being related to ischemic heart disease and lung cancer, accounting for 36.8% and 8.5% of mortality, respectively [30]. These deaths were concentrated in the main cities (Bogotá, Cali, and Medellín) and some intermediate cities (Barranquilla, Bucaramanga, Cartagena, and Cucutá). The economic valuation of mortality due to annual exposure to PM2.5 was estimated at 11.74 trillion pesos, compared to the GDP value of approximately 1.19% for 2018. According to the data reported by the Colombian air quality monitoring systems, the pollutants associated with the most significant problems are PM10 and PM2.5; however, there are other relevant pollutants due to their impact on health and the environment, such as combustion gases (NOx, SO2, CO, among others), volatile organic compounds, or even secondary pollutants formed by photochemicals, as in the case of tropospheric ozone [31]. The evolution of the concentrations reported by the air quality monitoring stations for criteria pollutants in Colombia (PM10, PM2.5, SO2, NO2, O3, CO) during 2014–2021 showed values between 151–173 µg/m3 PM10, 89–131 µg/m3 PM2.5, 32–63 µg/m3 SO2, 20–57 µg/m3 NO2, 35–57 µg/m3 O3, and 15–42 µg/m3 CO [32].
Due to this, in Colombia, the WHO Global Air Quality Guidelines have been progressively adopted. For this reason, in 2010 Resolution 610/2010 was issued and was later updated by Resolution 2254/2017, which establishes the air quality standard for criteria pollutants and adopts provisions for the air management resource to guarantee a healthy environment and minimize the risk to human health that may be caused by exposure to pollutants in the atmosphere. For the year 2021, 92.4% of the stations for air quality monitoring systems complied with the maximum permissible annual level of PM10 (50 µg/m3), and the most exceedances were in Bogotá D.C. and the Antioquia and Cundinamarca departments (Andean region), as well as the Magdalena department (Caribbean region). Regarding PM2.5, 94.3% of the stations complied with the annual standard (25 µg/m3), with the most exceedances in Bogotá D.C. and the Antioquia department (Andean region). While all stations met the annual NO2 standard (60 µg/m3), stations located in Bogotá D.C. and the Antioquia department (Andean region) exceeded the daily SO2 level (50 µg/m3) and the eight-hour O3 level (100 µg/m3), and two stations located in Bogotá D.C. exceeded the eight-hour CO level (5000 µg/m3) [32]. Resolution 2254/2017 includes a goal for 2030 focused on reducing the annual levels of PM10, PM2.5, and NO2, meeting the intermediate objective three of the WHO Global Air Quality Guidelines (30 µg/m3, 15 µg/m3, and 40 µg/m3, respectively) and the daily level of 20 µg/m3 SO2 [33,34].
Otherwise, for establishing mechanisms that lead to air pollution reduction, one of the strategies suggested is to carry out a reliable emissions inventory [35]. These emission inventories are used to determine GHG emission balances, estimate air quality in urban areas, or assess the environmental impact of a new facility, among other applications [36]. There needs to be more knowledge of emissions from road transport in South America. Earlier emissions inventories have found that PRE-EURO heavy-duty vehicles emitted close to 25% of particulate matter emissions, which leads to the conclusion that approximately 1.3% of the country’s vehicle fleet is responsible for the emissions of this pollutant [31]. Other studies about top-down and bottom-up inventories that estimate mobile source emissions in Bogotá D.C. provide a tool to identify areas with significant emissions and establish actions for emissions reduction. However, the results are highly uncertain due to the limitations of available and quality data [37]. In addition, the emission inventory studies led in Colombia have been applied in the short-term and are mainly carried out in Bogotá D.C [38,39]. Nevertheless, conducting emission inventories in developing countries like Colombia poses challenges due to poor data quality. However, the information obtained from these inventories becomes the basis for establishing control strategies, so it is necessary to have global emission inventories, which have traditionally been an alternative [40]. A key aspect of the quantifying of these inventories is using global information, as is the case of the Emissions Database for Global Atmospheric Research-EDGAR (https://edgar.jrc.ec.europa.eu/ (accessed on 12 March 2023)).
The aim of this study was to estimate the emissions associated with the transport sector in Colombia during the 2010–2021 period for four groups of pollutants: GHG (CH4, CO2, N2O), ozone precursor gases (CO, NMVOC, NOx), aerosols (BC, PM10, PM2.5), and acidifying gases (NH3, SO2). Although this work does not supply a projection for future emissions scenarios, it shows the measures recently adopted in the country to minimize emissions from the transport sector, which makes up the basis for the subsequent analysis of the effectiveness of the implemented actions and the decision-making about the fulfillment of the net-zero commitments for reducing emissions to 45% by 2030 and as close to zero as possible by 2050.
2. Materials and Methods
2.1. Study Area
Colombia is in the northwest of South America at 12°30′46″ N, 4°13′30″ S, 66°50′54″ W, and 79°01′23″ W and has a continental area of 1,141,748 km2. It is divided politically into a capital district (Bogota D.C.) and 32 departments that integrate five geographical regions (Andean, Amazon, Caribbean, Orinoquia, and Pacific), which have population differences, and according to the projections of the Departamento Administrativo Nacional de Estadísticas (DANE), dwellers for 2021 are distributed as follow: the Andean Region, including Bogota D.C., with 28,573,971 inhabitants (55.43%); the Amazon Region registers 1,061,757 inhabitants (2.06%); the Caribbean Region has 11,676,992 inhabitants (22.66%); the Orinoquia Region has 1,943,530 inhabitants (3.78%); and the Pacific Region has 8,287,996 inhabitants (16.07%) [41]
The data provided by the Ministry of Mines and Energy indicate that during 2021, the country consumed an average of 7,767,322 m3 of gasoline and 5,851,248 m3 of diesel oil from the various vehicle categories (personal car, cargo vehicle, public transport, motorcycle, and others). The gasoline consumption was represented by personal cars, motorcycles, and others, while the diesel consumption was related to the activities of personal cars, cargo vehicles, public transport, and other vehicles. Furthermore, the transport sector represents 40% of total energy consumption in the country, and road transport corresponds to 88% of consumption in this sector [42]. For 2021, the vehicle fleet was 17,020,451 units, classified as personal cars, cargo vehicles, and motorcycles [43].
2.2. Emissions Estimate
The national level of annual atmospheric emissions from the road transport sector was estimated during the period 2010–2021 for four groups of pollutants that affect climate change, air quality, and health: greenhouse gases or GHG (CO2, CH4, N2O), ozone precursors (CO, MNVOC, NOx), acidifying gases (SO2, NH3), and aerosols (PM10, PM2.5, BC).
For the elaboration of the emission inventories, a standardized methodology with a top-down approach consistent with the 2006 IPCC Guidelines for National Greenhouse Gas Inventories [44] and the EEA/EMEP Emission Inventory Guidebook 2019 [45] was used. The inventory guide supplies three methods for calculating atmospheric emissions: Tier 1 is a method based on estimations using a linear relationship between fuel consumption and a default emission factor. Tier 2 estimates emissions using fuel consumption as activity data and national emission factors. On the other hand, Tier 3 is an advanced method in which activity data and emission factors depend on the type and technology of the vehicle. Based on the available information, the Tier 1 method was chosen for this study (except for the estimation of SO2 emissions); it has also been used in several previous works [46,47,48]. A detail from the Tier 2 method was used to calculate SO2 emissions from Colombia’s fuel emission factors. The calculation was made using Equation (1), as follows:
where E(p) is the total emission for pollutant p, Fuelf,v is the fuel sold (diesel, gasoline) for the type of vehicle v, and Efp,f,v is the emission factor for pollutant p, for the type of fuel f and vehicle v.
The monthly data on fuel sold were supplied by the Ministry of Mines and Energy from available data for each department or administrative unit comprising the regions. This information was focused on diesel and gasoline consumption due to it representing almost all transport sector consumption [49]. The percentage of fuel consumption by vehicle category was obtained from the indicative action plan for energy efficiency [42]. The emission factors used for the vehicle category and fuel were selected from the database EEA/EMEP Emission Inventory Guidebook 2019 [45]. A Tier 2 approach was employed to calculate SO2 emissions due to the country-specific emission factor extracted from the FECOC calculator. Table S1 of the Supplementary Material shows the emission factors used in this study. The emission factors provided by the EMEP/EEA database and the IPCC have a 95% confidence interval. Emissions in CO2 Eq were calculated for CH4 and N2O based on 100-year Global Warming Potential (GWP100) values from the IPCC Fifth Assessment Report (CO2:1, CH4:28, N2O:265) [50]. The results were shown as total annual emissions, the emission variations, and emissions for regions for four groups of pollutants. The summary methodology is presented in Figure 1.
2.3. Fuel Consumption by Vehicle Type
The fuel consumption data, specifically gasoline and diesel, for the 2010–2021 period were provided by the Ministry of Mines and Energy and analyzed according to the vehicle to establish consumption behavior in the country for personal vehicles, cargo vehicles, public transport, motorcycles, and others.
2.4. Comparison between Estimated Emissions and the Emissions Calculated by the Emissions Database for Global Atmospheric Research (EDGAR)
Additionally, a comparison was made with the emissions calculated by the Emissions Database for Global Atmospheric Research (EDGAR) [51], which supplies information on annual emissions of GHG up to the year 2018 and data for ozone precursors, acidifying gases, and aerosols emissions, which are available up to 2015. The emissions calculation uses a technology-based emission factor approach consistent with all world countries and activity data derived from international statistics. The method is summarized in the following Equation (2) [51].
The emissions EM of a country c of pollutant x for each year y and sector i was calculated by multiplying the AD activity data of each sector i with the technology mix j TECH and a percentage decrease for each of the k end-of-cycle EOP measures based on technology. On the other hand, the country-specific emission factor EF for each compound c, sector i, and technology j, with relative emission reduction RED, is not controlled by the installed reduction measure k. These results were shown as percentages to find emission variations by the four groups of pollutants. The percentage difference was calculated by comparing the estimated emissions with the EDGAR database values for the four groups of pollutants, and these percentages were obtained by comparing the emission data each year with the earlier one. Some studies reported in the literature, such as a work carried out in Cuba, use comparison tools to evaluate the similarity and discrepancy of a local inventory and EDGAR data, showing high values of road transport EF for a few pollutants (PM10, CO, NOx, CH4, and SO2) used by EDGAR and low differences in terms of activity data [17]. On the other hand, another comparison of a local emissions inventory and EDGAR data reported that for the transport sector, EDGAR recorded a difference of 60 Gg in CH4 emissions; in addition, it showed high values in rural areas and low values in urban, densely populated areas [36].
3. Results
3.1. Total Annual Emissions
Figure 2 shows the total annual emissions estimated for road transport for the four groups of pollutants during the period 2010–2021. It is possible to show that the higher emissions were reported in 2021, obtaining the following values for GHG emissions: 33,109.29 Gg CO2, 512.43 Gg CO2 Eq. N2O, and 201.55 Gg CO2 Eq. CH4. Ozone precursor emissions were 2046.08 Gg, 306.78 Gg, and 622.53 Gg for CO, NOx, and NMVOC, respectively. In addition, the aerosol emissions recorded 7.51 Gg PM (PM10 y PM2.5) and 2.82 Gg BC, while the acidifying gases emissions reported values of 5.04 Gg NH3 and 1.36 Gg SO2.
In general, a progressive increase in annual emissions for each pollutant group was seen, except for the annual emission values during 2017, which remained constant compared to the previous year. In addition, annual emissions in 2020 registered a notable reduction in this study’s four groups of pollutants. The above is due to the declaration of the COVID-19 health emergency, whose protection measures such as lockdown contributed to many economic sectors interrupting their activities, reducing mobility and therefore also reducing fuel consumption [2].
Table 1 shows the percentage variation of the emission pollutants during the period 2010–2021. The results showed that emissions increased significantly in 2011 compared to 2010. On the other hand, from 2012 to 2014, the total emissions for pollutants increased by a range of 3–6%, while in 2015, the emissions showed similar behavior to the period 2010–2011, highlighting variation emissions for N2O, CO, and NH3 with 11–12%, and those of CH4 and NMVOC with 11%. For 2017, the lowest emission variations were reported to stay constant for CO2, NOx, SO2, and PM emissions compared to 2016. Substantial emission reductions were identified in the year 2020 as a result of lockdown in various economic sectors for the COVID-19 pandemic, as opposed to the results in 2021 that presented growth in the emissions for the four groups of pollutants, with variation emission values between 15–22% and with economic reactivation being the main factor that influenced the 30% increase in fuel consumption during 2021 as opposed to the decrease reported in consumption of −20% during 2020 [52]. The increment of emission changes was also influenced by factors such as the increase in the participation of automotive service stations in the fuel marketing chain and the increase in the vehicular fleet.
3.2. Emissions for Regions
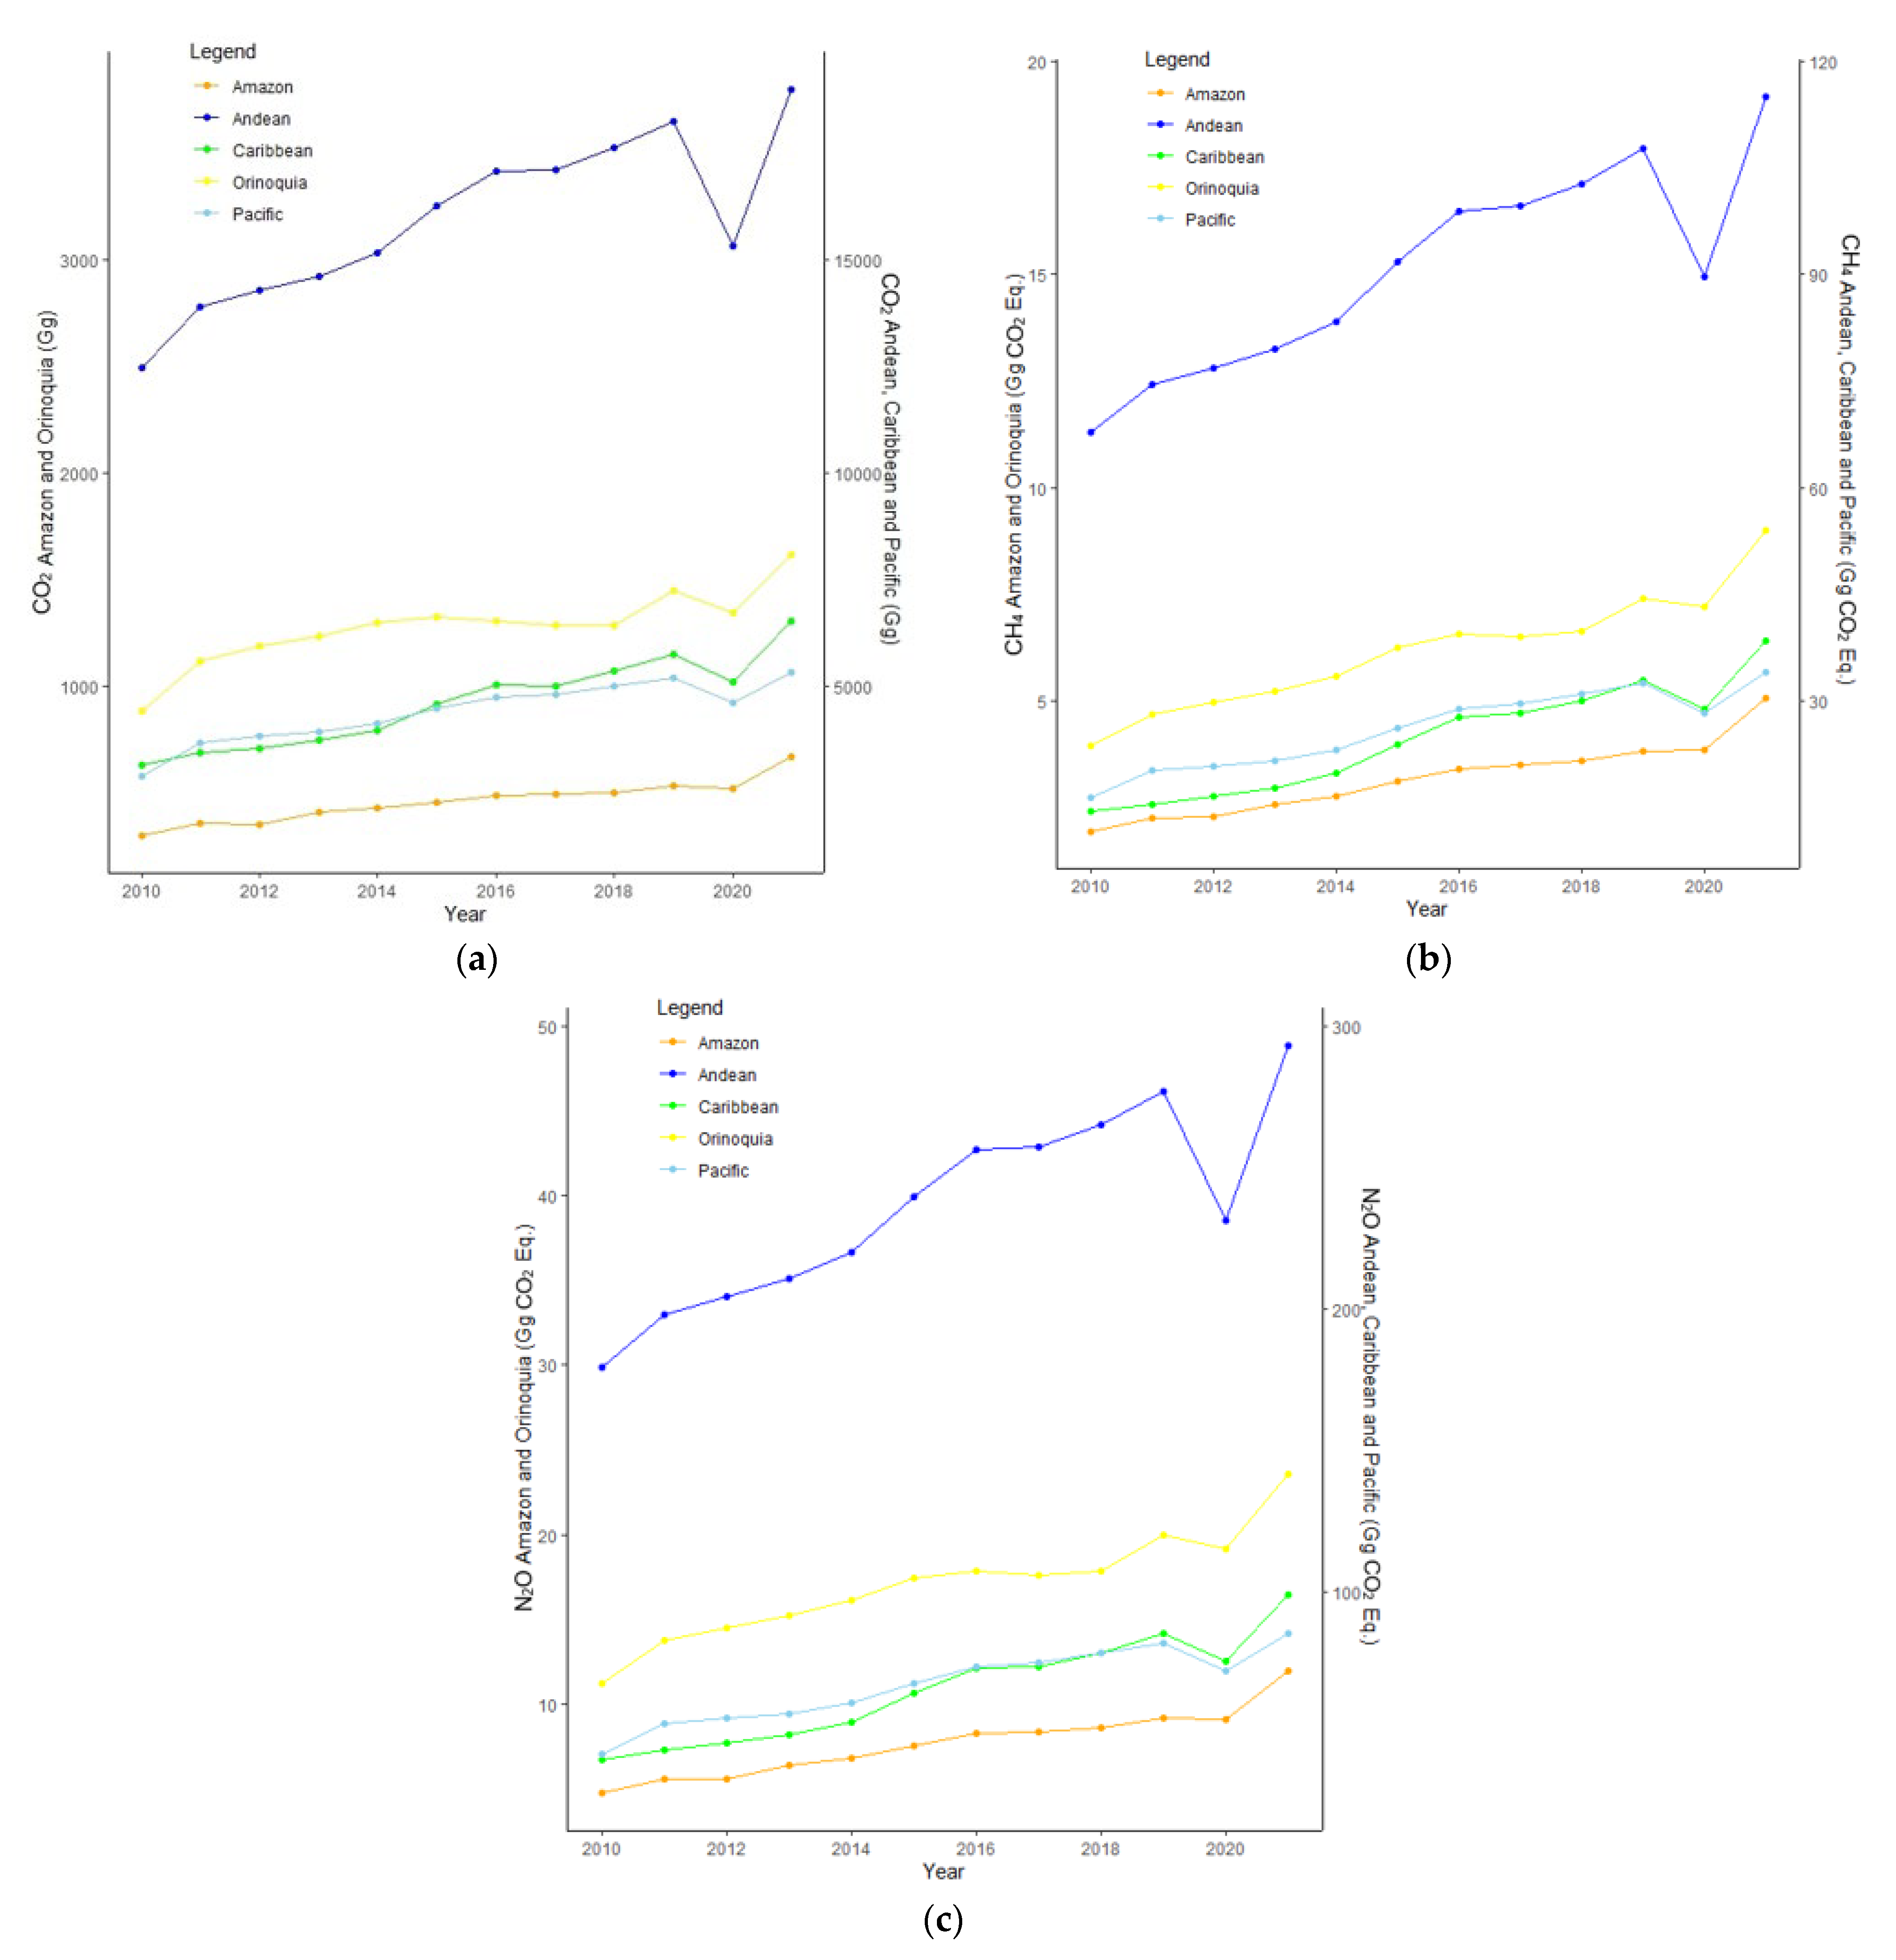
Figure 3 shows the total GHG emissions of the regions during the period 2010–2021. The results report that these emissions were higher in the Andean region, with contributions to the country’s total emissions being the following: 57–63% for CO2, 57–65% for CH4, and 57–66% for N2O. The emissions in the Caribbean region were in the range of 15–20% for CO2, 13–19% for CH4, and 12–19% for N2O, while the Pacific region registered contributions between 15–17% for CO2, 16–18% for CH4, and 16–18% for N2O. The lowest contributions were obtained in the Amazon and Orinoquia regions, with 2–3% and 4–5%, respectively.
Table S4 of the Supplementary Material shows the regional emissions of ozone precursors, acidifying gases, and aerosols. The contributions that stand out include the Andean region with 57–65% for ozone precursors (CO, NMVOC, and NOx), followed by the Pacific region (15–18%) and the Caribbean region (12–20%), while the Amazon and Orinoquia regions reported contributions between 1–3% and 4–5%, respectively. For acidifying gases, the most extensive registers were in the Andean region with 57–64% for SOx and 57–65% for NH3; the Pacific and Caribbean regions reported similar contribution ranges, i.e., 15–18% and 13–19%, respectively, and again the Amazon and Orinoquia regions obtained registers between 2–5%, with the Amazon region being the region with the lowest contribution. Finally, the aerosols emissions in the Andean region were between 57–64%, followed by the contributions of the Caribbean region with 15–20%, the Pacific region with 14–17%, and the Orinoquia region with 4–6%, and in the case of the Amazon region the contribution was 1–2%.
3.3. Analysis of Fuel Consumption by Vehicle Type
Figure 4 shows the historical fuel consumption during the period 2010–2021 for gasoline and diesel according to vehicle type and total consumption, identifying that the most-used fuel was gasoline, which experienced an increase of 103% throughout the study period for personal cars and motorcycles, while the diesel consumption mainly was used for cargo vehicles and public transport, showing an increase of 40%. A decrease in fuel consumption was observed in 2020 due to the lockdown due to the declaration of the health emergency of COVID-19 [52,53]. The total gasoline consumption from 2010 to 2021 increased by 50%, and diesel consumption increased by 28%.
3.4. Comparison between Estimated Emissions and the Emissions Calculated by EDGAR
EDGAR-recorded values show variations for the four groups of pollutants in contrast to the data estimated in this study (see Table 2). CO2 and NOx emissions calculated by EDGAR showed few differences related to this study, while NH3, NMVOC, and N2O emissions reported high percentages of variation compared to emissions estimated in this model. On the other hand, SO2 emissions that were estimated using a national emission factor also show medium percentage differences versus those calculated by EDGAR.
4. Discussion
Total annual emissions estimated during the period 2010–2021 by road transport for the four groups of pollutants in Colombia showed a progressive increase (except in the years 2017 and 2020) associated with the high consumption of fossil fuels, and therefore the dependence on these in transport sector activities. It is important to note that during the lockdown due to the COVID-19 pandemic, the impact on air quality in cities with high vehicular traffic was positive, registering a reduction in pollution levels due to the isolation measures, which generated a decrease in the use of the vehicle fleet and in industrial activities [54] and consequently improvements in air quality in the main cities of the Caribbean [55]. So, the significant reduction in 2020 was because of the pandemic closure in the transportation sector [56,57].
In terms of the spatiotemporal distribution of emissions in the study period, it is possible to affirm that the Andean, Caribbean, and Pacific regions concentrate 94.16% of the Colombian population due to socioeconomic and environmental conditions and the geographical location, which favors productive activities, and therefore these regions also contain a more significant number of anthropogenic sources such as mobile sources, as these regions are responsible for the most considerable of the four groups of pollutant emissions, with the largest contributions in the Andean region. The foregoing is consistent with the results of the highest contributions and exceedances of the criteria pollutant levels for the Andean region reported in “Informe del Estado de la Calidad del Aire 2021” [32].
It is a fact that the total annual GHG emissions show an increasing trend during the study period (except 2020), with the most significant contribution from CO2 emissions, as was stated in the third National Communication on Climate Change, which indicates that the transport sector is the category with the highest GHG emissions [58]. The second largest contributions were those of ozone precursors, with emissions between 6.05–7.06%, whose highest values were those of CO. Finally, the minor contributions correspond to the groups of acidifying gases and aerosols, with 0.03% and 0.02%, respectively. So, the urban areas’ dynamic associated with anthropogenic activities causes higher fuel consumption, with increases of up to 100% for gasoline in personal cars and motorcycles and up to 40% for diesel in cargo vehicles and public transport. Therefore, it is possible to affirm that the activities of the transport sector reported highly significant contributions of GHG, ozone precursors, acidifying gases, and aerosols related to the combustion process in the transport sector.
In this sense, it is worrying that the results of this study indicate a progressive increase in gasoline and diesel consumption during 2010–2021, which shows a high dependency on the use of fossil fuels in Colombia. This is even more the case as the country has established measures to reduce emissions from vehicles and improve air quality, such as the implementation of regulations about fuel quality, the renewal and replacement of the vehicular fleet with zero and low emission vehicles, and the existing air quality standards. Regarding fuels, the country has made progress in reducing the sulfur content in both diesel and gasoline, but this must be accompanied by a change in vehicle technology. Then, this strategy implies the technological renewal of vehicles that have completed their useful life according to the current regulations or that have obsolete technologies, as is the case for public transport and cargo vehicles weighing more than 10.5 tons; however, the disintegration has had a low implementation rate [31].
In this study, the calculated emissions have been compared with the data reported in the EDGAR inventory. The main discrepancies are related to the methodologies used, since EDGAR applies a bottom-up approach, using region-specific emission factors and additional reduction measures [59]. In addition, the Tier 1 method is considered a reliable method to estimate emissions; however, it limits us to carrying out an in-depth analysis of the influence of changes in technologies on the behavior of emissions.
On the other hand, the adoption of Euro emission standards is an important step toward ensuring that diesel engines manufactured in the country as of 2023 follow the standards corresponding to Euro VI, which was added to management policies to promote the introduction of zero and low emission vehicles through import tax reductions for electric and hybrid vehicles. This has been approved for the importation of 26,400 electric vehicles and the same quantity of hybrids until 2027, and thus offers options for the implementation of strategies regarding energy transition alternatives to supply the requirements of the transportation sector. So, e-mobility provides an opportunity for reducing the use of fossil fuels and decarbonizing this productive sector, i.e., the transformation of the current public transport fleet into electric vehicles, since the increase in GHG emissions from the global transport sector raises questions about the effectiveness of existing transport decarbonization policies and how to achieve net-zero by 2050 [60]. Currently, the National Energy Plan has established the substitution of diesel for natural gas in cargo transportation, with the study of the future demand for this fuel based on lower production and storage infrastructure costs.
5. Conclusions
The emissions from the road transport sector in Colombia during the last 10 years show an increase due to fossil fuel consumption (gasoline and diesel), with an upward trend for the following four groups of pollutants: GHG, ozone precursors, acidifying gases, and aerosols. The quality data allowed us to apply the Tier 1 method for estimating all the pollutants, except SO2, for which Tier 2 was used. Therefore, in future works, it is expected that there will be more data available, such as the characteristics of the vehicular fleet (traffic volume, speed, and categorization), as well as data on a time scale greater than a decade, for the application of Tier 2 or 3 methods to carry out the estimation and to go beyond the analysis of the annual emissions.
It is important to highlight that this work was carried out for the country for a decade, which shows the annual emissions inventory for four groups of pollutants as a basis to improve air quality management and reinforce policies focused on reducing emissions and the commitments of the Paris Agreement. It is not ruled out that future works will include a forecast of emissions of these pollutants under study associated with road transport or other sectors up to 2030 and 2050.
Owing to the progressive change in fuel quality standards during the 2010–2021 period, as well as the recent adoption of Euro VI, the analysis of the impact generated by the application of these control measures was not possible. However, it is expected that such measures will have a positive impact on the emissions of the transport sector. Finally, the energy transition associated with transportation activities is one of the current challenges in Colombia which requires continuing to carry out complementary technical studies to find alternative fuels, technologies, and priority actions to accomplish country goals.
Supplementary Materials
The following supporting information can be downloaded at: https://www.mdpi.com/article/10.3390/atmos14071167/s1, Table S1: Emission factors; Table S2: Quality standard of Gasoline; Table S3: Quality standard of Diesel; Table S4: Regional emissions of ozone precursors, acidifying gases and aerosols (Gg).
Author Contributions
Conceptualization, L.M.-R. and Y.C.-C.; methodology, L.M.-R.; formal analysis, L.M.-R., Y.C.-C. and F.T.-B.; data curation, L.M.-R.; writing—original draft preparation, L.M.-R., S.B.-D. and Y.C.-C.; writing—review and editing, F.T.-B. and A.G.-G.; visualization, L.M.-R.; supervision, Y.C.-C.; project administration, Y.C.-C.; funding acquisition, A.G.-G. All authors have read and agreed to the published version of the manuscript.
Funding
This research was funded by MINCIENCIAS-OEI, Programa +Mujer, +Ciencia + Equidad, and the APC was funded by UNIVERSIDAD DEL MAGDALENA.
Institutional Review Board Statement
Not applicable.
Informed Consent Statement
Not applicable.
Data Availability Statement
The data used in this study are available to individuals upon request.
Acknowledgments
The authors are grateful to Engineer Dagy Cabarcas for your technical support in making tables and figures and in the organization data of the manuscript.
Conflicts of Interest
The authors declare no conflict of interest.
Abbreviations
| FECOC | Colombian fuel emission factor |
| EMEP | European Monitoring and Evaluation Programme |
| EEA | Europe Environment Agency |
| EDGAR | Emissions Database for Global Atmospheric Research |
References
- WHO-Global Air Quaily. WHO Global Air Quality Guidelines: Particulate Matter (PM2.5 and PM10), Ozone, Nitrogen Dioxide, Sulfur Dioxide and Carbon Monoxide; World Heal. Organ., no. Report No. 09/2020; WHO: Geneva, Switzerland, 2021; p. 1302. [Google Scholar]
- Camargo-Caicedo, Y.; Mantilla-Romo, L.C.; Bolaño-Ortiz, T.R. Emissions reduction of greenhouse gases, ozone precursors, aerosols and acidifying gases from road transportation during the COVID-19 lockdown in Colombia. Appl. Sci. 2021, 11, 1458. [Google Scholar] [CrossRef]
- Garrido, A.P.; Tovar, F.T.; Fontanilla, J.D.; Camargo-Caicedo, Y. Assessment of livestock greenhouse gases in Colombia between 1995 and 2015. Heliyon 2022, 8, e1226. [Google Scholar] [CrossRef]
- Camargo, Y.C.; Garrido Galindo, A.P.; Fuentes, I.M.; Vegara, E. Association of the chemical composition and nutritional value of forage resources in Colombia with methane emissions by enteric fermentation. Trop. Anim. Health Prod. 2023, 55, 8. [Google Scholar] [CrossRef]
- Bolaño-Diaz, S.; Camargo-Caicedo, Y.; Tovar Bernal, F.; Bolaño-Ortiz, T.R. The Effect of Forest Fire Events on Air Quality: A Case Study of Northern Colombia. Fire 2022, 5, 191. [Google Scholar] [CrossRef]
- Silva, L.F.; Milanes, C.; Pinto, D.; Ramirez, O.; Lima, B.D. Multiple hazardous elements in nanoparticulate matter from a Caribbean industrialized atmosphere. Chemosphere 2020, 239, 124776. [Google Scholar] [CrossRef]
- Camargo-Caicedo, Y.; Bolaño-Ortiz, T.R.; Alvarez-Mancilla, A. Emisiones de Compuestos Orgánicos Volátiles de Origen Biogénico y su Contribución a la Dinámica Atmosférica Biogenic Volatile Organic Compound Emissions and Their Contribution to Atmospheric Dynamic. Intropica 2010, 5, 77–86. Available online: http://revistas.unimagdalena.edu.co/index.php/intropica/article/view/155/136 (accessed on 15 May 2023).
- Gulia, S.; Shiva Nagendra, S.M.; Khare, M.; Khanna, I. Urban air quality management-A review. Atmos. Pollut. Res. 2015, 6, 286–304. [Google Scholar] [CrossRef] [Green Version]
- Grassi, Y.S.; Brignole, N.B.; Díaz, M.F. Vehicular fleet characterisation and assessment of the on-road mobile source emission inventory of a Latin American intermediate city. Sci. Total Environ. 2021, 792, 148255. [Google Scholar] [CrossRef]
- Sivarethinamohan, R.; Sujatha, S.; Priya, S.; Sankaran; Gafoor, A.; Rahman, Z. Impact of air pollution in health and socio-economic aspects: Review on future approach. Mater. Today Proc. 2021, 37, 2725–2729. [Google Scholar] [CrossRef]
- Baldasano, J.M. COVID-19 lockdown effects on air quality by NO2 in the cities of Barcelona and Madrid (Spain). Sci. Total Environ. 2020, 741, 140353. [Google Scholar] [CrossRef] [PubMed]
- Yan, L.; Sheng, B.; He, Y.; Lu, S.; Guo, J. Forecasting and Planning Method for Taxi Travel Combining Carbon Emission and Revenue Factors—A Case Study in China. Int. J. Environ. Res. Public Health 2022, 19, 11490. [Google Scholar] [CrossRef] [PubMed]
- United Nations Environment Programme-UNEP. Emissions Gap Emissions Gap Report 2020; United Nations Environment Programme-UNEP: Nairobi, Kenya, 2020. [Google Scholar]
- International Energy Agency. Global Energy Review 2021. In Global Energy Review 2019; International Energy Agency: Paris, France, 2021. [Google Scholar] [CrossRef]
- Liu, Y.; Ye, K.; Wu, L.; Chen, D. Estimating quantity and equity of carbon emission from roads based on an improved LCA approach: The case of China. Int. J. Life Cycle Assess. 2022, 27, 759–779. [Google Scholar] [CrossRef]
- Grael, P.F.F.; Oliveira, L.S.B.L.; Oliveira, D.S.B.L.; Bezerra, B.S. Life cycle inventory and impact assessment for an asphalt pavement road construction—A case study in Brazil. Int. J. Life Cycle Assess. 2021, 26, 402–416. [Google Scholar] [CrossRef]
- Madrazo, J.; Clappier, A.; Belalcazar, L.C.; Cuesta, O.; Contreras, H.; Golay, F. Screening differences between a local inventory and the Emissions Database for Global Atmospheric Research (EDGAR). Sci. Total Environ. 2018, 631, 934–941. [Google Scholar] [CrossRef] [PubMed]
- Zhang, X.; Wang, Y. How to reduce household carbon emissions: A review of experience and policy design considerations. Energy Policy 2017, 102, 116–124. [Google Scholar] [CrossRef]
- Solaymani, S. CO2 emissions patterns in 7 top carbon emitter economies: The case of transport sector. Energy 2019, 168, 989–1001. [Google Scholar] [CrossRef]
- Creutzig, F.; Cruz-Nuñez, X.; D’ Agosto, M.; Dimitriu, D.; Figueroa, M.J.; Fulton, L.; Kobayashi, S.; Lah, O.; Mckinnon, A.; Newman, P.; et al. Transport. In Green Energy: Technology, Economics and Policy; CRC Press: London, UK, 2010; pp. 183–199. [Google Scholar] [CrossRef]
- Congreso de la Republica Colombia. Ley 1205 de 2008. Volume 2003. 16 September 2005. Available online: http://www.gobernacion.gob.mx/dof/dof_24-06-2002.pdf (accessed on 5 May 2023).
- Congreso de Colombia. Ley N° 1972 del 18 de Julio de 2019; Congreso de Colombia: Bogotá, Colombia, 2019; p. 5. Available online: https://dapre.presidencia.gov.co/normativa/normativa/LEY1972DEL18DEJULIODE2019.pdf (accessed on 5 May 2023).
- Ministerio de Minas y Energía. Resolucion-40103-2021; Ministerio de Minas y Energía: Bogotá, Colombia, 2021.
- Ministerio de Ambiente y Transporte. Resolución 005 De 1996; Ministerio de Ambiente y Transporte: Bogotá, Colombia, 1996. [Google Scholar]
- Ministerio de Ambiente Vivienda y Desarrrollo. Resolución 910 de 2008; Ministerio de Ambiente Vivienda y Desarrrollo: Bogotá, Colombia, 2008; p. 36. Available online: http://www.minambiente.gov.co/images/normativa/app/resoluciones/f0-Resolución909de2008-NormasyestandaresdeemisiónFuentesfijas.pdf (accessed on 5 May 2023).
- Ministerio de Ambiente y Desarrollo Sostenible. RESOLUCIÓN 1111 de 2013. In Por la cual se Modifica la Resolución 910 2008; Ministerio de Ambiente y Desarrollo Sostenible: Bogotá, Colombia, 2013; pp. 1–17. [Google Scholar]
- Ministerio de Ambiente, Vivienda y Desarrollo Territorial. Política de Prevención y Control de la Contaminación del Aire; Ministerio de Ambiente, Vivienda y Desarrollo Territorial: Bogotá, Colombia, 2010; Volume 1, pp. 53–59.
- Ministerio de Ambiente y Desarrollo Sostenible. Resolucion 0762 (18 July 2022); Ministerio de Ambiente y Desarrollo Sostenible: Bogotá, Colombia, 2022; Volume 0762.
- Departamento Nacional de Planeación (DNP). Conpes 3943: Consejo Nacional de Política Económica y Social República de Colombia Departamento Nacional Deplaneación; Departamento Nacional de Planeación (DNP): Bogotá, Colombia, 2018; p. 115. Available online: https://www.cancilleria.gov.co/documento-conpes-estrategia-atencion-migracion-venezuela (accessed on 12 May 2023).
- Pérez, A.R. Actualización de la Valoración Económica de la Contaminación de Aire Urbano 2015 y 2018; Unión Europea, Agencia Francesa de Desarrollo, Gobierno de Colombia, Fondo Acción: Bogotá, Colombia, 2020. [Google Scholar]
- Ministerio de Ambiente y Desarrollo Sostenible. Estrategia Nacional de Calidad del Aire; Ministerio de Ambiente y Desarrollo Sostenible: Bogotá, Colombia, 2022.
- IDEAM. Informe del Estado de la Calidad del Aire en Colombia; IDEAM: Bogotá, Colombia, 2021.
- Ministerio de Ambiente, Vivienda y Desarrollo Territorial. Resolución Número 610 (24 de Marzo de 2010); Ministerio de Ambiente, Vivienda y Desarrollo Territorial: Bogotá, Colombia, 2010; pp. 1–8.
- Ministerio de Ambiente y Desarrollo Sostenible. Resolución 2254 de 2017; Ministerio de Ambiente y Desarrollo Sostenible: Bogotá, Colombia, 2017.
- Patiño-Aroca, M.; Parra, A.; Borge, R. On-road vehicle emission inventory and its spatial and temporal distribution in the city of Guayaquil, Ecuador. Sci. Total Environ. 2022, 848, 157664. [Google Scholar] [CrossRef]
- Puliafito, S.E.; Allende, D.G.; Castesana, P.S.; Ruggeri, M.F. High-resolution atmospheric emission inventory of the argentine energy sector. Comparison with edgar global emission database. Heliyon 2017, 3, e00489. [Google Scholar] [CrossRef] [Green Version]
- Aparicio, L.G.C.; Pérez, M.A.R.; Robles, A.M.C.; Remolina, B.R.G.; Pulido, H.E.S.; Forero, R.A.M.; Quinche, J.E.P. Conciliación de inventarios top-down y bottom-up de emisiones de fuentes móviles en Bogotá, Colombia. Rev. Tecnura 2016, 20, 59. [Google Scholar] [CrossRef] [Green Version]
- Mangones, S.C.; Jaramillo, P.; Fischbeck, P.; Rojas, N.Y. Development of a high-resolution traffic emission model: Lessons and key insights from the case of Bogotá, Colombia. Environ. Pollut. 2019, 253, 552–559. [Google Scholar] [CrossRef]
- Pachón, J.E.; Galvis, B.; Lombana, O.; Carmona, L.G.; Fajardo, S.; Rincón, A.; Meneses, S.; Chaparro, R.; Nedbor-Gross, R.; Henderson, B. Development and evaluation of a comprehensive atmospheric emission inventory for air quality modeling in the megacity of Bogotá. Atmosphere 2018, 9, 49. [Google Scholar] [CrossRef] [Green Version]
- Al Shami, A.; Al Aawar, E.; Baayoun, A.; Saliba, N.A.; Kushta, J.; Christoudias, T.; Lakkis, I. Updated national emission inventory and comparison with the Emissions Database for Global Atmospheric Research (EDGAR): Case of Lebanon. Environ. Sci. Pollut. Res. 2022, 29, 30193–30205. [Google Scholar] [CrossRef] [PubMed]
- DANE. DANE Departamento Administrativo Nacional de Estadística (DANE). Available online: https://www.dane.gov.co/index.php/estadisticas-por-tema/demografia-y-poblacion/proyecciones-de-poblacion (accessed on 21 October 2022).
- UPME—Unidad de Planeación Minero Energética. Plan de Acción Indicativo de Eficiencia Energética 2017–2022; Ministerio de Minas y Energía: Bogotá, Colombia, 2016; pp. 1–157. Available online: http://www1.upme.gov.co/DemandaEnergetica/MarcoNormatividad/PAI_PROURE_2017-2022.pdf (accessed on 12 October 2022).
- Runt. Registro Único Nacional de Tránsito. Available online: https://www.runt.com.co/runt-en-cifras/parque-automotor (accessed on 21 October 2022).
- Davies, W.; Harnisch, J.; Lucon, O.; Mckibbon, S.; Saile, S.; Wagner, F.; Walsh, M. CAPÍTULO 3. Combustión Móvil; Directrices del IPCC 2006 Para los Inventarios Nacionales de Gases de Efecto Invernadero. 2006, p. 78. Available online: https://www.ipcc-nggip.iges.or.jp/public/2006gl/spanish/vol2.html (accessed on 16 September 2022).
- Kenneth, N.O. EMEP/EEA Air Pollutant Emission Inventory Guidebook 2019: Technical Guidance to Prepare National Emission Inventories; European Union: Luxembourg, 2019; Available online: https://www.eea.europa.eu/publications/emep-eea-guidebook-2019 (accessed on 16 September 2022).
- Mir, K.A.; Purohit, P.; Mehmood, S. Sectoral assessment of greenhouse gas emissions in Pakistan. Environ. Sci. Pollut. Res. 2017, 24, 27345–27355. [Google Scholar] [CrossRef] [PubMed]
- Charabi, Y.; Al Nasiri, N.; Al Awadhi, T.; Choudri, B.S.; Al Bimani, A. GHG emissions from the transport sector in Oman: Trends and potential decarbonization pathways. Energy Strategy Rev. 2020, 32, 100548. [Google Scholar] [CrossRef]
- Özyonar, F. Change in highway transportation-induced carbon footprint of Kayseri province. Sigma J. Eng. Nat. Sci. Sigma Mühendislik Fen Bilim. Derg. 2022, 40, 868–876. [Google Scholar] [CrossRef]
- Ministerio de Minas y Energía. Sistema de Información de Combustibles Líquidos de Colombia-SICOM. Available online: https://www.sicom.gov.co/index.php/boletin-estadistico (accessed on 12 October 2022).
- Pachauri, R.K.; de Redacción, E.P.; Meyer, L. Cambio Climático 2014 Equipo Principal de Redacción Equipo Principal de Redacción Unidad de Apoyo Técnico Para el Informe de Síntesis. Available online: http://www.ipcc.ch (accessed on 5 May 2022).
- Comisión Europea y la Agencia de Evaluación Ambiental de los Países Bajos (PBL). EDGAR—Emissions Database for Global Atmospheric Research. Available online: https://edgar.jrc.ec.europa.eu/archived_datasets (accessed on 13 October 2022).
- UPME—Unidad de Planeación Minero Energética. Proyeccion Demanda Energía Eléctrica, Gas Natural y Combustibles Líquidos 2022–2036; Unidad de Planeación Minero Energética: Bogotá, Colombia, 2021.
- Tello-Leal, E.; Macías-Hernández, B.A. Association of environmental and meteorological factors on the spread of COVID-19 in Victoria, Mexico, and air quality during the lockdown. Environ. Res. 2021, 196, 110442. [Google Scholar] [CrossRef]
- Sannigrahi, S.; Kumar, P.; Molter, A.; Zhang, Q.; Basu, B.; Basu, A.S.; Pilla, F. Examining the status of improved air quality in world cities due to COVID-19 led temporary reduction in anthropogenic emissions. Environ. Res. 2021, 196, 110927. [Google Scholar] [CrossRef]
- Bolaño-Ortiz, T.R.; Camargo-Caicedo, Y.; Puliafito, S.E.; Ruggeri, M.F.; Bolaño-Diaz, S.; Pascual-Flores, R.; Saturno, J.; Ibarra-Espinosa, S.; Mayol-Bracero, O.L.; Torres-Delgado, E.; et al. Spread of SARS-CoV-2 through Latin America and the Caribbean region: A look from its economic conditions, climate and air pollution indicators. Environ. Res. 2020, 191, 109938. [Google Scholar] [CrossRef]
- Gonzalez, J.N.; Camarero-Orive, A.; González-Cancelas, N.; Guzman, A.F. Impact of the COVID-19 pandemic on road freight transportation—A Colombian case study. Res. Transp. Bus. Manag. 2022, 43, 100802. [Google Scholar] [CrossRef]
- Emodi, N.V.; Okereke, C.; Abam, F.I.; Diemuodeke, O.E.; Owebor, K.; Nnamani, U.A. Transport sector decarbonisation in the Global South: A systematic literature review. Energy Strategy Rev. 2022, 43, 100925. [Google Scholar] [CrossRef]
- IDEAM. Inventario Nacional y Departamental de Gases Efecto Invernadero—De Gases Efecto; IDEAM: Bogotá, Colombia, 2016.
- Crippa, M.; Guizzardi, D.; Muntean, M.; Schaaf, E.; Dentener, F.; van Aardenne, J.A.; Monni, S.; Doering, U.; Olivier, J.G.J.; Pagliari, V.; et al. Gridded emissions of air pollutants for the period 1970-2012 within EDGAR v4.3.2. Earth Syst. Sci. Data 2018, 10, 1987–2013. [Google Scholar] [CrossRef] [Green Version]
- Ventura, L.M.B.; Ramos, M.B.; Márcio de Almeida, D.A.; Gioda, A. Evaluation of the impact of the national strike of the road freight transport sector on the air quality of the metropolitan region of Rio de Janeiro, Brazil. Sustain. Cities Soc. 2021, 65, 102588. [Google Scholar] [CrossRef]
Figure 1.
Summary methodology for the estimation of emissions.

Figure 2.
Total emissions estimated (Gg) of the four groups of pollutants: (a) GHG, (b) ozone precursors, (c) acidifying gases, and (d) aerosols during the period 2010–2021.
Figure 2.
Total emissions estimated (Gg) of the four groups of pollutants: (a) GHG, (b) ozone precursors, (c) acidifying gases, and (d) aerosols during the period 2010–2021.


Figure 3.
Estimated total GHG emissions of Colombian regions (Andean, Amazon, Pacific, Caribbean, and Orinoquia) during the period 2010–2021: (a) CO2, (b) CH4, (c) N2O.
Figure 3.
Estimated total GHG emissions of Colombian regions (Andean, Amazon, Pacific, Caribbean, and Orinoquia) during the period 2010–2021: (a) CO2, (b) CH4, (c) N2O.

Figure 4.
Fuel consumption by vehicle type: (a) gasoline, (b) diesel.


Table 1.
Emission variations (%) of pollutants in the period 2010 to 2021.
| Pollution/Year | 2011 | 2012 | 2013 | 2014 | 2015 | 2016 | 2017 | 2018 | 2019 | 2020 | 2021 |
|---|---|---|---|---|---|---|---|---|---|---|---|
| CO2 | 12 | 3 | 3 | 4 | 8 | 5 | 0 | 4 | 4 | −16 | 19 |
| CH4 | 11 | 4 | 4 | 6 | 11 | 9 | 1 | 4 | 6 | −17 | 22 |
| N2O | 12 | 3 | 4 | 5 | 10 | 8 | 1 | 4 | 6 | −16 | 21 |
| CO | 11 | 4 | 5 | 6 | 12 | 10 | 1 | 4 | 6 | −17 | 22 |
| NMVOC | 11 | 4 | 5 | 6 | 12 | 10 | 1 | 4 | 6 | −17 | 22 |
| NOx | 13 | 3 | 3 | 4 | 7 | 5 | 0 | 4 | 4 | −16 | 18 |
| SO2 | 12 | 3 | 3 | 4 | 8 | 6 | 0 | 4 | 5 | −16 | 19 |
| NH3 | 11 | 4 | 5 | 6 | 12 | 10 | 1 | 4 | 6 | −17 | 22 |
| PM | 13 | 3 | 3 | 4 | 7 | 4 | 0 | 4 | 4 | −15 | 18 |
| BC | 14 | 3 | 2 | 3 | 5 | 2 | −1 | 3 | 3 | −15 | 15 |
Table 2.
Emission variations (%) estimated versus EDGAR.
| Pollution/Year | 2010 | 2011 | 2012 | 2013 | 2014 | 2015 | 2016 | 2017 | 2018 |
|---|---|---|---|---|---|---|---|---|---|
| CO2 | −5 | −11 | −13 | −11 | −11 | −10 | −9 | −8 | −9 |
| CH4 | −25 | −21 | −21 | −27 | −26 | −23 | −15 | −11 | −11 |
| N2O | 50 | 50 | 50 | 50 | 50 | 50 | 50 | 50 | 50 |
| CO | −31 | −36 | −37 | −40 | −39 | −31 | - | - | - |
| NMVOC | 62 | 51 | 50 | 43 | 46 | 66 | - | - | - |
| NOx | 13 | 7 | 5 | 5 | 3 | 13 | - | - | - |
| SO2 | −55 | −47 | −29 | −29 | −29 | −23 | - | - | - |
| NH3 | 62 | 65 | 65 | 61 | 59 | 67 | - | - | - |
| PM10 | −27 | −34 | −36 | −31 | −31 | −27 | - | - | - |
| PM2.5 | −27 | −34 | −36 | −31 | −31 | −27 | - | - | - |
| BC | −40 | −45 | −46 | −43 | −43 | −41 | - | - | - |
Disclaimer/Publisher’s Note: The statements, opinions and data contained in all publications are solely those of the individual author(s) and contributor(s) and not of MDPI and/or the editor(s). MDPI and/or the editor(s) disclaim responsibility for any injury to people or property resulting from any ideas, methods, instructions or products referred to in the content. |
© 2023 by the authors. Licensee MDPI, Basel, Switzerland. This article is an open access article distributed under the terms and conditions of the Creative Commons Attribution (CC BY) license (https://creativecommons.org/licenses/by/4.0/).
Share and Cite
MDPI and ACS Style
Mantilla-Romo, L.; Camargo-Caicedo, Y.; Bolaño-Diaz, S.; Tovar-Bernal, F.; Garrido-Galindo, A. Estimation of Road Transportation Emissions in Colombia from 2010 to 2021. Atmosphere 2023, 14, 1167. https://doi.org/10.3390/atmos14071167
AMA Style
Mantilla-Romo L, Camargo-Caicedo Y, Bolaño-Diaz S, Tovar-Bernal F, Garrido-Galindo A. Estimation of Road Transportation Emissions in Colombia from 2010 to 2021. Atmosphere. 2023; 14(7):1167. https://doi.org/10.3390/atmos14071167
Chicago/Turabian StyleMantilla-Romo, Laura, Yiniva Camargo-Caicedo, Sindy Bolaño-Diaz, Fredy Tovar-Bernal, and Angélica Garrido-Galindo. 2023. "Estimation of Road Transportation Emissions in Colombia from 2010 to 2021" Atmosphere 14, no. 7: 1167. https://doi.org/10.3390/atmos14071167
Note that from the first issue of 2016, this journal uses article numbers instead of page numbers. See further details here.