Article

Can the Assimilation of the Ascending and Descending Sections’ Data from Round-Trip Drifting Soundings Improve the Forecasting of Rainstorms in Eastern China?

1
China Institute for Radiation Protection, Taiyuan 030006, China
2
Key Laboratory of Meteorological Disaster of Ministry of Education, Nanjing University of Information Science and Technology, Nanjing 210044, China
3
Meteorological Institute of Shaanxi Province, Xi’an 710016, China
*
Author to whom correspondence should be addressed.
Atmosphere 2023, 14(7), 1127; https://doi.org/10.3390/atmos14071127
Submission received: 21 June 2023 / Revised: 29 June 2023 / Accepted: 5 July 2023 / Published: 7 July 2023

Abstract

:
To further examine the effectiveness of the ascending and descending sections of the new round-trip drifting sounding system in forecasting high-impact weather such as heavy rainfall, in this study, three assimilation experiments were designed for a rainstorm in eastern China using WRF (Weather Research and Forecast) and WRFDA-3DVAR. Then, the reasons for the improvement in the effects of forecasting rainfall after assimilation were analyzed from various perspectives. The results showed that the assimilation of round-trip drifting sounding data can increase the accuracy of regions of heavy precipitation and improve the effectiveness of rainstorm forecasting. The quality of the wind field improved after the assimilation of the round-trip drifting sounding data, which improved the conditions of moisture transport, resulting in increased humidity in the lower layer, which accumulated more unstable energy for the development of storms. In addition, the enhanced low-level convergence after the assimilation of the new sounding data created a strong upward motion, which was more conducive to triggering heavy rainfall, thus improving the ability to forecast such heavy rainfall.

1. Introduction

Eastern China is a highly populated and relatively economically developed area. Heavy rainstorms in the region are often likely to cause large economic losses and even flooding and inundation, which can seriously threaten people’s lives and property [1,2]. According to the Ministry of Water Resources of the People’s Republic of China, the total direct economic loss of rainstorm disasters was more than 410 billion dollars from 2010 to 2020 [3]. Much interesting work has been carried out by experts and scholars on the development of rainstorms in eastern China and its mechanism. Zhang et al. showed that large-scale dynamical forcing allows the upward motion required for persistent rainstorms to be maintained [4]. Xu et al. pointed out that rainstorms mostly happen in areas where warm and humid air flows rise along the southern side of cyclones [5]. Weather systems such as shear lines, low-level jets, vortices and typhoons play an important role in rainstorms in eastern China [6,7,8]. Zhou et al. carried out a diagnostic analysis of a heavy precipitation event using the MM5 model and they found that the low vortex that formed and developed on the shear line was the system directly responsible for this rainfall [6]. Li et al. showed that the wind speed convergence of the jet strengthens low-level convergence, which is more conducive to the occurrence of rainstorms [7]. In addition, low-level jets can also serve as a moisture transport belt for precipitation [9]. Ma et al. pointed out that there is a good correspondence between the accumulation of moisture’s effective potential energy and the development of a storm [10]. However, heavy rainfall events are accompanied by the combined effects of multiscale systems [11] and forecasting has a certain degree of complexity; thus, accurate forecasting of heavy rainfall remains an important question in current operational forecasting [12,13].
To improve the numerical prediction of rainstorms, high-resolution observations are often assimilated to obtain better initial fields and thus improve the forecasting ability [14]. Although remote sensing observations such as radar and satellite are becoming more and more available, and provide a large amount of information for forecasting precipitation [15,16], the accuracy of remote sensing data is severely impacted by radiation transmission patterns and complicated topography. Sounding observations are direct observations of the atmosphere in three dimensions and are of better quality than other information, and are often used as ground truth to describe the state of the atmosphere [17,18]. Therefore, the assimilation of sounding data is extremely important in numerical forecasting and can make a strong contribution to improving the quality of forecasts [19,20]. Hattori et al. assimilated additional radiosondes using the LETKF (local ensemble transform Kalman filter) method and found significant increases in the wind speed, temperature and specific humidity in the lower troposphere around the disturbance, which helped to detect disturbances in the early stages in the South China Sea [19]. Although the current spatial and temporal resolution of sounding observations is relatively low, it can still effectively improve forecasts of convective precipitation, and the assimilation of sounding data can improve the simulation of areas and the intensity of rainfall [21,22,23,24]. Bao et al. assimilated conventional sounding data with the WRF-EnKF system and found that the TS score for heavy rainstorms improved from 0.03 to 0.11 [23]. Choi et al. introduced balloon drift information into the cyclic assimilation of sounding data, resulting in more accurate forecasts of precipitation and improved forecasting ability [25]. Generally, operational sounding observations are only observed twice a day. This detection frequency cannot meet the needs of small- and medium-scale monitoring and warning of catastrophic weather. It has been shown that assimilating intensive radiosonde observations is beneficial for improving forecasts of precipitation and the ability to analyze them [26,27,28]. Wang et al. proved the contribution of intensive radiosonde to forecasts of precipitation by OSSEs (observing system simulation experiments) and OSEs (observing system experiments) and pointed out that unconventional observations such as GPS/PW cannot replace intensive radiosonde observations at present [28]. However, intensive radiosondes are expensive and they are difficult to maintain for long periods of time.
To solve the space–time encryption problem of sounding observations in the long term without increasing the cost, the Atmospheric Sounding Centre of China’s Meteorological Administration has developed a new round-trip drifting sounding instrument by combining the features and advantages of ascending and descending soundings [29]. This radiosonde can be released once to obtain three sections of observation: ascending, flat drifting and descending. The drifting time can be more than 4 h, and the distance between the descending and ascending sections is more than several hundred kilometers. Cao et al. compared the round-trip drifting sounding data with the GTS1 sounding data and FNL (NCEP final operational global analysis) data and showed that the deviation in temperature in the ascending and descending sections was ±2 °C, the deviation in air pressure was ±3 hPa, and the deviation in humidity was ±10% [30]. The round-trip drifting sounder uses satellite navigation and positioning technology, which allows more accurate positioning and higher resolution than GTS1, making it easier to capture more detailed changes in the atmosphere [30]. Qian, and Wang et al. also indicated that the quality of the round-trip drifting soundings data reached operational standards [31,32]. Wang et al. showed that the detection accuracy of round-trip drifting soundings exceeded the WMO’s (World Meteorological Organization) breakthrough objectives, and some elements of observation have even exceeded the ideal [32]. Rong et al. verified the accuracy and consistency of round-trip drifting sounding temperature observations based on GNSS (global navigation satellite system) radio occultation data and ERA-Interim reanalyzed data [33]. Wang et al. developed a simulation system for predicting trajectories based on a high-resolution numerical prediction model, which laid the foundation for expanding the fields of application of round-trip drifting soundings [34]. Yang et al. used the new sounding data to analyze the characteristics of the gravity waves of the lower stratosphere, which proved that the descending section can play a role in encrypting the observation of gravity waves [35]. Zhang et al. demonstrated that new sounding data can make a positive contribution to reducing prediction errors through the FSO (forecast sensitivity to observations) method [36].
Round-trip drifting soundings allow for intensive radiosonde observations without increasing the costs, and its observation data have excellent quality and resolution. However, can the assimilation of the ascending and descending sections’ data from round-trip drifting soundings improve the forecasting of rainstorms in eastern China? Studies on this issue are still in the preliminary stage. To solve this problem, this study considered the assimilation and numerical simulation of a rainstorm in eastern China based on conventional observations and round-trip drifting sounding datasets, and analyzed the causes of the differences in the resulting rainstorm forecasts.

2. Data and Precipitation
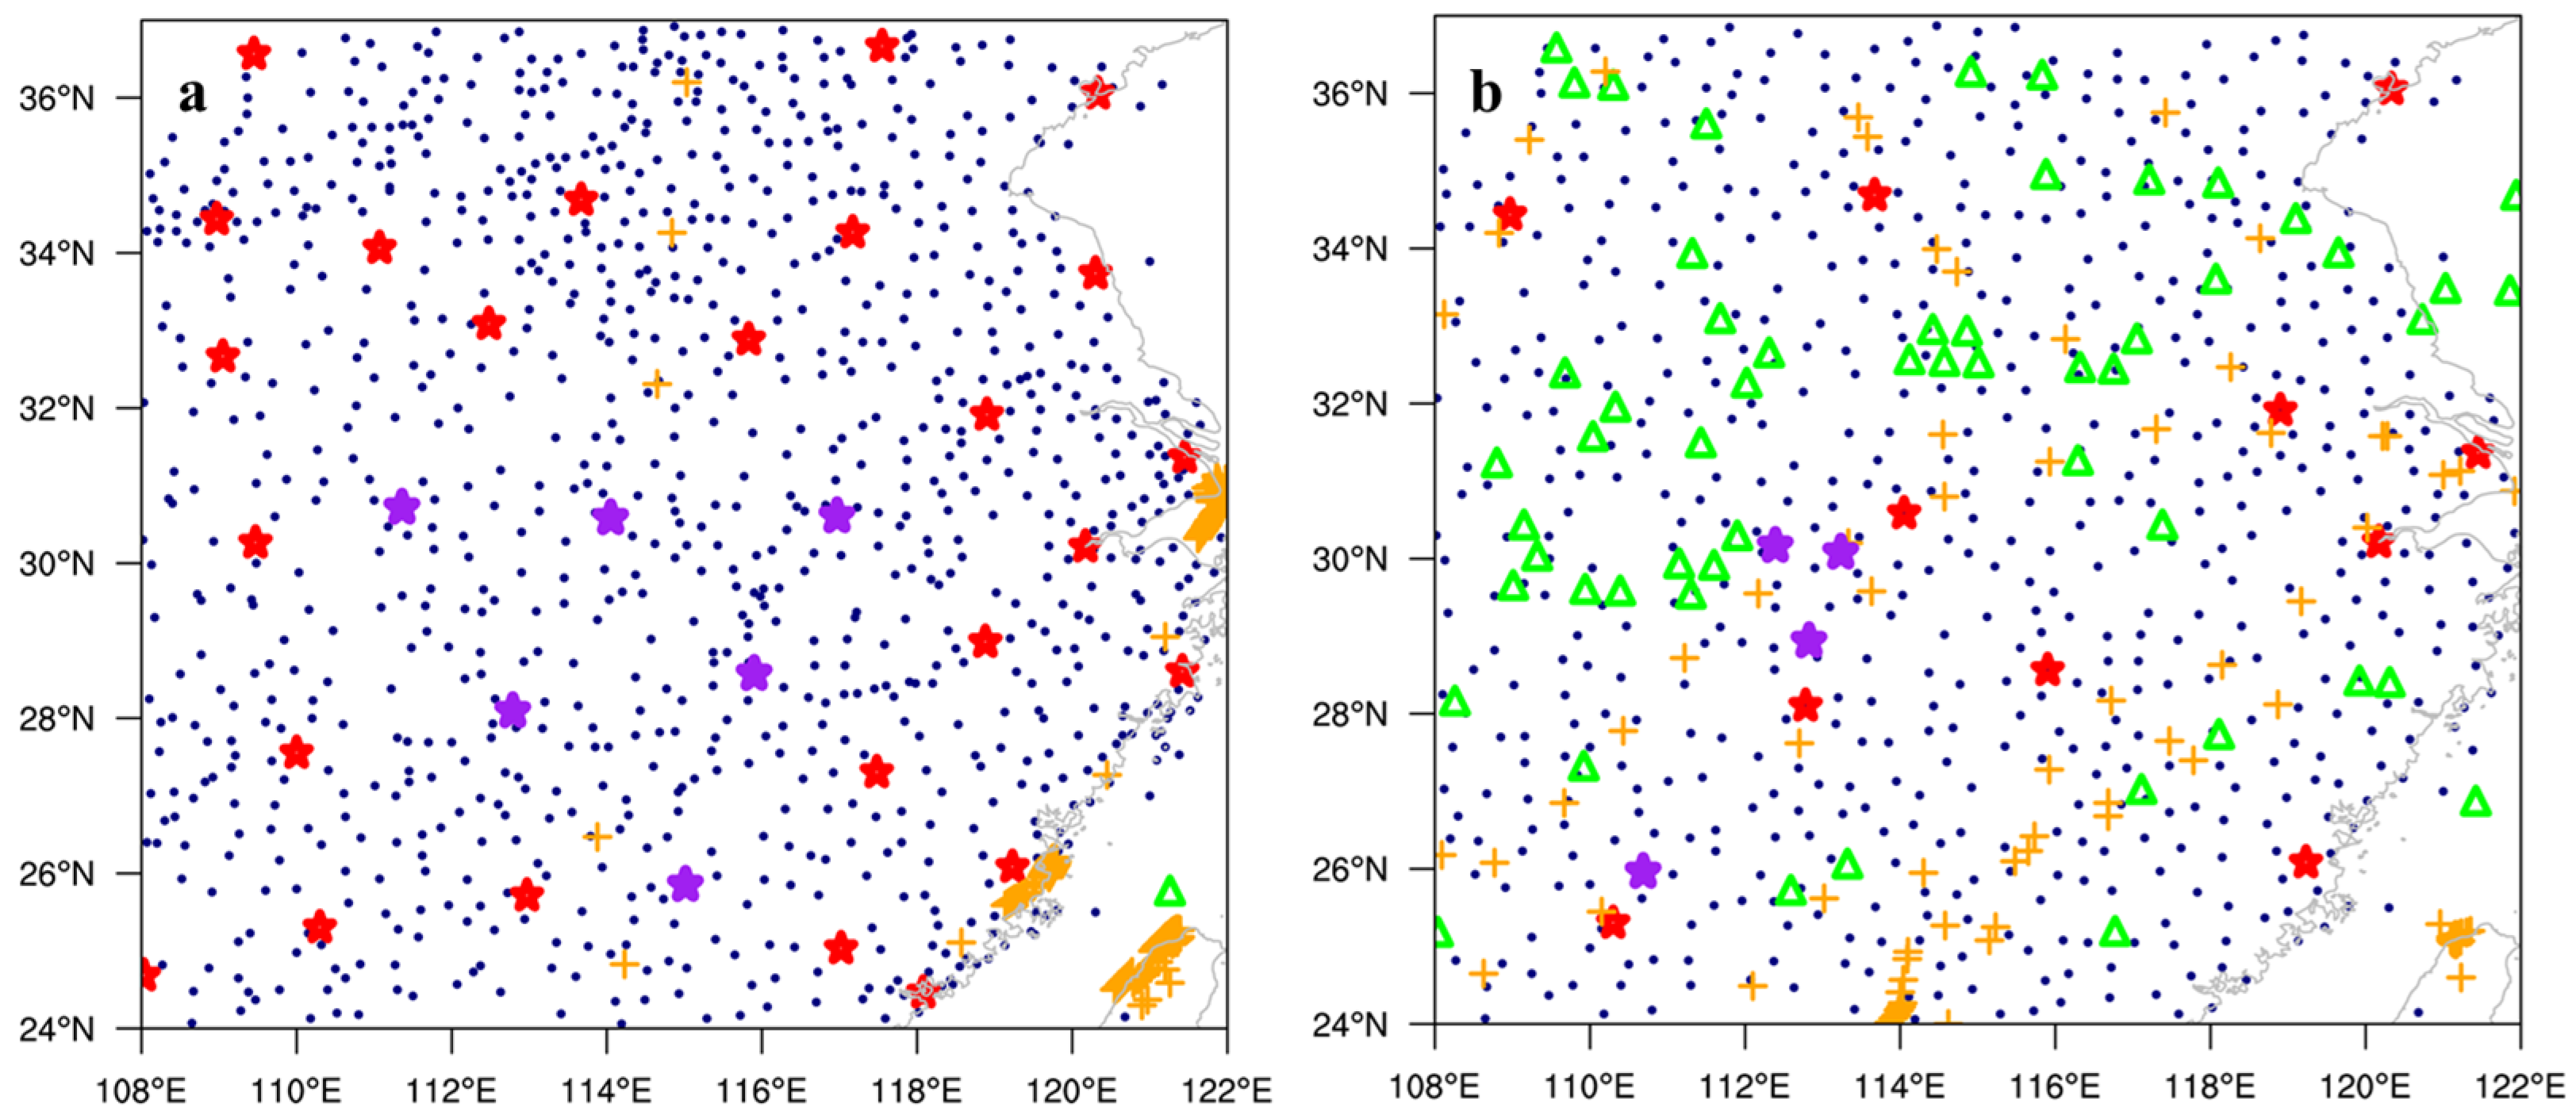
2.1. Observations

The observations used in this study mainly included conventional observations (specifically automatic stations, operational soundings, cloud-tracking winds, aircraft reports and ship reports) and round-trip drifting sounding data.
After the release of the operational sounding data, only a segment of the ascending data can be obtained. However, the round-trip drifting sounding data can obtain observations from the three sections (ascending, drifting and descending) by releasing one balloon. Ascending observations are similar to operational soundings. After the balloon reaches the lower stratosphere, the “outer ball” automatically explodes to observe the start time of the drifting, and the balloon then initiates the sounding observations of the descending section by exploding the “inner ball”. The descending section is similar to the sounding observations obtained by dropping; the difference is that the descending section of the round-trip drifting sounding does not require an aircraft or rocket as a carrier. The distance between the descending and ascending sections is more than several hundred kilometers, which means that intensive radiosonde observations can be obtained without increasing the costs.
Six round-trip drifting sounding stations (Yichang, Wuhan, Anqing, Changsha, Nanchang and Ganzhou) have been built in the middle and lower reaches of the Yangtze River. The round-trip drifting sounding system has now carried out more than 2000 outfield tests. Wang et al. analyzed the uncertainty of round-trip drifting sounding data after quality control by using the model’s forecast field with a high-temporal resolution and the operational sounding observations from the same station as references. Wang et al. established a quality control scheme for round-trip sounding data, including inspection of the extreme values, inversions and rigid values, etc. [32]. Qian and Zhang et al. carried out a quality assessment of round-trip drifting sounding data based on FNL and operational sounding data from the same station, and they found that the deviation in temperature between the ascending and descending sections was ±2 °C and the deviation in air pressure was ±4 hPa. Deviations in the relative humidity also met the current operational standards [31,37]. Multiple studies have demonstrated the availability of observational data for ascending and descending sections [31,32,33,37].
The research used a dataset of hourly precipitation grid points with a spatial resolution of 0.05° × 0.05° as the real precipitation values. This dataset combined data from ground-based automatic stations, radar data and satellite data. Pan et al. showed that the accuracy of the combined data on precipitation was higher than that of any of the three sources of data on precipitation [38]. ERA5 hourly reanalysis data on pressure levels with a horizontal resolution of 0.25° × 0.25° was used in weather analysis (https://cds.climate.copernicus.eu/cdsapp#!/dataset/reanalysis-era5-pressure-levels accessed on 1 June 2023).

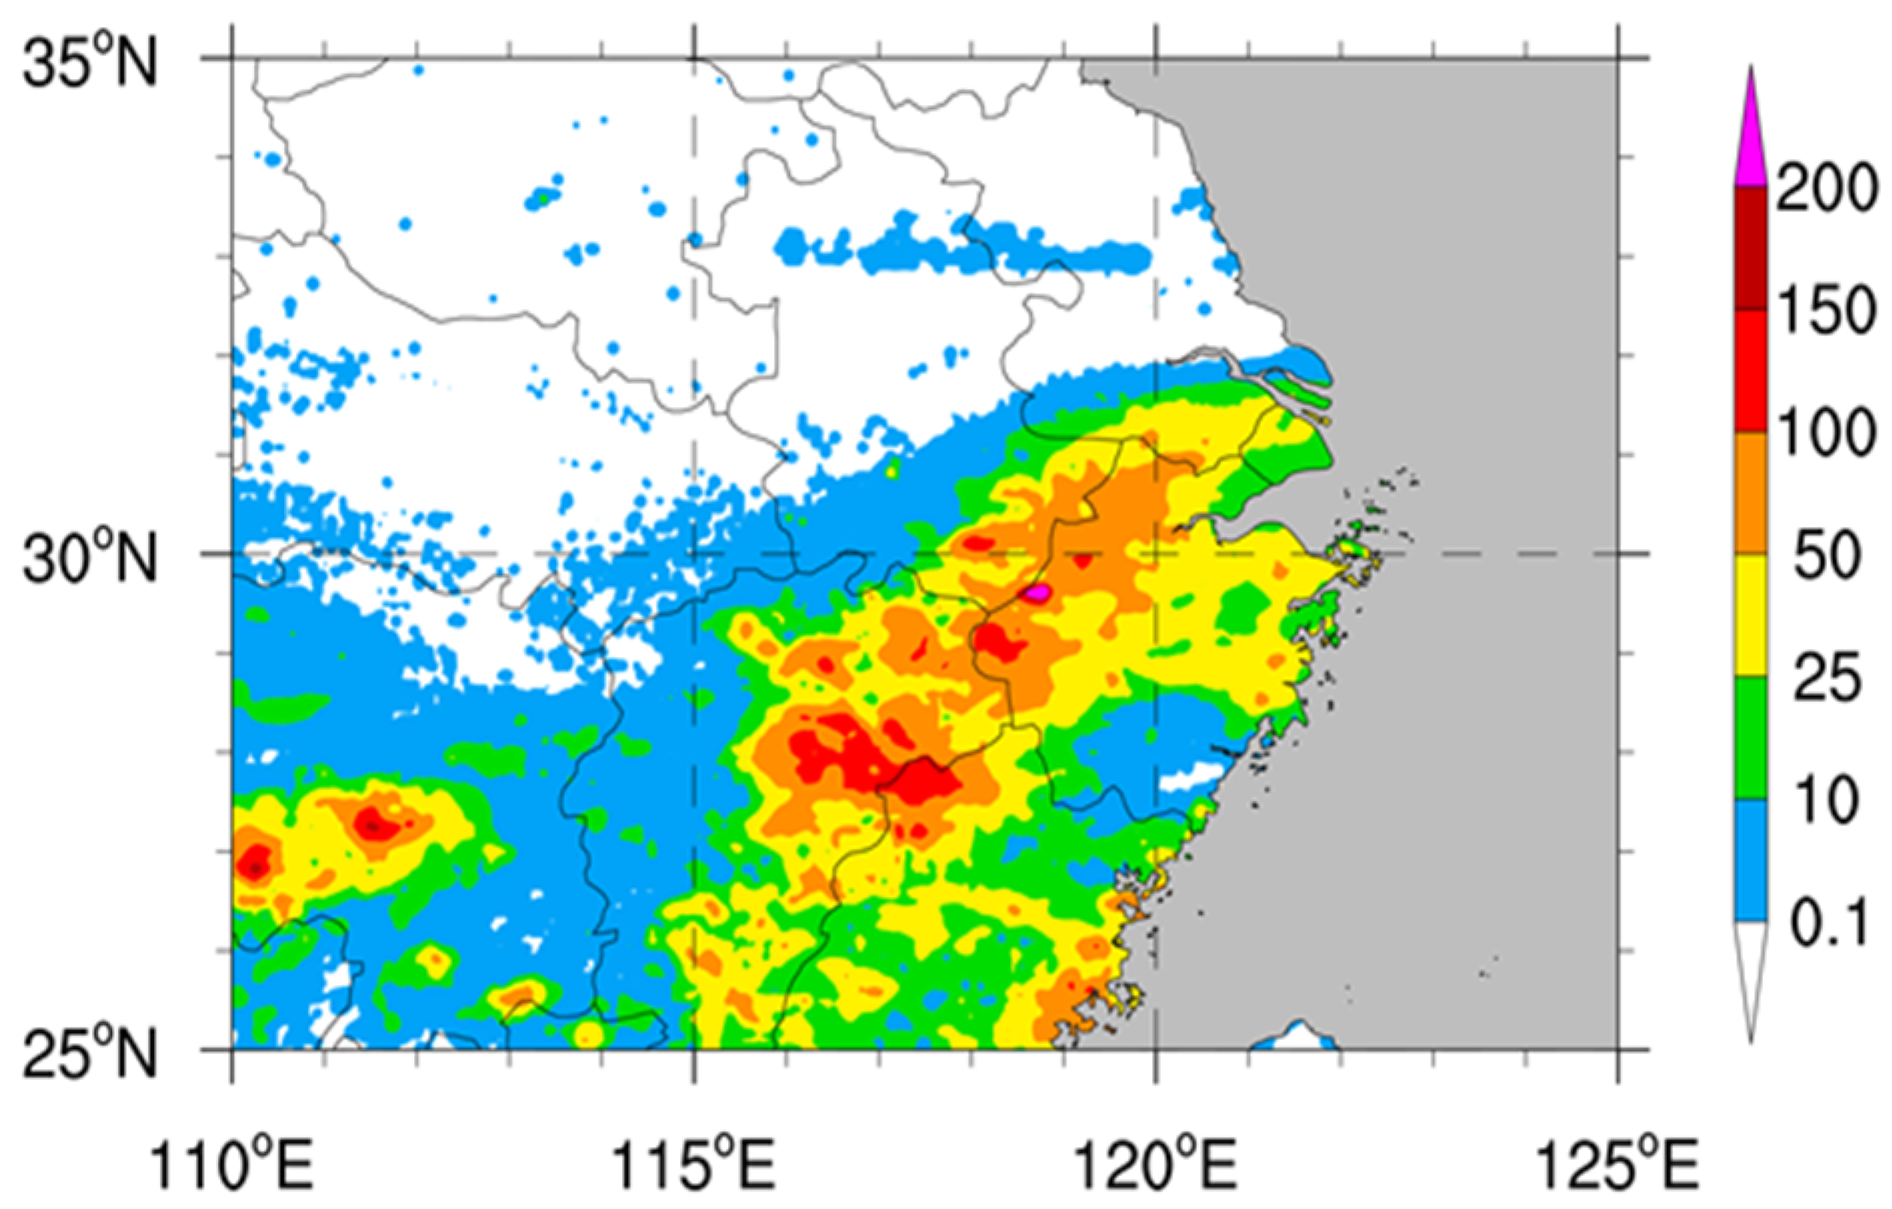
2.2. Real Precipitation

From 19 June 2018 18:00 UTC to 20 June 2018 18:00 UTC, a heavy precipitation event occurred in the middle and lower reaches of the Yangtze River in southeastern Anhui, eastern Jiangxi, northern Zhejiang and central Hunan under the influence of cyclones, shear lines and low-level jets. The distribution of 24 h real cumulative precipitation is shown in Figure 1. The main rain belt was in the area from northern Zhejiang to eastern Jiangxi, showing a northeast–southwest trend. In the east of Jiangxi, there was a large rainstorm center with a cumulative precipitation of more than 100 mm in 24 h. At the junction of Anhui and Zhejiang, there was heavy rainfall of more than 200 mm in local areas.
At 19 June 2018 12:00 UTC, the East Asian trough of 500 hPa was located in the northeast of China, and the temperature trough lagged behind the height trough, which was favorable to the deepening of the trough. At this time, the middle and lower reaches of the Yangtze River were at the rear side of the trough, mainly controlled by westerly and northwesterly air currents, and the wind speed was high, which was conducive to the maintenance of the upward movement (Figure 2a). At 850 hPa, there was a clear cyclone in eastern Hubei and southern Anhui with a significant east–west shear line. The relative humidity at the center of the cyclone reached more than 95% (Figure 2b).

3. Setup of the Model and Experimental Design

The experiment used the WRF version 3.9 model [39] and WRFDA-3DVAR [40]. The modelling area was centered at 30° N, 114° E, with a two-layer nested grid with horizontal resolution of 9 km and 3 km, 38 vertical layers, a model layer topped at 50 hPa and a model integration step of 10 s. The domain is shown in Figure 3a. The initial field and boundary conditions were provided by the FNL data with a resolution of 1° × 1° [40]. The physical parameterization schemes were the WSM5 microphysical parameterization scheme [41,42,43], the RRTM longwave radiation scheme [44], Dudhia’s shortwave radiation scheme [45], Yonsei University’s boundary layer scheme [46], the revised MM5 Monin–Obukhov scheme [47] and the Grell 3D cumulus parameterization scheme [48]. The covariance matrix of the observations for the experiments was CV5. Observations within 3 km domain were assimilated.
The experimental setup is shown in Figure 3b. The start time of all three experiments was 19 June 2018 12:00 UTC. The ascent and descent times of the balloon in the experiment were 19 June 2018 12:00 UTC and 19 June 2018 18:00 UTC, respectively. The CTL experiment assimilated the conventional observations but excluded the operational sounding data from six stations in Yichang, Wuhan, Anqing, Changsha, Nanchang and Ganzhou. The purpose of removing the operational soundings from these six stations was to serve as a control experiment. This allowed an overall assessment of the effects of assimilating the ascending and descending segments of the round-trip drifting soundings. The GTS experiment assimilated all the conventional observations. In other words, the GTS experiment added the operational sounding data of the six stations that were previously removed in the CTL experiment. The purpose of the GTS experiment was twofold. On the one hand, it was compared with the CTL experiment to demonstrate the effect of assimilating the operational sounding data; on the other hand, it was compared with the UDD experiment to study the improvements in the effect of assimilation of round-trip drifting sounding data compared with operational sounding data.
The distribution of the assimilated observations in the UDD experiment is shown in Figure 4, which contains six ascending segments and four descending segments (purple pentagrams). The location of the ascending segments for the round-trip drifting soundings was the same as the location of the operational sounding stations. In the three experiments, the time window of assimilation was set at 3 h before and after the moment of assimilation, with cyclic 3DVAR assimilation at 6-h intervals and cyclic assimilation until 19 June 2018 18:00 UTC for a 72-h forecast. It should be noted that at present, the height of the flat drifting section is about 50 hPa, and assimilating sounding data at this altitude has less impact on forecasts of strong convection. Therefore, no data from the flat drifting section were added in the experiments. Conventional soundings were sparse at 18:00 UTC and the information from the descending section could effectively supplement the sounding observations at that time.

4. Results

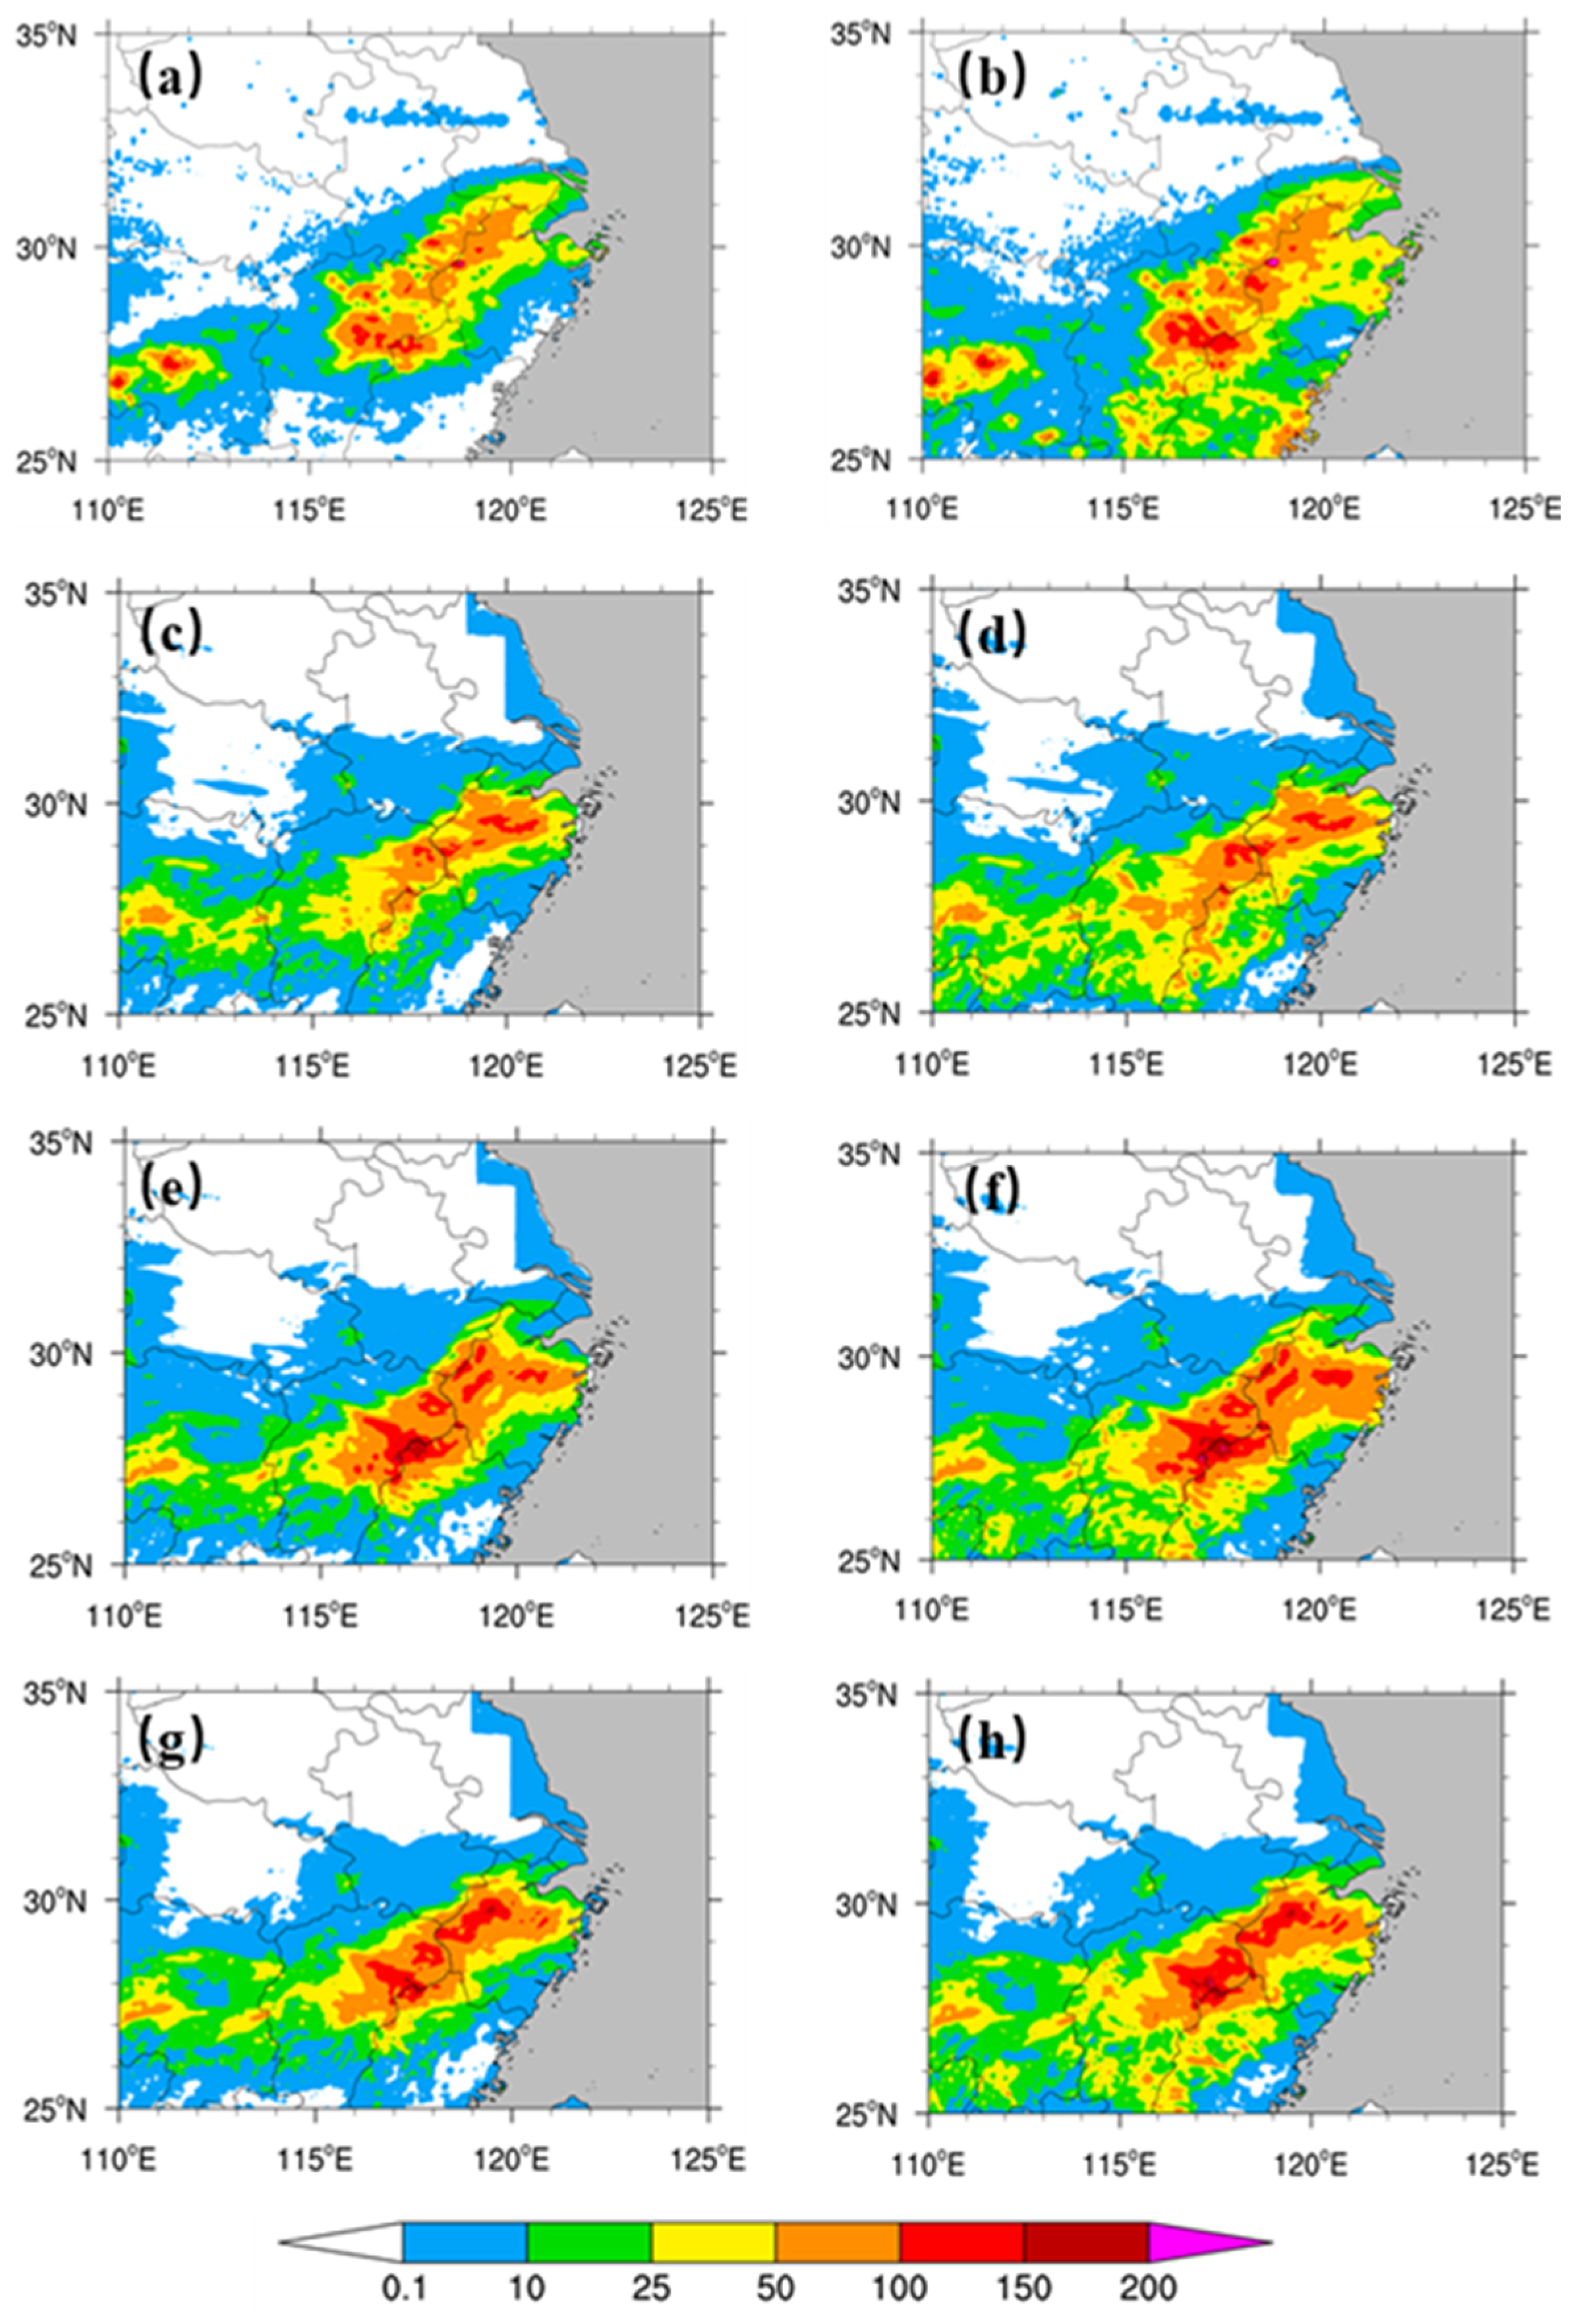
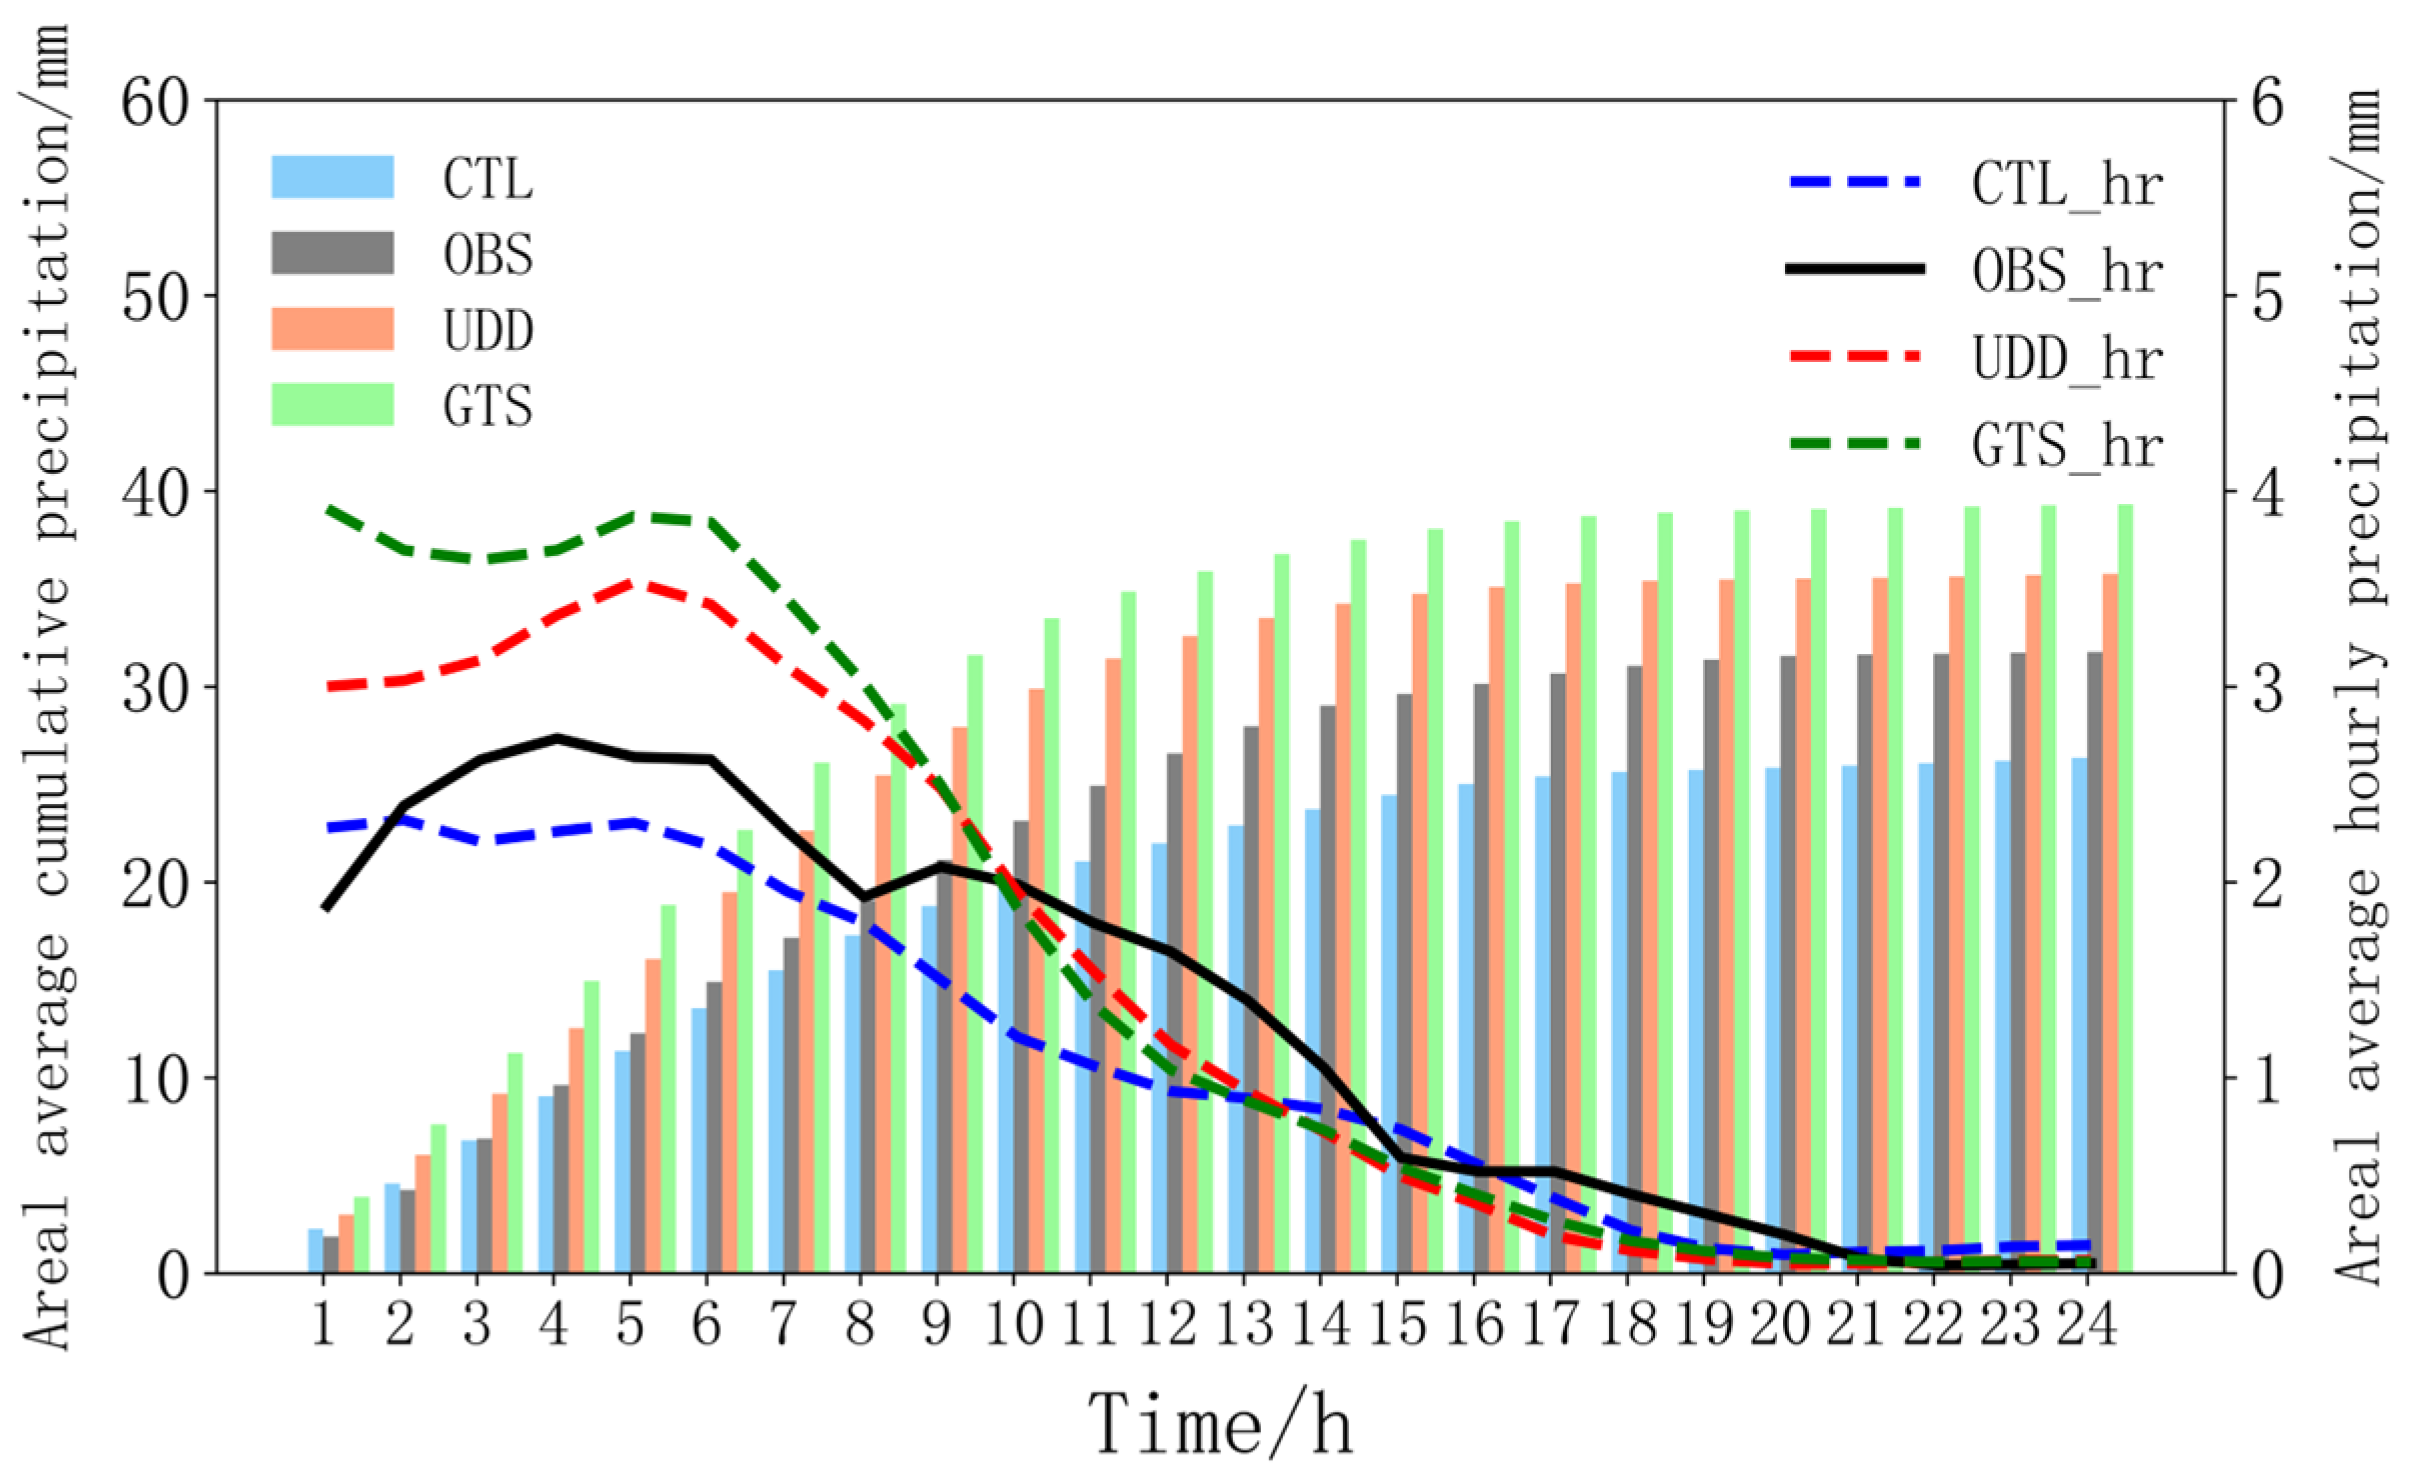
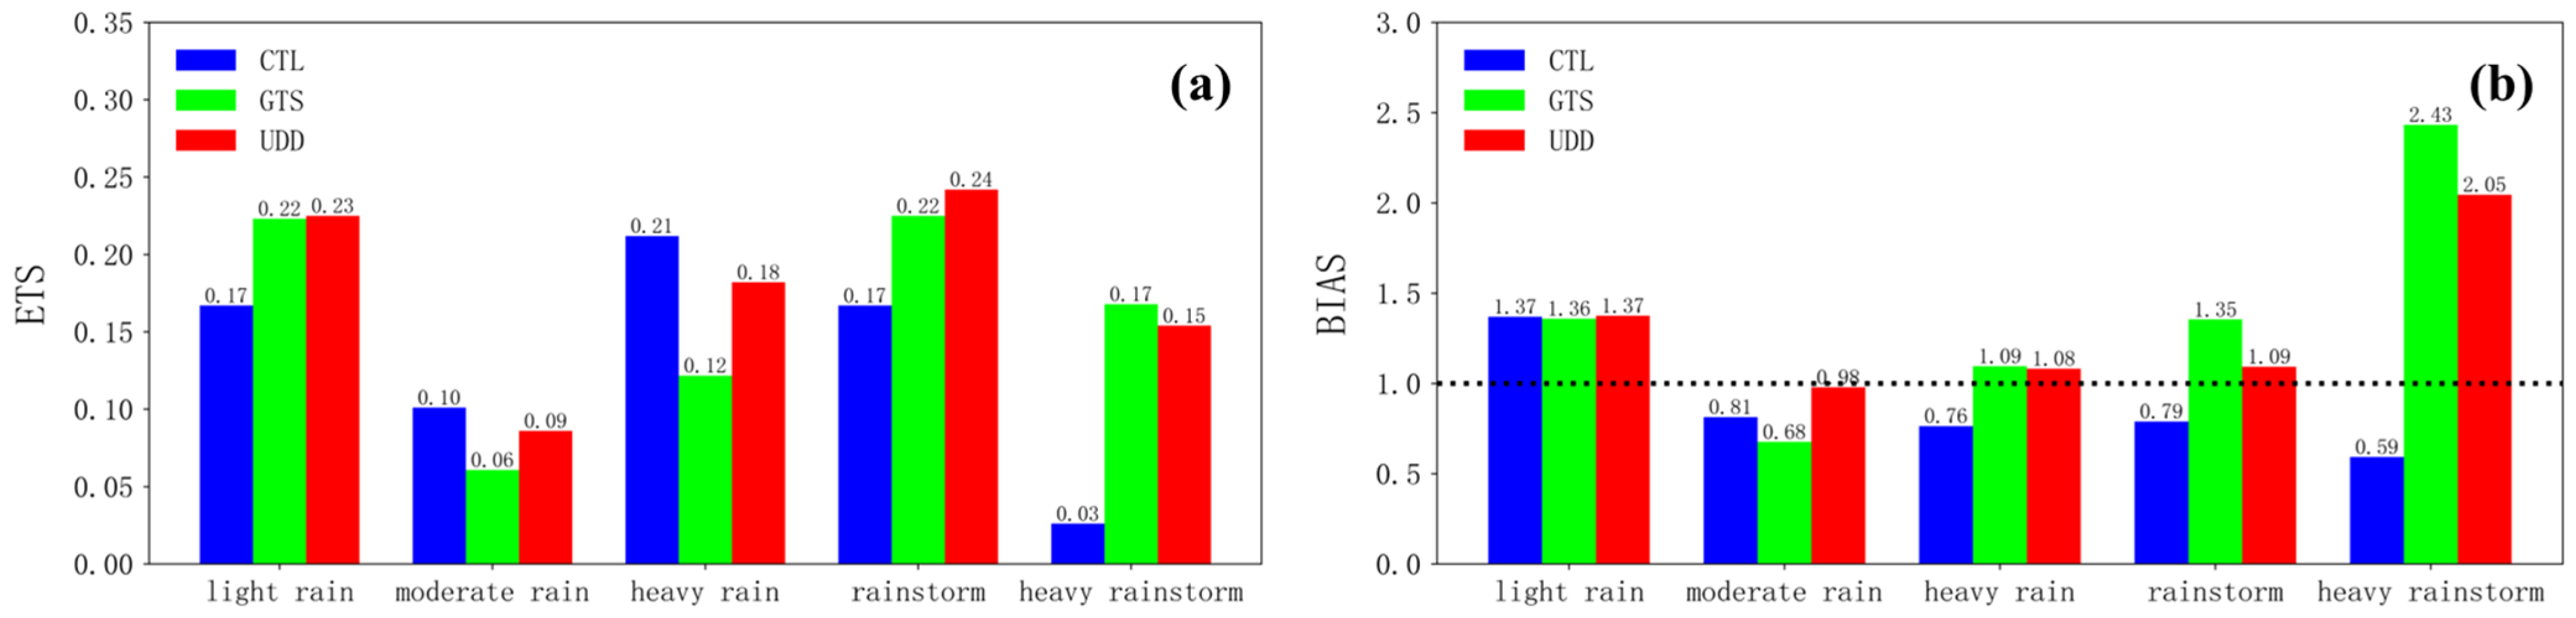
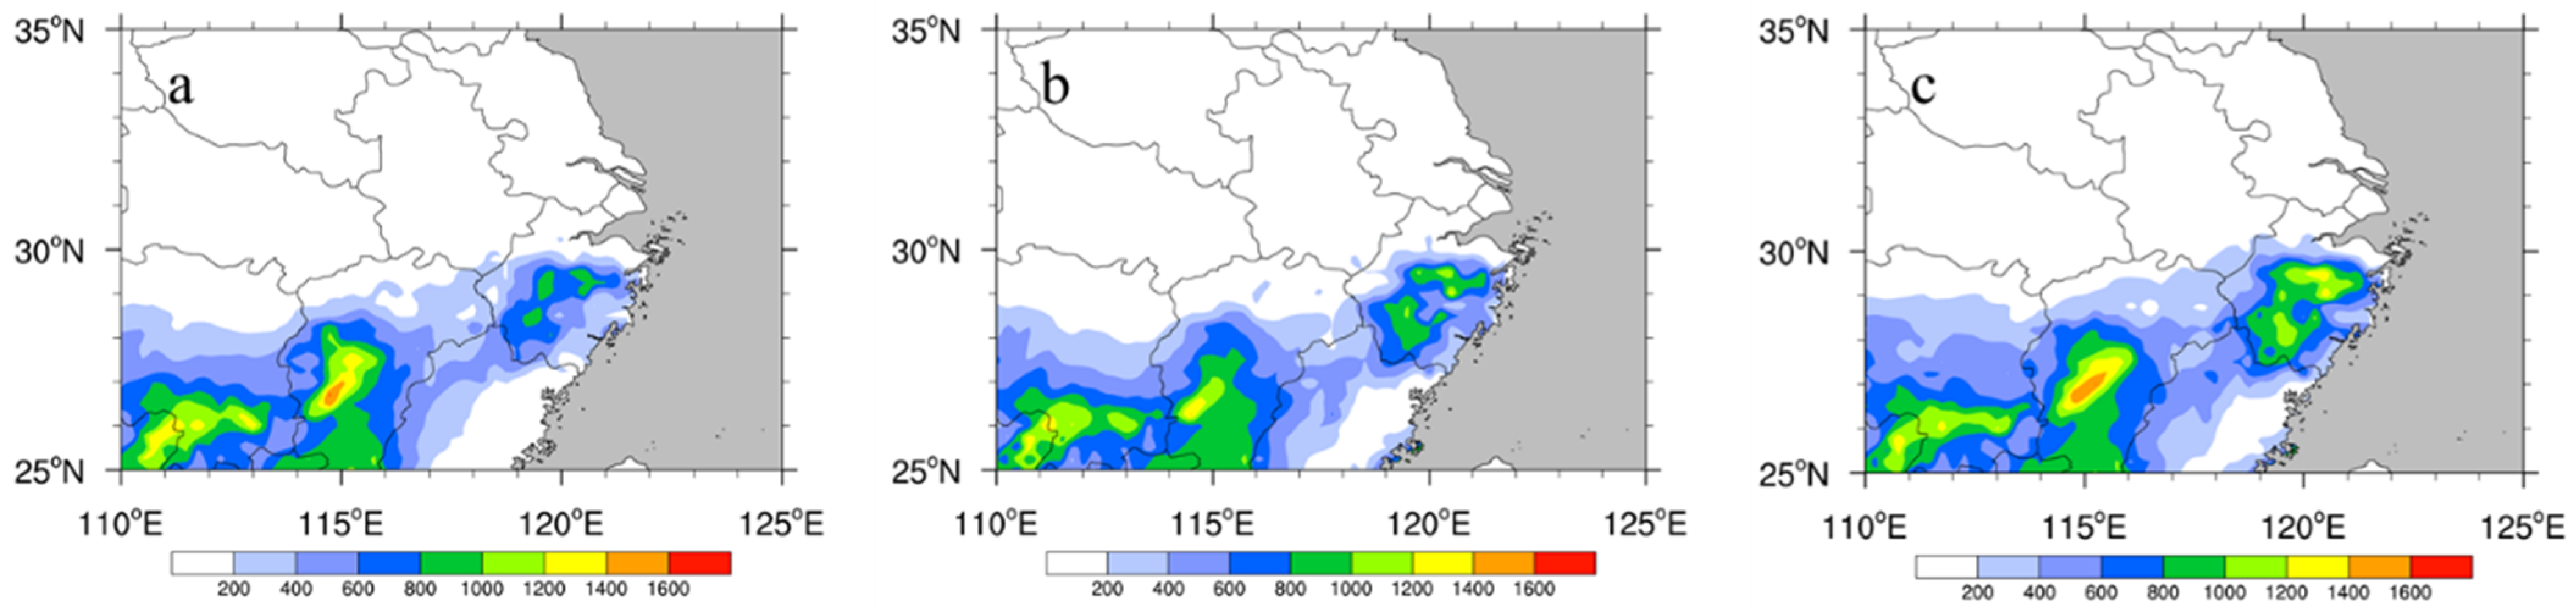
4.1. Precipitation Forecasts

The distribution of actual cumulative precipitation and that of the experimental forecasts is shown in Figure 5. In terms of the distribution of precipitation, all three experimental scenarios simulated the general location and trend of the rainbands to some extent. The center of heavy rainfall in eastern Jiangxi was almost completely missed in the CTL experiment, and there were obvious areas with large values of spurious precipitation in northern Zhejiang (Figure 5c,d). Although the GTS experiment had a better simulation of the heavy precipitation in eastern Jiangxi compared with the CTL experiment, there were empty reports for 24 h of rainfall reaching over 200 mm in the center. For the spurious heavy precipitation in northern Zhejiang in the control experiment, instead of weakening, there was a further enhancement, with significantly more empty reports of precipitation over 50 mm in this region (Figure 5e,f). The UDD experiment was able to forecast the heavy rainfall event in eastern Jiangxi and also reduced the magnitude of precipitation compared with the GTS experiment, and weakened the spurious heavy precipitation that occurred in Zhejiang, making it relatively closer to the observations overall (Figure 5g,h).
An hour-by-hour verification of the rainfall predicted by each experiment was carried out, focusing on the key areas of heavy precipitation (27–32° N, 115–120° E). The results are shown in Figure 6. The amount of precipitation in the observations showed that the main amount of heavy precipitation was concentrated in the first 12 h of the precipitation event. However, in the CTL experiment (blue dashed line), the areal average of hourly precipitation was basically weaker than the hourly rainfall (black solid line), and showed a continuous decreasing trend, failing to reflect the event of increasing rain intensity near 19 June 2018 22:00 UTC, which was not in phase with the observations. This resulted in a 24-h areal average cumulative precipitation of only 26.3 mm for the CTL experiment, in opposition to 31.8 mm in the observations. The GTS experiment (green dashed line) captured the intensification of precipitation at 19 June 2018 22:00 UTC. However, the initial moment of the GTS experiment significantly overestimated the precipitation. From 19 June 2018 18:00 UTC to 19 June 2018 22:00 UTC, the hourly precipitation in the GTS experiment showed a decreasing trend, followed by an increasing trend. However, the real precipitation during this period gradually increased. The final 24-h areal average cumulative precipitation for the GTS experiment was 39.3 mm. There were obvious empty reports compared with the real precipitation. The UDD experiment (red dashed line), based on the successful forecasting of an increase in heavy rainfall, effectively attenuated the overestimation of precipitation in the GTS experiment, with a 24-h areal average cumulative precipitation of 35.7 mm, which is relatively more similar to the observation.
The objective ETS (equitable threat score) test score adds penalties for missing and under-reporting precipitation compared with the TS (threat score) score, making the precipitation score relatively more equitable. It is according to the following formulae:
E T S = N A R a N A + N B + N C R a
R a = ( N A + N B ) · ( N A + N C ) N A + N B + N C + N D
where N A is the number of correct cells (times) in the forecast, N B is the number of empty cells (times), N c is the number of missed cells (times), and N D is the number of correct cells (times) where both the forecast and the actual conditions did not reach the specified threshold. The 24 h precipitation is classified into five levels: light rain (0.1–9.99 mm), moderate rain (10–24.99 mm), heavy rain (25–49.99 mm), rainstorms (50–99.99 mm) and heavy rainstorms (100–249.99 mm). Higher ETS values indicate more accurate forecasts of precipitation.
The bias score was used to describe the ratio of the frequency of forecasted events to the frequency of observed events (Equation (3)). When the bias score was closer to 1, it means that the forecast was better.
B i a s = N A + N B N A + N c
The results of the 24-h precipitation scores for the three sets of experiments are shown in Figure 7. The ETS scores (Figure 7a) showed that the GTS experiment had a significantly improved ability to forecast events above the magnitude of rainstorms compared with the CTL experiment, demonstrating that the assimilation of existing operational sounding data can improve the forecasting of heavy rain. The UDD experiment improved on the GTS experiment’s shortcomings in terms of poor forecasting of moderate and heavy rainfall, and also slightly outperformed the GTS experiment for the categories of light rainfall and rainstorms.
The bias scores (Figure 7b) showed that the CTL experiment under-reported all categories above light rain, indicating that the overall precipitation forecasted by this scheme was small. The UDD experiment has a score closer to 1 for moderate rain, heavy rain and rainstorms, and, to some extent, improved the problem of severe under-reporting seen in the GTS experiment for rainstorms and heavy rainstorms, and the overall forecast was relatively better.

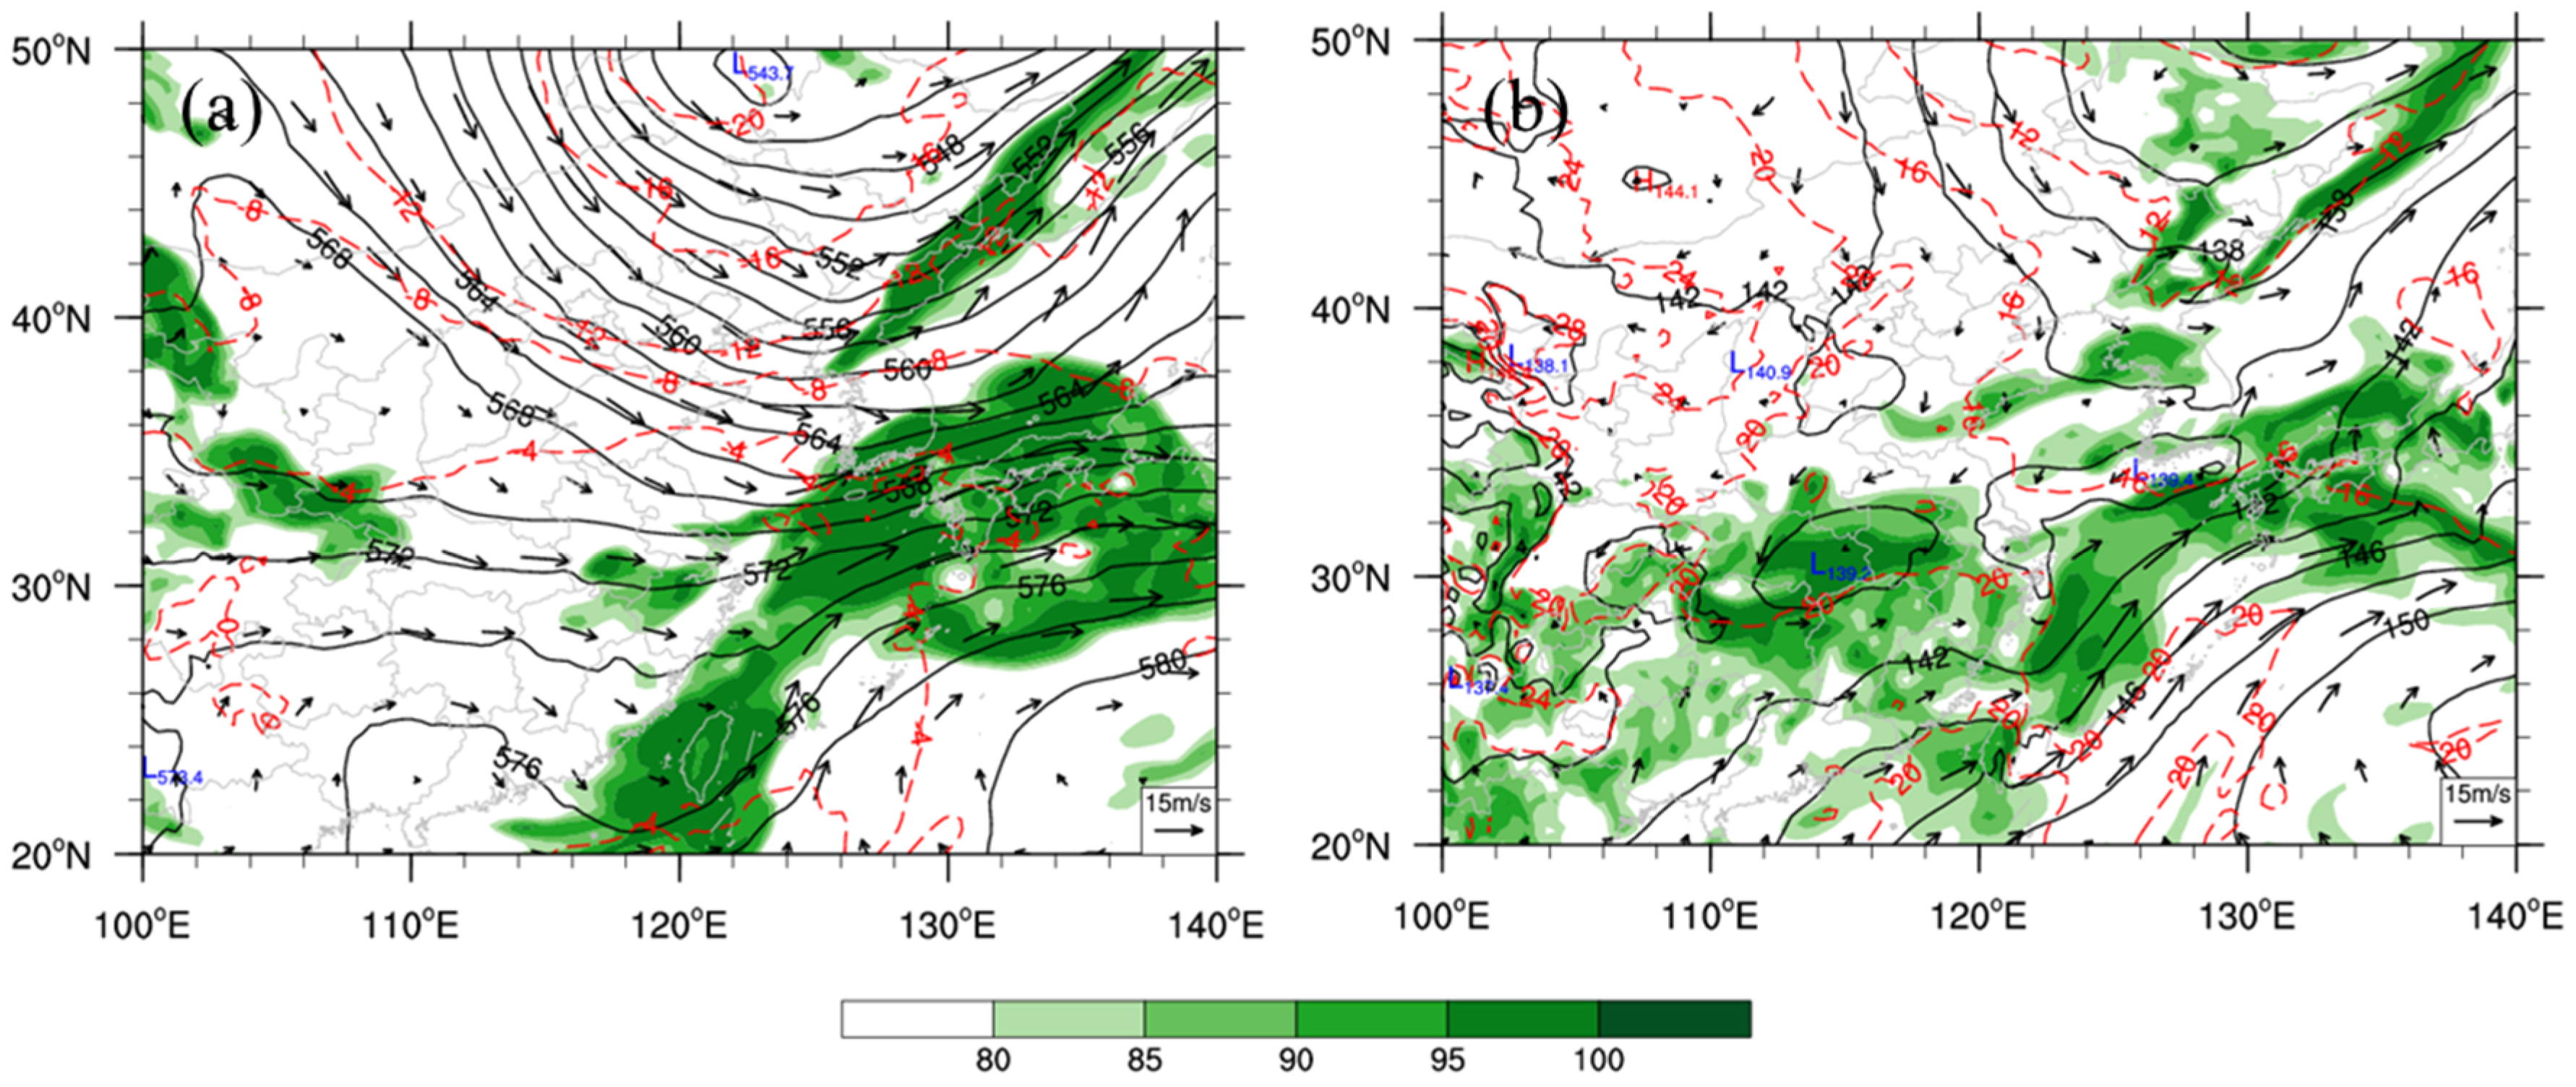
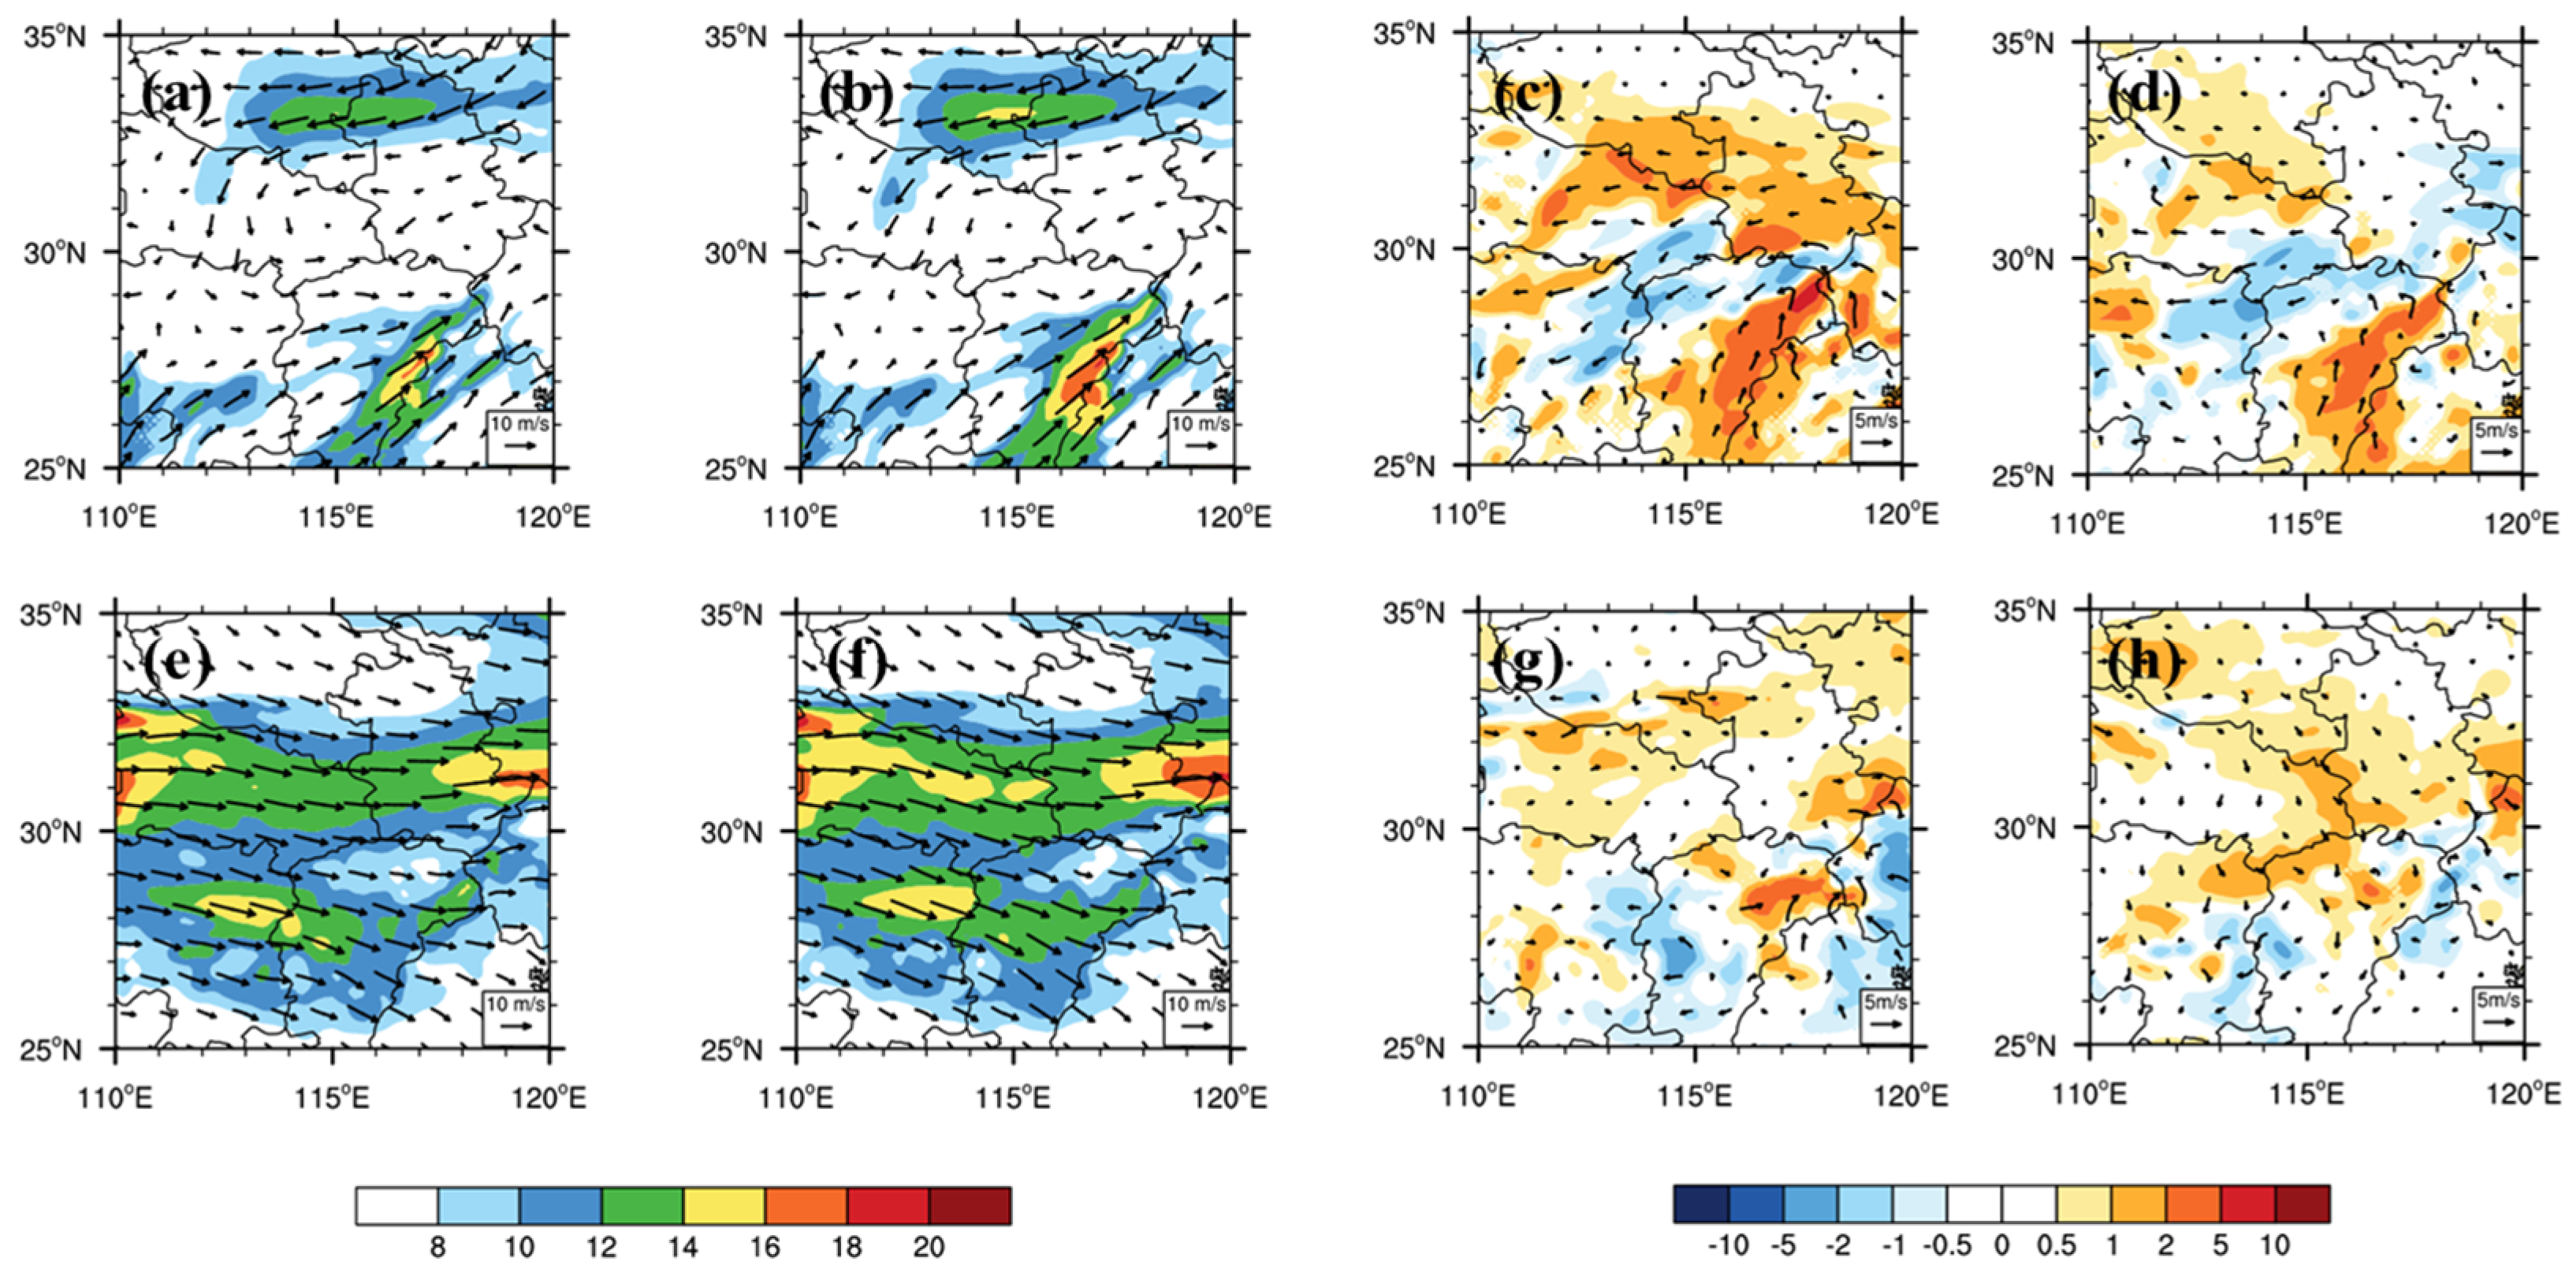
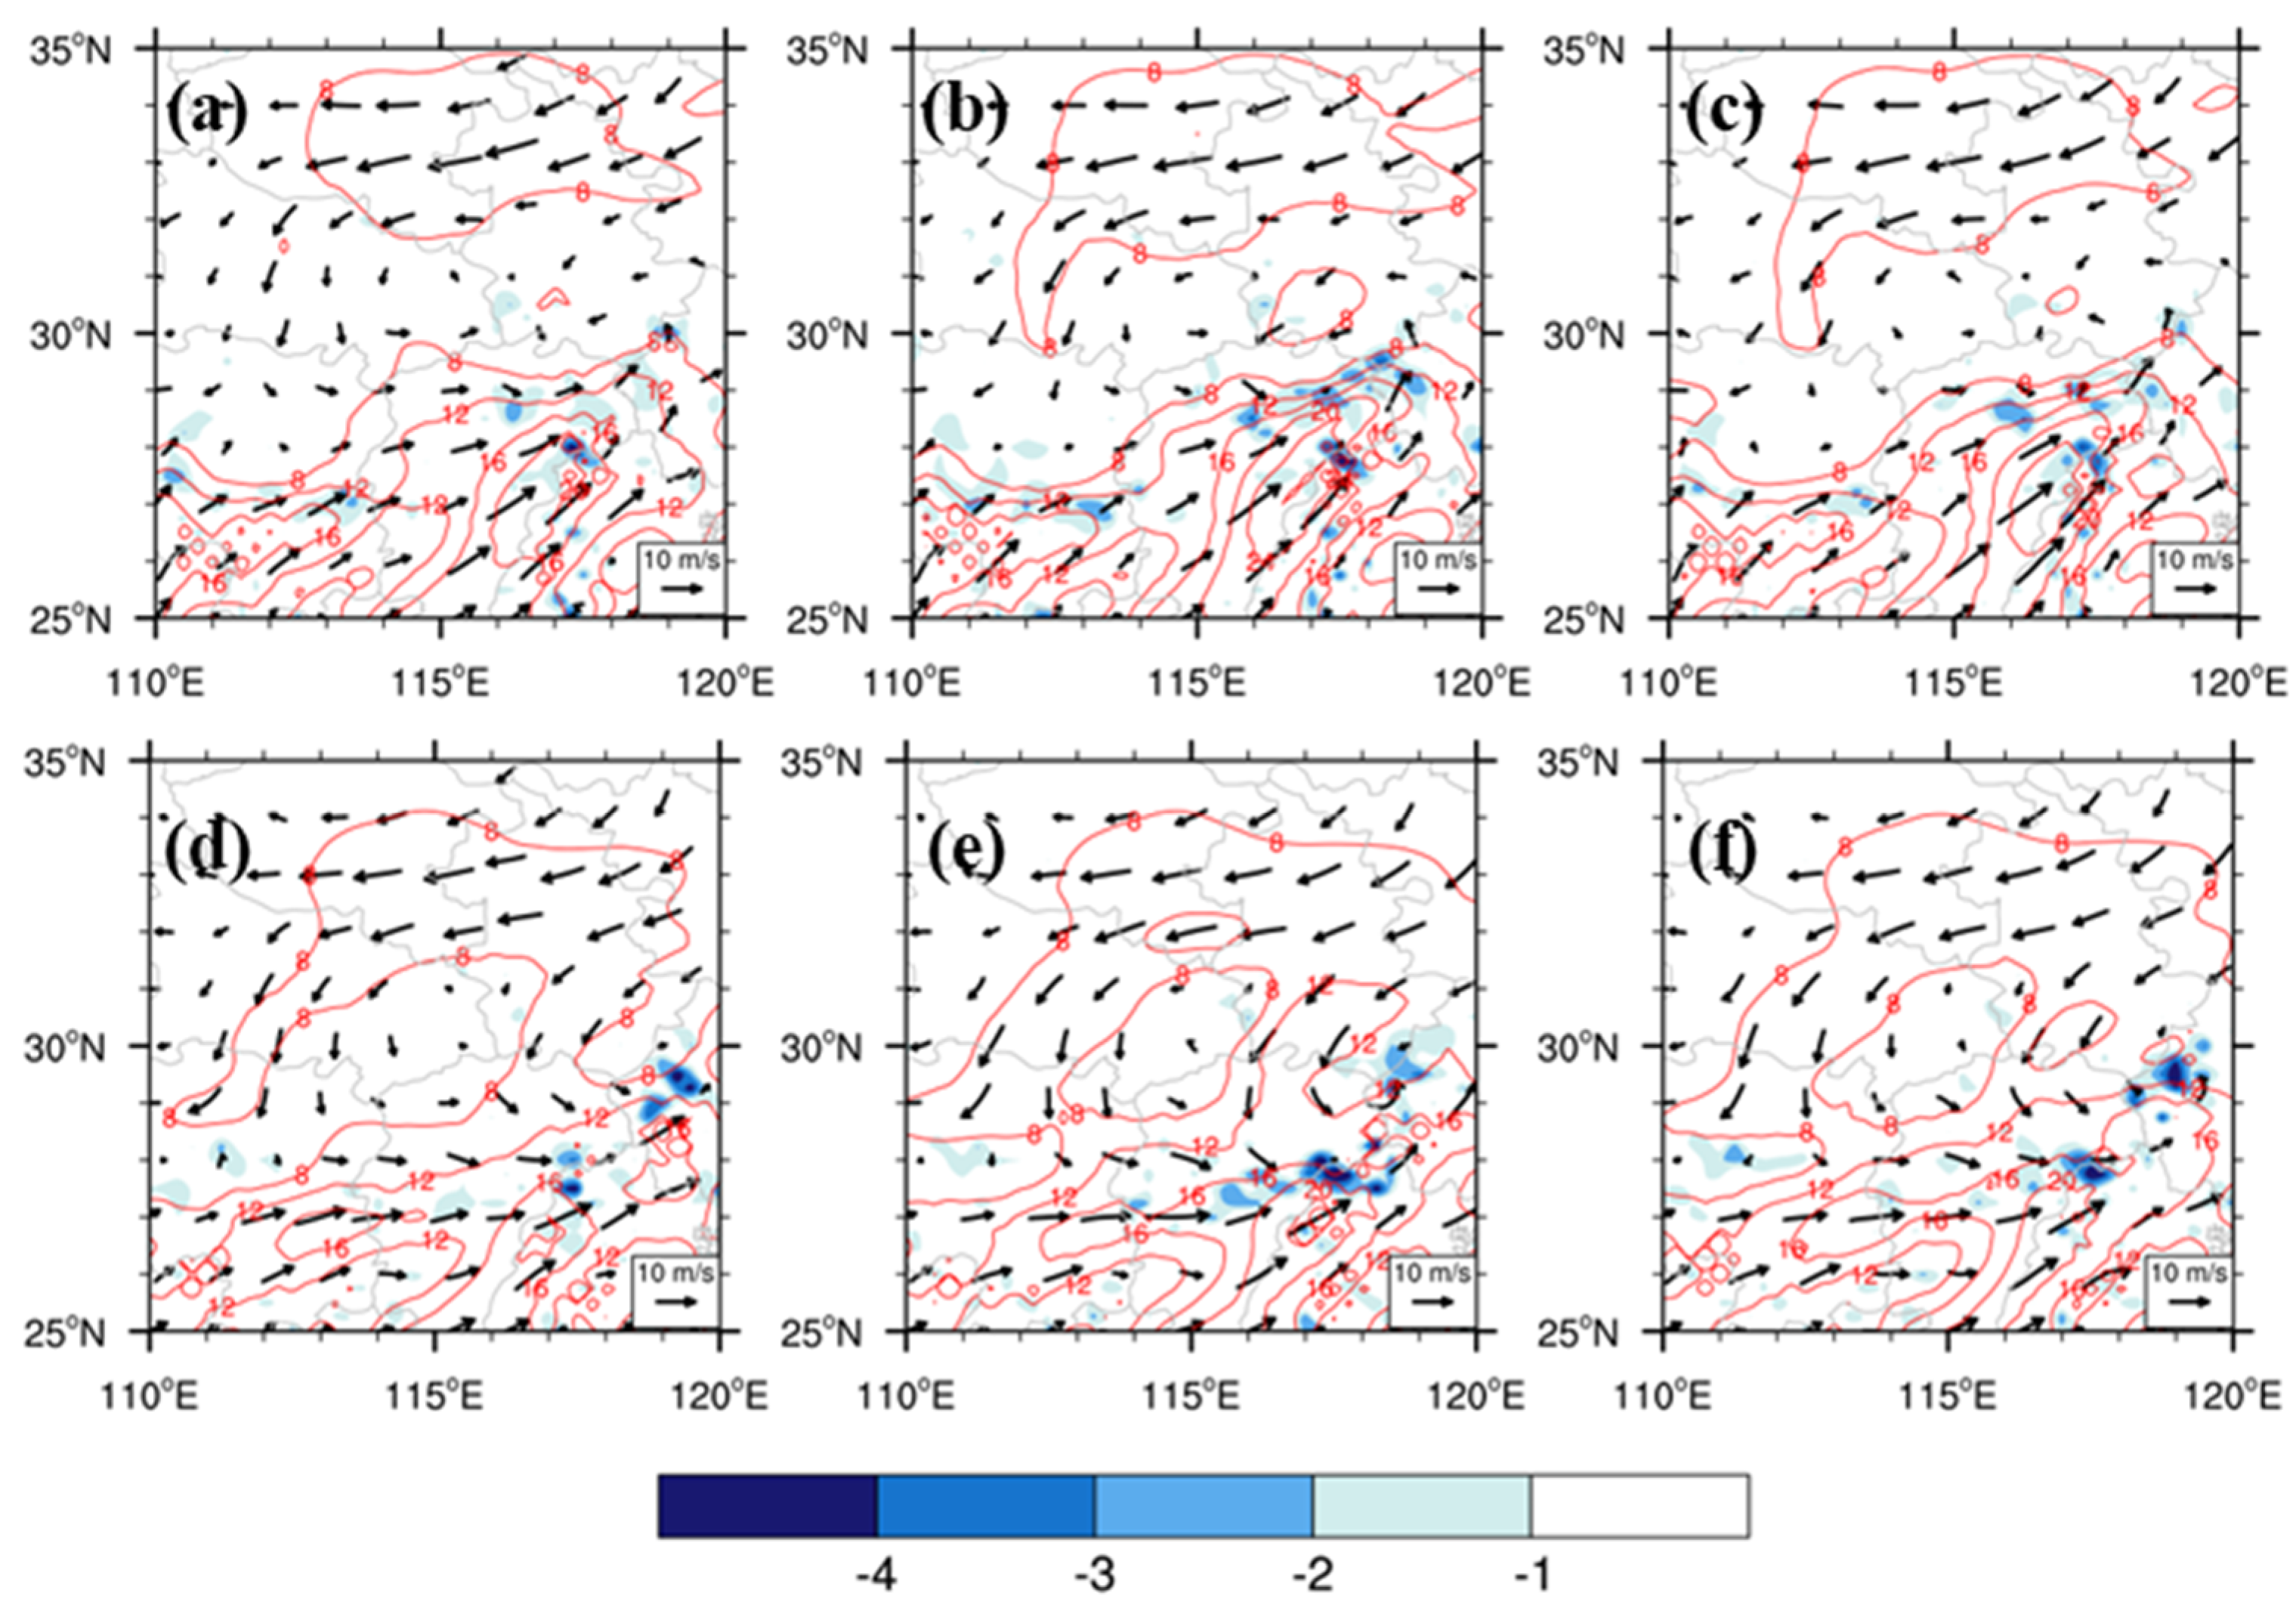
4.2. Quality of the Wind Field Simulation

The results of the simulation of the wind field (Figure 8) showed that all three sets of experiments simulated the north–south low-level jets at 850 hPa, with the GTS and UDD experiments simulating relatively stronger low-level jets in eastern Jiangxi (Figure 8c,d), providing a better basis for the moisture transport required for the subsequent precipitation. The adjustment of the GTS experiment and the UDD experiment to the low-level wind field showed some similarity in their spatial distribution.
At 500 hPa, the region north of 30° N was basically a flat westerly flow, while the south was dominated by northwesterly winds, creating a better environment for dispersion over the area of the storm. The westerly flow in eastern Hubei and southern Anhui–Jiangsu was significantly stronger in the UDD experiment than in the CTL experiment, which was more conducive to carrying the mass accumulation aloft and maintaining the upward motion. In contrast, in the GTS experiment, an increase in the southerly wind of about 2 m·s−1 (Figure 8g) appeared in the northeast part of Jiangxi, which would lead to the strengthening of the convergence structure over the rainstorm’s area, which was not conducive to the sustainable development of precipitation thereafter. However, this problem did not appear in the UDD experiment (Figure 8h). This indicated that the initial wind field in the middle and upper levels had a relatively better response to the assimilation of round-trip drifting sounding data.

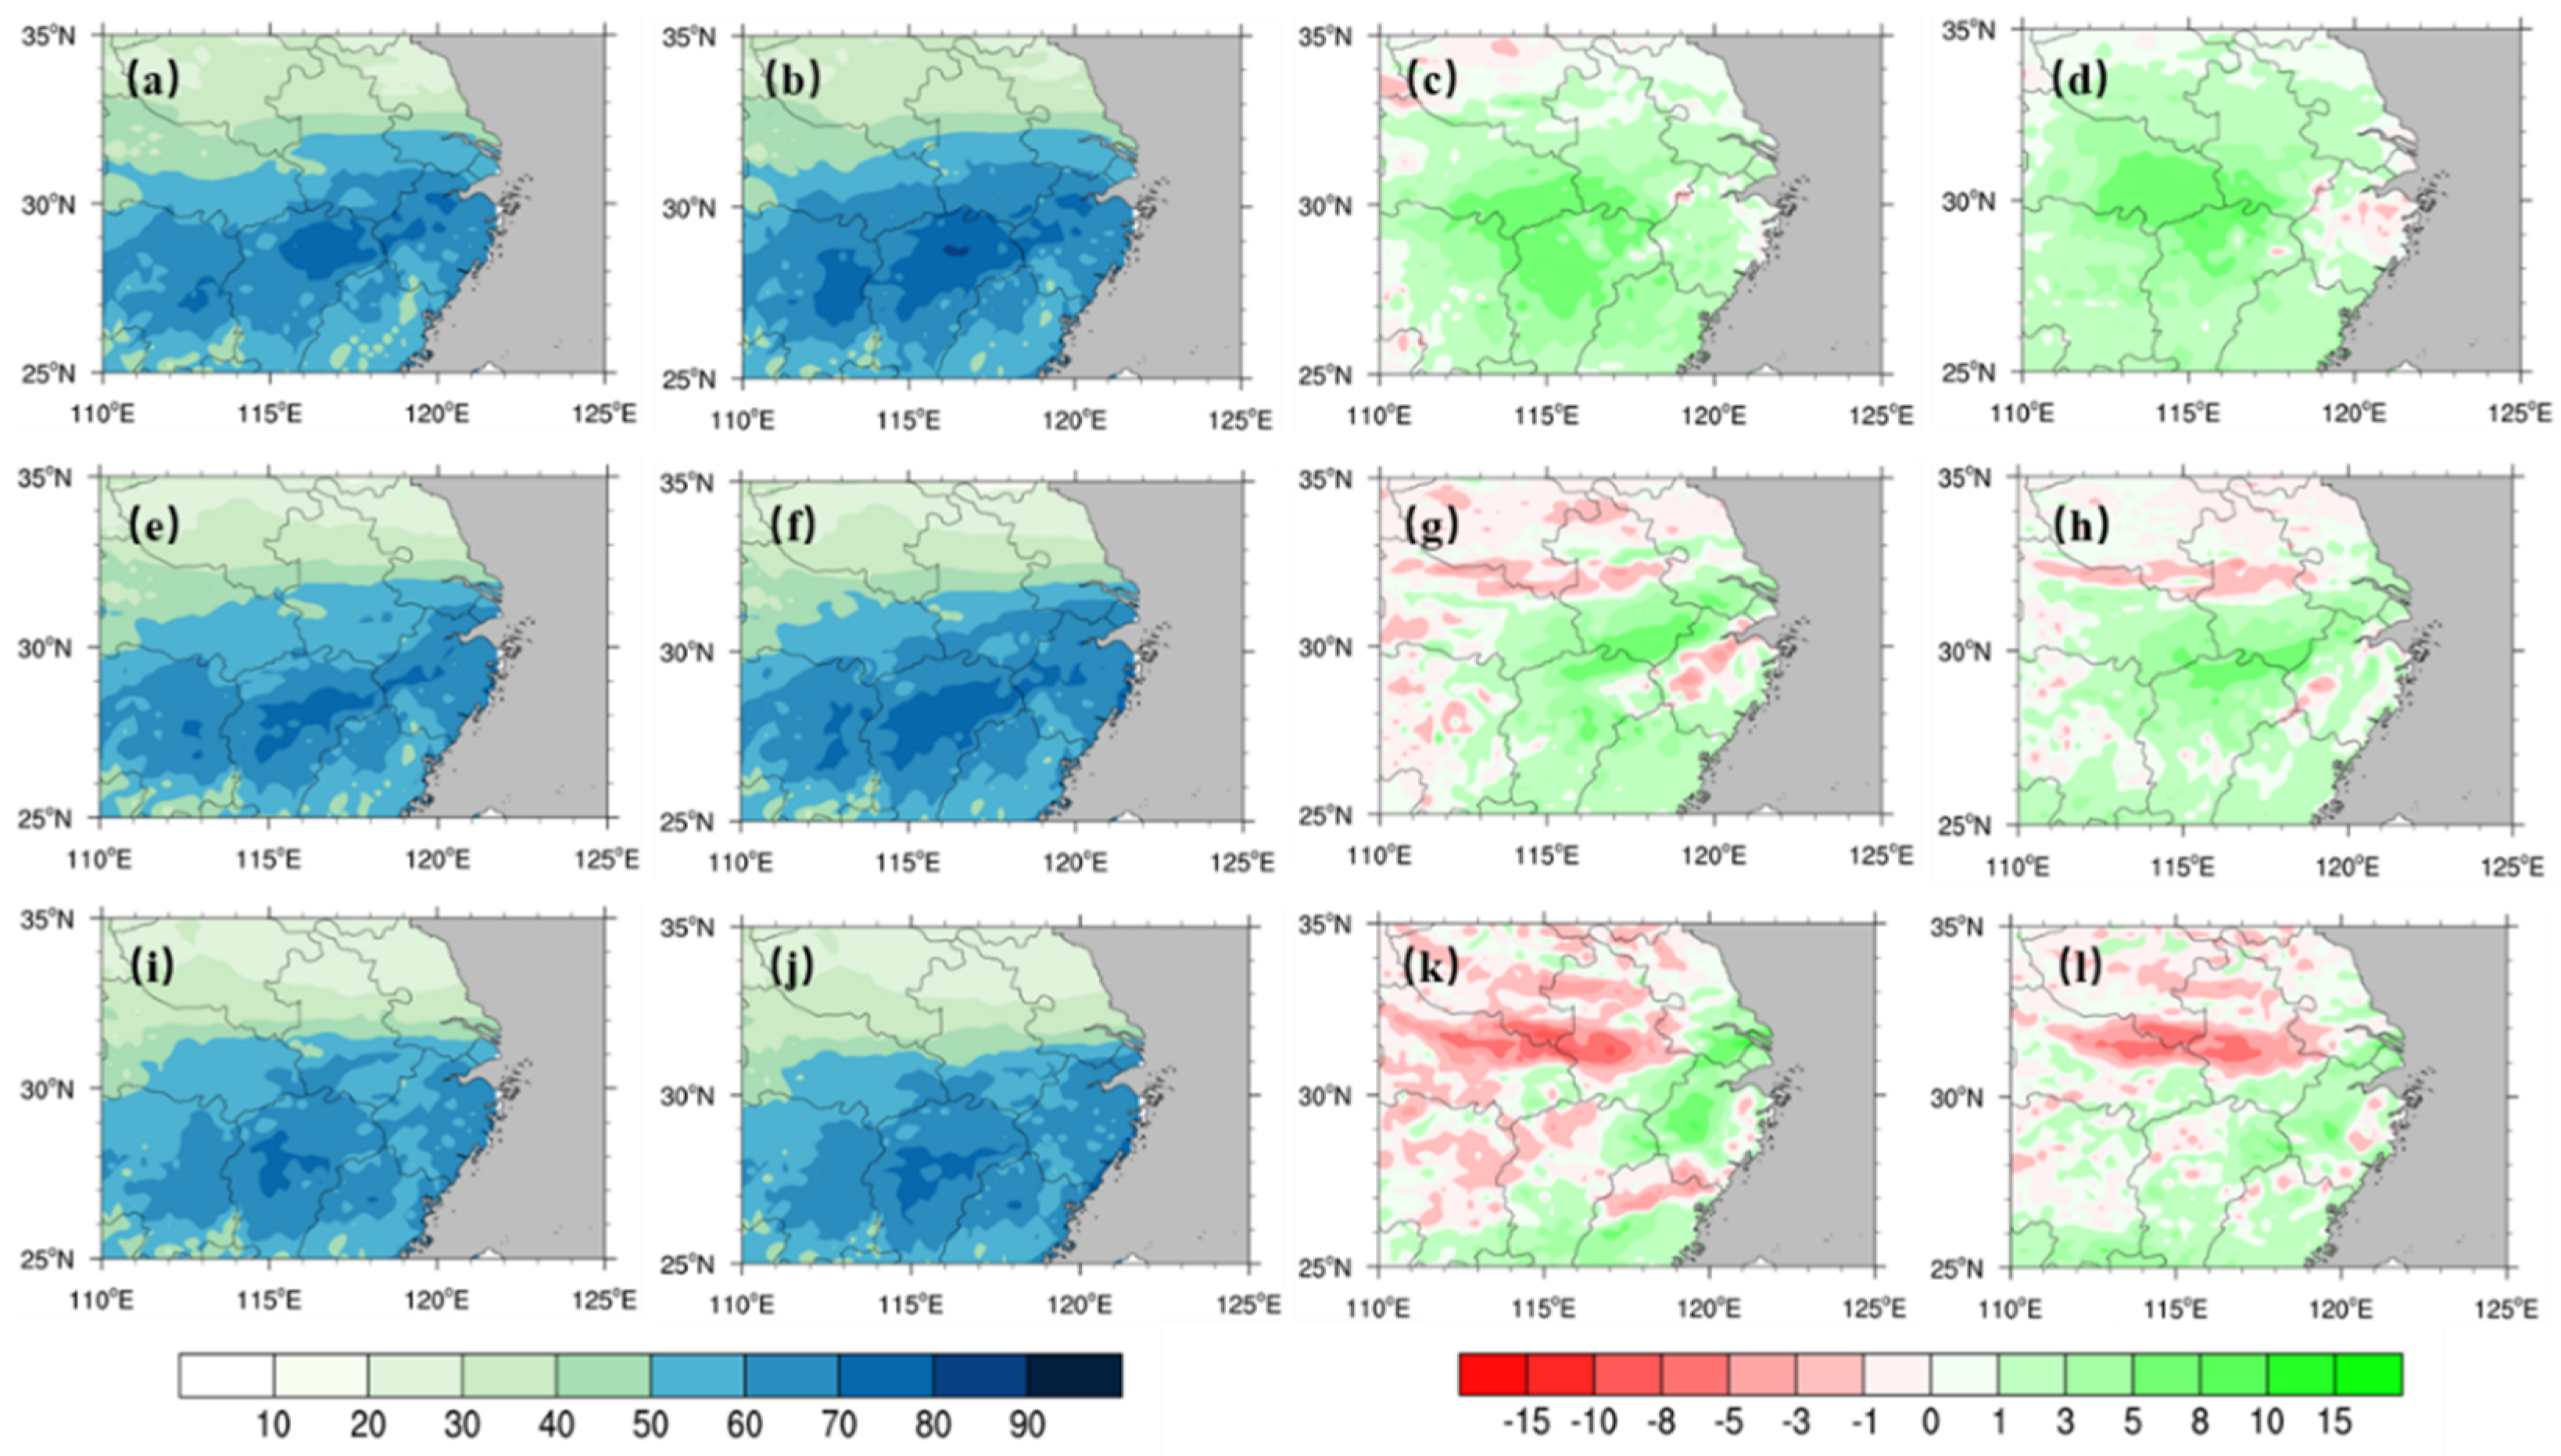
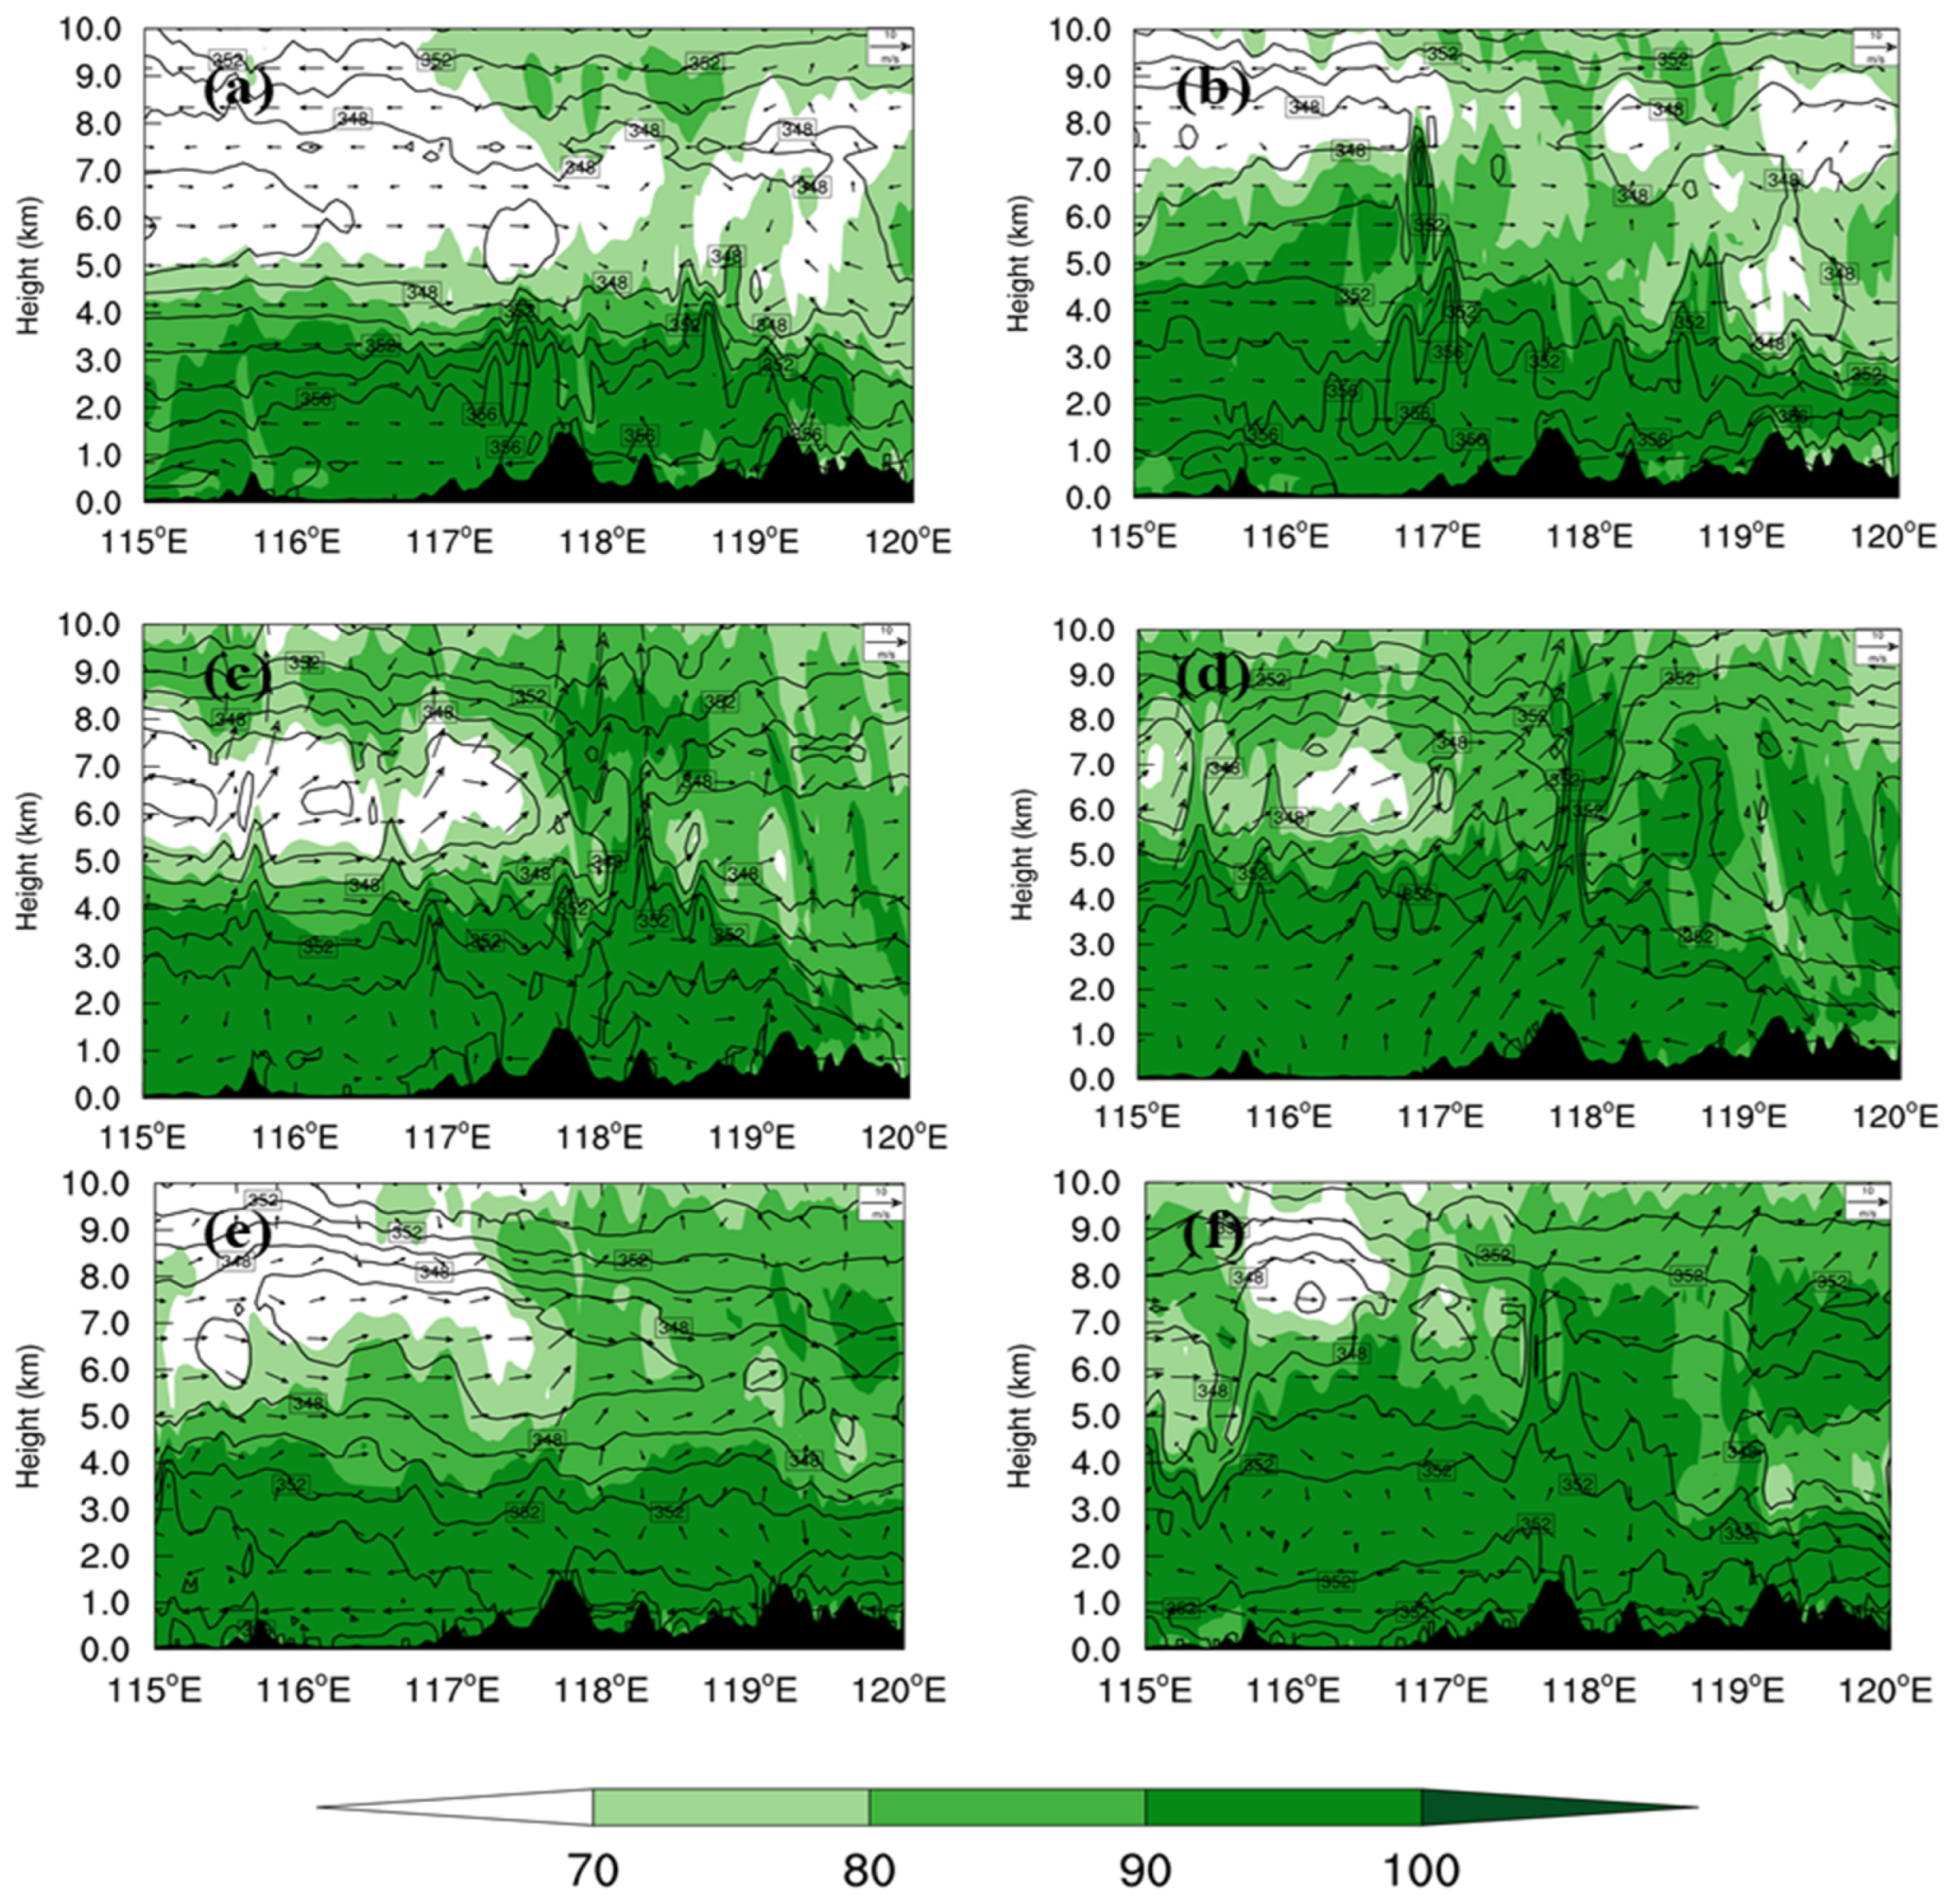
4.3. Analysis of the Moisture Conditions

The development of a rainstorm cannot occur without the support of the moisture conditions. Figure 9 depicts the distribution of atmospheric precipitable water during the heavy precipitation period simulated by the three experiments. The atmospheric precipitable water predicted by the three experiments tended to decrease gradually within 12 h. At 19 June 2018 18:00 UTC, the center with the largest value of precipitable water simulated by the CTL experiment reached 70 mm, while the atmospheric precipitable water predicted by the GTS and UDD experiments increased significantly compared with the CTL experiment, with the center with the largest value reaching over 80 mm. It can be seen that for Zhejiang, the GTS experiment was wetter than the CTL experiment (Figure 9c), while the UDD experiment was drier than the CTL experiment (Figure 9d). As we can see, the precipitable water in Zhejiang area for the UDD experiment was 1 to 3 mm less than that of the CTL experiment, which helped to explain the overestimation of precipitation in the forecast for this region.
Around 20 June 2018 06:00 UTC, the intensity of precipitation in the observations was greater than the intensity of precipitation forecasted by each experiment (Figure 6). The greater the amount of precipitable water in the atmosphere at this time, the more beneficial it is for long-term forecasts of heavy rainfall. The amount of precipitable water in the stormy area of the GTS experiment was less than that of the UDD experiment during this time (Figure 9g,h,k,l), so the hour-by-hour forecasts of precipitation of the UDD experiment were slightly better than those of the GTS experiment when the precipitation intensified again.
From the perspective of moisture (Figure 10), at 19 June 18:00 UTC, the GTS and UDD experiments predicted stronger southwesterly transport of moisture than the CTL experiment, and formed a stronger convergence of moisture at the front, which significantly improved the conditions for the transport of moisture for the southwesterly flow. The maximum moisture flux in the CTL experiment reached only 24 g/(cm·s·hPa), while the GTS and UDD experiments both reached over 28 g/(cm·s·hPa) (Figure 10a–c). At this time, the moisture conveyor belt from the ocean’s surface was also present in the northern part of the stormy area, but no convergence formed in the stormy area. At 20 June 00:00 UTC, the southwesterly moisture transport channel and the northeasterly moisture transport channel converged in the southern part of Anhui and the eastern part of Jiangxi, improving the conditions of moisture transport for the stormy area. At this moment, the GTS and UDD experiments were better than the CTL experiment in terms of both moisture flux and the intensity of convergence, which helped to improve the under-reporting of heavy rainfall in eastern Jiangxi in the CTL experiment (Figure 10d–f).
It is clear from the moisture condition data that the assimilation of round-trip drifting sounding data resulted in stronger moisture transport conditions than those in the control experiment, and more atmospheric precipitable water in the stormy area, which helped to improve predictions of rainfall.

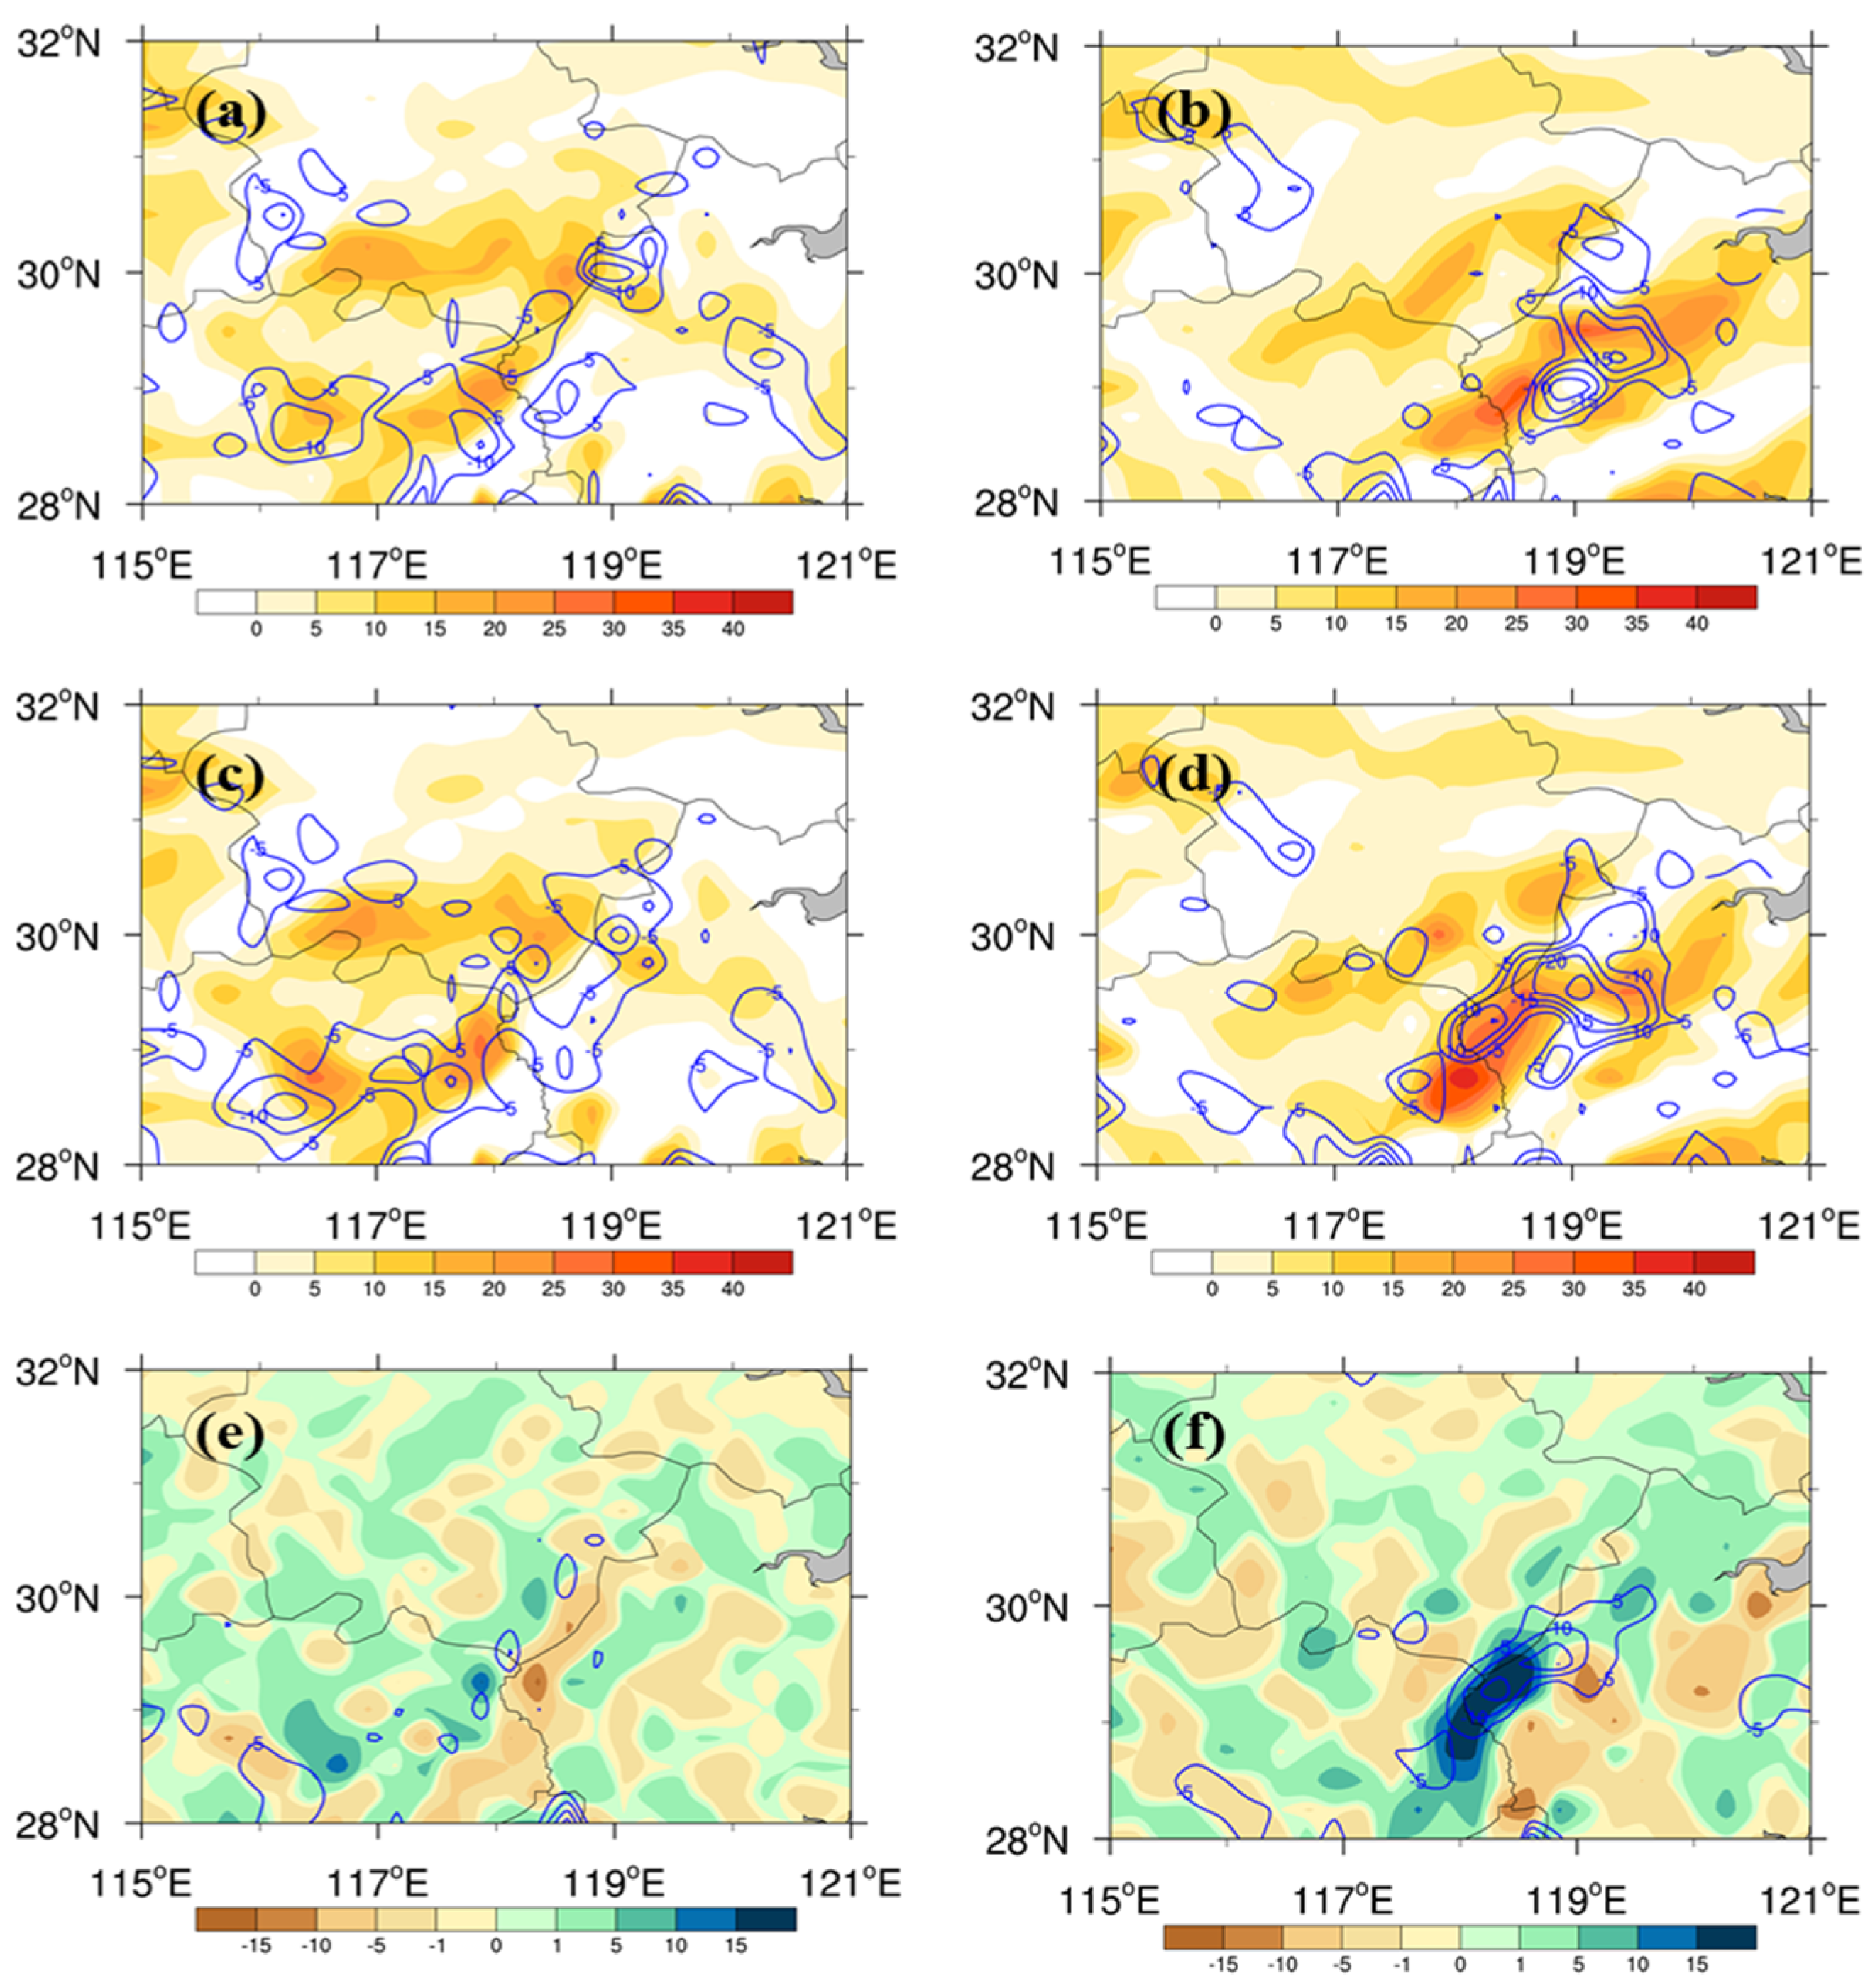
4.4. Thermal and Dynamic Analysis

The development of rainstorm events cannot be separated from the interplay of thermodynamic conditions. The analysis of the relative humidity and pseudo-equivalent potential temperature cross-sections in the stormy area (Figure 11) showed that the CTL and UDD experiments had high relative humidity in the lower layers, with most of the relative humidity below 4 km reaching over 80%, and there were dense pseudo-equivalent potential temperature zones. At 19 June 2018 18:00 UTC, the latitudinal distribution of low-level relative humidity in the CTL experiment was relatively homogeneous, with large areas of relative humidity of 80% or more concentrated below 4 km (Figure 11a), whereas in the UDD experiment, the low-level relative humidity was much higher, with some areas reaching about 6 km, which was relatively deeper (Figure 11b). Xue et al. and Gao et al. showed that positive buoyancy is related to the positive perturbation potential of the temperature [49,50]. As the humidity at the lower levels becomes higher, more moisture is transported to the upper levels and more of the latent heat of condensation is released. At 20 June 00:00 UTC, the strong upward airflow in the UDD experiment led to moisture condensation and the release of latent heat. The potential pseudo-equivalent temperature in the UDD experiment increased compared with that in the CTL experiment. Therefore, the UDD experiment had stronger buoyancy, which contributed to the enhancement of the upward motion and the formation of rainstorms (Figure 11c,d). The increased release of latent heat through the condensation of moisture in the middle and upper layers was also responsible for the enhanced upward motion. At 20 June 06:00 UTC, the relative humidity conditions below an altitude of 8 km in the UDD experiment were mostly above 90%, which was better than in the CTL experiment (Figure 11e,f).
The dispersion of vorticity at lower levels provided a visual response to the dynamic configuration of the rainstorm event. At 19 June 18:00 UTC, the large areas of vorticity simulated by the two experiments were mainly located in southern Anhui and northern Jiangxi (Figure 12a,c). At this time, the UDD experiment simulated slightly greater vorticity and scattered irradiance in northern Jiangxi than the CTL experiment, but the difference between the two was relatively small (Figure 12e). At 20 June 00:00 UTC, with the eastward movement of the cyclone, the vorticity and large values of convergence simulated by the two experiments moved to western Zhejiang (Figure 12b,d), when the vorticity simulated by the UDD experiment was significantly larger than that of the CTL experiment, and the motion of convergence around it was also significantly enhanced, with an increase of 15 × 10−5 s−1 (Figure 12f). The assimilation of the round-trip drifting sounding data enabled stronger convergence to be simulated at lower levels, creating a more intense upward movement that could trigger heavy rainfall and improve the under-reporting of precipitation in controlled experiments.

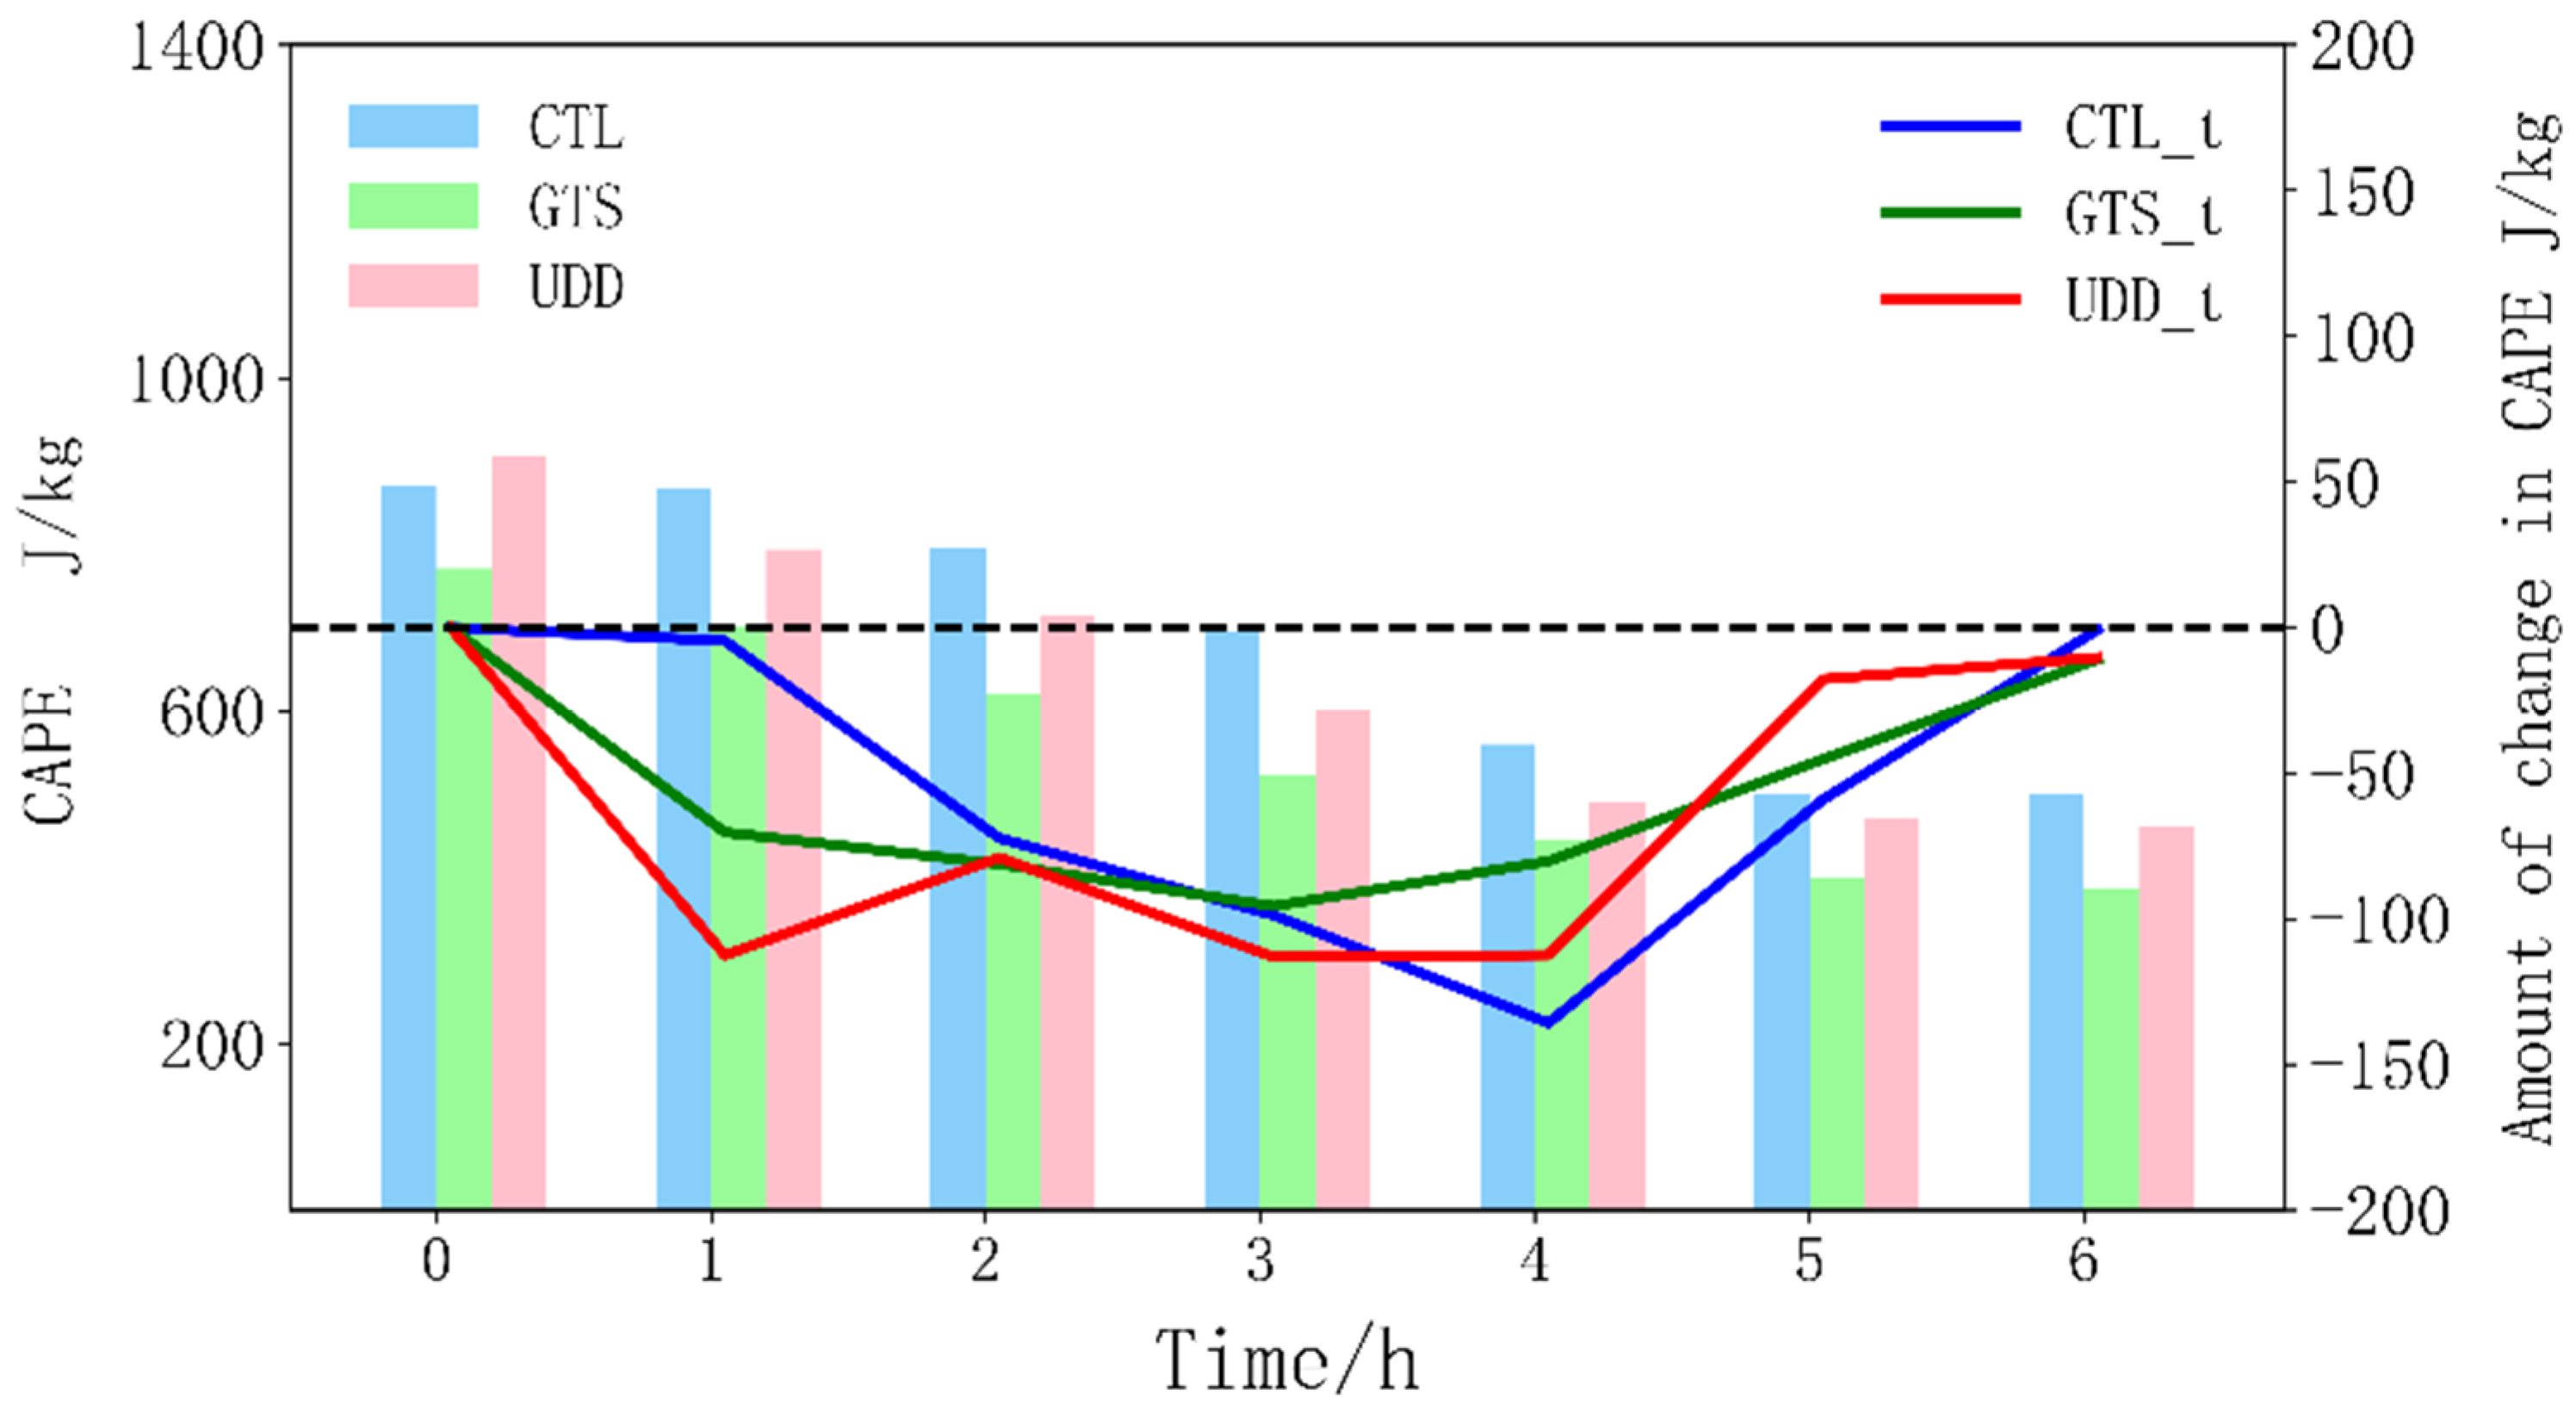
4.5. Unstable Energy

CAPE (convective available potential energy) can characterize the magnitude of unstable energy and its spatial distribution. At 19 June 2018 18:00 UTC, the areas with a large CAPE simulated by the three sets of experiments were mainly located within the Jiangxi boundary, with the centers with large CAPE values reaching over 1400 J/kg for both the CTL and UDD schemes. In the UDD experiment, the unstable convective energy was the largest (Figure 13a,c). In contrast, the CAPE values for the GTS experiment were significantly smaller than those of the other two groups (Figure 13b), which may be due to the overestimation of precipitation in the initial moments of the GTS experiment, leading to an early release of unstable energy (Figure 6), causing the experiment to show a decreasing trend that was inconsistent with the increase in hourly precipitation in the subsequent observations.
The regional average values of CAPE and their variation within the range of 26–28° N, 114–116° E are shown in Figure 14. All three experiments showed a decreasing trend in CAPE within six hours. We found that the UDD experiment had the largest CAPE at 18:00 UTC on 19 June, which reached 906.2 J/kg (pink column). In contrast, the CAPE values for the GTS experiment were significantly smaller than those of the other two experiments. The CAPE in the GTS experiment was only 771.1 J/kg at this time (green column). The GTS experiment’s overestimation of precipitation led to an early release of unstable energy, causing the GTS experiment to show a decreasing trend that was inconsistent with the increase in hourly precipitation in the observations. The CAPE of the CTL experiment was slightly less than that of the UDD experiment at 19 June 2018 18:00 UTC (blue column). However, the reduction in CAPE in the CTL experiment was only 371.4 J/kg during the enhanced phase of observation. The reduction in CAPE for the UDD experiment within the same period reached 445.3 J/kg. This suggests that the CTL experiment did not release the unstable energy sufficiently, making it underestimate the forecasted precipitation.

5. Conclusions and Discussion

The round-trip drifting sounding system has a higher temporal resolution than the operational sounding system. It can realize a vertical atmospheric observation every 6 h. In addition, the location of the descending section is different from the ascending section, increasing the density of the sounding data. In this study, assimilation experiments were conducted using conventional observations and the round-trip drifting sounding dataset for a rainstorm event that occurred on 19–20 June 2018. By comparing the forecasted results with those of the CTL experiment and the GTS experiment, it was found that the UDD experiment had a better ability to predict precipitation. The following conclusions can be drawn.
The results of the assimilation experiments suggested that the assimilation of round-trip drifting sounding data can increase the accuracy of regions of heavy precipitation, reduce empty precipitation reports, better grasp the development of rainstorms and improve the effectiveness of rainstorm forecasting. In particular, the forecasts of rainstorms and heavy rainstorms improved significantly.
The assimilation of the round-trip drifting sounding data improved the quality of the wind field forecasts at both 500 hPa and 850 hPa, giving it an advantage over the assimilation of conventional soundings for predicting the wind field at high altitudes. The adjustment of the wind field based on the assimilated round-trip drifting sounding data resulted in a significant improvement in the moisture conditions in the area of the rainstorm, which is more beneficial for the simulation of heavy precipitation.
The assimilation of round-trip drifting sounding data increased the relative humidity in the lower layers and had more unstable energy for the development of heavy rainfall. In addition, the significant increase in low-level cyclones and their convergence was more conducive to the development of an upward motion, creating advantageous conditions for triggering heavy rainstorms.
At present, the assimilation and analysis of round-trip drifting sounding data and observations are still at a preliminary stage. These conclusions are just for one case. Although some good results have been achieved in the analysis of assimilation and the numerical prediction of a recent rainstorm in eastern China, there are still many issues that require further research. Can the flat drifting section of a round-trip drifting sounding be used for continuous observations of stratospheric ozone? The descending section of the round-trip drifting sounding has the feature of high movability, so can the descending section be applied to the study of target observation to make covert observations of sensitive areas? How effective is it? How effective is the assimilation of round-trip drifting sounding data with radar and satellite data? More in-depth scientific research and practical applications are needed in the future.

Author Contributions

Conceptualization, X.Z. and X.M.; data curation, X.M.; formal analysis, X.Z.; funding acquisition, X.M.; investigation, L.S. and Z.G.; methodology, X.M. and H.G.; project administration, X.Y.; software, X.Z. and H.G.; validation, L.S., Z.G. and X.Y.; visualization, X.Z. and H.G.; writing—original draft, X.Z. and L.S.; writing—review and editing, X.M. and H.G. All authors have read and agreed to the published version of the manuscript.

Funding

This research was funded by the National Natural Science Foundation of China (Grant No. U2242213) and the National Key R&D Program of China (Grant No. 2018YFC1506702).

Institutional Review Board Statement

Not applicable.

Informed Consent Statement

Not applicable.

Data Availability Statement

Not applicable.

Acknowledgments

Thanks to the Meteorological Detection Centre of China’s Meteorological Administration for supporting this article with data. We acknowledge the High Performance Computing Centre of the Nanjing University of Information Science and Technology for their support.

Conflicts of Interest

The authors declare no conflict of interest.

References

  1. Huang, S.S.; Lin, Y.B.; Wei, T.J. Studies of the Changjiang-Huaihe cyclogenesis and its development and the rainstorm process and the related forecast questions. Chin. J. Atmos. Sci. 1976, 27–41. [Google Scholar] [CrossRef]
  2. Gao, S.T.; Zhou, Y.S.; Ran, L.K. A review on the formation mechanisms and forecast methods for torrential rain in China. Chin. J. Atmos. Sci. 2018, 42, 833–846. [Google Scholar]
  3. The Ministry of Water Resources of the People’s Republic of China. Available online: http://www.mwr.gov.cn/sj/tjgb/zgshzhgb/202112/t20211208_1554245.html (accessed on 22 May 2022).
  4. Zhang, X.L.; Tao, S.Y.; Zhang, S.L. Three Types of Heavy Rainstorms Associated with the Meiyu Front. Chin. J. Atmos. Sci. 2004, 28, 187–205. [Google Scholar]
  5. Xu, J.; Zhou, C.Y.; Gao, T.C. Analysis about development mechanism of Jianghuai Cyclone in Meiyu Front and Its Relationship with Rainstorm. Bull. Sci. Technol. 2013, 29, 24–29. [Google Scholar]
  6. Zhou, Y.S.; Li, B. Structural analyses of vortex causing torrential rain over the Changjiang-Huaihe River basin during 8 and 9 July 2003. Chin. J. Atmos. Sci. 2010, 34, 629–639. [Google Scholar]
  7. Li, X.R.; Zhang, X.R.; Pu, M.J. Composite analysis of the evolving of Yangtze River and Huaihe River shear line with heavy rain and without heavy rain in Meiyu period. Plateau Meteorol. 2014, 33, 199–209. [Google Scholar]
  8. Liu, X.; Chu, H.; Sun, J.; Zhao, W.; Meng, Q. A Numerical Simulation of the Development Process of a Mesoscale Convection Complex Causing Severe Rainstorm in the Yangtze River Delta Region behind a Northward Moving Typhoon. Atmosphere 2022, 13, 473. [Google Scholar] [CrossRef]
  9. Zhang, X.H.; Luo, J.; Chen, X.; Jin, L.L.; Qiu, X.M. Formation and Development Mechanism of One Cyclone over Changjiang-Huaihe River Basin and Diagnostic Analysis of Rainstorm. Meteorol. Mon. 2016, 42, 716–723. [Google Scholar]
  10. Ma, X.L.; Sun, L.N.; Jiang, S.; Yu, Y.M.; Guan, Y.H. Characteristics of moist available energy and its budget in a heavy rain process over Changjiang-Huaihe River basin. Trans. Atmos. Sci. 2015, 38, 289–298. [Google Scholar]
  11. Yang, X.M.; Ma, M.J.; Zhu, A.B. Cause Analysis on a Heavy Rainfall over the Yangtze—Huaihe Area in July 2013. J. Arid. Meteorol. 2016, 34, 700–709. [Google Scholar]
  12. Shou, S.W. Progress of synoptic studies for heavy rain in China. Torrential Rain Disasters 2019, 38, 450–463. [Google Scholar]
  13. Qi, L.B.; Wu, J.J.; Shi, C.H. Rethink on forecast focus of a torrential rainfall event at Jianghuai region. Torrential Rain Disasters 2020, 39, 647–657. [Google Scholar]
  14. Bouttier, F.; Courtier, P. Data Assimilation Concepts and Methods; ECMWF Meteorological Training Course Letter; ECMWF: Reading, UK, 1999.
  15. Zhang, X.Z.; Chen, J.M.; Zhao, P. Impacts of Doppler Radar Data Assimilation on the Simulation of Severe Heavy Rainfall Events. J. Appl. Meteorol. Sci. 2015, 26, 555–566. [Google Scholar]
  16. Zhang, T.; Bao, Y.S.; Lu, Q.F. The Iasi Date Assimilating Experiments on the Heavy Rain over the Yangtze River Basin. Sci. Technol. Eng. 2016, 16, 9–16. [Google Scholar]
  17. Durre, I.; Yin, X.G. Enhanced radiosonde data for studies of vertical structure. Bull. Am. Meteorol. Soc. 2008, 89, 1257–1262. [Google Scholar] [CrossRef]
  18. Faccani, C.; Rabier, F.; Fourrié, N.; Agusti-Panareda, A.; Karbou, F.; Moll, P.; Lafore, J.-P.; Nuret, M.; Hdidou, F.; Bock, O. The Impacts of AMMA Radiosonde Data on the French Global Assimilation and Forecast System. Weather Forecast. 2009, 24, 1268–1286. [Google Scholar] [CrossRef]
  19. Hattori, M.; Matsumoto, J.; Ogino, S.-Y.; Enomoto, T.; Miyoshi, T. The Impact of Additional Radiosonde Observations on the Analysis of Disturbances in the South China Sea during VPREX2010. SOLA 2016, 12, 75–79. [Google Scholar] [CrossRef] [Green Version]
  20. Naakka, T.; Nygård, T.; Tjernström, M.; Vihma, T.; Pirazzini, R.; Brooks, I.M. The Impact of Radiosounding Observations on Numerical Weather Prediction Analyses in the Arctic. Geophys. Res. Lett. 2019, 46, 8527–8535. [Google Scholar] [CrossRef] [Green Version]
  21. Hou, T.J.; Kong, F.Y.; Chen, X.L.; Lei, H.C. Impact of 3DVAR data assimilation on the prediction of heavy rainfall over Southern China. Adv. Meteorol. 2013, 2013, 129642. [Google Scholar] [CrossRef] [Green Version]
  22. Mo, Y.; Pan, X.B.; Zang, Z.L.; Zhang, B. Numerical experimental study on the impact of data assimilation on a rainstorm in South China. Rainstorm Disaster 2008, 27, 289. [Google Scholar]
  23. Bao, X.H.; Yang, S.N. Experimental study on deterministic prediction of a rainstorm process in southern China by WRF-ENKF system. Meteorol. Mon. 2015, 41, 566–576. [Google Scholar]
  24. Meng, X.W. Numerical Simulation of a Heavy Rainstorm Process in Chongqing Area by Assimilation of Conventional Sounding Data. Master’s Thesis, Lanzhou University, Lanzhou, China, 2018. [Google Scholar]
  25. Choi, Y.; Ha, J.C.; Lim, G.H. Investigation of the Effects of Considering Balloon Drift Information on Radiosonde Data Assimilation Using the Four-Dimensional Variational Method. Weather Forecast. 2015, 30, 809–826. [Google Scholar] [CrossRef]
  26. Wei, L.; Lei, H.C. Improvement of precipitation forecasts by the assimilation of intensive radiosonde data. Clim. Environ. Res. 2012, 17, 809–820. [Google Scholar]
  27. Xu, T.; Wang, X.F.; Zhang, L.; Yang, Y.H.; Li, J. The application test of intensive radiosonde observations in the East China regional numerical model system. Rainstorm Disaster 2016, 35, 306–314. [Google Scholar]
  28. Wang, D.; Xu, Z.F.; Wang, R.W.; Zhang, L.H. Study on the influence of intensive sounding on regional numerical prediction system at 14:00. Plateau Meteorol. 2019, 38, 872–886. [Google Scholar]
  29. Cao, X.Z.; Xia, Y.C.; Luo, H.W.; Liu, L.H.; Liu, Y.F.; Liu, Z.Y.; Li, X.; Guo, R.; Guo, Q.Y. Technical development and prospect of meteorological sounding observation. Adv. Meteorol. Sci. Technol. 2022, 12, 27–36. [Google Scholar]
  30. Cao, X.Z.; Guo, Q.Y.; Yang, R.K. Research on upper and lower secondary sounding based on long time horizontal drift interval. Chin. J. Sci. Instrum. 2019, 40, 198–204. [Google Scholar]
  31. Qian, Y. Research on Quality Control and Evaluation of Round-Trip Flat-Drift Sounding Data. Master’s Thesis, Nanjing University of Information Science and Technology, Nanjing, China, 2019. [Google Scholar]
  32. Wang, D.; Wang, J.C.; Tian, W.H.; Guo, Q.Y. Quality Control and Uncertainty Analysis of Return Radiosonde Data. Chin. J. Atmos. Sci. 2020, 44, 865–884. [Google Scholar]
  33. Rong, N.; Yang, S.P.; Wang, J.C.; Wang, D. The Evaluation of Return Radiosonde Temperature using GNSS Radio Occultation Retrievaled Temperature. Plateau Meteorol. 2023, 42, 221–232. [Google Scholar]
  34. Wang, J.C.; Wang, D.; Yang, R.K.; Cao, X.Z.; Guo, Q.Y. A Return Radiosonde Trajectory Forecast Method and Its Preliminary Evaluation Based on High Resolution Numerical Weather Prediction Model. Chin. J. Atmos. Sci. 2021, 45, 651–663. [Google Scholar]
  35. Yang, C.Y.; Guo, Q.Y.; Cao, X.Z.; Zhang, W. Analysis of gravity wave characteristics in the lower stratosphere based on new round-trip radiosonde. Acta Meteorol. Sin. 2021, 79, 150–167. [Google Scholar]
  36. Zhang, X.; Wang, Q.P.; Ma, X.L.; Zhang, X.P.; Cheng, W.; Xia, Y.C. Study of the Forecast Sensitivity to New Round-trip Drifting Sounding Observation in the Middle and Lower Reaches of the Yangtze River. Chin. J. Atmos. Sci. 2023. [Google Scholar] [CrossRef]
  37. Zhang, X.P.; Guo, Q.Y.; Yang, R.K.; Ma, X.L.; Cao, X.Z. Assimilation experiment of rainstorm in the middle and lower reaches of the Yangtze River based on “up-drift-down” sounding data. Meteorol. Mon. 2021, 47, 1512–1524. [Google Scholar]
  38. Pan, Y.; Shen, Y.; Yu, J.J.; Xiong, A.Y. An experiment of high-resolution gauge-radar-satellite combined precipitation retrieval based on the Bayesian merging method. Acta Meteorol. Sin. 2015, 73, 177–186. [Google Scholar]
  39. Skamarock, W.C.; Klemp, J.B.; Dudhia, J.; Gill, D.O.; Barker, D.; Duda, M.G.; Huang, X.Y.; Wang, W.; Powers, J.G. A Description of the Advanced Research WRF Version 3; Ncar Technical Note, NCAR/TN-475 + STR; University Corporation for Atmospheric Research: Boulder, CO, USA, 2008. [Google Scholar]
  40. Zhang, F.M.; Wang, C.H. Experiments on the improvement of near-surface wind speed forecasting by assimilating conventional observations with WRF-3DVAR. Highl. Meteorol. 2014, 33, 675–685. [Google Scholar] [CrossRef]
  41. Kan, Y.; Liu, C.S.; Qiao, F.X.; Liu, Y.N.; Gao, W.; Sun, Z.B. Effects of Microphysics Parameterization Schemes on the Simulation of a Heavy Rainfall Event in Shanghai. In Proceedings of the SPIE Optical Engineering + Applications, San Diego, CA, USA, 28 August–1 September 2016 ; International Society for Optics and Photonics: Bellingham, WA, USA, 2016. [Google Scholar]
  42. Zhu, G.L.; Lin, W.T.; Cao, Y.H. Numerical simulation of a rainstorm event over southern China by using various cloud microphysics parameterization schemes in the WRF model and its performance analysis. Chin. J. Atmos. Sci. 2014, 38, 513–523. [Google Scholar]
  43. Meng, Z.H. Study on Sensitivity of Physical Disturbance Parameters in High Resolution Numerical Model. Master’s Thesis, Nanjing University of Information Science and Technology, Nanjing, China, 2020. [Google Scholar]
  44. Mlawer, E.J.; Taubman, S.J.; Brown, P.D.; Iacono, M.J.; Clough, S.A. Radiative transfer for inhomogeneous atmospheres: RRTM, a validated correlated-k model for the longwave. J. Geophys. Res. Atmos. 1997, 102, 16663–16682. [Google Scholar] [CrossRef] [Green Version]
  45. Dudhia, J. Numerical study of convection observed during the winter monsoon experiment using a mesoscale two-dimensional model. J. Atmos. Sci. 1989, 46, 3077–3107. [Google Scholar] [CrossRef]
  46. Hong, S.-Y.; Noh, Y.; Dudhia, J. A new vertical diffusion package with an explicit treatment of entrainment processes. Mon. Weather Rev. 2006, 134, 2318–2341. [Google Scholar] [CrossRef] [Green Version]
  47. Paulson, C.A. The mathematical representation of wind speed and temperature profiles in the unstable atmospheric surface layer. J. Appl. Meteorol. 1970, 9, 857–861. [Google Scholar] [CrossRef]
  48. Grell, G.A.; Freitas, S.R. A scale and aerosol aware stochastic convective parameterization for weather and air quality modeling. Atmos. Chem. Phys. 2014, 14, 5233–5250. [Google Scholar] [CrossRef] [Green Version]
  49. Xue, L.L.; Fan, J.W.; Lebo, Z.J.; Wu, W.; Morrison, H.; Grabowski, W.W.; Chu, X.; Geresdi, I.; North, K.; Stenz, R.; et al. Idealized Simulations of a Squall Line from the MC3E Field Campaign Applying Three Bin Microphysics Schemes: Dynamic and Thermodynamic Structure. Mon. Weather Rev. 2017, 145, 4789–4812. [Google Scholar] [CrossRef]
  50. Gao, Y.Q.; Sun, L.; Ma, X.L.; Meng, Z.H.; Cheng, K.Q. The sensitivity of the structure and strength of squall line to low-level humidity and environmental vertical wind shear. Trans. Atmos. Sci. 2022, 45, 938–947. (In Chinese) [Google Scholar] [CrossRef]
Figure 1. Accumulative precipitation (in mm) over 24 h from 19 June 2018 18:00 UTC to 20 June 2018 18:00 UTC.
Atmosphere 14 01127 g001
Figure 2. Weather situation of ERA5 reanalyzed data at 19 June 2018 12:00 UTC (the black solid lines are contours in dagpm; the red solid lines are isotherms in °C; the shading is relative humidity in percent): (a) 500 hPa; (b) 850 hPa.
Atmosphere 14 01127 g002
Figure 3. Domains (a) and diagram (b) of the experimental design.
Atmosphere 14 01127 g003
Figure 4. Distribution of the assimilated observations from the UDD experiment (blue dots indicate the automatic stations’ data, green triangles are the cloud-tracked wind data, orange crosses are data from aircraft reports, red pentagrams indicate operational sounding data and purple pentagrams are round-trip drifting sounding data). (a) 19 June 2018 12:00 UTC; (b) 19 June 2018 18:00 UTC.
Atmosphere 14 01127 g004
Figure 5. Distribution of cumulative precipitation falling in an area within 12 h (a,c,e,g) and 24 h (b,d,f,h) after 19 June 2018 18:00 UTC (in mm). (a,b) Real precipitation; (c,d) CTL experiment; (e,f) GTS experiment; (g,h) UDD experiment.
Atmosphere 14 01127 g005
Figure 6. Areal average cumulative precipitation (columns) and hourly precipitation (lines) since 19 June 2018 18:00 UTC (in mm).
Atmosphere 14 01127 g006
Figure 7. ETS score of 24-h precipitation (a) and bias score (b) at 18:00 UTC on 19 June 2018.
Atmosphere 14 01127 g007
Figure 8. CTL experiment (a,e), UDD experiment (b,f), difference between the GTS and CTL experiments (c,g), difference between the UDD and CTL experiments (d,h) for the wind field at 850 hPa (ad) and the 500 hPa (eh) at 19 June 2018 18:00 UTC (shading shows the full wind speed (m/s); the vectors indicate the wind’s direction).
Atmosphere 14 01127 g008
Figure 9. Distribution of atmospheric precipitable water (unit: mm) at 18:00 UTC on 19 June (ad), 00:00 UTC on 20 June (eh) and 06:00 UTC on 20 June (il) for the CTL experiment (a,e,i), UDD experiment (b,f,j), differences between the GTS and CTL experiment (c,g,k) and differences between the UDD and CTL experiments (d,h,l).
Atmosphere 14 01127 g009
Figure 10. Divergence in the moisture flux at 850 hPa (shading, unit: 10−7 kg/m2·s·hPa), the moisture flux (contours, unit: g/(cm·s·hPa)) and the wind field (vectors, unit: m/s) in the CTL experiment (a,d), GTS experiment (b,e) and UDD experiment (c,f) at 19 June 2018 18:00 UTC (ac) and 20 June 2018 00:00 UTC (df).
Atmosphere 14 01127 g010
Figure 11. The zonal profile of potential pseudo-equivalent temperature (contours, unit: K), relative humidity (shading, unit: %) and wind (vectors, unit: m/s; the vertical velocity was multiplied by a factor of 20) predicted by the CTL experiment (a,c,e) and the UDD experiment (b,d,f) (at 27.8° N): 19 June 2018 18:00 UTC (a,b); 20 June 2018 00:00 UTC (c,d); 20 June 2018 06:00 UTC (e,f).
Atmosphere 14 01127 g011
Figure 12. Vorticity field (shading, unit: 10−5 s−1) and divergence field (contours, unit: 10−5 s−1) at 850 hPa at 19 June 2018 18:00 UTC (a,c,e) and 20 June 2018 00:00 UTC (b,d,f): CTL experiment (a,b); UDD experiment (c,d); differences between the UDD and CTL experiments (e,f).
Atmosphere 14 01127 g012
Figure 13. Distribution of CAPE (unit: J/kg) of the CTL experiment (a), the GTS experiment (b) and the UDD experiment (c) at 19 June 2018 18:00 UTC.
Atmosphere 14 01127 g013
Figure 14. Areal average CAPE (columns) and amount of change in CAPE (lines) after 19 June 2018 18:00 UTC (in J/kg).
Atmosphere 14 01127 g014
Disclaimer/Publisher’s Note: The statements, opinions and data contained in all publications are solely those of the individual author(s) and contributor(s) and not of MDPI and/or the editor(s). MDPI and/or the editor(s) disclaim responsibility for any injury to people or property resulting from any ideas, methods, instructions or products referred to in the content.

