
Study on NDVI Periodic Change Characteristics of Inner Mongolia Grassland Based on Variational Mode Decomposition Algorithm
1
Geospatial Big Data Application Research Center, Chinese Academy of Surveying & Mapping, Beijing 100039, China
2
Handan Key Laboratory of Natural Resources Spatial Information, Handan 056038, China
3
Software and Big Data Department, Handan Polytechnic College, Handan 056038, China
*
Author to whom correspondence should be addressed.
Atmosphere 2023, 14(6), 1039; https://doi.org/10.3390/atmos14061039
Submission received: 3 May 2023
/
Revised: 13 June 2023
/
Accepted: 15 June 2023
/
Published: 16 June 2023
(This article belongs to the Section Meteorology)
Abstract
:Based on the NDVI data of vegetation in Inner Mongolia from 1982 to 2015, the variational mode decomposition (VMD) method, which has been well applied in the field of signal decomposition, is introduced to study the periodicity of vegetation index in Inner Mongolia. The VMD method is used to extract the monthly and annual NDVI and the long time series cycle characteristics of temperature and precipitation in the same period from April 1982 to October 2015 in Inner Mongolia. The results show that temperature and precipitation are important factors affecting the growth of vegetation, and there are 6.99 and 3.49 months of the same oscillation cycle for monthly NDVI and temperature and precipitation time series; when the central frequency is the same, the amplitude of the monthly temperature and precipitation time series increases with the increase of the lag period. The annual scale NDVI has the same period of 16.95, 6.8a, and 4.85a with precipitation, and the same period of 6.8a and 4.85a with temperature. The Residue component shows that the overall NDVI and temperature in Inner Mongolia have shown a significant slow growth trend in the past 30 years. Although the precipitation has shown a significant slow decline trend in the same time period (p = 0.000), the grassland is still in the process of continuous improvement.
1. Introduction
As the main component of a terrestrial ecosystem, surface vegetation is the key link connecting the material and energy exchange between soil and atmosphere, and plays the role of “indicator” in global change research [1,2,3,4]. Using remote sensing to dynamically monitor the temporal and spatial evolution of vegetation cover is of great practical significance for in-depth study of the relationship between vegetation and climate change, as well as human activities, and for revealing the evolution and change of regional environmental conditions [5].
The normalized difference vegetation index (NDVI), as an index to characterize the vegetation coverage, is widely used in the study of the laws and driving forces of long-time-series vegetation evolution [6,7,8,9,10]. In recent years, using wavelet analysis and empirical mode decomposition (EMD) methods, combined with NDVI data, to extract the periodic characteristics of time series and study vegetation cover change has attracted extensive attention from domestic scholars [11,12,13,14,15,16,17,18,19,20]. Wavelet analysis is a method of processing signals and images, which is adaptive and can decompose complex time series composed of different frequency components interwoven into sub sequences with different frequencies [21]. Liu et al. used wavelet transform to discuss the periodic change of NDVI of vegetation in Inner Mongolia from 1998 to 2008, and achieved good application results [22,23,24]. Empirical Mode Decomposition (EMD) is a method proposed by Huang et al. to process nonlinear and non-stationary signals [25]. EMD can adaptively decompose non-stationary signals into a number of stationary eigenmode functions (IMF). It has the characteristics of adaptability, orthogonality, and completeness, and is widely used in vegetation periodic feature analysis, time series feature analysis, prediction, and forecasting [26]. For example, Han et al. studied and analyzed the periodicity of NDVI in the Heihe River basin and its relationship with climate factors using an empirical mode decomposition method; Chen et al. used EMD signal trend extraction technology to remove noise and error information, and accurately obtained the growth trend of different types of vegetation; Chen et al. applied the EMD method combined with the NDVI data of Huaihe River basin to analyze the periodic change of vegetation in the basin; and Zhang et al. studied the evolution of rainfall series characteristics in Hubei Province by coupling EEMD and EMD algorithms, and also achieved the expected research results [27,28,29].
However, both wavelet analysis methods and EMD and EEMD methods still have some shortcomings. For example, wavelet analysis has no theoretical standard for selecting the best wavelet basis function, and EMD and EEMD methods have problems such as mode aliasing and being greatly affected by sampling frequency [30,31,32]. In view of the shortcomings of the EMD method, DRAGOMIRETSKIY et al. proposed a new adaptive signal processing method, Variable Mode Decomposition (VMD), which is an improvement of EMD [33]. It not only retains the advantages of EMD’s adaptive decomposition of non-stationary signals, but also makes up for the shortcomings of the EMD method. It transforms the signal decomposition into a non-recursive, variational mode decomposition mode, and uses recursive iteration to calculate the optimal solution of the variational model to determine the frequency center and bandwidth of each IMF component [21]. The frequency center and bandwidth of the IMF change constantly in the iterative solution of the variational model. It adaptively realizes the separation of the signal frequency domain from each IMF. The frequency band of each modal component is around the center frequency, and there will be no mode aliasing [26]. The VMD method has been widely used in bearing fault characteristics, short-term charge, wind speed prediction, etc. Liu Changliang et al. have carried out fault diagnosis for rolling bearings based on variational mode decomposition and fuzzy C-means clustering [30]; Tang et al. applied the VMD method to early fault diagnosis of rolling bearings [31]; and Ma et al. extracted the fault features of rolling bearings based on the variational mode decomposition, and achieved good application results [32]. Liang et al. used VMD to decompose the original historical time series into several characteristic model functions, which improved the accuracy of short-term prediction [34,35,36,37,38,39,40].
At present, the research results of VMD method in the time series analysis of vegetation NDVI data are rare. This paper selects GIMMS NDVI3g data from April to October of 1982 to 2015, temperature and precipitation data from 1979 to 2015, uses VMD and FFT algorithms to extract data cycle and trend information, discusses the periodic relationship between vegetation and meteorological factors such as temperature and precipitation, and then studies the dynamic trend of vegetation and its climate factors and the application effects of the VMD method in surface vegetation monitoring data.
2. Materials and Methods
2.1. Study Area
The Inner Mongolia Autonomous Region (from 37°01′ N to 53°02′ N by 95°02′ E to 123°37′ E) is located in the northern border region of China (Figure 1). The Inner Mongolia grassland is the largest grassland pastoral area in China, located in the middle of the Eurasian grassland belt, which is the transition zone between the northwestern arid zone and the northeast humid zone and the dry farming region in North China. The Inner Mongolia grassland’s elevation is about 88–3496 m, and the total area is about 1,183,000 km2, belonging to a typical kind of semi-arid temperate grassland ecosystem in the middle latitude with an annual precipitation of 100–450 mm, decreasing from east to west, and an annual mean temperature of 0–8 °C, increasing from east to west in Inner Mongolia.
2.2. Data Set
The NOAA/AVHRR data set GIMMS NDVI3g was selected (download website: https://ecocast.arc.nasa.gov/data/pub/gimms/3g.v1/ (accessed on 5 March 2019)), the time range was from April to October of each year from 1982 to 2015, the time resolution was 15 days, and the spatial resolution was 8 km. In addition, the annual NDVI dataset is the cumulative sum of NDVI from April to October of the corresponding year. Monthly meteorological datasets were obtained from the National Meteorological Data Sharing Service Platform (http://data.cma.cn/ (accessed on 15 September 2018)), including monthly mean temperature and precipitation data between 1982–2015 (January–October) for 47 meteorological stations in Inner Mongolia (Figure 1). In order for these data to match the NDVI data (i.e., at a spatial resolution of 8 km), we employed the Kriging interpolation method within the ARCGIS software; this resulted in temperature and precipitation datasets for the entire study region. The annual precipitation is the cumulative monthly precipitation value from January to October, and the annual temperature is the average value of the monthly temperatures.
2.3. Research Method
The VMD algorithm is a new adaptive signal processing method [34,35,36,37]. Its decomposition process is the solution process of the variational problem. Suppose each IMF contains a limited bandwidth [32,33,34]. The variational problem is to seek K modal functions to minimize the estimated bandwidth sum of all modal functions. The sum of all modes is equal to the constraint condition of the original input signal f.
The steps are as follows:
Hilbert transform is used to calculate the analytical signal of each modal function to obtain the unilateral spectrum:
The center frequency of each modal analytical signal is estimated by mixing, and the spectrum of each modal is modulated to the corresponding fundamental frequency band:
Calculate the square L2 norm of the above demodulated signal gradient, and estimate the signal bandwidth of each modal function. The constrained variational problem is as follows:
The quadratic penalty factor a and Lagrangian multiplier operator λ(t) are introduced to construct extended Lagrangian expressions:
Iteration is repeated to find the “saddle point” of the extended Lagrangian expression and solve the minimum value to obtain the optimal solution. The optimal solution is the eigenmode function uk and the respective center frequency wk.
3. Results and Analysis
3.1. Comparison and Analysis of EMD and VMD Algorithms
Based on the scale NDVI data of Inner Mongolia Autonomous Region from April 1982 to October 2015, the EMD and VMD algorithms were, respectively, used to decompose and obtain multiple time-scale maps as shown in Figure 2 and Figure 3.
It can be seen from Figure 2A that the NDVI data were decomposed by EMD to obtain four IMF components and one Residue component; Figure 2B is the FFT transformation of NDVI and its components. The results show that NDVI has two wave periods, but IMF1 does not accurately decompose the two wave periods, and there is a phenomenon of “mode aliasing”. Figure 3A shows that the NDVI data were decomposed by VMD to obtain two IMF components and one Residue component; Figure 3B shows the FFT transformation results of NDVI and its components, and we can find that it has two fluctuation cycles, IMF1 and IMF2, respectively. In addition, the Residue component, as the last component, represents the change trend characteristics of the entire NDVI time series.
3.2. Analysis of Monthly Scale Periodic Change
Based on the above research, this paper uses VMD and FFT methods to decompose the monthly and annual NDVI data of the Inner Mongolia Autonomous Region from April to October every year from 1982 to 2015. The decomposition results are shown in Figure 3, Figure 4, Figure 5 and Figure 6. Figure 4a–d and Figure 5a–d were obtained via VMD decomposition of precipitation and temperature series from April to October, March to September, February to August, and January to July in the region from 1982 to 2015. Furthermore, Figure 7a–d and Figure 8a–d show the decomposition results of annual precipitation and annual average temperature time series from 1982 to 2015, from 1981 to 2014, from 1980 to 2013, and from 1979 to 2012, respectively.
Figure 3 shows that the NDVI time series data from April to October of 1982 to 2015 were decomposed into two IMF components and one Residue component by VMD, and then FFT was performed to obtain the spectrum. Figure 3A is the VMD decomposition result, and Figure 3B is the FFT transformation result of Figure 3A, wherein (a) in Figure 3A is the NDVI time series, and (b) in Figure 3B indicates that the NDVI time series has two dominant frequencies; (c,e,g) are first-order and second-order IMF components and Residue components, respectively; the Residue component indicates that the overall change trend of monthly NDVI shows a significant slow growth trend (p = 0.00, slope = 0.0076%/m), and (d,f,h) are the corresponding frequencies.
It can be seen from Figure 4a–d that the time series of rainfall from April to October, March to September, February to August, and January to July in 1982–2015 were decomposed via VMD to obtain 1 IMF, 1 IMF, 2 IMF, and 3 IMF components, respectively, and then FFT was performed to obtain the spectrum. The Residue component in Figure 4a–c decreases at a rate of 0.013/month, 0.009/month, and 0.004/month, respectively, and the Residue component in Figure 4d increases slowly and significantly at a linear rate of 0.02/month (p = 0.000).
It can be seen from Figure 5a–d that from 1982 to 2015, the time series of temperature on the scale of April to October, March to September, February to August, and January to July were decomposed via VMD to obtain 2, 3, 3, and 3 IMF components, respectively, and the Residue component showed a significantly slow upward trend at the linear speed of 0.005/month, 0.084/month, 0.011/month, and 0.012/month, respectively (p = 0.000).
The IMF components and their FFT transformation results in Statistical Figure 3, Figure 4 and Figure 5 are shown in Table 1.
- From 1982 to 2015, the center frequencies of the modal components of NDVI and temperature IMF1 and IMF2 on the monthly scale from April to October were consistent, 0.143 HZ and 0.286 HZ, respectively, in which IMF1 showed a 6.99 month cycle and IMF2 showed a 3.49 month cycle.
- From March to September, February to August, and January to July in 1982–2015, the monthly temperature had three IMF components, which are expressed as 6.99, 3.49, and 2.33 month fluctuation cycles.
- From April to October, March to September, February to August, and January to July of each year from 1982 to 2015, the precipitation had a similar period of 6.99 months with the IMF1 modal component of NDVI in April to October in the same time period. In addition, the scale NDVI from April to October is consistent with the scale component IMF2 of precipitation from February to August and from January to July, showing a 3.49 month cycle change, which is half of the IMF1 cycle; the central frequency of precipitation IMF3 from January to July is 0.429 HZ, and the period is 2.33 months, which is one third of the oscillation period of IMF1.
- When the central frequency of IMF1 is the same, the average amplitude of monthly scale temperature from low to high is 8.56 (April to October), 10.51 (March to September), 14.16 (February to August), and 16.45 (January to July); the average amplitude of monthly precipitation from low to high is 29.9 (January to July), 33.45 (April to October), 33.91 (March to September), and 35.07 (February to August); when the central frequency of IMF2 is the same, the average amplitude of monthly scale temperature from low to high is 1.46 (April to October), 3.56 (March to September), 6.18 (February to August), and 6.94 (January to July); when the central frequency of IMF 3 is the same, the average amplitude of monthly scale temperature is 2.56 (March to September), 4.42 (February to August), and 5.44 (January to July) from low to high, showing that the amplitude increases with the increase of the lag period.
3.3. Annual Scale Periodicity Analysis
Using ARCGIS software, the annual scale NDVI time series from 1982 to 2015 were obtained by summing up the NDVI accumulatively from April to October of each year from 1982 to 2015, the annual scale precipitation time series were obtained by summing up the precipitation accumulatively from January to October of the corresponding year, and the annual scale temperature data were obtained by averaging the temperature from January to October of the corresponding year.
Figure 6A shows the IMF component map obtained by VMD decomposition of annual scale NDVI time series from 1982 to 2015, and (Figure 6B) shows the FFT transformation result of Figure 6A. Figure 6(a) is the NDVI annual scale time series, Figure 6(c,e,g,i,k,m,o) are 1–6 order IMF components and Residue components, respectively, reflecting the complexity and multi time scale of NDVI changes in Inner Mongolia; the Residue component indicates that the overall change trend of NDVI on an annual scale shows a significant slow growth trend (p = 0.00, slope = 0.02/10a).
It can be seen from Figure 7a–d that 6, 7, 7, and 7 IMF components were obtained from the time series of precipitation on the scale of 1982–2015, 1981–2014, 1980–2013, and 1979–2012 after VMD decomposition, and the corresponding FFT transformation was performed to obtain the spectrum map. The Residue component in Figure 7a–d changes at the speed of −0.43/a, −0.53/a, −0.59/a, and −0.95/a, respectively (p = 0.000), reflecting that the rainfall in Inner Mongolia has shown a significant decreasing trend in the past 30 years.
Figure 8a–d shows that six IMF components can be obtained from each time scale data of the 1982–2015, 1981–2014, 1980–2013, and 1979–2012 scale temperature series after VMD decomposition, and the corresponding spectrum can be obtained via FFT transformation. In Figure 8a–d, the Residue component of the temperature in Inner Mongolia shows a significantly slow upward trend at the speeds of 0.039a, 0.039/a, 0.044/a, and 0.052/a, respectively (p = 0.000).
In order to further study the accurate periodic characteristics of each IMF component, the IMF components and their corresponding FFT transformation results in Figure 6, Figure 7 and Figure 8 are shown in Table 2.
- There are several periods of NDVI on the scale of 1982–2015, which are about 16.95, 6.8a, 4.85a, 3.4a, 2.83a, and 2.61a, respectively; the scale temperature in 1982–2015, 1981–2014, 1980–2013, and 1979–2012 has the periodic characteristics of 8.47a, 6.8a, 3.09a, 2.43a, and 2.27a; and the corresponding precipitation periods are 16.95a, 6.8a, 4.85a, 3.09a, 2.43a, and 2.27a.
- The annual scale temperature IMF1 center frequency is 0.118 HZ, and the period is 8.47, which is half of the NDVI IMF1 period; the temperature is consistent with the cycle of NDVI IMF2.
- The periodic characteristics of NDVI in 1982–2015 are the same as the corresponding precipitation periods in 1982–2015, 1981–2014, and 1979–2012, which are 16.95a, 6.8a, and 4.85a, respectively.
- The center frequency of IMF1 and IMF4 components of precipitation in 1980–2013 is consistent with that of NDVI IMF1 and IMF3 in 1982–2015, which are 0.059 HZ and 0.147 HZ, respectively, and the period is 16.95a and 4.85a.
- In addition, the annual scale precipitation in 1982–2015, 1981–2014, 1980–2013, and 1979–2012 included a 2.43a oscillation period, and in 1982–2015, 1980–2013, and 1979–2012 also included a 3.09a fluctuation period.
4. Discussion and Conclusions
4.1. The Periodic Variation Characteristics of Meteorological Factors and Their Impact on Regional Vegetation
Based on temperature and precipitation data between 1982–2015 (April–October) of 47 meteorological stations in Inner Mongolia (Figure 1), the VMD method and Fourier transform FFT method were used to study the changes in temperature and precipitation. Based on this, the periodic changes and trends of the above meteorological parameters were analyzed. The experimental results confirm that both the temperature and precipitation series data exhibit significant interannual and intra-year variations. During the year, the patterns of temperature and precipitation changes are basically the same, generally increasing gradually from April to May, reaching a peak in July, and then gradually decreasing. From interannual analysis, both temperature and rainfall have obvious periodicity, with an average time of 6.99 months and 3.49 months, with dominant frequencies of 0.143 HZ and 0.286 HZ, respectively. From the trend of change, temperature shows a significant slow increase, while precipitation shows a slow decrease trend. Affected by this, the NDVI of vegetation in Inner Mongolia showed a slow improvement trend from 1982 to 2015.
A correlation analysis was conducted between NDVI and Climatic Factors based on an Annual Scale from 1982 to 2015; the results are shown in Figure 9. On the annual scale, the vegetation NDVI showed a good correlation with the temperature and precipitation in our study period, and 70.2% and 85.26% of the area had a positive correlation, respectively. Excluding the influence of periodic variables, temperature and precipitation promote vegetation growth, and the above research results are basically consistent with the results of Meng Meng [41] and Mu et al. [42].
Existing studies have proved that [42], due to the influence of sunspot activities, climate factors, especially temperature and precipitation, have periodic changes, and it is generally believed that the most basic period of changes in meteorological factors on the earth is 2–3 years. However, the results obtained in this paper show a definite difference with this conclusion, and we believe that the reason should be related to the movement of celestial bodies and the period of changes in the strength of sunspots. Some research data show that the intensity of sunspot activity is closely related to the change of climate factors [43].
4.2. Vegetation NDVI Periodic Change Characteristics
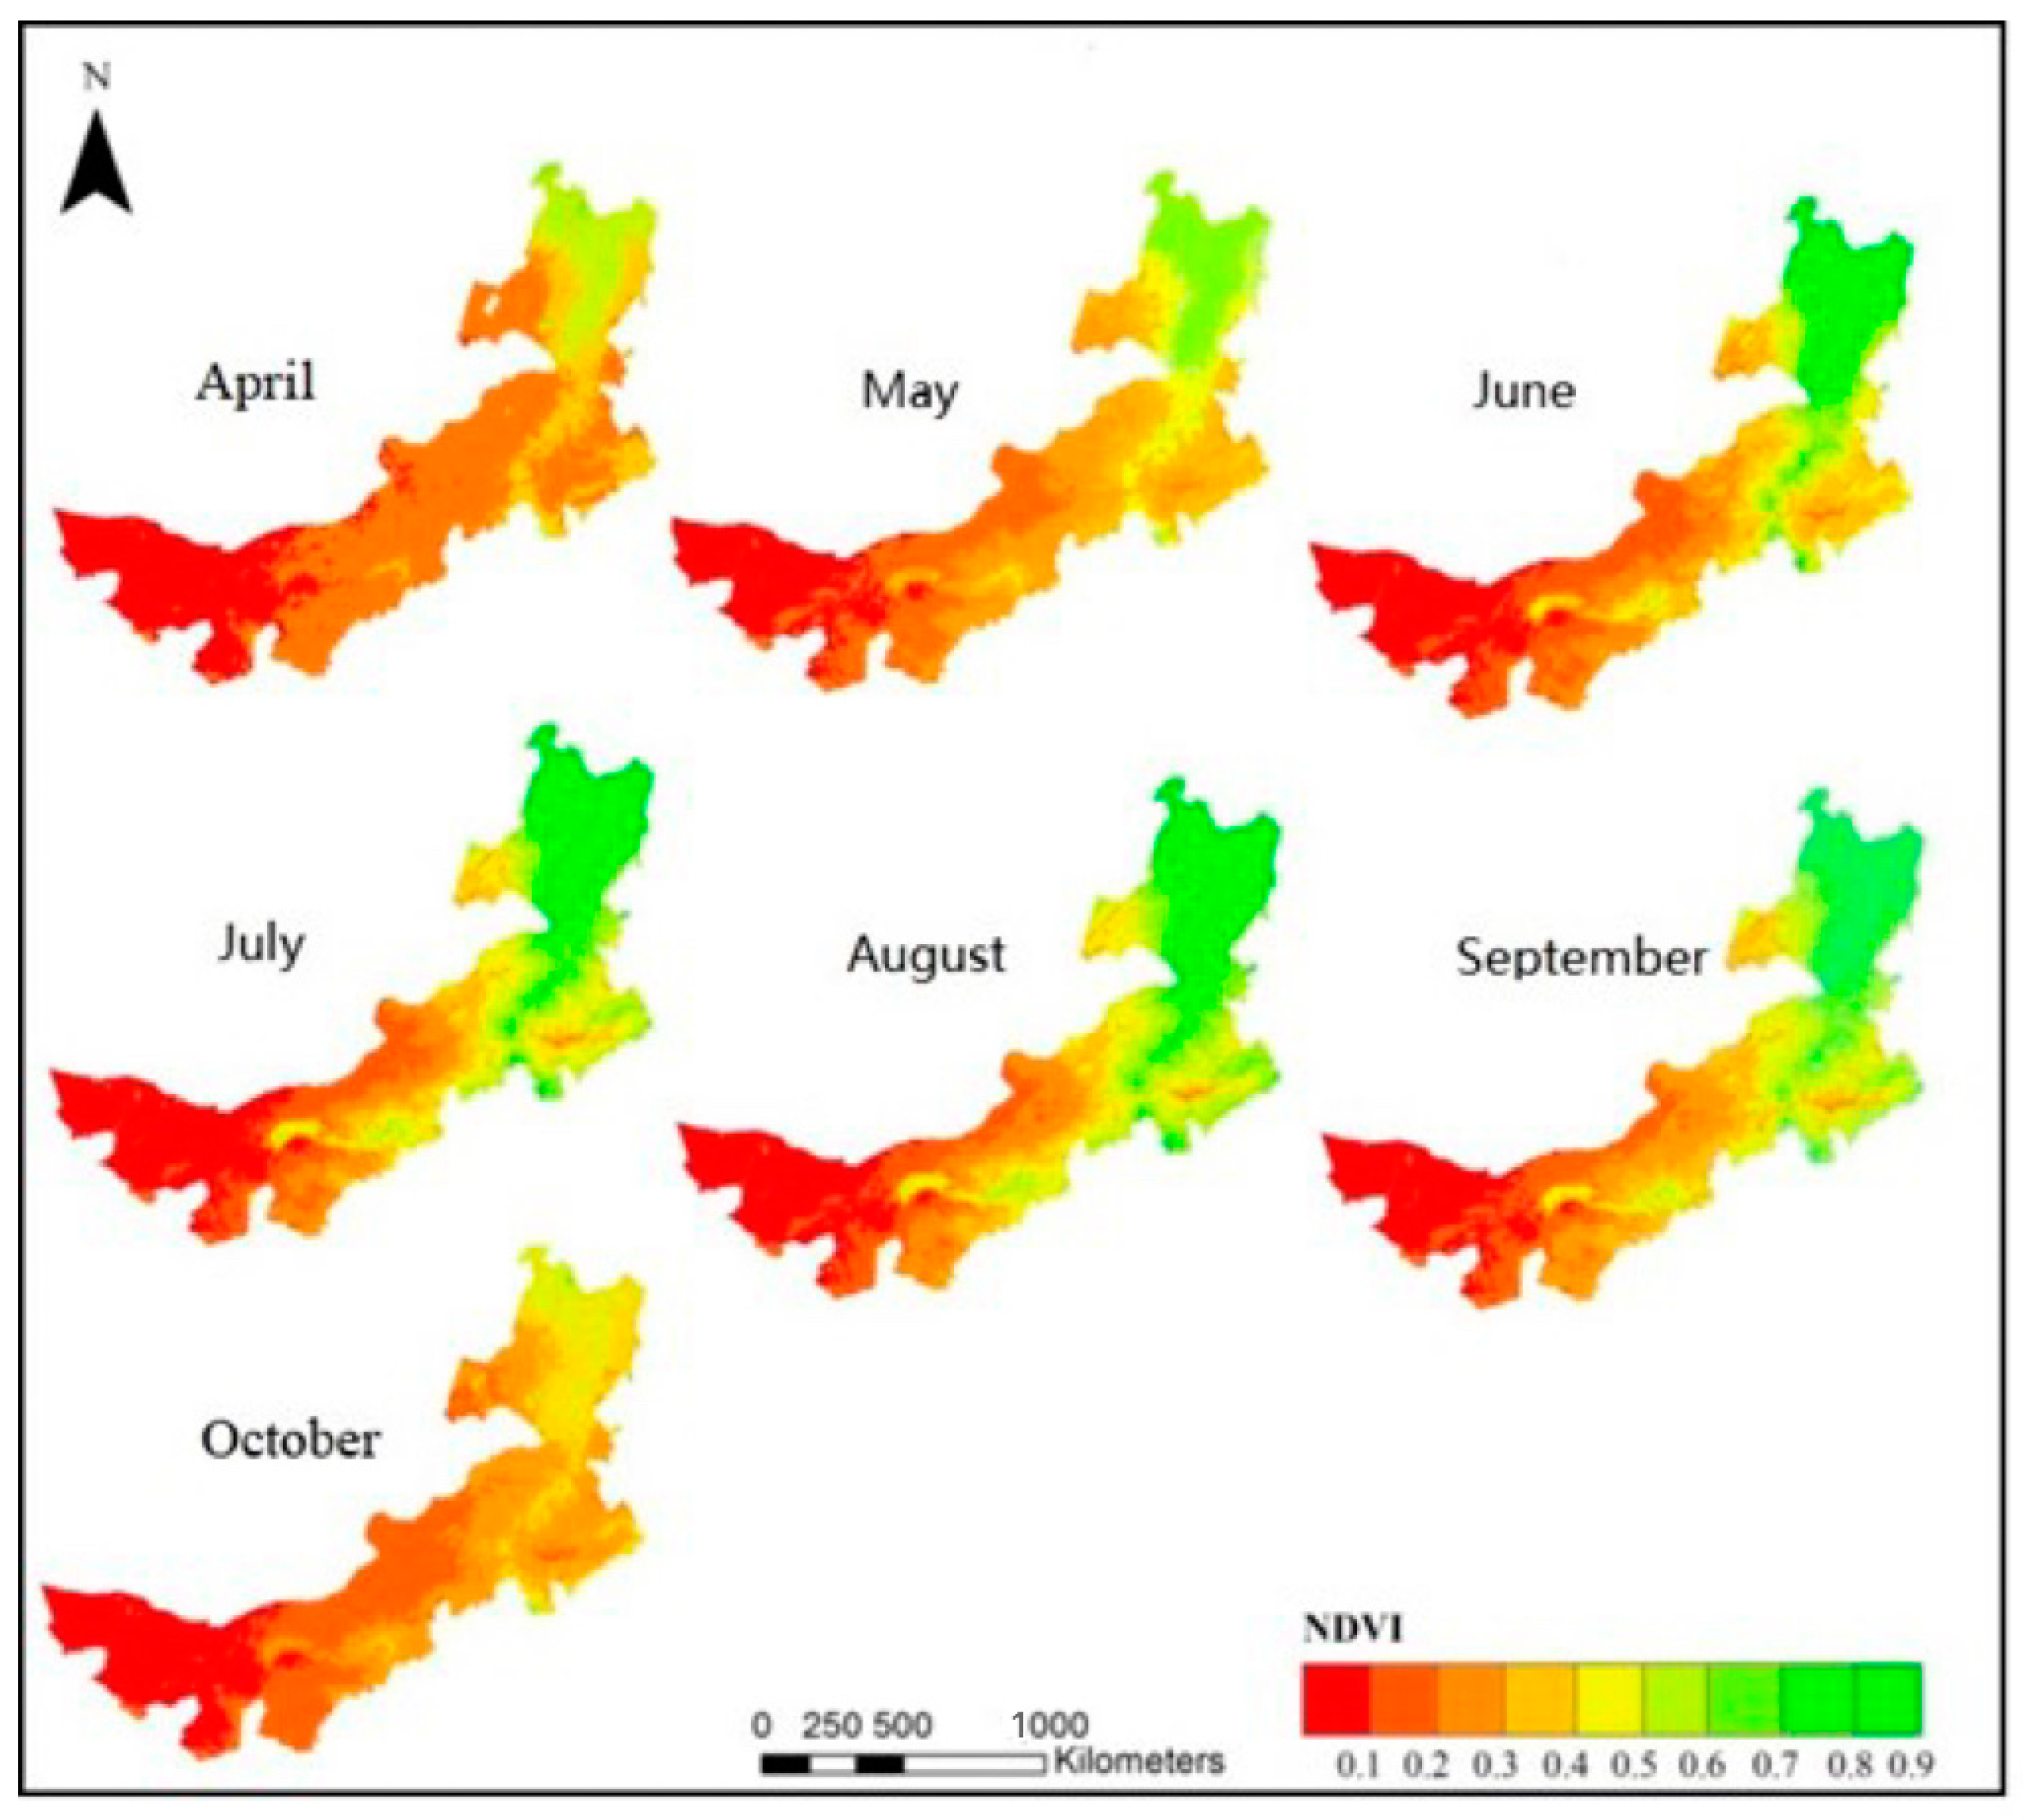
The time series decomposition results indicate that there are 6.99 (whole growing season) and 3.49 months of the same oscillation cycle for monthly NDVI and temperature and precipitation time series. The experimental results indicate that NDVI is positively regulated by temperature and precipitation, and the driving force of precipitation on vegetation is slightly higher than the impact of temperature on vegetation. It can be seen from the annual spatial distribution map of NDVI of vegetation (Figure 10) that, in spatial distribution, the vegetation at different locations in Inner Mongolia is distributed by gradient, and the NDVI value of Inner Mongolia gradually increases from southwest to northeast, while in terms of time, in April, the vegetation coverage was not significant, with only a slight greenness in the northeast region. Over time, the NDVI value gradually increased from southwest to northeast, and the vegetation gradually turned green. In July and August, the vegetation was most lush, mainly distributed in the northeast of Inner Mongolia; this time period coincides with the period with the highest rainfall and average temperature. The above research results are generally consistent with the findings of scholars such as Mu [42] and Meng Meng [41] that the overall spatiotemporal distribution of NDVI in Inner Mongolia is showing an upward trend. This further indicates the high correlation between regional vegetation growth and temperature and precipitation, which has supporting significance for scientific decision-making on grassland ecological environment protection. Through reviewing the relevant literature, it was found that the NDVI change rate of vegetation in Inner Mongolia from 1982 to 2015 was faster than that of the entire vegetation of China (0.007/10a from 1982 to 2011) [44,45], and also faster than that of the Loess Plateau (0.025/10a from 1982 to 2013) [44] and the Tibet Plateau (0.004/10a from 1982 to 2012) [46]. This indicates that the Inner Mongolia grasslands have received good ecological restoration in the past thirty years.
4.3. Delay Analysis of Vegetation Caused by the Meteorological Factors
The influence of climate on vegetation growth has a certain delay, and this conclusion has been recognized by many studies (Davis, 1989 [47]; Gessner U et al., 2013 [48]; Saatchi et al., 2013 [49]; Chen et al., 2014 [50]; Wu D et al., 2015 [51]; Xie B et al., 2016 [52]). In our study, we analyzed the correlation between monthly-scale NDVI and corresponding temperature and precipitation, and also found that temperature and precipitation have a lag effect on vegetation growth. For the monthly NDVI data from April to October, 1982 to 2015, there is a lag between the temperature, precipitation data, and NDVI. NDVI has the same period of 6.99 and 3.49 months with the temperature of the same time data, and 6.99 months with precipitation. If the lag influence factor is considered, the monthly scale temperature data of 1–3 months in the lag period mainly contains the periodic laws of 6.99, 3.49, and 2.33 months, and the monthly scale precipitation data of 1–3 months in the lag period mainly contains the periodic laws of 6.99, 3.49, 3.49, and 2.33 months, which is obviously different from that without considering the lag. The data analysis also found that when the center frequency is the same, the amplitude of the monthly scale temperature and precipitation time series data increases with the increase of the lag period. Therefore, when conducting research on vegetation growth patterns based on meteorological factors, it is necessary to take into account the issue of delay and study how to quantitatively calculate the duration of lag and the degree of influence of different factors.
Admittedly, because of the complex multi-scale characteristics between climate change and vegetation growth (Hawinkel P et al., 2015 [53]; Bunting E L et al., 2017) [54] and the low extraction accuracy of earth vegetation, the spatial resolution of MODIS is relatively coarse, and the density of meteorological stations is relatively low. Additionally, as this paper only takes the monthly delay as an example to verify and apply the method in the experimental verification section, further research needs to be carried out in combination with high-resolution images and high-density meteorological observation data, and particularly extended to the feature analysis of lag effects between climate and vegetation growth in different scales.
Author Contributions
Conceptualization, D.S. and A.Z.; methodology, Z.T. software, formal analysis, Z.T. and X.L.; data work, X.L. and Z.T.; writing—original draft preparation, D.S. and Z.T.; writing—review and editing, A.Z., D.S., Z.T., X.L. and Y.H. All authors have read and agreed to the published version of the manuscript.
Funding
This research was funded by the National Natural Science Foundation of China (NSFC) under grant number 42071246, the Hebei Natural Science Foundation under grant number D2021402007, and the Ecological SmartMine Joint Fund of Hebei Natural Science Foundation under grant number E2020402086.
Institutional Review Board Statement
Not applicable.
Informed Consent Statement
Not applicable.
Data Availability Statement
Data sharing not applicable.
Conflicts of Interest
The authors declare no conflict of interest.
References
- Tucker, C.J. Red and photographic infrared linear combinations for monitoring vegetation. Remote Sens. Environ. 1979, 8, 127–150. [Google Scholar] [CrossRef] [Green Version]
- Chen, X.Q.; Wang, H. Spatial and temporal variations of vegetation belts and vegetation cover degrees in Inner Mongolia from 1982 to 2003. Acta Geogr. Sin. 2009, 64, 84–94. [Google Scholar]
- Zhu, X.; Xiao, G.; Zhang, D.; Guo, L. Mapping abandoned farmland in China using time series MODIS NDVI. Sci. Total Environ. 2021, 755, 142651. [Google Scholar] [CrossRef]
- Sun, H.Y.; Wang, C.Y.; Zheng, N.; Bukhosor. Analysis of the vegetation cover change and the relationship between NDVI and environmental factors by using NOAA time series data. J. Remote Sens. 1998, 2, 204–210. [Google Scholar]
- Shen, B.B.; Wei, Y.B.; Ma, L.C.; Xu, D.W.; Ding, L.; Hou, L.L.; Qin, Q.; Xin, X.P. Spatiotemporal changes and drivers of fractional vegetation cover in Inner Mongolia grassland of China. Trans. CSAE 2022, 38, 118–126. [Google Scholar]
- Wu, L.L.; Wang, S.Y.; Ma, Y.X.; Yang, R.X.; Guan, Y.L.; Hai, K.; Liu, W.H. Response of vegetation to climate change in Central Asia with remote sensing and meteorological data. J. Remote Sens. 2022, 26, 2248–2267. [Google Scholar]
- Zhou, Y.K. Impacts of growth magnitude and length on long-term trends and interannual variation of vegetation productivity over Northeastern China. J. Remote Sens. 2021, 25, 8–19. [Google Scholar]
- Shen, B.; Fang, S.B.; Yu, W.G. Different correlations between NDVI and meteorological factors at temporal-time scales. J. Remote Sens. 2016, 20, 481–490. [Google Scholar]
- Joiner, J.; Yoshida, Y.; Anderson, M.; Holmes, T.; Hain, C.; Reichle, R.; Koster, R.; Middleton, E.; Zeng, F.W. Global relationships among traditional reflectance vegetation indices (NDVI and NDII), evapotranspiration (ET), and soil moisture variability on weekly timescales. Remote Sens. Environ. 2018, 219, 339–352. [Google Scholar] [CrossRef] [Green Version]
- Zhou, C.H.; Liang, J.Y.; Xie, Y.C. Investigating causal relationships between grassland deterioration and climate and socioeconomic changes through time-series computational learning. J. Clean. Prod. 2022, 366, 132963. [Google Scholar] [CrossRef]
- Zhou, C.H.; Xie, Y.C.; Zhang, A.B.; Liu, C.; Yang, J.Y. Spatiotemporal analysis of interactions between seasonal water, climate, land use, policy, and socioeconomic changes: Hulun-Buir Steppe as a Case Study. Water Res. 2022, 209, 117937. [Google Scholar] [CrossRef]
- Xu, X.; Ren, Z.Y.; Yang, R. The spatial and temporal dynamics of NDVI and its relation with climatic factors in Loess Plateau. J. Shaanxi Nor. Univ. 2012, 40, 82–87. [Google Scholar]
- Tu, Y.; Jiang, L.L.; Liu, R.; Xiao, Z.L.; Min, J. Spatiotemporal changes of vegetation NDVI and its driving forces in China during 1982–2015. Trans. CSAE 2021, 37, 75–84. [Google Scholar]
- Du, J.Q.; Zhao, C.X.; Jiaerheng, A.; Fang, S.F.; Xiang, B.; Yin, J.Q.; He, P.; Yuan, X.J.; Fang, G.L.; Shu, J.M. Analysis on spatio-temporal trends and drivers in monthly NDVI during recent decades in Xinjiang, China based two datasets. Trans. CSAE 2016, 32, 172–181. [Google Scholar]
- Yin, G.; Meng, X.Y.; Wang, H.; Hu, Z.Y.; Sun, Z.Q. Spatial-temporal variation of vegetation and its correlation with climate change in Central Asia during the period of 1982–2012. Acta Ecol. Sin. 2017, 37, 3149–3163. [Google Scholar]
- Wu, H.H.; Kuang, H.B.; Meng, B.; Feng, W.W. Study on the periodic characteristics of BDI index based on EMD-WA model. Syst. Eng-Theory Pract. 2018, 38, 1586–1598. [Google Scholar]
- Wang, X.L.; Zhang, Q.; Zhang, S.C. Periodic oscillation analysis of GPS water vapor time series using combined algorithm based on EMD and WD. Geo-Inform. Sci. Wuhan Univ. 2018, 43, 620–628. [Google Scholar]
- Han, H.; Ma, M.; Ping, Y.; Yi, S. Periodicity analysis of NDVI time series and its relationship with climatic factors in the Heihe River Basin in China. Remote Sens. Tech. Appl. 2011, 26, 554–560. [Google Scholar]
- Song, N.P.; Du, L.T.; Wang, L. Vegetation dynamics over 2000-2012 and its driving factors in Yanchi County, Ningxia Province. Acta Ecol. Sin. 2016, 35, 7377–7386. [Google Scholar]
- Chen, C.F.; Son, N.T.; Chang, L.Y.; Chen, C.C. Monitoring of soil moisture variability in relation to rice cropping systems in the Vietnamese Mekong delta using MODIS data. Appl. Geogr. 2011, 31, 463–475. [Google Scholar] [CrossRef]
- Liu, X.X.; Zhang, A.B.; Shi, C.M.; Wang, H.F. Filtering and multi-scale RBF prediction model of rainfall based on EMD method. In Proceedings of the First International Conference on Information Science and Engineering, Nanjing, China, 26–28 December 2009. [Google Scholar]
- Liu, H.X.; Zhang, A.B.; Jiang, T.; Zhao, A.Z.; Zhao, Y.L.; Wang, D.L. Response of vegetation productivity to climate change and human activities in the Shaanxi–Gansu–Ningxia region, China. J. Ndn. Soci. Remote Sens. 2018, 46, 1081–1092. [Google Scholar] [CrossRef]
- Liu, X.X.; Tian, Z.X.; Zhang, A.B.; Zhao, A.Z.; Liu, H.X. Impacts of climate on spatiotemporal variations in vegetation NDVI from 1982–2015 in Inner Mongolia, China. Sustainability 2019, 11, 768. [Google Scholar] [CrossRef] [Green Version]
- Zhao, A.Z.; Zhang, A.B.; Cao, S.; Liu, X.F.; Liu, J.H.; Cheng, D.Y. Responses of vegetation productivity to multi-scale drought in Loess Plateau, China. Catena 2018, 163, 165–171. [Google Scholar] [CrossRef]
- Huang, N.E.; Shen, Z.; Long, S.R.; Wu, M.L.C.; Shih, H.H.; Zheng, Q.N.; Yen, N.C.; Tung, C.C.; Liu, H.H. The empirical mode decomposition and the hilbert spectrum for nonlinear and non-stationary time series analysis. Proc. R. Soc. A-Math. Phys. Eng. Sci. 1998, 454, 903–995. [Google Scholar] [CrossRef]
- Zhao, H.S.; Guo, S.W.; Gao, D. Fault feature extraction of bearing faults based on singular value decomposition and variational modal decomposition. J. Vib. Shock 2016, 35, 183–188. [Google Scholar]
- Chen, T.Y.; Xie, Y.C.; Liu, C.; Bai, Y.F.; Zhang, A.B.; Mao, L.S.; Fan, S.Y. Trend analysis of relationship between primary productivity, precipitation and temperature in Inner Mongolia. Int. J. Geo-Inf. 2018, 7, 214. [Google Scholar] [CrossRef] [Green Version]
- Hu, Y.Q.; Hu, L.; Sun, P.; Wen, Q.Z.; Feng, A.L.; Liu, W. Spatio-temporal evolution of drought events in Huaihe River Basin: A non-stationary standardized precipitation evapotranspiration index study. J. Beijing Nor. Univ. 2022, 58, 116–124. [Google Scholar]
- Zhang, G.Y.; Wu, Y.G.; Liu, Y.; Zhang, W.B. A contrastive analysis of EMD and EEMD on multiple time-scale characteristics of rainfall. China Rural Water Hydropower 2014, 8, 98–103. [Google Scholar]
- Jiang, T.; Liu, B.H.; Li, X.; Li, G.Q. Forced oscillation location in power systems using multiple empirical mode decomposition. Proc. CSEE 2022, 42, 8063–8074. [Google Scholar]
- Wu, Z.H.; Huang, N.E. Ensemble empirical mode decomposition a noise assisted data analysis method. Adv. Adapt. Data Anal. 2011, 1, 1–41. [Google Scholar] [CrossRef]
- Rilling, G.; Flandrin, P. On the influence of sampling on the empirical mode decomposition. In Proceedings of the IEEE International Conference on Acoustics, Speech, and Signal Processing, Toulouse, France, 14–19 May 2006. [Google Scholar]
- Dragomiretskiy, K.; Zosso, D. Variational mode decomposition. IEEE Trans. Signal Proc. 2014, 62, 531–544. [Google Scholar] [CrossRef]
- Liu, C.L.; Wu, Y.J.; Zhen, C.G. Rolling bearing fault diagnosis based on variational mode decomposition and fuzzy C means clustering. Proc. CSEE 2015, 35, 3358–3365. [Google Scholar]
- Tang, G.J.; Wang, X.L. Variational mode decomposition method and its application on incipient fault diagnosis of rolling bearing. J. Vib. Eng. 2016, 29, 638–648. [Google Scholar]
- Ma, Z.Q.; Li, Y.C.; Liu, Z.; Guang, C.J. Rolling bearing fault feature extraction based on variational mode decomposition and Teager energy operator. J. Vib. Shock 2016, 35, 134–139. [Google Scholar]
- Xia, J.Z.; Yu, M.Q.; Huang, C.; Wang, Z.A.; Lu, Q.P. Fault feature extraction of rolling element bearing based on VMD and Infogram. J. Vib. Shock 2017, 36, 111–117. [Google Scholar]
- Liang, Z.; Sun, G.Q.; Li, H.C.; Wei, Z.N.; Zang, H.X.; Zhou, Y.Z.; Chen, S. Short-term load forecasting based on VMD and PSO optimized deep belief network. Power Syst. Technol. 2018, 42, 598–606. [Google Scholar]
- Lei, F.; Wei, Z.N.; Li, H.J.; Kwok, W.C.; Son, G.Q.; Sun, Y.H. Short-term wind speed interval prediction based on VMD and BA-RVM algorithm. Electr. Power Autom. Equip. 2017, 37, 93–100. [Google Scholar]
- Yang, J.P.; Ding, Y.J.; Chen, R.S. Analysis on periodic variations of annual hydrologic and meteorological series in source regions of Yangtze and Yellow Rivers. J. Dzt. Res. 2005, 25, 351–355. [Google Scholar]
- Meng, M.; Zheng, N. Change characteristic of ndvi and its response to climate change in inner mongolia over the past 30 years. Remote Sens. Technol. Appl. 2018, 33, 676–685. [Google Scholar]
- Mu, S.; Yang, H.; Li, J.; Chen, Y.; Gang, C.; Zhou, W.; Ju, W. Spatio-temporal dynamics of vegetation coverage and its relationship with climate factors in Inner Mongolia, China. J. Geogr. Sci. 2013, 23, 231–246. [Google Scholar] [CrossRef]
- Bhatt, U.S.; Walker, D.A.; Raynolds, M.K.; Bieniek, P.A.; Epstein, H.E.; Comiso, J.C.; Pinzon, J.E.; Tucker, C.J.; Steele, M.; Ermold, W.; et al. Changing seasonality of panarctic tundra vegetation in relationship to climatic variables. Environ. Res. Lett. 2017, 12, 055003. [Google Scholar] [CrossRef] [Green Version]
- Liu, X.; Zhu, X.; Pan, Y.; Zhao, A.; Li, Y. Spatiotemporal changes of cold surges in Inner Mongolia between 1960 and 2012. J. Geogr. Sci. 2015, 25, 259–273. [Google Scholar] [CrossRef]
- Liu, Y.; Liu, X.; Hu, Y.N.; Li, S.; Peng, J.; Wang, Y. Analyzing nonlinear variations in terrestrial vegetation in China during 1982–2012. Environ. Monit. Assess. 2015, 187, 722. [Google Scholar] [CrossRef] [PubMed]
- Du, J.; Zhao, C.; Shu, J.; Jiaerheng, A.; Yuan, X.; Yin, J.; Fang, S.; He, P. Spatiotemporal changes of vegetation on the Tibetan Plateau and relationship to climatic variables during multiyear periods from 1982–2012. Environ. Earth Sci. 2016, 75, 1–18. [Google Scholar] [CrossRef]
- Davis, M.B. Lags in vegetation response to greenhouse warming. Clim. Chang. 1989, 15, 75–82. [Google Scholar] [CrossRef]
- Gessner, U.; Naeimi, V.; Klein, I.; Kuenzer, C.; Klein, D.; Dech, S. The relationship between precipitation anomalies and satellite-derived vegetation activity in Central Asia. Glob. Planet. Chang. 2013, 110, 74–87. [Google Scholar] [CrossRef]
- Saatchi, S.; Asefi-Najafabady, S.; Malhi, Y.; Aragão, L.E.; Anderson, L.O.; Myneni, R.B.; Nemani, R. Persistent effects of a severe drought on Amazonian forest canopy. Proc. Natl. Acad. Sci. USA 2013, 110, 565–570. [Google Scholar] [CrossRef] [PubMed] [Green Version]
- Chen, D.; Huang, H.; Hu, M.; Dahlgren, R.A. Influence of lag effect, soil release, and climate change on watershed anthropogenic nitrogen inputs and riverine export dynamics. Environ. Sci. Technol. 2014, 48, 5683–5690. [Google Scholar] [CrossRef] [Green Version]
- Wu, D.; Zhao, X.; Liang, S.; Zhou, T.; Huang, K.; Tang, B.; Zhao, W. Time-lag effects of global vegetation responses to climate change. Glob. Chang. Biol. 2015, 21, 3520–3531. [Google Scholar] [CrossRef]
- Xie, B.; Jia, X.; Qin, Z.; Shen, J.; Chang, Q. Vegetation dynamics and climate change on the Loess Plateau, China: 1982–2011. Reg. Environ. Chang. 2016, 16, 1583–1594. [Google Scholar] [CrossRef]
- Hawinkel, P.; Swinnen, E.; Lhermitte, S.; Verbist, B.; Van Orshoven, J.; Muys, B. A time series processing tool to extract climate-driven interannual vegetation dynamics using ensemble empirical mode decomposition (EEMD). Remote Sens. Environ. 2015, 169, 375–389. [Google Scholar] [CrossRef] [Green Version]
- Bunting, E.L.; Munson, S.M.; Villarreal, M.L. Climate legacy and lag effects on dryland plant communities in the southwestern US. Ecol. Indic. 2017, 74, 216–229. [Google Scholar] [CrossRef]
Figure 1.
Geographic extent of Inner Mongolia and distribution of meteorological stations.
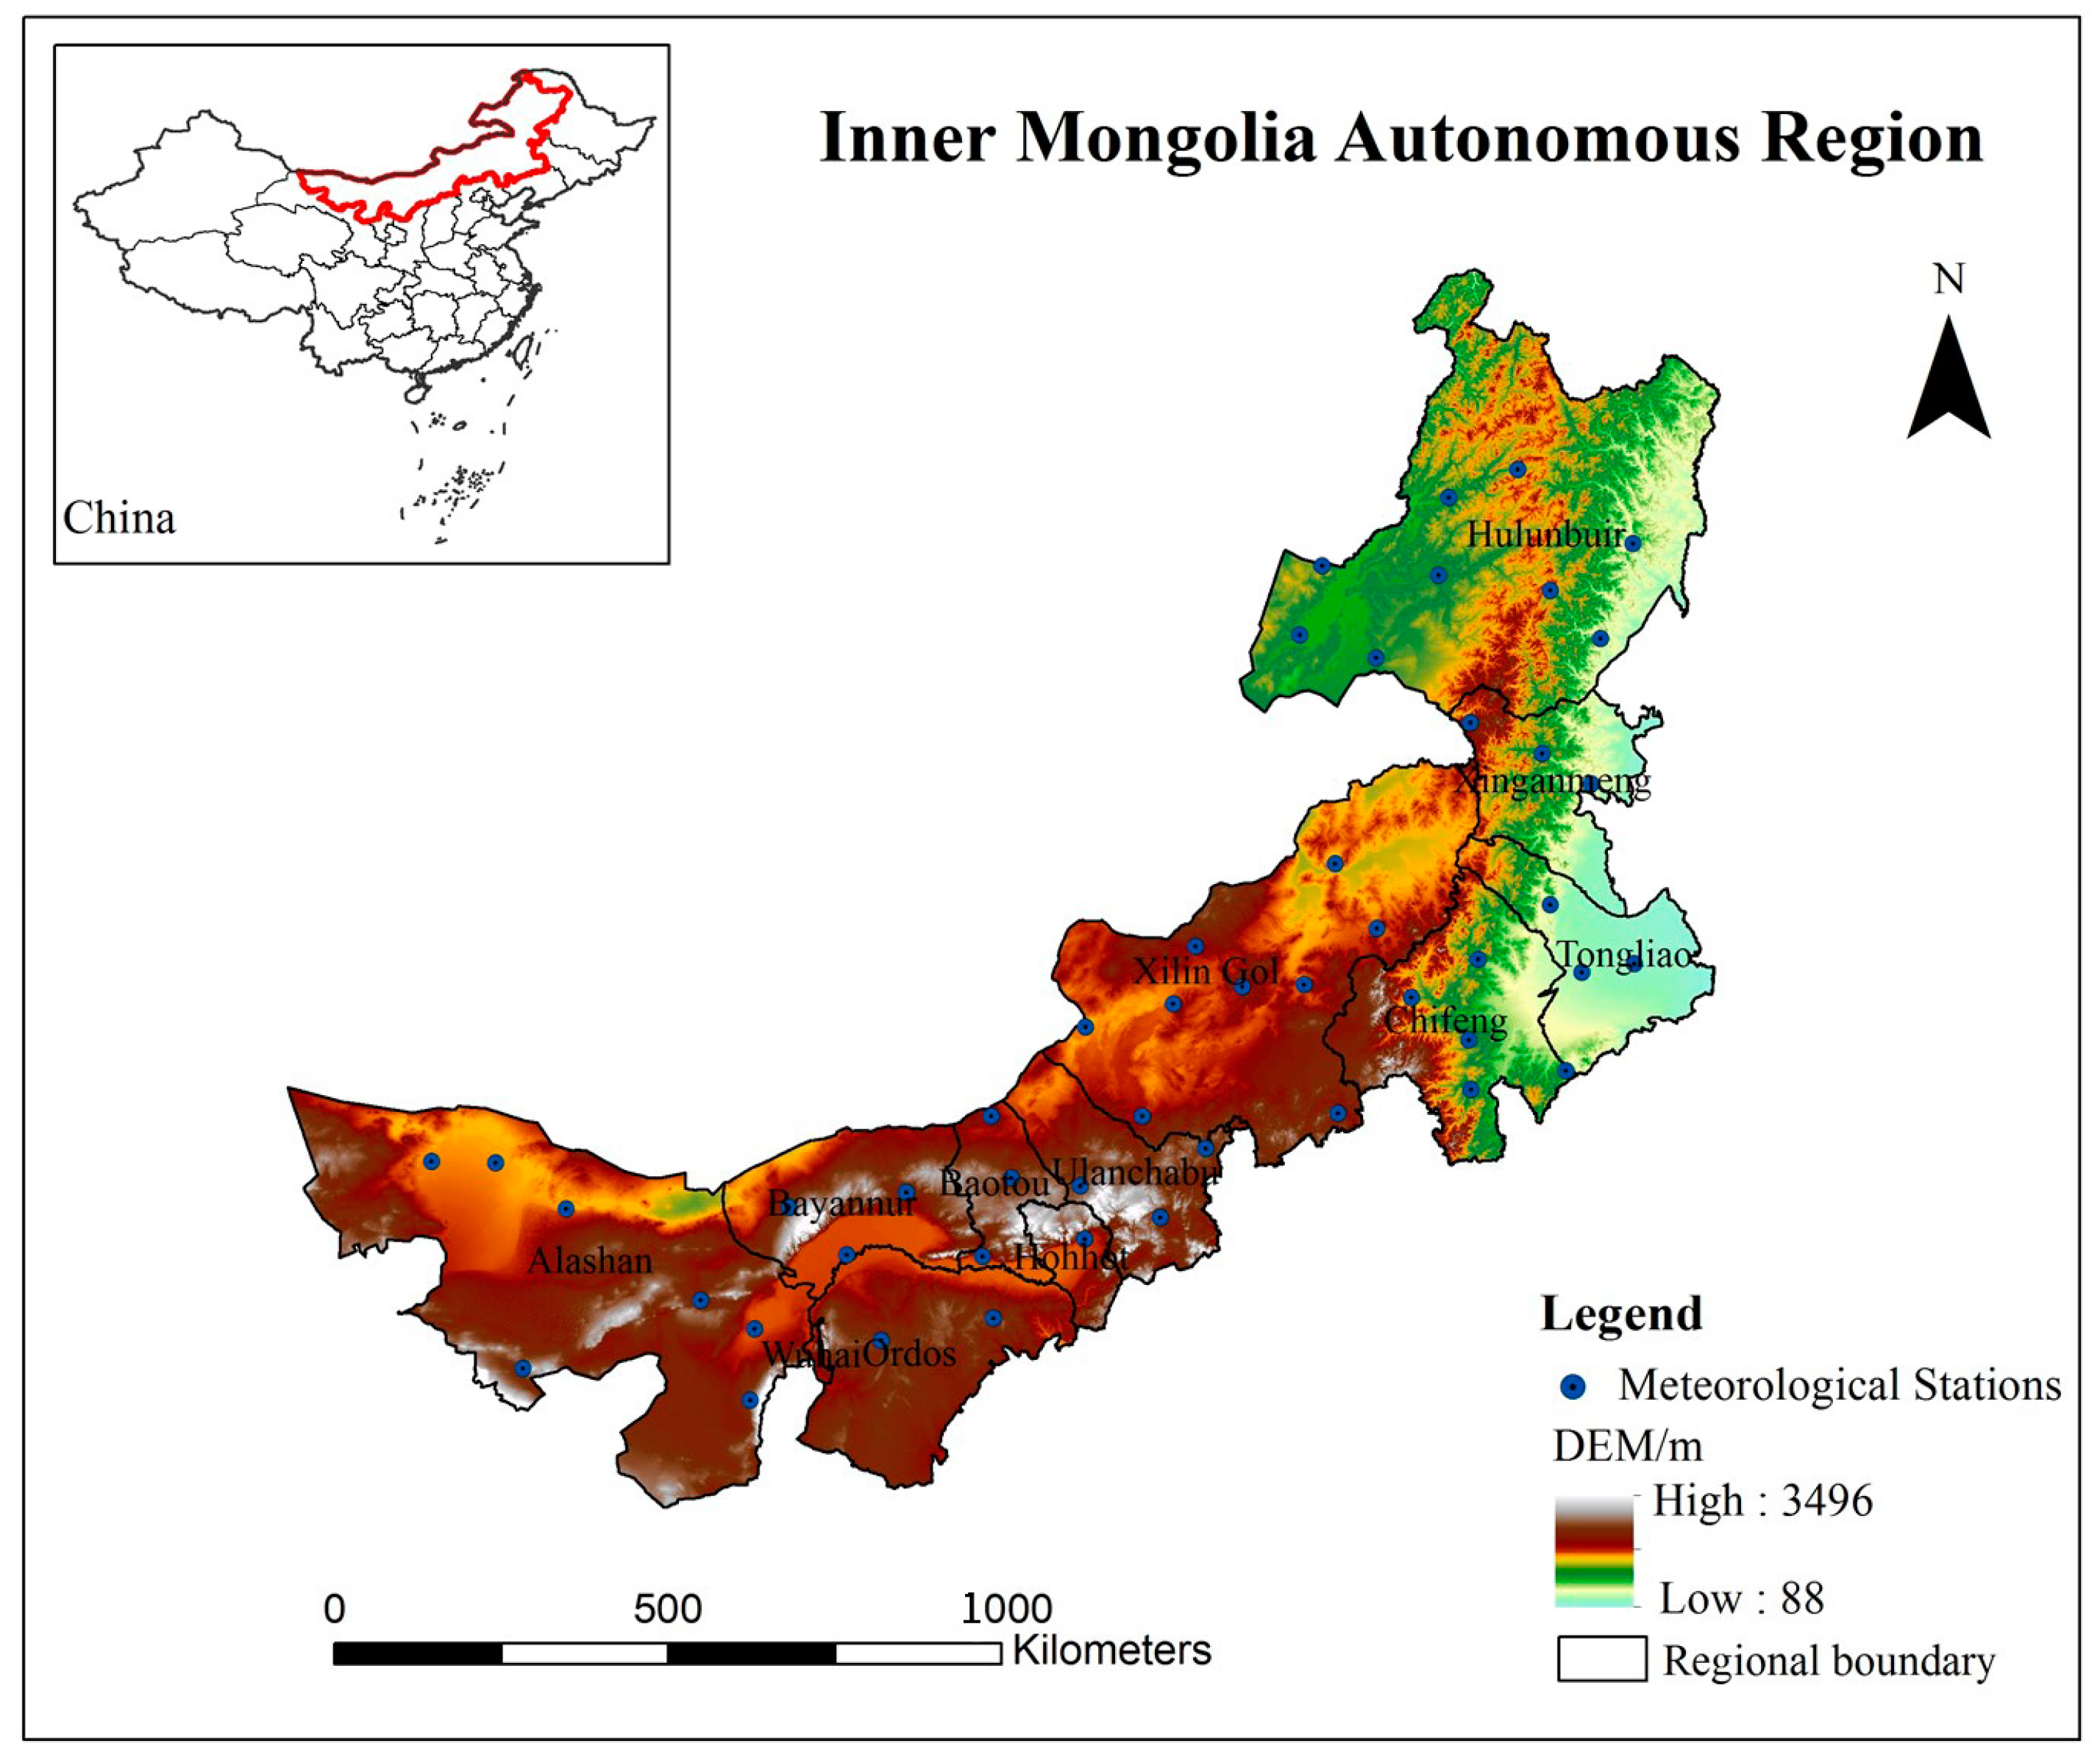
Figure 2.
EMD decomposition (A) and FFT transformation (B) of NDVI time series on the scale of April to October, 1982–2015.
Figure 2.
EMD decomposition (A) and FFT transformation (B) of NDVI time series on the scale of April to October, 1982–2015.

Figure 3.
VMD decomposition (a,c,e,g) and FFT transformation (b,d,f,h) of NDVI time series on the scale of April to October from 1982 to 2015.
Figure 3.
VMD decomposition (a,c,e,g) and FFT transformation (b,d,f,h) of NDVI time series on the scale of April to October from 1982 to 2015.
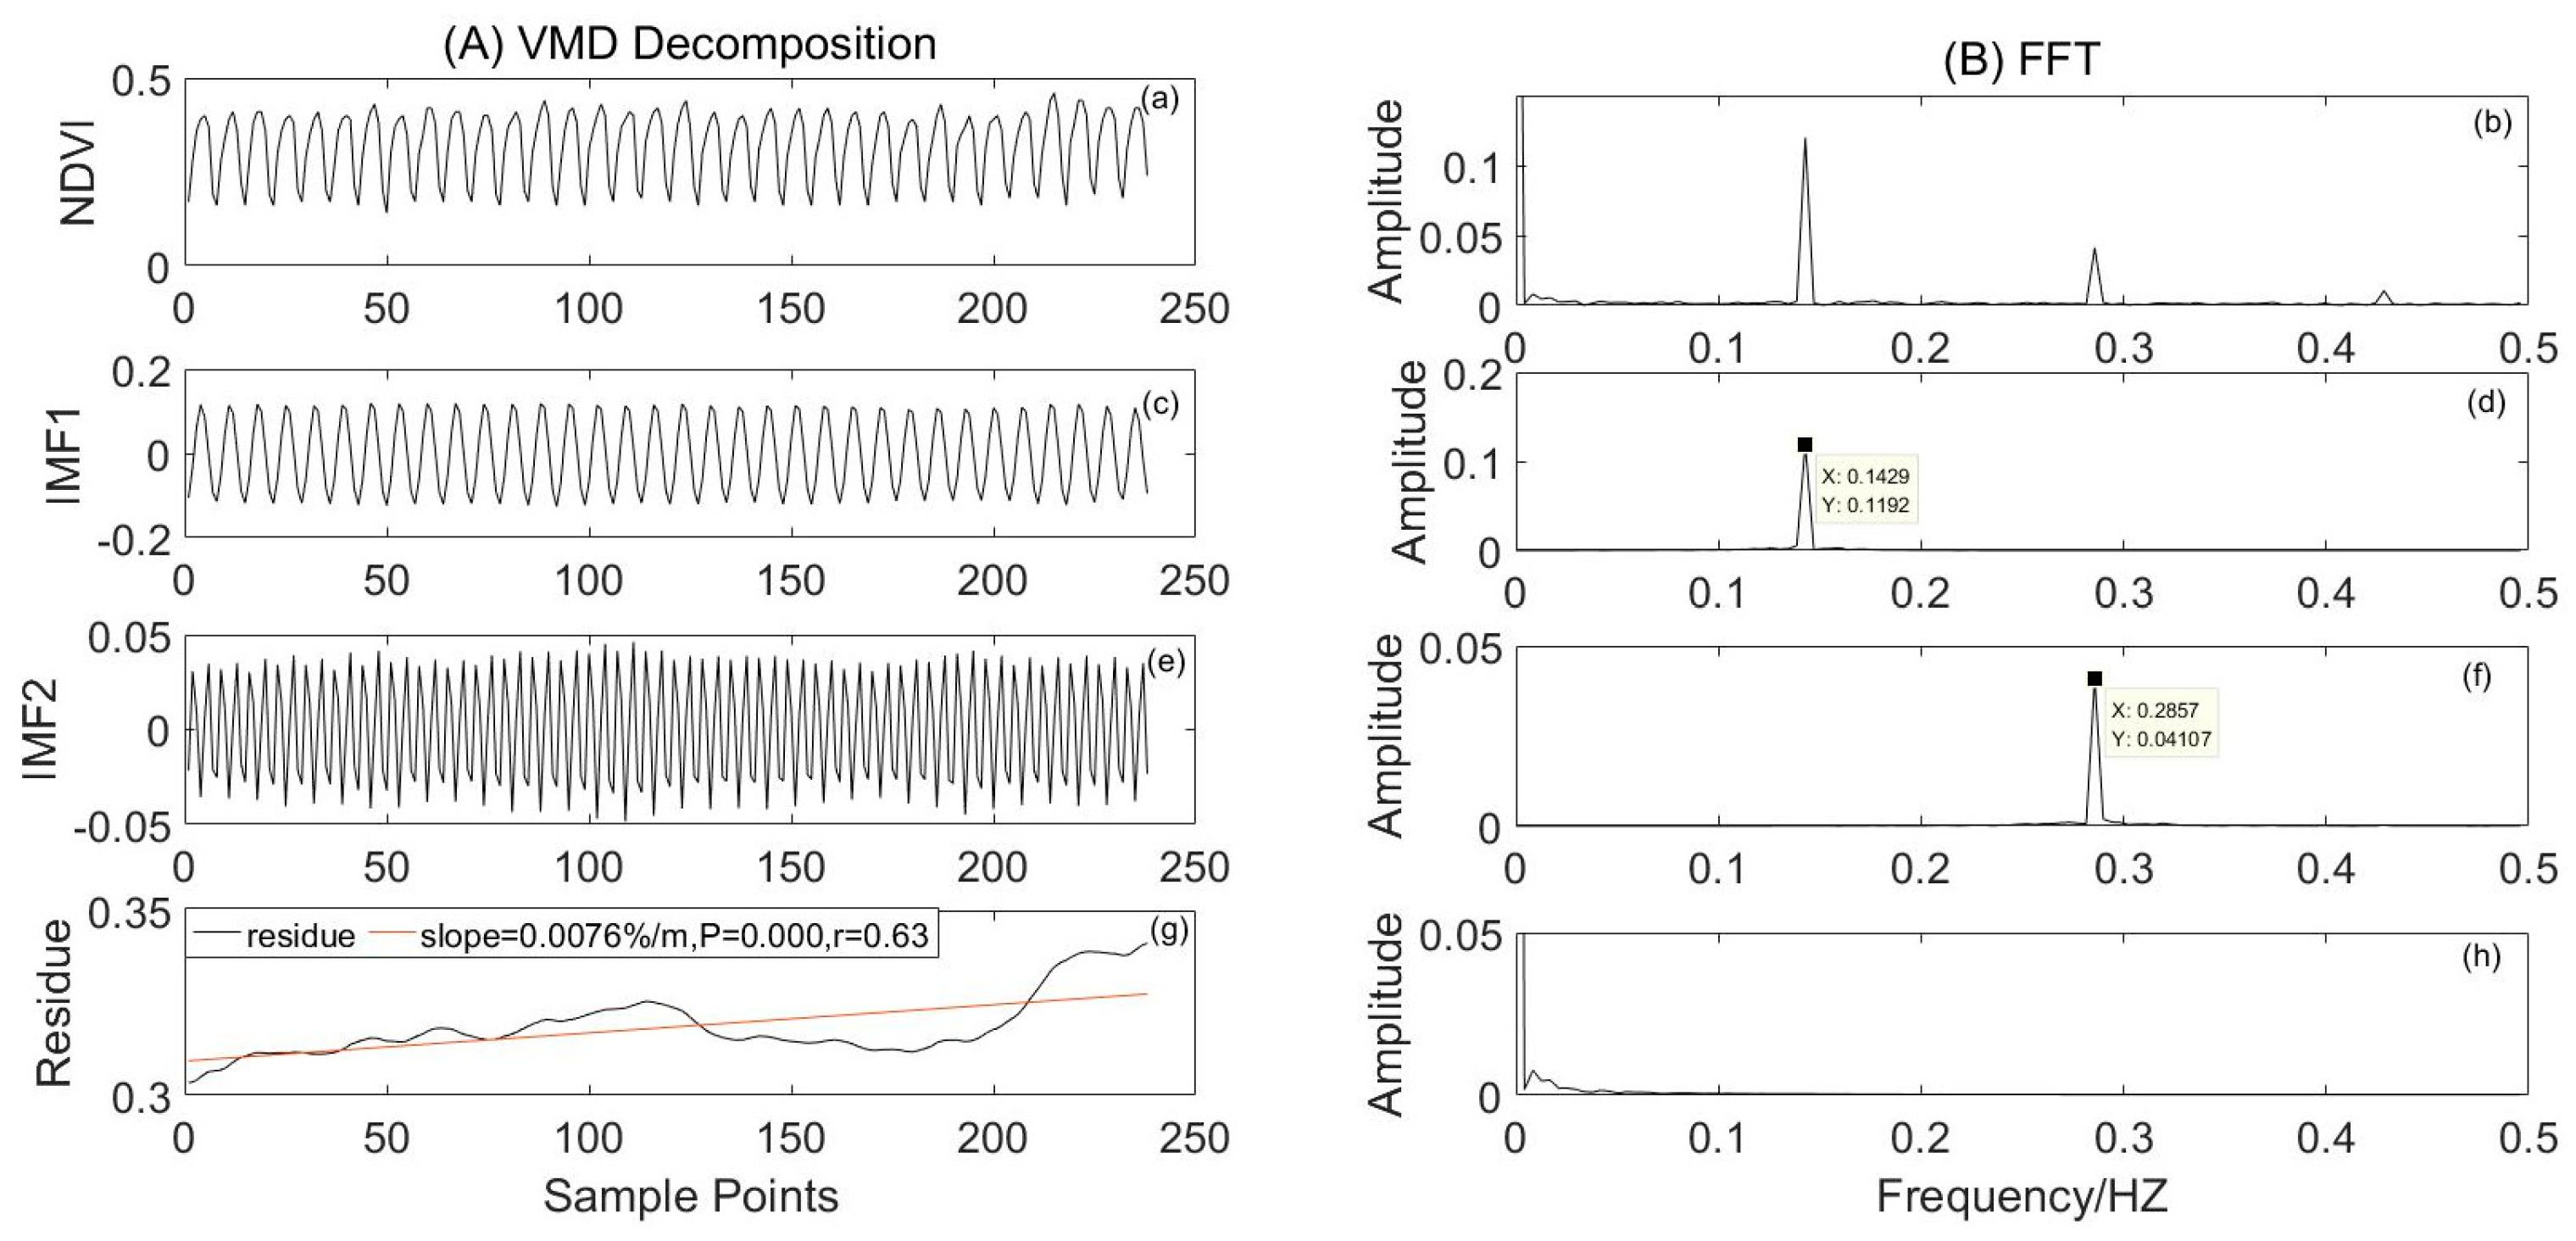
Figure 4.
IMF components and spectrum of precipitation from April to October (a), March to September (b), February to August (c), and January to July (d) from 1982 to 2015.
Figure 4.
IMF components and spectrum of precipitation from April to October (a), March to September (b), February to August (c), and January to July (d) from 1982 to 2015.
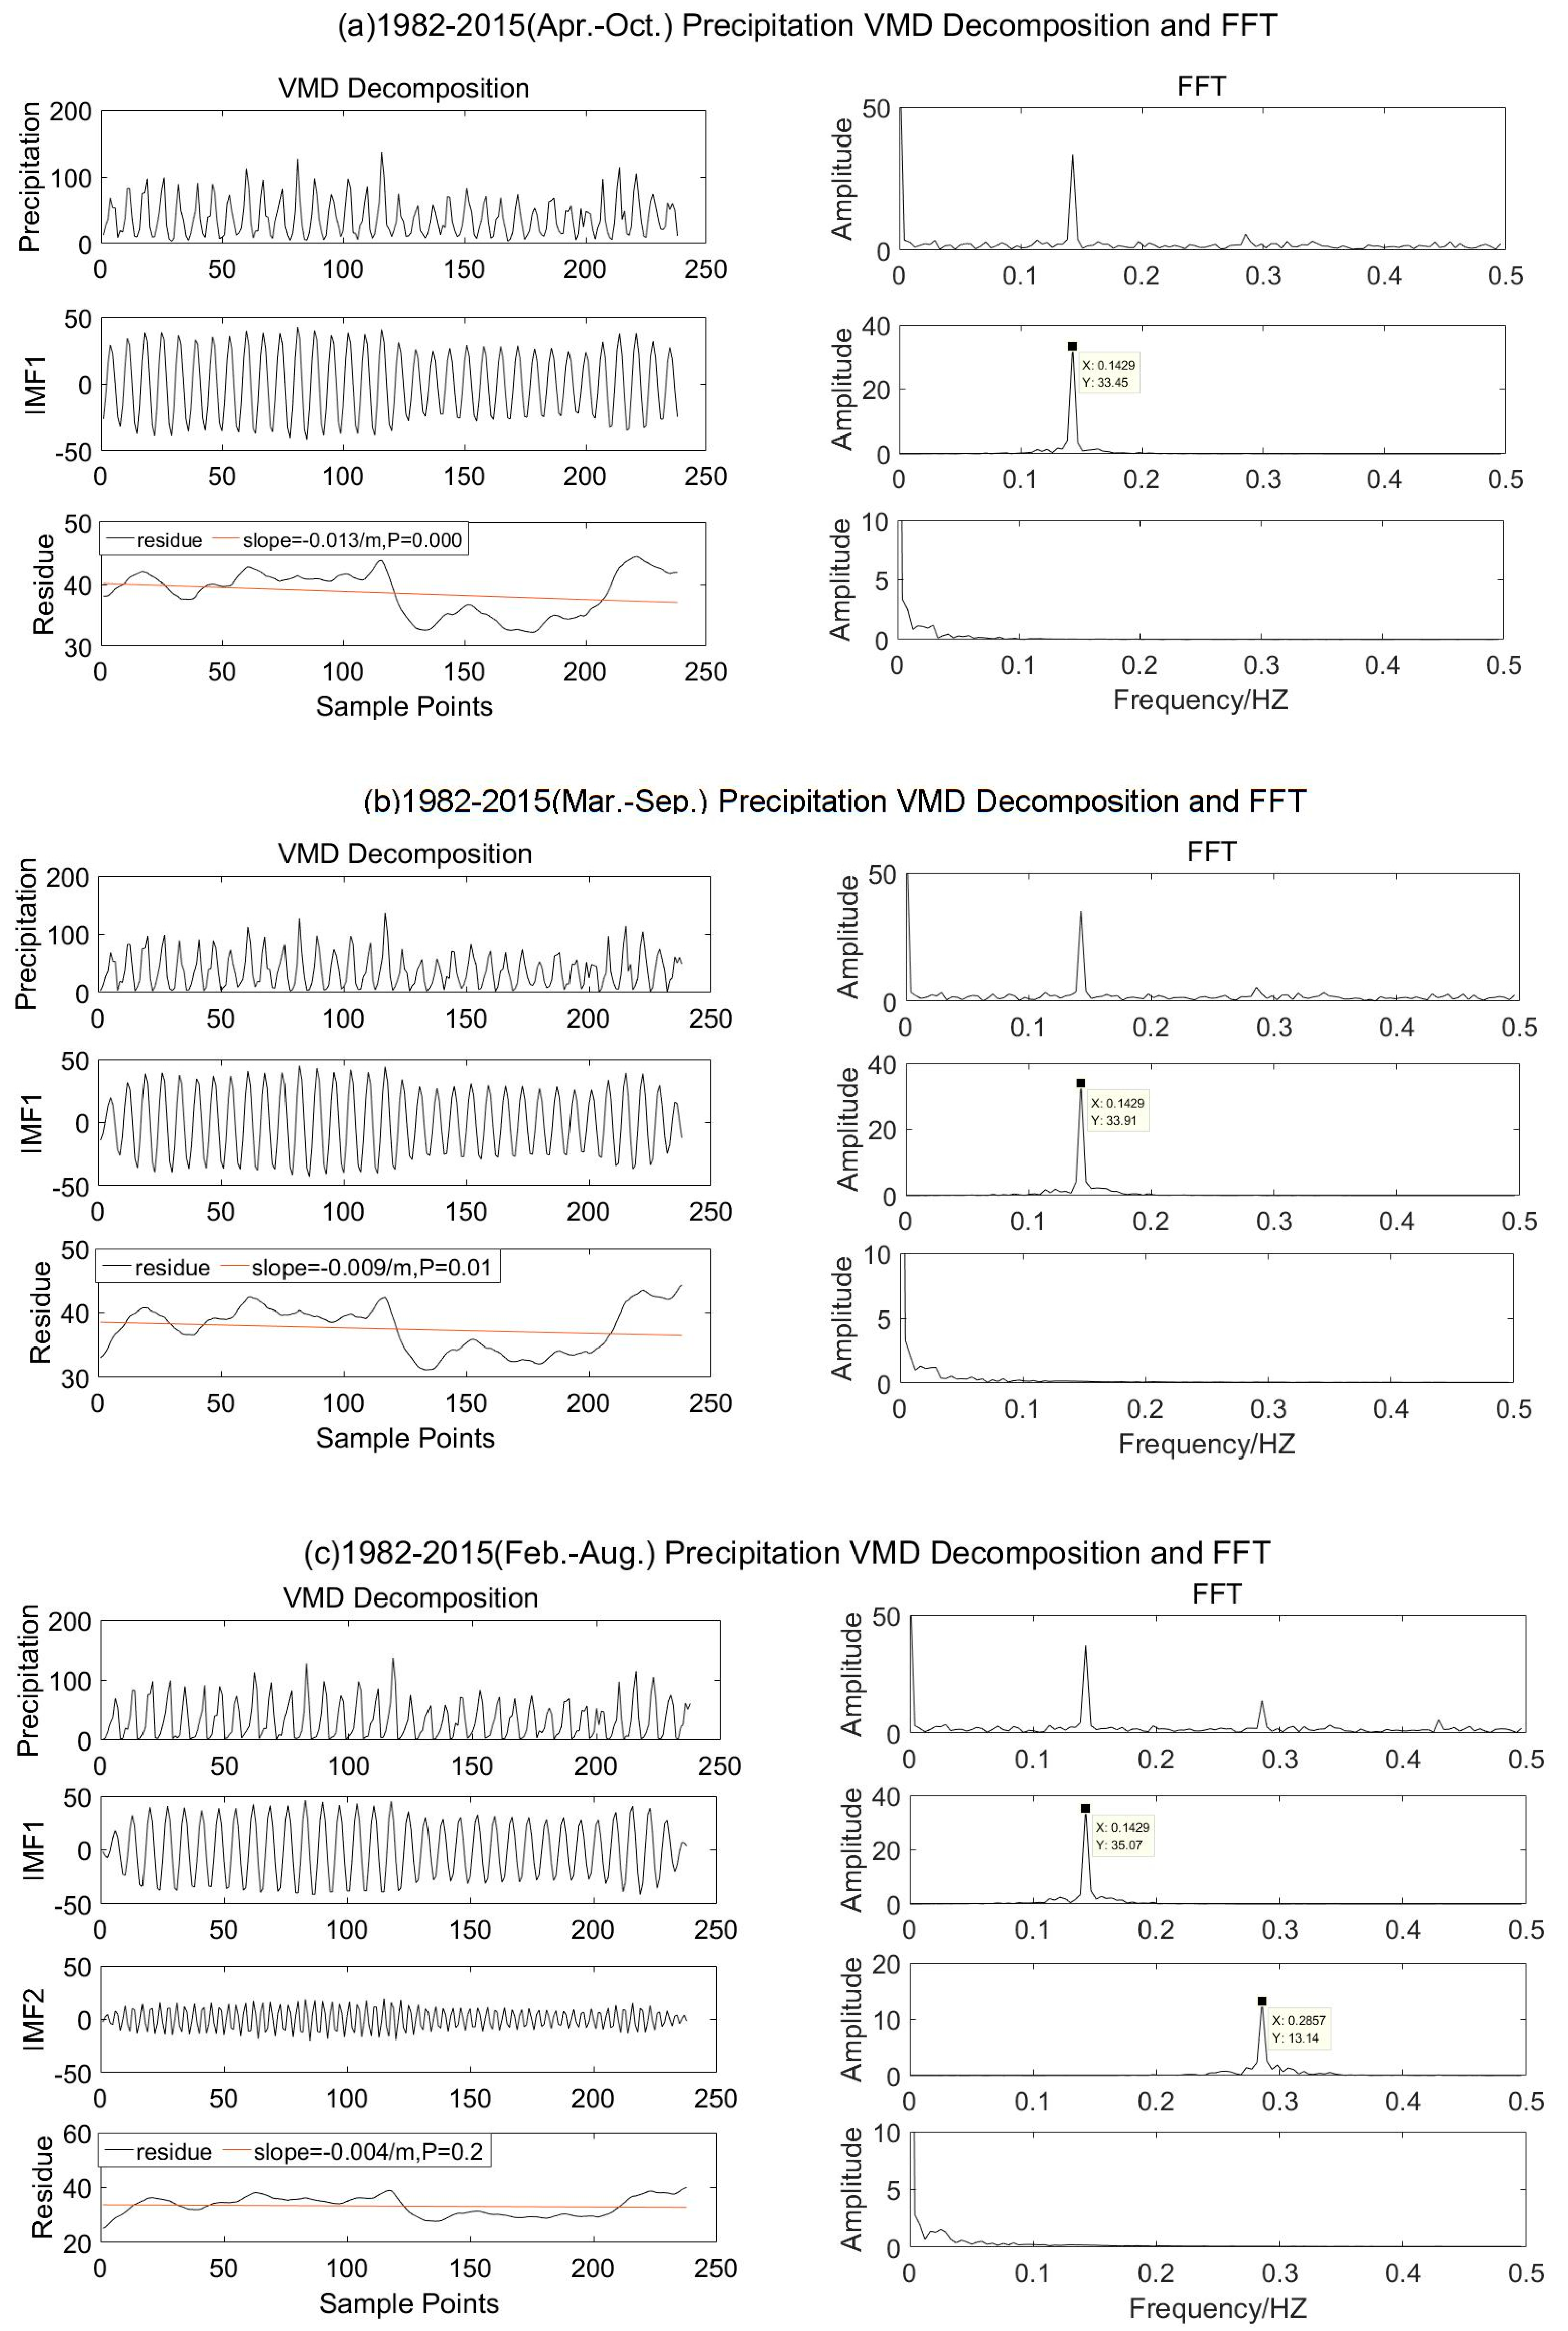
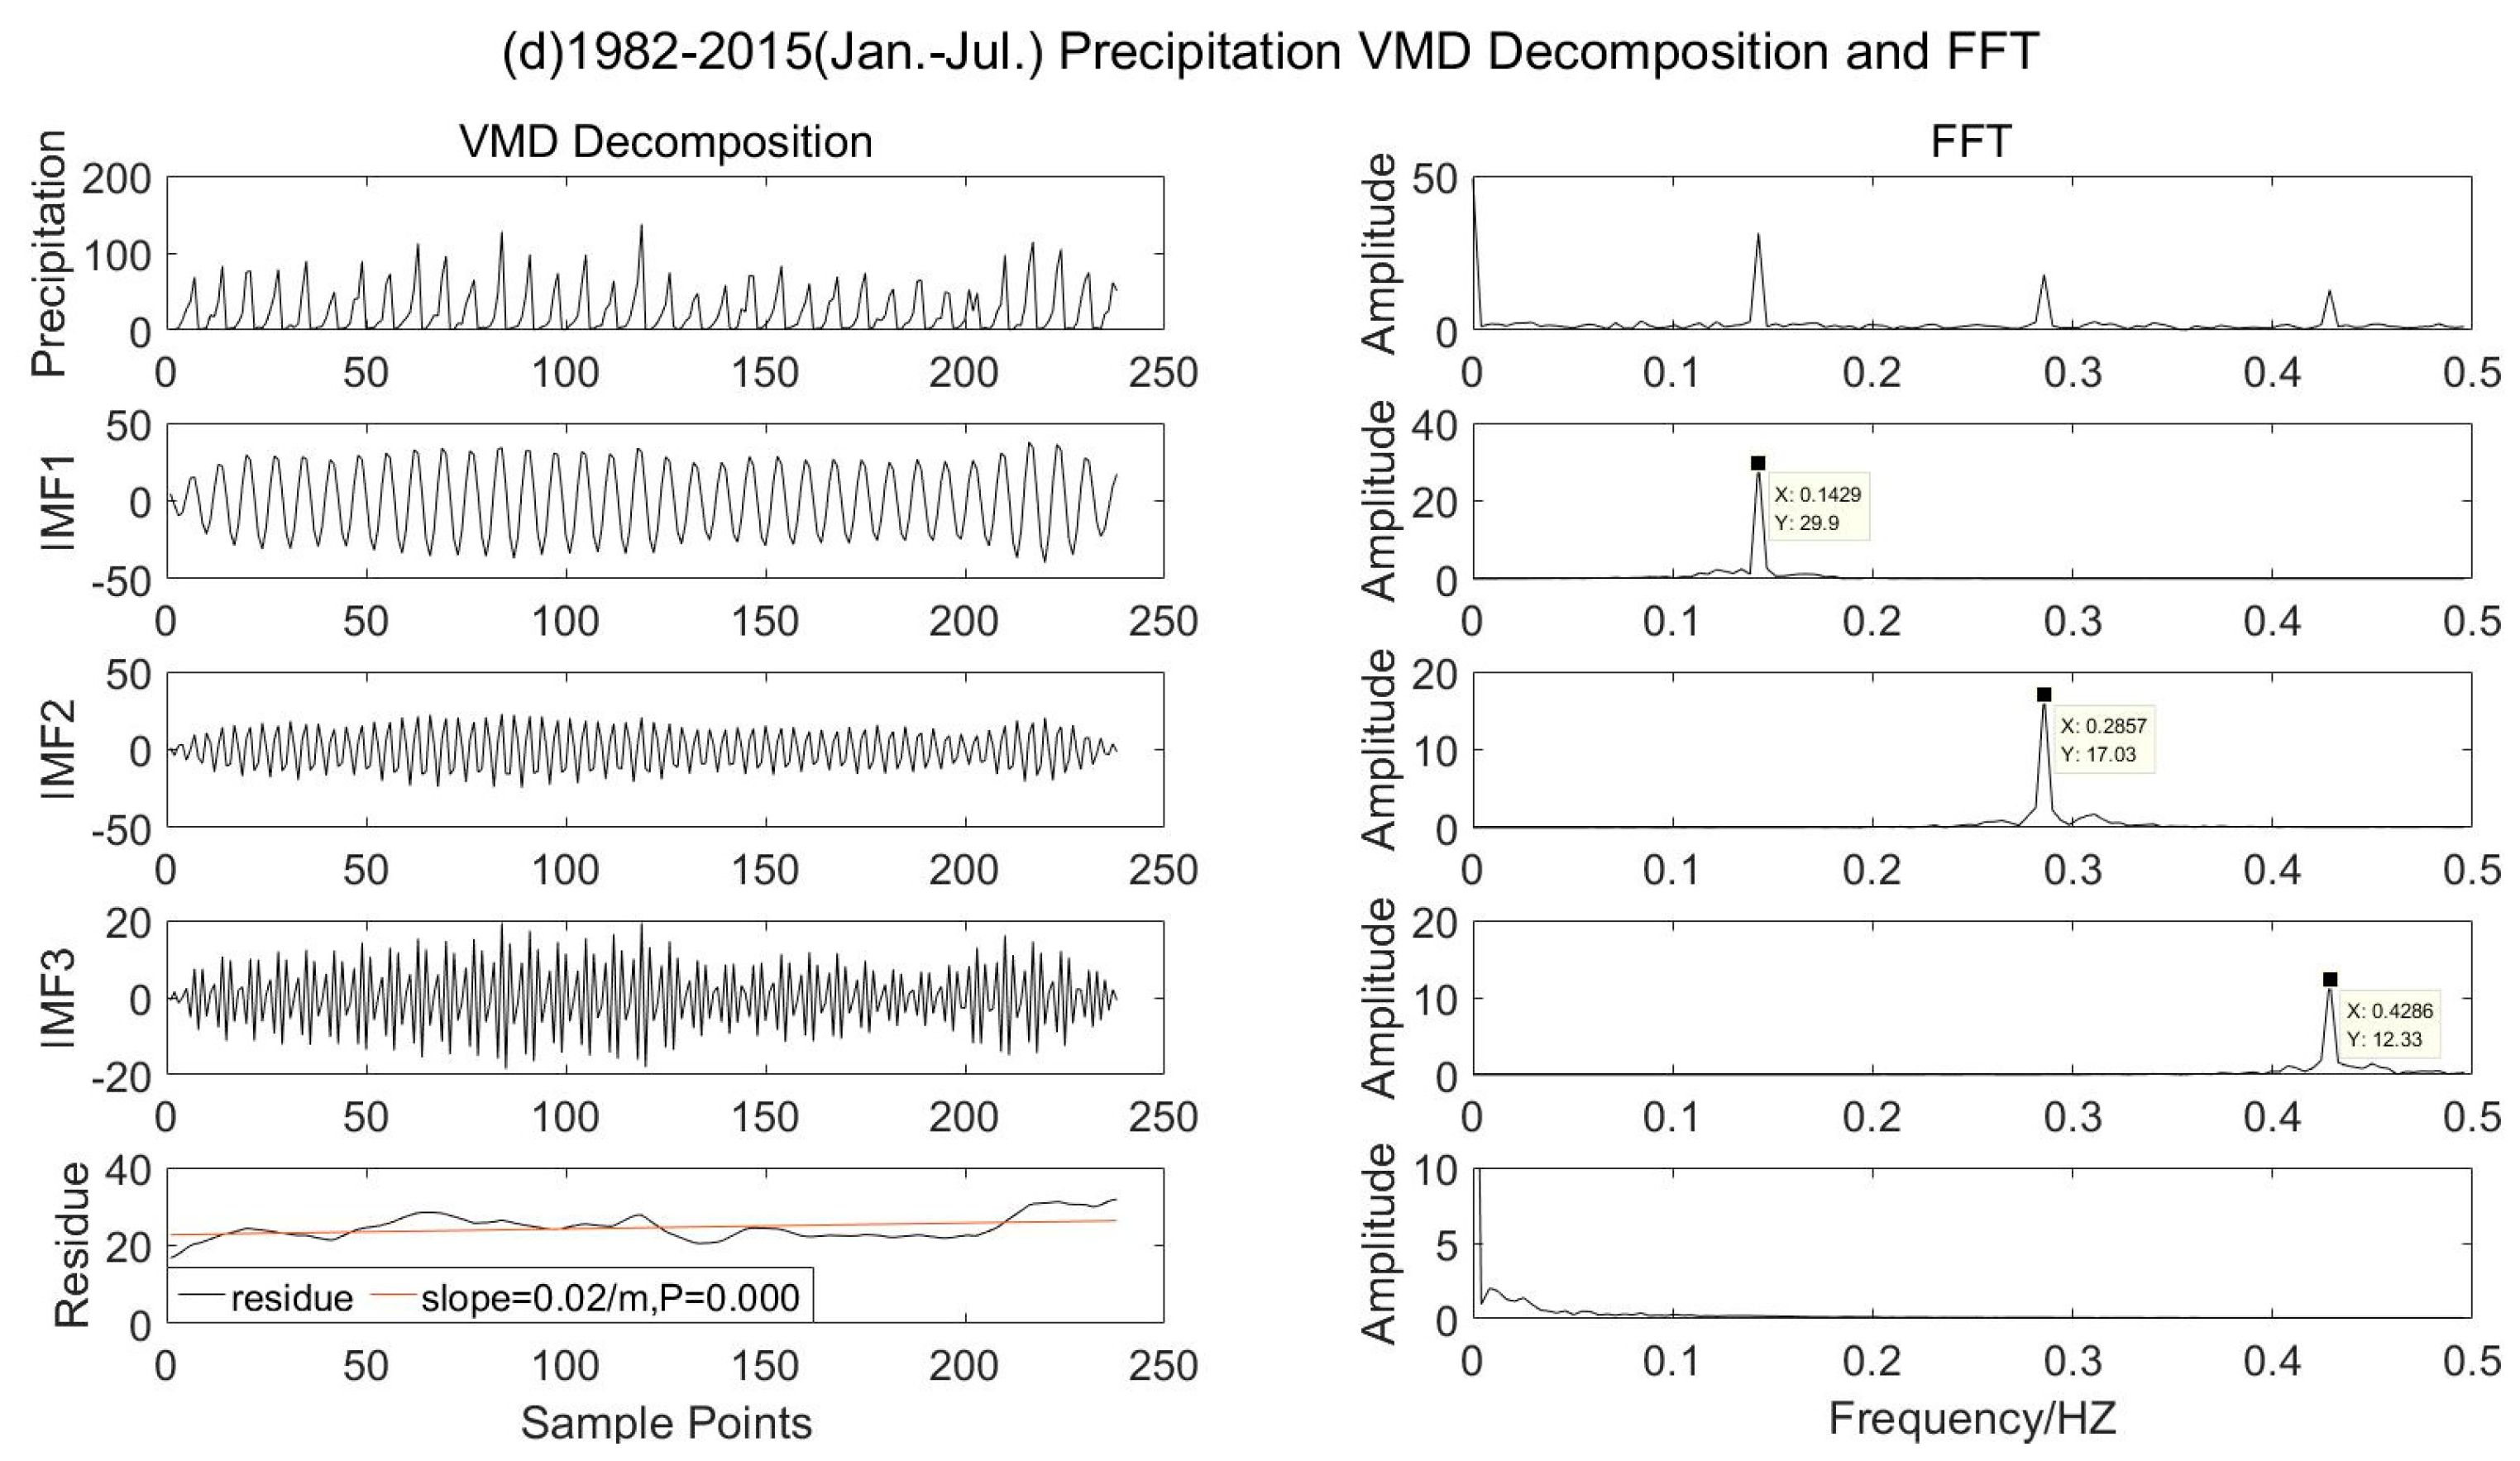
Figure 5.
IMF components and spectrum of temperature from April to October (a), March to September (b), February to August (c), and January to July (d) from 1982 to 2015.
Figure 5.
IMF components and spectrum of temperature from April to October (a), March to September (b), February to August (c), and January to July (d) from 1982 to 2015.

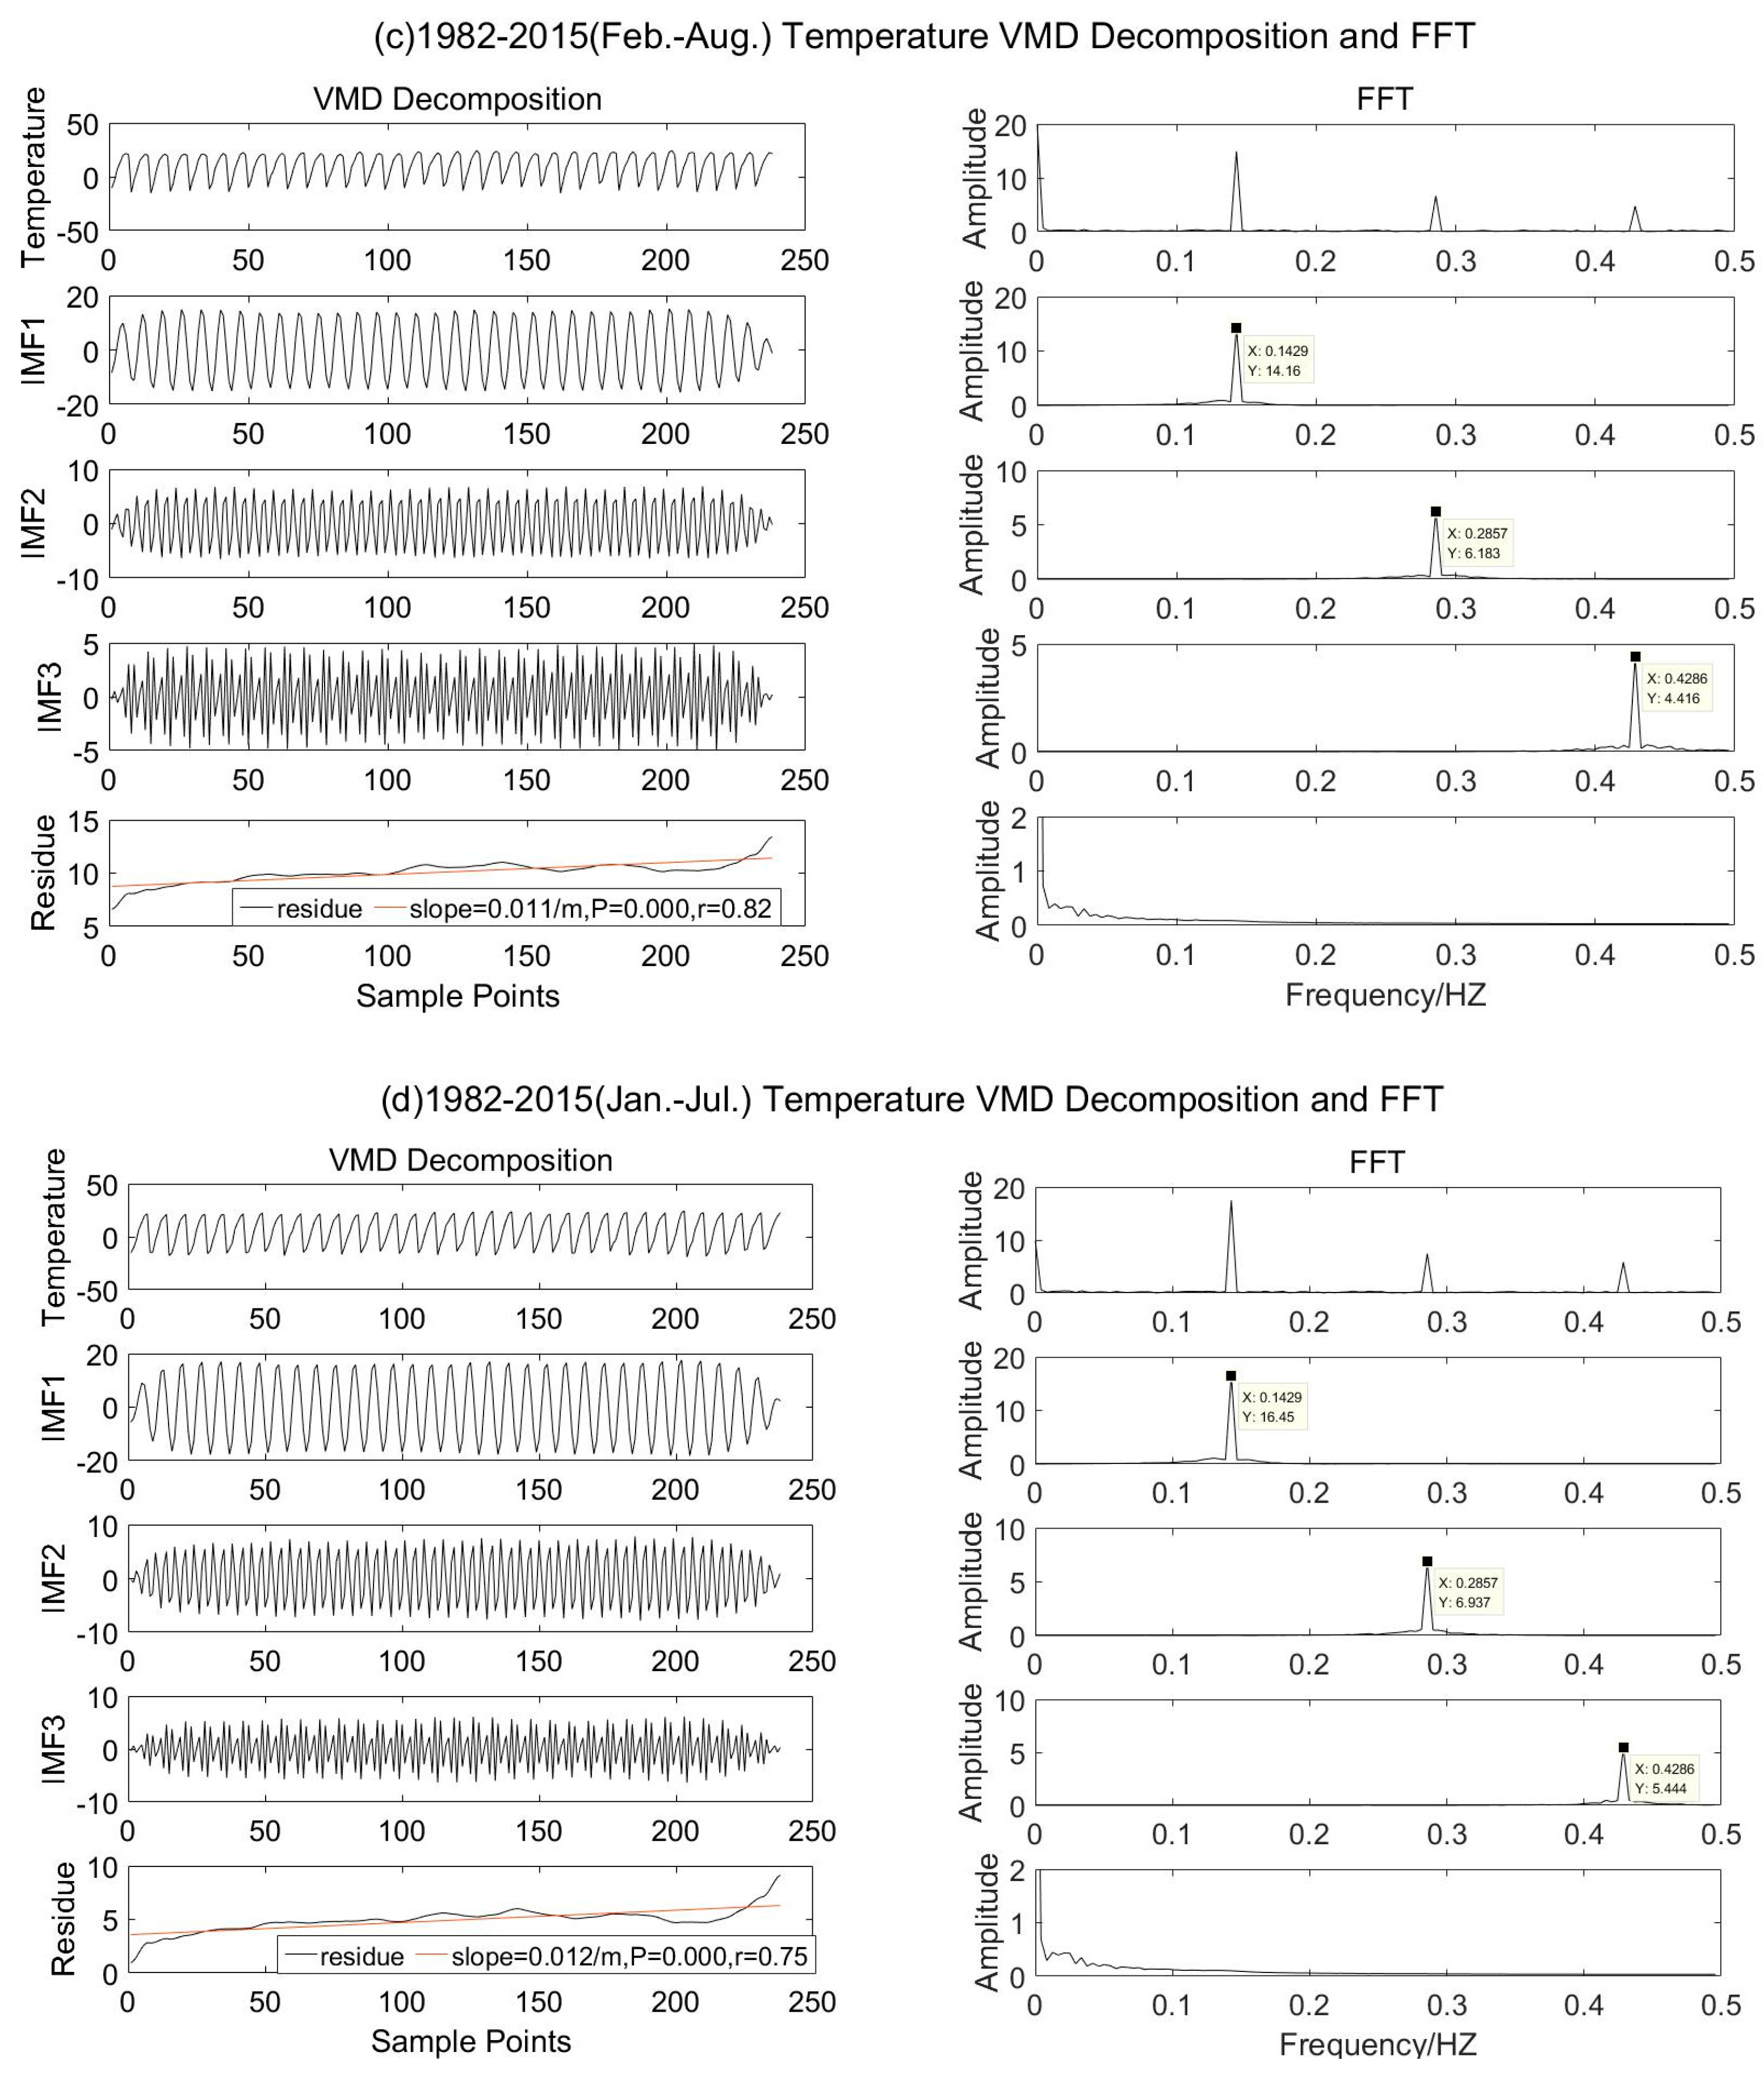
Figure 6.
IMF component and spectrum of NDVI time series in 1982–2015.
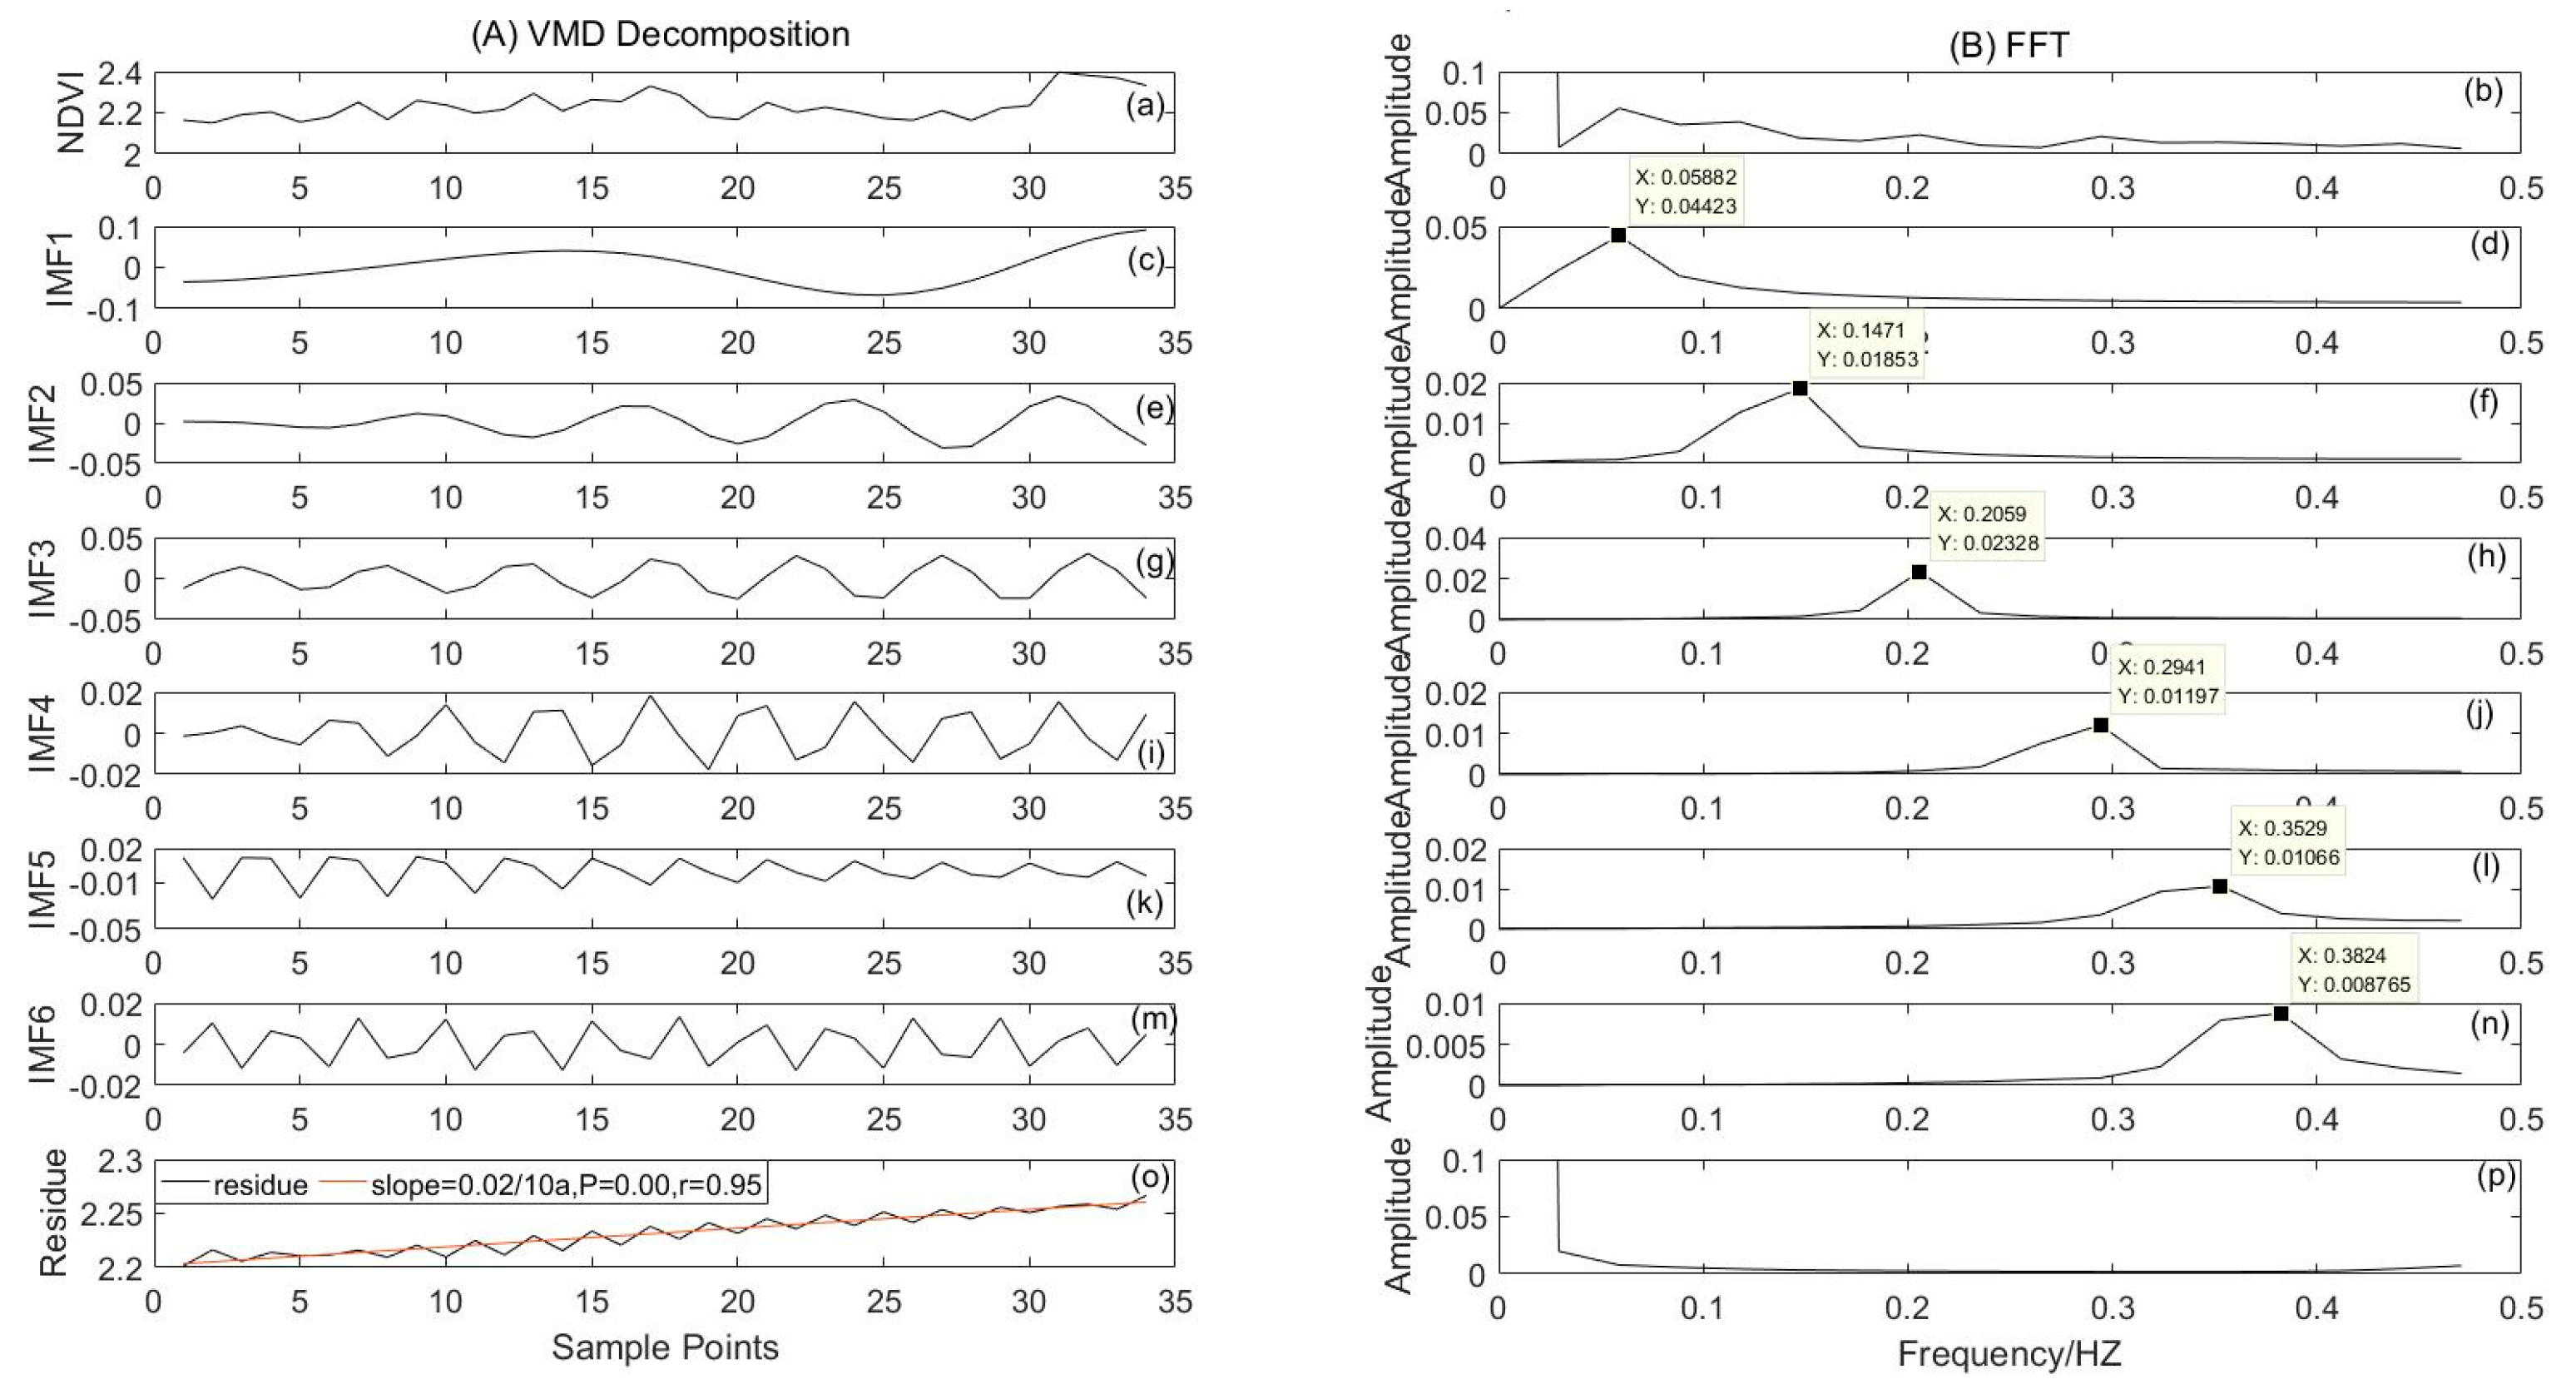
Figure 7.
IMF component diagram and corresponding spectrum diagram of precipitation in 1982–2015 (a), 1981–2014 (b), 1980–2013 (c), and 1979–2012 (d).
Figure 7.
IMF component diagram and corresponding spectrum diagram of precipitation in 1982–2015 (a), 1981–2014 (b), 1980–2013 (c), and 1979–2012 (d).
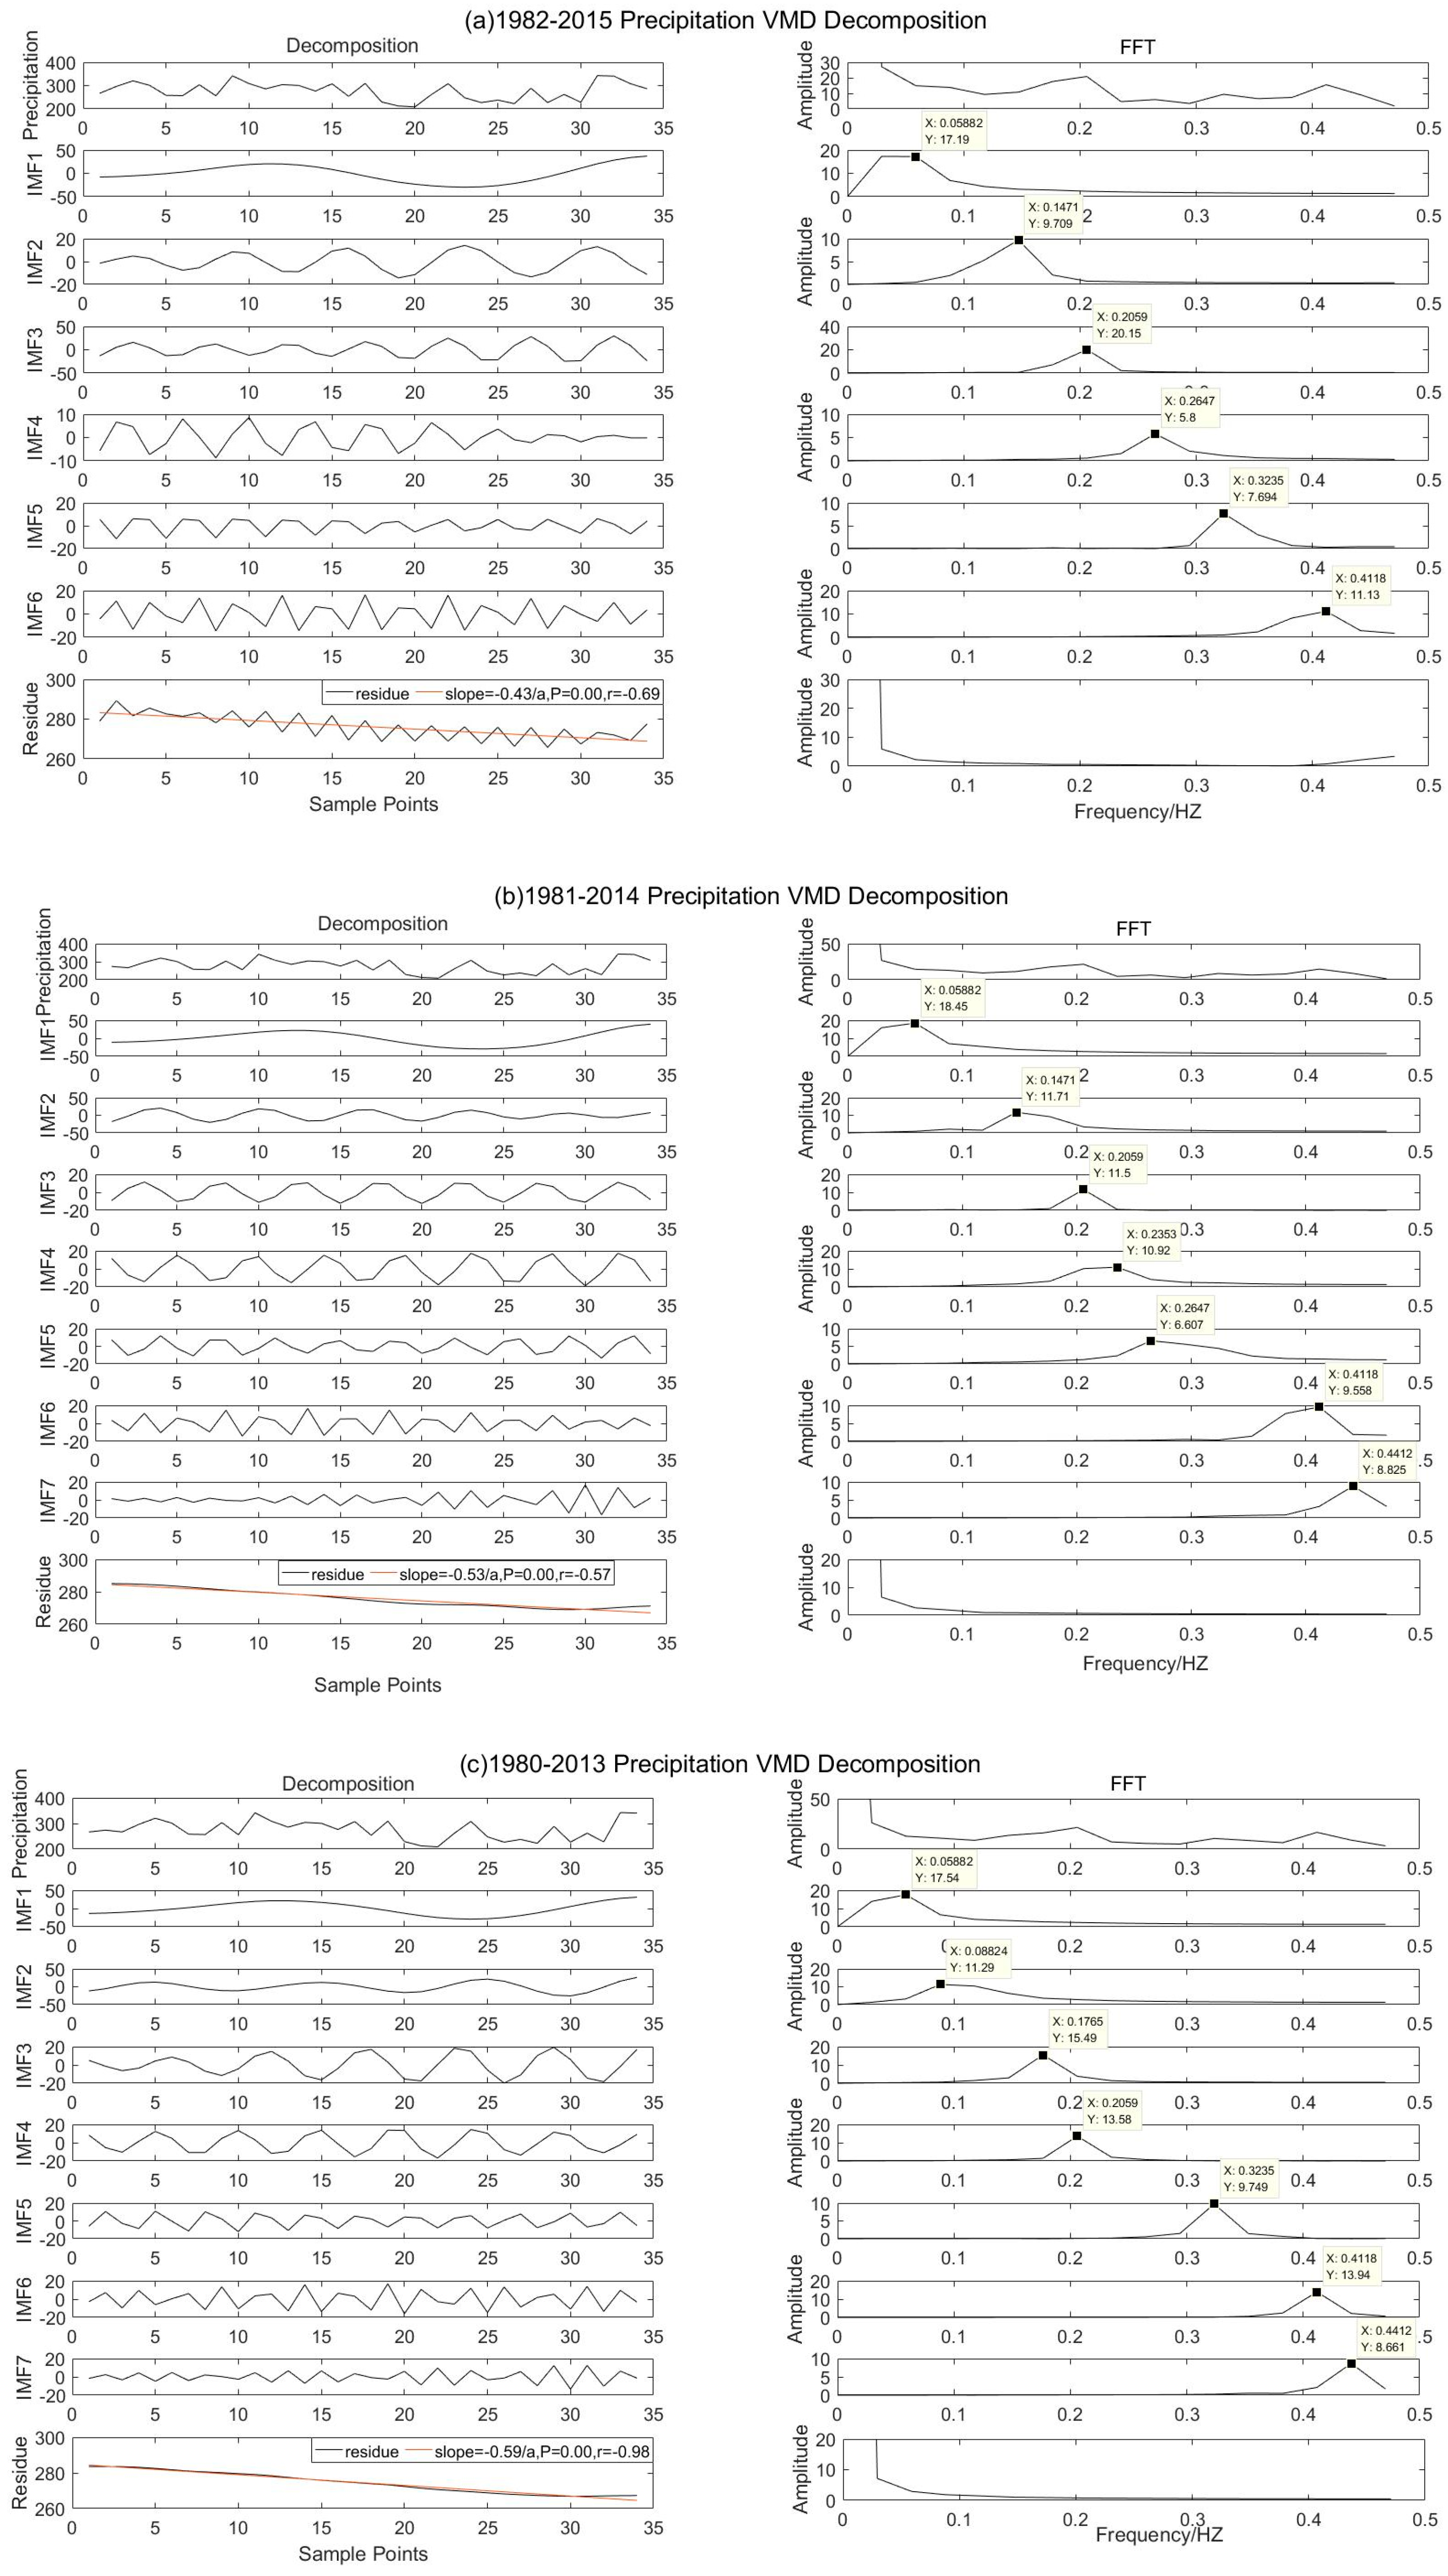

Figure 8.
IMF component and spectrum of temperature in 1982–2015 (a), 1981–2014 (b), 1980–2013 (c), and 1979–2012 (d).
Figure 8.
IMF component and spectrum of temperature in 1982–2015 (a), 1981–2014 (b), 1980–2013 (c), and 1979–2012 (d).
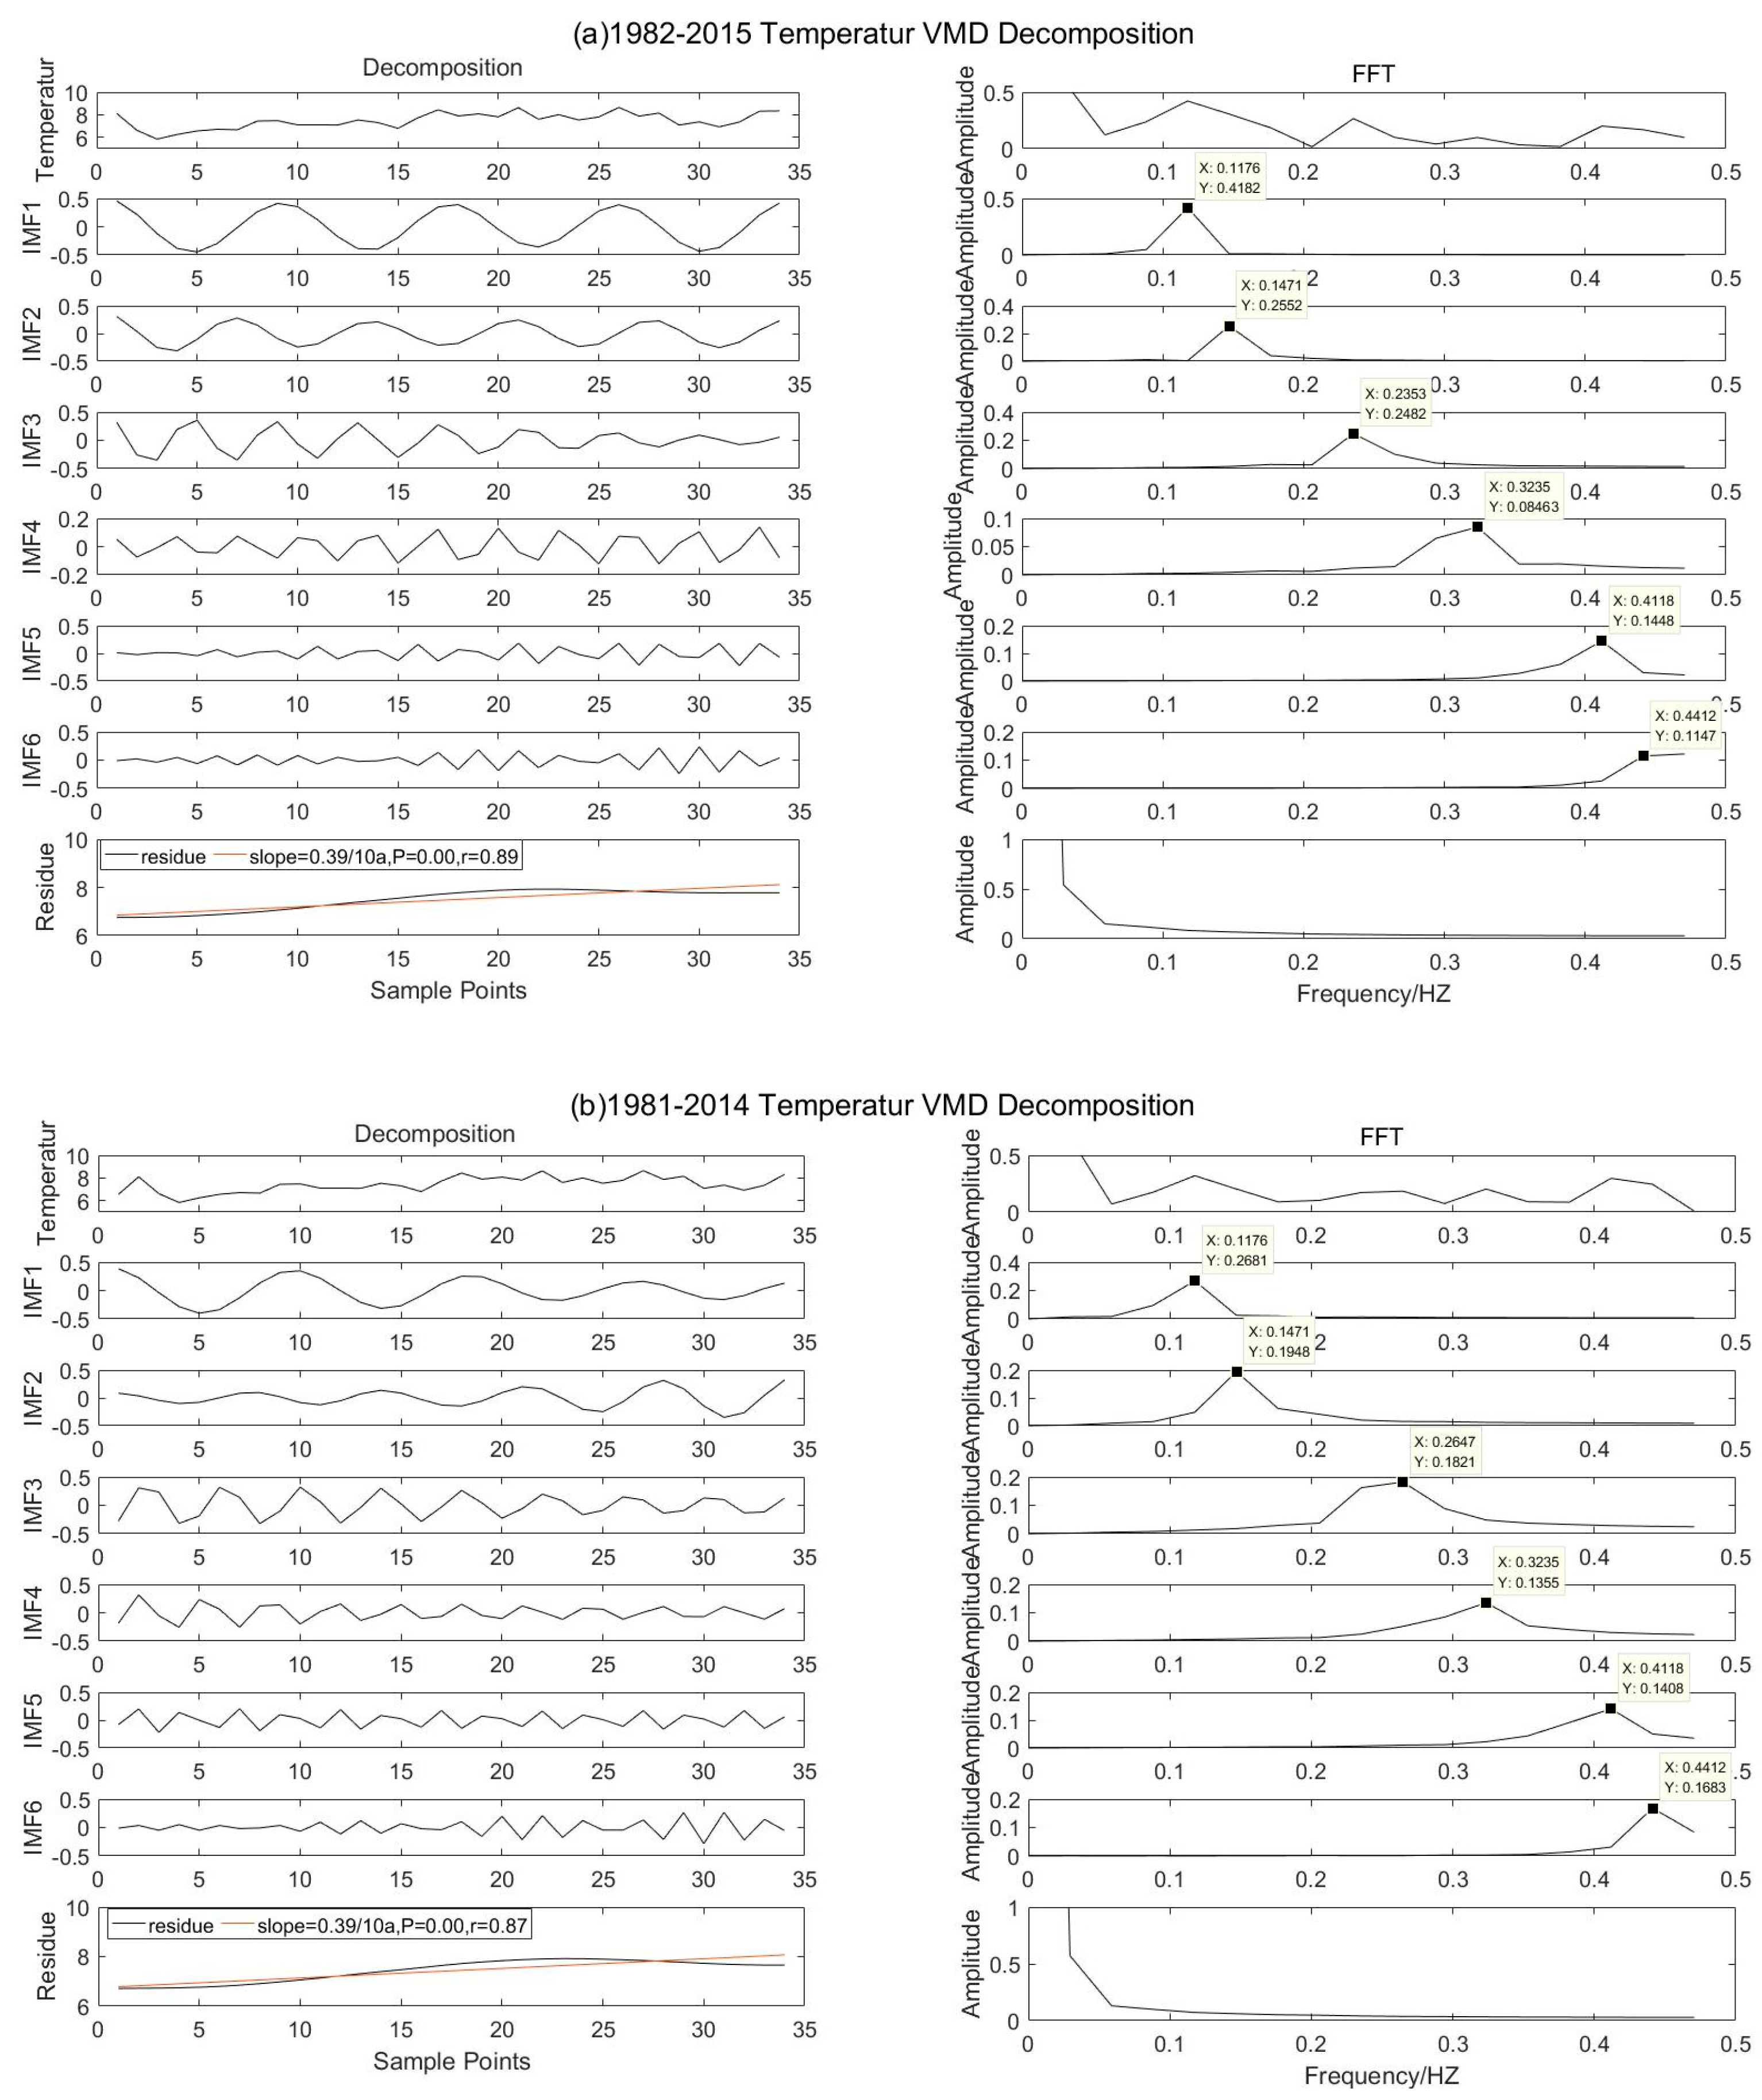

Figure 9.
Correlation coefficients between NDVI with growing season vegetation and average temperature and cumulative precipitation of Inner Mongolia in 1982–2015.
Figure 9.
Correlation coefficients between NDVI with growing season vegetation and average temperature and cumulative precipitation of Inner Mongolia in 1982–2015.

Figure 10.
The spatial distribution of NDVI in Inner Mongolia from April to October 2000.

Table 1.
Statistical values of monthly scale time series FFT transformation from 1982 to 2015.
| Month | Factor | Component | Average Amplitude | Center Frequency/HZ | Average Period (Months) |
|---|---|---|---|---|---|
| 4–10 | NDVI | IMF1 | 0.12 | 0.143 | 6.99 |
| IMF2 | 0.04 | 0.286 | 3.49 | ||
| temperature | IMF1 | 8.56 | 0.143 | 6.99 | |
| IMF2 | 1.46 | 0.286 | 3.49 | ||
| precipitation | IMF1 | 33.45 | 0.143 | 6.99 | |
| 3–9 | temperature | IMF1 | 10.51 | 0.143 | 6.99 |
| IMF2 | 3.56 | 0.286 | 3.49 | ||
| IMF3 | 2.56 | 0.429 | 2.33 | ||
| precipitation | IMF1 | 33.91 | 0.143 | 6.99 | |
| 2–8 | temperature | IMF1 | 14.16 | 0.143 | 6.99 |
| IMF2 | 6.18 | 0.286 | 3.49 | ||
| IMF3 | 4.42 | 0.429 | 2.33 | ||
| precipitation | IMF1 | 35.07 | 0.143 | 6.99 | |
| IMF2 | 13.14 | 0.286 | 3.49 | ||
| 1–7 | temperature | IMF1 | 16.45 | 0.143 | 6.99 |
| IMF2 | 6.94 | 0.286 | 3.49 | ||
| IMF3 | 5.44 | 0.429 | 2.33 | ||
| precipitation | IMF1 | 29.9 | 0.143 | 6.99 | |
| IMF2 | 17.03 | 0.286 | 3.49 | ||
| IMF3 | 12.33 | 0.429 | 2.33 |
Table 2.
Statistical values of annual scale time series data after FFT transformation.
| Time | Parameter | Modal Components | Fluctuation | Center Frequency/HZ | Period/a |
|---|---|---|---|---|---|
| 1982–2015 | NDVI | IMF1 | 0.044 | 0.059 | 16.95 |
| IMF2 | 0.019 | 0.147 | 6.8 | ||
| IMF3 | 0.023 | 0.206 | 4.85 | ||
| IMF4 | 0.012 | 0.294 | 3.4 | ||
| IMF5 | 0.011 | 0.353 | 2.83 | ||
| IMF6 | 0.009 | 0.382 | 2.61 | ||
| temperature | IMF1 | 0.418 | 0.118 | 8.47 | |
| IMF2 | 0.255 | 0.147 | 6.8 | ||
| IMF3 | 0.248 | 0.235 | 4.26 | ||
| IMF4 | 0.085 | 0.324 | 3.09 | ||
| IMF5 | 0.145 | 0.412 | 2.43 | ||
| IMF6 | 0.115 | 0.441 | 2.27 | ||
| precipitation | IMF1 | 17.19 | 0.059 | 16.95 | |
| IMF2 | 9.709 | 0.147 | 6.8 | ||
| IMF3 | 20.15 | 0.206 | 4.85 | ||
| IMF4 | 5.8 | 0.265 | 3.77 | ||
| IMF5 | 7.694 | 0.324 | 3.09 | ||
| IMF6 | 11.13 | 0.412 | 2.43 | ||
| 1981–2014 | temperature | IMF1 | 0.268 | 0.118 | 8.47 |
| IMF2 | 0.195 | 0.147 | 6.8 | ||
| IMF3 | 0.182 | 0.265 | 3.77 | ||
| IMF4 | 0.136 | 0.324 | 3.09 | ||
| IMF5 | 0.141 | 0.412 | 2.43 | ||
| IMF6 | 0.168 | 0.441 | 2.27 | ||
| precipitation | IMF1 | 18.45 | 0.059 | 16.95 | |
| IMF2 | 11.71 | 0.147 | 6.8 | ||
| IMF3 | 11.5 | 0.206 | 4.85 | ||
| IMF4 | 10.92 | 0.235 | 4.26 | ||
| IMF5 | 6.607 | 0.265 | 3.77 | ||
| IMF6 | 9.558 | 0.412 | 2.43 | ||
| IMF7 | 8.825 | 0.441 | 2.27 | ||
| 1980–2013 | temperature | IMF1 | 0.194 | 0.118 | 8.47 |
| IMF2 | 0.197 | 0.206 | 4.85 | ||
| IMF3 | 0.288 | 0.235 | 4.26 | ||
| IMF4 | 0.114 | 0.324 | 3.09 | ||
| IMF5 | 0.129 | 0.412 | 2.43 | ||
| IMF6 | 0.191 | 0.441 | 2.27 | ||
| precipitation | IMF1 | 17.54 | 0.059 | 16.95 | |
| IMF2 | 11.29 | 0.088 | 11.36 | ||
| IMF3 | 15.49 | 0.177 | 5.65 | ||
| IMF4 | 13.58 | 0.206 | 4.85 | ||
| IMF5 | 9.749 | 0.324 | 3.09 | ||
| IMF6 | 13.94 | 0.412 | 2.43 | ||
| IMF7 | 8.661 | 0.441 | 2.27 | ||
| 1979–2012 | temperature | IMF1 | 0.339 | 0.118 | 8.47 |
| IMF2 | 0.201 | 0.147 | 6.8 | ||
| IMF3 | 0.23 | 0.265 | 3.77 | ||
| IMF4 | 0.131 | 0.324 | 3.09 | ||
| IMF5 | 0.164 | 0.412 | 2.43 | ||
| IMF6 | 0.167 | 0.441 | 2.27 | ||
| precipitation | IMF1 | 13.6 | 0.059 | 16.95 | |
| IMF2 | 8.611 | 0.118 | 6.8 | ||
| IMF3 | 19.88 | 0.206 | 4.85 | ||
| IMF4 | 7.008 | 0.234 | 4.27 | ||
| IMF5 | 8.422 | 0.324 | 3.09 | ||
| IMF6 | 16.57 | 0.412 | 2.43 | ||
| IMF7 | 7.885 | 0.441 | 2.27 |
Disclaimer/Publisher’s Note: The statements, opinions and data contained in all publications are solely those of the individual author(s) and contributor(s) and not of MDPI and/or the editor(s). MDPI and/or the editor(s) disclaim responsibility for any injury to people or property resulting from any ideas, methods, instructions or products referred to in the content. |
© 2023 by the authors. Licensee MDPI, Basel, Switzerland. This article is an open access article distributed under the terms and conditions of the Creative Commons Attribution (CC BY) license (https://creativecommons.org/licenses/by/4.0/).
Share and Cite
MDPI and ACS Style
Su, D.; Zhang, A.; Tian, Z.; Liu, X.; Hou, Y. Study on NDVI Periodic Change Characteristics of Inner Mongolia Grassland Based on Variational Mode Decomposition Algorithm. Atmosphere 2023, 14, 1039. https://doi.org/10.3390/atmos14061039
AMA Style
Su D, Zhang A, Tian Z, Liu X, Hou Y. Study on NDVI Periodic Change Characteristics of Inner Mongolia Grassland Based on Variational Mode Decomposition Algorithm. Atmosphere. 2023; 14(6):1039. https://doi.org/10.3390/atmos14061039
Chicago/Turabian StyleSu, Deguo, Anbing Zhang, Zhixiu Tian, Xinxia Liu, and Yikai Hou. 2023. "Study on NDVI Periodic Change Characteristics of Inner Mongolia Grassland Based on Variational Mode Decomposition Algorithm" Atmosphere 14, no. 6: 1039. https://doi.org/10.3390/atmos14061039
Note that from the first issue of 2016, this journal uses article numbers instead of page numbers. See further details here.