
Study on An Effective Roadway Watering Scheme for Mitigating Pedestrian Thermal Comfort According to the Street Configuration


1
Department of Architecture, Graduate School of Engineering, Kobe University, Kobe 657-8501, Japan
2
Technical Management Division, Construction Bureau, Kobe 650-8570, Japan
*
Author to whom correspondence should be addressed.
Atmosphere 2023, 14(6), 1014; https://doi.org/10.3390/atmos14061014
Submission received: 5 April 2023
/
Revised: 8 June 2023
/
Accepted: 9 June 2023
/
Published: 12 June 2023
(This article belongs to the Special Issue Research on Building Coating for Urban Heat Island Mitigation)
Abstract
:Continuous measurement of road surface temperature using an infrared camera throughout the summer season was conducted to clarify the duration of surface temperature decrease due to roadway watering according to weather conditions and watering time. Watering during sunny daytime conditions resulted in a maximum reduction in surface temperature of about 10 °C and an average reduction of about 6 °C. The duration of the surface temperature decrease was short (less than 30 min) for sunny days and long (more than 30 min) for cloudy days. On sunny days, if the evaporation rate was faster and the surface temperature decrease was larger, then the duration of the evaporation was shorter. Effective roadway watering plans were investigated according to the street configurations by simulating the thermal environment considering the solar radiation shielding condition of pedestrians on sidewalks. Simulation results in the downtown area of Kobe city indicated that watering the nearby roadways resulted in only 20% and 39% comfort for the northern sidewalks on the east–west road at 10:00 and 16:00, but about 70% comfort for the southern sidewalks and 60–90% comfort for the eastern and western sidewalks. Guiding pedestrians to a shaded sidewalk and then watering the nearby roadway to lower the surface temperature in the sun improves the thermal environment for pedestrians.
1. Introduction
Kobe City, Japan has been promoting various measures to promote activities in outdoor spaces of the city center and to avoid the extreme heat during the hot summer season [1,2]. For example, highly reflective pavement and water-retentive pavement have been considered as measures for roadways [3,4]. Based on discussions between Kobe City engineers and experts, including the authors, watering on roadways was selected as a measure to mitigate extreme heat. The discussion was as follows: The introduction of highly reflective or water-retentive pavement in a certain urban area requires a larger budget and may be implemented over a period of several years. Furthermore, high reflectance is not acceptable on roadways from a visual quality perspective, and reflectance may decrease over time due to vehicle travel. Continuous water supply is necessary to ensure a stable evaporative cooling effect in water-retentive pavements. Although continuous water supply technologies are available on the market [5], they require a substantial cost and management effort. In contrast, watering on roadways is controllable according to citizen need and budget and allows for continuous improvement in the location and timing of watering. Two vehicles with water tanks sprinkled 32 tons of water on 25.8 ha of downtown streets every day except rainy days in the summer of 2020. By watering on the roadway when the surface temperature was above 40 °C, the maximum reduction in surface temperature was about 10 °C. However, the reduction in MRT (mean radiant temperature) and SET* (standard new effective temperature) at the center of the sidewalk 3.75 m away from the water surface was about 0.2 °C and 0.1 °C, respectively [1]. Quantitative evaluation of the improvement in thermal environment for pedestrians on sidewalks by watering the roadways is still insufficient. In order to achieve effective measures for extreme heat, it is necessary to accumulate evidence and discuss specific methods of roadway watering based on evidence.
The effects of cool pavements are related primarily to reflection and evaporation, with smaller effects due to heat storage [6]. The effect of evaporation is relatively promising because it is necessary to avoid the solar radiation reflected by the pavement from incident onto the human body. Anand et al. [7] pointed out that thermal storage is effective if daytime thermal comfort is a priority, but it also contributes to nighttime heat islands. Various studies have been conducted on cool pavement using evaporation as follows: The authors performed comparative surface heat budget measurements on several types of asphalt, concrete, and ceramic pavements developed in Japan, as well as soil and turf surfaces [8]. Cool pavements based on evaporation are classified as porous pavements, permeable pavements, and pervious pavements. In all cool pavements based on evaporation, the evaporation rate gradually decreases, and the cooling effect lasts only a few days after precipitation or watering. Relatively continuous evaporation can be expected in pavements with water-retaining materials incorporated between porous aggregates, which are called water-retaining pavements [8]. In addition, Akagawa et al. proposed the use of water-retaining sheets using capillary action under the surface of the water-retaining material in order to facilitate more continuous evaporation [5]. Watering on an as-needed basis or periodically is another possible alternative for continuous evaporation. Hendel et al. confirmed that watering reduced the surface temperature by 4 °C in the shade and 13 °C in the sun using infrared camera measurements [9]. Asaeda et al. focused on the heat storage and examined the heat budget on several kinds of pavements [10]. Qin and Hiller focused on the thermal inertia and examined the heat budget on the pavement surface [11]. The possibility of cooling benefits using irrigation was evaluated by Broadbent et al. [12]. Gao and Santamouris considered the temperature decrease due to irrigation and pointed out the necessity of optimizing irrigation in consideration of the relationship between irrigation cooling and the related factors [13]. The cooling effect of watering vegetation and irrigating pavement was analyzed by Daniel et al. [14]. Hendel et al. examined the optimization of the pavement-watering method [15]. They also examined the optimum watering method by paying attention to the sudden change in surface temperature [9]. Wei and He examined a numerical simulation for analyzing the thermal improvement effect of evaporative cooling on urban surfaces [16].
Because of the administrative effort and cost involved in continuous irrigation and periodic watering, more strategic research is needed to realize cool pavements to improve outdoor human thermal environment. Several studies have already examined the improvement of the outdoor human thermal environment using cool pavements as follows, but more practical studies are needed. Djekic et al. discussed the relationship between color, roughness, and shade of several materials and surface temperature and argued that the effects of sunshine and shade are dominant in human thermal comfort declaration based on the analysis of a thermal comfort declaration survey [17]. Wang et al. reported that water sprinkling can reduce surface temperature and wet bulb globe temperature (WBGT) at a height of 0.5 m above cold pavement by up to 10 °C and 2 °C, respectively [18]. The authors also reported that the most dominant factor in the thermal environment of outdoor spaces is solar radiation shielding, followed by surface cover improvement [19]. They also stated that solar radiation shielding using trees is necessary at least 10 m from buildings on the south side and at least 6 m from buildings on the east or west side [20]. In addition, based on the results of measurements and calculations in a large-scale redevelopment plaza in front of a major railway station, it was discussed that the thermal environment design of outdoor spaces should be considered in the following order: shading from buildings, shading from trees, and improvement of surface materials [21].
Permeable and porous pavement systems developed as sustainable drainage systems [3] have been studied for their effectiveness in preventing heat island effects [4]. The heat budget on pavement surfaces was analyzed [22,23]. In addition, surface temperature reduction effects of various types of water-retentive pavements were investigated using field observations [5,24,25,26,27,28,29]. Recently, a field study of the thermal environmental mitigation effects of roadway watering was conducted in Paris, France [30]. Based on these studies, continuous water supply is necessary because evaporation from precipitation is insufficient in many cases to achieve a stable evaporative cooling effect. Therefore, effective water supply methods need to be considered, whether watering conventional pavements or water-retentive pavements.
Kato et al. [31] described that, based on field measurements, roadway watering reduced road surface temperatures from 50 °C to 40 °C, and it took 60 min on average to return to pre-watering temperatures. The authors investigated the effective watering time by simulating the effect of roadway watering, assuming that the roadway is used by pedestrians, and identified the optimal watering time depending on the road orientation and location within the road (e.g., roadway, sidewalk) [2]. However, quantitative evaluation of appropriate watering times and intervals are still insufficient. Roadway watering has been implemented in Paris, France [30], for example, and the necessity to study its effective implementation is expected in other cities as well.
Based on the results of the previous study, this study aims to achieve the following two objectives:
- To determine the duration for surface temperature decrease associated with different weather conditions.
- To investigate the effective roadway watering plans according to the street configurations. It also considers the time it takes for the human body to reach a comfortable temperature.
2. Methods of Measurement and Calculation
2.1. Ground Surface Temperature Measurement by Infrared Camera
In Kobe City, watering on roadways in the downtown area has been continuously conducted in summer since 2020 as a measure for preventing extreme high temperatures. An example of roadway watering is shown in Figure 1. In order for local governments to establish effective watering plans, it is necessary to consider effective watering locations and durations, focusing on the thermal environment mitigation for pedestrians. Continuous measurement of ground surface temperature using an infrared camera throughout the summer is therefore needed to identify the duration of ground surface temperature decrease due to watering according to weather conditions and watering time.
2.1.1. Outline of Roadway Watering
Except for rainy days from 26 July to 31 August 2021 and 22 July to 4 September 2022, two 4-ton trucks watered approximately 32 tons per day (4 cups for each car per day), at 9:00, 11:00, 12:30, 14:00, and 15:30. The total watering area is 258,000 (m2), and the amount of each watering per unit area is 24.8 (g/(m2·times)) (=32,000,000 (g)/258,000 (m2)/5 (times)). If all the water evaporated in one hour, the latent heat of evaporation would be 62,000 (J/(m2·h)) (=2500 (J/g) × 24.8 (g/(m2·h))), which is 17.2 (W/m2). In reality, however, the amount of evaporation is large immediately after watering and decreases with time. In addition, we confirmed that some water flowed into adjacent lanes and side gutters. In order to mitigate the thermal environment for pedestrians on the sidewalks, it is desirable to water the lanes near the sidewalks, so watering was carried out on the lane near the sidewalk as much as possible, taking into consideration the situation of parked vehicles.
2.1.2. Outline of Continuous Measurement with Infrared Camera
Thermal images were measured using an infrared camera (VOx Uncooled Thermal Sensor, Dahua Technology, Hangzhou, China, TPC-BF2221-T; measurement accuracy: maximum ±5 °C) at 15 s intervals from 23 July to 4 September 2022. Measurement points and example of thermal image are shown in Figure 2. Air temperature, humidity, and solar radiation were also measured from 1 August to 1 September 2022. The measurement point was located on the intersection of a one-way westbound three-lane east–west road and an opposite four-lane north–south road. Air temperature and humidity were measured near the location of the infrared camera, and solar radiation (Thermopile, Tsuruga Electric, Osaka, Japan, LP PYRA03, measurement accuracy: 25 W/m2) was measured on the roof of a building of Kobe University, continuously at one-minute intervals. The sensor of the thermo-hygrometer (Thermistor and polymer membrane resistance type, Espec, Osaka, Japan, Thermo Recorder RS-14, measurement accuracy: average ±0.5 °C, ±5%) was installed in a natural ventilation system that provided shade from the sun and rain. The infrared camera and thermo-hygrometer, which were continuously installed throughout the measurement period, were mounted on a pole about 1 m above the platform, which is about 2 m above the ground. The surface temperature data of vehicles and pedestrians seen in the thermal images were dismissed by checking the images every 15 s.
2.1.3. Measurement Accuracy of Infrared Camera
To confirm the accuracy of the infrared camera measurements, field measurements were taken with a radiation thermometer at four points (see Figure 2): at the crosswalk, north, center, and south of the subject intersection. Figure 3 shows measurement results of surface temperatures using the radiation thermometer and infrared camera. The radiation thermometer readings were averages of 5 measurements taken at the center and four corners of a 50 cm square at each of the 4 points. The infrared camera readings were the median of the five-minute period immediately before the thermometer readings. To avoid the influence of the thermometer operators and their shadow on the infrared image, data only before the radiation thermometer measurements were used. The data were carefully extracted from 5 min data under stable weather conditions and without the influence of cars. Only measurements unaffected by watering were used. The averaged bias (radiation thermometer–infrared camera) at each location was 0.54 °C at south, 0.61 °C at center, 0.54° C at north, and 0.83 °C at crosswalk. As emissivity was set to 1.0 for both measurement devices, this is considered to be an effect of instrumental difference. Errors are large at low temperatures. We carefully examined the relationship between the relevant pixel in the infrared image and the surface to be measured in the field but could not find a clear relationship with the distance or angle from the infrared camera. However, it is obvious that there is a limitation in the accuracy of the infrared camera image measured from the lateral upper side.
2.2. Calculation Method of Thermal Environmental Indices
2.2.1. Calculation Method of Surface Temperature
The calculation method is the same as in previous studies by the authors [2,32]. Surface temperatures on the ground and wall are calculated based on the following surface heat budget equation. These equations follow those used by the authors in the study of heat budgets for various pavements [8]. However, multiple reflections of radiation in the street canyon are not considered to simplify the calculation. Comparison of calculated and measured results has been verified in previous studies by the authors [32].
where S is solar radiation (W/m2), R is infrared radiation (W/m2), V is sensible heat flux (W/m2), A is conduction heat flux (W/m2), and lE is latent heat flux (W/m2). ρ is solar reflectance (-). J (W/m2) is incident solar radiation, which is calculated based on the spatial distribution of solar radiation using ArcGIS and building shape data, as per the method described by Takebayashi et al. [33]. R (W/m2) is calculated by Brunt’s formula (Equation (7)) using air temperature and relative humidity. ε is emissivity (-). σ is Stefan–Boltzmann constant (=5.67 × 10⁻⁸ (W/(m2·K4))). Ts and Ta are surface and air temperature (K). P is water vapor pressure of air (kPa). Ac is convection heat transfer coefficient (W/(m2·K)), which is calculated by Jürges formula (Equation (8)) using wind velocity u (m/s). θs and θa are surface and air temperature (°C). λ is heat conductivity of surface material (W/(mK)). Θ (°C) is temperature in surface material, which is calculated by solving an unsteady one-dimensional heat conduction equation to take thermal mass into account. l is latent heat of water (=2500 (kJ/kg)). β is evaporative efficiency (-). αw is convection moisture transfer coefficient (kg/(m2·s(kg/kg’))), which is calculated by the Lewis relation formula using αc and specific heat of air. Xs and Xa are air absolute humidity and surface absolute humidity (kg/kg’). Parameters for the surface heat budget equation and heat conduction equation are shown in Table 1. Surface temperature is calculated by substituting these parameters into the above equations, where air temperature, air absolute humidity, underground temperature, and convection heat and moisture transfer coefficients as a function of wind velocity are set using observed values. All of these parameters of asphalt need to be appropriately changed when watering, but, in this study, only the dominant parameter, evaporation efficiency, was changed based on the tune-up results in previous studies.
2.2.2. Study Area
MRT is calculated by incident solar and infrared radiation to human body, which is calculated by surrounding surface temperature and view factors between the human body and surrounding surfaces. SET* is calculated by integrating the wind velocity and MRT distributions, by providing air temperature, relative humidity, a clothing amount, and a metabolic rate of the human body. Building shape and the test road are shown in Figure 4. The study area was divided into a 2 m mesh, and surface materials were set for each mesh. Asphalt is used for the roadway and blocks of concrete are used for the sidewalks. The crown width and tree height of each street tree were set using a field survey and Google Earth.
Kobe City is located facing Osaka Bay. The climate is classified as warm and temperate. According to Köppen and Geiger, this climate is classified as Cfa. The average annual temperature is 16.7 °C. The average annual rainfall is 1216 mm.
3. Results of Measurement and Calculation
3.1. Measurement Results of Surface Temperature after Watering
Figure 5 shows the measured surface temperature decrease immediately after watering at 12:30 p.m. on the north and south lanes of the east–west road, excluding rainy days from 22 July to 4 September 2022, separately for sunny and cloudy days. The north side roadway is shown in orange and the south side roadway is shown in blue. Sunny and cloudy are classified according to the hourly weather conditions by Kobe meteorological observatory. Because noise (e.g., influence of vehicles) was observed when the time interval was short, thermal images were extracted every minute after confirming measurements taken at 15 s intervals. Therefore, the rapid drop in surface temperature immediately after watering may not be captured. The surface temperatures were averaged from thermal images of approximately 0.5 m squares at the target location. The surface temperature immediately before watering (one minute before) was used as the reference, and surface temperatures were shown up to the time when they became higher than the reference temperature. The horizontal axis represents the time elapsed from watering time, since the watering time varies depending on the sprinkler vehicle’s timing.
Figure 6 shows the mean and standard deviation of the measured surface temperature decrease immediately after watering on the north and south lanes of the east–west road at 9:00, 11:00, 12:30, 14:00, and 15:30, excluding rainy days from July 2022 to 4 September 2022, separately for sunny and cloudy days. Figure 6 shows the mean values and standard deviations for each time calculated from the data for each day in Figure 5. The standard deviations shown in Figure 6 are not errors but represent the variation between measurement dates. This variation is caused not only by weather conditions, but also by watering conditions, which vary from day to day depending on how the sprinkler trucks are operated. Watering using sprinkler trucks is performed under actual traffic conditions, so watering amounts are not always stable due to the influence of other vehicles and other factors. Therefore, we adopted the method of ensemble averaging the experimental data for several days, as shown in Figure 6. Although the number of measurements varied by time of day and the standard deviation was large, a general trend can be recognized. Although the surface temperature may decrease by 2 to 4 °C immediately after watering, the maximum decrease in surface temperature is not immediately after watering, but gradually decreases for about 10 min after watering. It is considered that evaporation of the water is the cause of this effect.
Calculated values for a constant evaporation efficiency β = 0.15 are added to each figure for asphalt surfaces that are not shadowed by surrounding buildings, assuming typical sunny and cloudy weather conditions. At 9:00 and 11:00, it is difficult to confirm a significant surface temperature reduction in the measurement results due to the shading effect of the surrounding buildings. Changing the evaporation efficiency from 0.15 to a smaller value after 20 or 30 min after watering in either time period may reproduce the behavior of the changes in the observed values.
Table 2 shows the amount and duration of the surface temperature decrease at each watering time. The maximum reduction of surface temperature is about 10 °C. The duration of the surface temperature decrease is the time it returns to the surface temperature before watering, but it is difficult to determine them in many cases. As can be seen from Figure 4 and Figure 5, surface temperature may not rise to the level before watering under cloudy or shaded conditions or in the evening.
At the time of watering at 9:00, test points were in the shade. Because surface temperature before watering was low, the surface temperature decrease by watering was small. The duration of the surface temperature decrease was shorter than other times. As the reference temperature was low, surface temperature reached the reference temperature relatively soon after watering.
At the time of watering at 11:00, 12:30, and 14:00, test points were in the sun. Because surface temperature before watering was high, the surface temperature decrease by watering was large, which was about 4 to 6 °C on sunny days and about 2 to 4 °C on cloudy days. The duration of the surface temperature decrease was short (less than 30 min) for sunny days and long (more than 30 min) for cloudy days. In sunny days, the evaporation rate was faster, the surface temperature decrease was larger, and the duration of the evaporation was shorter.
At the time of watering at 15:30, test points were in the shade. Since surface temperature continuously decreased after watering, it was difficult to determine the duration of the surface temperature decrease.
3.2. Calculation Results of SET* Distribution
Time change of the ground surface temperature, MRT, and SET* were calculated for a typical summer sunny day, 5 August 2020. Air temperature and relative humidity were provided in the measurement data from Kobe local meteorological observatory located near the study area. It is assumed that the solar absorption rate, clothing amount, and metabolic rate of the human body are 0.5, 0.6 clo, and 1.0 met, respectively, and transmittance of solar radiation of a tree is 0.06.
An example of SET* distribution calculation results at 1.5 m high at 13:00 on 5 August 2020 is shown in Figure 7. Ground surface temperature is low in the shaded area by the surrounding buildings and trees. Since daily integral incident solar radiation is small in the shaded streets by street trees, surface temperature is low in both east–west and north–south roads. MRT is low in the median strip in some streets and the central park, where incident solar radiation and surrounding surface temperature are low. SET* is more affected by MRT than wind velocity. The calculation results were validated using the measurement results obtained on sunny summer days [32].
3.2.1. Diurnal Variations in Spatial Distribution Frequency of SET* on the Northern and Southern Sidewalk on East–West Road
Diurnal variations in spatial distribution frequency of SET* at 1.5 m high on the northern and southern sidewalks on the east–west road on 5 August 2020 are shown in Figure 8. These are the aggregated results of all calculation results as shown in Figure 7 for the areas shown in Figure 4. Based on the relationship between SET* and thermal sensation observed by Ishii et al. [34], it is uncomfortable if SET* exceeds about 30 °C. It is uncomfortable from 9:00 to 16:00 on the northern sidewalk, while there are locations where it is not uncomfortable even from 9:00 to 16:00 on the southern sidewalks.
When water was sprinkled on the roads, diurnal variations in spatial distribution frequency of SET* at 1.5 m high on the northern and southern sidewalk of the east–west road on 5 August 2020 are shown in the righthand bar of Figure 8 and Figure 9. Based on the experimental results from using sprinkler vehicles, the calculations were carried out with an evaporation efficiency set at 0.15 [1]. When the surface temperature is high before water sprinkling, a surface temperature reduction is confirmed greater than 10 °C, and SET* is reduced up to 2 °C. Although the SET* reduction around noon is large, the water sprinkling does not lead to comfortable conditions because the conditions before water sprinkling are quite uncomfortable. At this time, we should not insist on watering roadways, and may recommend that people move into public cooling spaces, for example. Sprinkling water in the evening may increase the number of comfortable spaces.
Change in percentage of comfortable SET* (below 29.5 °C) due to roadway watering on the east–west road is shown in Table 3. While watering around noon does not increase the percentage of comfortable, watering at 10:00 and 16:00 increases the percentage of comfortable by about 70% on the southern sidewalk, but only by 20% to 40% on the northern sidewalk. The increase in percentage of comfort was as large as 25% on the southern sidewalk. Although surface temperature reduction by watering is almost the same on the northern and southern roadways, SET* tends to be comfortable on the southern sidewalk, where incident solar radiation on the human body is more likely to be shaded. Watering the lanes near the southern sidewalk is considered to be more effective in mitigating the thermal environment for pedestrians.
3.2.2. Diurnal Variations of Spatial Distribution Frequency of SET* on the Eastern and Western Sidewalk on North–South Road
Diurnal variations of spatial distribution frequency of SET* at 1.5 m high on the eastern and western sidewalks on north–south road on 5 August 2020 are shown in Figure 9. The right bar at each time indicates the frequency when the road was watered. On the eastern sidewalk, there are relatively many places that are comfortable (below 29.5 °C) until 11:00 a.m. On the western sidewalk, there are relatively many places that are comfortable after 1:00 p.m. Use of the eastern sidewalk in the morning and the western sidewalk in the afternoon are recommended.
While watering around noon does not increase the percentage of comfort, watering in the morning or afternoon increases the percentage of comfort on the eastern and western sidewalk. Change in percentage of comfortable SET* (below 29.5 °C) due to roadway watering on north–south road is shown in Table 4. Compared to the east–west road (especially on the northern sidewalk), the thermal environment on the sidewalks of the north–south road tends to be more mitigated as a whole. Watering the lanes near the eastern sidewalk in the morning and near the western sidewalk in the afternoon is considered to be more effective in mitigating the thermal environment for pedestrians.
4. Discussion
Previous studies [1,31] have shown that when the unwatered road surface temperature is high on sunny days, the amount of decrease in surface temperature is large when the road surface is watered. As shown in Table 2, watering at 12:30, 14:00, and 15:30 resulted in a maximum decrease of about 10 °C and an average decrease of about 6 °C in sunny conditions in the measurements of this study. Since these results are based on a number of measurements, they may provide a realistic estimate of the effect of watering.
Kato et al. [31] described that, based on field measurements, it took an average of 60 min to return to pre-watering temperatures. As shown in Table 2 and Figure 6, it is often difficult to determine the time it takes to return to the pre-watering temperature from the measurement results. The duration of the surface temperature decrease was short (less than 30 min) for sunny days and long (more than 30 min) for cloudy days. On sunny days, if the evaporation rate was faster and the surface temperature decrease was larger, then the duration of the evaporation was shorter.
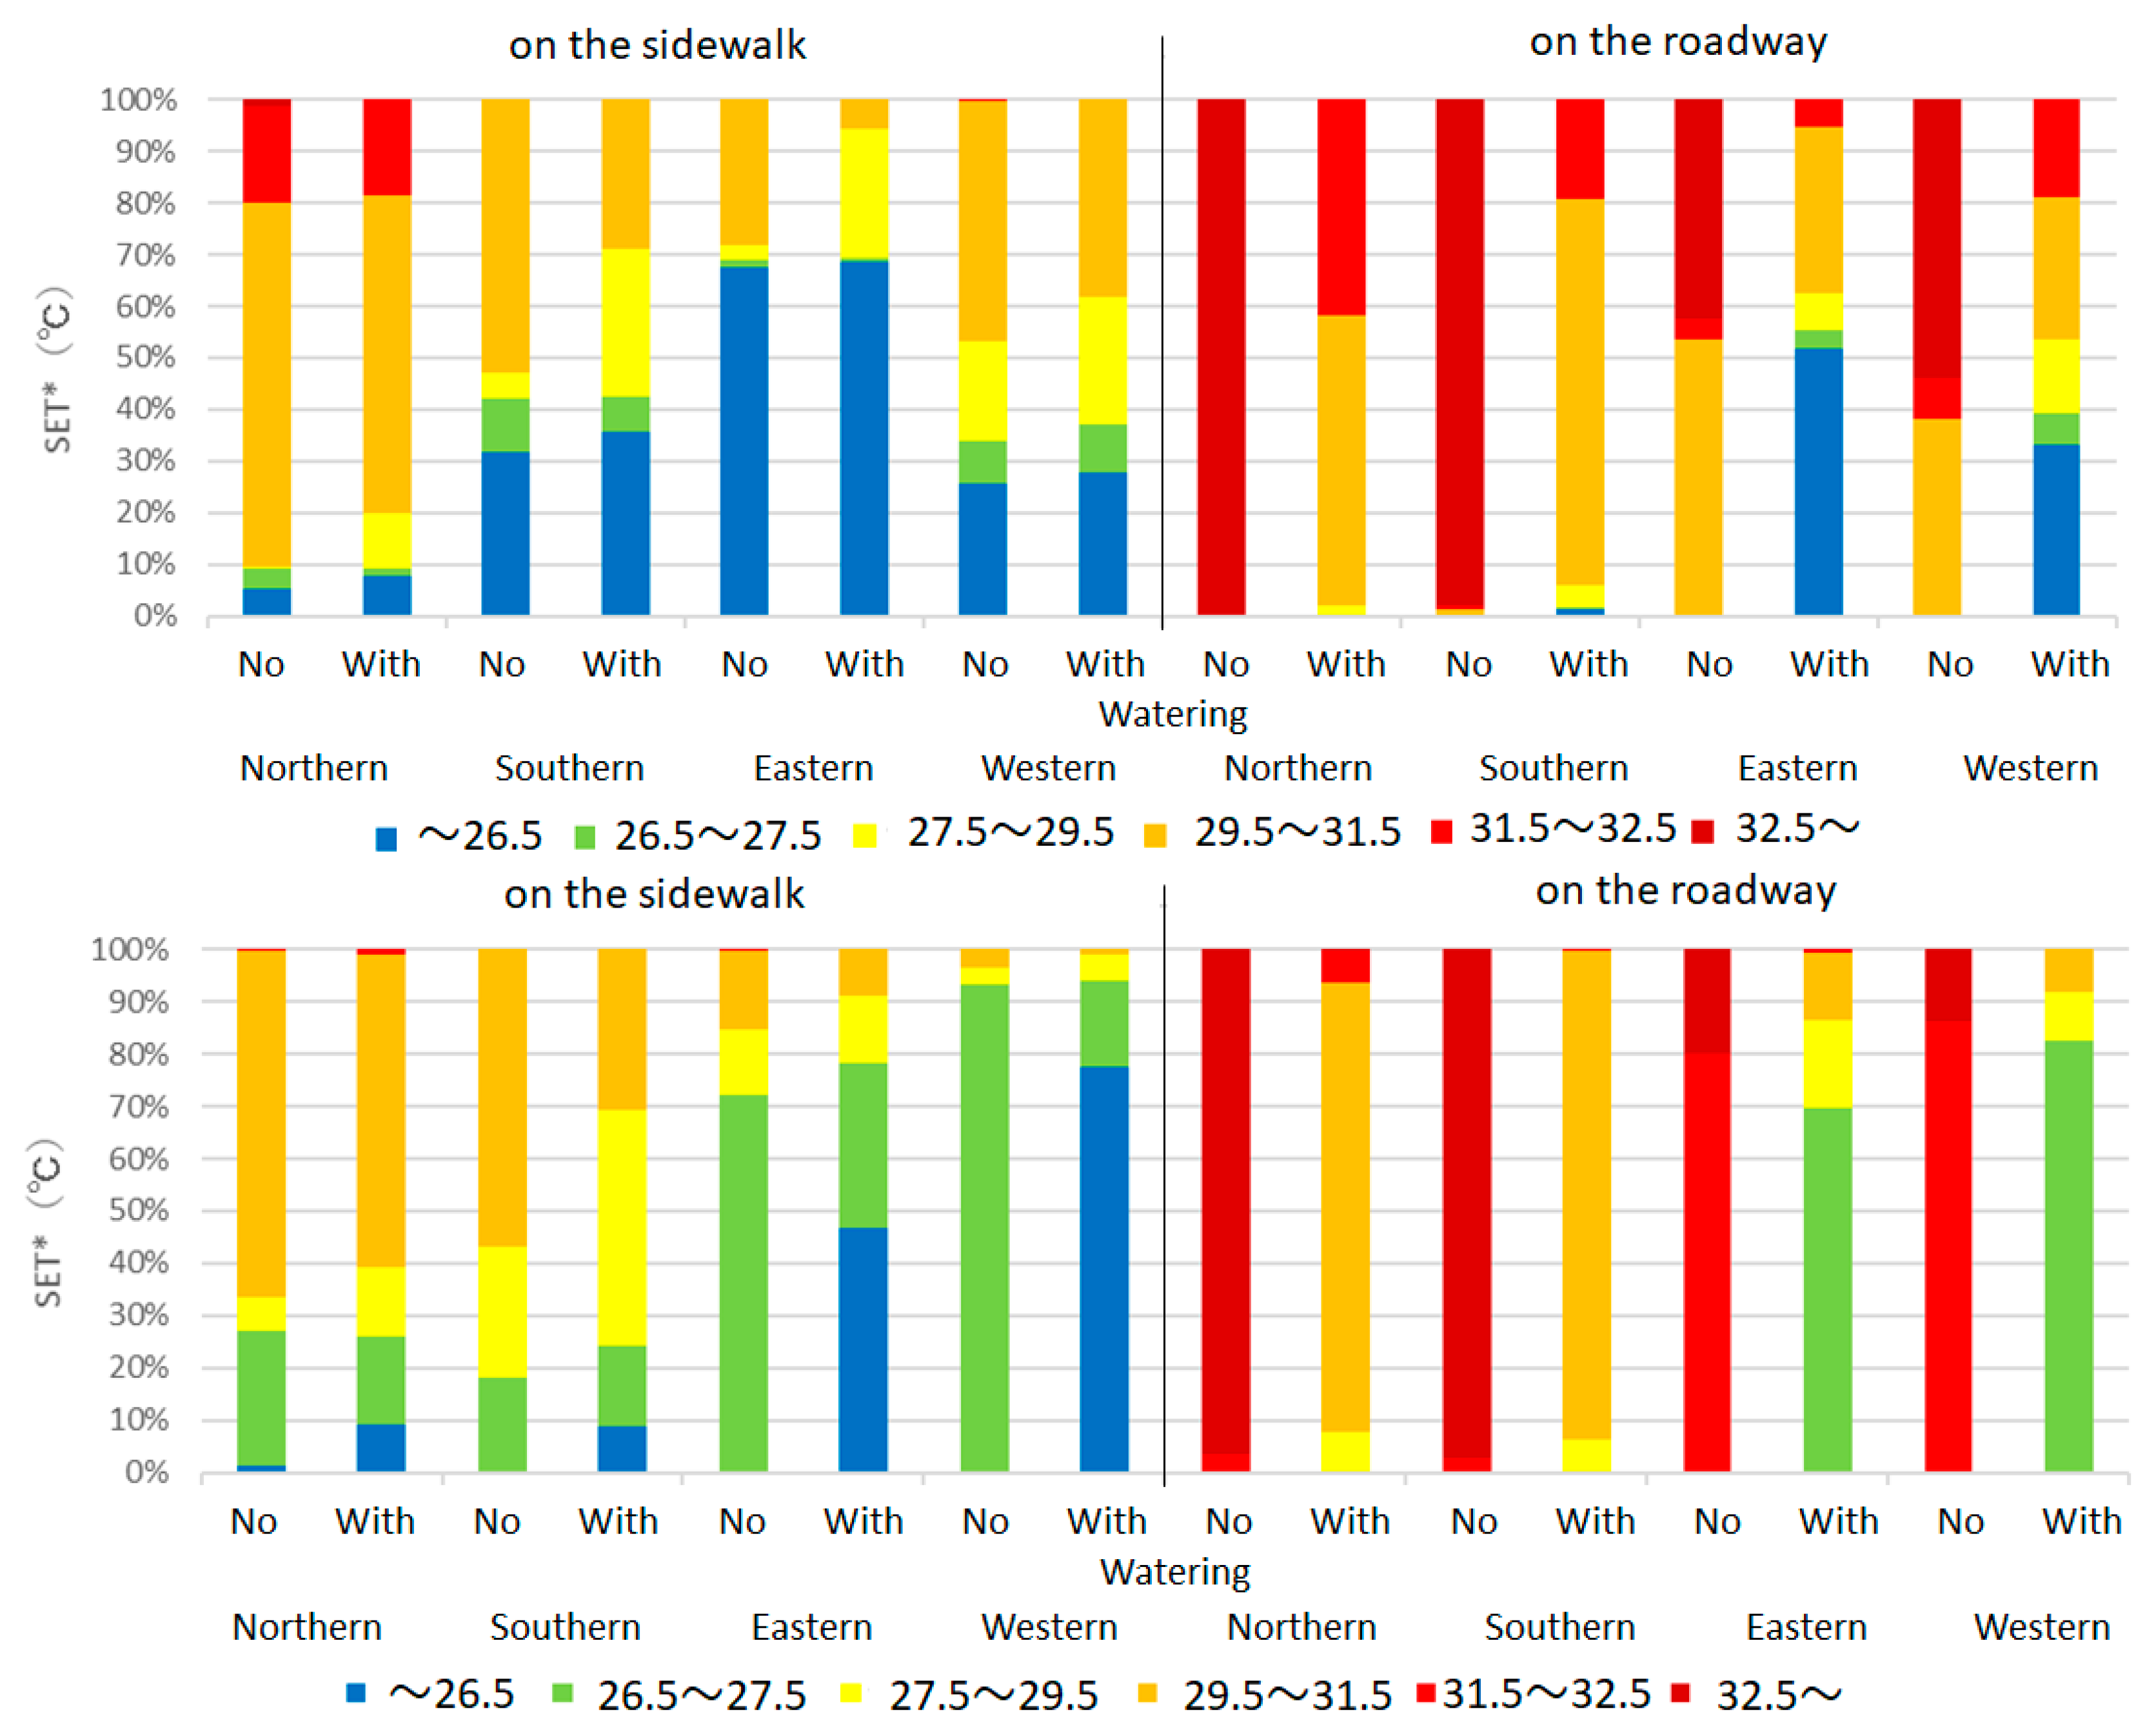
Since the form factor of the road surface for the human body on sidewalks is small, watering the road has a limited effect on the thermal environment for pedestrians on sidewalks [1]. Measures to provide road space for pedestrians have also been considered by revising the traffic network (e.g., Midosuji, the central street in Osaka). Takebayashi et al. [2] examined the effects of sun shade, water sprinkling, and water surfaces for pedestrian use of the roadway. Integrating the results of previous work and this study, Figure 10 shows the change in SET* on the sidewalk and on the roadway due to roadway watering at 10:00 and 16:00. At each time, the thermal environment on the sidewalk, which is more affected by shading from surrounding buildings, is mitigated more than on the roadway. In addition, roadway watering increases the percentage of comfortable SET* (below 29.5 °C) for pedestrians on the sidewalk. Change in percentage of comfortable SET* (below 29.5 °C) due to roadway watering on the north–south road at 10:00 and 16:00 is shown in Table 5. Watering on the east–west roadway does not increase comfort because of the sun, but approaches comfort on the shaded south sidewalk. Watering on the north–south roadway at the same time approaches comfort both on the roadway and on the sidewalk. Therefore, a more effective strategy for roadway watering would be to guide pedestrians to shaded sidewalks and then water nearby roadways in the sun to reduce surface temperatures.
5. Conclusions
Continuous measurement of road surface temperature using an infrared camera throughout the summer season was conducted to clarify the duration of surface temperature decrease due to roadway watering according to weather conditions and watering time. Watering during sunny daytime conditions resulted in a maximum reduction in surface temperature of about 10 °C and an average reduction of about 6 °C. Since these results are based on a large number of measurements, realistic estimates of the effects of watering could be obtained. The duration of the surface temperature decrease was short (less than 30 min) for sunny days and long (more than 30 min) for cloudy days. On sunny days, if the evaporation rate was faster and the surface temperature decrease was larger, then the duration of the evaporation was shorter.
Effective roadway watering plans were investigated according to the street configurations by simulating the thermal environment considering the solar radiation shielding condition of pedestrians on sidewalks. Simulation results in the downtown area of Kobe City indicated that watering the nearby roadways resulted in only 20% and 39% comfort for the northern sidewalks on the east–west road at 10:00 and 16:00, but about 70% comfort for the southern sidewalks and 60–90% comfort for the eastern and western sidewalks. Guiding pedestrians to a shaded sidewalk and then watering the nearby roadway to lower the surface temperature in the sun improves the thermal environment for pedestrians.
The results of the infrared camera measurements provide an understanding of the temporal variation in surface temperature reduction due to watering. To reflect these results in numerical simulations, it is necessary to set the time variation of the evaporation efficiency β. In this study, the amount and duration of the surface temperature reduction were obtained, but due to their large variability, the modeling was abandoned and a uniform value of β = 0.15 was used in the numerical simulations. This is a topic for future research. In addition, numerical simulations were carried out in the central area of Kobe City, which is configured in block form, but the trend of the results may change for urban blocks composed of high-rise buildings, such as those in New York City.
Author Contributions
Conceptualization, H.T. and U.T.; methodology, H.T.; software, H.M.; validation, H.T. and H.M.; formal analysis, H.M.; investigation, H.M.; resources, H.M.; data curation, H.M.; writing—original draft preparation, H.T.; writing—review and editing, H.T.; visualization, H.M.; supervision, H.T.; project administration, H.T. and U.T.; funding acquisition, H.T. All authors have read and agreed to the published version of the manuscript.
Funding
This work was supported by JSPS KAKENHI, grant number JP22H01651.
Institutional Review Board Statement
Not applicable.
Informed Consent Statement
Not applicable.
Data Availability Statement
Not applicable.
Acknowledgments
The authors thank Toshiyuki Sano of Kobe City and Yoshitaka Nakamura of Kobe City College of Technology for their cooperation.
Conflicts of Interest
The authors declare no conflict of interest.
References
- Takebayashi, H.; Danno, H.; Tozawa, U. Study on appropriate heat mitigation technologies for urban block redevelopment based on demonstration experiments in Kobe city. Energy Build. 2021, 250, 111299. [Google Scholar] [CrossRef]
- Takebayashi, H.; Danno, H.; Tozawa, U. Study on Strategies to Implement Adaptation Measures for Extreme High Temperatures into the Street Canyon. Atmosphere 2022, 13, 946. [Google Scholar] [CrossRef]
- Scholz, M.; Grabowiecki, P. Review of permeable pavement systems. Build. Environ. 2007, 42, 3830–3836. [Google Scholar] [CrossRef]
- Santamouris, M. Using cool pavements as a mitigation strategy to fight urban heat island—A review of the actual developments. Renew. Sustain. Energy Rev. 2013, 26, 224–240. [Google Scholar] [CrossRef]
- Akagawa, H.; Komiya, H. Experimental study on pavement system with continuous wet surface. J. Archit. Plann. Environ. Eng. AIJ 2000, 530, 79–85. [Google Scholar] [CrossRef] [Green Version]
- Qin, Y. A review on the development of cool pavements to mitigate urban heat island effect. Renew. Sustain. Energy Rev. 2015, 52, 445–459. [Google Scholar] [CrossRef]
- Anand, J.; Sailor, D.J. Role of pavement radiative and thermal properties in reducing excess heat in cities. Sol. Energy 2022, 242, 413–423. [Google Scholar] [CrossRef]
- Takebayashi, H.; Moriyama, M. Study on surface heat budget of various pavements for urban heat island mitigation. Adv. Mater. Sci. Eng. 2012, 2012, 523051. [Google Scholar] [CrossRef] [Green Version]
- Hendel, M.; Colombert, M.; Diab, Y.; Royon, L. Improving a pavement-watering method on the basis of pavement surface temperature measurements. Urban Clim. 2014, 10, 189–200. [Google Scholar] [CrossRef] [Green Version]
- Asaeda, T.; Ca, V.; Wake, A. Heat storage of pavement and its effect on the lower atmosphere. Atmos. Environ. 1996, 30, 413–427. [Google Scholar] [CrossRef]
- Qin, Y.; Hiller, J. Understanding pavement-surface energy balance and its implications on cool pavement development. Energy Build. 2014, 85, 389–399. [Google Scholar] [CrossRef]
- Broadbent, A.M.; Coutts, A.M.; Tapper, N.J.; Demuzere, M. The cooling effect of irrigation on urban microclimate during heatwave conditions. Urban Clim. 2018, 23, 309–329. [Google Scholar] [CrossRef]
- Gao, K.; Santamouris, M. The use of water irrigation to mitigate ambient overheating in the built environment: Recent progress. Build. Environ. 2019, 164, 106346. [Google Scholar] [CrossRef]
- Daniel, M.; Lemonsu, A.; Viguié, V. Role of watering practices in large-scale urban planning strategies to face the heat-wave risk in future climate. Urban Clim. 2018, 23, 287–308. [Google Scholar] [CrossRef]
- Hendel, M.; Colombert, M.; Diab, Y.; Royon, L. An analysis of pavement heat flux to optimize the water efficiency of a pavement-watering method. Appl. Therm. Eng. 2015, 78, 658–669. [Google Scholar] [CrossRef] [Green Version]
- Wei, J.; He, J. Numerical simulation for analyzing the thermal improving effect of evaporative cooling urban surfaces on the urban built environment. Appl. Therm. Eng. 2013, 51, 144–154. [Google Scholar] [CrossRef]
- Djekic, J.; Djukic, A.; Vukmirovic, M.; Djekic, P.; Brankovic, M. Thermal comfort of pedestrian spaces and the influence of pavement materials on warming up during summer. Energy Build. 2018, 159, 474–485. [Google Scholar] [CrossRef] [Green Version]
- Wang, J.; Meng, Q.; Tan, K.; Zhang, L.; Zhang, Y. Experimental investigation on the influence of evaporative cooling of permeable pavements on outdoor thermal environment. Build. Environ. 2018, 140, 184–193. [Google Scholar] [CrossRef]
- Takebayashi, H.; Kyogoku, S. Thermal environmental design in outdoor space focusing on radiation environment influenced by ground cover material and solar shading, through the examination on the redevelopment buildings in front of central Osaka station. Sustainability 2018, 10, 337. [Google Scholar] [CrossRef] [Green Version]
- Takebayashi, H.; Kasahara, M.; Tanabe, S.; Kouyama, M. Analysis of solar radiation shading effects by trees in the open space around buildings. Sustainability 2017, 9, 1398. [Google Scholar] [CrossRef] [Green Version]
- Takebayashi, H. Thermal environment design of outdoor spaces by examining redevelopment buildings opposite central Osaka station. Climate 2019, 7, 143. [Google Scholar] [CrossRef] [Green Version]
- Asaeda, T.; Fujino, T. Heat flux and Heat storage Properties of the Paved ground. J. Japan Soc. Hydrol. Water Resour. 1992, 5, 3–7. [Google Scholar] [CrossRef] [Green Version]
- Kinouchi, T.; Kanda, M. An observation on the climatic effect of watering on paved roads. J. Hydrosci. Hydraul. Eng. 1997, 15, 55–64. [Google Scholar] [CrossRef] [Green Version]
- Ozaki, T.; Suzuki, Y. Study on the contribution of water-retentive ceramic tile to the reduction of environment heat accumulation. J. Hydraul. Eng. 1998, 42, 61–66. [Google Scholar] [CrossRef]
- Yamagata, H.; Nasu, M.; Yoshizawa, M.; Miyamoto, A.; Minamiyama, M. Heat island mitigation using water retentive pavement sprinkled with reclaimed wastewater. Water Sci. Technol. 2008, 57, 763–771. [Google Scholar] [CrossRef]
- Herb, W.; Janke, B.; Mohseni, O.; Stefan, H. Ground surface temperature simulation for different land covers. J. Hydrol. 2008, 356, 327–343. [Google Scholar] [CrossRef]
- Akagawa, H.; Takebayashi, H.; Moriyama, M. Experimental study on improvement on human thermal environment on a watered pavement and a highly reflective pavement. J. Environ. Eng. AIJ 2008, 73, 85–91. [Google Scholar] [CrossRef] [Green Version]
- Nakayama, T.; Fujita, T. Cooling effect of water-holding pavements made of new materials on water and heat budgets in urban areas. Landsc. Urban Plan. 2010, 96, 57–67. [Google Scholar] [CrossRef]
- Yokota, K.; Yamaji, T.; Hirano, S. Basic characteristics of water permeable/retainable porous paving bricks for controlling urban heat island phenomenon. J. Heat Isl. Inst. Int. 2010, 5, 40–46. [Google Scholar]
- Hendel, M.; Gutierrez, P.; Colombert, M.; Diab, Y.; Royon, L. Measuring the effects of urban heat island mitigation techniques in the field: Application to the case of pavement-watering in Paris. Urban Clim. 2016, 16, 43–58. [Google Scholar] [CrossRef]
- Kato, T.; Tebakari, T.; Tsuchiya, S.; Yamada, T. Mitigation Effects of Thermal Environment by Watering. J. Hydraul. Eng. 2008, 52, 277–282. [Google Scholar] [CrossRef]
- Takebayashi, H.; Okubo, M.; Danno, H. Thermal environment map in street canyon for implementing extreme high temperature measures. Atmosphere 2020, 11, 550. [Google Scholar] [CrossRef]
- Takebayashi, H.; Ishii, E.; Moriyama, M.; Sakaki, A.; Nakajima, S.; Ueda, H. Study to examine the potential for solar energy utilization based on the relationship between urban morphology and solar radiation gain on building rooftops and wall sur-faces. Sol. Energy 2015, 119, 362–369. [Google Scholar] [CrossRef]
- Ishii, A.; Katayama, T.; Shiotsuki, Y.; Yoshimizu, H.; Abe, Y. Experimental study on comfort sensation of people in the out-door environment. J. Archit. Plan. Environ. Eng. 1988, 386, 28–37. [Google Scholar]
Figure 1.
Roadway watering in Kobe City. Photo taken in the summer of 2022.
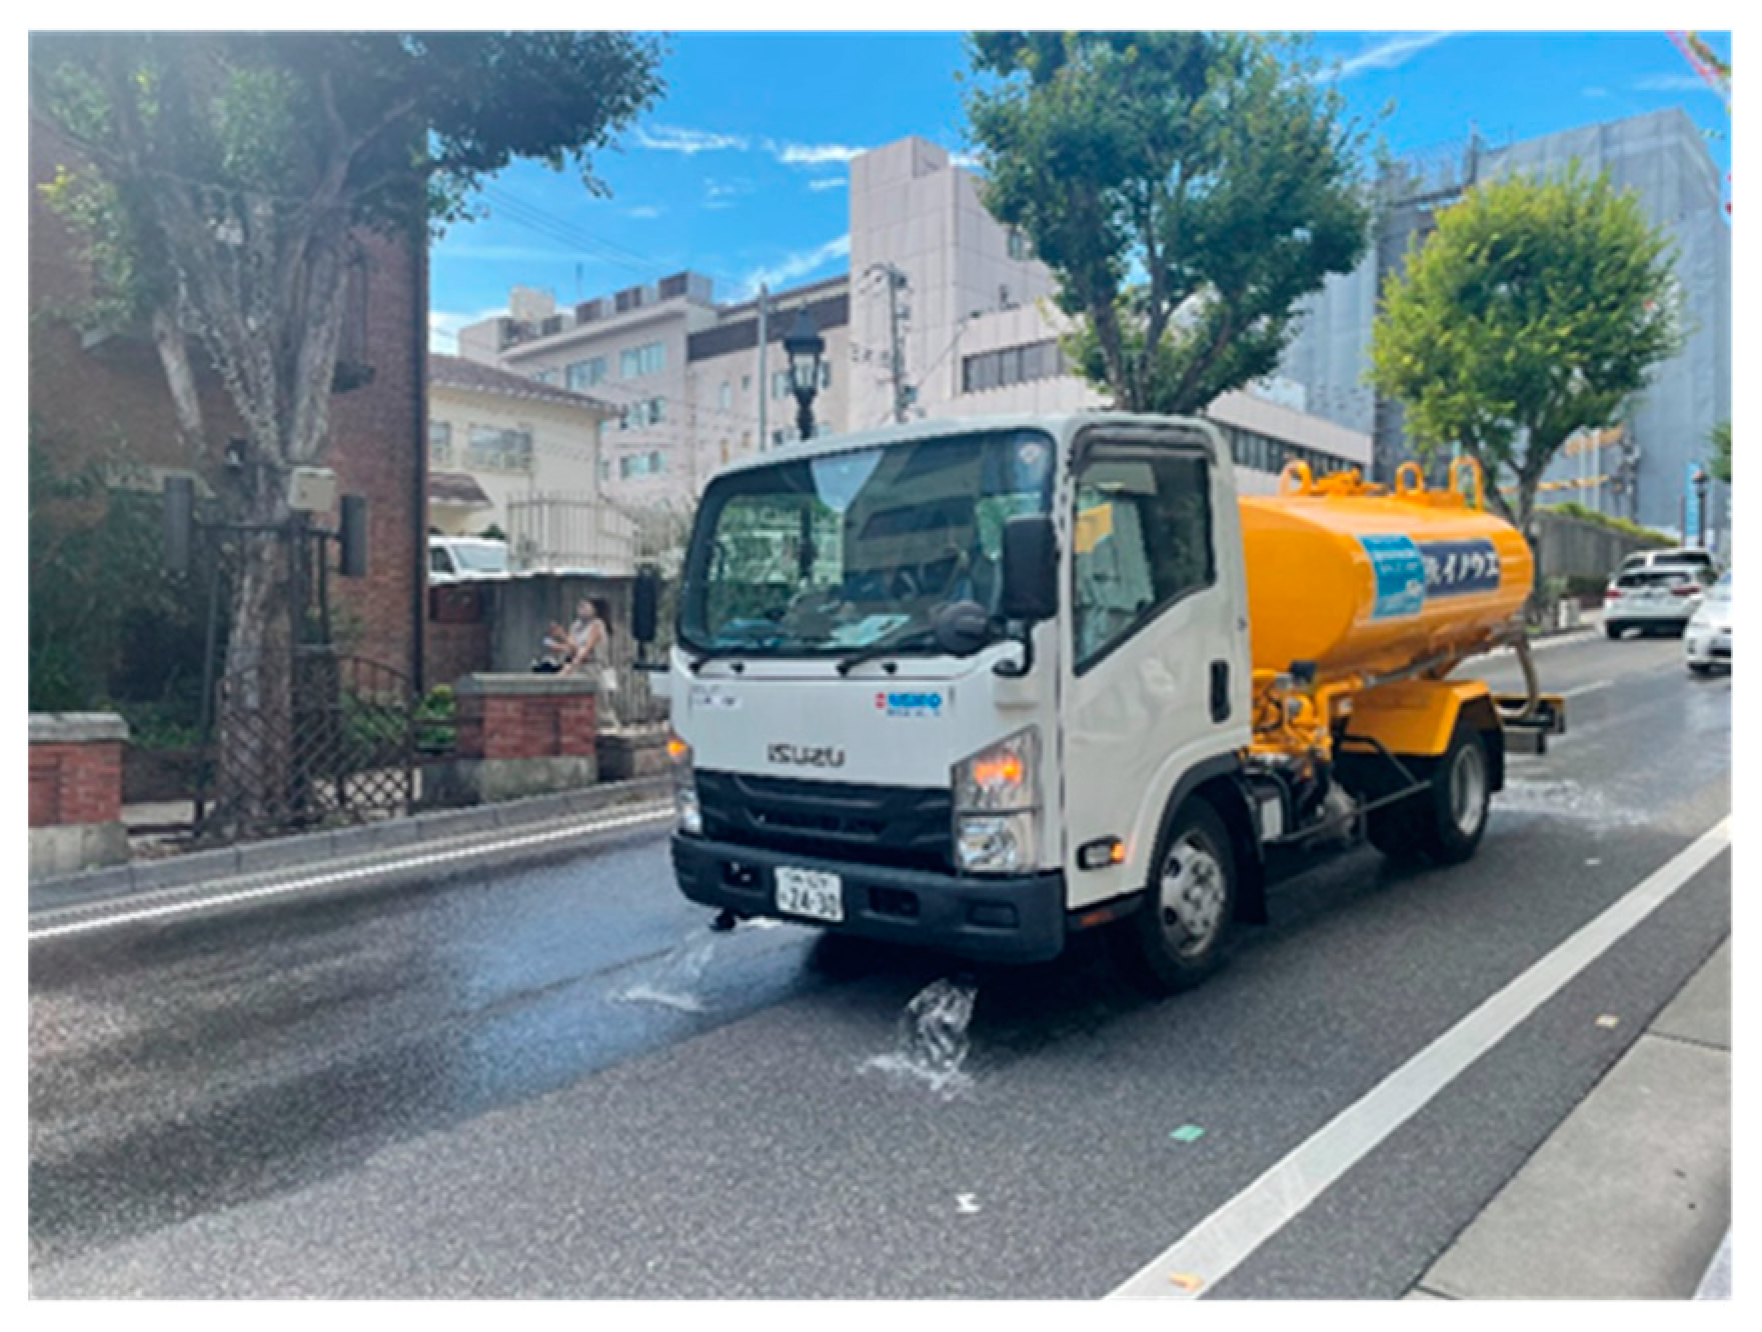
Figure 2.
Measurement points and example of thermal image.
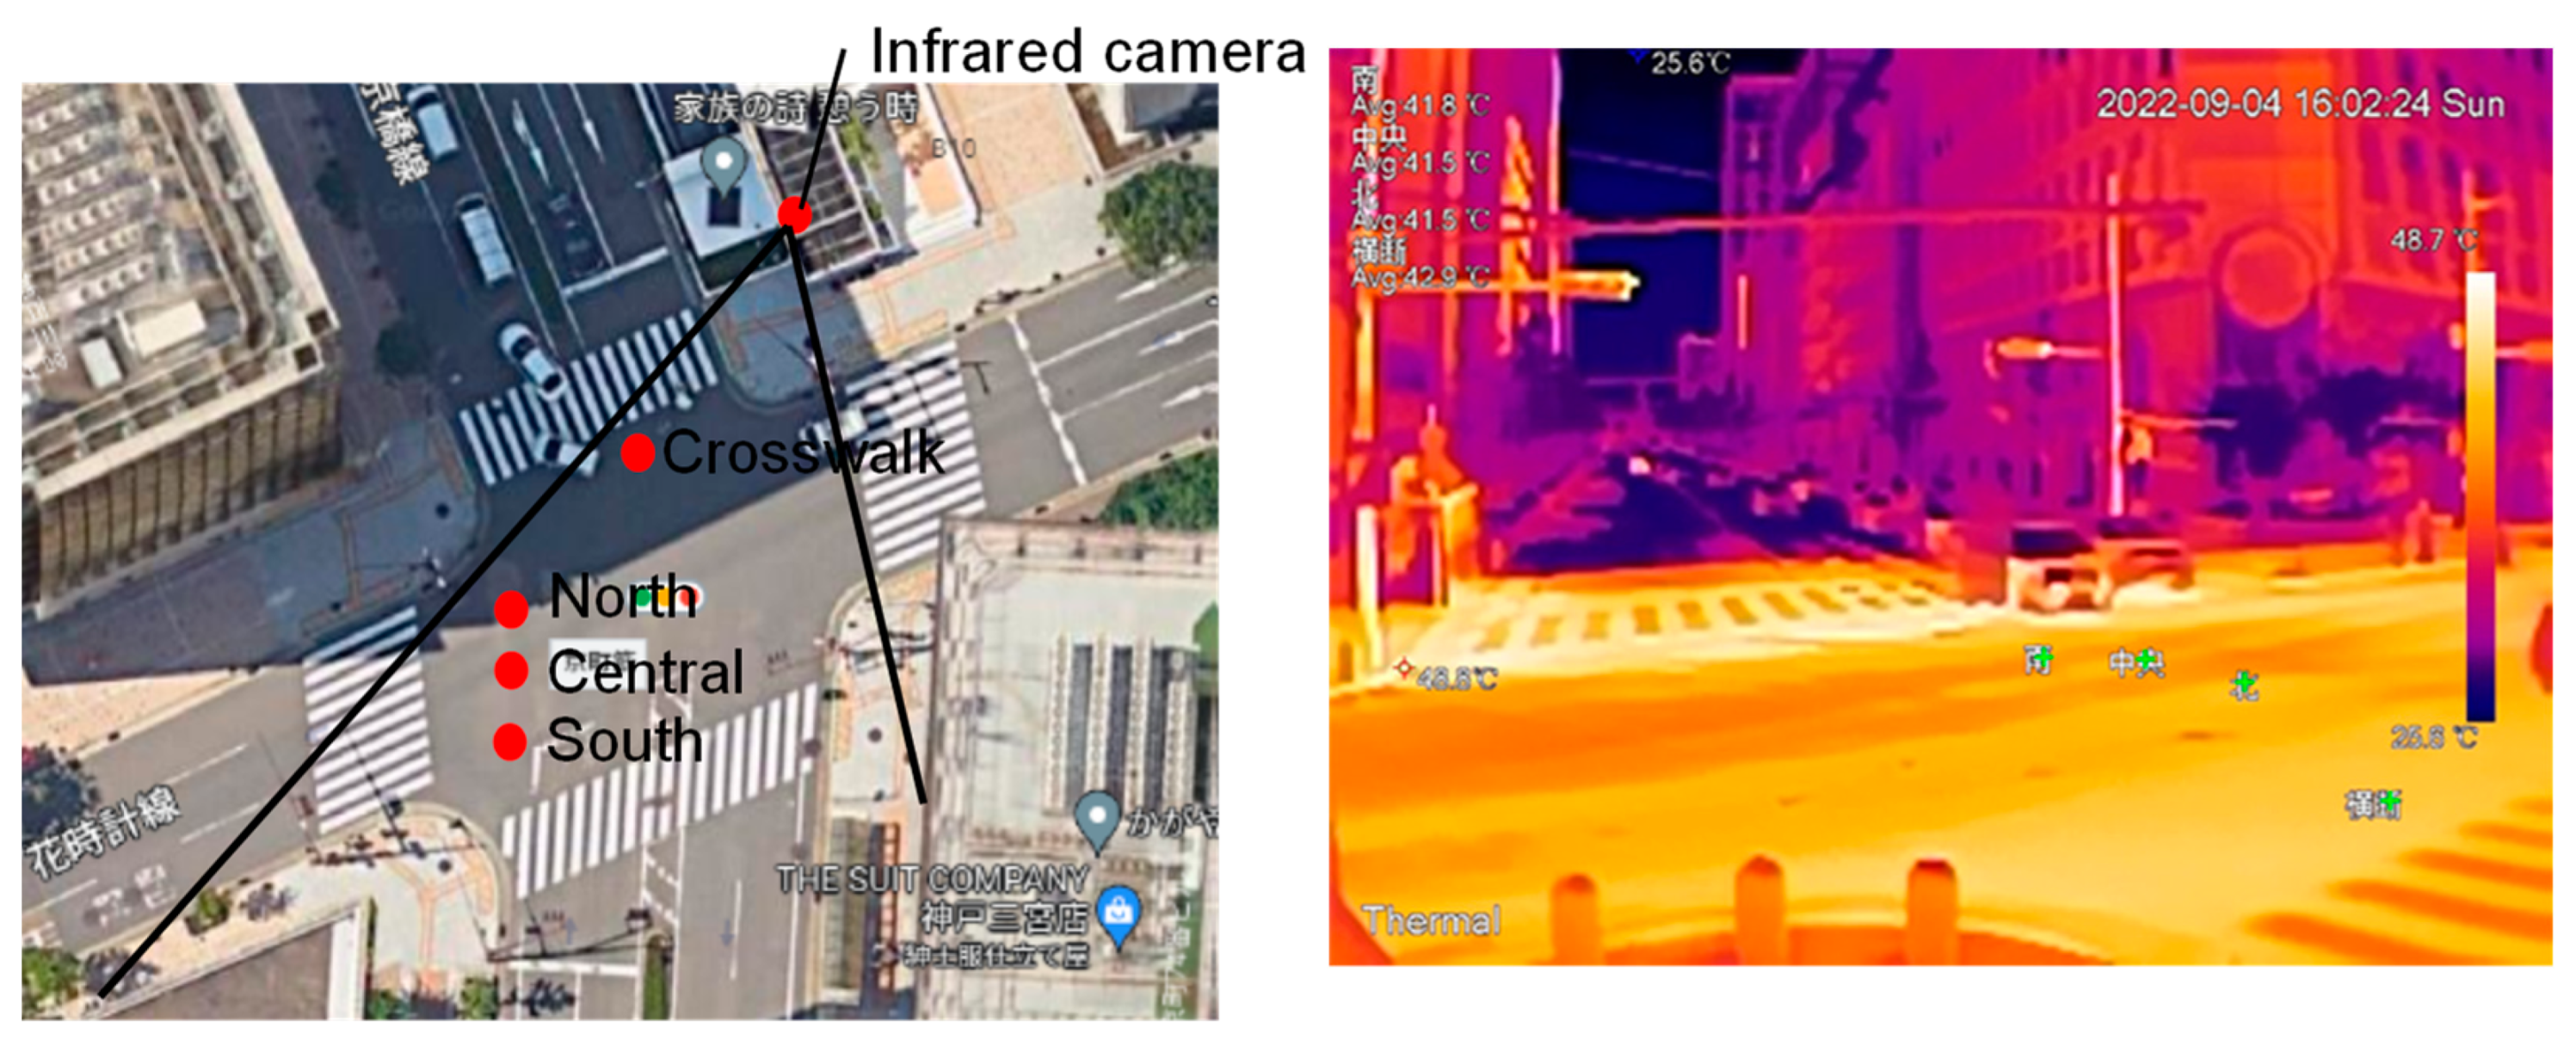
Figure 3.
Measurement results of surface temperatures using the radiation thermometer and infrared camera.
Figure 3.
Measurement results of surface temperatures using the radiation thermometer and infrared camera.
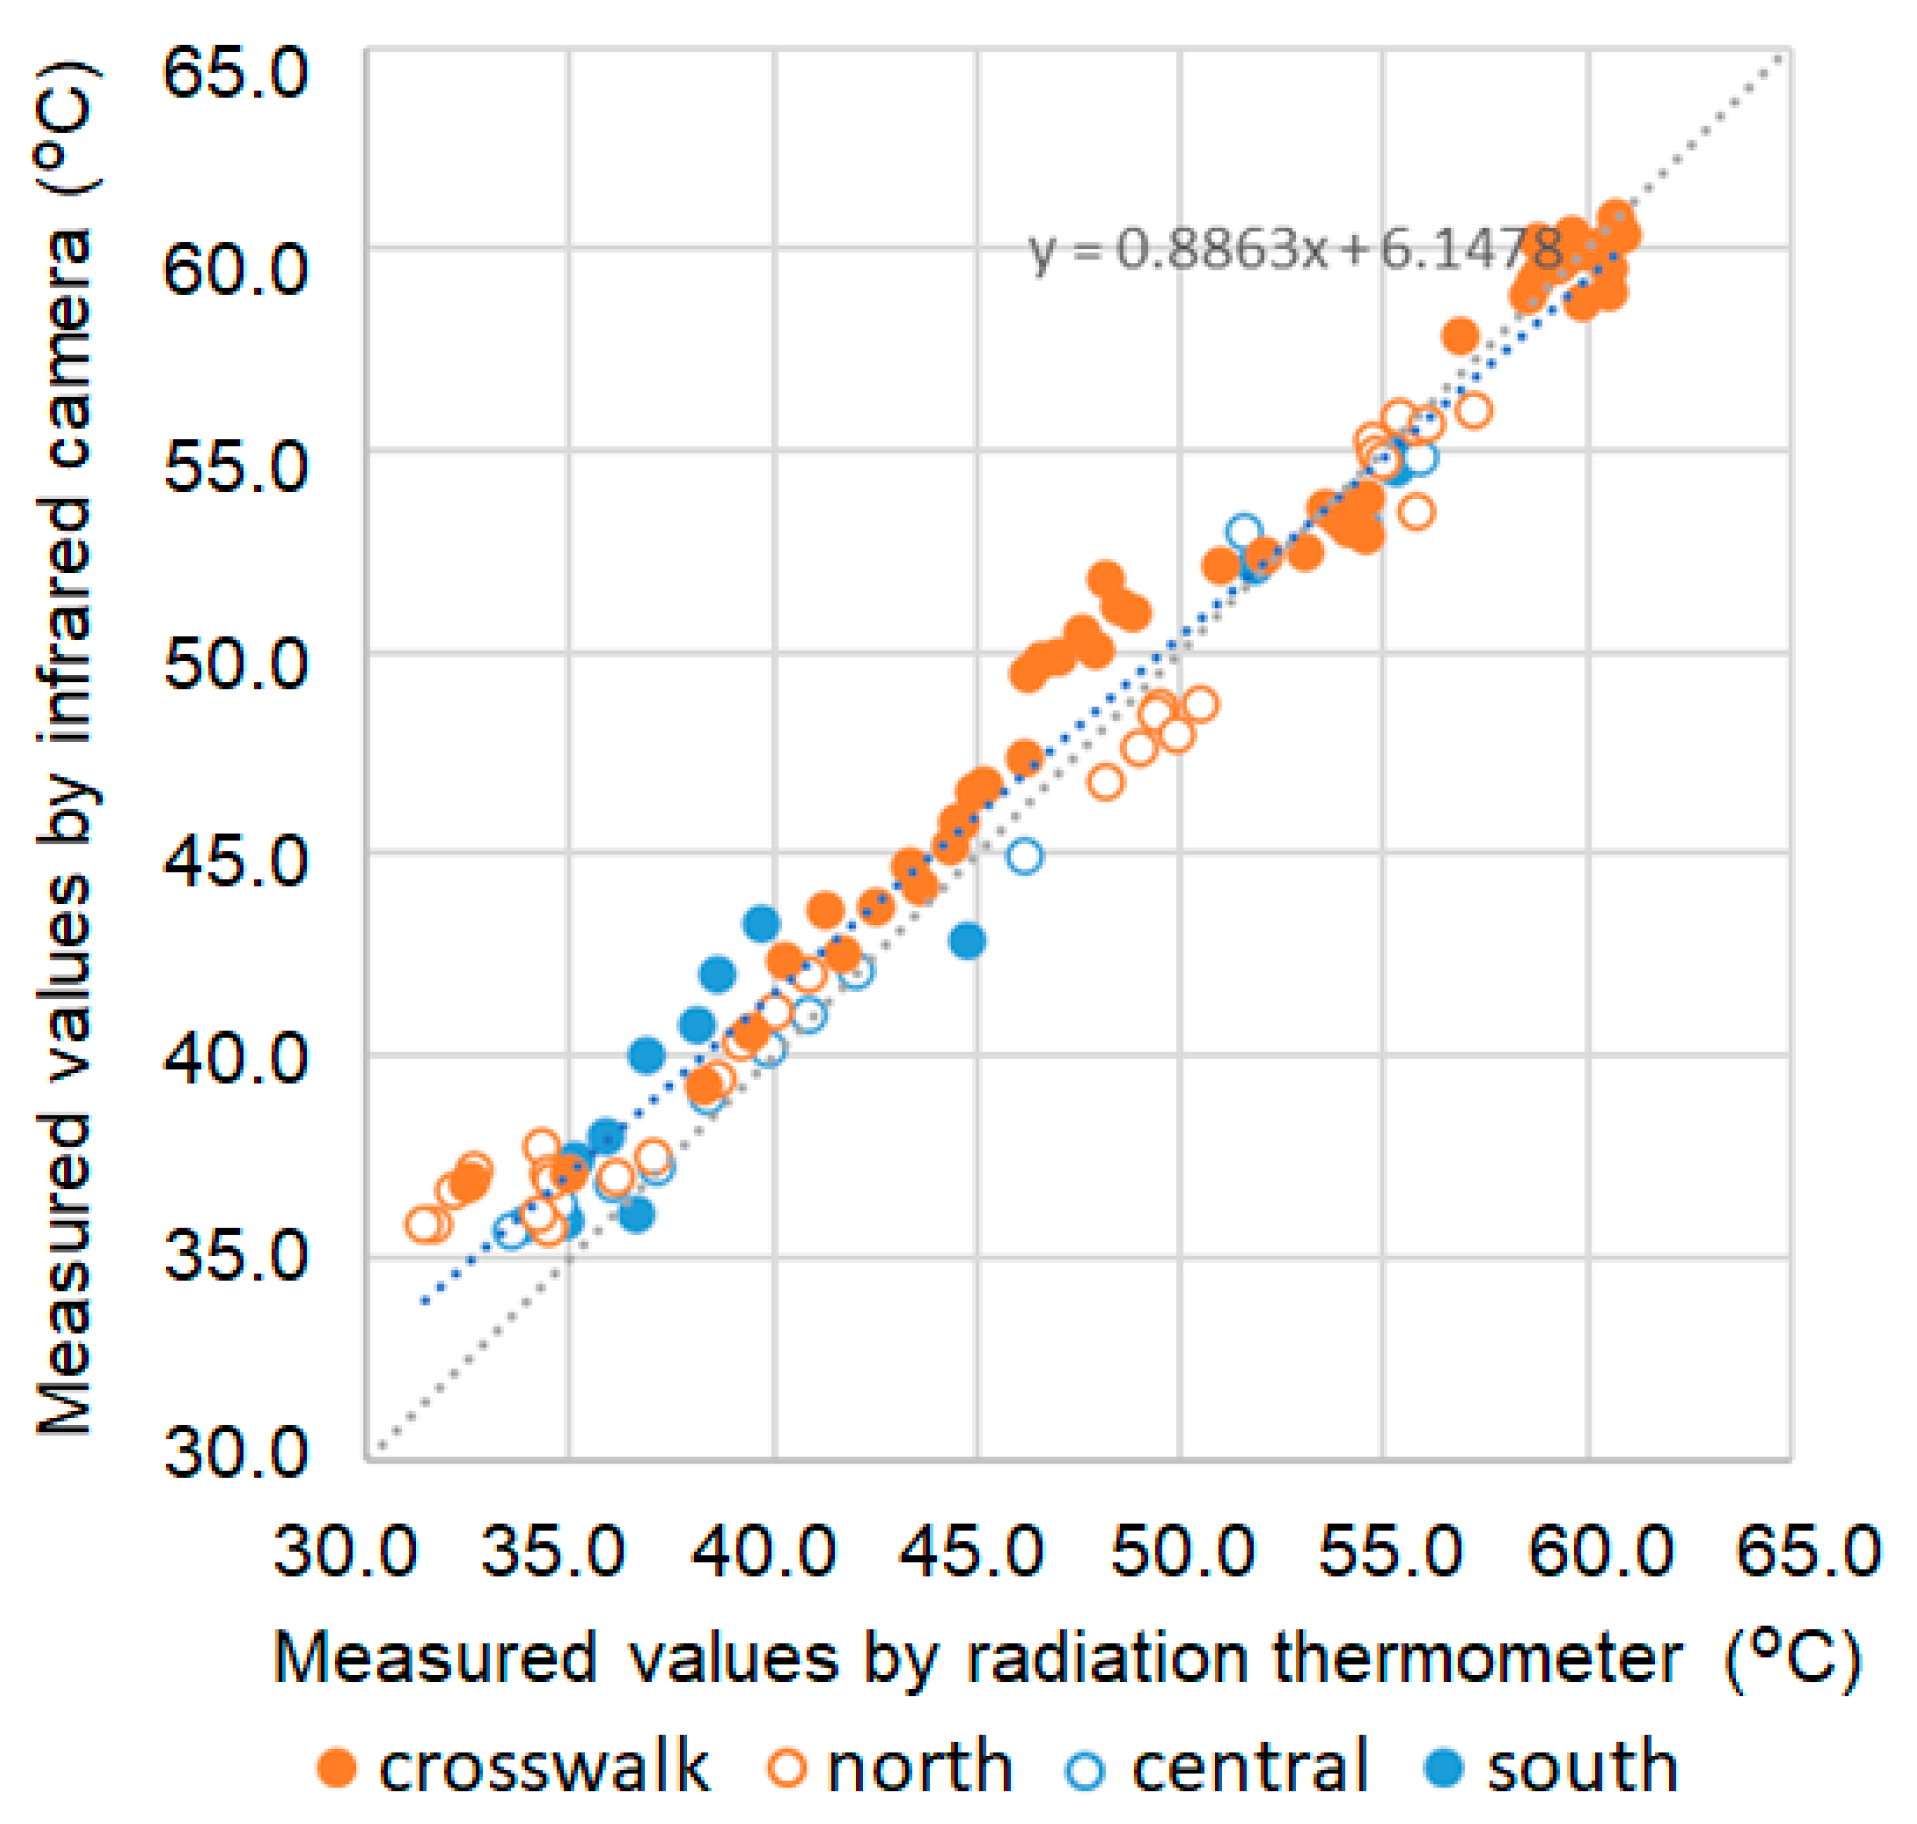
Figure 4.
Study area showing building footprints and test roads.
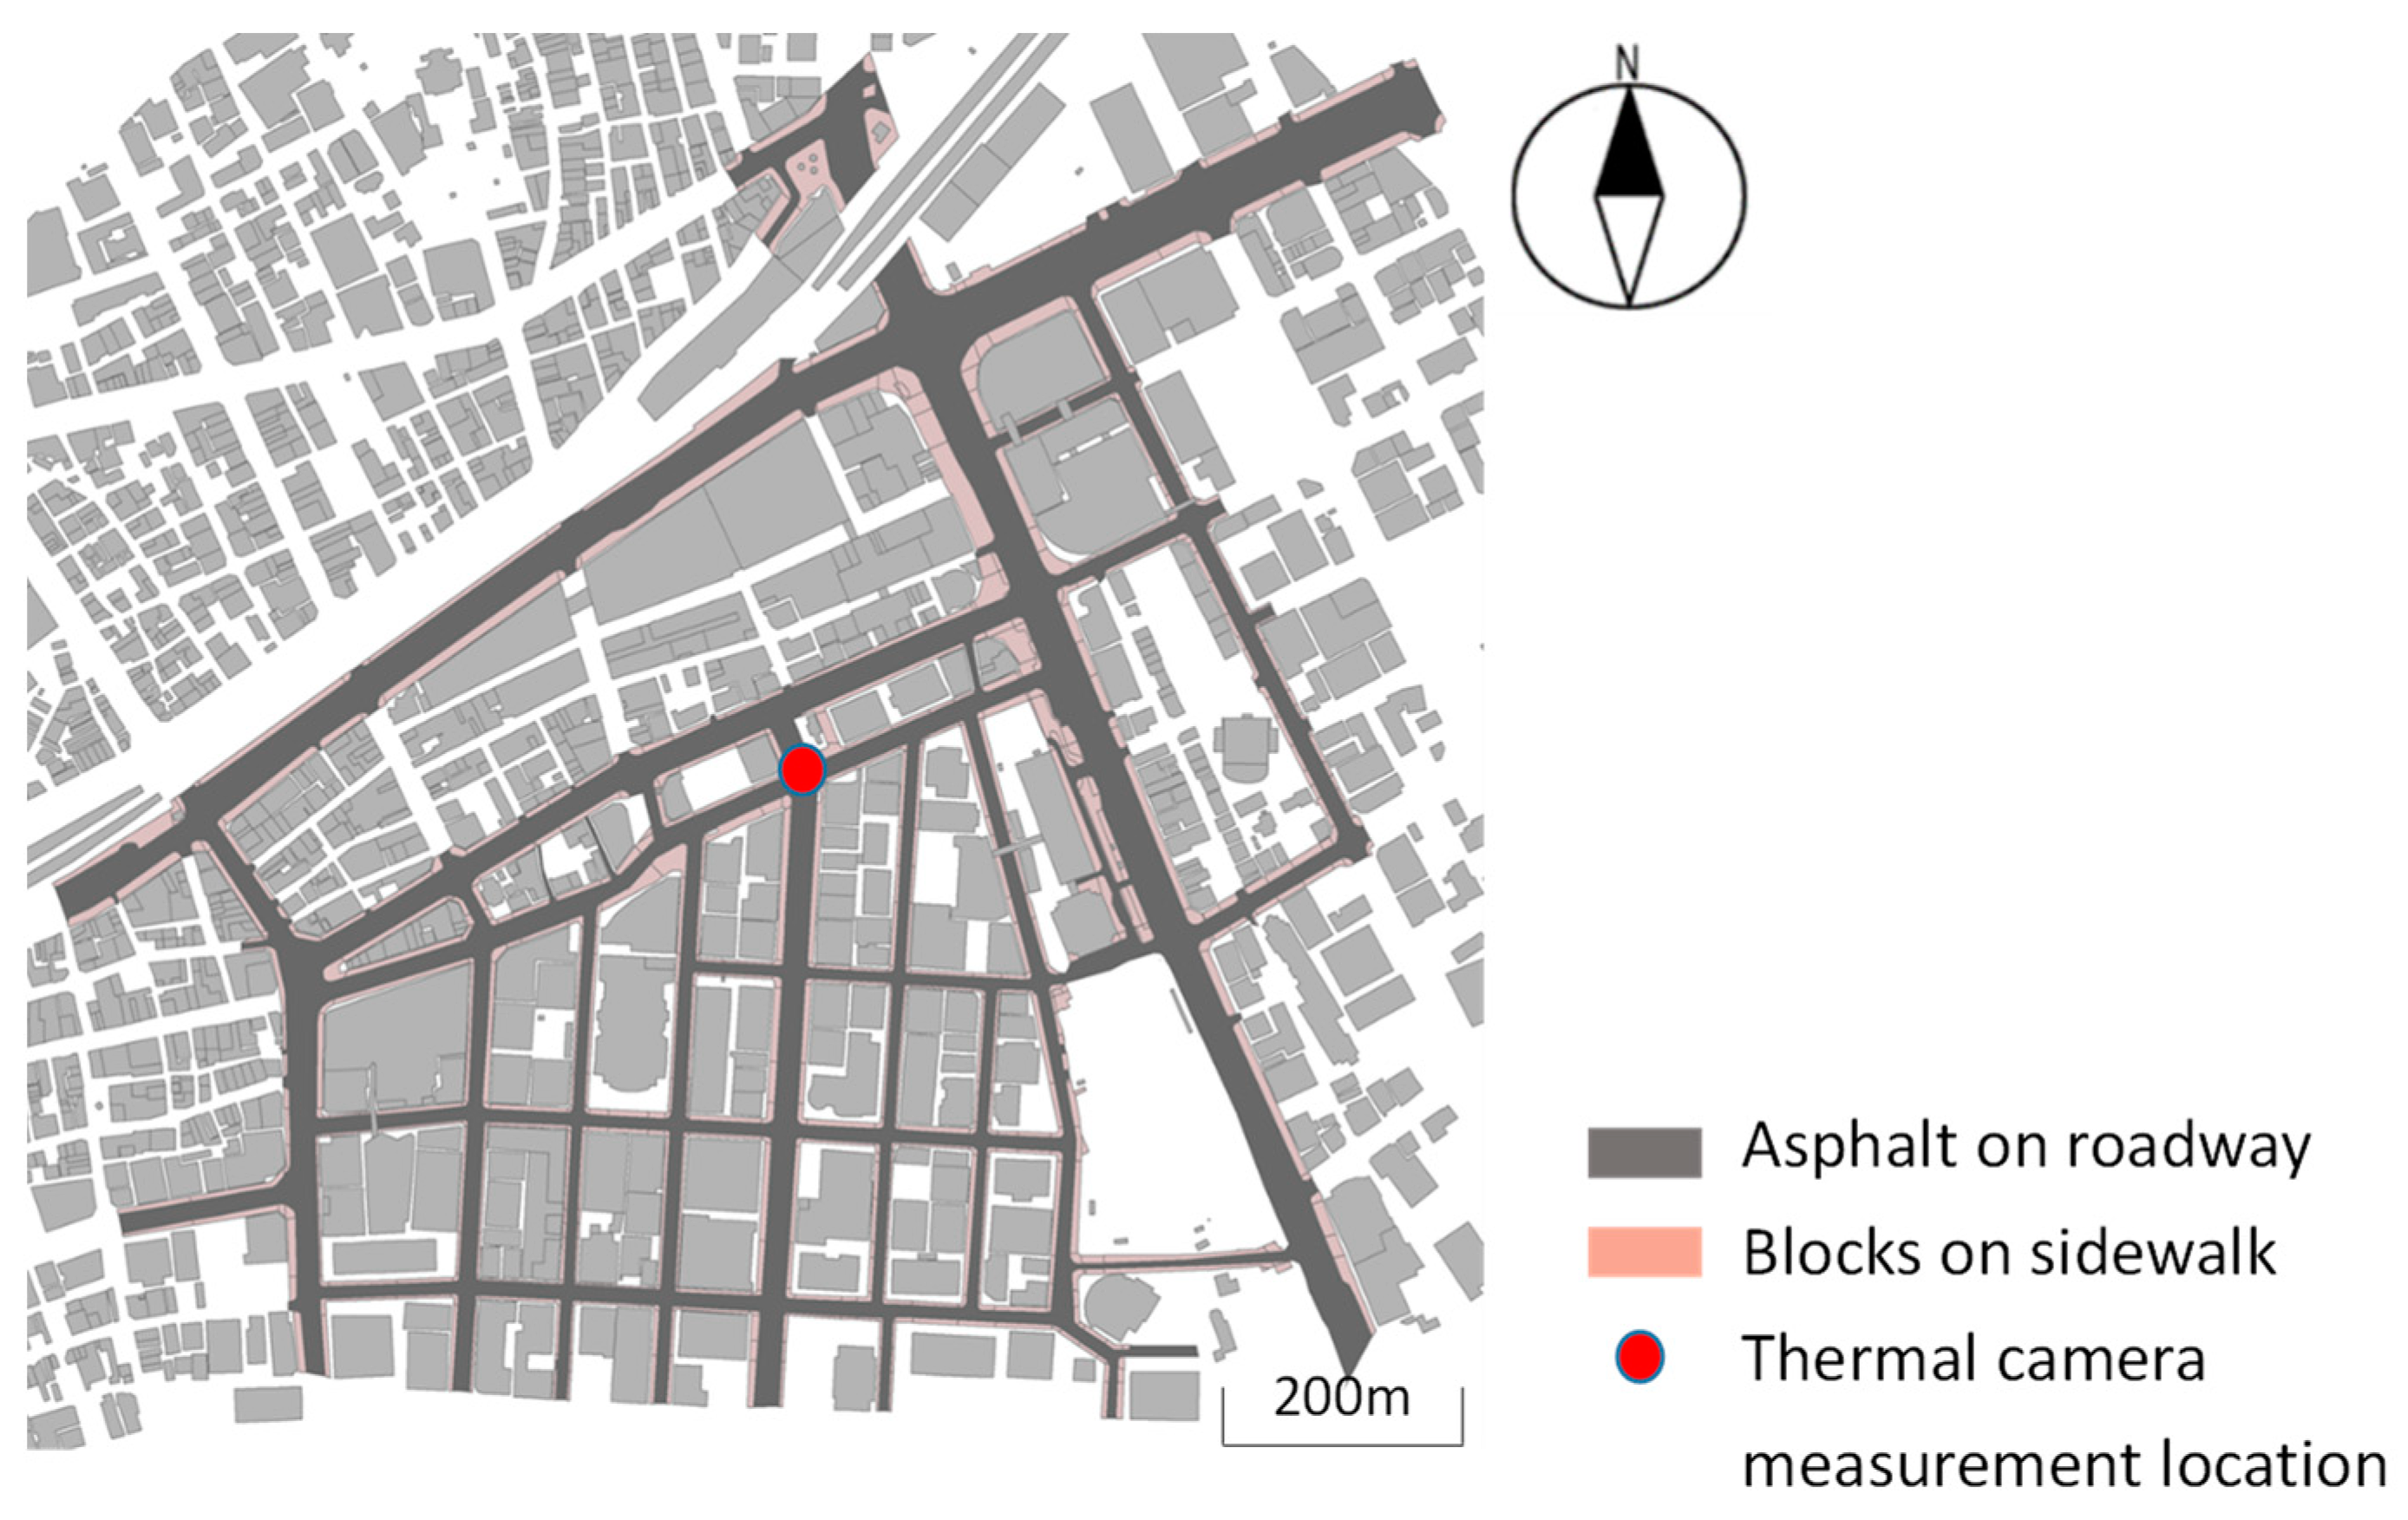
Figure 5.
Measured surface temperature decrease immediately after watering at 12:30 p.m. on the north and south lanes of the east–west road, excluding rainy days from July 22 to 4 September 2022. Each line represents a measuring day, and the blue and orange lines represent measuring points. These values were extracted from the results of continuous measurements using an infrared camera. The data show the surface temperature until it returns to the temperature before watering, but if it becomes discontinuous due to the shadow of surrounding buildings or the influence of other watering trucks, the display stops. (a) Sunny days (data from 17 watering events); (b) cloudy days (data from 13 watering events).
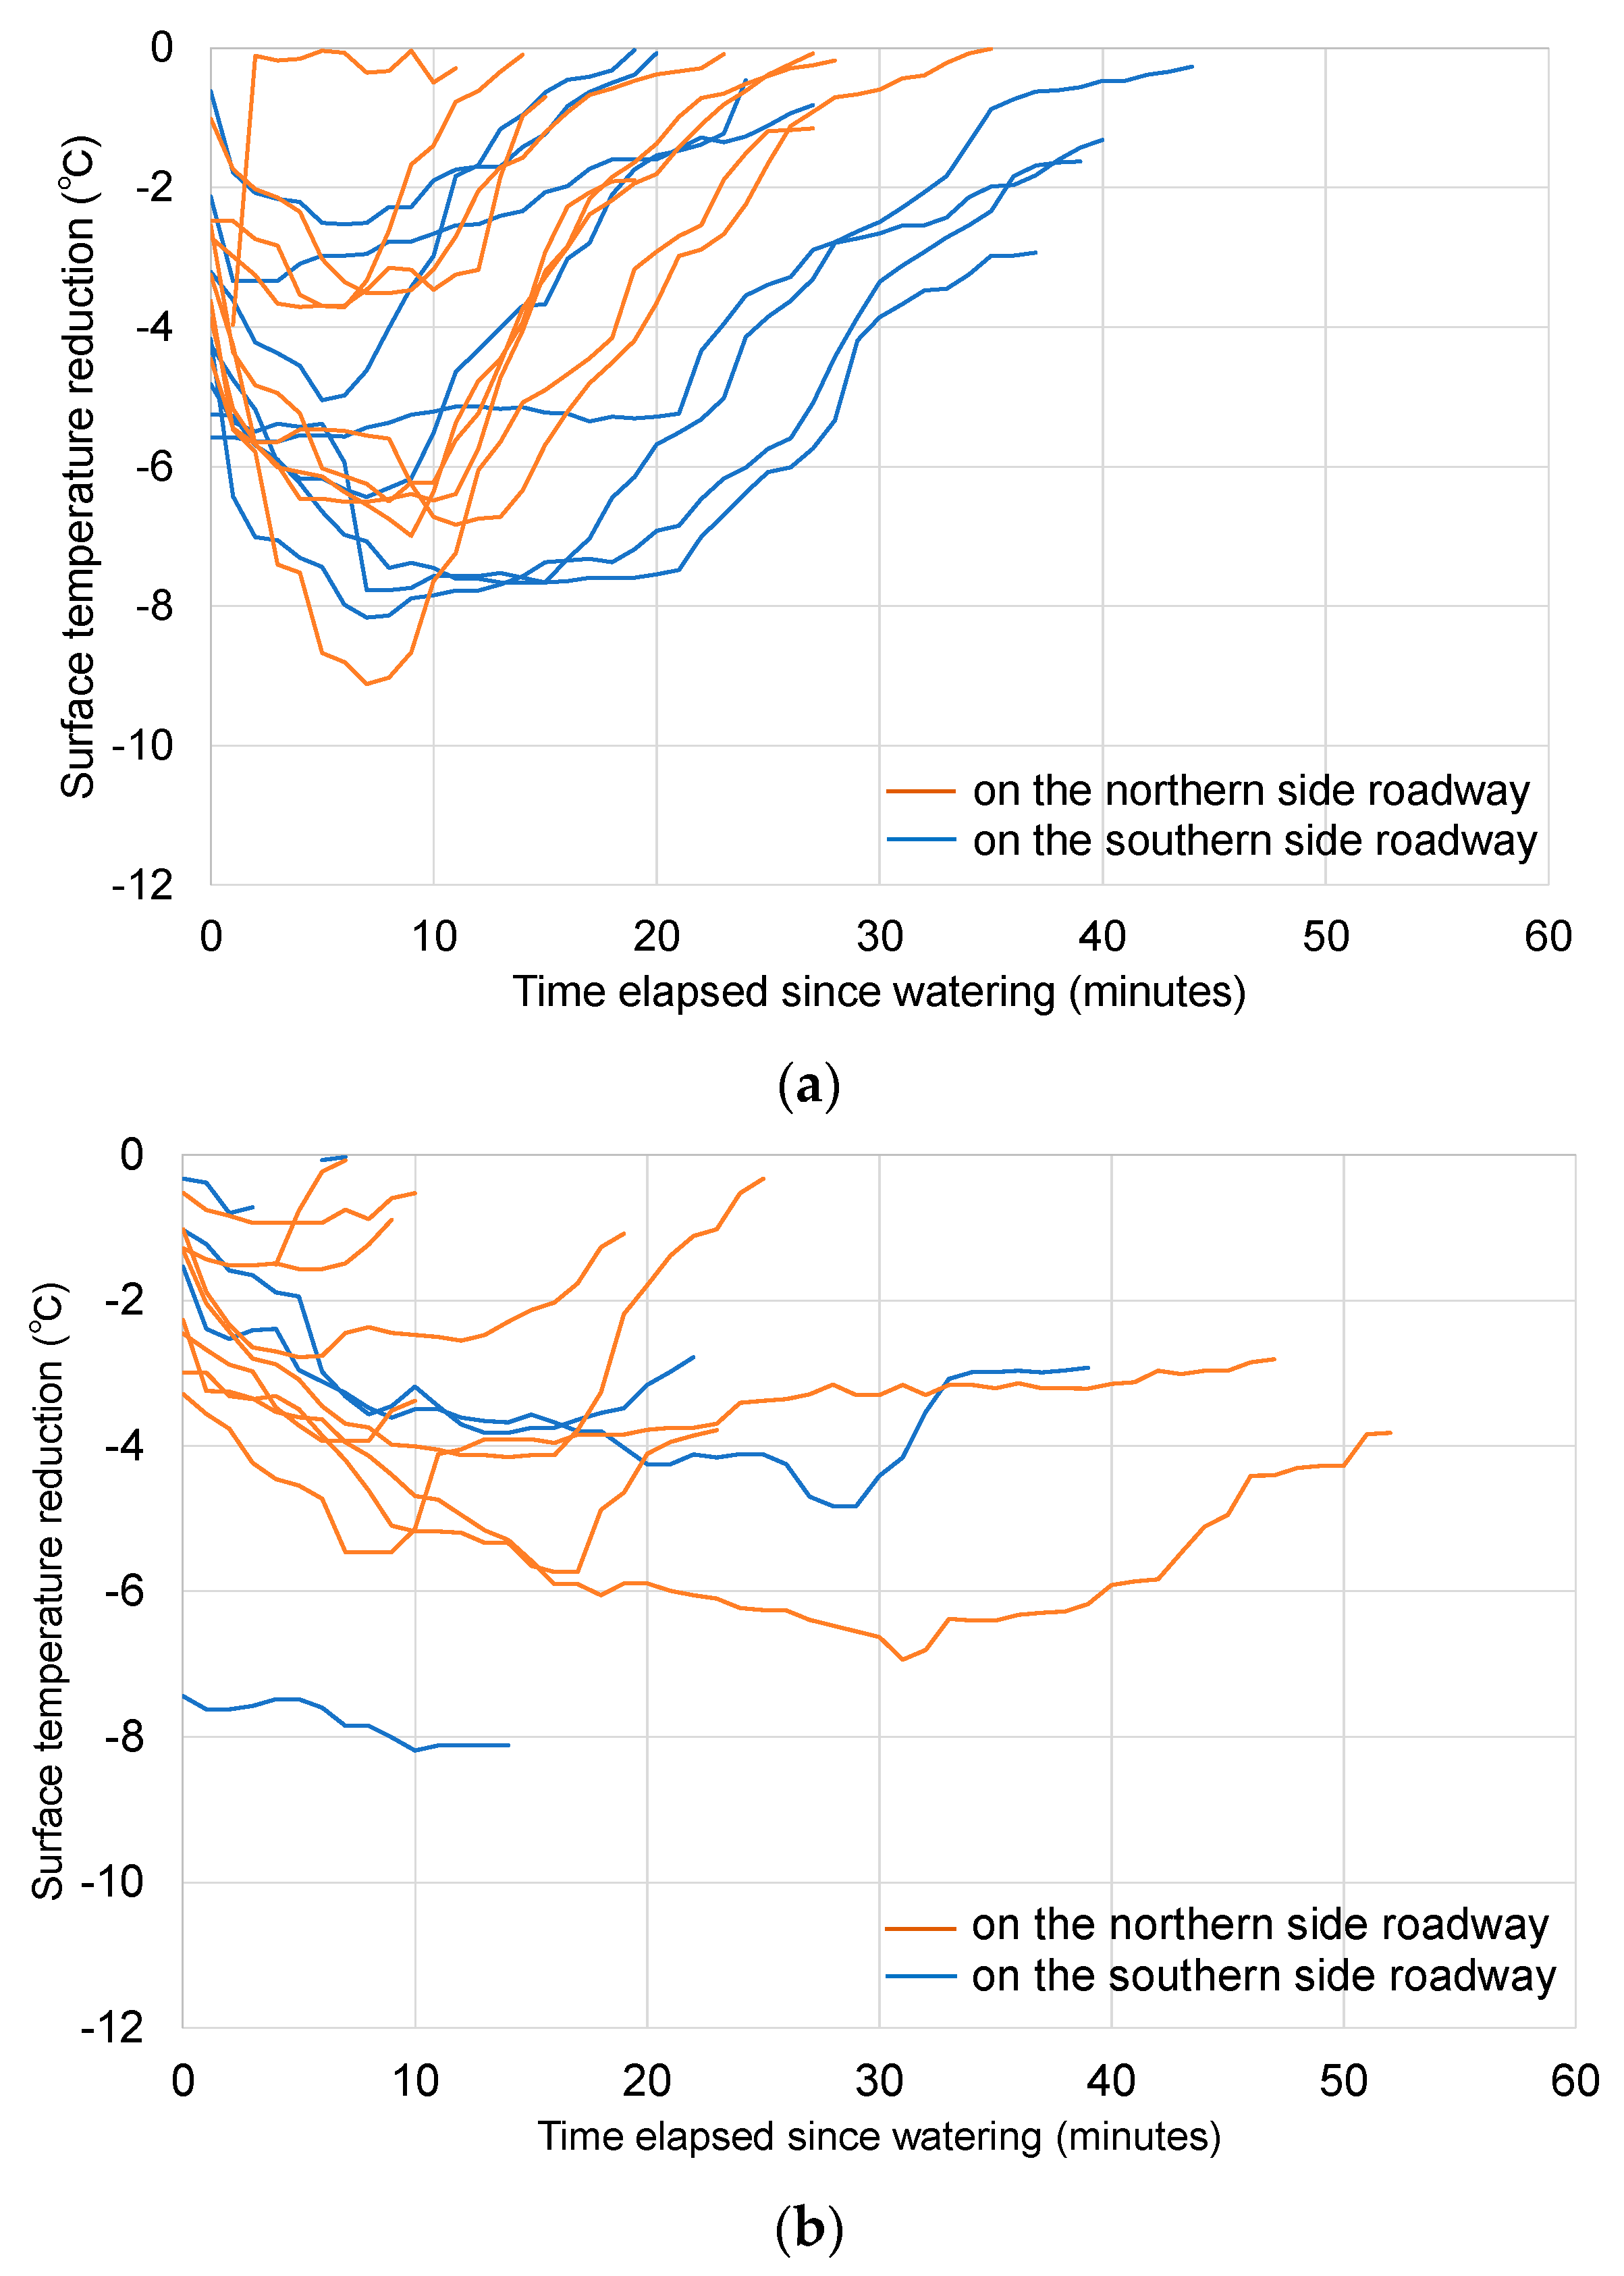
Figure 6.
Mean and standard deviation of measured surface temperature decrease immediately after watering at 9:00, 11:00, 12:30, 14:00, and 15:30 on the north and south lanes of the east–west road, excluding rainy days from July 2022 to 4 September 2022. (a) Sunny days at 9:00 (data from 6 watering events); (b) cloudy days at 9:00 (data from 5 watering events); (c) sunny days at 11:00 (data from 3 watering events); (d) cloudy days at 11:00 (data from 4 watering events); (e) sunny days at 12:30 (data from 17 watering events); (f) cloudy days at 12:30 (data from 13 watering events); (g) sunny days at 14:00 (data from 42 watering events); (h) cloudy days at 14:00 (data from 14 watering events); (i) sunny days at 15:30 (data from 21 watering events); (j) cloudy days at 15:30 (data from 7 watering events).
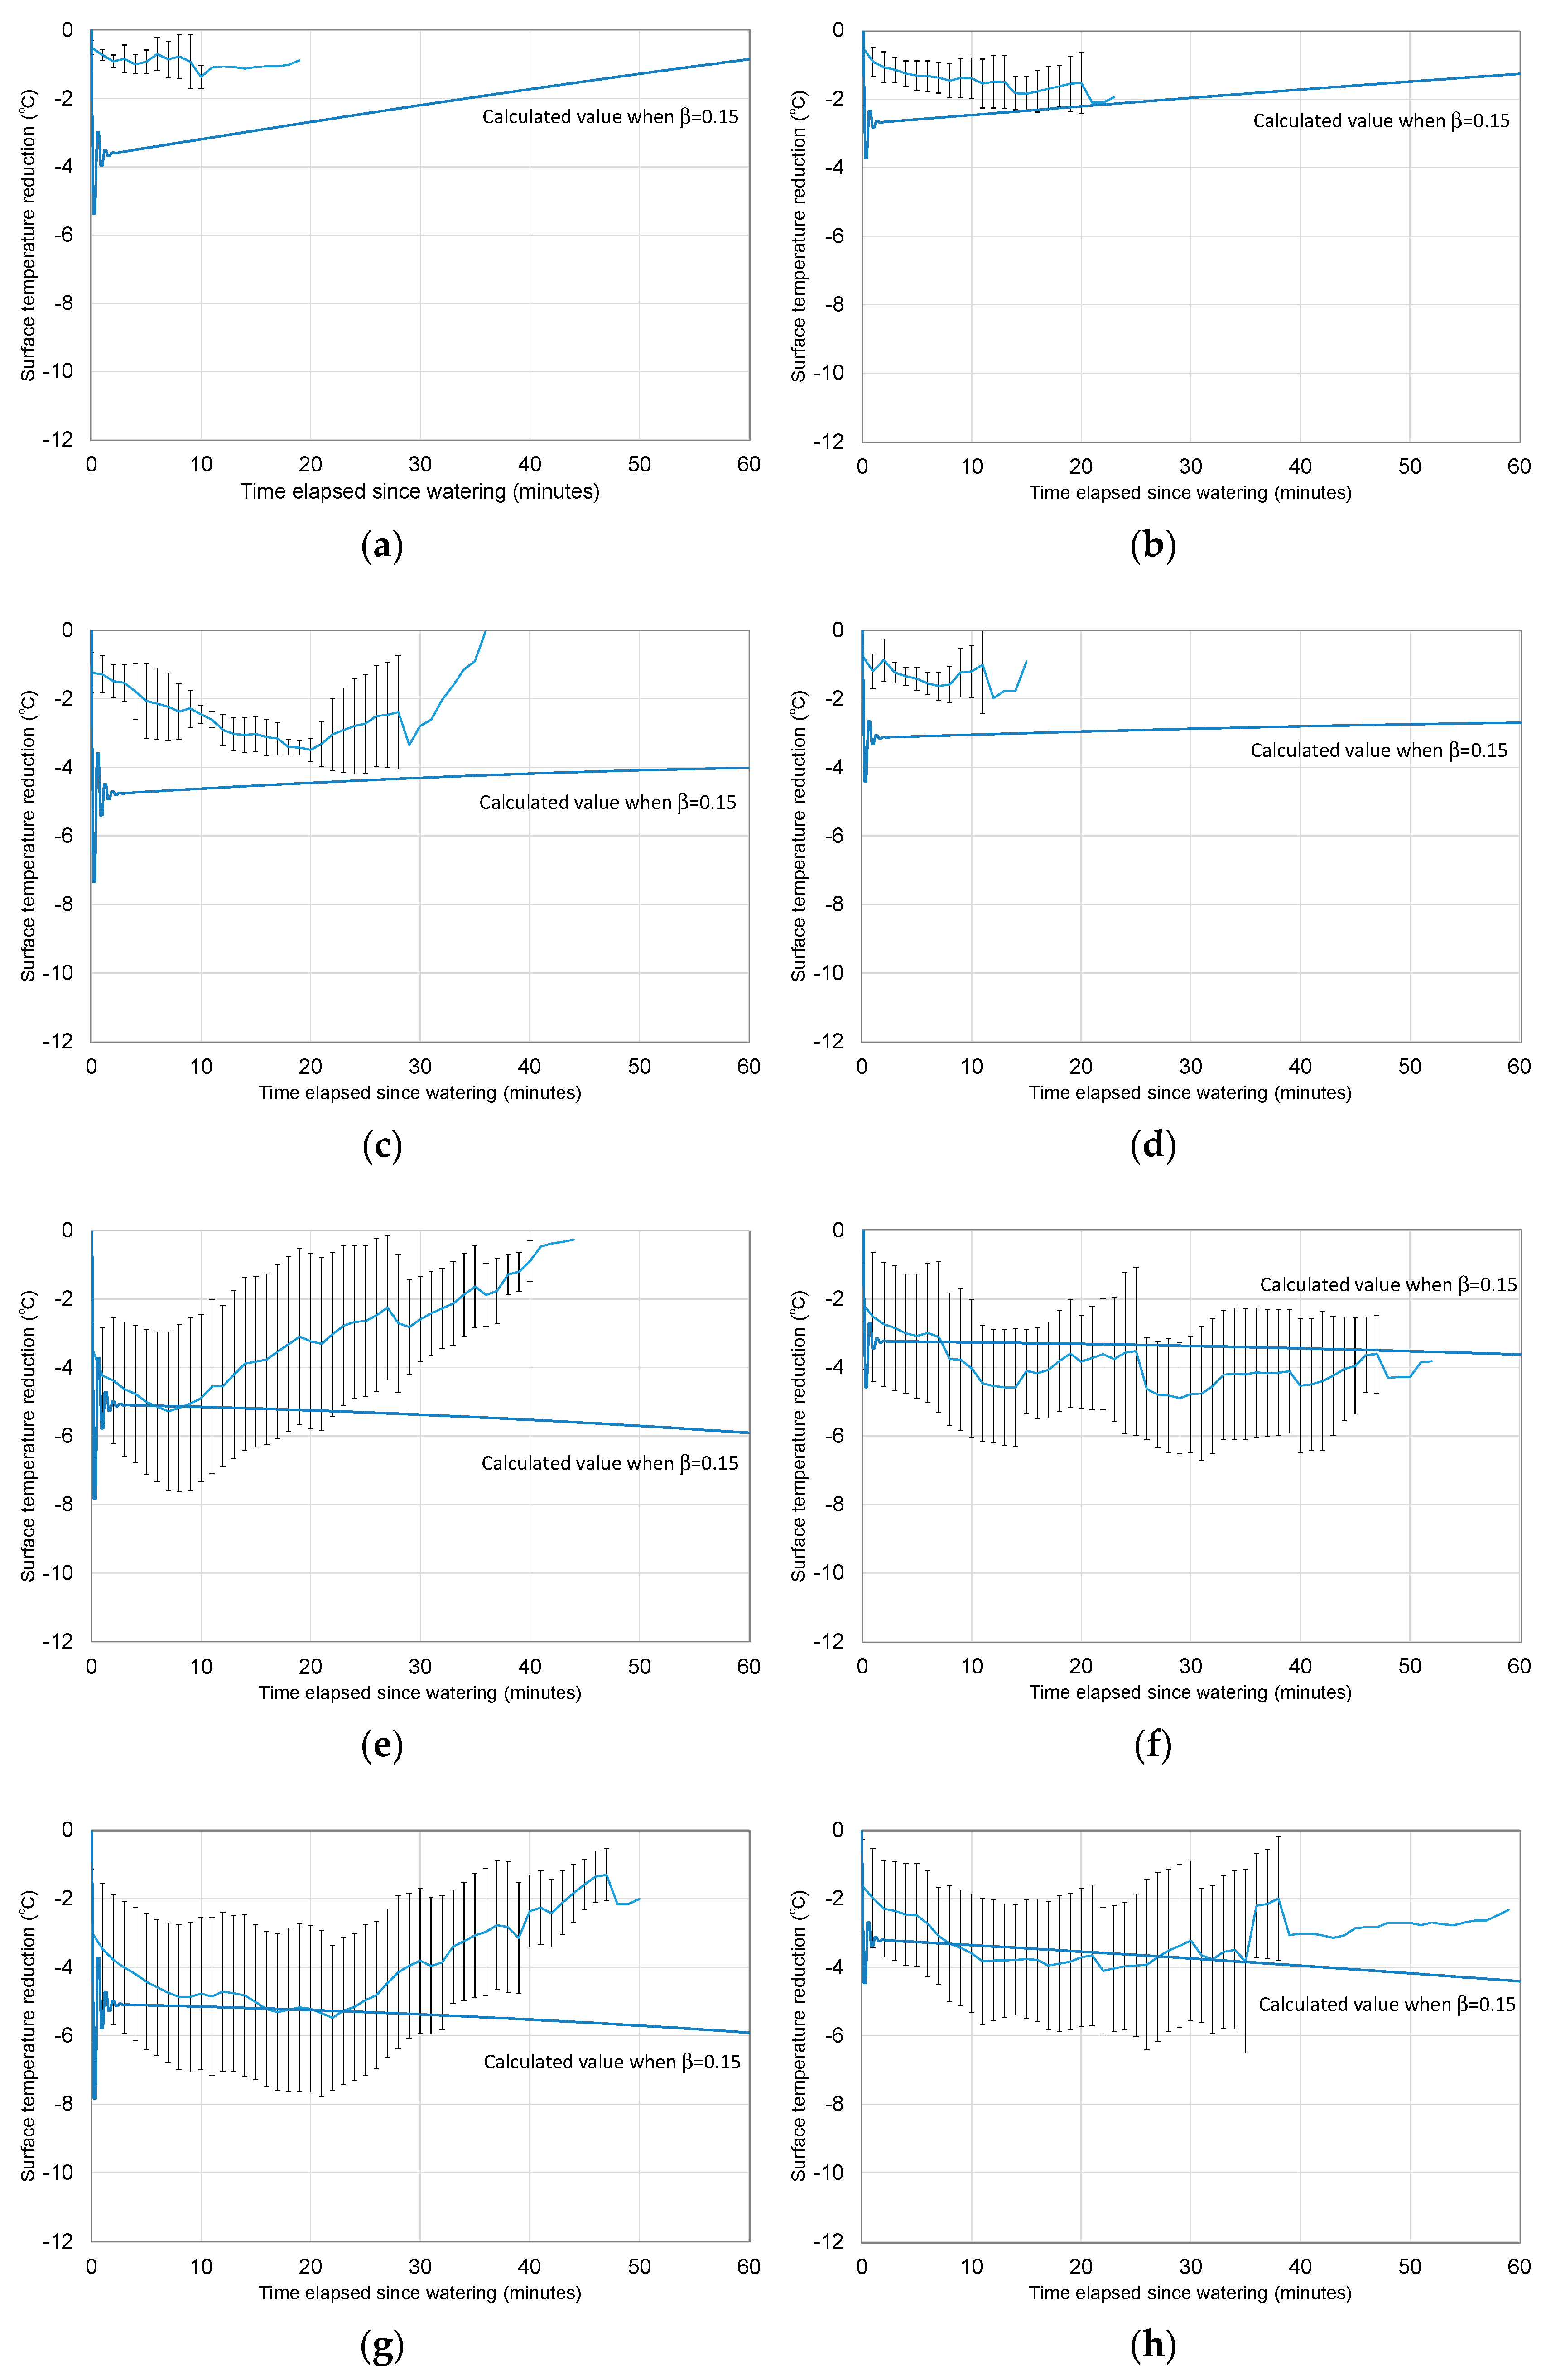
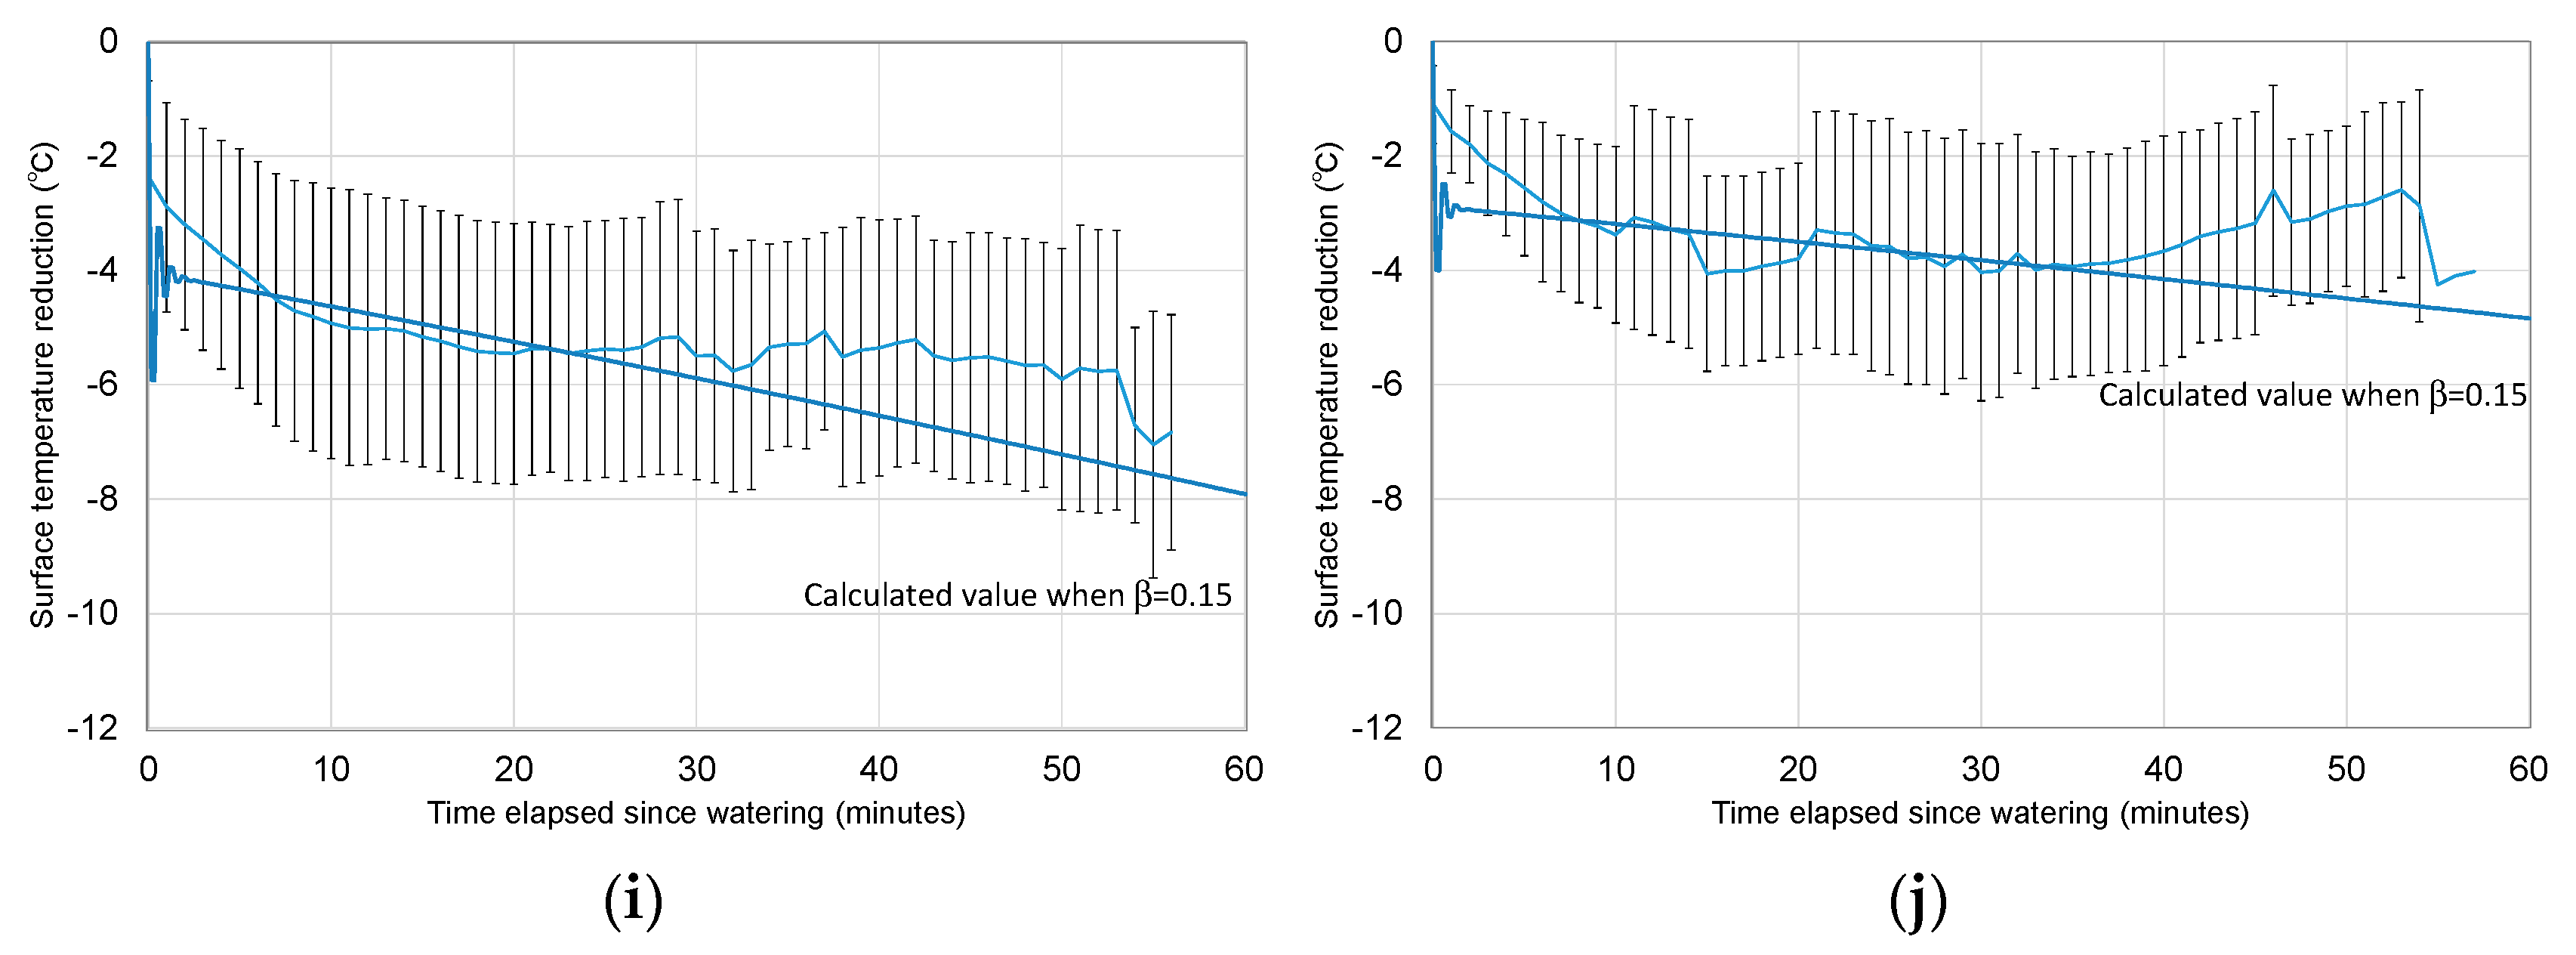
Figure 7.
An example of SET* distribution calculation results at 1.5 m high at 13:00 on 5 August 2020.
Figure 7.
An example of SET* distribution calculation results at 1.5 m high at 13:00 on 5 August 2020.
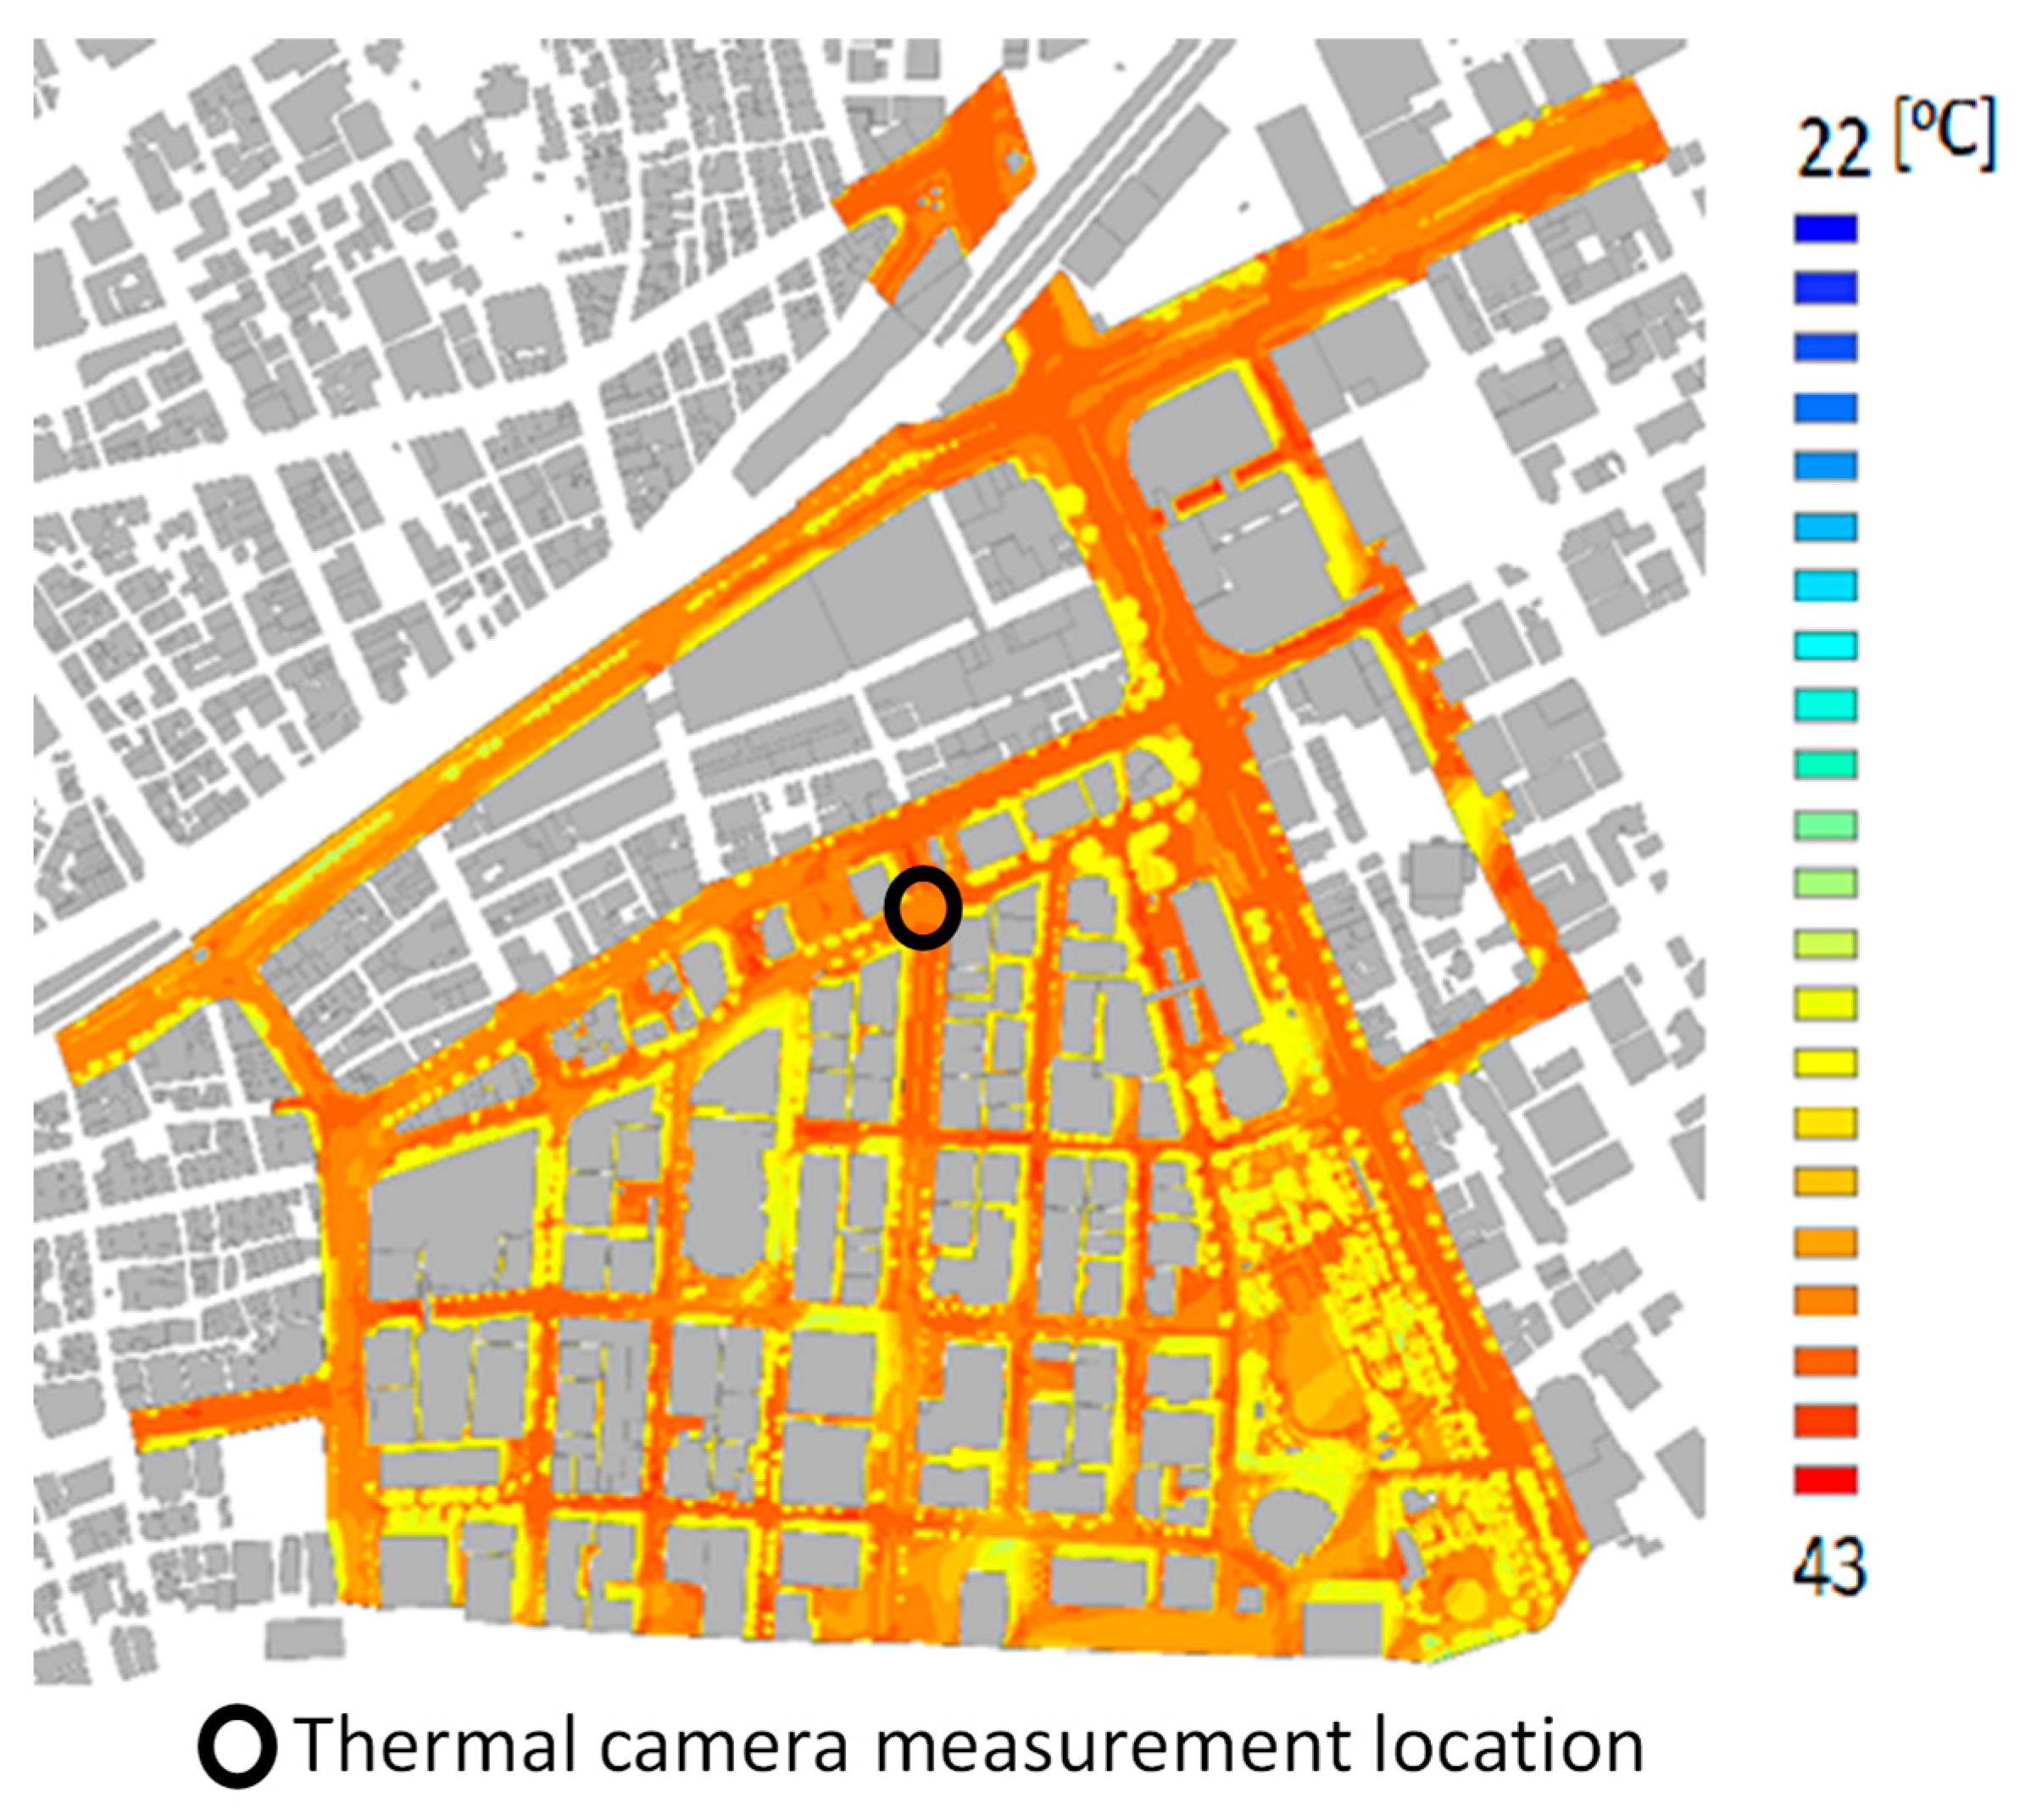
Figure 8.
Diurnal variations in spatial distribution frequency of SET* at 1.5 m high on the northern and southern sidewalks of east–west road on 5 August 2020. The left bar is without watering, the right bar is with watering. (a) On the northern sidewalk of east–west road; (b) on the southern sidewalk of east–west road.
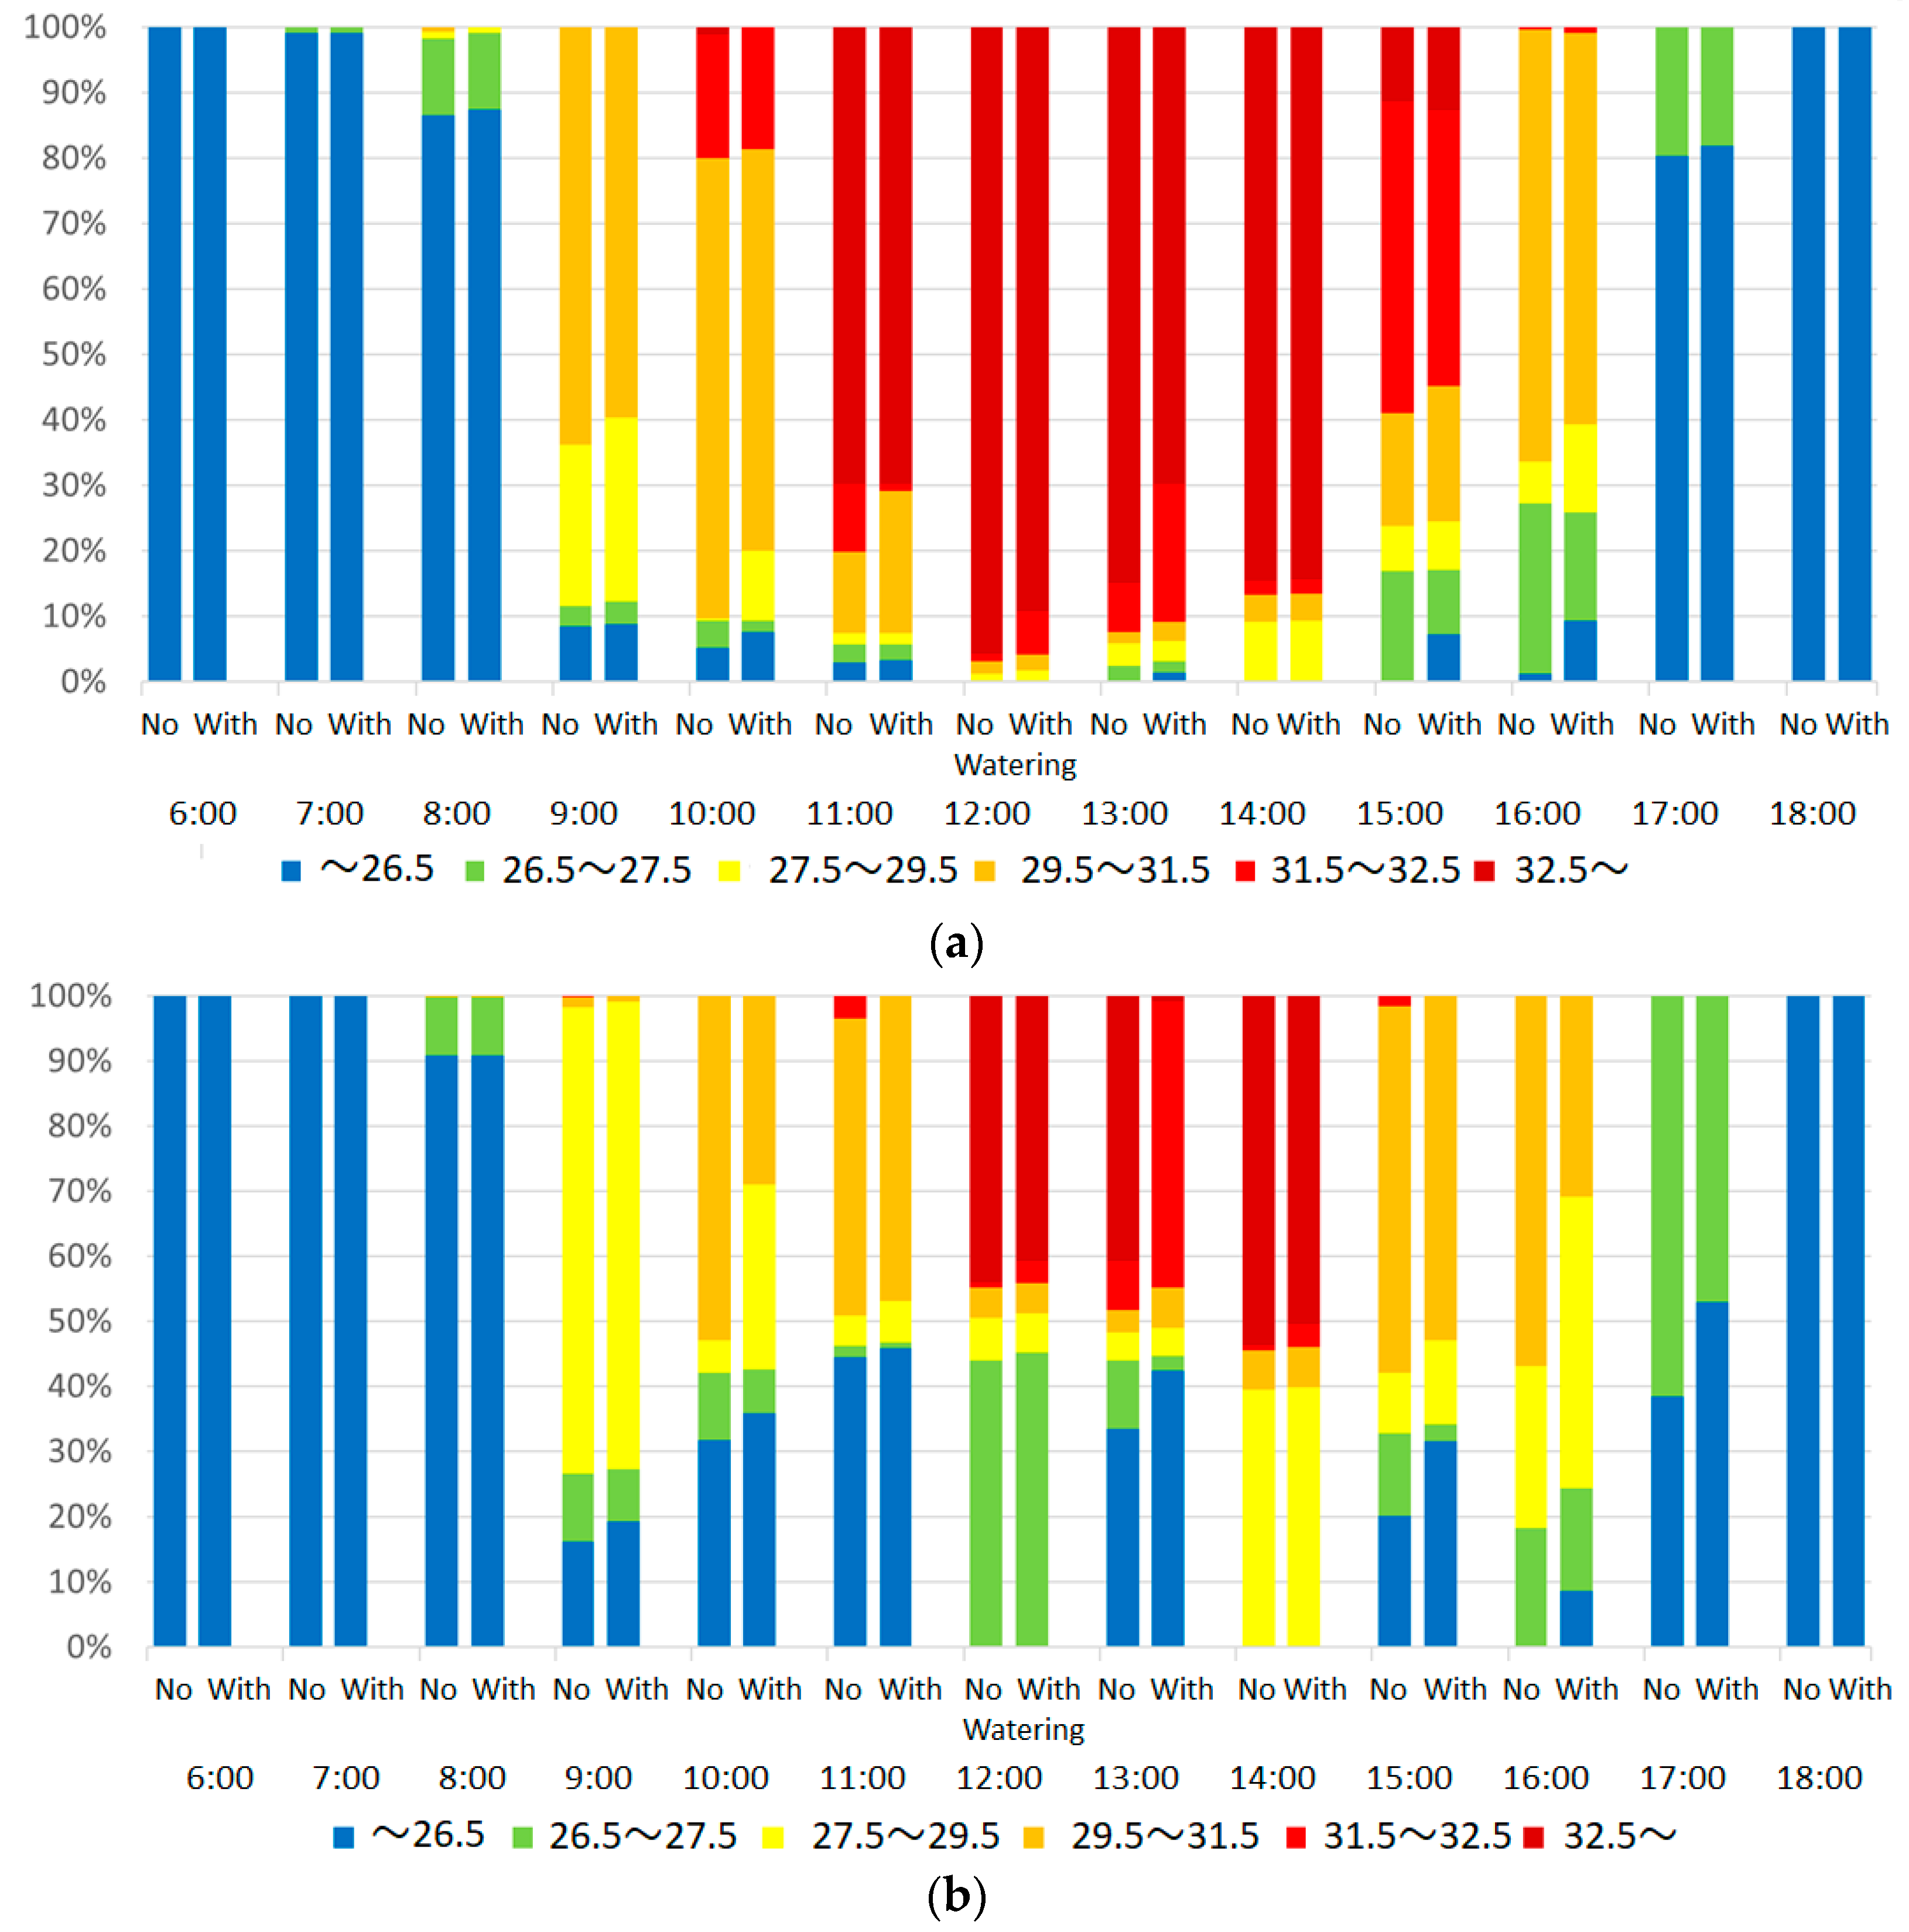
Figure 9.
Diurnal variations in spatial distribution frequency of SET* at 1.5 m high on the eastern and western sidewalks of north–south road on 5 August 2020. The left bar is without watering, the right bar is with watering. (a) On the eastern sidewalk of north–south road; (b) on the western sidewalk of north–south road.
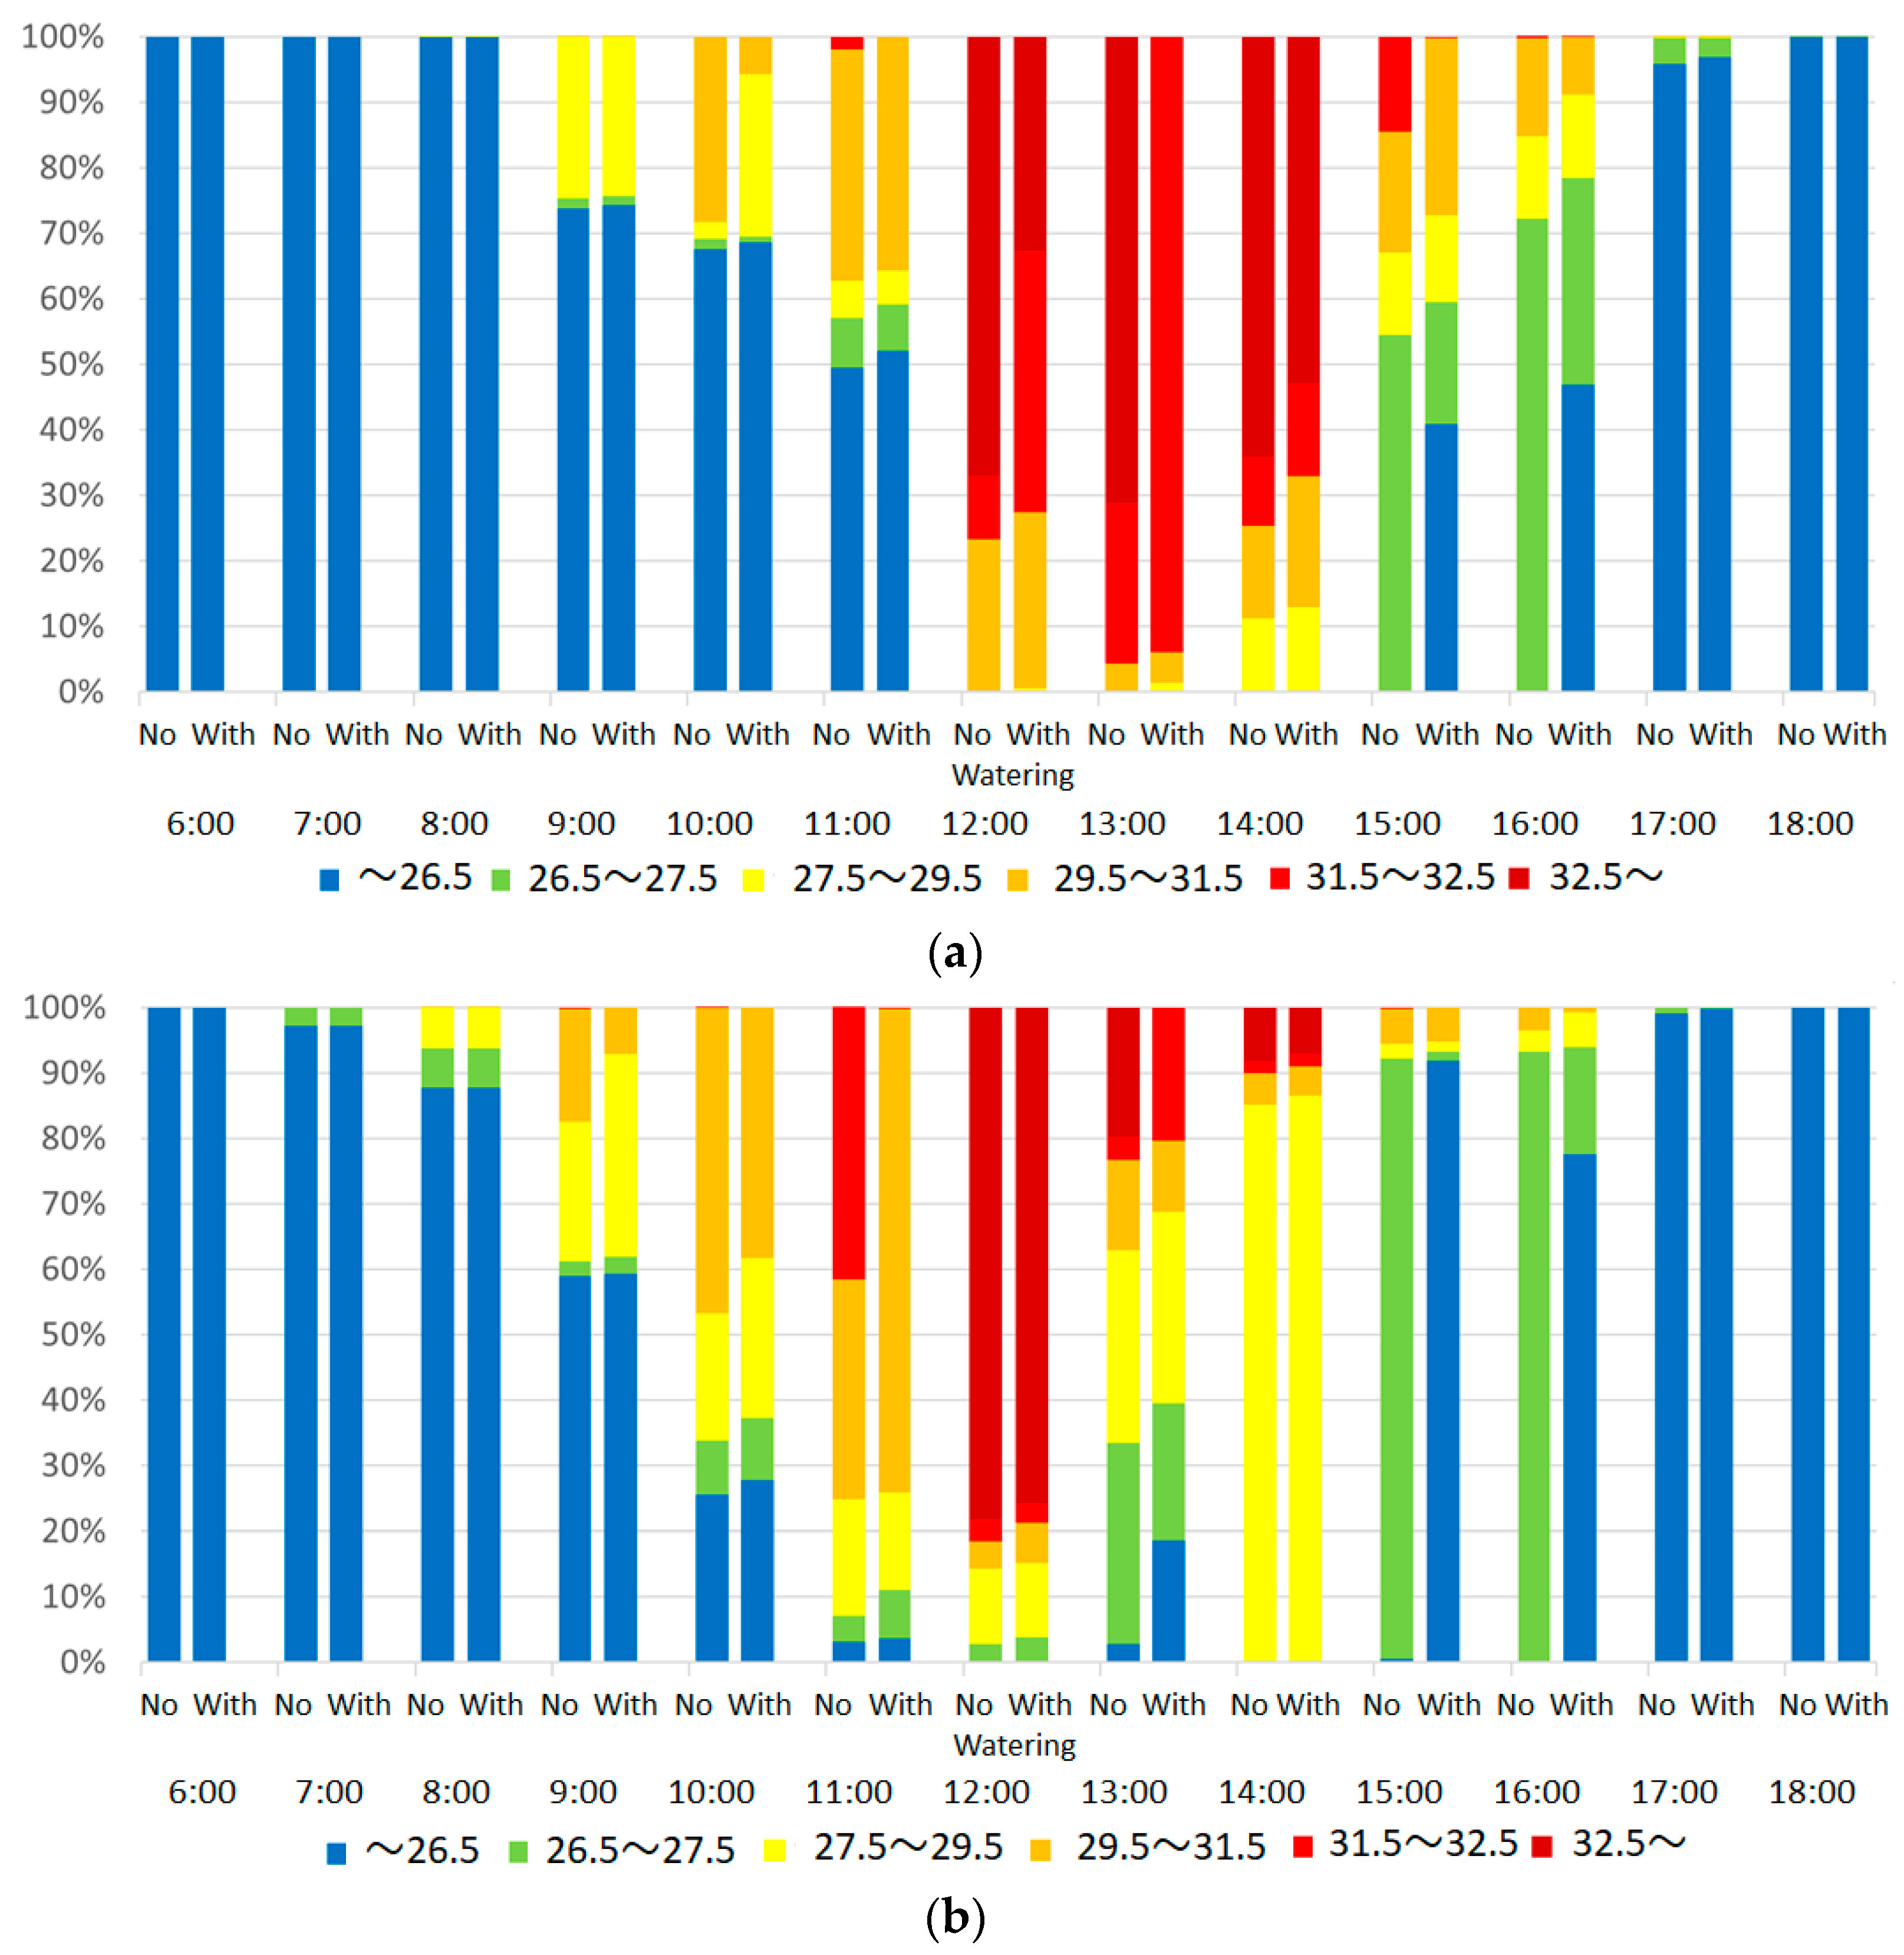
Figure 10.
The change in SET* on the sidewalk and roadway due to roadway watering at 10:00 (upper) and 16:00 (lower).
Figure 10.
The change in SET* on the sidewalk and roadway due to roadway watering at 10:00 (upper) and 16:00 (lower).

Table 1.
Parameters for surface heat budget equation and heat conduction equation.
| Solar Reflectance (-) | Evaporative Efficiency (-) | Heat Conductivity (W/(m K)) | Emissivity (-) | Thermal Capacity (kJ/(m3·K)) | |
|---|---|---|---|---|---|
| Concrete | 0.35 | 0.0 | 1.70 | 0.95 | 1934 |
| Asphalt | 0.15 | 0.0 | 0.74 | 1.00 | 2056 |
| Block | 0.30 | 0.0 | 1.40 | 0.90 | 2000 |
Table 2.
Amount and duration of the surface temperature decrease at each watering time. - means it could not be determined.
Table 2.
Amount and duration of the surface temperature decrease at each watering time. - means it could not be determined.
| Sunny Condition | Cloudy Condition | |||||||
|---|---|---|---|---|---|---|---|---|
| Decrease (°C) | Duration (Minutes) | Decrease (°C) | Duration (Minutes) | |||||
| Maximum | Average | Maximum | Average | Maximum | Average | Maximum | Average | |
| 9:00 | 1.6 | 1.0 | - | - | 2.4 | 1.7 | - | - |
| 11:00 | 3.8 | 3.5 | - | - | 2.0 | 1.7 | - | - |
| 12:30 | 9.1 | 5.7 | 37 | 26 | 8.2 | 3.9 | - | - |
| 14:00 | 9.7 | 5.9 | 31 | 24 | 8.2 | 4.0 | 40 | 34 |
| 15:30 | 10.4 | 6.7 | - | - | 7.3 | 4.6 | - | - |
Table 3.
Change in percentage of comfortable SET* (below 29.5 °C) due to roadway watering on east–west road.
Table 3.
Change in percentage of comfortable SET* (below 29.5 °C) due to roadway watering on east–west road.
| 10:00 | 16:00 | |
|---|---|---|
| Northern sidewalk | 10% to 20% (+10%) | 34% to 39% (+5%) |
| Southern sidewalk | 47% to 71% (+24%) | 43% to 69% (+26%) |
Table 4.
Change in percentage of comfortable SET* (below 29.5 °C) due to roadway watering on north–south road.
Table 4.
Change in percentage of comfortable SET* (below 29.5 °C) due to roadway watering on north–south road.
| 10:00 | 16:00 | |
|---|---|---|
| Eastern sidewalk | 72% to 94% (+22%) | 85% to 91% (+6%) |
| Western sidewalk | 53% to 62% (+9%) | 97% to 99% (+2%) |
Table 5.
Change in percentage of comfortable SET* (below 29.5 °C) due to roadway watering on north–south road at 10:00 and 16:00.
Table 5.
Change in percentage of comfortable SET* (below 29.5 °C) due to roadway watering on north–south road at 10:00 and 16:00.
| 10:00 | 16:00 | |||
|---|---|---|---|---|
| Sidewalk | Roadway | Sidewalk | Roadway | |
| Northern | 10% to 20% (+10%) | 0% to 2% (+2%) | 34% to 39% (+5%) | 0% to 8% (+8%) |
| Southern | 47% to 71% (+24%) | 0% to 6% (+6%) | 43% to 69% (+26%) | 0% to 6% (+6%) |
| Eastern | 72% to 94% (+22%) | 0% to 62% (+62%) | 85% to 91% (+6%) | 0% to 87% (+87%) |
| Western | 53% to 62% (+9%) | 0% to 54% (+54%) | 97% to 99% (+2%) | 0% to 92% (+92%) |
Disclaimer/Publisher’s Note: The statements, opinions and data contained in all publications are solely those of the individual author(s) and contributor(s) and not of MDPI and/or the editor(s). MDPI and/or the editor(s) disclaim responsibility for any injury to people or property resulting from any ideas, methods, instructions or products referred to in the content. |
© 2023 by the authors. Licensee MDPI, Basel, Switzerland. This article is an open access article distributed under the terms and conditions of the Creative Commons Attribution (CC BY) license (https://creativecommons.org/licenses/by/4.0/).
Share and Cite
MDPI and ACS Style
Takebayashi, H.; Mori, H.; Tozawa, U. Study on An Effective Roadway Watering Scheme for Mitigating Pedestrian Thermal Comfort According to the Street Configuration. Atmosphere 2023, 14, 1014. https://doi.org/10.3390/atmos14061014
AMA Style
Takebayashi H, Mori H, Tozawa U. Study on An Effective Roadway Watering Scheme for Mitigating Pedestrian Thermal Comfort According to the Street Configuration. Atmosphere. 2023; 14(6):1014. https://doi.org/10.3390/atmos14061014
Chicago/Turabian StyleTakebayashi, Hideki, Hiroyuki Mori, and Ushio Tozawa. 2023. "Study on An Effective Roadway Watering Scheme for Mitigating Pedestrian Thermal Comfort According to the Street Configuration" Atmosphere 14, no. 6: 1014. https://doi.org/10.3390/atmos14061014
Note that from the first issue of 2016, this journal uses article numbers instead of page numbers. See further details here.