Article

Effects of Aerosol Number Concentration and Updraft Velocity on Relative Dispersion during the Collision–Coalescence Growth Stage of Warm Clouds

1
Institute of Public Security Governance, Emergency Management School, Nanjing University of Information Science and Technology, Nanjing 210044, China
2
Key Laboratory for Aerosol-Cloud-Precipitation of China Meteorological Administration, Nanjing University of Information Science and Technology, Nanjing 210044, China
3
Zhongshan Meteorological Service, Zhongshan 528400, China
4
Weather Modification Office, Meteorological Disasters Defense Technology Center, Meteorological Bureau of Shanxi Province, Taiyuan 030032, China
*
Author to whom correspondence should be addressed.
Atmosphere 2023, 14(5), 828; https://doi.org/10.3390/atmos14050828
Submission received: 6 February 2023 / Revised: 11 April 2023 / Accepted: 21 April 2023 / Published: 4 May 2023
(This article belongs to the Special Issue Atmospheric Ice Nucleating Particles, Cloud and Precipitation)

Abstract

:
Relative dispersion (ɛ) is a key expression used to parameterize various cloud processes in global circulation models (GCMs) and meteorological mesoscale models. Aerosols, updraft velocity (w), and different growth stages of warm clouds are known to affect relative dispersion. A two-dimensional detailed bin microphysical cloud model is used to investigate the combined impacts of aerosol number concentration (Na) and updraft velocity on relative dispersion in the collision–coalescence stage. In addition, the causes potentially controlling the changes in ɛ with updraft velocity are explored. There are three main influence regimes: the updraft velocity main influence regime, the aerosol main influence regime, and the joint influence regime. The cause of the variations in ɛ with updraft velocity is found to be different in the three main influence regimes. In the updraft velocity main influence regime, vigorous collision–coalescence due to stronger w results in a shift in the cloud droplet number concentration spectrum toward larger droplets, and the average cloud droplet radius increases, but the spectral width is less variable, so ε decreases. In the joint influence regime, stronger cloud droplet evaporation due to the stronger dragging effect of large cloud droplets widens the spectrum, mainly by reducing the cloud droplet number concentration (Nc) of 4–30 μm, and ε increases with the reduction in w. In the aerosol main influence regime, the strongest dragging effect reduces Nc at all radii with decreasing w, and the cloud droplet number concentration spectrum (CDNCS) narrows, which becomes the formation mechanism of the positive correlation between ε and w. Evaporation mainly causes a negative correlation between ε and Nc, but weak evaporation causes the correlation to become positive under the background of high aerosol concentration. At low aerosol concentrations, a strong collision–coalescence effect leads to a negative correlation between Nc and ε, but at high aerosol concentrations, the correlation is the opposite due to a weak collision–coalescence effect.

1. Introduction

Aerosols affect cloud albedo and lifetime, which are referred to as the first and second aerosol indirect effects [1]. The cloud number concentration effect [2] and dispersion effect [3] are included in the first aerosol indirect effect. Atmospheric observations suggest that the first aerosol–cloud indirect effect can be enhanced or suppressed by the dispersion effect [4,5,6,7,8,9,10,11,12].
Relative dispersion, defined as the ratio of the standard deviation (σ) to the mean radius (rc) of cloud droplets, is an important parameter for studying the dispersion effect [3]. Some previous studies assumed that ε was a constant and focused mainly on the effects of the liquid water content (LWC) and Nc. Consequently, the effects of ε were largely ignored when quantifying the first indirect effects of aerosols [1,13]. However, recent studies have shown that ε has a major impact on the assessment of the first indirect effects of aerosols [6,9,14,15,16,17]. Changes in Na can affect ε and are referred to as aerosol dispersion effects or spectral effects [11]. Wang [15] found that ε first increases and then decreases with an increase in Na, which provides observational evidence for numerical simulations in the recent literature. Ghan et al. [16] suggested that nearly half of the aerosol indirect radiative forces were caused by changes in the cloud droplet size distribution. Peng and Lohmann [9] found that an increase in Na can potentially lead to changes in ε. Liu and Daum [6] analyzed measurements of marine clouds under clean and polluted conditions and pointed out that the increase in Nc and ε due to an increase in Na can offset the Twomey effect by 10–80%. Therefore, it is necessary to provide detailed descriptions of the dispersion effects to obtain cloud albedo accurately and evaluate the indirect climatic effects more precisely.
Many studies have indicated that additional factors affect ε, including aerosols [18,19], vertical velocities and entrainment effects [8,17,19,20,21,22,23], and various microphysical processes [24,25]. Liu et al. [22] found that ε was negatively correlated with w. It was observed that ε became larger in weak updraft or downdraft zones (w less than or equal to 2 m/s) due to strong evaporation effects and became smaller in strong rising air regimes, where condensation effects are dominant [23]. Lu and Seinfeld [24] stated that Nc decreased but ε increased during collision–coalescence processes and that collision–coalescence processes were enhanced when aerosol concentrations were low. Chen et al. [19] explored the effects of w and Na on ε during warm cloud nucleation and condensation processes and found that ε showed different characteristics in different configurations of aerosol and updraft velocity. Chandrakar et al. [20] identified ε independent of Nc for a non-precipitating cloud in a controlled laboratory environment by creating a turbulent cloud. Kumar et al. [17] investigated the effect of entrainment and turbulent mixing on cloud microphysics using direct numerical simulations of turbulent mixing followed by droplet evaporation at the cloud–clear air interface in a meter-sized volume using an ensemble of up to almost half a billion individual cloud droplets. The shape of the droplet size distribution varied significantly with the spatial scale. Enhancement of ε during the transient mixing process is strongly dependent on the scale of the mixing. Using the digital in-line holography technique, Desai et al. [25] obtained variations in Nc and droplet diameter in marine boundary layer clouds. They considered stochastic condensation to be one of the mechanisms causing the broadening of the CDNCS and breaking in the bottleneck of droplet growth that are attributable to diffusion and collision–coalescence. Stochastic condensation can result in increasing ε and droplet diameters with decreasing Nc.
Based on the current state of research, the effects of the joint dependence of aerosol and updraft velocity on ε have not been explored in warm clouds using a bin model including detailed microphysics processes. Therefore, we accurately performed such research by changing Na based on a bin cloud model considering condensation and evaporation and collision–coalescence microphysical processes to obtain the characteristics and formation mechanism of ε and provide background support for the assessment of aerosol indirect climate effects.

2. Description of the Model and Simulation Setup

2.1. The Model Description

A two-dimensional axis symmetrical nonhydrostatic cloud model developed by Tel Aviv University in Israel was used in this study [26]. The model used a vorticity equation and fluid function to solve the radial and vertical wind calculations, and the mass and number concentrations (e.g., for water droplets, ice, snow, and graupel), potential temperature levels, and CCN concentrations were successfully predicted. The microphysical processes of warm clouds include activation, condensation, evaporation, collision–coalescence, breakup, and sedimentation mechanisms. Each hydrometeor was divided into 34 bins, with the second bin having twice the mass of the first, and so on. The aerosol number concentration size distributions were divided into 57 bins, and the minimum was set to 0.0041 μm.

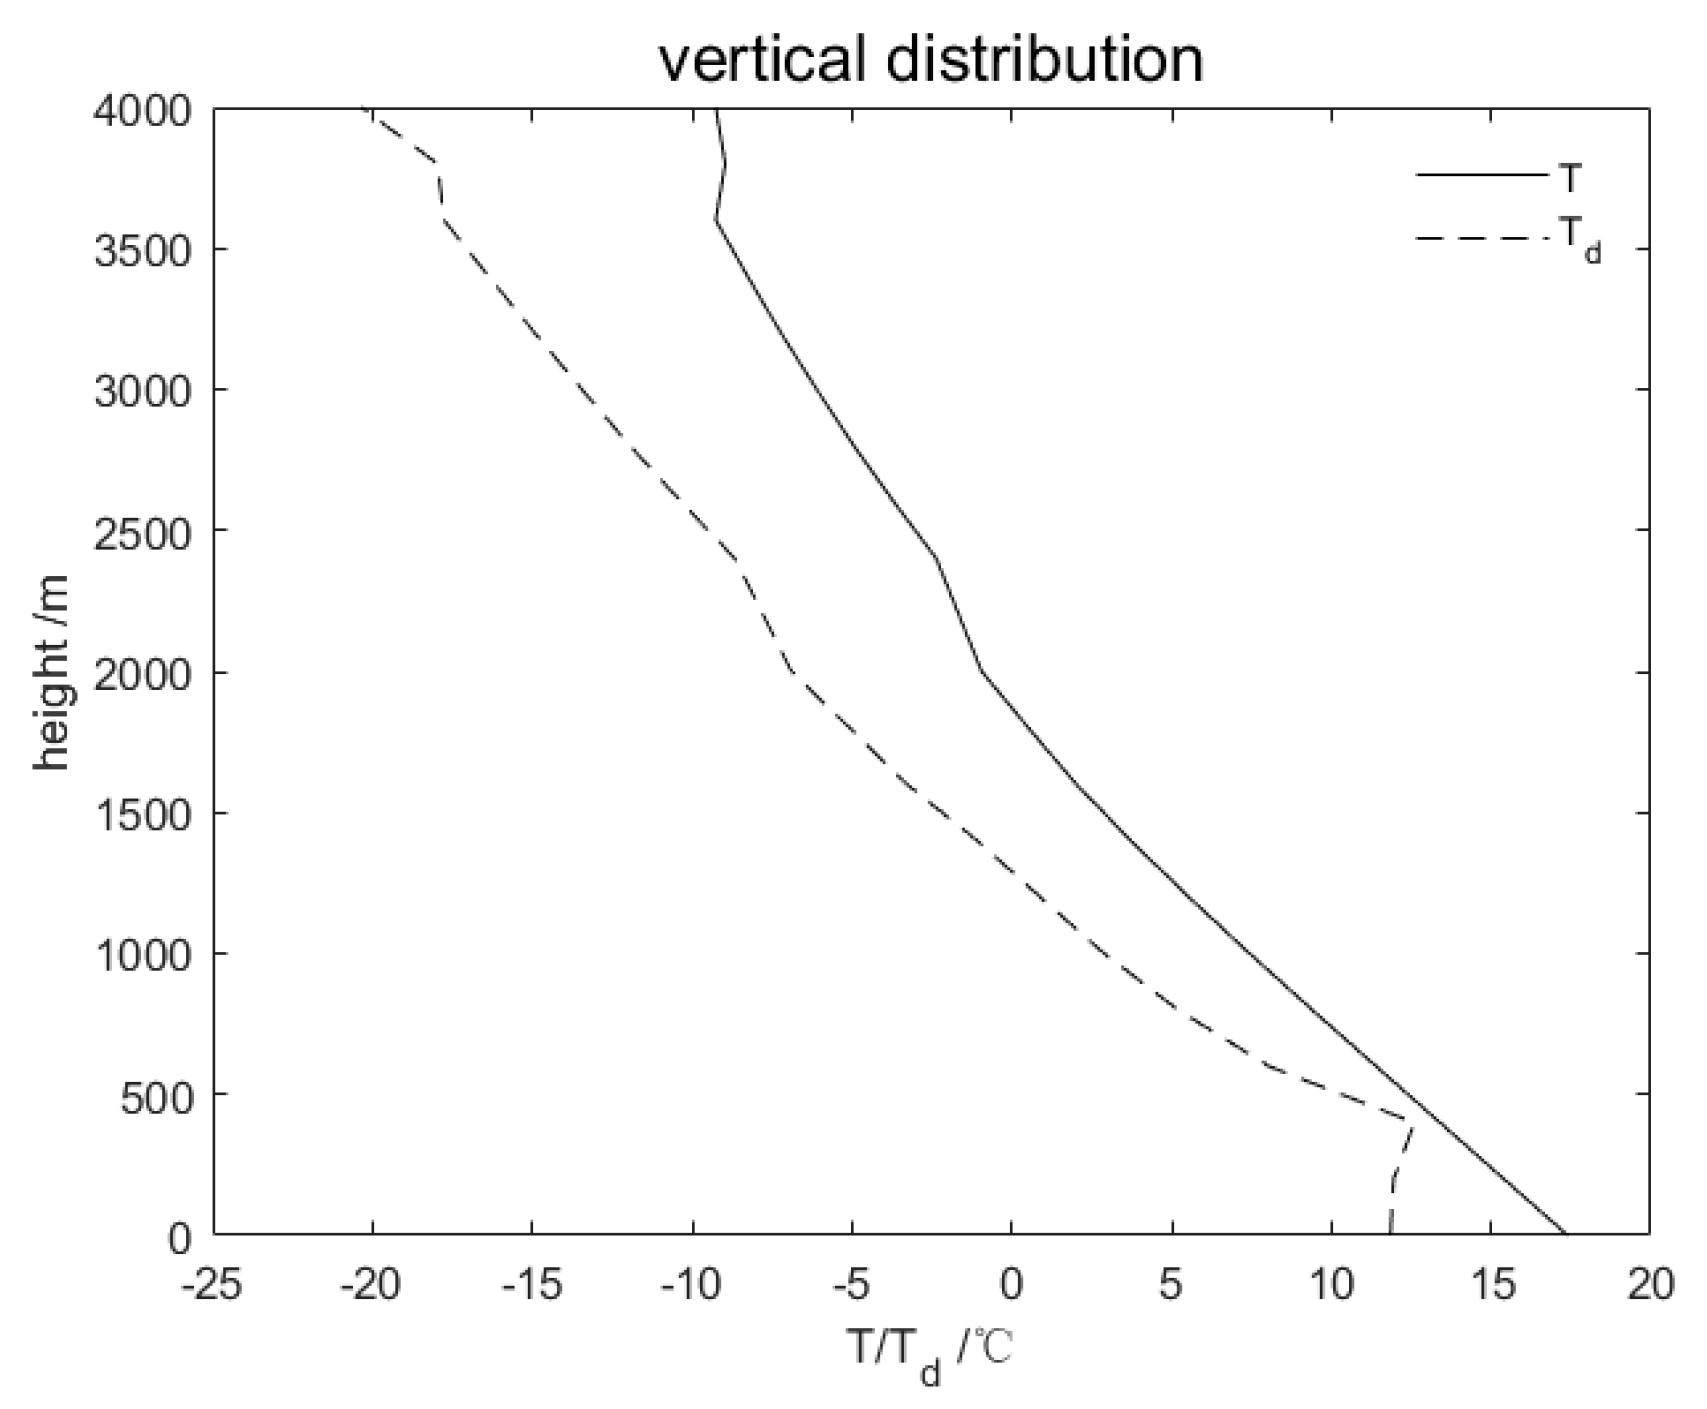
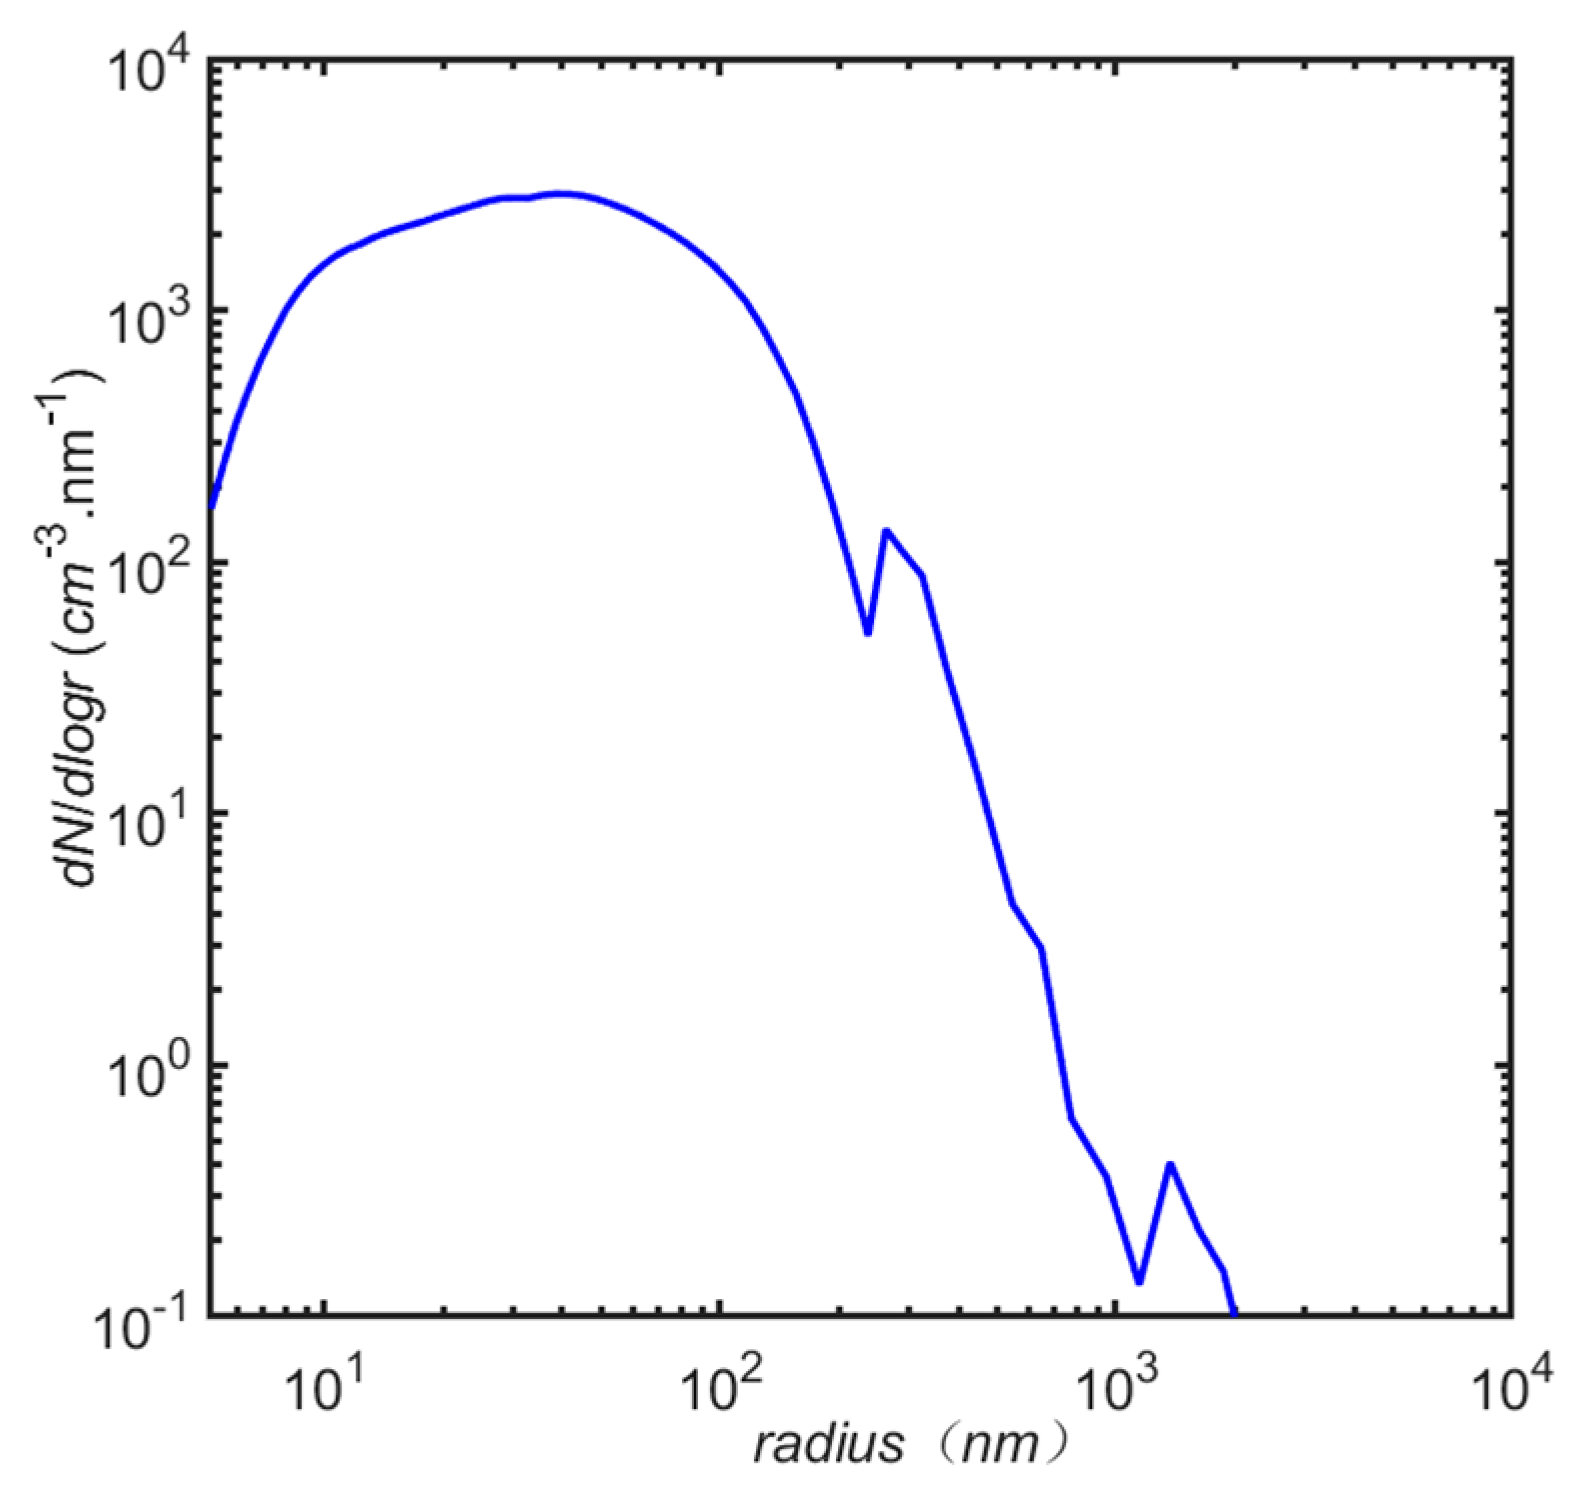
2.2. Model Initialization

The domain was 10 km in the radial direction and 4 km in the vertical direction. The grid size was 200 m. The dynamic time step was 5 s, and the total duration was set to 60 min. The outputs are from the 10th minute, and the interval was two minutes. The sounding profile was obtained from the previous literature (Figure 1) [27]. The temperature perturbation was set at 2 °C.

2.3. Experimental Schemes Design

The average aerosol number concentration size distribution obtained in 2011 (Figure 2) [28] was used in the control experiment. The total number concentration was 2790 cm−3 (exp3). Then, with the shape of the spectrum unchanged, Na in each bin of the other schemes was obtained by multiplying Na of each bin in exp3 by a certain number of times (0.1 to 3.5). Eighteen experimental schemes were presented to explore the dependence of ε or Nc on w and Na, and the distribution of w with height and time derived from the results of the eighteen simulations. Exp1, exp2, exp3, and exp4 were used to analyze the characteristics of the cloud droplet number concentration size distribution with changes in Na. These were designed as follows:
Exp1: Na in each bin is one-tenth of exp3;
Exp2: Na in each bin is one-half of exp3;
Exp3: control experiment based on observations;
Exp4: Na in each bin is two times that in exp3.
Exp1 and exp2 represent low Na backgrounds, and exp3 and exp4 represent high Na backgrounds. The simulations for the 18 schemes were analyzed in detail.

3. Results and Discussion

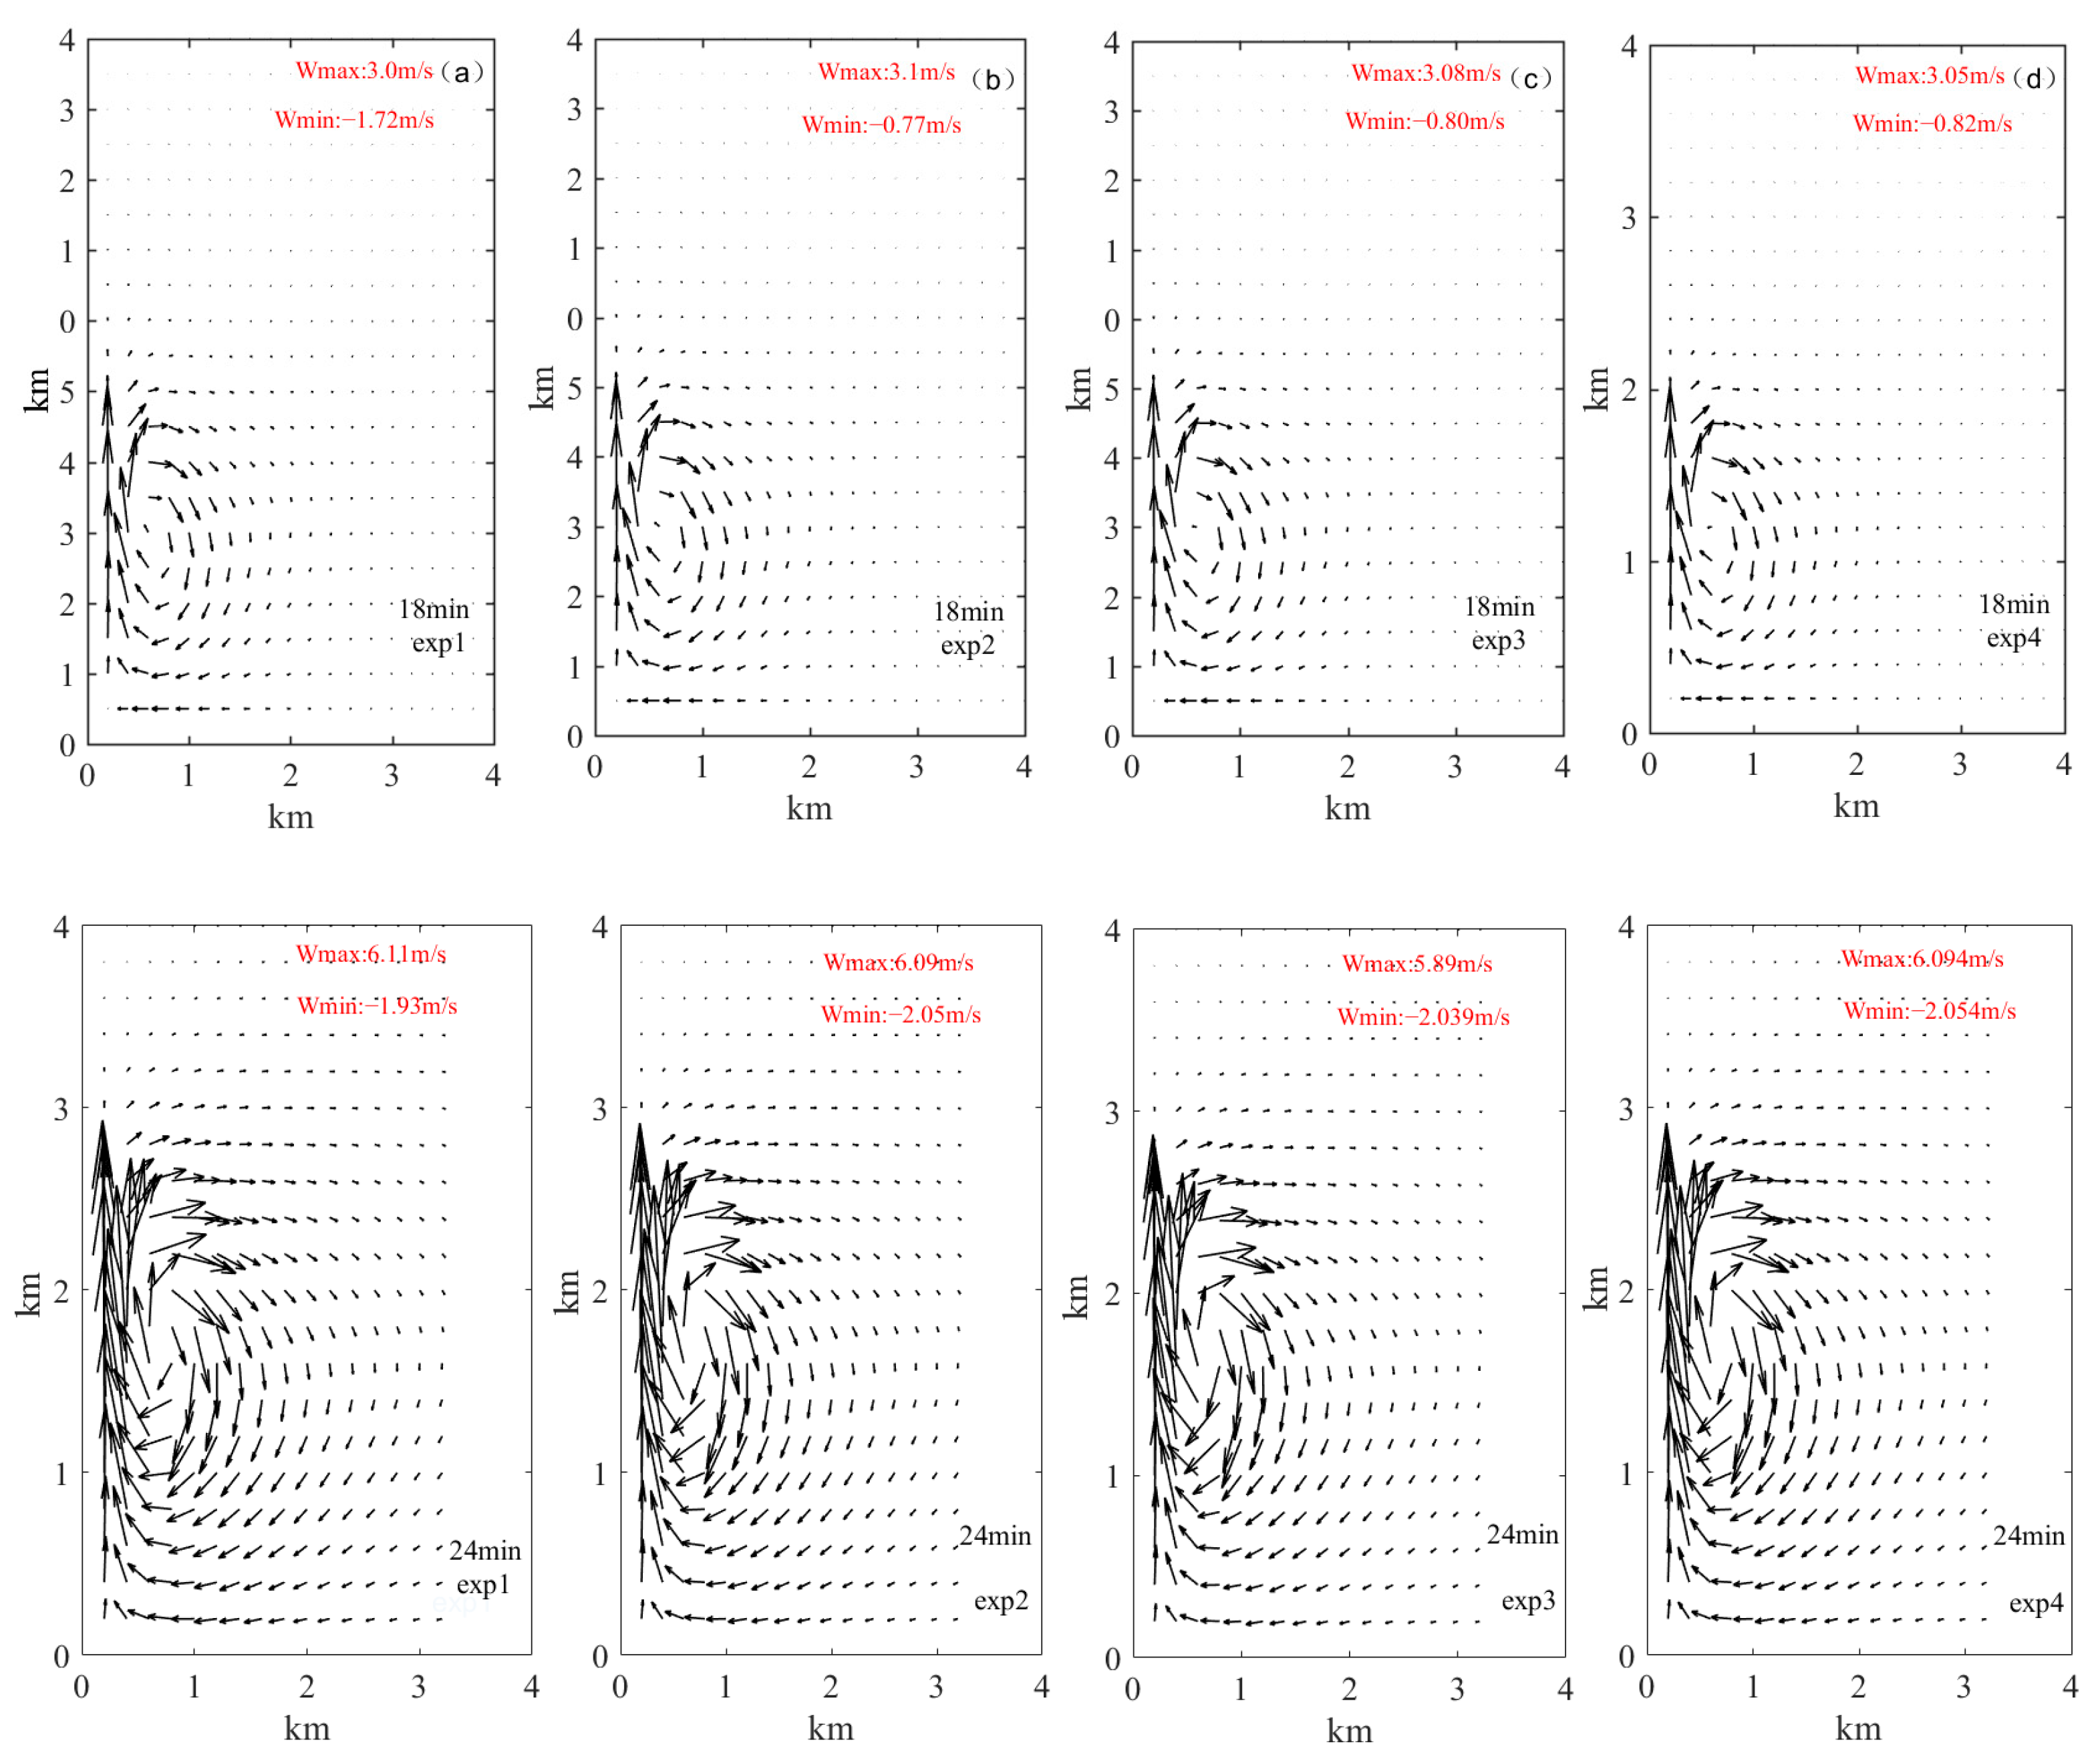
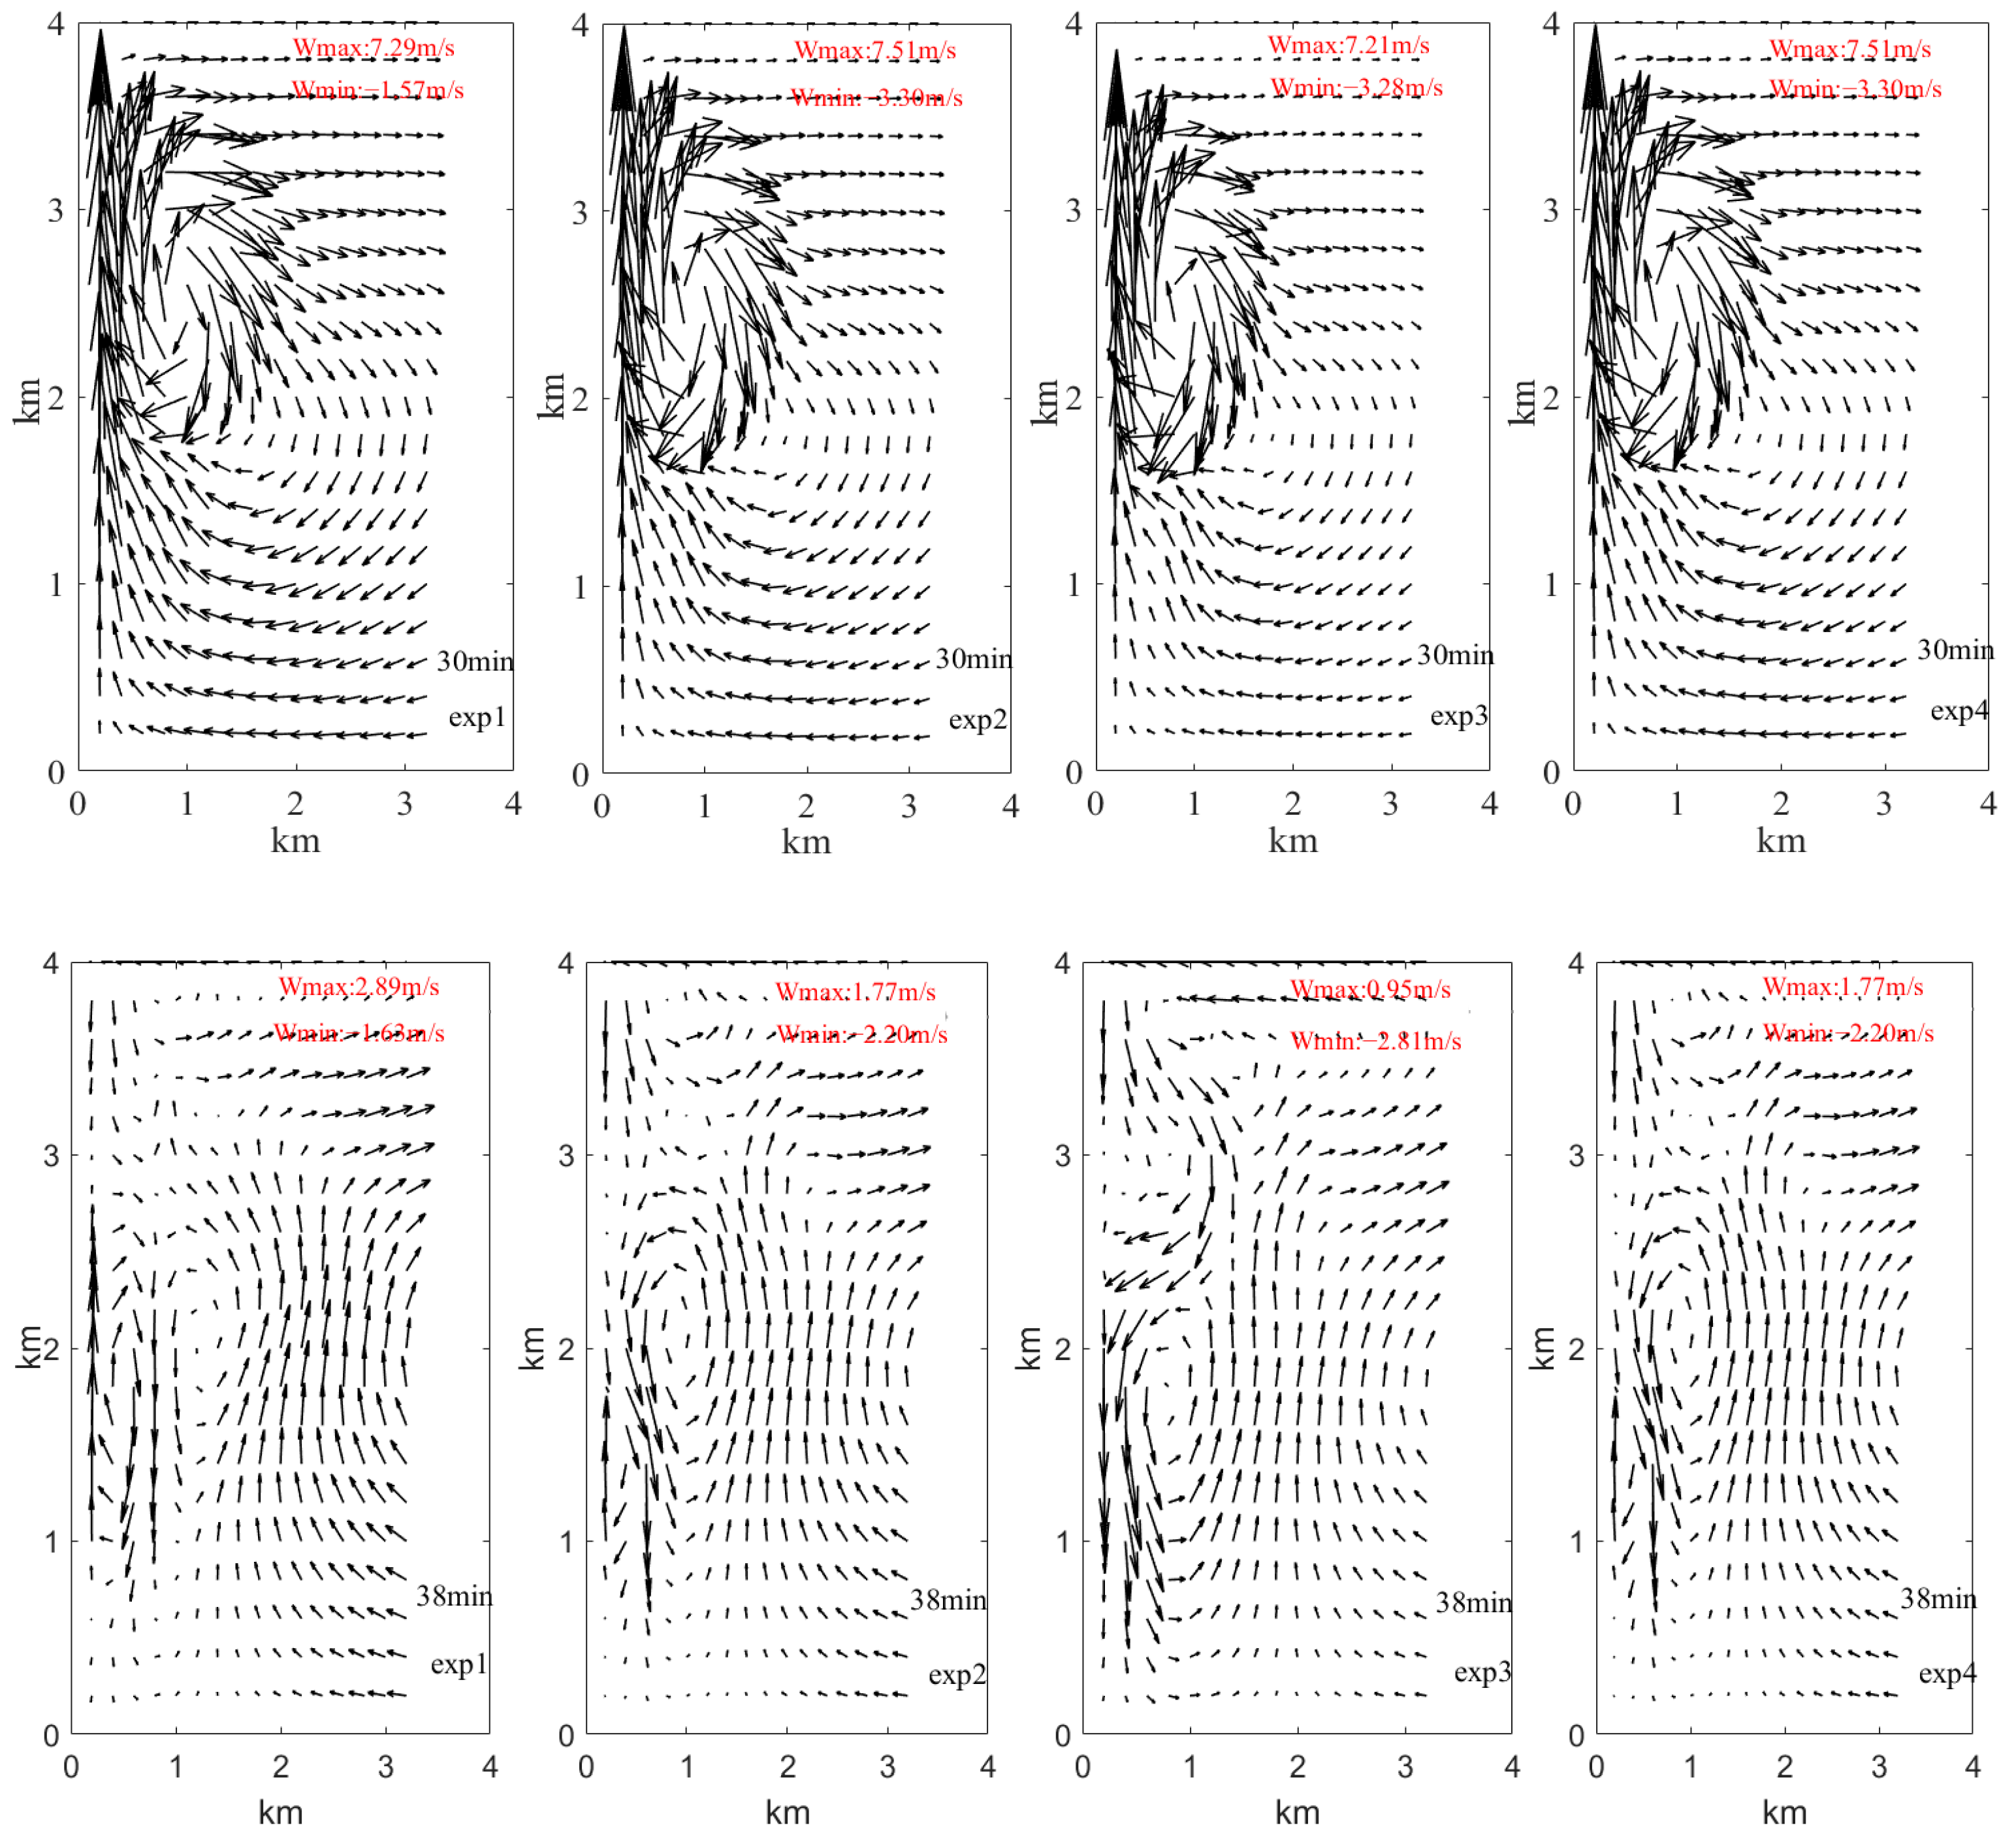
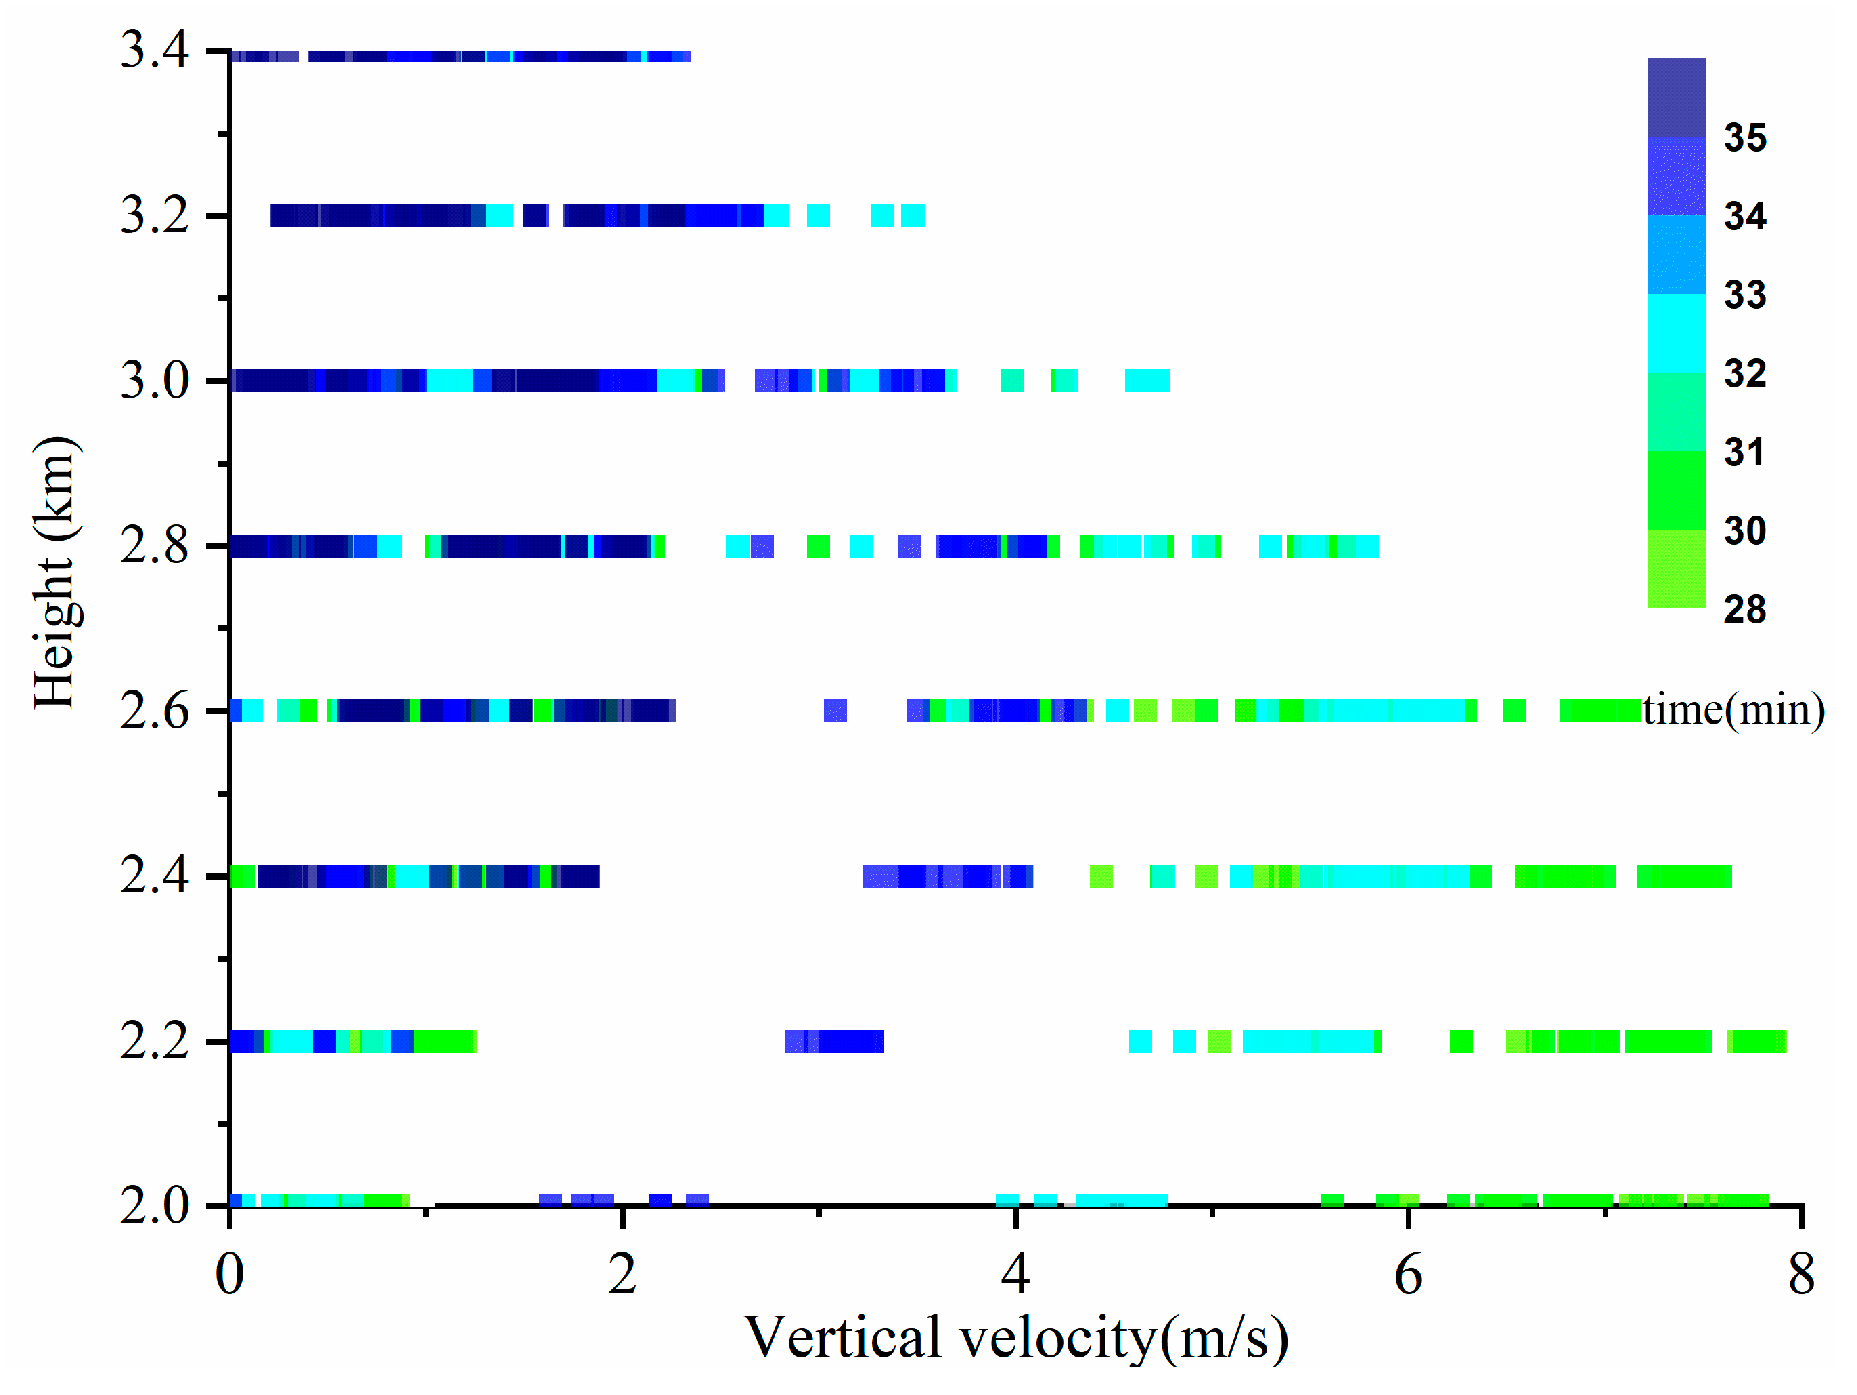
3.1. Selection of the Domain and the Time Division of Growth Stages

To avoid entrainment and mixing influences, the region of strong updraft in the center of the clouds must be taken as the research domain. In this study, the spatial distributions of the wind fields correspond to the aforementioned aerosol schemes, as illustrated in Figure 3. The wind fields are represented by wind vectors (the black arrows). For example, in the same aerosol scheme, the maximum values of w first increases and then decreases with time. It is more than 3 m/s at the 18th minute, more than 7 m/s at the 30th minute, and more than 1 m/s at the 38th minute. The heights corresponding to the maximum values of w increase with time. For example, the height is below 2 km in the 18th minute but above 2 km in the 30th minute. The domain field is within the radial distance of 0.2 km, where the strong center of w is located.
Tas et al. [10] suggested that dlnLWC/dt ≥ 0 at a certain height indicates the condensation growth stage, whereas dlnLWC/dt < 0 indicates the collision–coalescence stage. Based on this method, the condensation growth stage and collision–coalescence growth stage were obtained using the distributions of LWC with height and time in the stronger w regions (Figure 4).

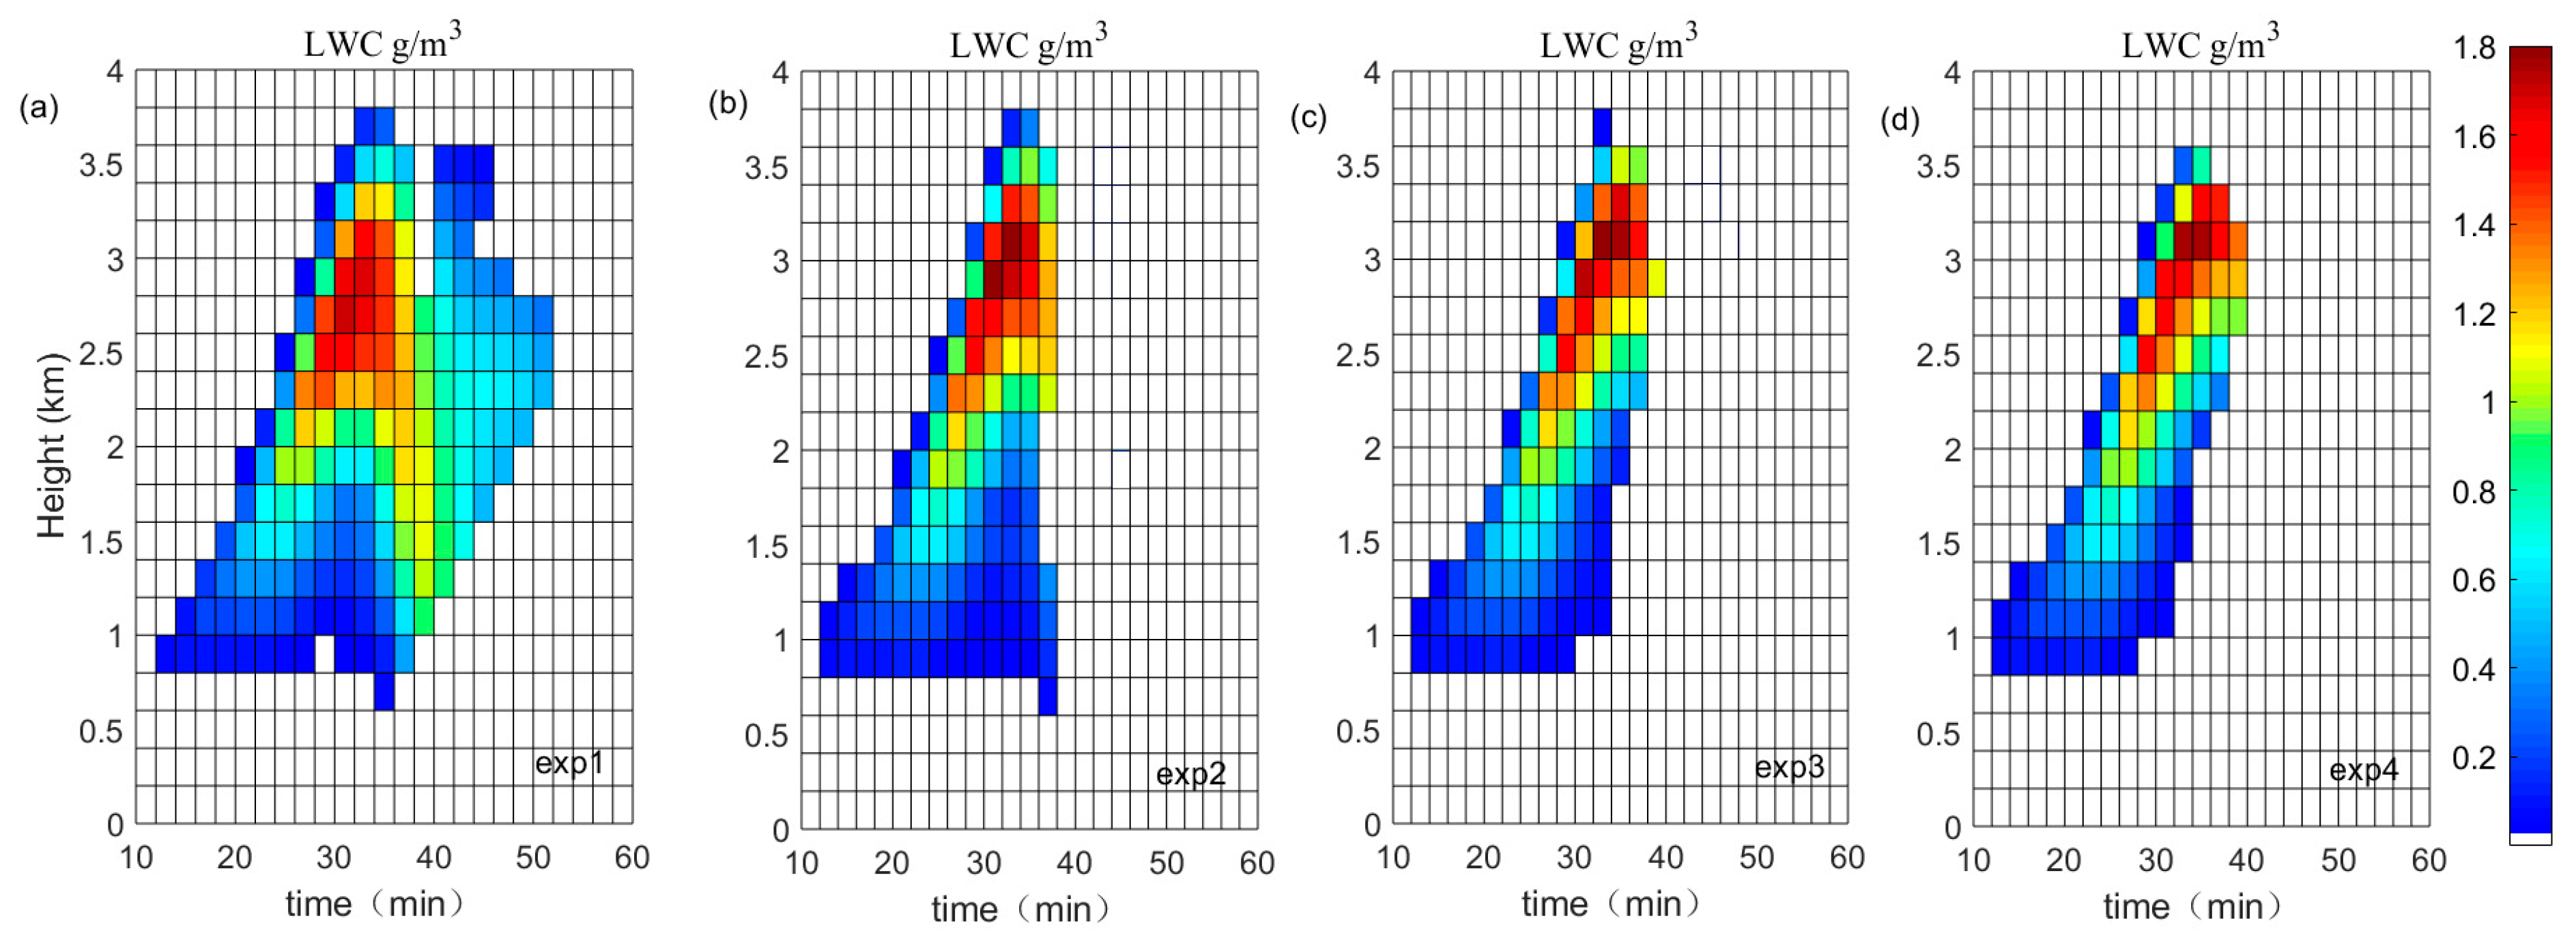
3.2. Temporal Changes in Cloud Microphysics

This study also investigated changes in ε with height and time. The results are presented in Figure 5. When the time is constant, ε first decreases and then increases with height. The maxima of ε are at the top and bottom of the cloud, whereas the values in the central regions are smaller. Moreover, ε obviously decreases with an increase in Na. For example, the average value of ε in exp1 is 0.69 but is 0.43 in exp4.
Figure 6 illustrates the variations in Nc with time and height. When w is large, Nc is more abundant. At the same height, Nc tends to decrease with an increase in time due to collision–coalescence growth. High aerosol concentrations result in increases in Nc, decreases in ε, and reductions in rc, which makes the CDNCS narrow.

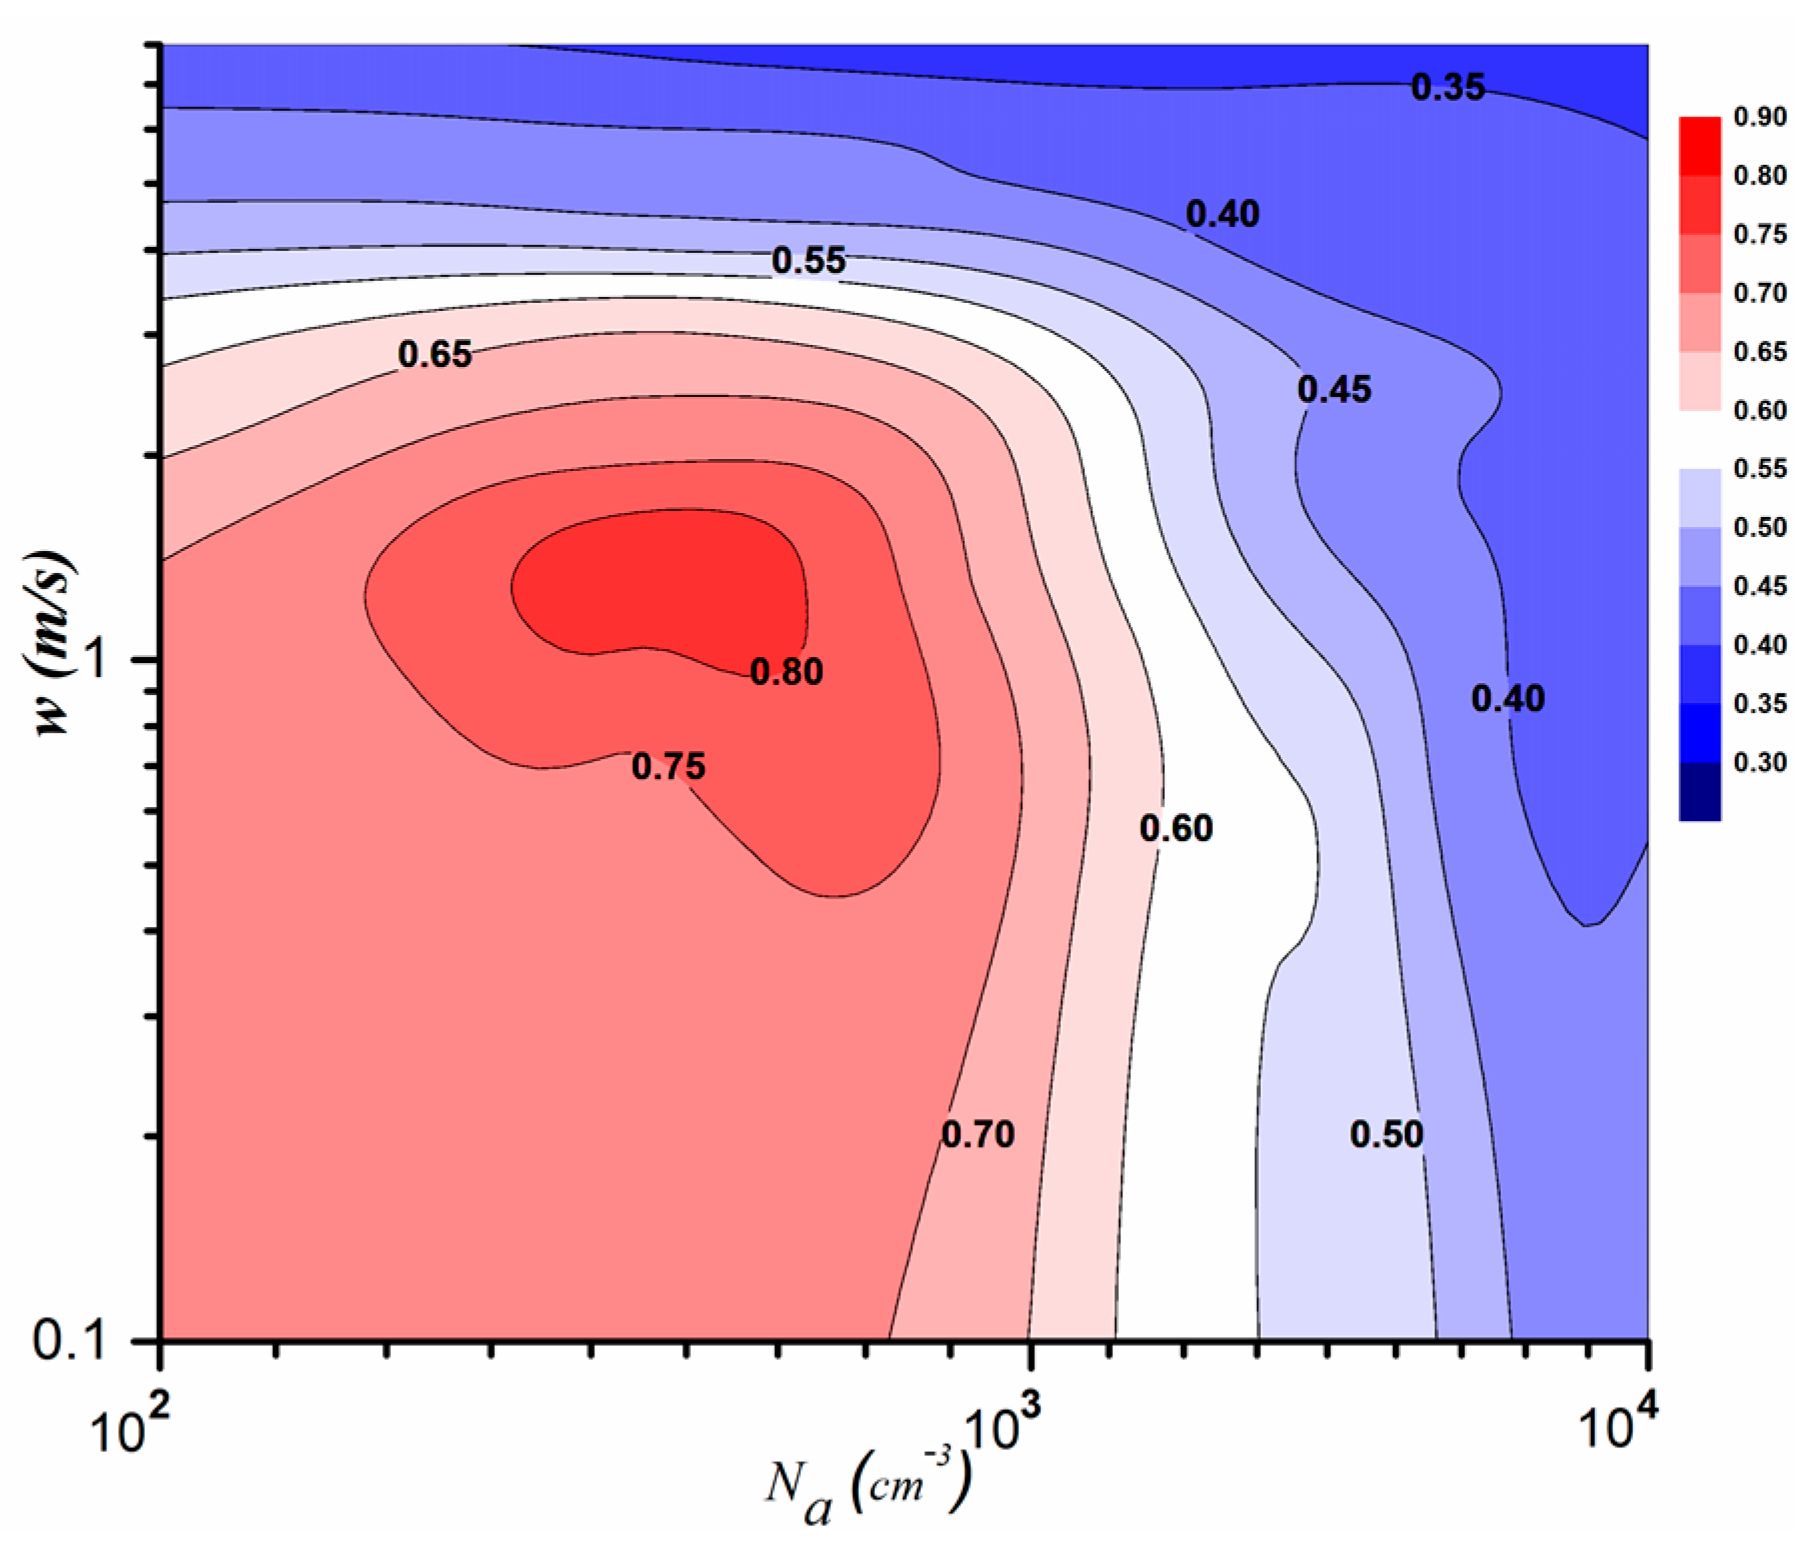
3.3. Joint Effects of Updraft Velocity and Aerosol Loadings on Relative Dispersion

Figure 7 shows the dependence of ε on w and Na during the collision–coalescence stage. When Na is fixed, ε increases slowly and then decreases rapidly with increasing w. In addition, in the regime where w is smaller than 1.5 m/s, ε mainly decreases with increasing Na, but it changes slowly or remains unchanged with changing w. Therefore, this regime is the aerosol main influence regime. Furthermore, where w is greater than 3 m/s, ε decreases slowly with Na but decreases strongly with increasing w, so this regime is the w main influence regime. When w is between 1.5 m/s and 3 m/s, ε also decreases with w, but first increases and then decreases with Na, so this regime is the joint influence regime.
In the aerosol main influence regime (w < 1.5 m/s), the characteristics of ε with w vary with Na. For example, when Na < 2000/cm3, ε increases slowly, but σ and rc increase obviously, with increasing w (Figure 8a,b). Therefore, under this condition, the rc of cloud droplets is the main factor affecting the change in ε with increasing w. However, in the case of 2000/cm3 < Na < 4000/cm3, ε does not change with w because of equivalent contributions from rc and σ (Figure 8). In addition, when Na > 4000/cm3, ε decreases only slightly with w, and the main reason is the increasing rc with increasing w (Figure 8a,b).
In the aerosol main influence regime and the joint influence regime, when w is constant, ε first increases significantly and then decreases with an increase in aerosol loadings. In the next section, we further explain these phenomena in combination with the characteristics of the CDNCS with Na.

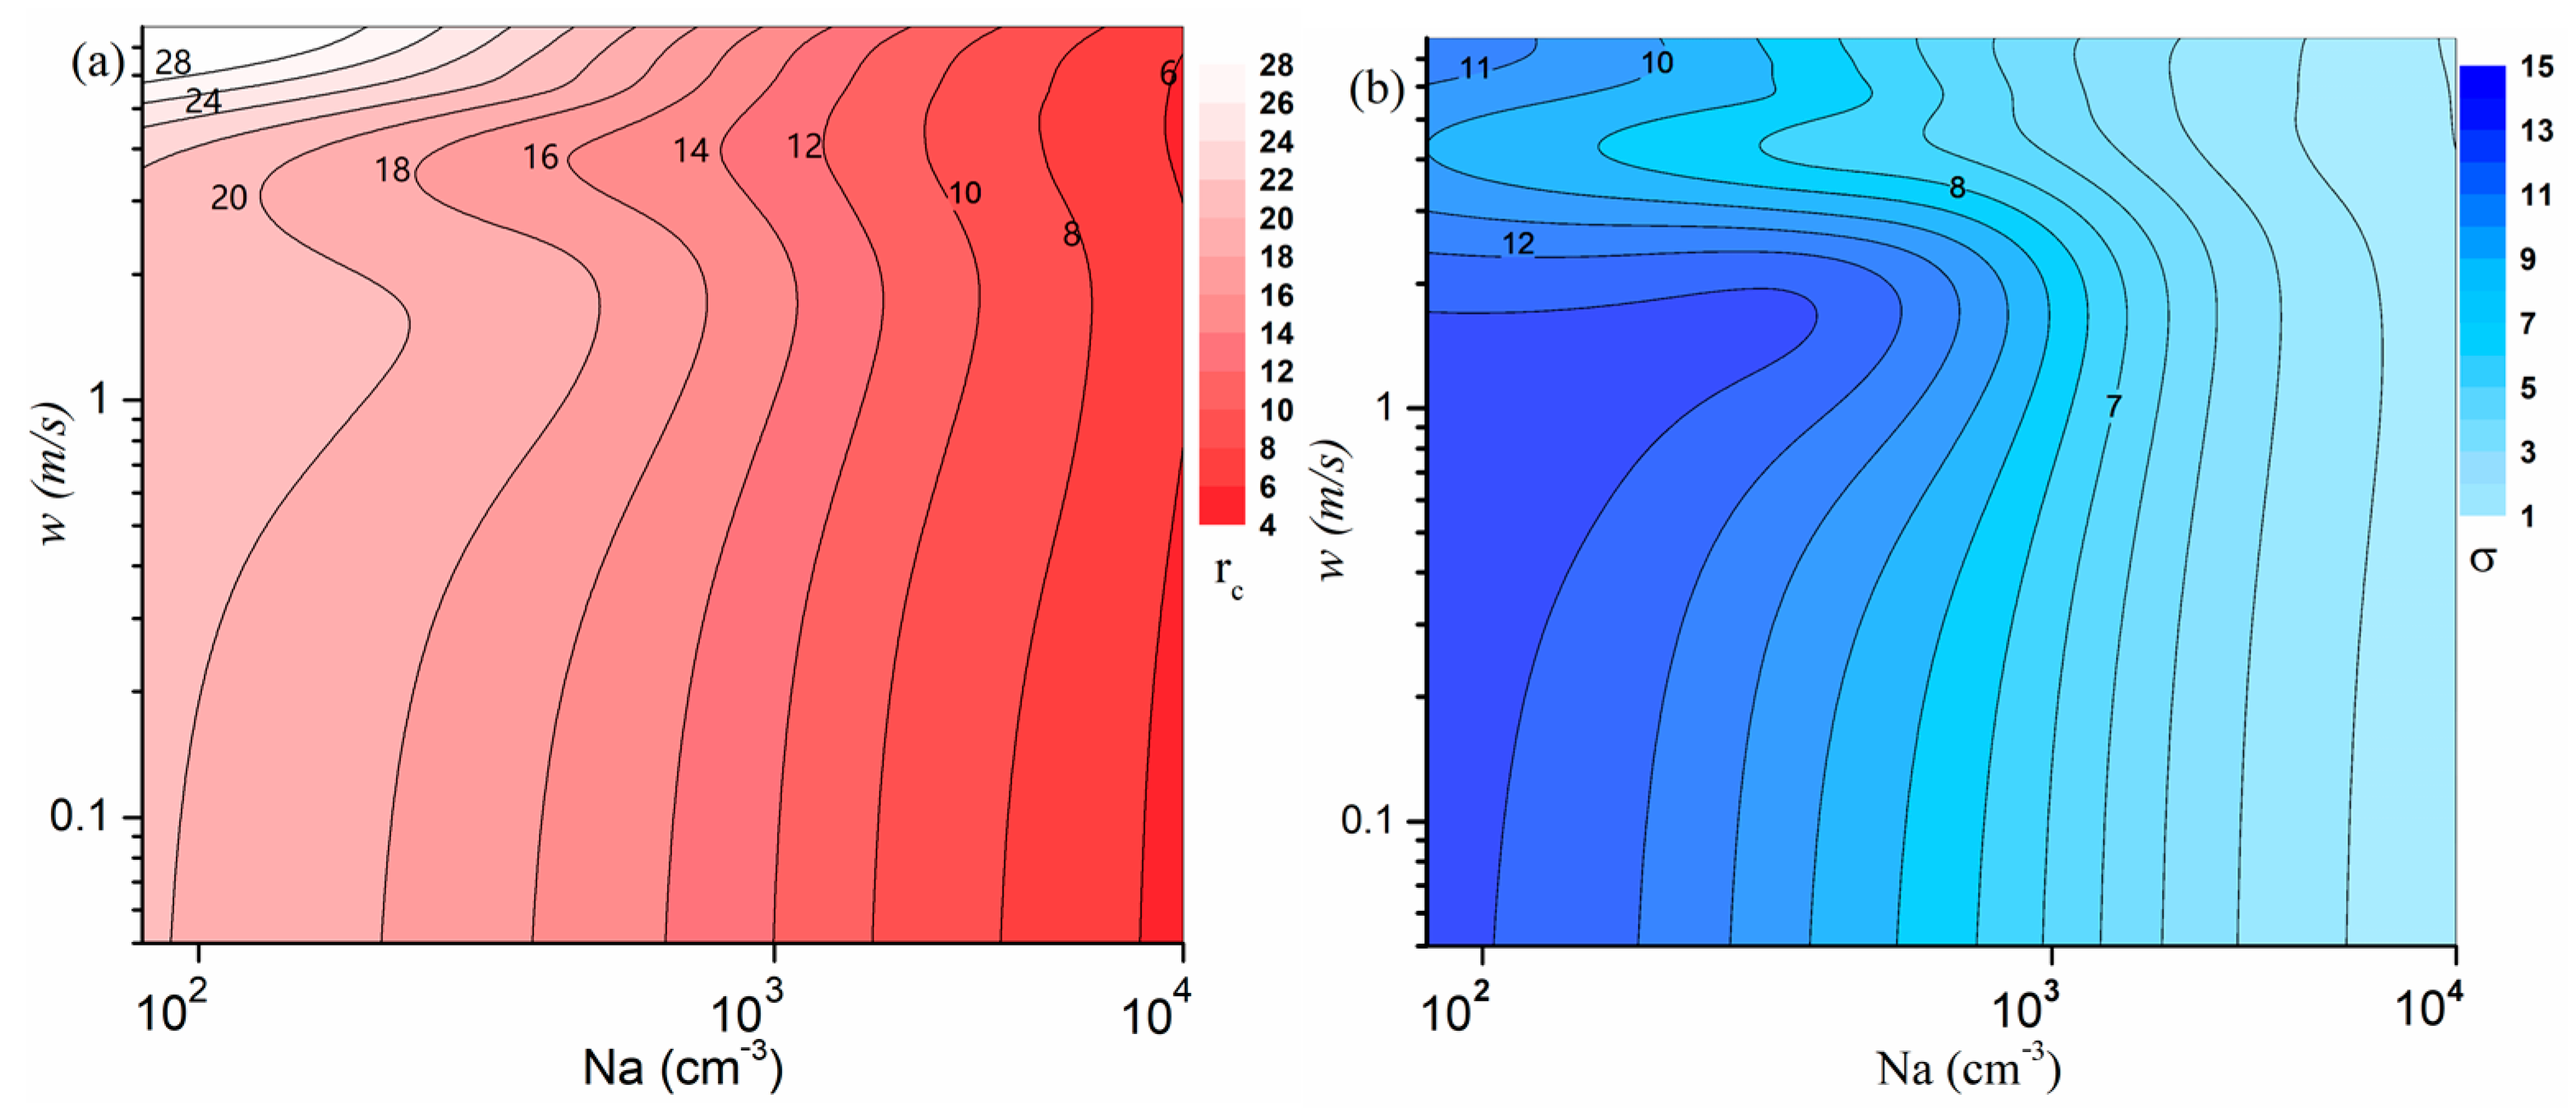
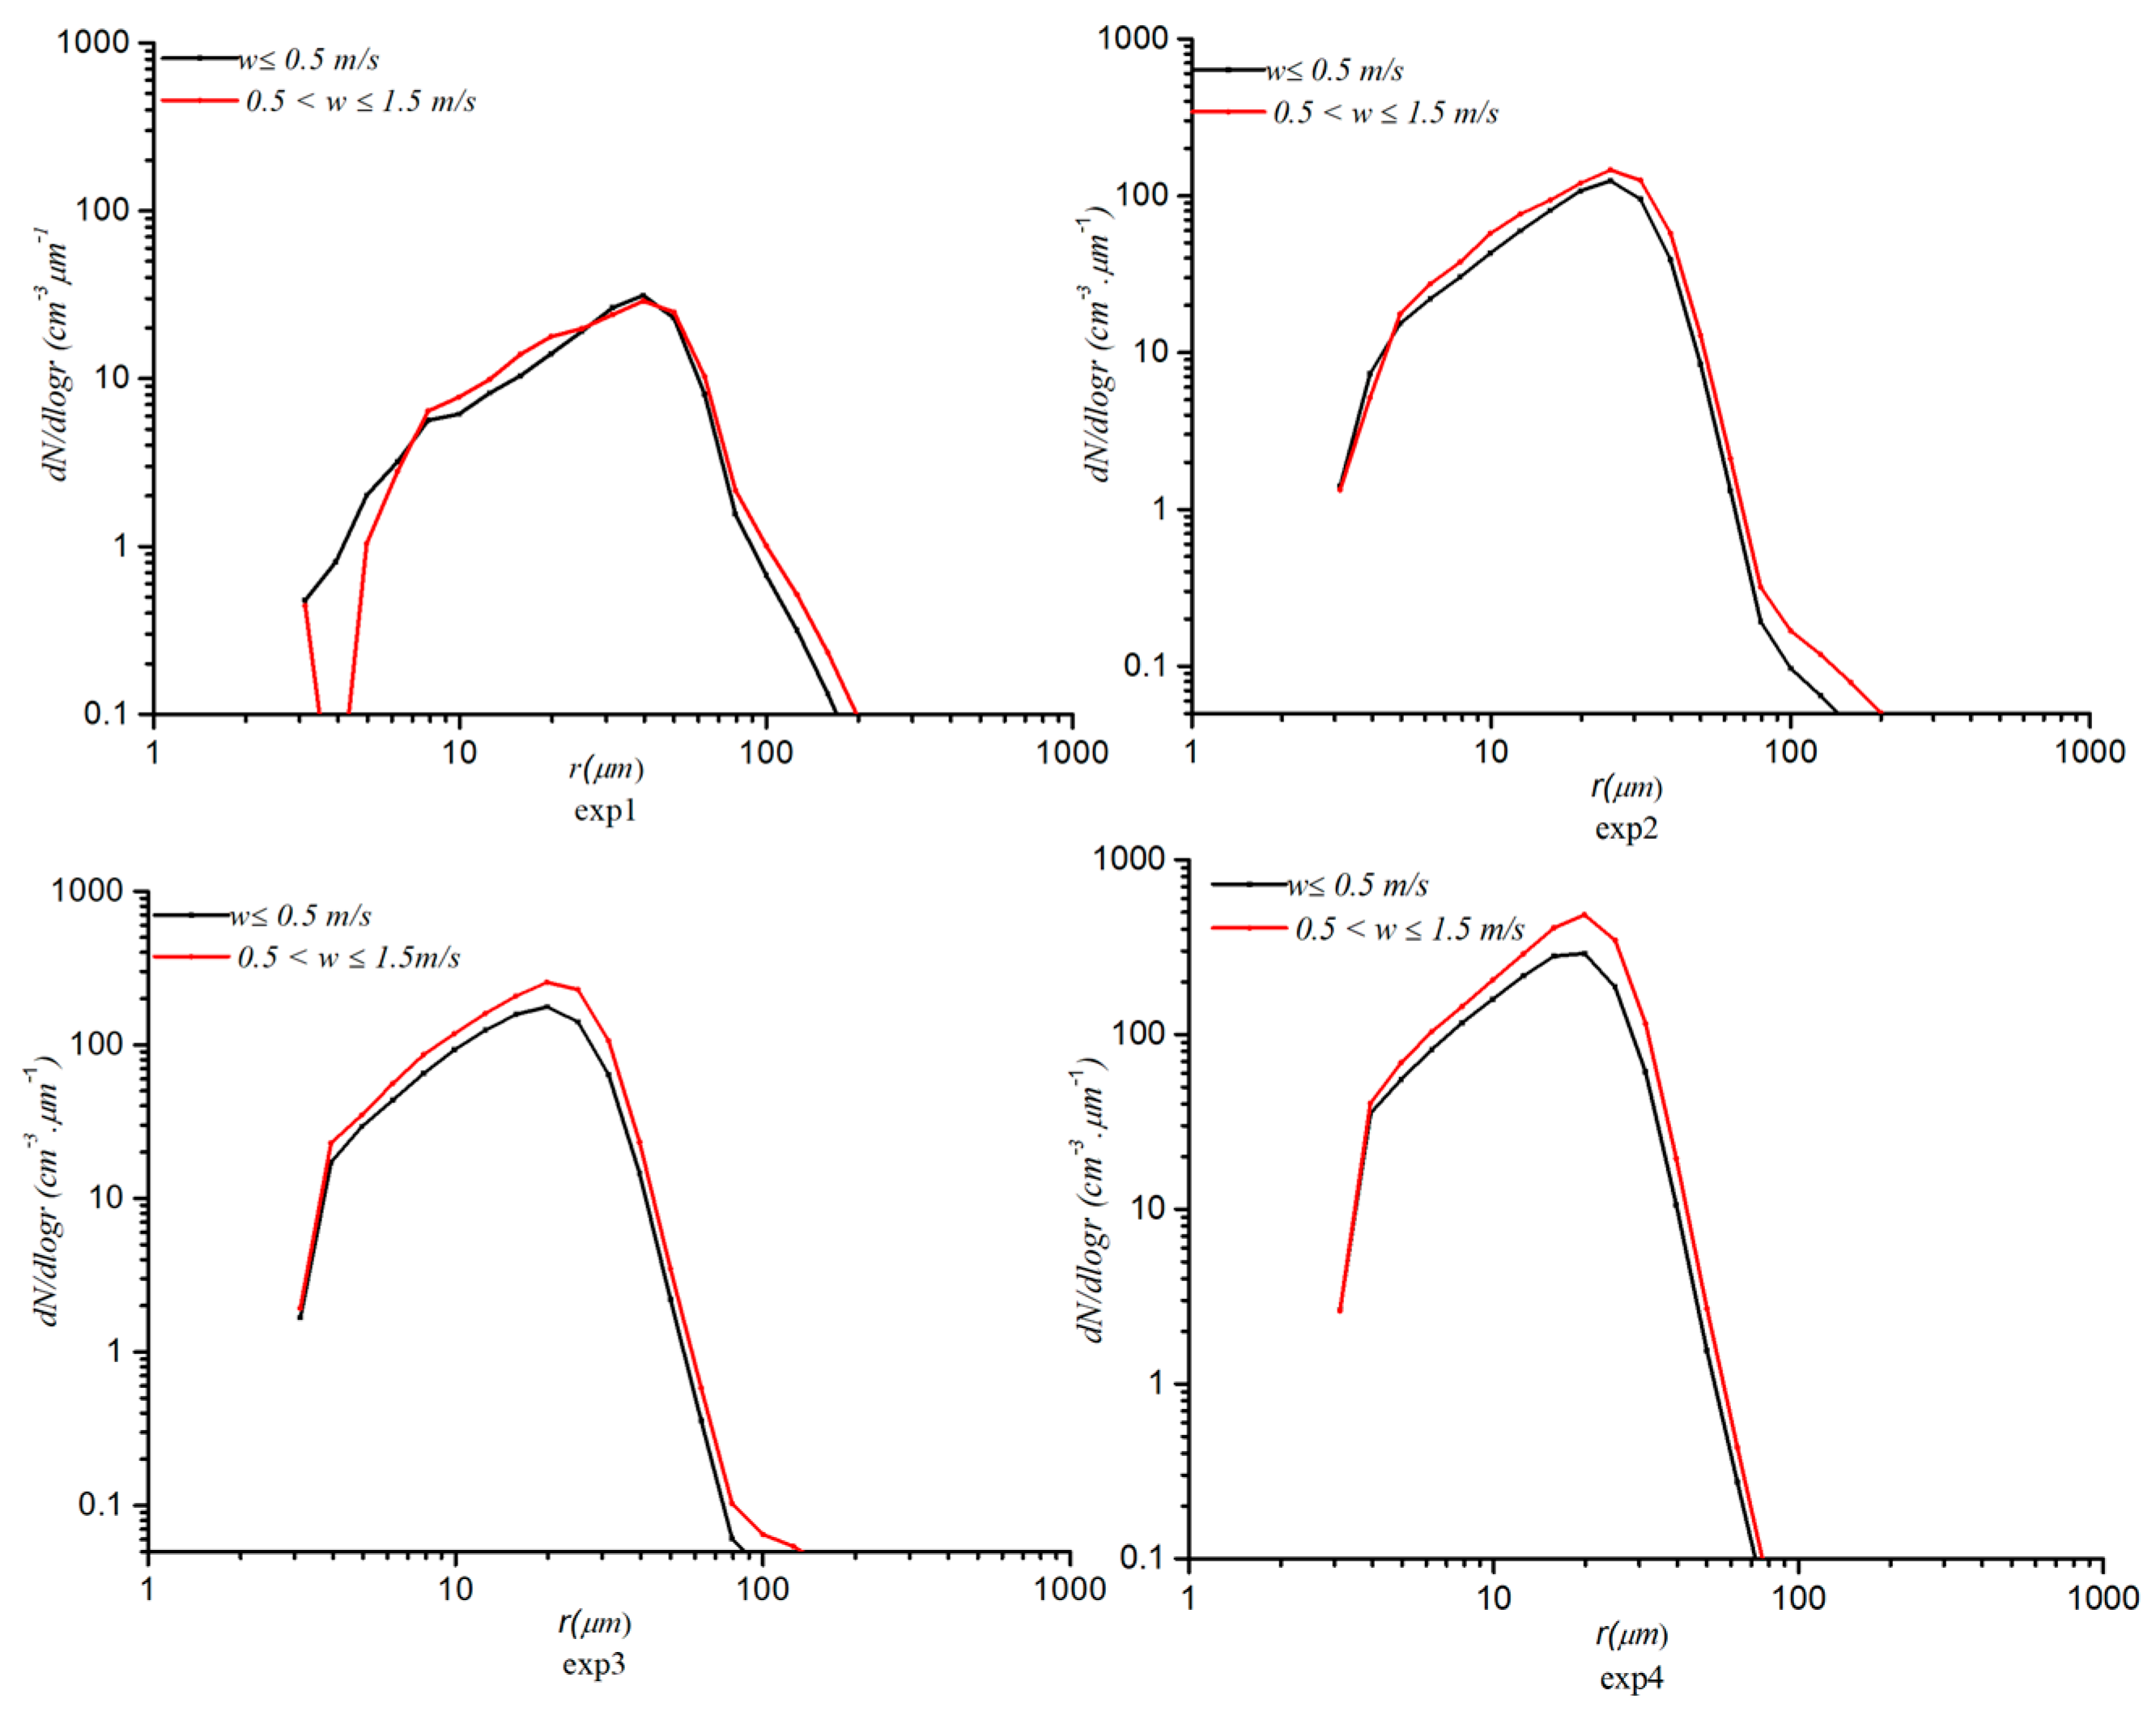
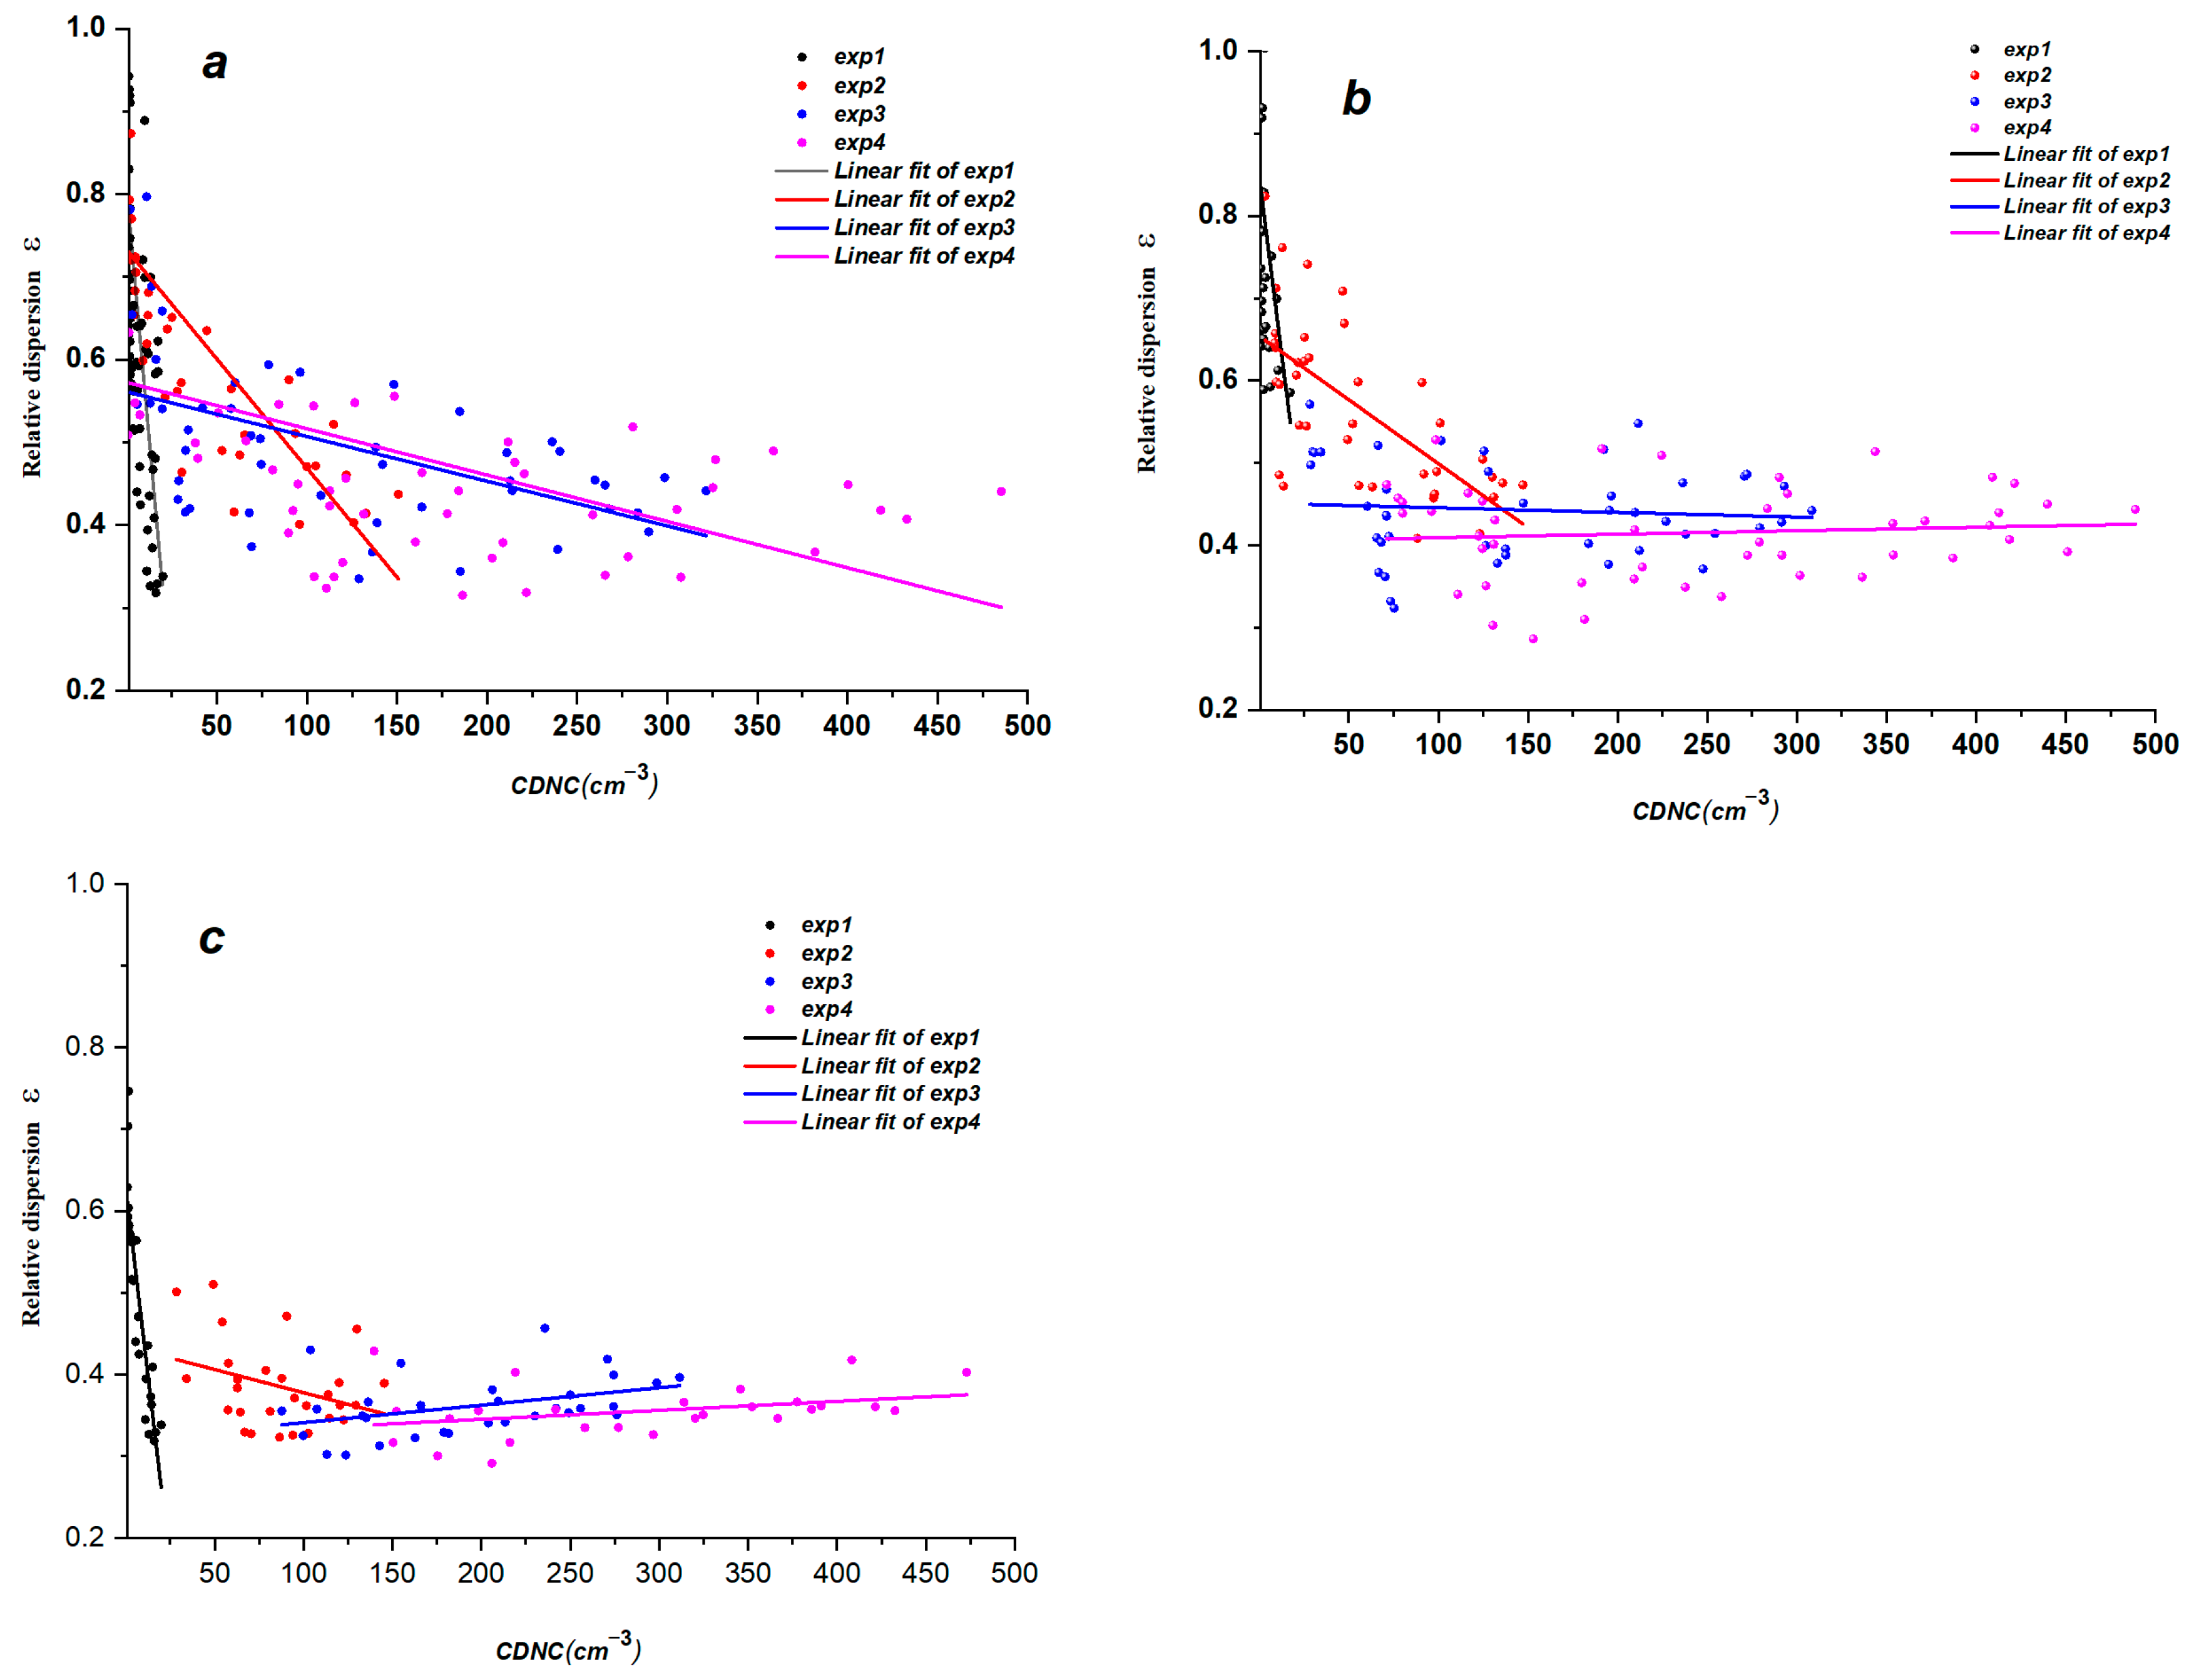
3.4. Variation in Relative Dispersion with Updraft Velocity and Aerosol Number Concentration

To investigate the reasons for the characteristics of ε with w and Na in more detail, CDNCSs under the different aerosol schemes and the influence regimes are examined (Figure 9, Figure 10 and Figure 11). In the main influence regime of w (w ≥ 3 m/s), w is in the early stage and at a lower height (Figure 12), and there is an inverse correlation between ε and w (Figure 7). In this regime, the larger cloud droplets are formed for vigorous collision–coalescence because rc increases with the increase in w, which to some extent indicates that w has a promoting effect on collision–coalescence growth [29,30]. For each aerosol scheme, there is an obvious broadening in the CDNCS toward larger droplets with increasing w (Figure 9). This finding is consistent with conclusions reported in the literature [30]. By comparison, we find that rc is obviously larger at higher w than at lower w, but there are discernible differences in σ (Figure 8a,b). The slower increase in rc with Na is the reason for the less obvious characteristics of the decrease in ε with increasing w when the aerosol loadings are higher (Figure 9).
In the joint influence regime (1.5 ≤ w ˂ 3 m/s), as shown in Figure 10, 4–30 μm droplets increase, but the large cloud droplet concentration changes little with the increase in w, so the CDNCS becomes narrower (i.e., σ becomes smaller) with increasing w due to the explosion of smaller droplets. As shown in Figure 12, w values between 1.5 m/s and 3 m/s occur after the 34th minute and above the height of 2.8 km during the later period of the collision–coalescence stage. At this time, the drag effect on w steadily increases [31], and some scholars have also found this feature, that is, above the maximum of w, w decreases [32,33]. Hence, the drag effect is enhanced with the decreasing w [31], and the evaporation of falling cloud droplets [31] significantly reduces the 4–30 μm cloud droplets (Figure 10), which widens the CDNCS (i.e., higher σ) and increases rc (Figure 8a,b).
In the aerosol main influence regime, the mechanism for the increase in ε with the increase in w is similar to that in the joint influence regime, as is also the case for the drag effect and the evaporation effect [32,33]. However, the drag effect is more intense in the regime as a result of the smaller w [31] because the regime occurs at the end of the collision–coalescence stage (Figure 12). At this time, the evaporation effect is also more significant because the evaporative cooling can reduce w and even change into a downdraft [34]. As can be seen in Figure 11, under the four aerosol schemes, when the evaporation effect is stronger, the CDNCS is narrower (i.e., smaller σ), rc becomes smaller (i.e., less than the change in σ) by the reduction in Nc of all sizes. A positive relationship exists between ε and w (Figure 7).
This discussion leads to an interesting question: Why does ε first increase and then decrease with an increase in Na in the aerosol main influence regime and the joint influence regime? To answer this question, the main aerosol influence regime can be taken as an example. As illustrated in Figure 8 and Figure 11, the differences in σ are smaller between exp1 and exp2, but rc significantly decreases with Na (from exp1 to exp2), so rc plays a major role in the increase in ε with an increase in Na. As shown, from exp3 or exp4, rc and σ significantly decrease because the collision–coalescence effect is noticeably weakened with increasing Na [35]. Thus, it can be concluded that the characteristics of σ resulted in a decreasing ε with the increase in Na (Figure 8a,b).

3.5. Joint Dependence of the Relationship between Nc and ε on Na and w

This study also analyzed the correlations between ε and Nc within the different main regimes. Under low w conditions (w ≤ 1.5 m/s), negative correlations are observed between ε and Nc, and the relationship becomes weaker with the increase in Na (Figure 13a). However, when w > 1.5 m/s, the negative correlations gradually weaken or even become positive correlations with Na (Figure 13b,c). The positive correlations are found at higher Na (exp3 or exp4).
In each scheme, Nc is arranged from small to large, and the corresponding average values of ε, rc, and σ under higher Nc and lower Nc, respectively, are calculated. The physical quantity values are determined using the difference between the values at higher Nc and the values at lower Nc, which are defined as the variations (e.g., ∆Nc, ∆ε, ∆rc, and ∆σ). The variation in each quantity to the quantity under a lower Nc multiplied by 100% is defined as the change rate (CRx =∆x/x, x under lower Nc), where x represents the cloud microphysical quantities (Nc, ε, rc, or σ). This method can determine the main causes for the correlation between Nc and ε in the different main influence regimes.
As shown in Table 1, CRσ and CRr are both negative. The absolute values of CRσs are higher than those of CRrs at lower w (w ≤ 1.5 m/s, the main influence regime of aerosol), and become smaller with the increase in Na. Variations in σ are the main reason for the negative correlation between ε and Nc (Table 1). The absolute values of CRσ reduction with Na result in a weakening of the negative relationship between ε and Nc (Figure 11). The mechanism for this negative correlation can be understood by also considering the analysis in Figure 11. That is, stronger evaporation [34] (i.e., corresponding to a weaker w) causes Nc to decrease, σ to become obviously larger (Figure 8b), and ε to increase. The increase in Na leads to weakening in the evaporation effect and σ effect [36], and thus the negative correlation.
In the joint regime, there are negative correlations between Nc and ε in exp1, exp2, and exp3 (Figure 13b). The evaporation of cloud droplets reduces Nc of 4–30 μm, increases rc and σ (the increase in σ is more significant), and then increases ε (Table 1). Finally, the negative correlation between Nc and ε appears. When Na is very high (exp4), the relationship between Nc and ε becomes positive (Figure 13b). The reason for this change is that the evaporation of cloud droplets reduces Nc and decreases ε (i.e., the increase in rc is stronger than the increase in σ) (Table 1).
In the main influence regime of w, the collision–coalescence strength is proportional to w (Figure 9). Collision–coalescence growth is the main mechanism affecting the CDNCS. When the collision–coalescence growth is stronger, Nc is lower, the CDNCS widens toward large diameters, σ increases, and rc becomes larger (Table 1). The effect of collision–coalescence is stronger in lower Na backgrounds (exp1, exp2) than in the higher Na backgrounds (exp3, exp4). The broadening of the CDNCS toward larger cloud droplets is more significant in lower Na, so the degree of σ change is stronger than that of rc. However, when Na is higher, collision–coalescence growth is relatively weaker, and the increase in rc is stronger than the increase in σ. In conclusion, in the lower Na background, stronger collision–coalescence causes a negative correlation between Nc and ε, but the relatively weak collision–coalescence in the higher aerosol background results in a positive correlation between the two (Figure 13c).

4. Conclusions

The joint dependence of aerosol number concentration and updraft velocity on relative dispersion during the collision–coalescence growth process under similar dynamic and thermal atmospheric environmental conditions was investigated by performing cloud model simulations with wide ranges of aerosol concentrations virtually covering ambient aerosol concentrations, thus improving our understanding of the regime dependence in the aerosol–cloud interaction. The main conclusions are stated below.
In the aerosol main influence regime, ε first increases and then decreases with an increase in Na, but it changes slowly or even remains unchanged with w. In the updraft velocity main influence regime, ε decreases slowly with an increase in Na but decreases most substantially with increasing w. In the joint influence regime, ε also decreases with increasing w, and the changes with Na are similar to those in the aerosol main influence regime.
The cause of the variation in the relative dispersion with updraft velocity is different in the different main influence regimes. In the updraft velocity main influence regime, vigorous collision–coalescence causes the cloud droplet number concentration spectrum to move toward large droplets and an increase in rc, but the spectral width is less variable. In the joint influence regime, the dragging effect of large cloud droplets leads to a smaller updraft velocity, and their evaporation widens the spectrum by mainly reducing cloud droplets of 4–30 μm. Finally, a decrease in ε with an increase in w appeared. In the aerosol main influence regime, the strong drag effect of cloud droplets causes the cloud droplet number concentration of all sizes to decrease and the cloud droplet number concentration spectrum to narrow. This becomes the mechanism for the positive correlation between the relative dispersion and updraft velocity.
In the middle and late stages of collision–coalescence growth, there are both a positive correlation and a negative correlation between Nc and ε. Cloud droplet evaporation produces a negative correlation between the two. When the aerosol number concentration is very high, weaker evaporation results in a positive correlation between Nc and ε. In the early stage of collision–coalescence growth, the collision–coalescence effect results in a negative correlation under the background of a lower aerosol number concentration. At this time, the collision–coalescence effect is weak at higher aerosol number concentrations, and Nc and ε present a positive correlation relationship.

Author Contributions

Conceptualization, funding acquisition, supervision, project administration, writing original draft, revising and editing, S.Y.; visualization, Y.Z.; methodology, X.Y.; supervision, revising and editing, Y.L.; revising and editing, C.L. All authors have read and agreed to the published version of the manuscript.

Funding

This research was funded by the National Natural Science Foundation of China (grant numbers 41575133 and U2242212) and the National Key Research and Development Program of China (grant number 2017YFC1501404).

Institutional Review Board Statement

Not applicable.

Informed Consent Statement

Not applicable.

Data Availability Statement

The datasets generated and analyzed in the current study are available from the corresponding author upon reasonable request.

Acknowledgments

The authors are grateful to the editors and anonymous reviewers for their insightful comments and helpful suggestions and appreciate the helpful discussions with Yangang Liu of Brookhaven National Lab (BNL), Upton, NY (USA). The authors thank Yan Yin (Nanjing University of Information Science and Technology (NUIST, Nanjing, Jiangsu Province, China) for the model.

Conflicts of Interest

The authors declare no conflict of interest.

References

  1. Albrecht, B.A. Aerosols, cloud microphysics, and fractional cloudiness. Science 1989, 245, 1227–1230. [Google Scholar] [CrossRef]
  2. Jia, H.; Ma, X.; Yu, F.; Liu, Y.; Yin, Y. Distinct impacts of increased aerosols on cloud droplet number concentration of stratus/stratocumulus and cumulus. Geophys. Res. Letts. 2019, 46, 13517–13525. [Google Scholar] [CrossRef]
  3. Wang, Y.; Lu, C.; Niu, S.; Lv, J.; Jia, X.; Xu, X.; Zhang, L.; Yan, S. Diverse dispersion effects and parameterization of relative dispersion in urban fog in eastern China. J. Geophys. Res. Atmos. 2023, 128, e2022JD037514. [Google Scholar] [CrossRef]
  4. Ackerman, A.S.; Toon, O.B.; Taylor, J.P.; Johnson, D.W.; Hobbs, P.V.; Ferek, R.J. Effects of aerosols on cloud albedo: Evaluation of Twomey’s parameterization of cloud susceptibility using measurements of ship tracks. J. Atmos. Sci. 2000, 57, 2684–2695. [Google Scholar] [CrossRef]
  5. Feingold, G.; Boers, R.; Stevens, B.; Cotton, W.R. A modeling study of the effect of drizzle on cloud optical depth and susceptibility. J. Geophys. Res. 1997, 102, 13527–13534. [Google Scholar] [CrossRef]
  6. Liu, Y.; Daum, P. Indirect warming effect from dispersion forcing. Nature 2002, 419, 580–581. [Google Scholar] [CrossRef]
  7. Lu, M.; Feingold, G.; Jonsson, H.H.; Chuang, P.Y.; Gates, H.; Flagan, R.C.; Seinfeld, J.H. Aerosol-cloud relationships in continental shallow cumulus. J. Geophys. Res. 2008, 113, D15201. [Google Scholar] [CrossRef]
  8. Lu, C.; Liu, Y.; Niu, S.; Vogelmann, A.M. Observed impacts of vertical velocity on cloud microphysics and implications for aerosol indirect effects. Geophys. Res. Lett. 2012, 3. [Google Scholar] [CrossRef]
  9. Peng, Y.; Lohmann, U. Sensitivity study of the spectral dispersion of the cloud droplet size distribution on the indirect aerosol effect. Geophys. Res. Lett. 2003, 30, 1507. [Google Scholar] [CrossRef]
  10. Tas, E.; Koren, I.; Altaratz, O. On the sensitivity of droplet size relative dispersion to warm cumulus cloud evolution. Geophys. Res. Lett. 2012, 39, L13807. [Google Scholar] [CrossRef]
  11. Tas, E.; Teller, A.; Altaratz, O.; Axisa, D.; Bruintjes, R.; Levin, Z.; Koren, I. The relative dispersion of cloud droplets: Its robustness with respect to key cloud properties. Atmos. Chem. Phys. 2015, 15, 2009–2017. [Google Scholar] [CrossRef]
  12. Jones, A.; Slingo, A. Predicting cloud-droplet effective radius and indirect sulphate aerosol forcing using a general circulation model. Q. J. R. Meteorol. Soc. 1996, 122, 1573–1595. [Google Scholar] [CrossRef]
  13. Kiehl, J.T.; Schneider, T.L.; Rasch, P.J.; Barth, M.C.; Wong, J. Radiative forcing due to sulfate aerosols from simulations with the National Center for Atmospheric Research Community Climate Model, Version 3. J. Geophys. Res. 2000, 105, 1441–1457. [Google Scholar] [CrossRef]
  14. Liu, Y.; Daum, P.H. Spectral dispersion of cloud droplet size distributions and the parameterization of cloud droplet effective radius. Geophys. Res. Lett. 2000, 27, 1903–1906. [Google Scholar] [CrossRef]
  15. Wang, Y.; Niu, S.; Lu, C.; Liu, Y.; Chen, J.; Yang, W. An observational study on cloud spectral width in North China. Atmosphere 2019, 10, 109. [Google Scholar] [CrossRef]
  16. Ghan, S.J.; Easter, R.C.; Chapman, E.G.; Abdul-Razzak, H.; Zhang, Y.; Leung, L.R.; Laulainen, N.S.; Saylor, R.D.; Zaveri, R.A. A physically based estimate of radiative forcing by anthropogenic sulfate aerosol. J. Geophys. Res. 2001, 106, 5279–5293. [Google Scholar] [CrossRef]
  17. Kumar, B.; Götzfried, P.; Suresh, N.; Schumacher, J.; Shaw, R.A. Scale dependence of cloud microphysical response to turbulent entrainment and mixing. J. Adv. Model. 2018, 10, 2777–2785. [Google Scholar] [CrossRef]
  18. Pandithurai, G.; Dipu, S.; Prabha, T.V.; Maheskumar, R.S.; Kulkarni, J.R.; Goswami, B.N. Aerosol effect on droplet spectral dispersion in warm continental cumuli. J. Geophys. Res. 2012, 117, D16202. [Google Scholar] [CrossRef]
  19. Chen, J.; Liu, Y.; Zhang, M.; Peng, Y. New understanding and quantification of the regime dependence of aerosol-cloud interaction for studying aerosol indirect effects. Geophys. Res. Lett. 2016, 43, 1780–1787. [Google Scholar] [CrossRef]
  20. Chandrakar, K.K.; Cantrell, W.; Kostinski, A.B.; Shaw, R.A. Dispersion aerosol indirect effect in turbulent clouds: Laboratory measurements of effective Radius. Geophys. Res. Lett. 2018, 45, 10738–10745. [Google Scholar] [CrossRef]
  21. Guo, X.H.; Lu, C.S.; Zhao, T.L.; Liu, Y.G.; Zhang, G.J.; Luo, S. Observational study of the relationship between entrainment rate and relative dispersion in deep convective clouds. Atmos. Res. 2018, 199, 186–192. [Google Scholar] [CrossRef]
  22. Liu, Y.G.; Daum, P.; Guo, H.; Peng, Y.R. Dispersion bias, dispersion effect, and the aerosol–cloud conundrum. Environ. Res. Lett. 2008, 3, 045021. [Google Scholar] [CrossRef]
  23. Wang, X.F.; Xue, H.W.; Fang, W.; Zheng, G.G. A study of shallow cumulus cloud droplet dispersion by large eddy simulations. Acta Meteorol. Sin. 2011, 25, 166–175. [Google Scholar] [CrossRef]
  24. Lu, M.L.; Seinfeld, J.H. Effect of aerosol number concentration on cloud droplet dispersion: A large-eddy simulation study and implications for aerosol indirect forcing. J. Geophys. Res. 2006, 111, D0027. [Google Scholar] [CrossRef]
  25. Desai, N.; Glienke, S.; Fugal, J.; Shaw, R.A. Search for microphysical signatures of stochastic condensation in marine boundary layer clouds using airborne digital holography. J. Geophys. Res. 2019, 124, 2739–2752. [Google Scholar] [CrossRef]
  26. Reisin, T.; Levin, Z.; Tzivion, S. Rain production in convective clouds as simulated in an axisymmetric model with detailed microphysics. Part I: Description of the model. J. Atmos. Sci. 1996, 53, 497–519. [Google Scholar] [CrossRef]
  27. Yin, Y.; Chen, L. The effects of heating by transported dust layers on cloud and precipitation: A numerical study. Atmos. Chem. Phys. 2007, 7, 3497–3505. [Google Scholar] [CrossRef]
  28. Wang, Q. Parameterization Scheme for Hygroscopicity of Aerosol in Huang Mountain of China and Its Influence on Microphysical Characteristics of Clouds. Master’s Thesis, Nanjing University of information Science and Technology, Nanjing, China, 2016. [Google Scholar]
  29. Shupe, M.D.; Kollias, P.; Persson, P.O.; McFarquhar, G.M. Vertical Motions in Arctic Mixed-Phase Stratiform Clouds. J. Atmos. Sci. 2008, 65, 1304–1322. [Google Scholar] [CrossRef]
  30. Huang, X.Y.; Lu, l.; Hong, T.; Mei, Y.; Yang, M. A case study on the retrieval of microphysical parameters and in-cloud stratus turbulent dissipa-tion rate by millimeter-wave cloud radar measurement. Trans. Atmos. Sci. 2020, 43, 908–916. (In Chinese) [Google Scholar] [CrossRef]
  31. Pruppacher, H.R.; Klett, J.D.; Wang, P.K. Microphysics of Clouds and Precipitation. Aerosol Sci. Technol. 1998, 28, 381–382. [Google Scholar] [CrossRef]
  32. Wang, Y.G.; Geerts, B. Composite Vertical Structure of Vertical Velocity in Nonprecipitating Cumulus Clouds. Mon. Weather Rev. 2013, 141, 1673–1692. [Google Scholar] [CrossRef]
  33. Kollias, P.; Albrecht, B.A.; Lhermitte, R.; Savtchenko, A. Radar Observations of Updrafts, Downdrafts, and Turbulence in Fair-Weather Cumuli. J. Atmos. Sci. 2001, 58, 1750–1766. [Google Scholar] [CrossRef]
  34. Takeda, T. Evolution of a precipitating cloud and cloud droplets. Pure Appl. Geophys. 1975, 113, 891–907. [Google Scholar] [CrossRef]
  35. Feingold, G.; McComiskey, A.; Rosenfeld, D.; Sorooshian, A. On the relationship between cloud contact time and precipitation susceptibility to aerosol. J. Geophys. Res. Atmos. 2013, 118, 10544. [Google Scholar] [CrossRef]
  36. Lee, H.; Fridlind, A.M.; Ackerman, A.S. An Evaluation of Size-Resolved Cloud Microphysics Scheme Numerics for Use with Radar Observations. Part II: Condensation and Evaporation. J. Atmos. Sci. 2021, 78, 1629–1645. [Google Scholar] [CrossRef]
Figure 1. Temperature (T) and dew point temperature (Td) as the simulation input.
Atmosphere 14 00828 g001
Figure 2. Initial aerosol number concentration size distribution (relative humidity < 60%).
Atmosphere 14 00828 g002
Figure 3. The wind fields for the different schemes for (a) exp1, (b) exp2, (c) exp3, and (d) exp4.
Atmosphere 14 00828 g003aAtmosphere 14 00828 g003b
Figure 4. The distribution of LWC with height and time in the domain field: (a) exp1, (b) exp2, (c) exp3, and (d) exp4.
Atmosphere 14 00828 g004
Figure 5. Temporal and height distributions of ε in the domain field for (a) exp1, (b) exp2, (c) exp3, and (d) exp4.
Atmosphere 14 00828 g005
Figure 6. Distributions of Nc in the domain field for (a) exp1, (b) exp2, (c) exp3, and (d) exp4.
Atmosphere 14 00828 g006
Figure 7. Joint dependence of aerosol number concentration and updraft velocity on relative dispersion.
Atmosphere 14 00828 g007
Figure 8. Joint dependence of aerosol number concentration and updraft velocity on the (a) average cloud droplet radius (μm, shading) and (b) standard deviation (μm, shading).
Atmosphere 14 00828 g008
Figure 9. Cloud droplet number concentration spectrum in the updraft velocity main influence regime.
Atmosphere 14 00828 g009
Figure 10. Cloud droplet number concentration spectrum in the joint influence regime.
Atmosphere 14 00828 g010
Figure 11. Cloud droplet number concentration spectrum in the aerosol main influence regime.
Atmosphere 14 00828 g011
Figure 12. Distribution of updraft velocity with height and time.
Atmosphere 14 00828 g012
Figure 13. Scatter correlations between ε and Nc during the collision–coalescence growth stage in the different regimes for (a) w ≤ 1.5 m/s, (b) 1.5< w ≤ 3 m/s, and (c) w > 3 m/s.
Atmosphere 14 00828 g013
Table 1. Change rates in cloud microphysical quantities under different Na and w during the collision–coalescence growth stage (units: %).
w ≤ 1.5 m/s1.5 ≤ w ≤ 3 m/sw > 3 m/s
CRNcCRεCRrCRσCRNcCRεCRrCRσCRNcCRεCRrCRσ
exp1163−22−26−42264−4−29−32303−35−33−57
exp2247−18−23−37353−21−19−3681−5−9−14
exp3409−18−16−31247−2−16−17858−10−2
exp4171−5−11−122034−15−10994−5−1
Disclaimer/Publisher’s Note: The statements, opinions and data contained in all publications are solely those of the individual author(s) and contributor(s) and not of MDPI and/or the editor(s). MDPI and/or the editor(s) disclaim responsibility for any injury to people or property resulting from any ideas, methods, instructions or products referred to in the content.

