
Analysis of the Variability Characteristics and Applicability of SPEI in Mainland China from 1985 to 2018

College of Geomatics, Xi’an University of Science and Technology, Xi’an 710054, China
*
Author to whom correspondence should be addressed.
Atmosphere 2023, 14(5), 790; https://doi.org/10.3390/atmos14050790
Submission received: 21 March 2023
/
Revised: 25 April 2023
/
Accepted: 25 April 2023
/
Published: 26 April 2023
(This article belongs to the Section Meteorology)
Abstract
:Drought is one of the most destructive natural disasters in China and can cause serious environmental and socio-economic impacts. Based on monthly precipitation and temperature data from 571 meteorological stations, the Standardized Precipitation Evapotranspiration Index (SPEI) was calculated on a 12-month scale (SPEI-12) from 1985 to 2018 in mainland China, and it was compared with the records of the Bulletin of Flood and Drought Disasters in China to verify its drought monitoring accuracy. Then, run theory was used to explore in depth the spatiotemporal distribution of drought characteristics and trends in various climatic sub-regions. The results showed that: (1) the comparison with the Bulletin of Flood and Drought Disasters in China indicated that the results of SPEI-12 monitoring drought had high accuracy and could identify drought events in mainland China. (2) About 70% of the regions in mainland China experienced droughts more than 50 times, and about 43% of the regions had drought durations of between 100 and 110 months. Nearly 11% of the regions had drought severities of more than 130, which were mainly located in the Northwest Desert (NWC), the southern part of Northeast China (NEC), and the western part of North China (NC). (3) In the past 34 years, the droughts in the Northwest Desert (NWC), the western part of Inner Mongolia (IM), and the Qinghai-Tibet Plateau (TP) showed an aridity trend, while the droughts in South China (SC) and eastern Central and South China (CSC) presented a mitigation tendency. (4) Specifically, the droughts in South China (SC) were more influenced by precipitation, while those in the Northwest Desert (NWC) and Northeast China (NEC) were influenced by temperature and potential evapotranspiration, and the evolution of drought in North China (NC) and the Qinghai-Tibet Plateau (TP) was mainly influenced by soil moisture. The study could provide scientific guidance and a reference for drought response and sustainable development in China.
1. Introduction
Drought is recognized as an environmental event with high frequency, long duration, and wide impact, which severely restricts agricultural production, disturbs ecosystem stability, and affects sustainable socio-economic development [1]. It is reported that the extreme heat will reach critical tolerance thresholds for agricultural production and human health more frequently due to rising global temperatures, further leading to increased climate change and continued increases in the frequency and severity of drought [2]. Therefore, timely and effective drought monitoring will help to reasonably respond to drought events and improve drought mitigation capabilities [3,4].
Based on the drought formation mechanism, numerous drought indicators have been established and extensively used in drought monitoring and assessment. The commonly used drought indices mainly include the Standardized Precipitation Index (SPI) [5], Palmer Drought Severity Index (PDSI) [6], and Standardized Precipitation Evapotranspiration Index (SPEI) [7]. The SPI with multiple time scales has been widely used for meteorological drought monitoring, but SPI only considers precipitation and ignores the effect of surface evapotranspiration, which is not conducive to characterizing monthly drought variations [8]. Although PDSI takes into account the impact of evapotranspiration on surface water balance, its applicability is limited by its large data requirement and the fact that some parameters can only be calculated empirically [9]. Vicente-Serrano et al. proposed [10] the SPEI based on precipitation and potential evapotranspiration (PET), which not only combines the advantages of SPI and PDSI, but it also has clear physical significance, and has thus become a more desirable index for drought monitoring at the moment.
Currently, the SPEI has been used by numerous academics to carry out a variety of studies that have mostly focused on drought characteristics [11,12], the spatiotemporal evolution of droughts [13,14], comparisons with other drought indices [15,16,17], regional applicability [18,19], and improvement of SPEI [20,21]. In recent years, numerous studies have been conducted on meteorological drought characteristics at regional scales [22], mainly focused on spatial patterns, but the evolution of drought characteristics has received less attention [23,24]. However, the temporal evolution of drought characteristics is an important aspect in the field of drought research. Therefore, there was a need to evaluate the trends of drought characteristics under different climate sub-regions in China. In addition, global warming increases concerns about the hydrological cycle. Water availability is often affected by abnormal climatic conditions that can increase or decrease precipitation and affect main parameters of the hydrological cycle (temperature, soil moisture, and evaporation), with a significant impact on the occurrence of drought [25]. However, the response mechanisms of drought to climate change are complex, and the main climate factors affecting each climate partition in China are still unclear. Therefore, the analysis of the relationship between drought and climate factors in different subregions can raise the awareness of major drought events and drought management.
China is one of the countries in which drought disasters are common and have the most severe impact. Meteorological disaster losses account for around 61% of natural disaster losses, while drought losses account for 55% of meteorological disaster losses, thus severely restricting ecological security and sustainable socioeconomic development [26,27]. The characteristics and causes of drought in different regions of China have been examined in previous studies using SPEI from a variety of angles, although the majority of the research has been conducted in the northern arid regions, mainly in the northwest, and less in the southern humid regions [28]. In recent years, severe drought events have occurred frequently in the humid regions of eastern and southern China, causing significant impacts on the production and livelihood of local people and socio-economic development. For instance, an extreme winter–spring drought occurred in southwestern China in 2009 to 2010 and in the summer of 2022, and the middle and lower reaches of the Yangtze River experienced the most severe drought in nearly 50 years of records [29]. All the above drought events have had severe adverse impacts on agriculture, the environment, and water resources, and thus a better understanding of the spatial and temporal characteristics of historical droughts is critical to mitigating the impacts of drought. In addition, due to the obvious differences in climatic conditions and drought-causing factors among regions leading to variability in the SPEI monitoring capability in each climatic sub-region and the significant changes in drought occurrence characteristics with global warming, there are few in-depth studies on the changes of drought characteristics in each climatic sub-region in mainland China. Therefore, it is necessary to conduct studies on the drought evolution characteristics of different sub-regions.
In this study, we first calculated the SPEI-12 using the meteorological data over mainland China from 1985 to 2018. Combined with the Bulletin of Flood and Drought Disasters in China, we assessed the drought monitoring capability of SPEI at the station-scale. Second, run theory was used to identify the drought characteristics while the Mann–Kendall (M–K) test was used to analyze their spatiotemporal variations in each climate sub-region. Therefore, the main objectives of this study were: (1) to assess the applicability of SPEI in drought monitoring; (2) to analyze the drought characteristics (frequency, duration, and severity) in each sub-region, and (3) to explore the spatial and temporal evolutionary trends of drought characteristics in each sub-region. The results of this study will contribute to our understanding of drought in China and provide scientific guidance for water planning and management.
2. Materials and Methods
2.1. Study Area
China is located in East Asia (73°40′ E–135°2′ E, 3°52′ N–53°33′ N), with a land area of about 9.6 × 10⁶ km2. The terrain is high in the west and low in the east, with a three-step distribution. Considering the significant differences in seasonal and regional precipitation, China is divided into 7 climate sub-regions [30], which include the temperate and warm-temperate desert of Northwest China (NWC), the temperate grassland of Inner Mongolia (IM), the temperate humid and sub-humid Northeast China (NEC), the warm-temperate humid and sub-humid North China (NC), the subtropical humid Central and South China (CSC), the Qinghai-Tibetan Plateau (TP), and the tropical humid South China (SC) (Figure 1). In addition, the drought-prone northeastern and southwestern regions of China were selected as typical regions to further evaluate the applicability of SPEI (Figure 2).
2.2. Data Sources
Meteorological data were obtained from the China Meteorological Data Service Center (http://data.cma.cn (accessed on 5 May 2022)), which contained monthly precipitation and mean temperature measurements at 571 stations from 1985 to 2018. Outliers or missing data were interpolated by calculating the arithmetic mean for the month in the study period. The historical drought events were obtained from the Bulletin of Flood and Drought Disasters in China (http://www.mwr.gov.cn/sj/tjgb/zgshzhgb (accessed on 5 May 2022)) and the Yearbook of Meteorological Disasters in China [31].
Digital elevation model data with a spatial resolution of 90 m were obtained from the Geospatial Data Cloud site, Computer Network Information Center, Chinese Academy of Sciences (http://www.gscloud.cn (accessed on 25 July 2022)). The soil moisture data with a spatial resolution of 0.05° were obtained from the National Tibetan Plateau Data Center (http://data.tpdc.ac.cn (accessed on 25 July 2022)).
2.3. Research Methods
2.3.1. Standardized Precipitation Evapotranspiration Index
SPEI is a meteorological drought index based on the difference between precipitation and PET, with multiple time scales [32]. Considering the relatively stable variation of SPEI-12, it can better reflect the interannual variation characteristics of drought. Therefore, the SPEI-12 was used to reflect the drought variation characteristics of mainland China. The degree of drought is classified by the SPEI and the classified criteria are shown in Table 1. The SPEI was calculated as follows:
If p ≤ 0.5:
And for p > 0.5:
where c0 = 2.515517, c1 = 0.802853, c2 = 0.010328, d1 = 1.432788, d2 = 0.189269, and d3 = 0.001308; p denotes the probability of exceeding the determined moisture gain/loss. Among them, the calculation of PET is mainly referred to as the Thornthwaite method by Vicente-Serrano, which was calculated as follows:
where and are the monthly average temperature and annual heat index, respectively; and is a constant determined by :
2.3.2. Drought Event Identification
Run theory was used to identify the drought characteristics of SPEI-12 (where +R and −R represent drought index values), and the schematic diagram of the run theory to extract the drought characteristics is shown in Figure 3 [11]. A “run” is interpreted as part of the time series of the drought parameter at all values below or above the selected threshold, and s therefore called a “negative run” or “positive run”, respectively [33]. The drought duration indicates the time from the beginning to the end of a drought event, drought frequency is the total number of drought events in a period, and drought severity is the cumulative value of the difference between the drought index and its threshold during the drought duration. Setting three threshold R0, R1, R2 (R0 = −1, R1 = −0.5, R2 = 0) levels, the identification process of drought characteristics was as follows:
- (1)
- If the SPEI was less than R1, it was tentatively determined that a drought occurred that month, meaning that a, b, d, and e are four possible drought events.
- (2)
- When the drought duration was one month and the SPEI was greater than R0, it was not identified as a drought event (e).
- (3)
- For two consecutive events occurring only one month apart (b and d) and if the SPEI of the intervening month was less than R2, the two drought events were considered as one drought event. The drought duration was D = Db + Dc + 1 and the drought severity was S = Sb + Sc. Conversely, they were identified as two separate events.
2.3.3. Sen’s Slope and Mann-Kendall Test
Sen’s slope method is unaffected by outliers and follows no specific distribution, which is a robust nonparametric calculation method with better judgment for long time series data and is now widely used in climate change and hydrological series analysis [34]. Sen’s slope method was used in this study to reflect the trend change in drought characteristics. The equation was expressed as follows:
where β is the slope; and are the time series values at moments i and j, respectively; and n is the total number of the time series, 1 < i < j < n. A positive β means an increasing trend, while a negative β means a decreasing trend.
The Mann–Kendall (M–K) test can quantify the trend and significance of long time series data and is widely used to detect trends in hydrometeorological time series [35]. In this study, the M–K test was employed to detect the significance of the changing trends in drought characteristics [36]. The M–K test was calculated as follows:
where S is the statistical variable; Yi, and Yj are the specific data points at locations i and j, respectively; and t is the size of the series. The significance level corresponding to the trend of change Z was defined as follows:
In this study, the trend test was performed at a specific α significance level. When the significance level α= 0.05, |Z| > Z1−α/2 = 1.96.
2.3.4. Pearson Correlation Analysis
The Pearson correlation coefficient (R) was used to analyze the correlation between SPEI and meteorological factors such as precipitation, temperature, and evapotranspiration. It was calculated as follows [37]:
where is the series value of SPEI; is the series value of meteorological factor; is the average of the SPEI series; is the average of meteorological factor series; m is the number of stations; and i represents the series number of the observation month.
3. Results
3.1. SPEI-12 Applicability Based on Typical Historical Drought Events
In this study, the accuracy of the SPEI-12 in monitoring drought events was verified in combination with Bulletin of Flood and Drought Disasters in China. As recorded, severe drought events were frequent in 2007 and 2009. Since February 2007, drought conditions have been severe due to the decrease in precipitation and insufficient water storage in water conservancy projects in Chongqing, Sichuan, and other places. In early August 2007, severe drought occurred in Heilongjiang, western Jilin, eastern Inner Mongolia, Jiangxi, southwestern Hunan, and northwestern Guangxi. In 2009, the drought was severe and widespread. Early February was the peak of the winter–spring drought, and central Shanxi, south-central Hebei, northeastern Henan, western Shandong, northwestern Anhui, and other areas continued to receive less rainfall. The drought-affected area of crops reached 1.02 × 10⁵ km2. Mid-August was the peak of the summer drought, and Liaoning, Jilin, Heilongjiang, Inner Mongolia, Hebei, and Shanxi were more severely affected by this drought event.
The ability of the SPEI-12 to monitor drought conditions was assessed using typical drought events from 2007 to 2009. As shown in Figure 4, moderate and above droughts occurred in the spring of 2007 in Sichuan, Chongqing, northern Guizhou, southern Gansu, and Ningxia, with Sichuan, Chongqing, and central to southern Ningxia suffering the most. In the summer of 2007, a relatively extreme drought appeared in Heilongjiang, western Jilin, eastern Inner Mongolia, northern Jiangxi, and Guangxi, with the northeastern region of Inner Mongolia and northern Jiangxi experiencing extreme drought. Drought monitoring results were mostly consistent with historical drought records according to comparisons. In the spring of 2009, Shaanxi, south-central Shanxi, Gansu, northwestern Shandong, and northeastern Henan all experienced drought conditions above mild drought, with Gansu, central Shanxi, and northeastern Henan experiencing severe drought. This indicated that the SPEI-12 monitoring results on the extent and severity of drought were highly consistent with the actual conditions. In the summer of 2009, mild and above droughts occurred in Liaoning, western Jilin, Inner Mongolia, northern Shanxi, and northeastern Hebei, and severe drought was experienced in Inner Mongolia and northeastern Hebei, which were basically consistent with the severity and range of drought events. In general, the SPEI was effective in drought monitoring and could effectively identify the evolution of drought development.
3.2. SPEI Drought Event Identification in Typical Regions
To further verify the accuracy of SPEI, the drought-prone northeastern and southwestern parts of China were selected as typical regions. According to the Yearbook of Meteorological Disasters in China, a severe drought affected Northeast China from 2004 to 2005, with the worst affected regions primarily being western Liaoning, central Jilin, and southwestern Heilongjiang. Figure 5a shows that the regions with the highest frequency of drought occurrence were mostly concentrated in west-central Jilin and southern Liaoning. SPEI monitored droughts of long duration and high severity mainly in northwestern Liaoning, southwestern Heilongjiang, and west-central Jilin, which was generally consistent with records, and the identification results were in general agreement with the findings of Xue et al. [38].
According to the 2009 Bulletin, the southwest of China suffered from a widespread and prolonged autumn–winter–spring drought from the fall of 2009 to the spring of 2010. In February 2010, extreme drought regions in the southwest expanded, and most regions of Yunnan, western Guizhou, and northwestern Guangxi all reached extreme drought conditions in March. Yunnan was extremely damaged by the drought and was the province that suffered the largest area of damage in southwest China. As demonstrated in Figure 5b, the high frequency areas where drought occurred were mainly in Guizhou and Yunnan. The areas with long duration of drought were mainly concentrated in most of Yunnan, southern Sichuan, and northwestern Guangxi, and the drought duration was between 10 and 25 months. The areas with higher drought severity in southwest China were mainly concentrated in Yunnan. The descriptions of drought extent and severity by SPEI-12 were close to the records and more consistent with the results of Li et al. [39].
3.3. Spatial Distribution of Drought Characteristics
Figure 6a depicts the spatial distribution of the drought frequency in each climate sub-region. The drought frequency was between 50 and 64 times in 70% of the stations nationwide, which were mainly concentrated in the southern NEC, western NC, and eastern CSC regions. Drought frequency was lower in the western IM, southern CSC, and southern TP regions, with frequencies below 40 times. It can be seen that 43% of the national stations had drought durations of 100–110 months, and the drought duration in the south was generally short and low in severity. Meanwhile, the regions with drought durations over 120 months were mainly concentrated in the NWC, southern NEC, and eastern NC regions (Figure 6b). Drought severity and duration had a certain similarity in spatial distribution, and the corresponding drought severity was greater in areas with longer drought duration (Figure 6c). Overall, the distribution of meteorological drought characteristics in China was uneven. Although droughts were less frequent in the NWC region, they were longer in duration and more severe, whereas droughts in the SC region were more frequent but shorter in duration and less severe.
To further analyze the drought conditions in each climate sub-region of China, the frequency, duration, and severity of drought events in each sub-region from 1985 to 2018 were summarized in this study. The maximum drought frequency occurred in the NC region, and the minimum frequency occurred in the TP region (Figure 7a). From Figure 7b it can be seen that the drought durations in the NWC and TP regions were more concentrated above 110 months, while the durations in the CSC region were concentrated between 100 and 110 months. This was attributed to the fact that the former mostly belongs to the northwest arid region and the Qinghai-Tibet alpine region, while the latter belongs to the humid and sub-humid region of China, resulting in a greater degree of interannual variation in the calculated drought characteristics. Lastly, compared with other regions, the drought degree in NWC was deeper, with a drought severity above 130. In the TP and SC regions, the drought severity was relatively low, mostly below 120 (Figure 7c). The findings presented above were more consistent with the analysis of Wang et al. [40] of the spatial distribution characteristics of drought in mainland China.
3.4. Spatial Patterns of Trends in Drought Characteristics
Figure 8 depicts the spatial variations of drought characteristics in each climate sub-region. The frequency of drought in the southeastern NWC, northern TP, and southwestern IM regions and most stations in the NC region showed a significant increasing trend (p < 0.05), while the stations with a significant decreasing trend were mainly located in the CSC region. Most of the stations that did not pass the significance test showed an increasing trend, indicating an increase in the frequency of drought throughout the region (Figure 8a). The interannual trend of drought duration is depicted in Figure 8b. Most of the stations showed an increasing trend of drought duration from the southeast region to the western inland, indicating that the drought duration was increasing annually, and the drought duration in the NWC and TP regions had a significantly increasing trend. Figure 8c depicts the increasing trend in the severity of drought at most stations during the past 34 years. Drought severity increased in the NWC, northwestern IM, western NEC, southwestern CSC, and TP regions, with Xinjiang, Qinghai, Gansu, Ningxia, and Sichuan having the most significant upward trends. Qin et al. [41] found that precipitation in northwestern China showed an increasing trend, and the severe drought regions were mainly distributed in the junction part of Xinjiang, Qinghai, and Gansu. However, the climate of this region generally showed a slowing down of warming and humidification, which was basically consistent with the conclusion obtained in this study.
Figure 9a shows that the trends in drought frequency indicated that droughts became more frequent in the NWC and IM regions, with drought frequency increasing approximately 0.45% per 5 years. There was a consistent trend in the severity and duration of droughts, such as in the NWC, IM, and TP regions. Most regions showed an increasing trend in the severity of droughts, with a general trend towards warming and dryness, while droughts in the SC region presented a mitigation tendency (Figure 9b,c).
4. Discussion
4.1. Applicability and Impact Factor of SPEI
By comparing the above SPEI monitoring results with historical disaster records in typical regions, the SPEI showed better applicability in the eastern monsoon region, but there were some differences from historical drought records in the NWC and TP regions. The common characteristics of the NWC and TP regions were complex climates and topography and low average temperatures [42]. The NWC region is deeply inland, far from the ocean, and it is influenced by mountainous terrain and a monsoon climate. Large spatial variations in temperature and precipitation resulted in significant differences in the spatial and temporal distribution of the drought characteristics. The Thornthwaite method for calculating PET overestimates the effect of precipitation deficit on drought severity, thus causing the SPEI to deviate from the actual situation in the region [43]. The reason for the low reliability of SPEI in the TP region was that climate change studies in the TP region have been limited by the scarcity of observations, especially at the extremely sparse stations in the western part of the plateau [44]. The low spatial density of meteorological stations in TP region increased the uncertainty of SPEI calculations using data from this region. Additionally, the proportion of evapotranspiration anomalies (caused by temperature changes) in the surface water balance of the TP region was relatively large, and the contribution of temperature to drought was often overestimated by SPEI, thus causing some of the variation.
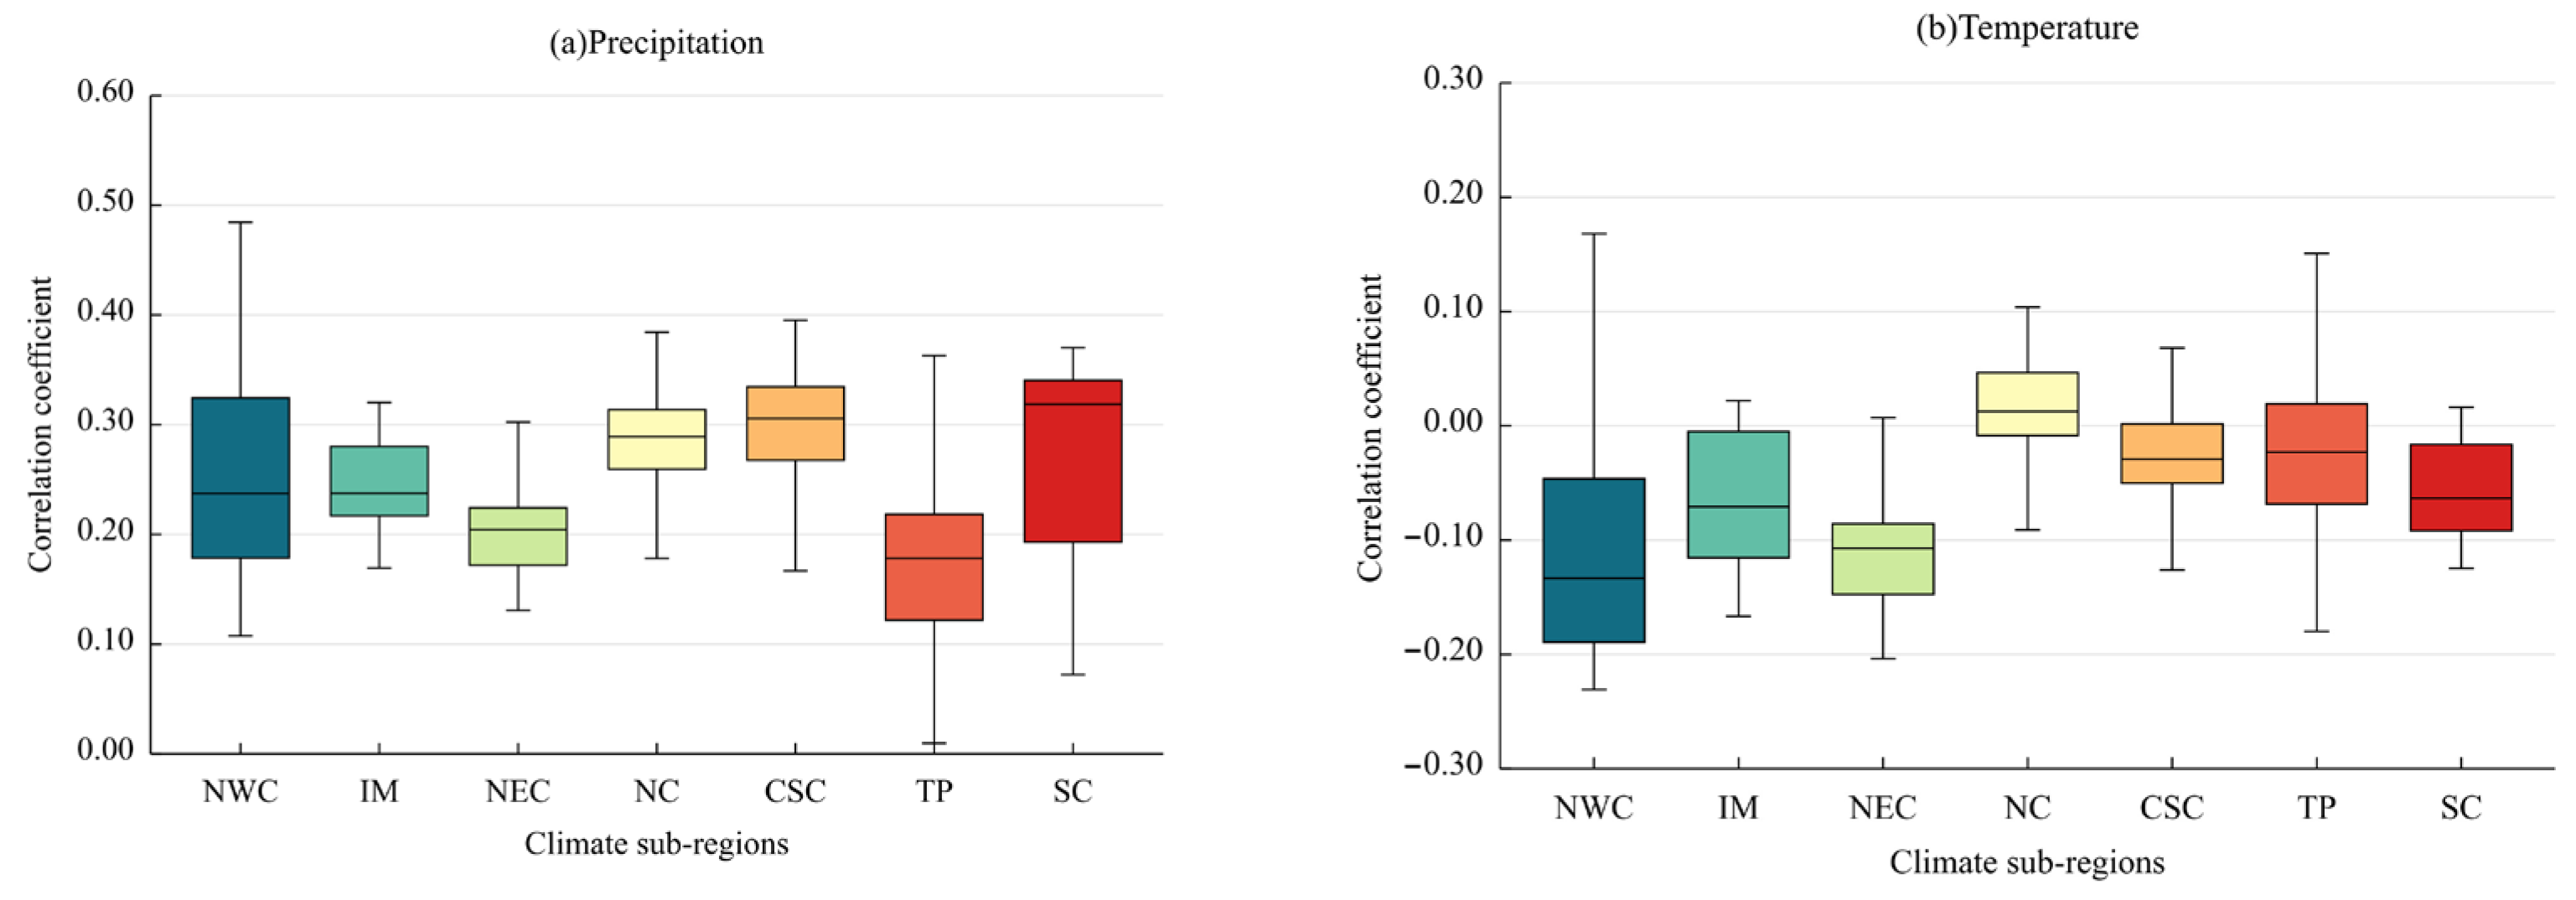
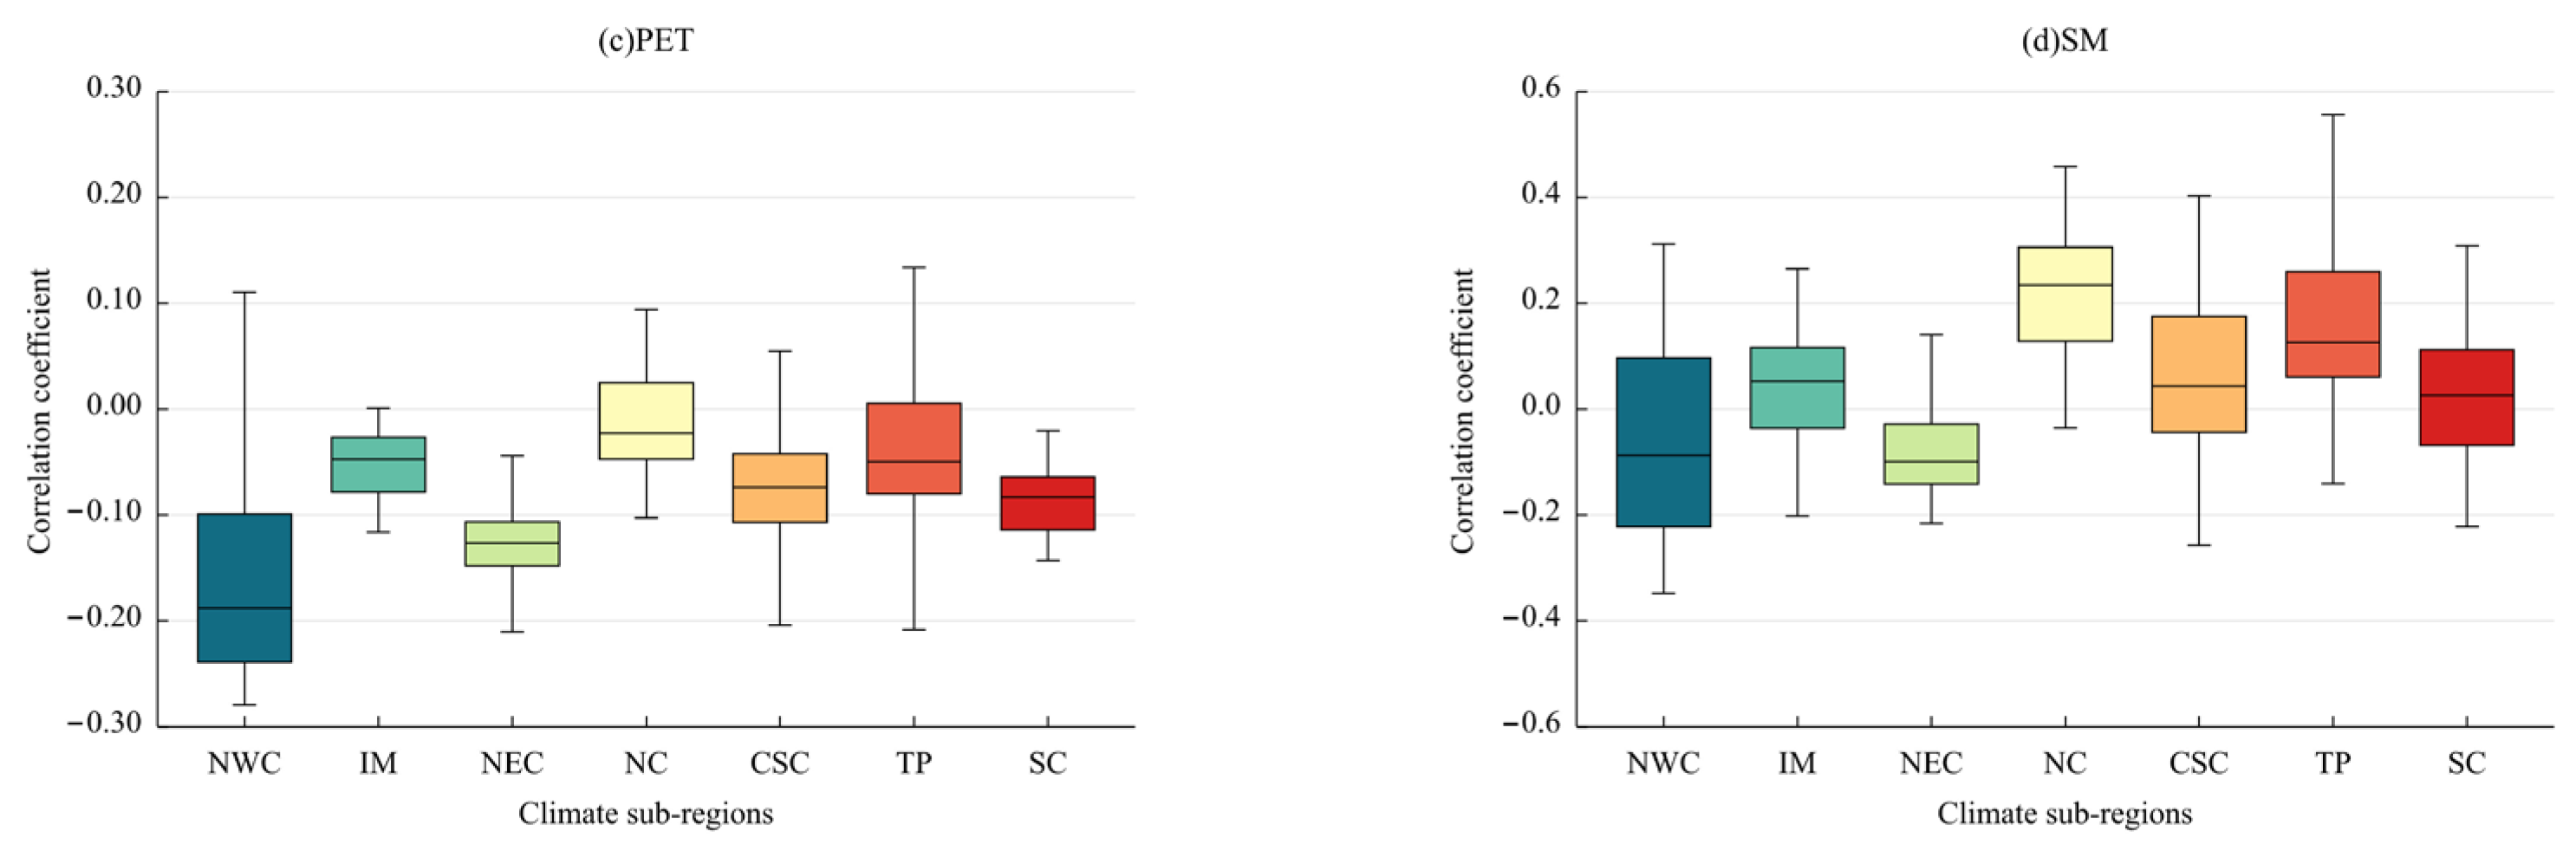
Precipitation is the dominant factor affecting drought, but factors such as temperature, air pressure, and wind speed also affect the drought process by influencing evapotranspiration [45]. To quantify the influence of climatic conditions on SPEI drought monitoring results, this study calculated correlation coefficients between SPEI and meteorological factors, including precipitation, temperature, PET, and soil moisture, in seven climate sub-regions (Figure 10). The response of precipitation to drought was more sensitive in the SC region, followed by that in the CSC and NC regions. The temperature response to drought was more sensitive in the NWC, NEC, and IM regions. The continued increase in temperature due to global warming has intensified the aridification trend in the region. The higher response of PET to drought was distributed in the NWC and NEC regions, indicating that drought in the above regions depends to a greater extent on PET. The response of soil moisture to drought was higher in the NC and TP regions, which showed that drought in the above regions is influenced by soil moisture to a greater extent.
For the NWC and IM regions, both belong to the northwest arid zone with little influence of the marine monsoon in the summer and thus have low precipitation and high evapotranspiration. In the context of global warming, extreme heat wave events were frequent in the NWC region, and the higher temperature caused an increase in evapotranspiration, which further affected the water deficit and thus aggravated drought severity. The contribution of temperature would further increase drought severity, which was consistent with the conclusion reached in the study by by Li et al. [46]. For the SC, NC, and CSC regions, which belong to the same eastern monsoon region under the influence of a humid monsoon climate, precipitation is more abundant but the spatiotemporal distribution is extremely uneven and easily triggers long-term and large-scale drought. Therefore, precipitation was the direct cause of drought in the above regions. The atmospheric circulation anomalies resulting in precipitation anomalies had a greater impact on drought in the eastern monsoon region. This is directly related to the increased frequency of summer winds in the highlands and the increased intensity of subtropical high pressure in recent years [47]. It was also found that when high values of drought regions and drought severity occurred, the corresponding annual mean temperature in the eastern monsoon region was relatively high, indicating that the climate in the eastern monsoon region became warmer and drier with global warming and local droughts became extreme. While the TP region belongs to the high-altitude region with low temperatures and low moisture evaporation, the degradation of the permafrost layer under the influence of climate warming has led to the reduction of surface soil moisture, which is the main cause of drought. Therefore, soil moisture was closely related to drought, which was consistent with the results of a previous study [48].
In summary, SPEI is more applicable to drought monitoring in humid regions and less applicable in arid and semi-arid regions. The findings of this study provide a scientific basis for initiating and enhancing drought adaptation measures on a large scale in mainland China, especially in the NWC region. Related studies suggest that the future climate in northern China will become warmer and wetter, with drought intensity being mitigated. However, our work indicated that drought in these regions still requires more consideration in the future [49]. Based on temperature and precipitation data, SPEI mainly considers the influence of water balance on drought and takes less account of PET, soil, atmospheric circulation, and other factors. Therefore, it has failed to fully reflect the impact of climate change on actual drought and the drought impact factors require further research.
4.2. Analysis of Physical Mechanisms of Trends in Drought Characteristics
Comparing the spatial distribution of different drought characteristics in mainland China indicated that droughts in the NWC region were long in duration and had high severity. Related studies indicated that the lack of precipitation and the sudden intensification of climate warming were the main factors leading to the occurrence of drought in northwest China due to the transition from warm-dry to warm-wet in recent decades [50]. In addition, El Niño (ENSO) events also aggravated the drought in the northwest region. The abnormal atmospheric circulation resulted in the inability of cold and warm air masses to converge, which was a major reason for the aggravation of drought [51]. Therefore, in this study, drought in the NWC region showed a pattern of long duration and high severity. The high drought frequency occurring in the southern part of the NEC region could be explained by changes in the intensity of the southeastern monsoon, which have significantly weakened precipitation and resulted in a higher drought frequency [52]. The higher frequency of droughts may also be related to changes in the subsurface resulting from the development of large-scale agriculture through four periods. The sudden warming of the temperature in the NEC region is directly related to the large-scale development of the wetlands in the Sanjiang Plain. In conclusion, precipitation and temperature play a common role in the drought variation patterns in the NEC region [53].
Relevant studies have shown that a significant spatial difference in precipitation between the southern and northern parts of the TP region occurs, with water vapor from the south contributing more to the increase in precipitation in the northern part of the plateau while higher temperatures increase evapotranspiration, thus offsetting the contribution of increased precipitation to soil moisture [54]. The shortage of soil moisture increases the aridity in the northern part of the TP region; at the same time, the increase in cumulus temperature due to the continuous increase in temperature also intensifies the aridity in the northern part of the plateau [55]. On the one hand, the IM region experiences low precipitation in the spring and winter and the low connotation of surface water sources, thus greater evaporation will further aggravate drought. On the other hand, since Inner Mongolia is located at the edge of the East Asian summer wind influence region, precipitation in the southeastern region may be severely constrained by the summer wind [56]. Since the 1970s, the intensity of the East Asian summer wind has generally shown a significant weakening trend, resulting in a non-significant increasing trend in drought in the southern IM region. This may also be related to the accelerated transpiration of vegetation and reduced soil moisture due to global warming. Vegetation (especially grassland) growth has been suppressed and the grassland has become degraded, leading to intensified drought [57].
However, the western part of the NC region was vulnerable to drought and the drought frequency was high. The weakened interdecadal variability of the North Pacific Ocean in North China has led to a reduction of the East Asian summer wind, which directly led to the reduction of summer precipitation in the western part of the NC region [58]. In terms of atmospheric circulation changes, the main reason for the occurrence of meteorological droughts in the NC region was the influence of ENSO events. In terms of global changes, drought was mainly affected by rapid urbanization and global warming [59]. The SC region is a tropical-south subtropical monsoon climate with high temperature and rainfall that borders on tropical oceans. Additionally, the region is under the joint influence of low-latitude tropical weather systems and mid- and high-latitude temperate weather systems, with abundant annual precipitation but extremely uneven spatial and temporal distribution. Combined with the effects of high solar radiation and intense evaporation, seasonal and regional droughts are prominent in South China [60]. It has been shown that El Niño events (ENSO) are the main cause of droughts in South China. When an ENSO event occurs, it causes more rain in South China in autumn and changes the atmospheric circulation, thus affecting drought events. Therefore, ENSO events were an important factor for the frequent occurrence of low-intensity and short-term droughts in the region [61,62].
5. Conclusions
In this study, based on monthly precipitation and temperature data from 571 meteorological stations across mainland China from 1985 to 2018, the Thornthwaite method was used to estimate the potential evapotranspiration for the study period and then the SPEI was calculated on a 12-month timescale. The drought monitoring capability of SPEI was evaluated in comparison to the typical drought events recorded in the Bulletin of Flood and Drought Disasters in China, and the drought characteristics and variation trends of each climate sub-region were analyzed. The results of the study indicated that:
- The descriptions of the extent and severity of drought by SPEI-12 basically matched the real drought events, indicating that SPEI-12 can better reflect the development process of drought events.
- Over the last 34 years, the spatial distribution of drought characteristics in mainland China has changed significantly. About 70% of the regions had drought frequencies between 50 and 64 times, and about 43% of the regions had drought durations between 100 and 110 months. Nearly 11% of the regions had drought severities of more than 110, with the NWC, southern NEC, and eastern NC regions being more severely affected.
- The spatial patterns indicated that regions with higher drought severity were associated with higher drought duration. The NWC, western part of IM, and TP regions all showed a significant increasing trend, while a decreasing trend was observed in the SC and eastern CSC regions.
- The SPEI was more applicable to drought monitoring in humid regions and less applicable in arid and semi-arid regions. Precipitation had the greatest positive correlation with drought in the SC region, indicating that drought was more sensitive to precipitation. The evolution of drought in the NWC and MEC regions was mainly influenced by temperature and PET, while soil moisture was more responsive to drought in the NC and TP regions.
Author Contributions
Conceptualization, X.S. and Y.Y.; methodology, Y.Y.; software, X.S.; validation, H.D., F.C. and M.S.; formal analysis, X.S.; investigation, Y.Y.; resources, Y.Y.; data curation, H.D.; writing—original draft preparation, Y.Y.; writing—review and editing, X.S.; visualization, M.S.; supervision, F.C.; project administration, X.S.; funding acquisition, X.S. All authors have read and agreed to the published version of the manuscript.
Funding
This research was funded by [National Natural Science Foundation of China] grant number [52079103].
Institutional Review Board Statement
Not applicable.
Informed Consent Statement
Not applicable.
Data Availability Statement
Not applicable.
Acknowledgments
The authors would like to thank the editors and referees for their valuable comments on this article.
Conflicts of Interest
The authors declare no conflict of interest.
References
- Yao, N.; Li, Y.; Lei, T.; Peng, L. Drought evolution, severity and trends in China’s mainland over 1961–2013. Sci. Total Environ. 2018, 616, 73–89. [Google Scholar] [CrossRef] [PubMed]
- Jiang, D.; Wang, X. A brief interpretation of drought change from IPCC Sixth Assessment Report. Trans. Atmos. Sci. 2021, 44, 650–653. (In Chinese) [Google Scholar]
- West, H.; Quinn, N.; Horswell, M. Remote sensing for drought monitoring & impact assessment: Progress, past challenges and future opportunities. Remote Sens. Environ. 2019, 232, 111291. [Google Scholar]
- Ali, Z.; Hussain, I.; Faisal, M.; Grzegorczyk, M.A.; Almanjahie, I.M.; Nazeer, A.; Ahmad, I. Characterization of regional hydrological drought using improved precipitation records under multi-auxiliary information. Theor. Appl. Clim. 2020, 140, 25–36. [Google Scholar] [CrossRef]
- Mckee, T.B.; Doesken, N.J.; Kleist, J. The Relationship of Drought Frequency and Duration to Time Scales. J. Environ. Sci. 1993, 17, 179–183. [Google Scholar]
- Palmer, W.C. Meteorological Drought; US Department of Commerce, Weather Bureau: Silver Spring, MD, USA, 1965; Volume 45, pp. 1–58.
- Vicente-Serrano, S.M.; Beguería, S.; López-Moreno, J.I. A Multiscalar Drought Index Sensitive to Global Warming: The Standardized Precipitation Evapotranspiration Index. J. Clim. 2010, 23, 1696–1718. [Google Scholar] [CrossRef]
- Silva, T.; Pires, V.; Cota, T.; Silva, Á. Detection of Drought Events in Setúbal District: Comparison between Drought Indices. Atmosphere 2022, 13, 536. [Google Scholar] [CrossRef]
- Liu, Z.; Wang, Y.; Shao, M.; Jia, X.; Li, X. Spatiotemporal analysis of multiscalar drought characteristics across the Loess Plateau of China. J. Hydrol. 2016, 534, 281–299. [Google Scholar] [CrossRef]
- Beguería, S.; Vicente-Serrano, S.M.; Reig, F.; Latorre, B. Standardized precipitation evapotranspiration index (SPEI) revisited: Parameter fitting, evapotranspiration models, tools, datasets and drought monitoring. Int. J. Climatol. 2014, 34, 3001–3023. [Google Scholar] [CrossRef]
- Li, Y.; Jia, C.; Ma, S.; Hu, Z.; Sun, J. Refined spatiotemporal analysis of drought characteristics under different characteristic variable matchings: A case study of the middle reaches of the Yellow River basin, China. ESPR 2022, 29, 60440–60458. [Google Scholar] [CrossRef]
- Politi, N.; Vlachogiannis, D.; Sfetsos, A.; Nastos, P.T.; Dalezios, N.R. High Resolution Future Projections of Drought Characteristics in Greece Based on SPI and SPEI Indices. Atmosphere 2022, 13, 1468. [Google Scholar] [CrossRef]
- Wu, M.; Li, Y.; Hu, W.; Yao, N.; Liu, D.L. Spatiotemporal variability of standardized precipitation evapotranspiration index in mainland China over 1961 2016. Int. J. Climatol. 2020, 40, 4781–4799. [Google Scholar] [CrossRef]
- Mathbout, S.; Lopez-Bustins, J.A.; Martin-Vide, J.; Bech, J.; Rodrigo, F.S. Spatial and temporal analysis of drought variability at several time scales in Syria during 1961–2012. Atmos. Res. 2018, 200, 153–168. [Google Scholar] [CrossRef]
- Shi, X.; Ding, H.; Wu, M.; Zhang, N.; Shi, M.; Chen, F.; Li, Y. Effects of different types of drought on vegetation in Huang-Huai-Hai River Basin, China. Ecol. Indic. 2022, 144, 109428. [Google Scholar] [CrossRef]
- Wable, P.S.; Jha, M.K.; Shekhar, A. Comparison of Drought Indices in a Semi-Arid River Basin of India. Water Resour. Manag. 2019, 33, 75–102. [Google Scholar] [CrossRef]
- Teweldebirhan, T.D.; Uddameri, V.; Forghanparast, F.; Hernandez, E.A.; Ekwaro-Osire, S. Comparison of Meteorological- and Agriculture-Related Drought Indicators across Ethiopia. Water 2019, 11, 2218. [Google Scholar] [CrossRef]
- Yang, Q.; Li, M.; Zheng, Z.; Ma, Z. Regional applicability of seven meteorological drought indices in China. Sci. China Earth Sci. 2017, 60, 745–760. [Google Scholar] [CrossRef]
- Adnan, S.; Ullah, K.; Shuanglin, L.; Gao, S.; Khan, A.H.; Mahmood, R. Comparison of various drought indices to monitor drought status in Pakistan. Clim. Dyn. 2018, 51, 1885–1899. [Google Scholar] [CrossRef]
- Shi, X.; Chen, F.; Shi, M.; Ding, H.; Li, Y. Construction and application of Optimized Comprehensive Drought Index based on lag time: A case study in the middle reaches of Yellow River Basin, China. Sci. Total Environ. 2022, 857, 159692. [Google Scholar] [CrossRef]
- Xu, Y.; Zhu, X.; Cheng, X.; Gun, Z.; Lin, J.; Zhao, J.; Yao, L.; Zhou, C. Drought assessment of China in 2002–2017 based on a comprehensive drought index. Agric. For. Meteorol. 2022, 319, 108922. [Google Scholar] [CrossRef]
- Ayantobo, O.O.; Li, Y.; Song, S.; Yao, N. Spatial comparability of drought characteristics and related return periods in China’s mainland over 1961–2013. J. Hydrol. 2017, 550, 549–567. [Google Scholar] [CrossRef]
- Yu, H.; Wang, L.; Yang, M. Zonal Patterns of Meteorological Drought on the Yunnan-Guizhou Plateau, China. Front. Environ. Sci. 2021, 9, 445. [Google Scholar] [CrossRef]
- Zhao, J.; Liu, Q.; Lu, H.; Wang, Z.; Zhang, K.; Wang, P. Future droughts in China using the standardized precipitation evapotranspiration index (SPEI) under multi-spatial scales. Nat. Hazards Rev. 2021, 109, 615–636. [Google Scholar] [CrossRef]
- Sun, H.; Hu, H.; Wang, Z.; Lai, C. Temporal Variability of Drought in Nine Agricultural Regions of China and the Influence of Atmospheric Circulation. Atmosphere 2020, 11, 990. [Google Scholar] [CrossRef]
- Zhang, Q.; Yao, Y.; Li, Y.; Huang, J.; Ma, Z.; Wang, Z.; Wang, S.; Wang, Y.; Zhang, Y. Causes and Changes of Drought in China:Research Progress and Prospects. J. Meteorol. Res. 2020, 34, 460–481. [Google Scholar] [CrossRef]
- Jia, H.; Chen, F.; Zhang, J.; Du, E. Vulnerability Analysis to Drought Based on Remote Sensing Indexes. Int. J. Environ. Res. Public Health 2020, 17, 7660. [Google Scholar] [CrossRef] [PubMed]
- Yang, P.; Xia, J.; Zhang, Y.; Zhan, C.; Cai, W.; Zhang, S.; Wang, W. Quantitative study on characteristics of hydrological drought in arid area of Northwest China under changing environment. J. Hydrol. 2021, 597, 126343. [Google Scholar] [CrossRef]
- Ma, M.; Qu, Y.; Lyu, J.; Zhang, X.; Su, Z.; Gao, H.; Yang, X.; Chen, X.; Jiang, T.; Zhang, J.; et al. The 2022 extreme drought in the Yangtze River Basin: Characteristics, causes and response strategies. River 2022, 1, 162–171. [Google Scholar] [CrossRef]
- Zhao, S. A new scheme for comprehensive physical regionalization in China. Acta. Geogr. Sin. 1983, 38, 1–10. (In Chinese) [Google Scholar]
- China Meteorological Administration. Yearbook of Meteorological Disasters in China; Meteorological Press: Beijing, China, 2004. (In Chinese)
- Llanes-Cárdenas, O.; Gaxiola-Hernández, A.; Estrella-Gastelum, R.; Norzagaray-Campos, M.; Troyo-Diéguez, E.; Pérez-González, E.; Ruiz-Guerrero, R.; Cervantes, M.d.J.P. Variability and Factors of Influence of Extreme Wet and Dry Events in Northern Mexico. Atmosphere 2018, 9, 122. [Google Scholar] [CrossRef]
- Yildirim, G.; Rahman, A.; Singh, V.P. Meteorological and hydrological drought hazard, frequency and propagation analysis: A case study in southeast Australia. J. Hydrol. Reg. Stud. 2022, 44, 101229. [Google Scholar] [CrossRef]
- Suroso, S.; Nadhilah, D.; Ardiansyah, A.; Aldrian, E. Drought detection in Java Island based on Standardized Precipitation and Evapotranspiration Index (SPEI). J. Water Clim. Chang. 2021, 12, 2734–2752. [Google Scholar] [CrossRef]
- Zhou, J.; Wang, Y.; Su, B.; Wang, A.; Tao, H.; Zhai, J.; Kundzewicz, Z.W.; Jiang, T. Choice of potential evapotranspiration formulas influences drought assessment: A case study in China. Atmos. Res. 2020, 242, 104979. [Google Scholar] [CrossRef]
- Shi, M.; Yuan, Z.; Shi, X.; Li, M.; Chen, F.; Li, Y. Drought assessment of terrestrial ecosystems in the Yangtze River Basin, China. J. Clean. Prod. 2022, 362, 132234. [Google Scholar] [CrossRef]
- Yan, Y.; Mao, K.; Shen, X.; Cao, M.; Xu, T.; Guo, Z.; Bao, Q. Evaluation of the influence of ENSO on tropical vegetation in long time series using a new indicator. Ecol. Indic. 2021, 129, 107872. [Google Scholar] [CrossRef]
- Xue, L.; Kappas, M.; Wyss, D.; Putzenlechner, B. Assessing the Drought Variability in Northeast China over Multiple Temporal and Spatial Scales. Atmosphere 2022, 13, 1506. [Google Scholar] [CrossRef]
- Li, X.; Li, Y.; Chen, A.; Gao, M.; Slette, I.J.; Piao, S. The impact of the 2009/2010 drought on vegetation growth and terrestrial carbon balance in Southwest China. Agric. For. Meteorol. 2019, 269, 239–248. [Google Scholar] [CrossRef]
- Wang, Q.; Zeng, J.; Qi, J.; Zhang, X.; Cong, J. A multi-scale daily SPEI dataset for drought characterization at observation stations over mainland China from 1961 to 2018. Earth Syst. Sci. Data 2021, 13, 331–341. [Google Scholar] [CrossRef]
- Qin, J.; Su, B.; Tao, H.; Wang, Y.; Huan, J.; Li, Z.; Jiang, T. Spatio-temporal variations of dryness/wetness over Northwest China under different SSPs-RCPs. Atmos. Res. 2021, 259, 105672. [Google Scholar] [CrossRef]
- Gong, X.; Du, S.; Li, F.; Ding, Y. Study on the Spatial and Temporal Characteristics of Mesoscale Drought in China under Future Climate Change Scenarios. Water 2021, 13, 2761. [Google Scholar] [CrossRef]
- Ortiz-Gómez, R.; Flowers-Cano, R.S.; Medina-García, G. Sensitivity of the RDI and SPEI Drought Indices to Different Models for Estimating Evapotranspiration Potential in Semiarid Regions. Water Resour. Manag. 2022, 36, 2471–2492. [Google Scholar] [CrossRef]
- Sun, S.; Zhang, Q.; Xu, Y.; Yuan, R. Integrated Assessments of Meteorological Hazards across the Qinghai-Tibet Plateau of China. Sustainability 2021, 13, 10402. [Google Scholar] [CrossRef]
- Dayal, K.S.; Deo, R.C.; Apan, A.A. Investigating Drought Duration-Severity-Intensity Characteristics Using the Standardized Precipitation-Evapotranspiration Index: Case Studies in Drought-Prone Southeast Queensland. J. Hydrol. Eng. 2017, 23, 05017029. [Google Scholar] [CrossRef]
- Li, X.; You, Q.; Ren, G.; Wang, S.; Zhang, Y.; Yang, J.; Zheng, G. Concurrent droughts and hot extremes in Northwest China from 1961 to 2017. Int. J. Climatol. 2019, 39, 2186–2196. [Google Scholar] [CrossRef]
- Ma, B.; Zhang, B.; Jia, L.; Huang, H. Conditional distribution selection for SPEI-daily and its revealed meteorological drought characteristics in China from 1961 to 2017. Atmos. Res. 2020, 246, 105108. [Google Scholar] [CrossRef]
- Hamal, K.; Sharma, S.; Khadka, N.; Haile, G.G.; Joshi, B.B.; Xu, T.; Dawadi, B. Assessment of drought impacts on crop yields across Nepal during 1987–2017. Meteorol. Appl. 2020, 27, e1950. [Google Scholar] [CrossRef]
- Han, R.; Li, Z.; Li, Z.; Han, Y. Spatial–Temporal Assessment of Historical and Future Meteorological Droughts in China. Atmosphere 2021, 12, 787. [Google Scholar] [CrossRef]
- Yang, L.; Tian, J.; Fu, Y.; Zhu, B.; He, X.; Gao, M.; Odamtten, M.T.; Kong, R.; Zhang, Z. Will the arid and semi-arid regions of Northwest China become warmer and wetter based on CMIP6 models? Hydrol. Res. 2021, 53, 29–50. [Google Scholar] [CrossRef]
- Liu, Z.; Menzel, L.; Dong, C.; Fang, R. Temporal dynamics and spatial patterns of drought and the relation to ENSO: A case study in Northwest China. Int. J. Climatol. 2016, 36, 2886–2898. [Google Scholar] [CrossRef]
- Cao, S.; Zhang, L.; He, Y.; Zhang, Y.; Chen, Y.; Yao, S.; Yang, W.; Sun, Q. Effects and contributions of meteorological drought on agricultural drought under different climatic zones and vegetation types in Northwest China. Sci. Total Environ. 2022, 821, 153270. [Google Scholar] [CrossRef]
- Ye, L.; Shi, K.; Zhang, H.; Xin, Z.; Hu, J.; Zhang, C. Spatio-Temporal Analysis of Drought Indicated by SPEI over Northeastern China. Water 2019, 11, 908. [Google Scholar] [CrossRef]
- Feng, W.; Lu, H.; Yao, T.; Yu, Q. Drought characteristics and its elevation dependence in the Qinghai-Tibet plateau during the last half-century. Sci. Rep. 2020, 10, 14323. [Google Scholar] [CrossRef] [PubMed]
- Zeng, Z.; Wu, W.; Li, Y.; Zhou, Y.; Zhang, Z.; Zhang, S.; Guo, Y.; Huang, H.; Li, Z. Spatiotemporal Variations in Drought and Wetness from 1965 to 2017 in China. Water 2020, 12, 2097. [Google Scholar] [CrossRef]
- An, Q.; He, H.; Nie, Q.; Cui, Y.; Gao, J.; Wei, C.; Xie, X.; You, J. Spatial and Temporal Variations of Drought in Inner Mongolia, China. Water 2020, 12, 1715. [Google Scholar] [CrossRef]
- Wang, Y.; Liu, G.; Guo, E. Spatial distribution and temporal variation of drought in Inner Mongolia during 1901–2014 using Standardized Precipitation Evapotranspiration Index. Sci. Total Environ. 2019, 654, 850–862. [Google Scholar] [CrossRef]
- Xu, Y.; Zhang, X.; Wang, X.; Hao, Z.; Singh, V.P.; Hao, F. Propagation from meteorological drought to hydrological drought under the impact of human activities: A case study in northern China. J. Hydrol. 2019, 579, 124147. [Google Scholar] [CrossRef]
- Liu, Y.; Zhu, Y.; Chen, H. Interannual Variability in August Drought in Northern China and the Corresponding Climate Shift. J. Geophys. Res. Atmos. 2021, 126, e2020JD034105. [Google Scholar] [CrossRef]
- Zhang, Q.; Yao, Y.; Wang, Y.; Wang, S.; Wang, J.; Yang, J.; Wang, J.; Li, Y.; Shang, J.; Li, W. Characteristics of drought in Southern China under climatic warming, the risk, and countermeasures for prevention and control. Theor. Appl. Climatol. 2019, 136, 1157–1173. [Google Scholar] [CrossRef]
- Sun, B.; Wang, H.; Li, H.; Zhou, B.; Duan, M.; Li, H. A Long-Lasting Precipitation Deficit in South China During Autumn-Winter 2020/2021: Combined Effect of ENSO and Arctic Sea Ice. J. Geophys. Res. Atmos. 2022, 127, e2021JD035584. [Google Scholar] [CrossRef]
- Yan, H.; Wang, S.Q.; Wang, J.B.; Guo, A.H.; Zhu, Z.C.; Myneni, R.B.; Shugart, H.H. Recent wetting trend in China from 1982 to 2016 and the impacts of extreme El Nino events. Int. J. Climatol. 2020, 40, 5485–5501. [Google Scholar] [CrossRef]
Figure 1.
Locations of meteorological stations and the division of seven sub-regions in China.

Figure 2.
Location of the study area and typical drought regions: (a) Northeast China; (b) Southwest China.
Figure 2.
Location of the study area and typical drought regions: (a) Northeast China; (b) Southwest China.

Figure 3.
Identification of drought characteristics using run theory.
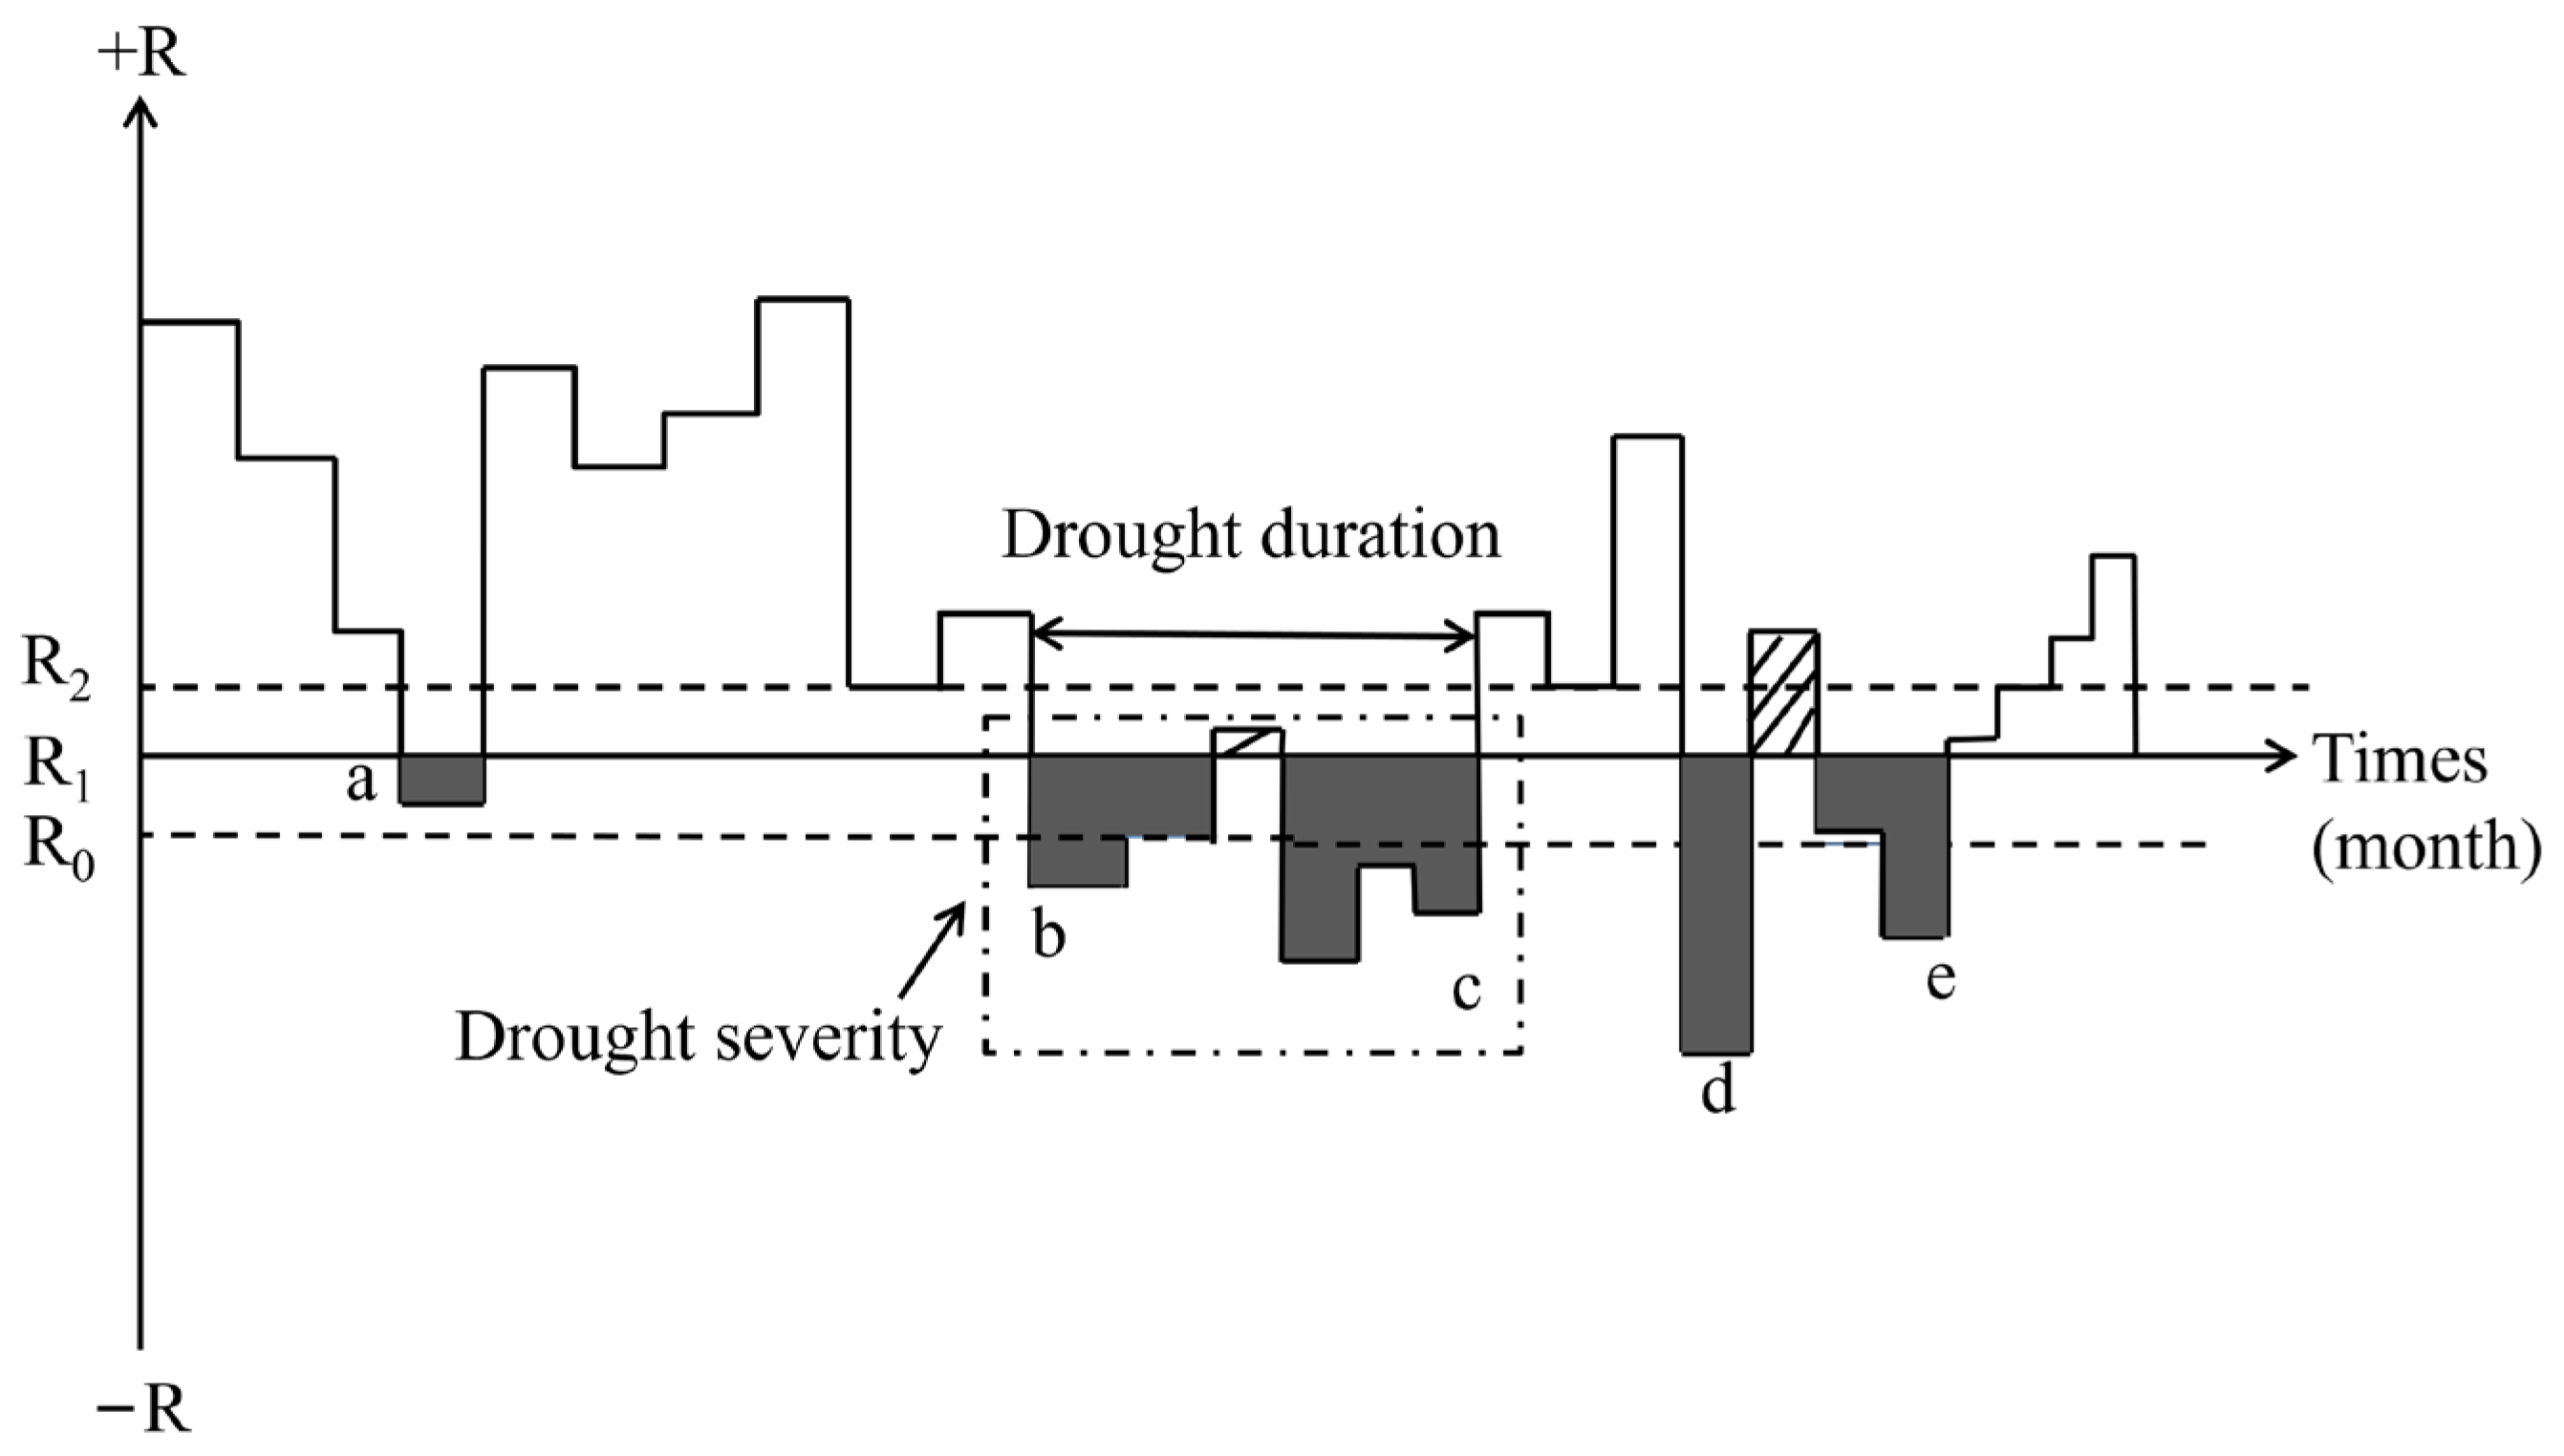
Figure 4.
Typical drought event monitoring based on SPEI-12.

Figure 5.
Spatial distribution of typical drought event characteristics in Northeast and Southwest China. (a) Northeast China; (b) Southwest China.
Figure 5.
Spatial distribution of typical drought event characteristics in Northeast and Southwest China. (a) Northeast China; (b) Southwest China.
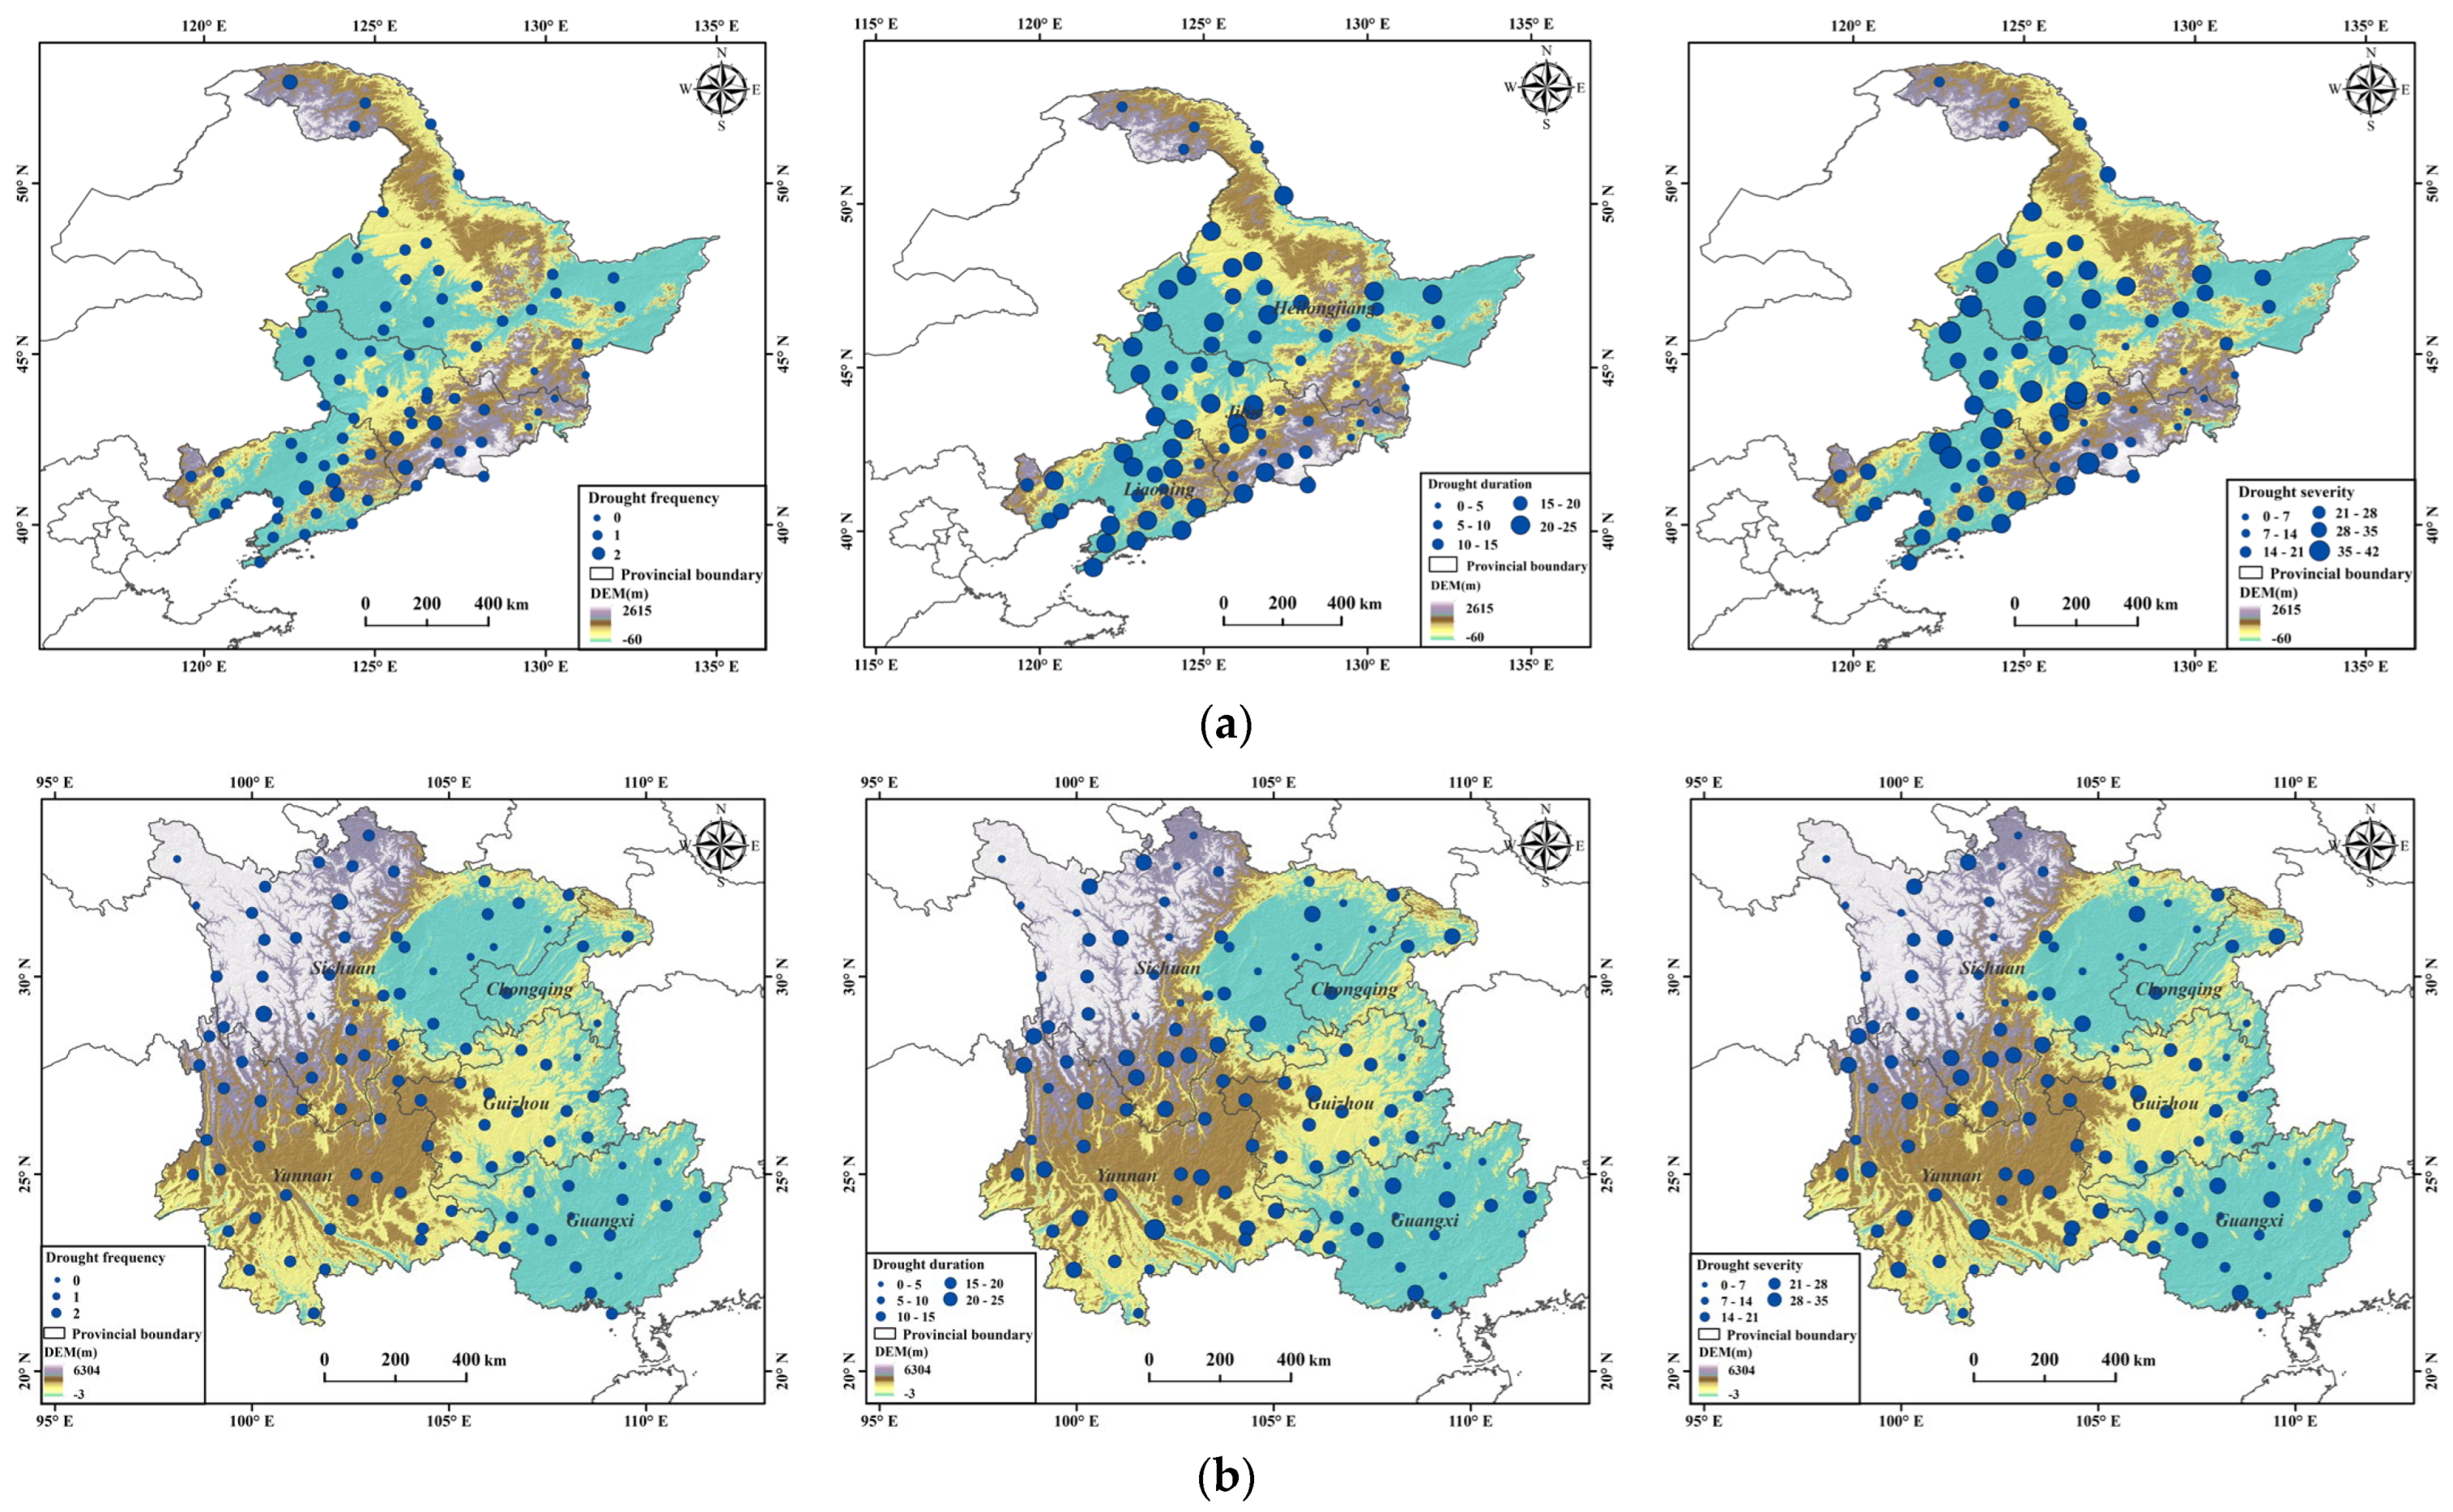
Figure 6.
Spatial distribution of drought characteristics: (a) drought frequency; (b) drought duration; (c) drought severity.
Figure 6.
Spatial distribution of drought characteristics: (a) drought frequency; (b) drought duration; (c) drought severity.
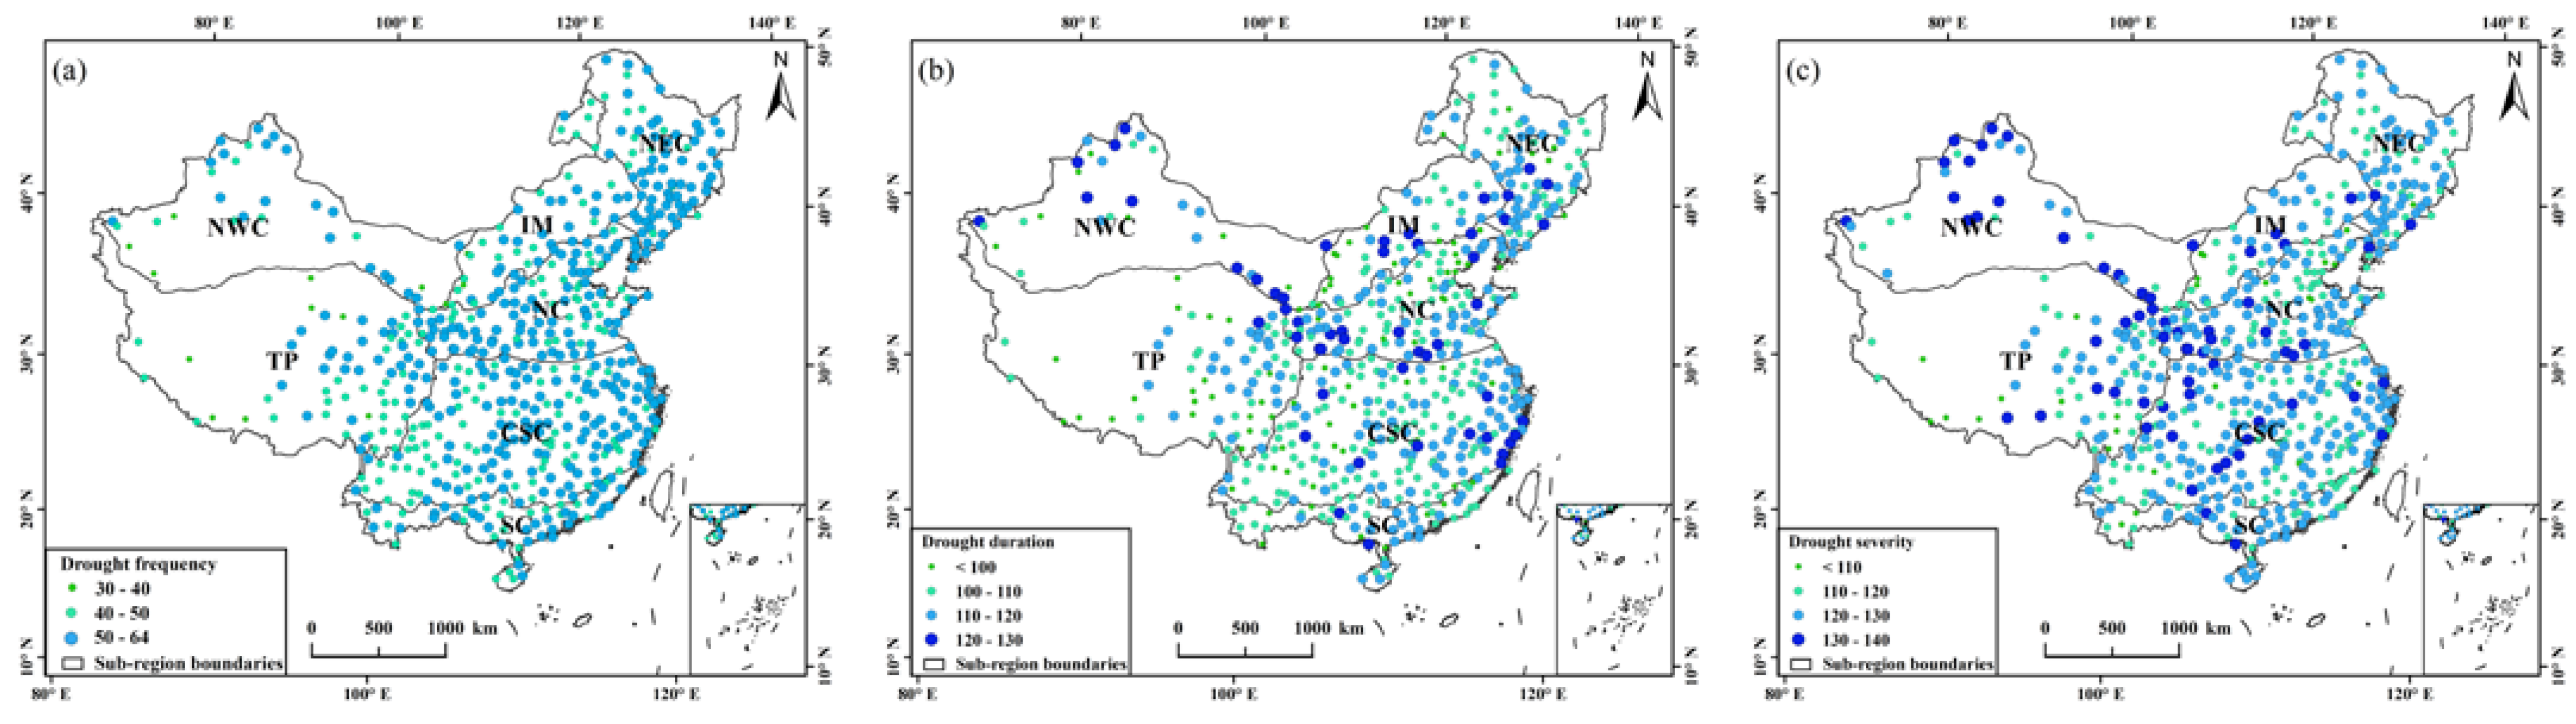
Figure 7.
Statistical results of annual drought characteristics in different climate sub-regions: (a) drought frequency; (b) drought duration; (c) drought severity.
Figure 7.
Statistical results of annual drought characteristics in different climate sub-regions: (a) drought frequency; (b) drought duration; (c) drought severity.
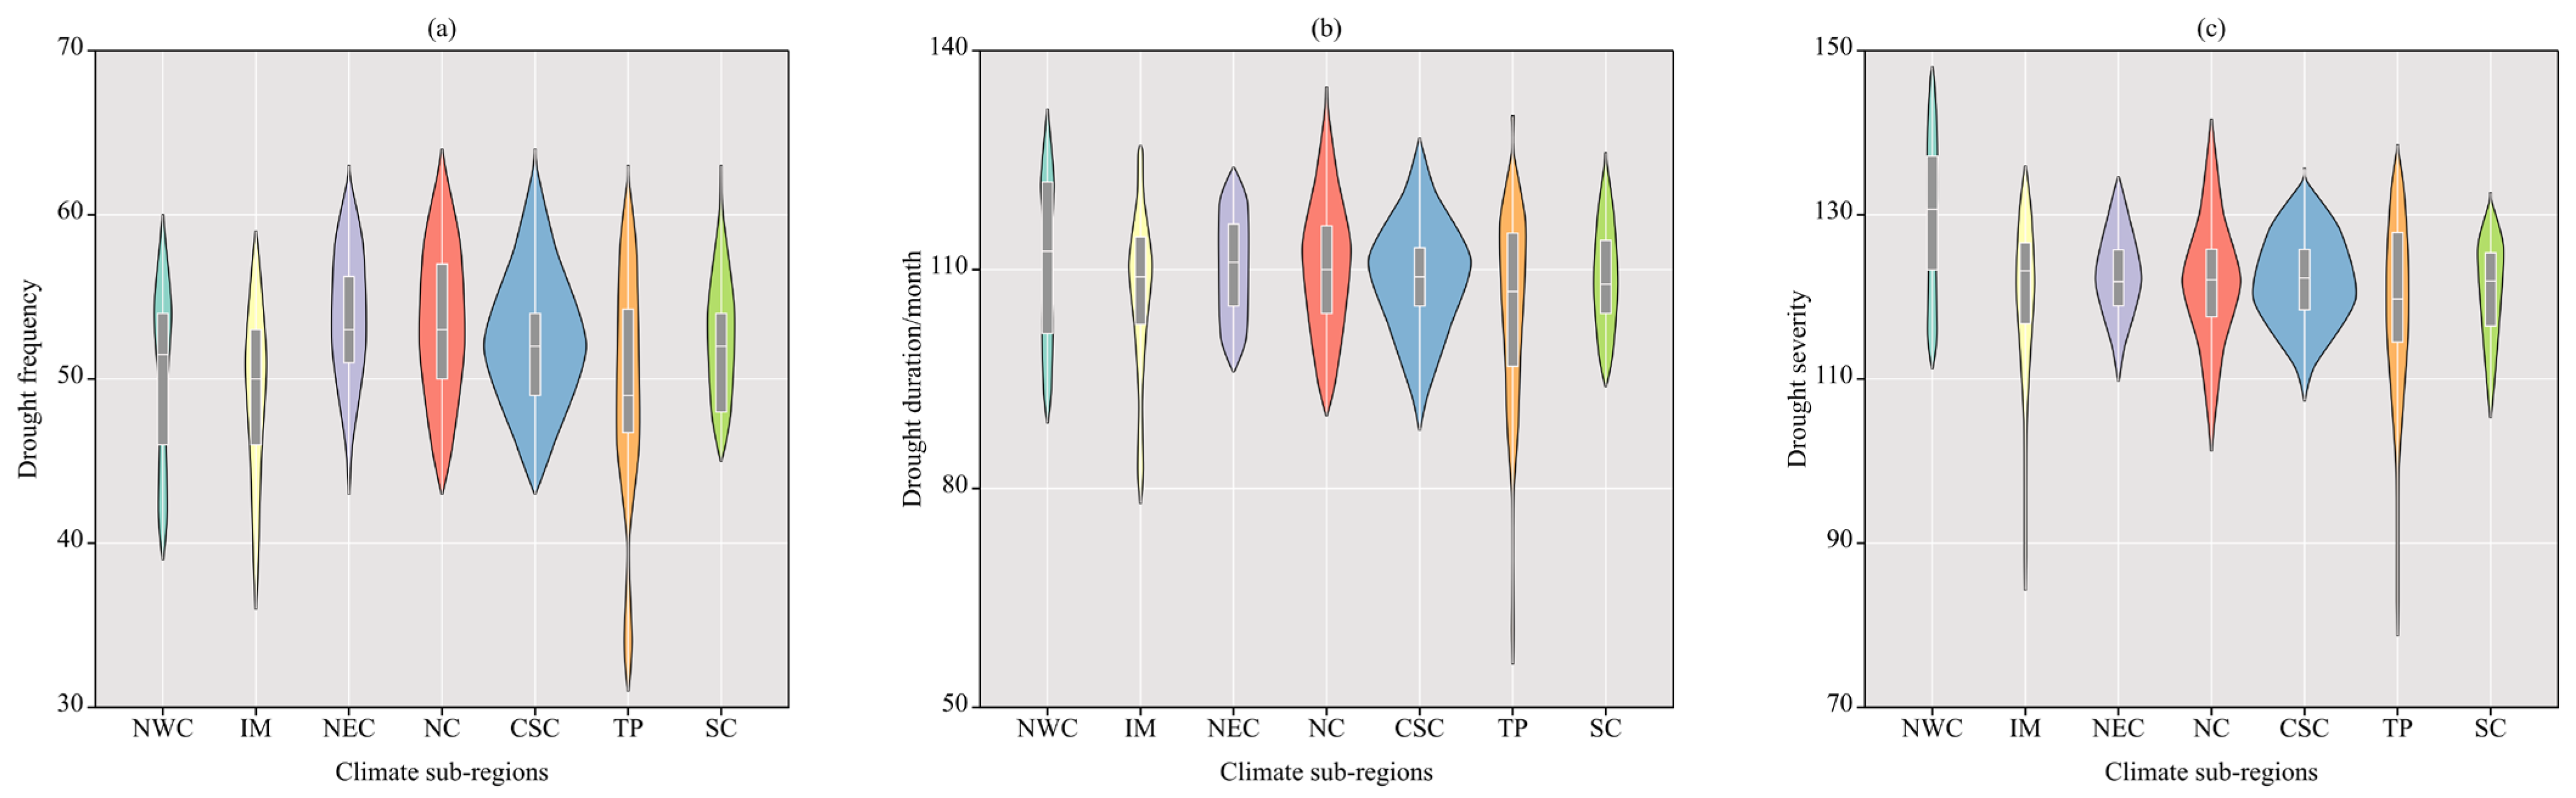
Figure 8.
Spatial patterns of trends in drought characteristics: (a) drought frequency; (b) drought duration; (c) drought severity.
Figure 8.
Spatial patterns of trends in drought characteristics: (a) drought frequency; (b) drought duration; (c) drought severity.
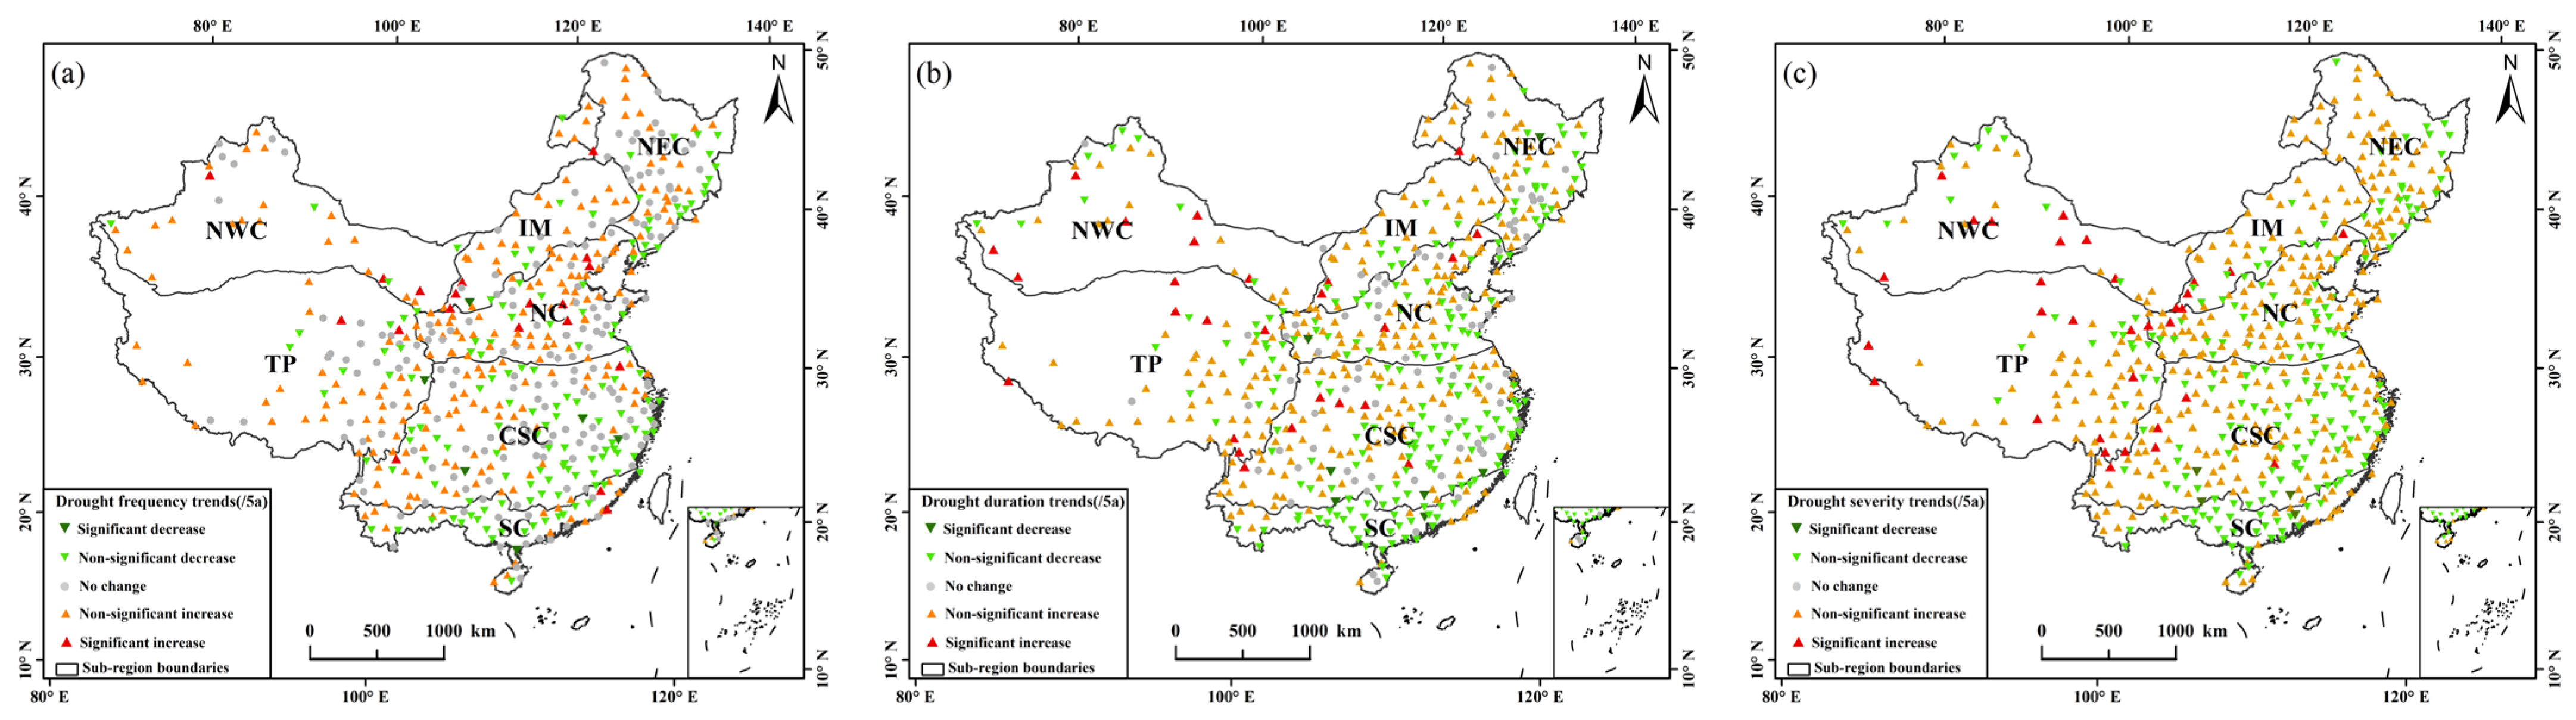
Figure 9.
Trends in annual drought characteristics in different climatic sub-regions of China: (a) drought frequency; (b) drought duration; (c) drought severity.
Figure 9.
Trends in annual drought characteristics in different climatic sub-regions of China: (a) drought frequency; (b) drought duration; (c) drought severity.
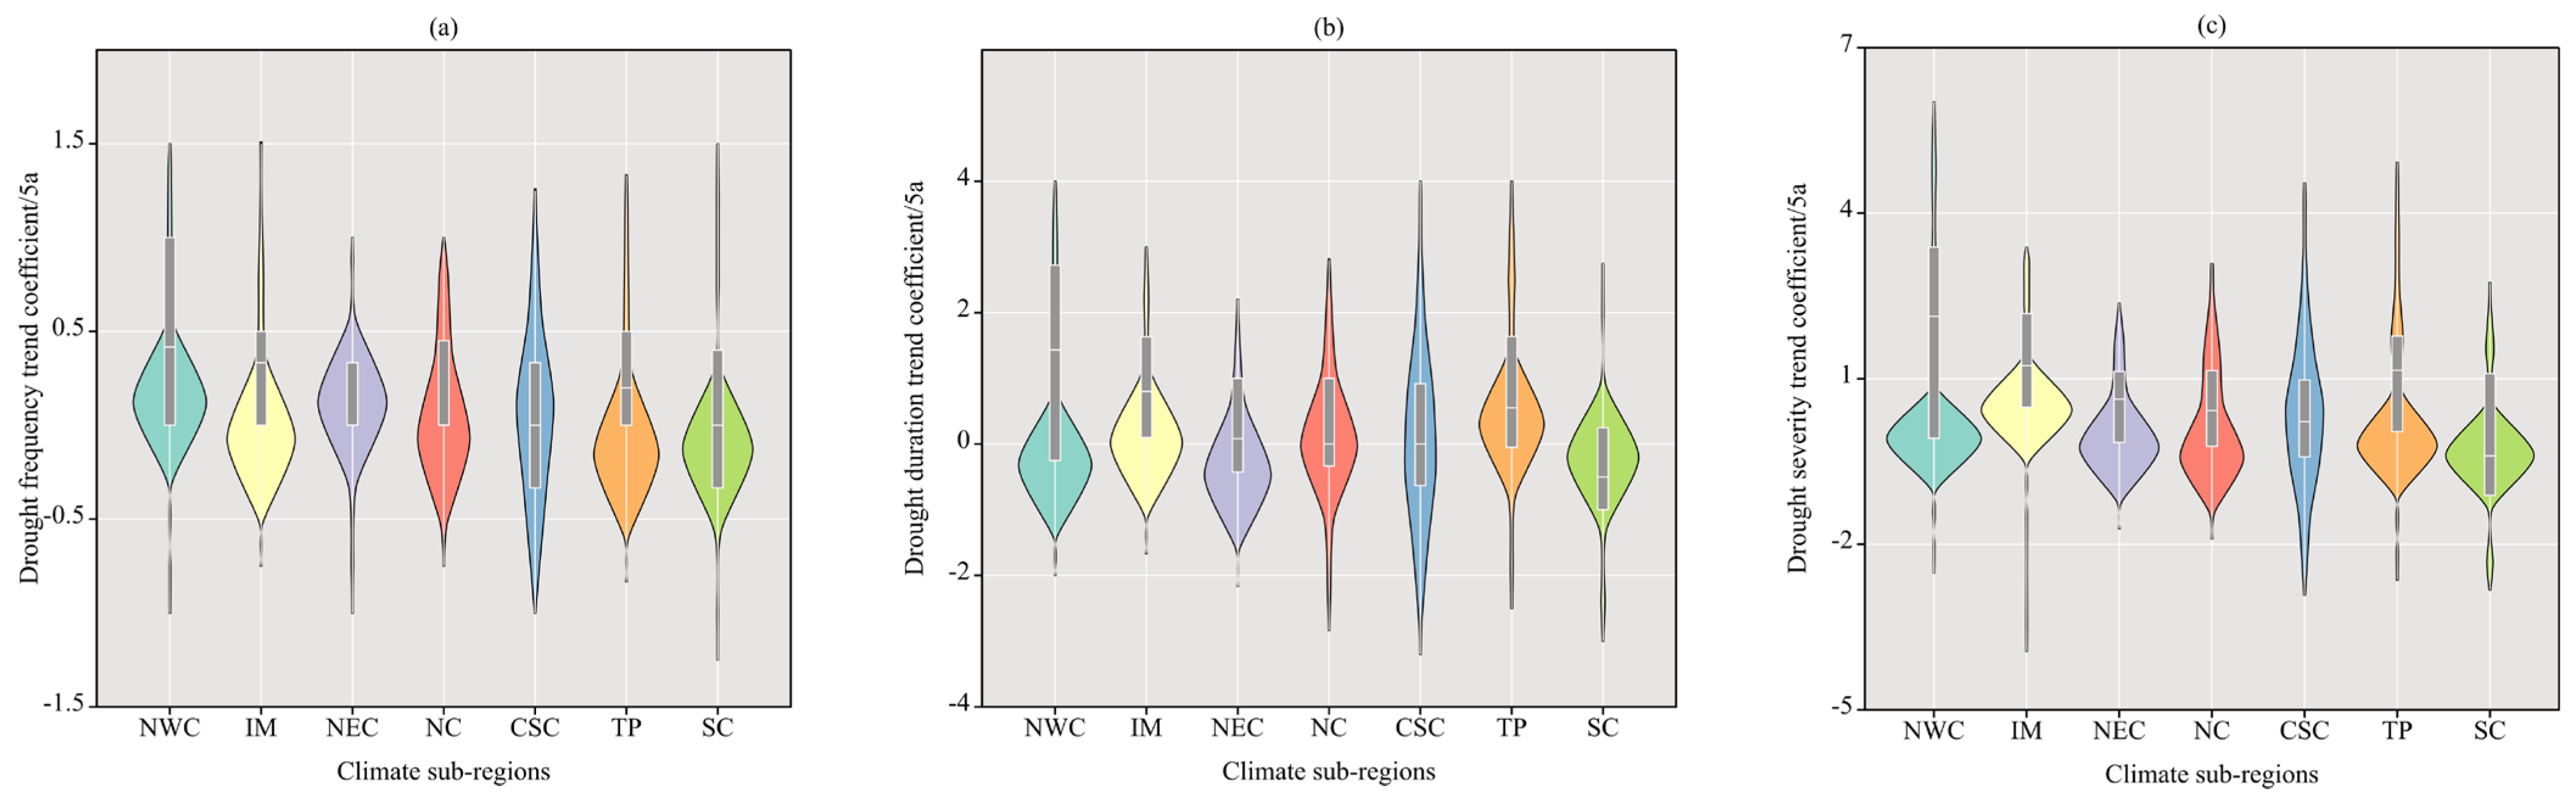
Figure 10.
Correlation coefficients of SPEI with each meteorological factor in different climate sub-regions: (a) precipitation; (b) temperature; (c) PET; (d) SM.
Figure 10.
Correlation coefficients of SPEI with each meteorological factor in different climate sub-regions: (a) precipitation; (b) temperature; (c) PET; (d) SM.

Table 1.
Categories of drought based on SPEI.
| Degree of Drought | SPEI Values |
|---|---|
| No drought | SPEI ≥ −0.5 |
| Mild drought | −1.0 ≤ SPEI < −0.5 |
| Moderate drought | −1.5 ≤ SPEI < −1.0 |
| Severe drought | −2.0 ≤ SPEI < −1.5 |
| Extreme drought | SPEI ≤ −2.0 |
Disclaimer/Publisher’s Note: The statements, opinions and data contained in all publications are solely those of the individual author(s) and contributor(s) and not of MDPI and/or the editor(s). MDPI and/or the editor(s) disclaim responsibility for any injury to people or property resulting from any ideas, methods, instructions or products referred to in the content. |
© 2023 by the authors. Licensee MDPI, Basel, Switzerland. This article is an open access article distributed under the terms and conditions of the Creative Commons Attribution (CC BY) license (https://creativecommons.org/licenses/by/4.0/).
Share and Cite
MDPI and ACS Style
Shi, X.; Yang, Y.; Ding, H.; Chen, F.; Shi, M. Analysis of the Variability Characteristics and Applicability of SPEI in Mainland China from 1985 to 2018. Atmosphere 2023, 14, 790. https://doi.org/10.3390/atmos14050790
AMA Style
Shi X, Yang Y, Ding H, Chen F, Shi M. Analysis of the Variability Characteristics and Applicability of SPEI in Mainland China from 1985 to 2018. Atmosphere. 2023; 14(5):790. https://doi.org/10.3390/atmos14050790
Chicago/Turabian StyleShi, Xiaoliang, Yuanqi Yang, Hao Ding, Fei Chen, and Mengqi Shi. 2023. "Analysis of the Variability Characteristics and Applicability of SPEI in Mainland China from 1985 to 2018" Atmosphere 14, no. 5: 790. https://doi.org/10.3390/atmos14050790
Note that from the first issue of 2016, this journal uses article numbers instead of page numbers. See further details here.