
Diurnal Characteristics in Summer Water Vapor Budget and Transport over the Tibetan Plateau

1
Collaborative Innovation Center on Forecast and Evaluation of Meteorological Disasters, Nanjing University of Information Science and Technology, Nanjing 210044, China
2
State Key Laboratory of Severe Weather, Chinese Academy of Meteorological Sciences, Beijing 100081, China
3
Institute of Tibetan Plateau Meteorology, Chinese Academy of Meteorological Sciences, Beijing100081, China
*
Author to whom correspondence should be addressed.
Atmosphere 2023, 14(2), 322; https://doi.org/10.3390/atmos14020322
Submission received: 5 January 2023
/
Revised: 29 January 2023
/
Accepted: 1 February 2023
/
Published: 6 February 2023
(This article belongs to the Special Issue Research on the Weather and Climate of the Tibetan Plateau and Its Impact)
Abstract
:Using the ERA5 reanalysis dataset during the period 1979–2019, the diurnal variation in summer water vapor budget (Bt) over the Tibetan Plateau (TP) is investigated in this study. It is found that the TP Bt shows a distinct diurnal cycle. It tends to increase in the morning, reaches a peak in the afternoon, and falls to a minimum in the early morning. The diurnal variations in four boundary water vapor budgets of the TP contribute to the growth in the TP Bt from the early morning to the afternoon, of which the western and eastern boundaries are more important. To understand the reasons for the diurnal variations in boundary water vapor budgets, the temporal evolutions of water vapor transports and relevant circulations at the four boundaries are examined. The results show that the temporal evolutions of water vapor transports and budgets at the four boundaries are essentially regulated by the changes in the orographic thermodynamic effect. Specifically, rapid and strong warming (cooling) on the TP slopes generates anomalous water vapor inputs (outputs) by anomalous upslope (downslope) flows during the daytime (nighttime). At the southern and western boundaries, apart from the terrain effects, the diurnal variation in the Indian southerly monsoon also has an effect on the changes in water vapor budgets by modulating the water vapor input towards the TP below 700 hPa. At the northern and eastern boundaries, under the orographic thermodynamic effects, low-level water vapor transports towards the TP accompanying by plateau-scale vertical circulations, exist significant diurnal variations and thereby adjust the boundary water vapor budgets. In this study, it is also found that the deviated water vapor flux vectors over the TP present a daily clockwise rotation, which mainly results from the diurnal variation in wind below 450 hPa. In addition, the largest amount of precipitation over the TP occurs 2–3 h after the Bt peak.
1. Introduction
The Tibetan Plateau (TP), known as the “Asian water tower”, is the headwater of several major rivers and feeds more than two billion people in Asia [1,2]. Under the influence of the heat source over the TP, water vapor is transported into the TP from the surrounding areas [3], forming clouds, inducing precipitation, and supplying water resources in the TP. Meanwhile, atmospheric water vapor over the TP can be transported to East Asia and even into the stratosphere, exerting profound impacts on the Asian hydroclimate [4,5,6,7,8,9]. Therefore, investigating the multiple-scale characteristics of the water vapor budget (Bt) over the TP is crucial to reveal the spatiotemporal distribution of water resources of the “Asian water tower” and is favorable for understanding its effects on extreme weather, the water cycle, and climate change.
Numerous studies have documented that meteorological variables, weather phenomena, and circulation systems over the TP, such as the temperature, wind, precipitation, surface heat source, boundary layer height, and Tibetan Plateau vortices (TPV), show obvious circadian variations [10,11,12,13,14,15]. Based on numerical models and GPS-retrieved data with a high temporal resolution, the diurnal characteristics of precipitable water vapor (PWV) on different sites over the TP have been explored [16,17,18]. Kuwagata et al. [16] demonstrated that the water vapor increases (decreases) over the mountain (valley) area during the daytime, which is caused by regional-scale upslope flows, adjusting water vapor content at the observation site. Wang et al. [18] revealed that water vapor levels over south of the TP usually reach the maximum between the late afternoon and midnight and are lower between the morning and midday. Previous studies have mostly focused on the diurnal variations in water vapor contents at some observation stations of the TP region. For the regional Bt over the entire TP, the interannual and interdecadal variabilities have long been studied [19,20,21], but there is little research on the diurnal variation. Employing 6 h reanalysis data, Li et al. [12] pointed out that the largest Bt of main body of the TP occurs at 18:00 local standard time (LST), which is conducive to the maximum occurrence of the TPV. In their study, however, the diurnal variation in the Bt over the whole TP was not investigated systematically.
The diurnal variation in atmospheric water vapor can be affected by mesoscale thermally-induced circulations (e.g., mountain-valley winds), surface evaporation, and other weather processes [16,17,22]. Apart from these, water vapor is also influenced by large-scale thermal circulation caused by the terrain. The mountain–plain solenoid (MPS) circulation, which develops between the high mountains and the low-lying basin/plains and is driven by differential heating over inhomogeneous surfaces, can modulate diurnal changes in wind and water vapor transport in the lower troposphere around high elevation areas [23]. On the flat ground, the Blackadar boundary layer inertial oscillation (BLO) is used to explain the diurnal cycle of wind and water vapor transport in the lower troposphere [24,25,26,27]. Do these factors influence the water vapor transport and Bt over the TP on the diurnal time scale? This issue is needed to be addressed.
Therefore, based on the hourly reanalysis dataset, this paper considers the entire TP as a whole and aims to explore the diurnal characteristics of Bt over the entire TP and the associated reasons for its variation, which have not been studied systematically until now. In particular, the differences in diurnal evolutions of water vapor transport at different TP boundaries will be compared in detail, which will help to comprehensively understand the effect of the TP forcing on the diurnal time scale. In addition, the relationship of the TP Bt with precipitation on the diurnal time scale is also preliminarily explored. The results in this study can provide a comprehensive insight into the vertical structure of water vapor transport and its diurnal characteristics around the TP, which is favorable for associated studies on the diurnal variation around the TP region.
2. Data and Methods
This study focuses on the TP area (26°–40° N, 70°–104° E) with an altitude above 2000 m (i.e., the area enclosed by polygonal lines in Figure 1). We used the latest hourly European Center for Medium-Range Weather Forecasts Reanalysis fifth generation dataset (ERA5) from 1979 to 2019 for the climatological studies on the diurnal variation [28]. The variables include surface pressure, specific humidity, horizontal winds, vertical velocity, and temperature. The horizontal resolutions are 1.5° × 1.5° and 0.25° × 0.25°. The estimation of the Bt and boundary water vapor budgets over the TP with the complex topography was calculated using the higher horizontal resolution. Lower horizontal resolution data were used to analyze large-scale spatial characteristics of atmospheric circulation and water vapor transport around the TP. The ERA5 dataset, which provided hourly meteorological variables with a long period, was useful here to examine the diurnal cycle features of the Bt and the relevant variables. Moreover, according to previous studies, the ERA5 dataset can more precisely depict local mountain-valley wind circulation over the complex trumpet-shaped region in the southeast of the TP and has a good agreement with meteorological measurements of the diurnal variation in PWV when compared to the ERA-Interim dataset over the TP region [29,30]. Therefore, the ERA5 dataset was used in this paper.
In this study, the Integrated Multi-satellite Retrievals for GPM (IMERG) V06 B Level 3 final run precipitation product was employed to examine the diurnal cycle of precipitation over the TP [31]. The horizontal resolution is 0.1° × 0.1° and the temporal resolution is 30 min. As the new generation of the Tropical Rainfall Measuring Mission (TRMM) precipitation dataset, the IMERG dataset has a higher capacity of detecting snow and light rainfall (<0.5 mm h–1), which is more effective for observing precipitation over high elevation and latitude areas [27,32,33]. To make the data comparable, the hourly precipitation generated by the NOAA CPC morphing technique (CMORPH) with a horizontal resolution of 0.25° × 0.25° was also used [34]. In this study, we used the two satellite precipitation products for the period of 2000–2019 when both products were available.
The vertically integrated water vapor flux (Q) is calculated as follows:
Here Q can be divided into the zonal and meridional water vapor fluxes, that is, and , respectively; g is the gravity acceleration; q is the specific humidity; u and v are the zonal and meridional components of winds, respectively; is the surface pressure; and is the pressure at the top layer. Here, the top layer is set to 300 hPa because the water vapor above 300 hPa is negligible.
The Bt is calculated as follows:
where l is the boundary curve of the TP. Bt over the TP area is defined as the sum of water vapor budgets at four boundaries of the TP, namely, the western (Bw), southern (Bs), eastern (Be), and northern (Bn) boundaries. The boundary water vapor budget of the TP is defined as the sum of water vapor budgets at all sub-boundaries on each boundary. The water vapor budget at the sub-boundary can be divided into the zonal water vapor budget , and the meridional water vapor budget ), where a is the earth radius, and are the latitude and longitude of the sub-boundary, respectively.
Compared to the regional mean of PWV or water vapor convergence, the TP Bt, which is calculated from the Bs, Bn, Bw, and Be, seems to be more applicable to measure the net atmospheric water vapor content, since more observations in the adjacent areas of the TP were assimilated into the atmospheric reanalysis datasets in contrast to the inner TP [20].
The longitudinal range of the TP is large, spanning from approximately 70° to 105° E. This large longitudinal range covers two time zones. For the purpose of comparison between Bt and four boundary water vapor budgets, Beijing time (BJT, UTC + 8) is utilized in this study. In the TP region, 04:00–08:00, 08:00–12:00, 12:00–16:00, 16:00–20:00, 20:00–00:00, and 00:00–04:00 BJT denote the early morning, morning, midday, afternoon, evening, and midnight, respectively. To denote the intensity of the diurnal variation, the diurnal range is defined as the difference between the maximum and minimum values of mean hourly variables. To compare the intensity of diurnal variation between different variables and study areas, the diurnal range is divided by daily mean, which is defined as a relative diurnal range. This study focuses on the summer (June–August, JJA) water vapor budget and transport.
3. Results
3.1. Diurnal Variation Features of the Water Vapor Budget and Transport over the TP
3.1.1. Diurnal Variation in the Bt
Figure 2 shows the climatological mean water vapor transport around the TP in summer. In this figure, the water vapor is transported into the TP by the Indian summer monsoon (mid-latitude westerly) through the southern (western) boundary, and the water vapor over the TP is exported to the downstream areas through the eastern boundary. In general, the amounts of water vapor transported into the TP from the respective southern, western, northern, and eastern boundaries are 87.0 × 10⁶ kg s−1, 36.3 × 10⁶ kg s−1, 1.4 × 10⁶ kg s−1, and −44.3 × 10⁶ kg s−1, respectively. Here, a positive (negative) value denotes that water vapor is imported (exported) via the associated boundary. The net water vapor income is 80.5 × 10⁶ kg s−1 in the TP, indicating a sink of water vapor in summer in the climatology.
The mean diurnal cycle of summer Bt over the TP is displayed in Figure 3a. In this figure, the Bt is positive during a day, suggesting that the TP is always a sink of water vapor from day to night in summer. It also can be seen that there is a significant diurnal variation in the summer Bt with a single peak. The TP Bt rapidly rises from 09:00 BJT (in the morning), reaches a maximum value of 169.4 × 10⁶ kg s−1 at 17:00 BJT (in the afternoon), and then decays to a minimum (17.8 × 10⁶ kg s−1) at 05:00 BJT (in the early morning). Relative to the daily mean (80.5 × 10⁶ kg s−1), the net water vapor income increases by nearly 2-fold in the afternoon. Moreover, the diurnal range of the Bt (151.6 × 10⁶ kg s−1) is about 1.9 times larger than the daily mean value. They both evidence a strong diurnal variation in the TP Bt. To clarify the relative role of water vapor budgets at four boundaries, we also explored the temporal evolution of water vapor budget at each boundary in Figure 3a. The Bs reaches a maximum value first at 15:00 BJT (at midday). The Bw, Bn, and Be reach a maximum at 16:00−17:00 BJT (in the afternoon), 18:00 BJT (in the evening), and 21:00−22:00 BJT (in the evening), respectively. The increases in Bs, Bw, Bn, and Be from 05:00 to 17:00 BJT are 35.6 × 10⁶ kg s−1, 43.6 × 10⁶ kg s−1, 31.6 × 10⁶ kg s−1, and 40.8 × 10⁶ kg s−1, respectively. As such, the increments in four water vapor budgets have positive effects on the growth in the TP Bt from the early morning to the afternoon, in which the western and eastern boundaries are more important. The diurnal ranges of the Bs, Bw, Bn, and Be are 47.2 × 10⁶ kg s−1, 49.3 × 10⁶ kg s−1, 40.5 × 10⁶ kg s−1, and 46.8 × 10⁶ kg s−1, respectively. This suggests that the intensities of diurnal variation in water vapor budgets at the four boundaries are almost at the same level. Since the northern boundary has a weak water vapor exchange, the diurnal variation in water vapor budget is smaller at the northern boundary than those at the other boundaries.
3.1.2. Spatial Features of Diurnal Variation in Water Vapor Transport
Figure 3b shows the diurnal variation in vertically integrated water vapor fluxes around the TP, which actually gives the diurnal deviations in vertically integrated water vapor flux at 3 h intervals with the daily mean removed. The daily mean is removed to highlight the diurnal component. The deviated vectors of water vapor flux generally undergo a clockwise rotation from day to night over most parts of the TP, which is consistent with the diurnal veering of wind vectors. Such a diurnally veering feature can extend to 450 hPa (about 2 km above the surface), but the diurnal range decreases at higher pressure levels (figure omitted). From 05:00 to 08:00 BJT, water vapor flux divergence can be detected. Compared to the daily mean of water vapor transport (Figure 2), this represents that water vapor inputs through the southern, western, and northern boundaries reduce, while water vapor output through the eastern boundary increases. This thus leading to a lower level of the TP Bt. From 11:00 to 14:00 BJT, external water vapor entering the TP begins to increase, especially through the southern and western boundaries. In addition, the outgoing water vapor through the northeastern boundary reduces. With the growth in the Bs, Bw, Bn, and Be, the TP Bt substantially increases (Figure 3a). At 17:00 BJT, the diurnal veering of the flux vectors leads to a significant convergence towards the inner TP. This means that water vapor output (inputs) through the eastern boundary (western and northern boundaries) further reduces (increase). At this time, the Bt is the largest. Due to the effect of the “air pump” driven by the sensible heating (SHAP) [35], the water vapor is converged towards the inner TP from surrounding areas in summer. The water vapor convergence (divergence) in the afternoon (the early morning) seems to strengthen (attenuate) the efficiency of the “air pump”. From 20:00 to 23:00 BJT, the water vapor inputs through the western and southwestern boundaries decrease, which results in a decline in the TP Bt. After that, the increase (decrease) in water vapor output (input) at the eastern (northern) boundary further diminishes the TP Bt until its minimum (at 05:00 BJT). From the above analysis, we can see that the diurnal variations in boundary water vapor budgets, which jointly regulate the diurnal cycle of the TP Bt, are closely associated with the diurnal changes in water vapor transports at the four boundaries of the TP.
We also found that the southerly water vapor transport prevails to the south of the central TP (26° N, 87°–93° E) at 02:00 BJT, which can explain the slight rise in the Bs at midnight (Figure 3a). This seems to be related to the diurnal variation in the Indian southerly monsoon flows, which can be explained by the Blackadar BLO theory [24,27]. Specifically, the southerly monsoon flows experience deceleration during the day due to surface friction and supergeostrophic acceleration at night when the boundary layer flow decouples from the ground surface, and the wind directions rotate clockwise in a day [25]. The nighttime acceleration of the southerly flows can enhance water vapor transport into the TP and favor precipitation over the central Himalayas [27]. However, this diurnal variation in the Indian southerly monsoon is prominent below 700 hPa, thus having a limited impact on the Bs.
Similar features of diurnal rotations of vertically integrated water vapor flux vectors can also be detected over eastern China (Figure 3c). The deviated fluxes present northward at 02:00 BJT, southeastward at 08:00 BJT, and southwestward at 20:00 BJT, which is in line with the results of Xue et al. [25]. Similar to the TP, the rotational behaviors of the flux vectors, which are consistent with the wind vectors, are also evident in the lower troposphere (below 700 hPa) over eastern China. Nevertheless, the relative diurnal range over eastern China (54%) is smaller than that over the TP (79%), suggesting prominent diurnal variations over the plateau region. Due to higher elevations and less air mass over the TP, the temperature and humidity changes over the TP tend to be larger than those in the plains corresponding to the same amount of heat and water vapor [36]. The relative diurnal range of wind (above 80%) is much larger than that of specific humidity (less than 20%) in the low-level of atmosphere over both eastern China and the TP. That is, the changes in the direction and value of water vapor fluxes are essentially determined by the wind variations rather than the moisture content on the diurnal time scale.
3.2. The Cause of the Diurnal Variation in the TP Bt and Its Relationship with Precipitation
3.2.1. The Cause of the Diurnal Variation in the TP Bt
In the last section, it was found that the diurnal changes in water vapor transport at the four boundaries modulate the boundary water vapor budgets and net water vapor income of the TP. To deeply understand the reason for that, the diurnal evolution processes of water vapor transport at the four boundaries were explored. Figure 4 shows the variations in the four boundary water vapor budgets and their diurnal ranges along their respective boundaries. The abscissa denotes the order number of the sub-boundary (shown in Figure 1) on each boundary. In Figure 4a, we calculated the climatological daily mean water vapor budget at each sub-boundary on the southern boundary. Then, according to the times where the Bs is at a minimum (05:00 BJT) and a maximum (15:00 BJT) in Figure 3a, the difference in water vapor budget between 15:00 BJT and 05:00 BJT at each sub-boundary was also calculated. The same calculation was also applied to the other boundaries. Through quantitatively analyzing the spatial distributions of water vapor budgets and their diurnal ranges at the four boundaries, we can identify the detailed locations where the diurnal variations in boundary water vapor budgets primarily occur.
Water vapor budgets of the sub-boundaries on the southern boundary (Figure 4a) were usually positive due to water vapor input by the southerly monsoon flows. However, negative values appear on several segments of the southern boundary, such as the third and fifteenth sub-boundaries. This can be attributed to the southeasterly and southwesterly water vapor transport (Figure 2), which conveys water vapor from the TP to the outside via the southern boundary. This result also indicates that a more accurate estimation of the TP Bt can be obtained by calculating it on a complex boundary relative to a regularly rectangular one, since the rectangular boundary may misidentify water vapor input or output as a result of the complex terrain of the TP. Since the water vapor budget at the sub-boundary can be divided into the zonal and meridional water vapor budgets, the total Bs was divided into the zonal and meridional Bs. Water vapor budgets at longitudinal (latitudinal) sub-boundaries are the Bs caused by the zonal (meridional) water vapor transport, namely, the zonal (meridional) Bs. The zonal and meridional components of the other boundary water vapor budgets are distinguished in the same way. In terms of the diurnal variation, the sum of diurnal range of the zonal Bs is nearly one-tenth of the diurnal range of the total Bs, while the percentage of the sum of diurnal range of the meridional Bs is 88%. That is, both the summer mean and diurnal Bs are primarily regulated by the meridional water vapor transport.
Figure 5 shows the latitude–height cross-sections of the meridional water vapor transport and the vertical circulation along 81°–85° E. This longitudinal zone contains the western part of the cyclonic water vapor transport to the southwest of the TP (Figure 2). Regarding the daily mean (Figure 5a), the Indian southerly monsoon flows, which prevail below 850 hPa to the south of the TP, ascend at the foothills and transport water vapor into the TP platform along the southern slope of the TP. The northerly flows and deep southward water vapor transport dominate the middle and upper levels of the troposphere to the south of 26° N. Figure 5b–i show the diurnal deviation in the meridional water vapor transport and vertical circulation. From 00:00 to 03:00 BJT (at midnight; Figure 5b,c), negative temperature anomalies occupy the southern slope and the main body of the TP. That is, due to the radiation cooling, the drop in temperature over the mountain top (30° N) is faster compared to the foothills of the TP (26° N) at the same height. The temperature differences cause a horizontal pressure gradient force and downslope winds. Accordingly, the southward water vapor transport anomalies persist over the southern slope, which inhibits water vapor input through the southern boundary (black upward arrow) compared to the daily mean (Figure 5a). Therefore, the Bs is lower during this period. In addition, the Indian southerly monsoon flows usually strengthen (weaken) during the nighttime (daytime) due to the diurnal oscillation of the frictional drag in the boundary layer [27]. From 00:00 to 03:00 BJT, the southerly anomalies appear below 700 hPa to the south of the TP, which transport more wet air toward the lower southern boundary and have a small positive contribution to the Bs. The corresponding low-level northward water vapor transport is the strongest at 03:00 BJT, thus resulting in a slight rise in the Bs (Figure 3a). Note that the strengthened southerly monsoon flows can converge with anomalous downslope flows and cause upward motion over the southern slope (26°–28° N). Chen et al. [37] also confirmed the existence of the anomalous rising motion at midnight and indicated that it favors the growth in organized moist convection in the Himalayan foothills.
From 06:00 to 09:00 BJT (the early morning to the morning; Figure 5d,e), the temperature differences between the TP platform and the periphery of the TP gradually increase. The horizontal pressure gradient force also strengthens with the temperature gradient. Hence, the downdraft and southward water vapor transport anomalies intensify, occupying the southern slope about 1–2 km above the ground. Furthermore, with the weakening in the Indian southerly monsoon flows, the anomalous northerly flows and southward water vapor transport appear below 700 hPa to the south of the TP. The widespread and strengthened southward water vapor transport anomalies from 18°–31° N further reduce water vapor input through the southern boundary. Consequently, the Bs decreases and reaches its lowest value.
At 12:00 BJT (at noon; Figure 5f), due to the increase in solar radiation, the temperature anomalies over the southern slope become positive. The warm air rises around 29° N. Combined with the low-level northerly flow anomalies to the south of the TP, there exists an anomalous divergence over the southern slope. In the middle level of the troposphere, the anomalous southerly flows prevail and transport water vapor towards the TP. The Bs begins to increase. At 15:00 BJT (at noon; Figure 5g), due to larger temperature differences (about 2 °C) between the mountain top and the foothills, the anomalous upslope winds and corresponding northward water vapor transport are the strongest (≥4 g kg−1 m s−1 at the boundary) and extend upward to 300 hPa. Consequently, the Bs reaches a peak at this time. At 18:00 BJT (in the afternoon; Figure 5h), decreasing temperature differences (about 1 °C) between the mountain top and the foothills attenuate the intensities of upslope winds and northward water vapor transport. The Bs begins to decrease in the afternoon. At 21:00 BJT (in the evening; Figure 5i), despite the larger positive temperature anomalies in the main body of the TP, anomalous downward flows appear over the southern slope, which compensates for the movement of upslope flows over the north of the TP. The latitudinal span of the west of the TP is smaller than the center and the east of the TP; thus, the vertical circulation and relevant water vapor transport over the southern slope can be influenced by that over the northern slope in the evening. As a result, the corresponding southward water vapor transport anomalies further decrease the Bs.
To summarize, the diurnal variation in water vapor transport over the southern slope is mainly regulated by the TP thermodynamic effect. Specifically, fast and strong warming (cooling) over the TP slope usually generates anomalous upslope (downslope) winds [27], accompanied by anomalous water vapor transport towards (away from) the TP during the daytime (nighttime), which causes an increase (decrease) in the Bs. Note that the descending motion of the upslope flows in the northern TP has a negative contribution to the Bs in the evening. Additionally, the diurnal variation in the Indian southerly monsoon flows also plays a role in the Bs change, which mainly occurs in the region to the west of 85° E. Influenced by the diurnal cycles of the TP thermodynamic effect and the Indian southerly monsoon, the Bs is higher at noon and midnight. These two factors have also been demonstrated to be the reasons for twice-daily precipitation maxima in the Nepal Himalayas [27]. The southerly water vapor transport anomalies maintain mostly in the entire troposphere to the east of 85° E (figure omitted). In this longitudinal zone, the diurnal variations in the meridional water vapor transport and Bs are primarily adjusted by the TP thermodynamic effect.
Figure 4b reveals that, governed by the mid-latitude westerly flows, the climatological zonal Bw at each sub-boundary is always greater than 2 × 10⁶ kg s−1, while the meridional Bw at each sub-boundary is close to zero. Nevertheless, the change in diurnal variation in the Bw is opposite to that in the Bw, exhibiting larger (smaller) diurnal ranges of the meridional (zonal) Bw. This means that the zonal (meridional) water vapor transport predominantly (insignificantly) affects the climatological Bw, but contributes little (a lot) to the diurnal variation in the Bw. This also signifies that the westerly water vapor transport into the TP through the western boundary is relatively stable, without a distinct difference between day and night. The sum of the diurnal range of the meridional (zonal) Bw is 65% (35%) of diurnal range of the total Bw. That is, the diurnal cycle of the Bw is jointly regulated by the diurnal variations in the meridional and zonal water vapor transports at the western boundary, of which the former is more vital.
Figure 6 gives the vertical structure of the meridional water vapor transport and circulation at the western boundary (along 70°–81° E). Regarding the daily mean (Figure 6a), the water vapor mainly flows into the TP below 750 hPa and exports from the TP between 750 hPa and 500 hPa. The water vapor transport is weak above 500 hPa. The diurnal evolution of the meridional water vapor transport at the western boundary and the relevant influencing factors are similar to those at the southern boundary. From 00:00 to 09:00 BJT (Figure 6b–e), the compensating downward motion and downslope winds are induced by the rapid cooling effect over the TP slope, and the accelerated southerly monsoon flows in the lower troposphere commonly adjust the meridional water vapor transport. On the whole, the water vapor transport anomalies between the lower and upper troposphere counteract each other and result in a slight change in the Bw during this period. From 12:00 to 15:00 BJT (Figure 6f,g), owing to a rapid and strong warming of the TP, an anomalous upslope wind and northward water vapor transport cause a sharp rise in the Bw. Similar to the southern boundary, the most intense northward water vapor transport anomalies occur at 15:00 BJT. However, weak westerly water vapor transport anomalies exist between 16:00 and 22:00 BJT at the western boundary (figure omitted), which also leads to an increase in the Bw. Consequently, the Bw reaches a peak at 17:00 BJT, later than the Bs. Thereafter, the Bw declines with the reduced water vapor input and increased water vapor output in the meridional direction (Figure 6h,i). It seems that the tendency and transition of the Bw are more consistent with those of the meridional water vapor transport at the western boundary than the zonal water vapor transport. Note that the magnitudes of the zonal water vapor transport anomalies at the western boundary (figure omitted) are smaller than the meridional terms most of the time. That is, when adjusting the Bw, the meridional water vapor transport is more vital than the zonal term.
To sum up, from the quantitative and qualitative analyses mentioned above, it can be seen that the meridional water vapor transport is predominant in regulating the diurnal variation in the Bw, while the zonal water vapor transport plays a supplementary role.
At the northern boundary, the sum of the diurnal range of the meridional Bn is 93% of diurnal range of the total Bn, which indicates that the diurnal variation in the Bn is also dominated by the meridional water vapor transport. In Figure 4c, we can also see that the diurnal variation in the meridional Bn between 79° E and 99° E is relatively obvious, with diurnal ranges exceeding 1 × 10⁶ kg s−1. Thus, the meridional water vapor transport and vertical circulation between 79° E and 99° E were averaged (Figure 7) to investigate the reason for the Bn change. Regarding the daily mean (Figure 7a), there is a belt of southward water vapor transport, which coincides with upslope flows in the surface layer (about 1–2 km above the ground). The upslope winds extend southward to 35° N, ascend over the central TP, and then descend around the Tianshan mountains (42°–44° N), which forms a vertically meridional circulation. Accompanied with the development and disappearance of this vertically meridional circulation, the low-level southward water vapor transport exhibits significant diurnal variation and thereby modulates the diurnal cycle of the Bn.
From 00:00 to 03:00 BJT (Figure 7b,c), anomalous downslope winds are induced by fast cooling over the northern slope of the TP. The anomalous upward movement is observed over the foothill regions of the Tianshan mountains (41° N), and the vertically meridional circulation is reversed compared to the daily mean. The corresponding northward water vapor transport anomalies below 500 hPa inhibit water vapor input at the northern boundary and cause a modest decrease in the Bn. From 06:00 to 12:00 BJT (Figure 7d–f), the meridional circulation dissipates, and weak southerly water vapor transport anomalies persist below 300 hPa. On the whole, the Bn changes slightly during this period. From 15:00 to 18:00 BJT (Figure 7g–h), the temperature anomalies become positive, anomalous upslope winds appear over the northern slope, and the vertical meridional circulation between the northern TP and the Tianshan mountains is established. The corresponding southward water vapor transport anomalies increase the Bn. Then, the vertical meridional circulation gradually develops and extends to the upper troposphere at 18:00 BJT. Meanwhile, the anomalous southward water vapor transport significantly strengthens (less than −6 g kg−1 m s−1 at the boundary) and occupies the northern slope about 2–3 km above the ground. The increased amounts of water vapor are transported into the TP through the northern boundary and the Bn reaches a peak at this time. At 21:00 BJT (Figure 7i), with the dissipation of the inverse meridional circulation, the intensity of the low-level southward water vapor transport weakens (larger than −2 g kg−1 m s−1 at the boundary) and the Bn decreases accordingly.
Clearly, the diurnal variation in the Bn is consistent with the low-level southward water vapor transport over the northern slope, which is regulated by the vertical meridional circulation between the TP and the Tianshan mountains. Note that the low-level southward water vapor transport reinforces substantially in the center of the TP (35° N) at 21:00 BJT (Figure 7i), which is closely related to the sudden acceleration in the v-component after climbing the TP. At this time, the anomalous upslope winds over the southern slope induced by the “pump effect” are weak. As a result, the strengthened upslope flows generate a compensating downward movement over the southern slopes in the evening, which can also be seen in Figure 5i and Figure 6b,i.
At the eastern boundary, the zonal Be is far larger than the meridional component (Figure 4d). Moreover, the sum of diurnal range of the zonal Be is about 92% of diurnal range of the total Be. This suggests that the zonal water vapor transport is predominant in both the Be and its diurnal variation. In Figure 4d, it can also be seen that the diurnal variation in the zonal Be between 39° N and 26° N is significant, with diurnal ranges larger than 2 × 10⁶ kg s−1. Figure 8 shows the longitude–height cross-sections of the zonal water vapor transport and vertical circulation along 26°–39° N. On average (Figure 8a), a westward water vapor transport belt exists in the low layer (about 1–2 km above the ground) over the eastern slope, coinciding with upslope winds. These upslope flows can be considered as the upward branch of the MPS circulation between the eastern TP and eastern China (118° E). Previous studies also have documented the existence of low-level westward water vapor transport over the eastern slope of the TP in summer [19,23]. Similar to the northern boundary, the temporal evolution of the Be is determined by the diurnal variation in the low-level westward water vapor transport, which is driven by the MPS circulation. When the TP slope cools down (warms up) from 03:00 (12:00) to 09:00 (00:00) BJT, anomalous downslope (upslope) flows and eastward (westward) water vapor transport appear in the lower troposphere at the eastern slope. With the development of the large-scale anti-MPS (MPS) circulation, the low-level eastward (westward) water vapor transport anomalies gradually strengthen and expand to eastern China. Around 0600 (21:00) BJT, the intensities of the low-level water vapor transport anomalies at the eastern boundary are the largest, which corresponds to the minimum (maximum) value of the Be.
3.2.2. The Relationship between the TP Bt and Precipitation
The net water vapor fluxes in a specific region provide the low-level dynamic forcing and water vapor source for local precipitation. Investigating the relationship between the Bt and precipitation on the diurnal time scale is helpful to comprehend the formation of the diurnal variation in precipitation. In contrast to the simultaneous variation between the Bt and precipitation on the monthly time scale [38], recent studies have found that the daily peak of the regional Bt is earlier than that of precipitation in the Meiyu front region and the Sichuan Basin [25,39]. The relationship between the Bt and precipitation over the TP is also examined herein. Due to the sparse and uneven characteristics of the rain gauges in the TP, we used the satellite precipitation data with a high spatiotemporal resolution to study the diurnal cycle of precipitation over the entire TP.
Figure 9a presents the diurnal cycle of climatological mean rainfall over the TP, based on the GPM and CMORPH satellite datasets. The GPM- and CMORPH-based results resemble each other, and both show a clear diurnal cycle of precipitation over the TP. The precipitation rate reaches its lowest value around 11:00 BJT, increases from 12:00 BJT, and reaches a peak around 19:00 BJT. The precipitation over the TP corresponds to, to some extent, the earlier TP Bt on the diurnal time scale. The TP Bt starts to increase at 10:00 BJT and reaches its highest value around 17:00 BJT, about 2–3 h earlier than the diurnal evolution of the TP precipitation. The lead–lag correlation between the time series of the TP Bt and the TP precipitation rate (Figure 9b) also confirms this phase difference. For both the GPM and CMORPH satellite datasets, the correlation coefficient is the largest (>0.85) at the lead time of 2–3 h. This suggests that the enhanced net water vapor fluxes in the TP precede the diurnal evolution of the precipitation over the TP. The time for the ascending motion peak is in agreement with that for the Bt over the TP (figure omitted). In the TP, water vapor is relatively thin. When the ascending motion reaches the peak, the water vapor in the lower layer of the atmosphere possibly has not reached saturation [15]. Therefore, it takes about 2–3 h for the net water vapor to converge and promote precipitation over the TP.
4. Conclusions
Using the ERA5 hourly reanalysis data, we investigated the diurnal variation in the net water vapor input over the TP. The results show that the TP Bt exhibits a distinct diurnal cycle with a single peak. The Bt starts to increase at 10:00 BJT and peaks at 17:00 BJT with a value of 169.4 × 10⁶ kg s−1. Compared to the daily mean, the summer water vapor income over the TP increases by approximately 2-fold in the afternoon. The increases in water vapor budgets at the four boundaries have positive contributions to the change in the TP Bt from the early morning to the afternoon, in which the western and eastern boundaries are more important.
The deviated water vapor flux vectors present a clockwise rotation in a day, which is associated with the diurnal veering of wind vectors in the lower atmosphere (below 450 hPa). These diurnal rotations of flux vectors generate anomalous water vapor convergence (divergence) in the TP in the afternoon (the early morning), which appear to enhance (reduce) the efficiency of the “air pump” during the daytime (nighttime). The water vapor flux vectors also show diurnal veering features over eastern China, with a smaller relative diurnal range compared to the TP. In the two regions, the diurnal variations in the direction and value of the water vapor fluxes are primarily determined by the wind field rather than the moisture content.
The diurnal variations in water vapor transports at the four boundaries, which bring about diurnal variations in the boundary water vapor budgets and Bt, are essentially regulated by the diurnal evolution of the terrain thermodynamic effect. In general, fast and strong warming (cooling) on the TP slopes generates anomalous water vapor input (output) by virtue of anomalous upslope (downslope) flows during the daytime (nighttime). However, there are discrepancies in the specific diurnal evolutions between the four boundaries, induced by different local circulation. At the southern and western boundaries, apart from the terrain thermodynamic effect, the nighttime acceleration (daytime deceleration) of the Indian southerly monsoon also promotes (inhibits) a low-level water vapor input towards the TP, which has a smaller contribution to the change in the Bs and Bw. In addition, the compensation downward flows of upslope winds over the northern TP have a negative contribution to the Bs and Bw in the evening.
At the northern and eastern boundaries, the diurnal variations in the Bn and Be mainly depend on the low-level water vapor transport belts towards the TP, which exist in summer and can be considered the upward branch of the vertically meridional (zonal) circulation between the TP and the Tianshan mountains (eastern China). When the air is warmed up (cooled down) over the TP slopes, plateau scale vertical circulations are in the positive (negative) phase. The anomalous upslope (downslope) flows favor water vapor input (output) in the lower troposphere at the boundaries. When the vertical circulations and low-level water vapor transport are the strongest, the Bn and Be reach their peaks/valleys.
The temporal evolution of precipitation over the entire TP coincides well with that of the earlier TP Bt on the diurnal time scale. When the TP Bt reaches a maximum at 17:00 BJT, precipitation reaches its peak at around 20:00 BJT, approximately 2–3 h later.
5. Discussion
In this paper, it is found that water vapor flux vectors exhibit clockwise rotations to complete closed circles in a day over most parts of the TP, which is consistent with the diurnal veering of wind vectors. Geostrophic wind components show a much weaker diurnal variation and contribute to a small fraction of the diurnal variation in the total wind, while the diurnal variation in the ageostrophic wind component is roughly consistent with that of the total wind at 450 hPa (figure omitted). This seems to be in accordance with the Blackadar BLO theory. Whether the BLO theory can explain the diurnal veering feature of water vapor fluxes and wind vectors in the TP needs to be investigated in detail.
In addition, the following aspects also deserve more studies in the future. First, the diurnal range of the Bt shows a significant decreasing trend from 1979 to 2019 (figure omitted), which is associated with the increase in the nighttime Bt and Be. A detailed study on the reasons for this long-term change in the diurnal variability of the TP Bt will enrich the scientific knowledge. Second, the diurnal features of the Bt and boundary water vapor budgets have been explored. Further attention will be paid to the effects of diurnal variation in the boundary water vapor budgets or the TP Bt. Third, there are possible water vapor and circulation biases over the TP between different reanalysis datasets. Multiple datasets, including the MERRA-2 [40], which also provide hourly meteorological variables with a long period, could be used in the future to compare with the results of the ERA5 dataset.
Author Contributions
Conceptualization, H.W. and P.Z.; methodology, P.Z.; data curation, visualization, writing—original draft preparation, H.W.; review and editing, P.Z.; funding acquisition, P.Z. All authors have read and agreed to the published version of the manuscript.
Funding
This research was funded by the Second Scientific Expedition on the Qinghai-Tibet Plateau (2019QZKK020803) and the Strategic Priority Research Program of Chinese Academy of Sciences Pan-Third Pole Environment Study for a Green Silk Road (XDA2010030807).
Institutional Review Board Statement
Not applicable.
Informed Consent Statement
Not applicable.
Data Availability Statement
Publicly available datasets were analyzed in this study. The European Center for Medium-Range Weather Forecasts Reanalysis fifth generation dataset (ERA5) can be accessed here: https://cds.climate.copernicus.eu/ (accessed on 1 March 2021). The Integrated Multi-satellite Retrievals for GPM (IMERG) V06 B Level 3 final run precipitation dataset can be accessed here: https://gpm.nasa.gov/data/ (accessed on 16 May 2022). The NOAA CPC morphing technique (CMORPH) precipitation dataset can be accessed here: https://www.ncei.noaa.gov/products/climate-data-records/precipitation-cmorph (accessed on 5 August 2022).
Conflicts of Interest
The authors declare no conflict of interest.
References
- Yao, T.; Thompson, L.; Yang, W.; Yu, W.; Gao, Y.; Guo, X.; Yang, X.; Duan, K.; Zhao, H.; Xu, B.; et al. Different glacier status with atmospheric circulations in Tibetan Plateau and surroundings. Nat. Clim. Chang. 2012, 2, 663–667. [Google Scholar] [CrossRef]
- Immerzeel, W.W.; van Beek, L.P.; Bierkens, M.F. Climate change will affect the Asian water towers. Science 2010, 328, 1382–1385. [Google Scholar] [CrossRef]
- Xu, X.; Lu, C.; Shi, X.; Gao, S. World water tower: An atmospheric perspective. Geophys. Res. Lett. 2008, 35, L20815. [Google Scholar] [CrossRef]
- Gettelman, A.; Kinnison, D.E.; Dunkerton, T.J.; Brasseur, G.P. Impact of monsoon circulations on the upper troposphere and lower stratosphere. J. Geophys. Res. 2004, 109, D22101. [Google Scholar] [CrossRef]
- Fu, R.; Hu, Y.; Wright, J.S.; Jiang, J.H.; Dickinson, R.E.; Chen, M.; Filipiak, M.; Read, W.G.; Waters, J.W.; Wu, D.L. Short circuit of water vapor and polluted air to the global stratosphere by convective transport over the Tibetan Plateau. Proc. Natl. Acad. Sci. USA 2006, 103, 5664–5669. [Google Scholar] [CrossRef]
- Xu, X.; Zhao, T.; Lu, C.; Guo, Y.; Chen, B.; Liu, R.; Li, Y.; Shi, X. An important mechanism sustaining the atmospheric “water tower” over the Tibetan Plateau. Atmos. Chem. Phys. Discuss. 2014, 14, 11287–11295. [Google Scholar] [CrossRef]
- Zhao, P.; Xu, X.; Chen, F.; Guo, X.; Zheng, X.; Liu, L.; Hong, Y.; Li, Y.; La, Z.; Peng, H.; et al. The third atmospheric scientific experiment for understanding the earth atmosphere coupled system over the Tibetan Plateau and its effect. Bull. Am. Meteor. Soc. 2018, 99, 757–776. [Google Scholar] [CrossRef]
- Liu, Y.; Li, Y.; Huang, J.; Zhu, Q.; Wang, S. Attribution of the Tibetan Plateau to northern drought. Natl. Sci. Rev. 2020, 7, 489–492. [Google Scholar] [CrossRef]
- Zhao, Y.; Chen, D.; Deng, Y.; Son, S.; Wang, X.; Di, D.; Pan, M.; Ma, X. How were the eastward–moving heavy rainfall events from the Tibetan Plateau to the lower reaches of the Yangtze River enhanced? J. Clim. 2021, 34, 607–620. [Google Scholar] [CrossRef]
- Ma, Y.; Fan, S.; Ishikawa, H.; Tsukamoto, O.; Yao, T.; Koike, T.; Zuo, H.; Hu, Z.; Su, Z. Diurnal and inter–monthly variation of land surface heat fluxes over the central Tibetan Plateau area. Theor. Appl. Climatol. 2005, 80, 259–273. [Google Scholar] [CrossRef]
- Xu, W.; Zipser, E.J. Diurnal variations of precipitation, deep convection, and lightning over and east of the eastern Tibetan Plateau. J. Clim. 2011, 24, 448–465. [Google Scholar] [CrossRef]
- Li, L.; Zhang, R.; Wen, M. Diurnal variation in the occurrence frequency of the Tibetan Plateau vortices. Meteorol. Atmos. Phys. 2014, 125, 135–144. [Google Scholar] [CrossRef]
- Wei, N.; Zhou, L.; Dai, Y. Evaluation of simulated climatological diurnal temperature range in CMIP5 models from the perspective of planetary boundary layer turbulent mixing. Clim. Dyn. 2017, 49, 1–22. [Google Scholar] [CrossRef]
- Che, J.; Zhao, P. Characteristics of the summer atmospheric boundary layer height over the Tibetan Plateau and influential factors. Atmos. Chem. Phys. 2021, 21, 5253–5268. [Google Scholar] [CrossRef]
- Chen, M.; Yao, X. The characteristics and mechanisms on diurnal variation of summer precipitation over the Tibetan Plateau. Clim. Dyn. 2022. [Google Scholar] [CrossRef]
- Kuwagata, T.; Numaguti, A.; Endo, N. Diurnal variation of water vapor over the central Tibetan Plateau during summer. J. Meteorol. Soc. Jpn. 2001, 79, 401–418. [Google Scholar] [CrossRef]
- Sasaki, T.; Wu, P.; Kimura, F.; Yoshikane, T.; Liu, J. Drastic evening increase in precipitable water vapor over the southeastern Tibetan Plateau. J. Meteorol. Soc. Jpn. 2003, 81, 1273–1281. [Google Scholar] [CrossRef]
- Wang, Y.; Yang, K.; Pan, Z.; Qin, J.; Chen, D.; Lin, C.; Chen, Y.; Lazhu; Tang, W.; Han, M.; et al. Evaluation of precipitable water vapor from four satellite products and four reanalysis datasets against GPS measurements on the Southern Tibetan Plateau. J. Clim. 2017, 30, 5699–5713. [Google Scholar] [CrossRef]
- Feng, L.; Zhou, T. Water vapor transport for summer precipitation over the Tibetan Plateau: Multidata set analysis. J. Geophys. Res. 2012, 117, D20114. [Google Scholar] [CrossRef]
- Zhou, C.; Zhao, P.; Chen, J. The interdecadal change of summer water vapor over the Tibetan Plateau and associated mechanisms. J. Clim. 2019, 32, 4103–4119. [Google Scholar] [CrossRef]
- Wang, H.; Zhao, P. Spatiotemporal variation of water vapor budget over the Tibetan Plateau and its regulation on precipitation. J. Trop. Meteorol. 2022, 28, 194–206. [Google Scholar] [CrossRef]
- Dai, A.; Deser, C. Diurnal and semidiurnal variations in global surface wind and divergence fields. J. Geophys. Res. 1999, 104, 31109–31125. [Google Scholar] [CrossRef]
- Sun, J.; Zhang, F. Impacts of mountain–plains solenoid on diurnal variations of rainfalls along the Mei-Yu Front over the East China plains. Mon. Weather. Rev. 2012, 140, 379–397. [Google Scholar] [CrossRef]
- Blackadar, A.K. Boundary layer wind maxima and their significance for the growth of nocturnal inversions. Bull. Am. Meteor. Soc. 1957, 38, 283–290. [Google Scholar] [CrossRef]
- Xue, M.; Luo, X.; Zhu, K.; Sun, Z.; Fei, J. The controlling role of boundary layer inertial oscillations in Meiyu frontal precipitation and its diurnal cycles over China. J. Geophys. Res. Atmos. 2018, 123, 5090–5115. [Google Scholar] [CrossRef]
- Pan, H.; Chen, G. Diurnal variations of precipitation over North China regulated by the mountain-plains solenoid and boundary-layer inertial oscillation. Adv. Atmos. Sci. 2019, 36, 863–884. [Google Scholar] [CrossRef]
- Fujinami, H.; Fujita, K.; Takahashi, N.; Sato, T.; Kanamori, H.; Sunako, S.; Kayastha, R.B. Twice-daily monsoon precipitation maxima in the Himalayas driven by land surface effects. J. Geophys. Res. 2021, 126, e2020JD034255. [Google Scholar] [CrossRef]
- Hersbach, H.; Bell, B.; Berrisford, P.; Hirahara, S.; Horanyi, A.; Muñoz-Sabater, J.; Nicolas, J.; Peubey, C.; Radu, R.; Schepers, D.; et al. The ERA5 global reanalysis. Q. J. R. Meteorol. Soc. 2020, 146, 1999–2049. [Google Scholar] [CrossRef]
- Yu, L.; Fu, Y.F.; Yang, Y.; Pan, X.; Tan, R. Trumpet-shaped topography modulation of the frequency, vertical structures, and water path of cloud systems in the summertime over the southeastern Tibetan Plateau: A perspective of daytime–nighttime differences. J. Geophys. Res. Atmos. 2020, 125, e2019JD031803. [Google Scholar] [CrossRef]
- Zhang, W.; Zhang, H.; Liang, H.; Lou, Y.; Cai, Y.; Cao, Y.; Zhou, Y.; Liu, W. On the suitability of ERA5 in hourly GPS precipitable water vapor retrieval over China. J. Geod. 2019, 93, 1897–1909. [Google Scholar] [CrossRef]
- Huffman, G.J.; Bolvin, D.T.; Braithwaite, D.; Hsu, K.; Joyce, R.; Kidd, C.; Nelkin, E.J.; Sorooshian, S.; Tan, J.; Xie, P. NASA Global Precipitation Measurement (GPM) Integrated Multi-Satellite Retrievals for GPM (IMERG). Algorithm Theoretical Basis Document Version 06; p. 38. Available online: https://gpm.nasa.gov/sites/default/files/2019-05/IMERG_ATBD_V06.pdf (accessed on 16 May 2022).
- Kulie, M.S.; Bennartz, R. Utilizing spaceborne radars to retrieve dry snowfall. J. Appl. Meteorol. Climatol. 2009, 48, 2564–2580. [Google Scholar] [CrossRef]
- Kukulies, J.; Chen, D.; Wang, M. Temporal and spatial variations of convection, clouds and precipitation over the Tibetan Plateau from recent satellite observations. Part II: Precipitation climatology derived from global precipitation measurement mission. Int. J. Climatol. 2020, 40, 4858–4875. [Google Scholar] [CrossRef]
- Joyce, R.J.; Janowiak, J.E.; Arkin, P.A.; Xie, P. CMORPH: A method that produces global precipitation estimates from passive microwave and infrared data at high spatial and temporal resolution. J. Hydrometeorol. 2004, 5, 487–503. [Google Scholar] [CrossRef]
- Wu, G.; Liu, Y.; Zhang, Q.; Duan, A.; Wang, T.; Wan, R.; Liu, X.; Li, W.; Wang, Z.; Liang, X. The influence of mechanical and thermal forcing by the Tibetan Plateau on Asian climate. J. Hydrometeorol. 2007, 8, 770–789. [Google Scholar] [CrossRef]
- Gao, B.; Yang, P.; Guo, G.; Park, S.K.; Wiscombe, W.; Chen, B. Measurements of water vapor and high clouds over the Tibetan Plateau with the Terra MODIS instrument. IEEE. Trans. Geosci. Remote 2003, 41, 895–900. [Google Scholar] [CrossRef]
- Chen, G. Diurnal Cycle of the Asian summer monsoon: Air pump of the second kind. J. Clim. 2020, 33, 1747–1775. [Google Scholar] [CrossRef]
- Piao, J.; Chen, W.; Zhang, Q.; Hu, P. Comparison of moisture transport between Siberia and Northeast Asia on annual and interannual time Scales. J. Clim. 2018, 31, 7645–7660. [Google Scholar] [CrossRef]
- Zhang, Y.; Xue, M.; Zhu, K.; Zhou, B. What is the main cause of diurnal variation and nocturnal peak of summer precipitation in Sichuan Basin, China? The key role of boundary layer low-level jet inertial oscillations. J. Geophys. Res. Atmos. 2019, 124, 2643–2664. [Google Scholar] [CrossRef]
- Bosilovich, M.G.; Akella, S.; Coy, L.; Cullather, R.; Draper, C.; Gelaro, R.; Kovach, R.; Liu, Q.; Molod, A.; Norris, P.; et al. MERRA-2: Initial Evaluation of the Climate; NASA/TM-2015-104606; National Aeronautics and Space Administration, Goddard Space Flight Center: Greenbelt, MD, USA, 2015; Volume 43, p. 139. Available online: https://gmao.gsfc.nasa.gov/pubs/tm/docs/Bosilovich803.pdf (accessed on 11 September 2022).
Figure 1.
The boundaries (elevation greater than 2000 m) of the Tibetan Plateau (TP), where the southern, western, northern, and eastern boundaries are denoted in green, red, blue, and purple, respectively. The numbers are the series of sub-boundaries (1° latitude or longitude) on each boundary. The dashed gray rectangle (108°–120° E, 25°–35° N) denotes eastern China region.

Figure 2.
Climatological mean of vertically integrated water vapor fluxes (vectors; units: kg m−1 s−1) in summer from 1979 to 2019.
Figure 2.
Climatological mean of vertically integrated water vapor fluxes (vectors; units: kg m−1 s−1) in summer from 1979 to 2019.
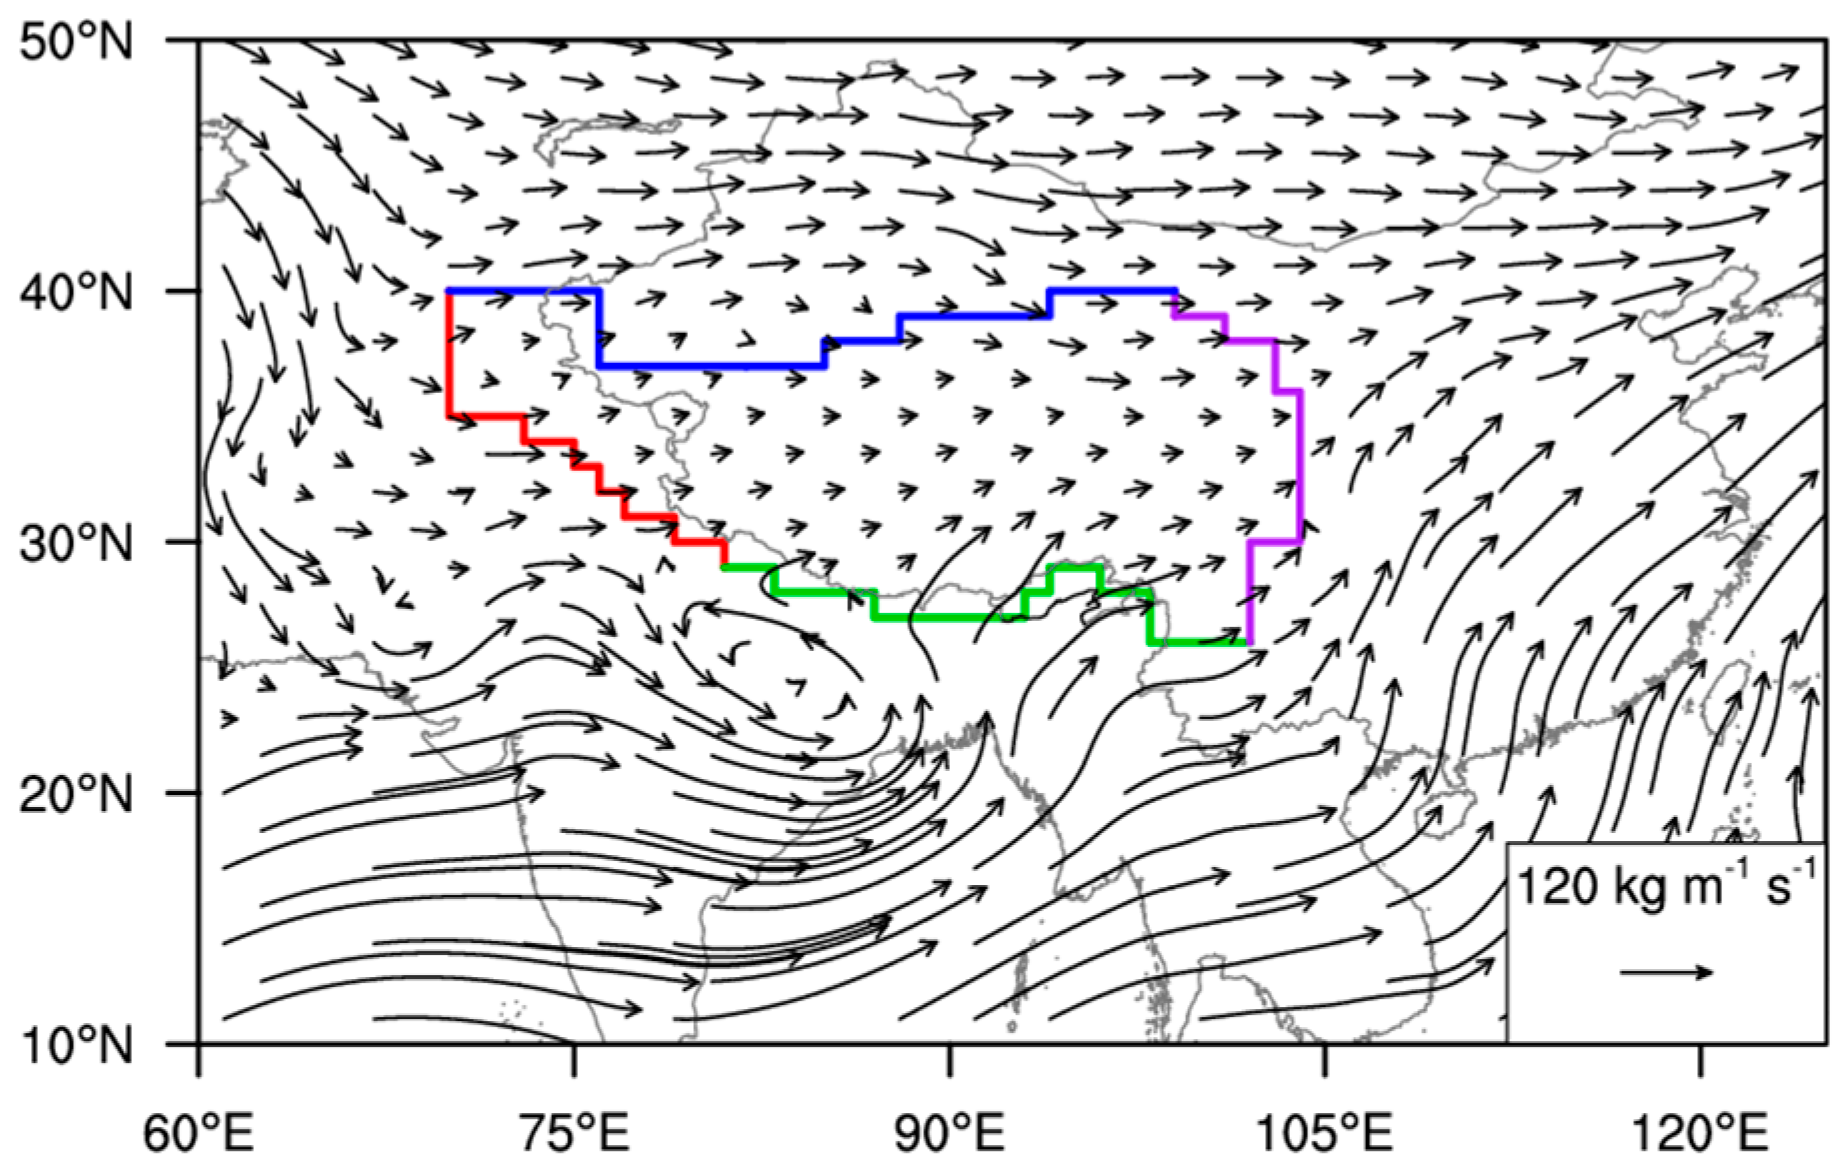
Figure 3.
(a) Diurnal cycles of the net water vapor budget (Bt; black curve) and water vapor budgets at the southern (Bs; green curve), western (Bw; red curve), northern (Bn; blue curve), and eastern (Be; purple curve) boundaries over the TP during summer (unit: 106 kg s−1). (b) Diurnal variation in vertically integrated water vapor fluxes around the TP in summer (unit: kg m−1 s−1). The daily mean has been removed in each grid. The gray contour in (b) indicates the TP area (≥2000 m). (c) is the same as in (b), but over eastern China.
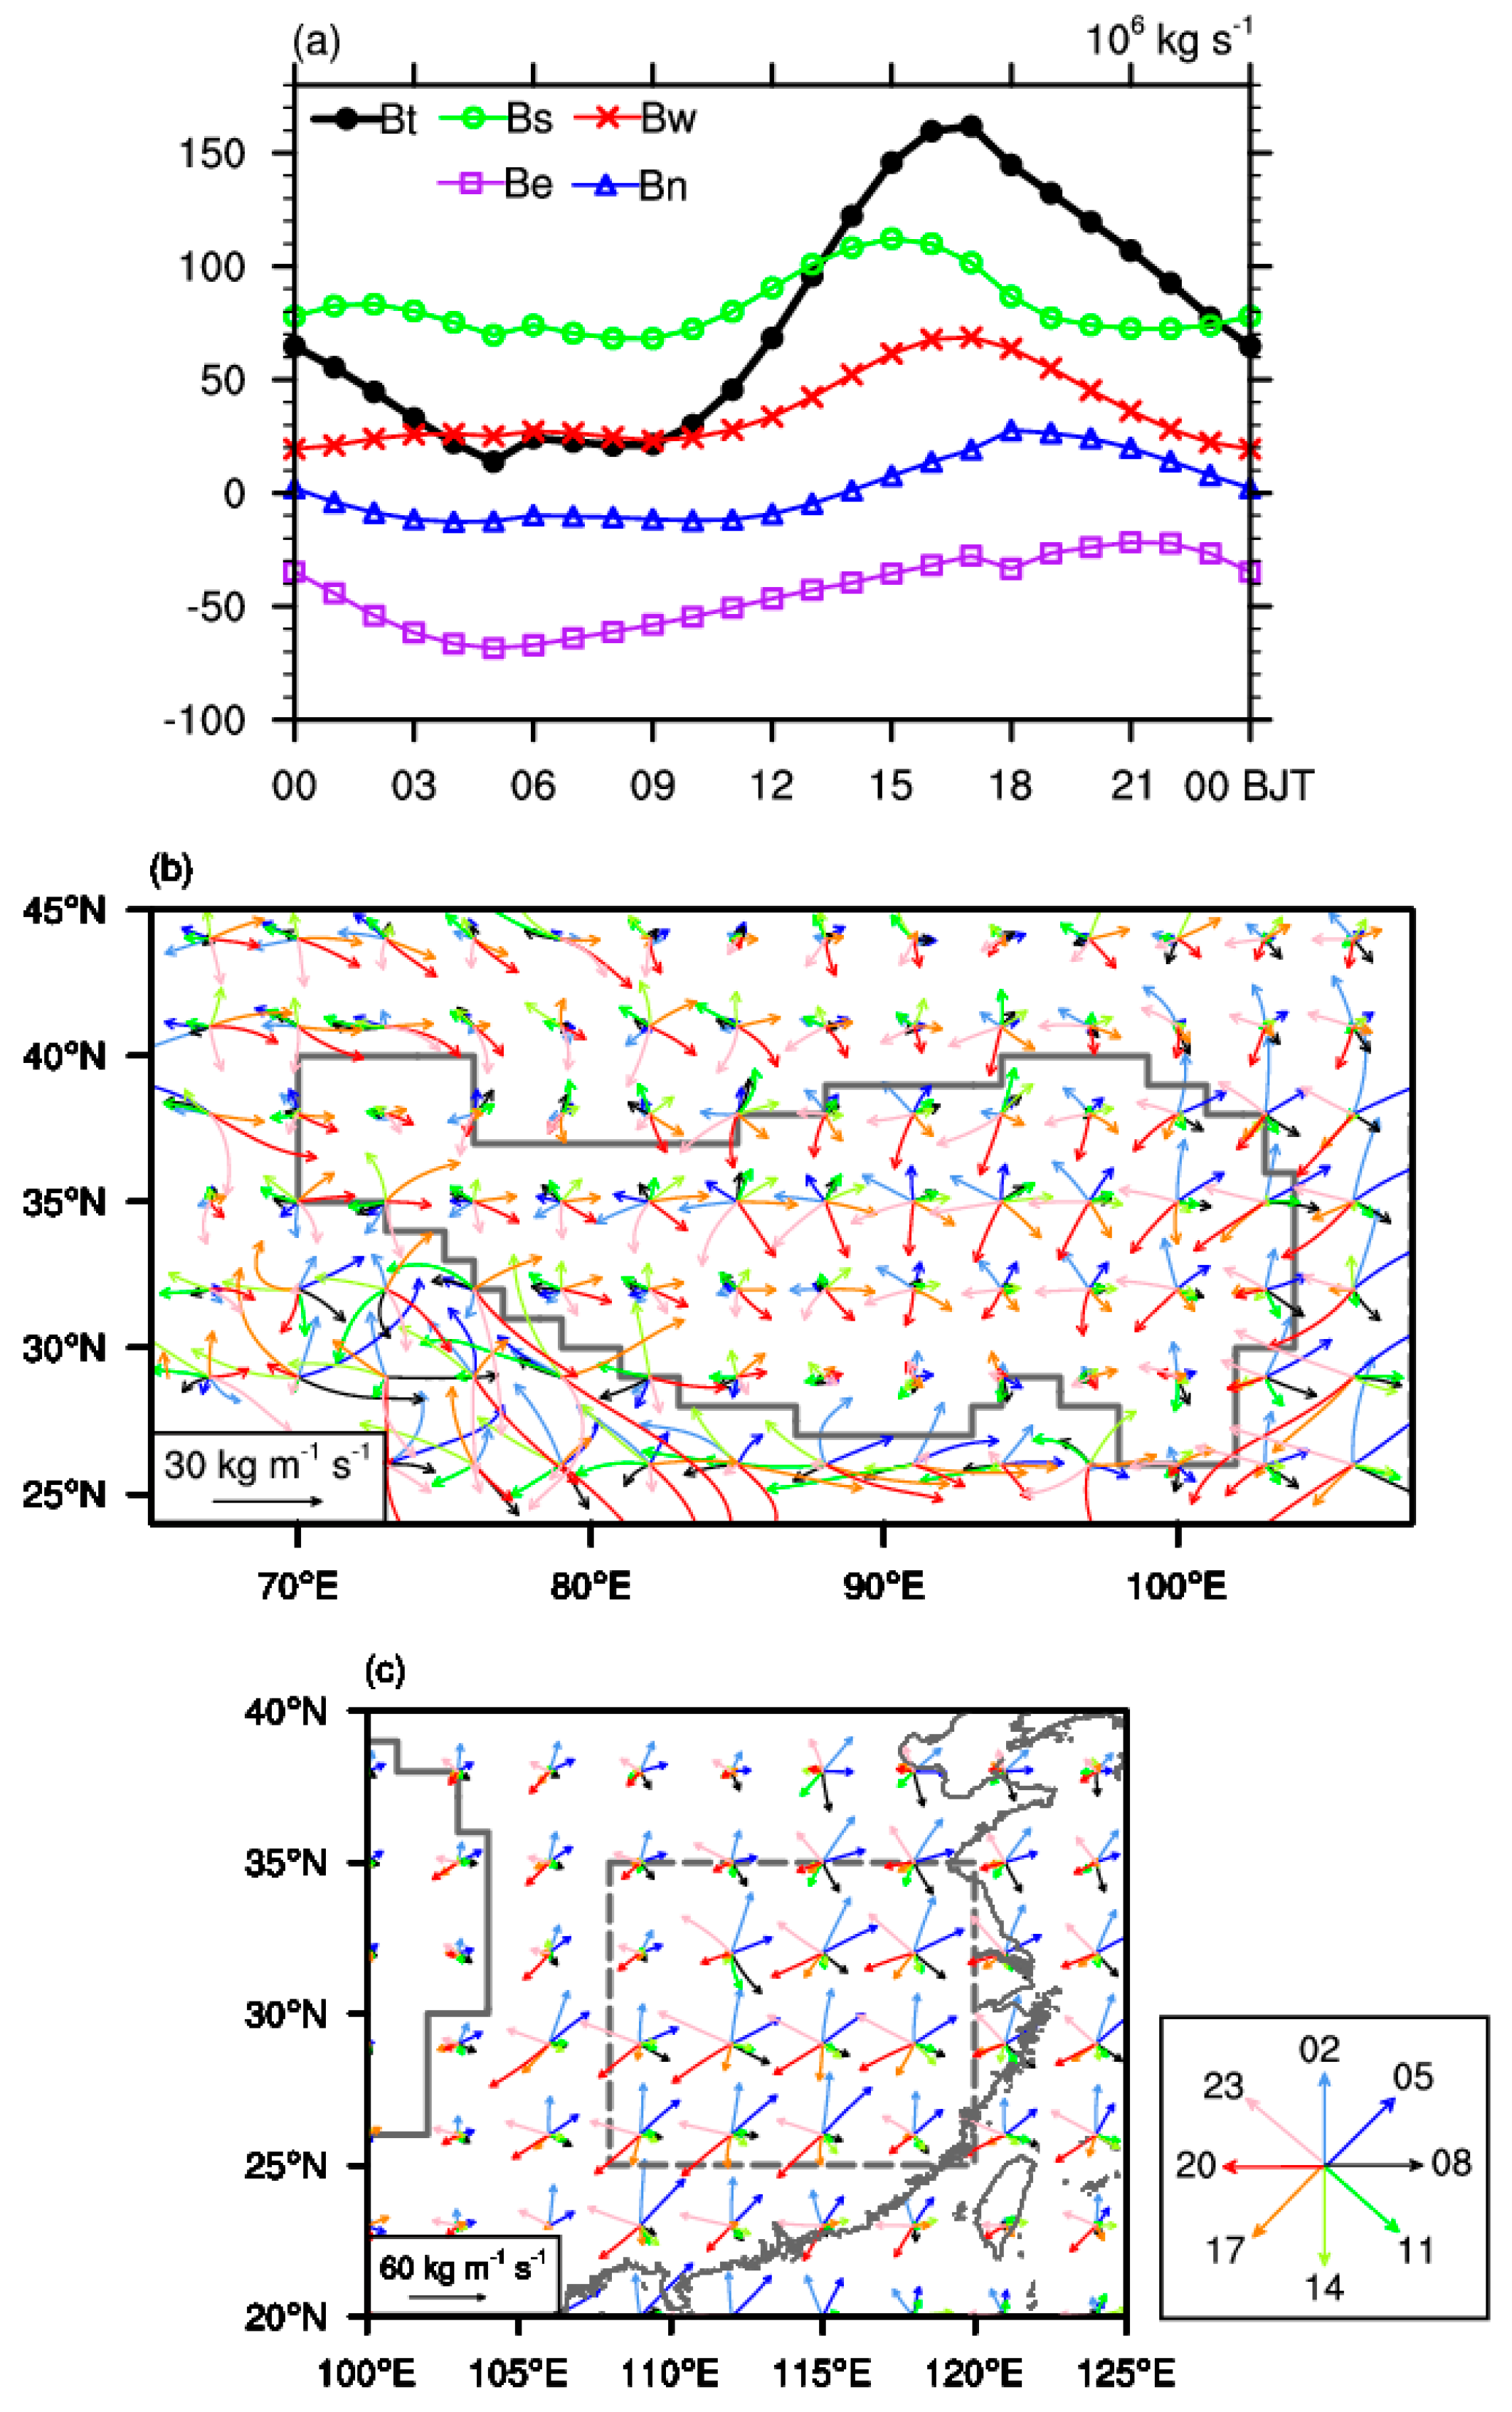
Figure 4.
(a) Variations in the Bs (black line with dots) and its diurnal range (red line with dots) along the southern boundary of the TP. The abscissa represents the series numbers of sub-boundaries on the southern boundary in Figure 1. The horizontal gray dash line is the reference line of diurnal range of the Bs. (b–d) are the same as in (a), but for the western, northern, and eastern boundaries, respectively (unit: 106 kg s−1).
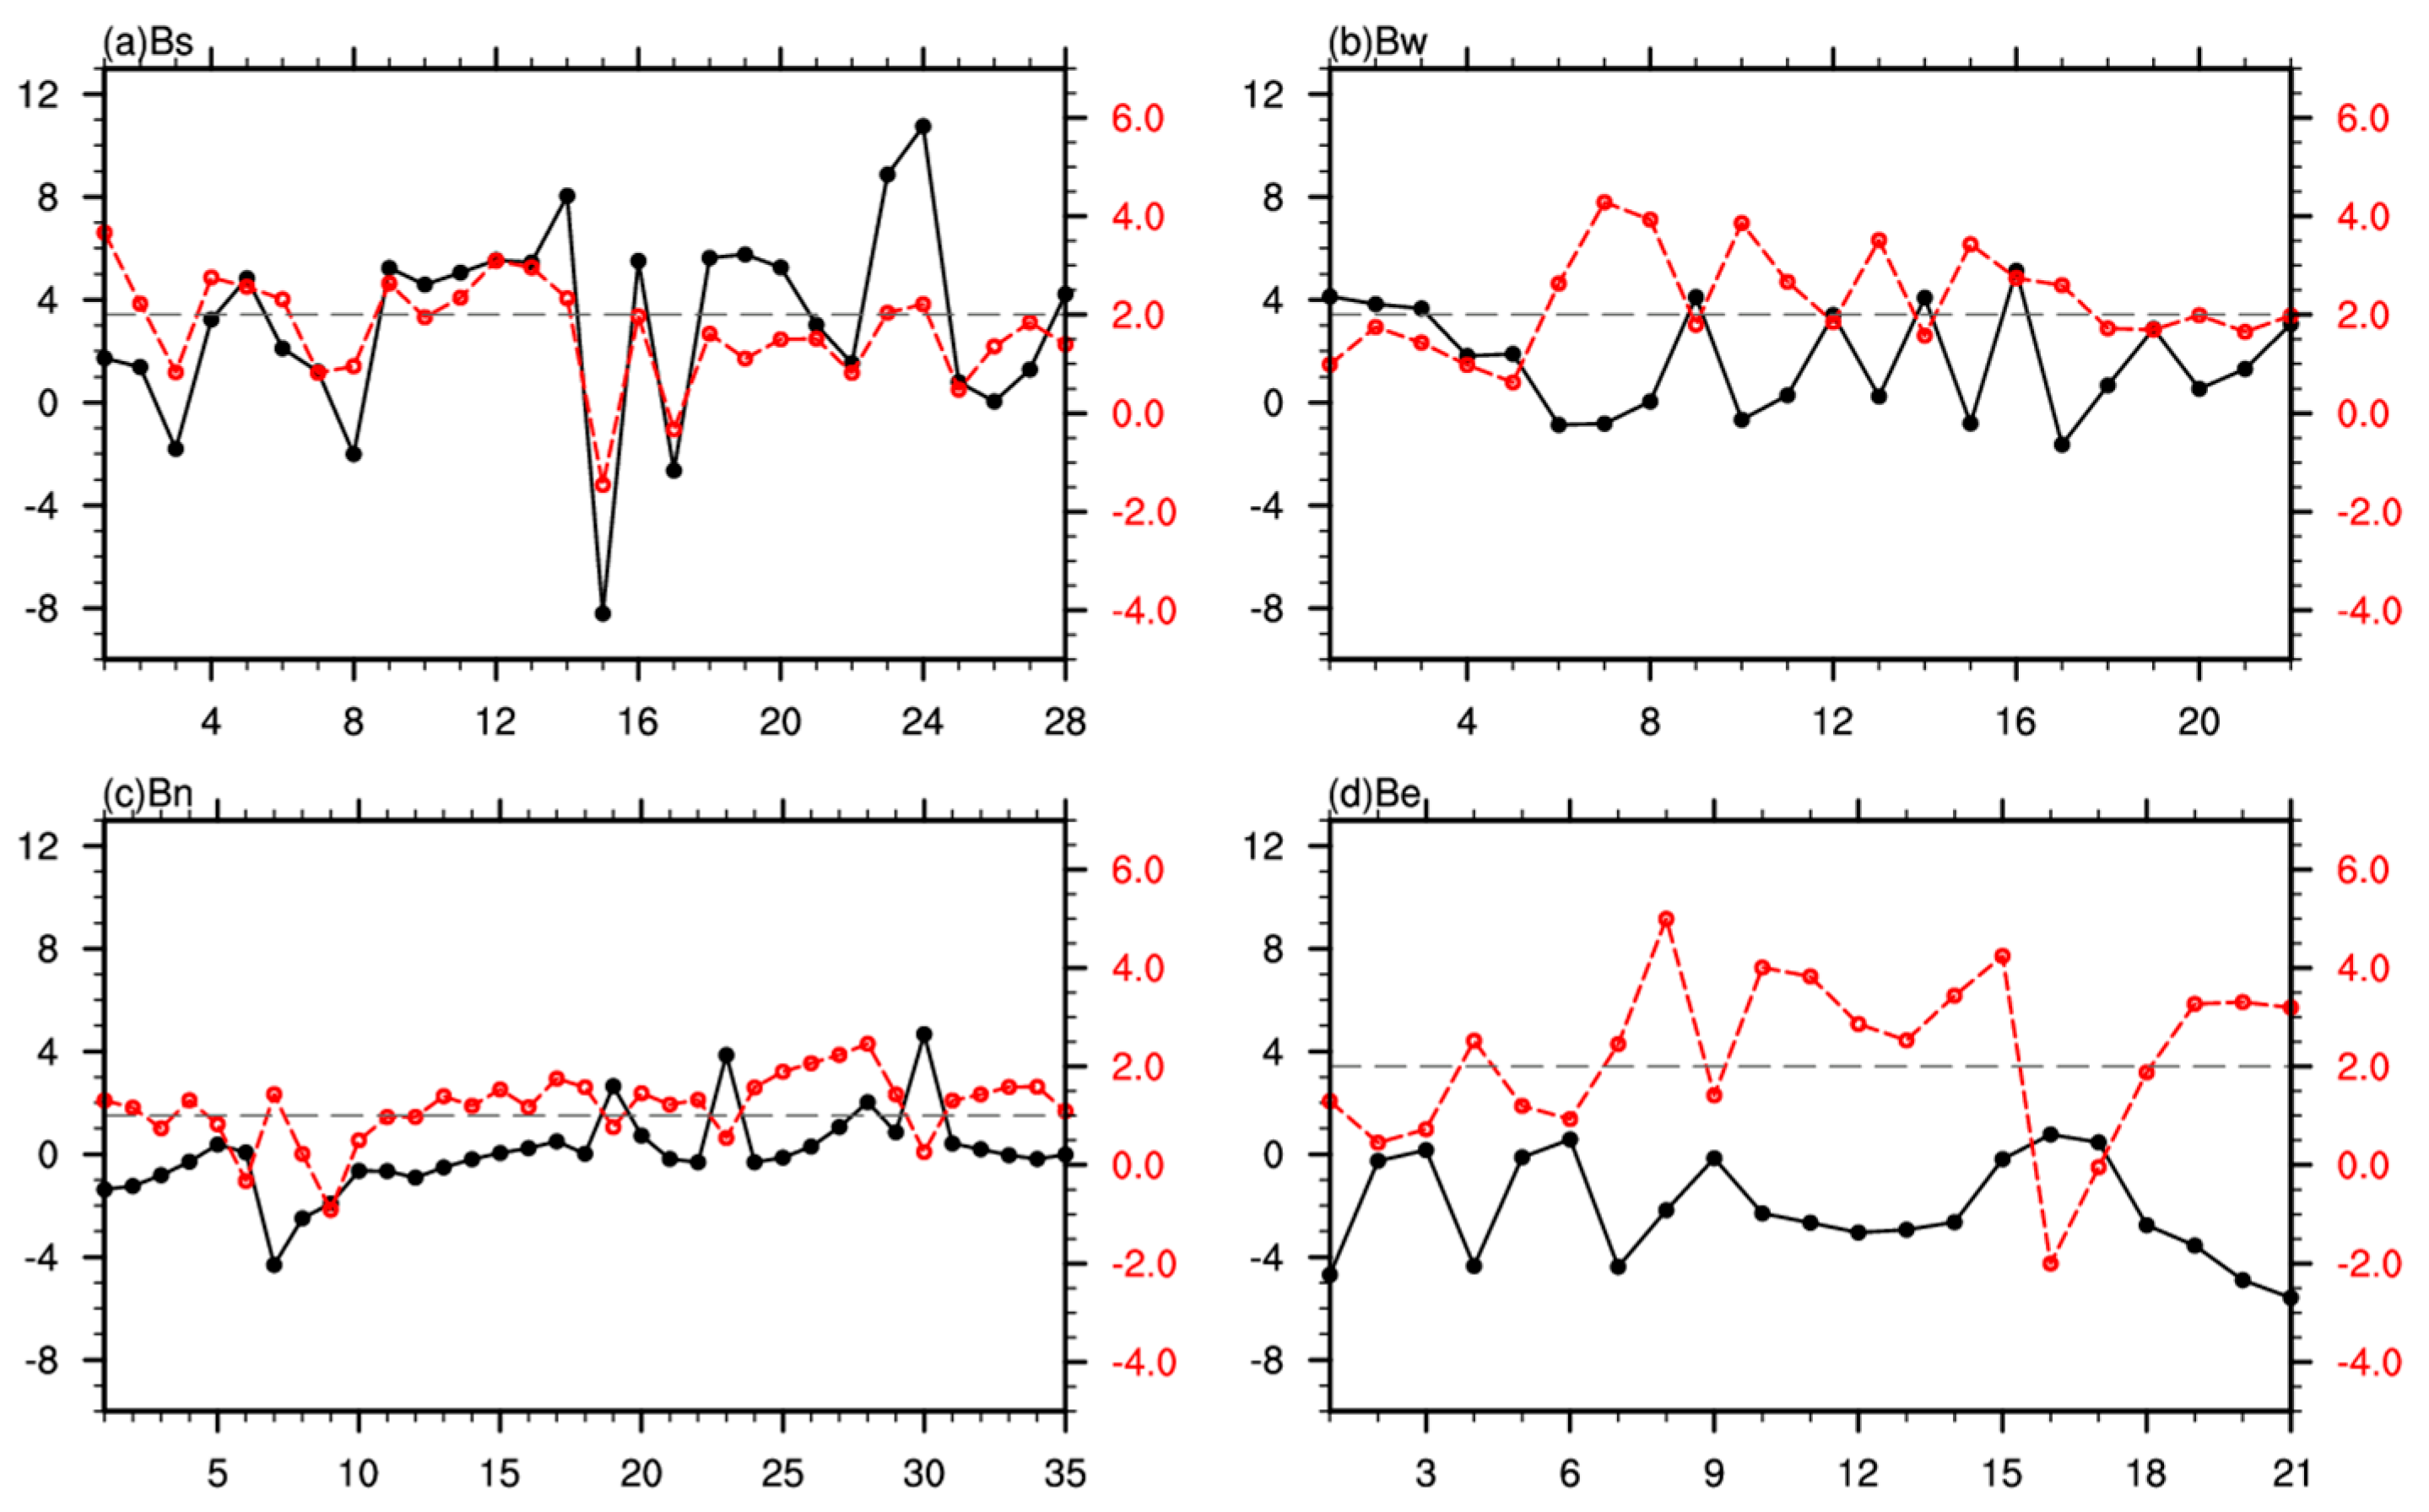
Figure 5.
The latitude−height cross-sections of the meridional water vapor transport (shaded; unit: g kg−1 m s−1) and vertical circulation in summer (vectors; unit: m s−1; the omega has been multiplied by −10, unit: Pa s−1) along 81°–85° E. (a) is the daily mean; (b–i) are the diurnal deviations at 3 h intervals with the daily mean removed. Purple dashed contours denote temperature deviations (units °C). The gray shaded areas represent the topography. The black upward arrows above the topography indicate the southern boundary of the TP (elevation greater than 2000 m).
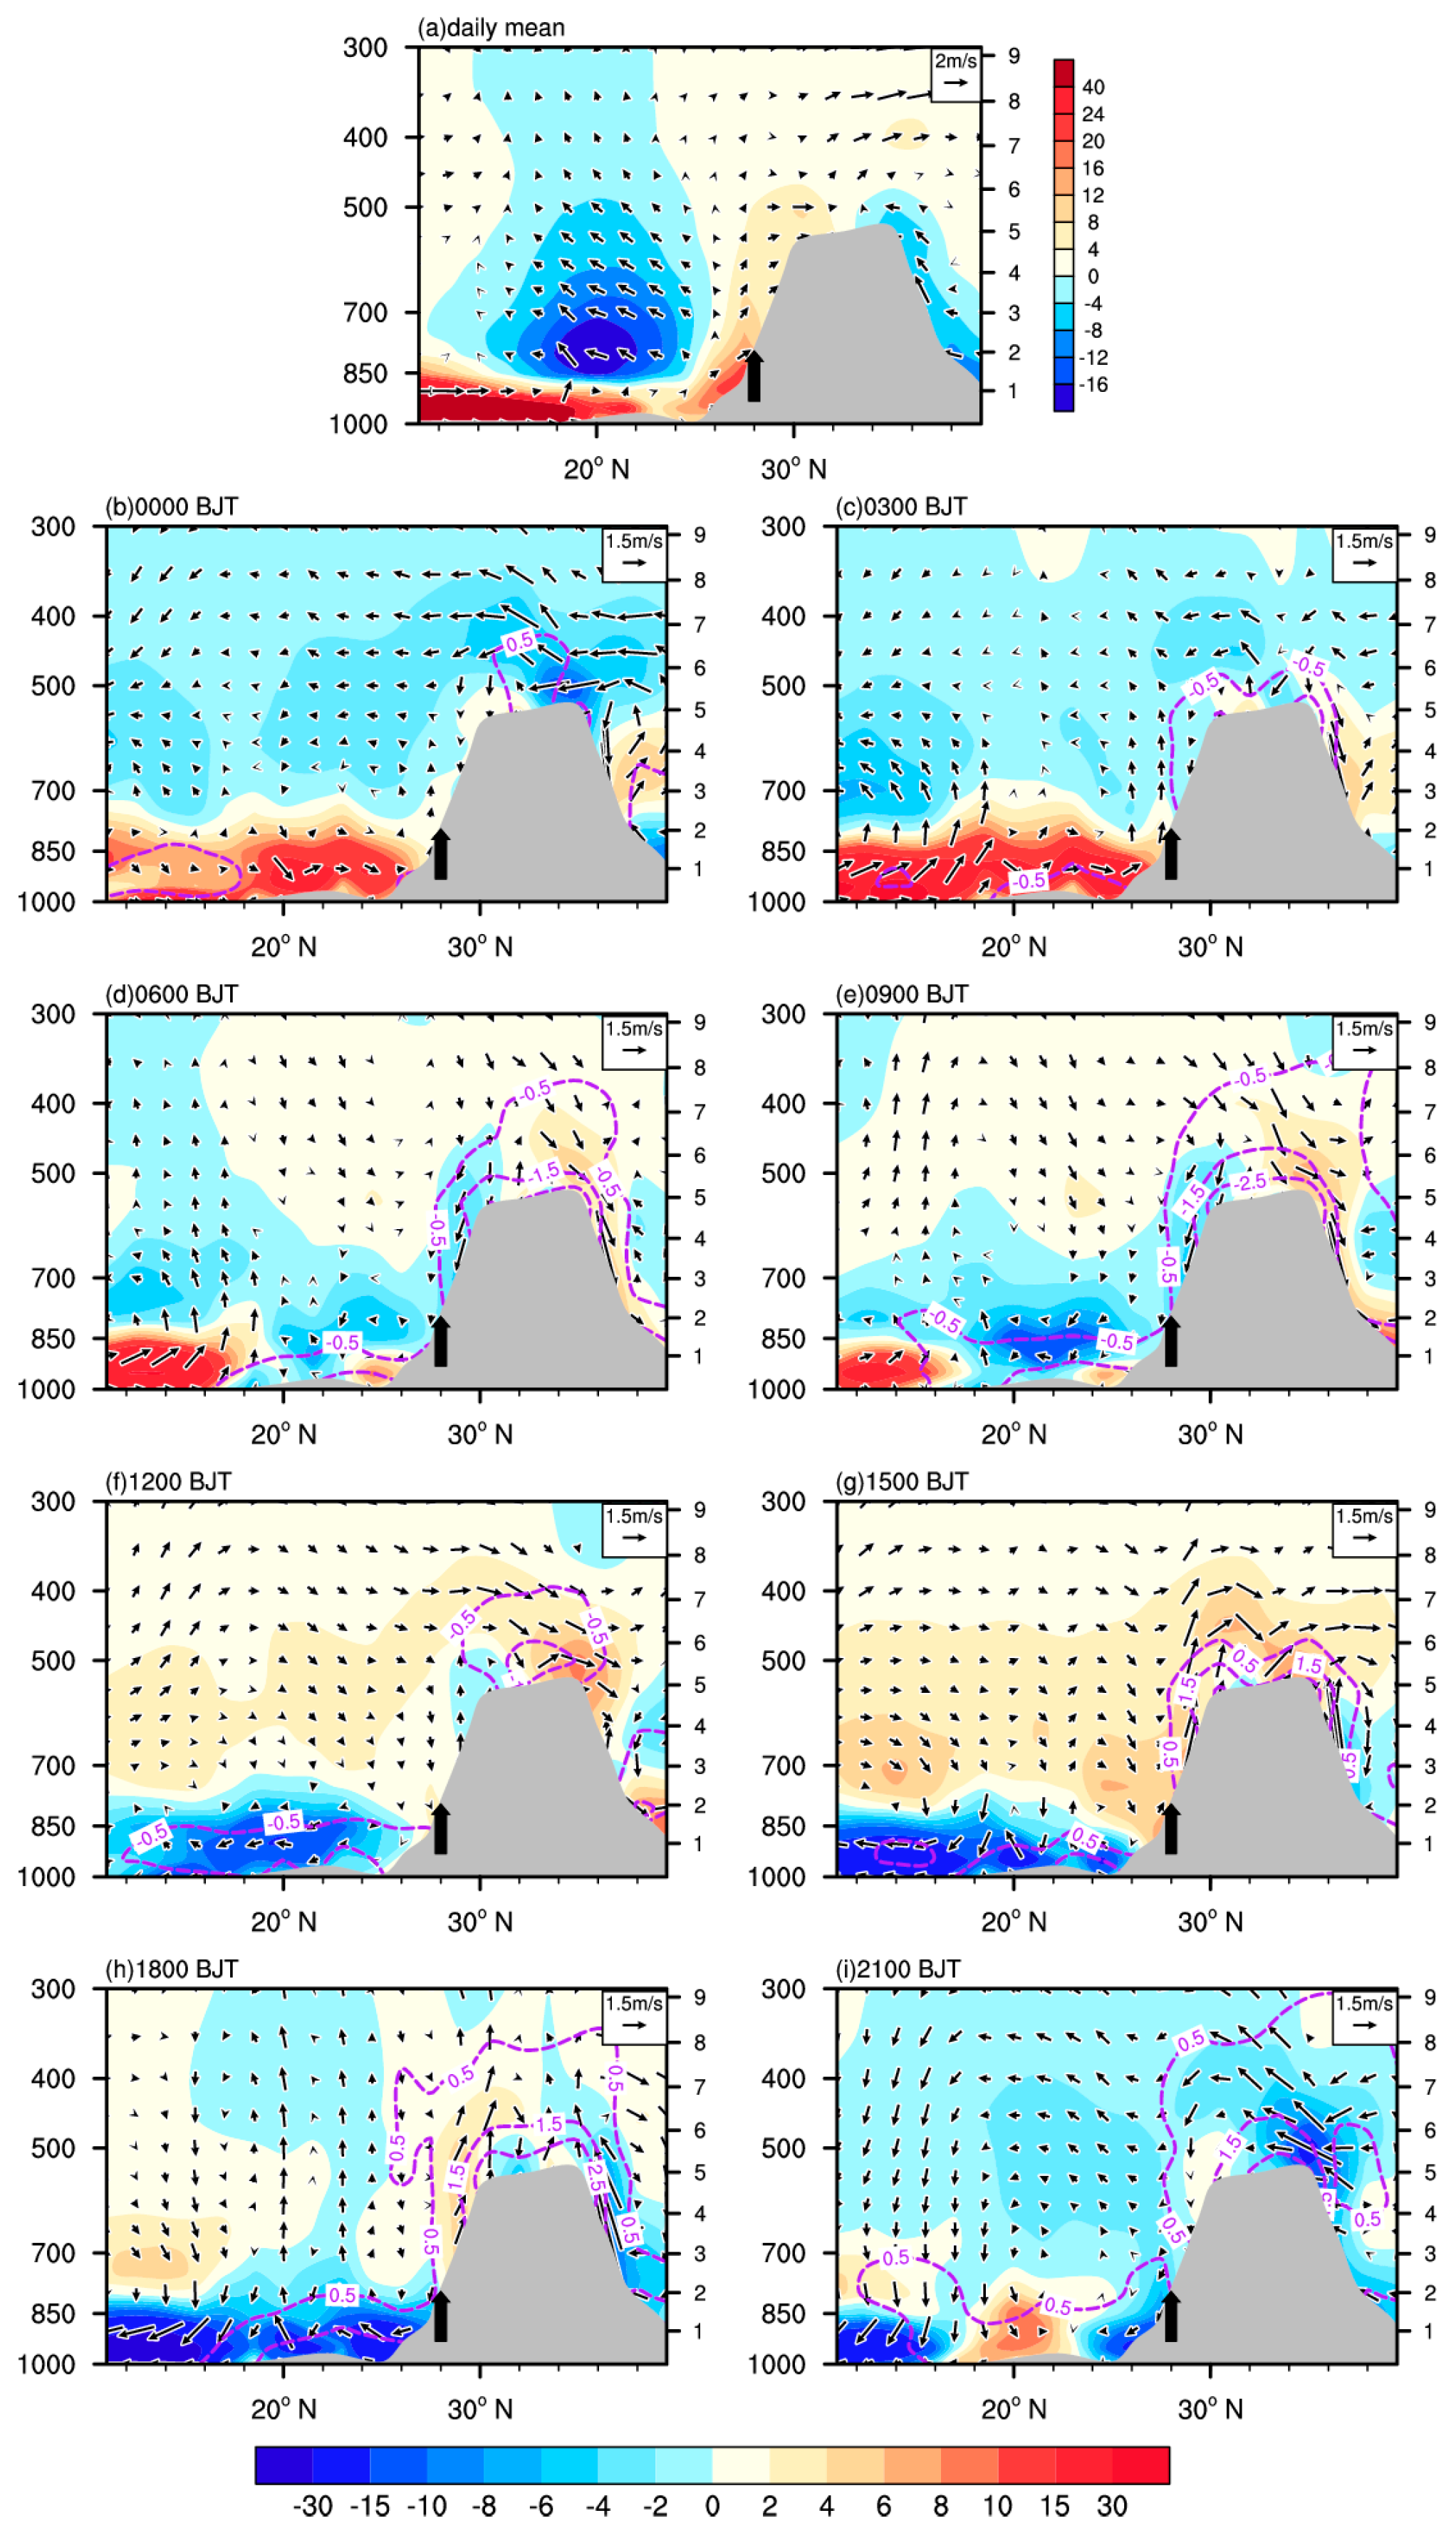
Figure 6.
(a–i) are the same as in Figure 5a–i, but for the meridional water vapor transport and vertical circulation along 70°–81° E. The black upward arrows above the topography indicate the western boundary of the TP.
Figure 6.
(a–i) are the same as in Figure 5a–i, but for the meridional water vapor transport and vertical circulation along 70°–81° E. The black upward arrows above the topography indicate the western boundary of the TP.

Figure 7.
(a–i) are the same as in Figure 5a–i, but for the meridional water vapor transport and vertical circulation along 79°–99° E. The omega has been multiplied by −20 (unit: Pa s−1). The black upward arrows above the topography indicate the northern boundary of the TP.
Figure 7.
(a–i) are the same as in Figure 5a–i, but for the meridional water vapor transport and vertical circulation along 79°–99° E. The omega has been multiplied by −20 (unit: Pa s−1). The black upward arrows above the topography indicate the northern boundary of the TP.
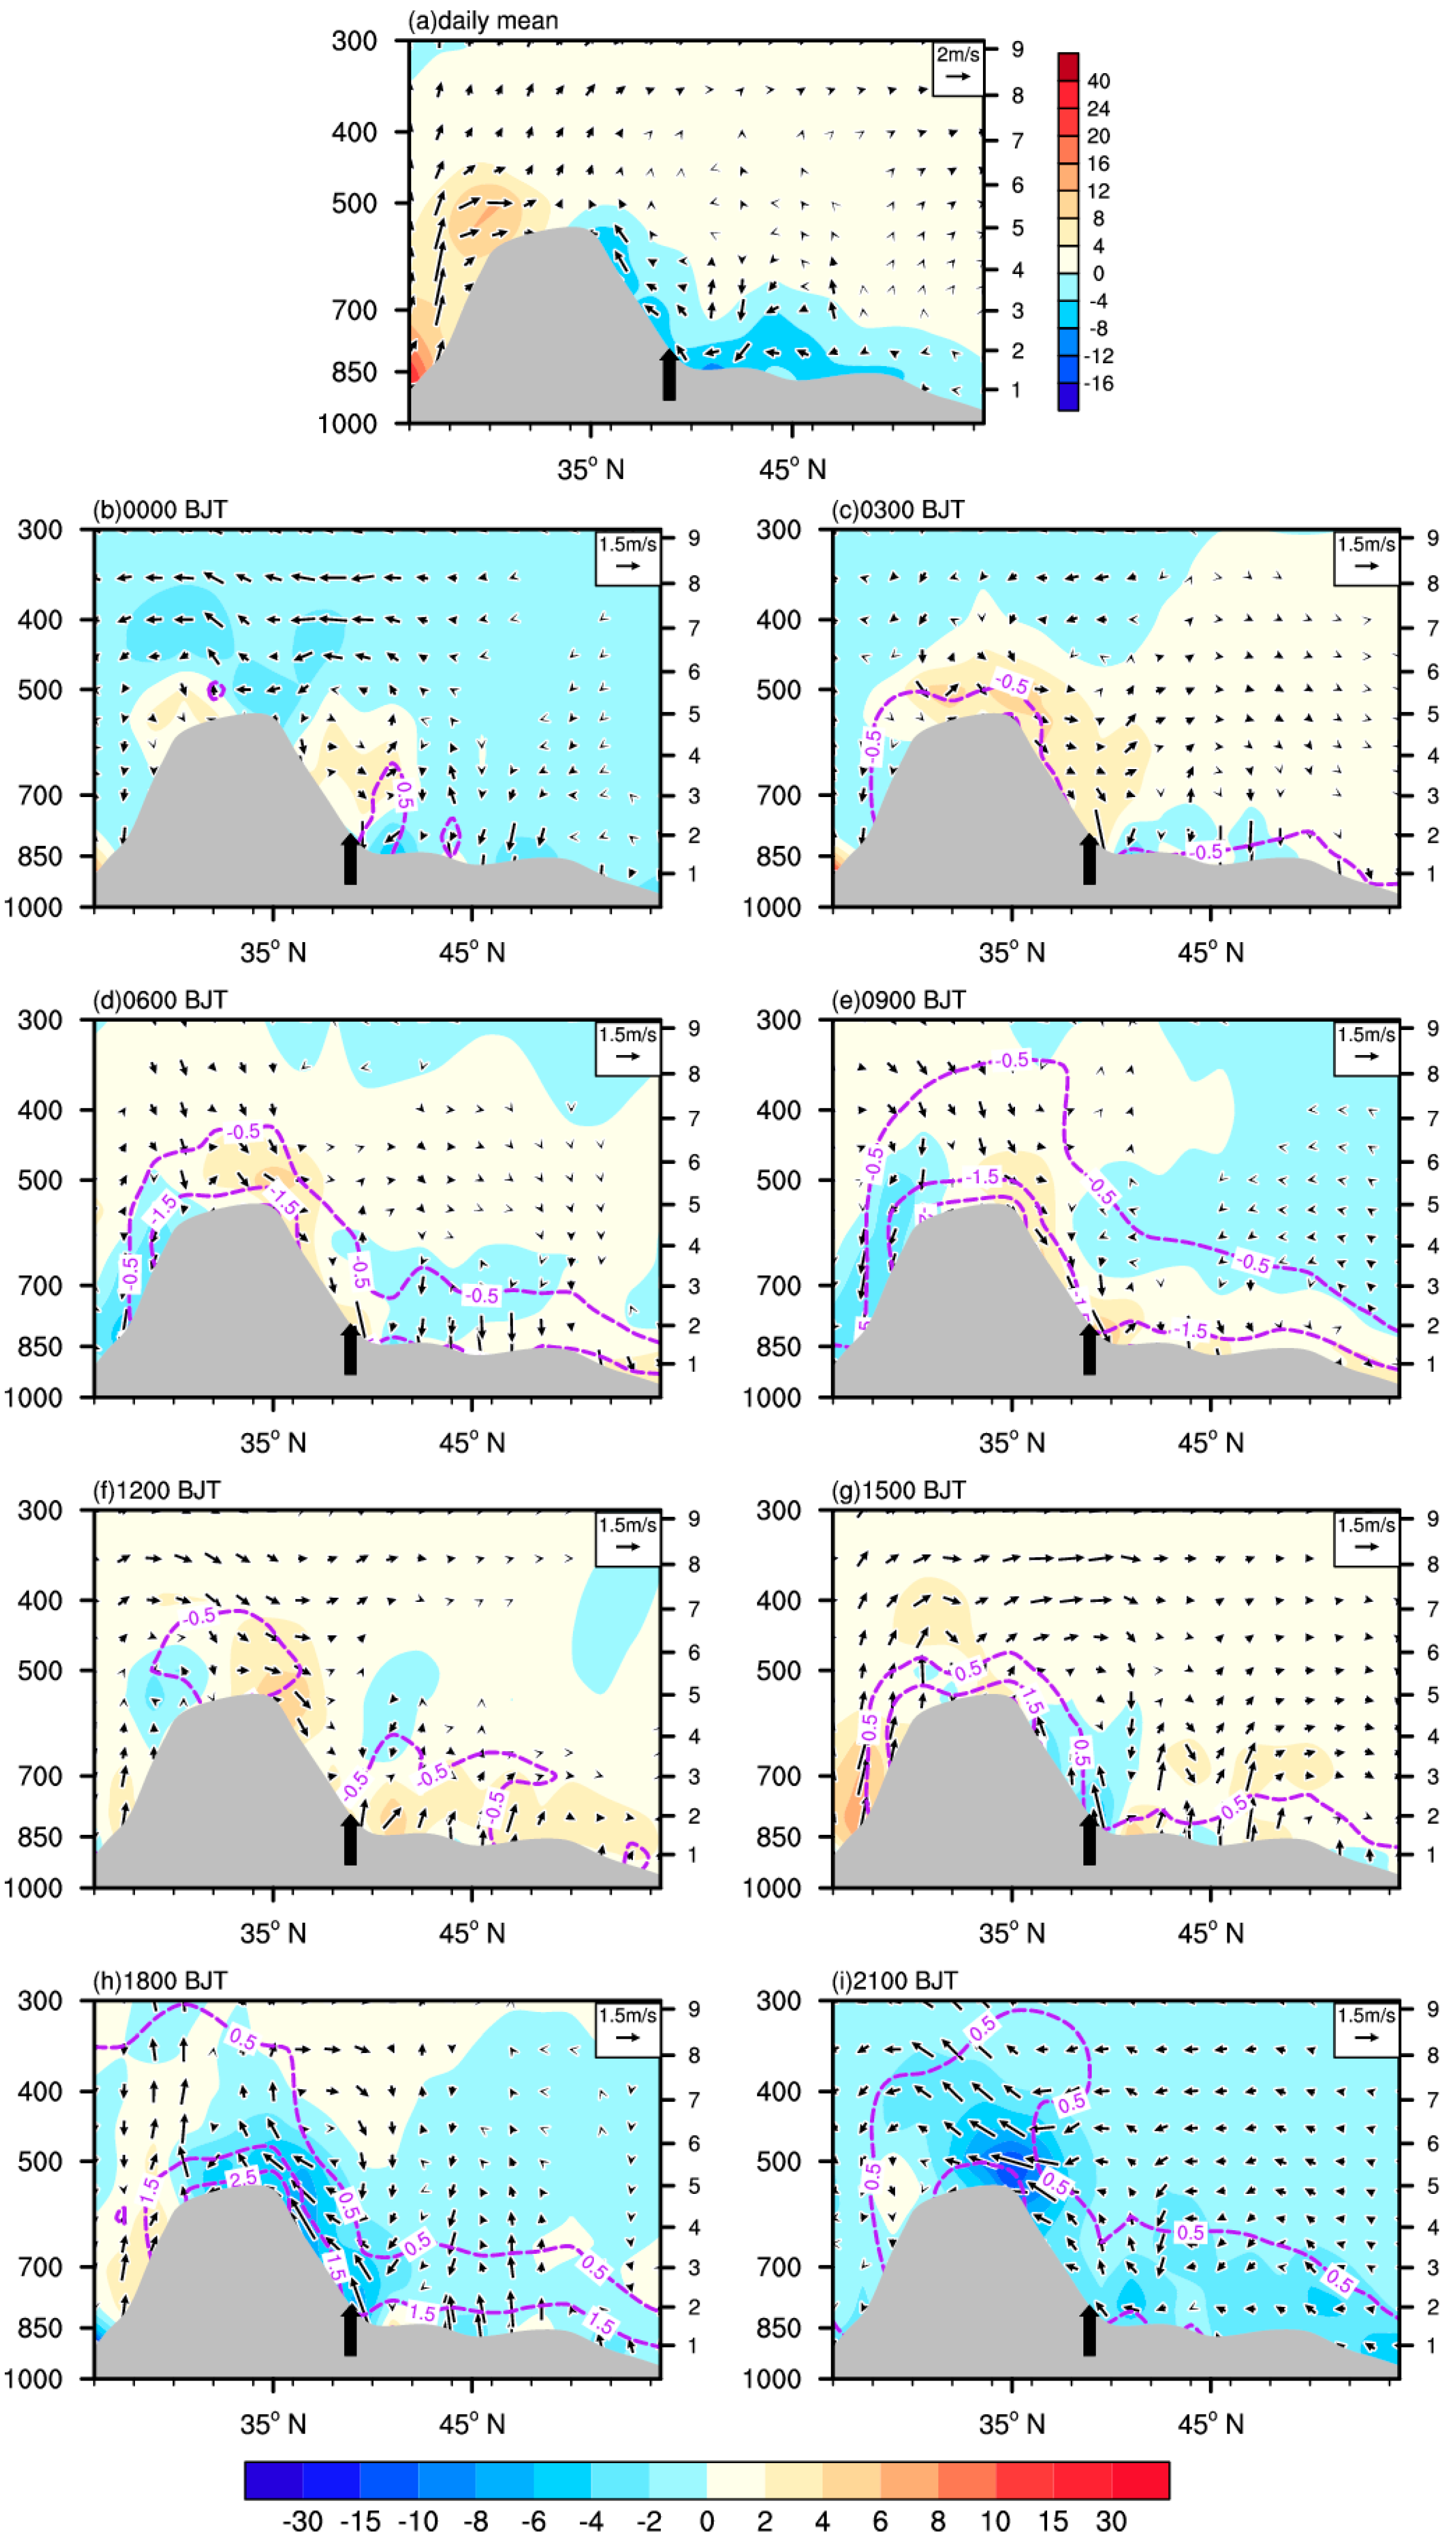
Figure 8.
The longitude–height cross-sections of the zonal water vapor transport (shaded; unit: g kg−1 m s−1) and vertical circulation in summer (vectors; unit: m s−1; the omega has been multiplied by −20, unit: Pa s−1) along 26°–39° N. (a) is the daily mean; (b–i) are the diurnal deviations at 3 h intervals with the daily mean removed. Purple dashed contours denote temperature deviations (units: °C). The gray shaded areas represent the topography. The black upward arrows above the topography indicate the eastern boundary of the TP.

Figure 9.
(a) Diurnal cycle of the TP precipitation rate (units: mm h−1). (b) Lead−lag correlation coefficients between the time series of the TP Bt and that of the TP precipitation rate. Red and blue lines in (a) denote the GPM and CMORPH precipitation rates and those in (b) represent the correlation coefficients of the TP Bt with the GPM and CMORPH precipitation rate, respectively.

Disclaimer/Publisher’s Note: The statements, opinions and data contained in all publications are solely those of the individual author(s) and contributor(s) and not of MDPI and/or the editor(s). MDPI and/or the editor(s) disclaim responsibility for any injury to people or property resulting from any ideas, methods, instructions or products referred to in the content. |
© 2023 by the authors. Licensee MDPI, Basel, Switzerland. This article is an open access article distributed under the terms and conditions of the Creative Commons Attribution (CC BY) license (https://creativecommons.org/licenses/by/4.0/).
Share and Cite
MDPI and ACS Style
Wang, H.; Zhao, P. Diurnal Characteristics in Summer Water Vapor Budget and Transport over the Tibetan Plateau. Atmosphere 2023, 14, 322. https://doi.org/10.3390/atmos14020322
AMA Style
Wang H, Zhao P. Diurnal Characteristics in Summer Water Vapor Budget and Transport over the Tibetan Plateau. Atmosphere. 2023; 14(2):322. https://doi.org/10.3390/atmos14020322
Chicago/Turabian StyleWang, Huimei, and Ping Zhao. 2023. "Diurnal Characteristics in Summer Water Vapor Budget and Transport over the Tibetan Plateau" Atmosphere 14, no. 2: 322. https://doi.org/10.3390/atmos14020322
Note that from the first issue of 2016, this journal uses article numbers instead of page numbers. See further details here.