
Numerical Simulation of Heat Transfer of Porous Rock Layers in Cold Sandy Regions
by
 ,
,
Kaichi Qiu
1 ,
,
Yong Huang
2,3,
Fenglei Han
1,2,*,
Qiuju Yang
2,
Wenbing Yu
1,
Lu Cheng
1 and
Hang Cao
1 1
College of Civil Engineering, Chongqing Jiaotong University, Chongqing 400074, China
2
Xinjiang Communication Construction Group Co., Ltd., Urumqi 830000, China
3
State Key Laboratory of Chemistry and Utilization of Carbon Based Energy Resources, Xinjiang University, Urumqi 830000, China
*
Author to whom correspondence should be addressed.
Atmosphere 2023, 14(12), 1812; https://doi.org/10.3390/atmos14121812
Submission received: 25 October 2023
/
Revised: 7 December 2023
/
Accepted: 9 December 2023
/
Published: 11 December 2023
(This article belongs to the Special Issue Research about Permafrost–Atmosphere Interactions)
Abstract
:The heat transfer characteristics of porous rock layers (PRLs) have significant seasonal differences. This feature has been used to protect the permafrost subgrade under highways and railways from degeneration. However, in cold sandy environments, the transformation law of heat transfer characteristics of PRLs on account of climate warming and aeolian sand filling needs to be solved. This work developed a coupled heat transfer model for the soil–PRL system aimed at analyzing the convective heat transfer process and mechanism of a closed PRL. Furthermore, the impact of climate warming and sand filling on the cooling performance of the PRL under different mean annual air temperatures (MAATs) of −3.5, −4.5, and −5.5 °C was quantified. The numerical results indicated that the natural convection of the closed PRL occurred only in winter, and the effective convective height of the rock layer decreased with the sand-filling thickness. As the thickness of sand filling increased, the critical temperature difference for the occurrence of natural convection increased, accompanied by decreases in the Rayleigh number, the duration, and intensity of natural convection. When the sand-filling thickness exceeded 80 cm, natural convection would not occur in the PRL. Under a warming scenario of 0.052 °C·a−1, the cooling performance of the PRL could offset the adverse impact of climate warming and raise the permafrost table in the first 20 years. Moreover, the closed PRL can be more effective in permafrost regions with colder MAATs. For cold sandy permafrost zones, sand-control measures should be taken to maintain the long-term cooling performance of the PRL. This study is of great significance in guiding porous rock embankment design and road maintenance along the Qinghai–Tibetan Railway.
1. Introduction
Climate warming has led to the warming and thawing of permafrost at a global scale [1,2]. To alleviate the road settlement caused by permafrost degradation, a PRL, which has excellent and stable heat transfer performance, is widely used to maintain the thermal stability of road embankments in cold regions, such as along the Qinghai–Tibet Railway (QTR) in China, Baikal–Amur Railway in Russia, Inuvik–Tuktoyaktuk and Yukon Highway in northern Canada, and Taylor Highway in Alaska, USA [3,4,5,6,7]. However, climate change and frequent human activities have led to serious degradation and desertification of the grassland on the Qinghai–Tibet Plateau (QTP) [8]. Strong wind conditions result in large amounts of sandy material deposition on the natural surface, ranging in thickness from a few centimeters to several meters [9]. The construction of transportation infrastructure has altered the conditions of flow, transportation, and accumulation of near-surface aeolian sand. The embankment is buried due to the accumulation of aeolian sand [10]. Further investigation reveals that there are approximately 450 km of hazardous sand sections in the Golmud–Lhasa section of the QTR, accounting for 25% of the entire section (Figure 1). Therefore, whether the PRL structure can maintain good heat-transfer performance even after being clogged by aeolian sand has always been a concern for engineers.
The PRL structure has excellent air convection and “thermal semiconductor” characteristics and has become the mainstream technology for maintaining the thermal stability of embankments in the permafrost zone of the QTP [3,7,11]. In recent years, the heat transfer mechanism of PRLs has undergone comprehensive exploration using diverse technical methods, including field monitoring, laboratory model tests, and numerical simulations [12,13,14,15,16,17,18,19]. As a highly permeable porous medium, a PRL has the characteristics of large pores and high pore-space connectivity. In winter, air density gradients caused by temperature changes at the bottom and top of the PRL can trigger gravity-driven internal air circulation, with cooler air flowing down to the bottom of the rock layer. In summer, the direction of the air density gradient in the porous medium is stable, and the cooler air is trapped at the bottom of the rock layer, which acts as an effective thermal insulator owing to the low thermal conductivity of the air [20,21]. Although global warming has led to a rise in ground temperature, the PRL can still cool the subgrade below [22,23]. However, in the areas with severe sand damage, a thick layer of aeolian sand usually accumulates on the slope and toe of the embankment, which can quickly fill the voids in the PRL [24]. When the rough pores of the PRL are filled with aeolian sand, the connectivity of the high pore space is reduced, the thermal resistance of the variable equivalent thermal conductivity of the porous medium layer will cease to exist, and the convective heat transfer process is inhibited [25,26]. The completely clogged PRL mainly depends on the heat conduction between solid particles, which leads to a significant reduction in the cooling effect of the PRL. Understanding the effect of aeolian sand filling on the heat transfer performance of closed PRLs is an important but unresolved issue in permafrost engineering.
At present, there is a lack of scientific evidence to evaluate the impact of aeolian sand on convective heat transfer in PRLs. In this study, a two-dimensional finite-element model was used to simulate the impacts of climate warming and sand filling on the heat-transfer characteristics of a PRL and the thermal state of the underlying permafrost under different MAATs of −3.5, −4.5, and −5.5 °C. Our study aims to: (1) understand the heat transfer laws of a PRL in aeolian sand environments; (2) find out the necessary conditions under which a PRL can maintain subgrade stability under the dual effects of climate warming and aeolian sand; (3) provide a scientific basis for the evaluation of the long-term stability of a PRL applied to frozen-soil engineering in the aeolian sand environment of the QTP.
2. Physical and Numerical Model
2.1. Governing Equations
In addressing permafrost engineering problems, it is often assumed that the rock layer can be considered infinitely long in the longitudinal direction [16]. Therefore, the problem in this study can be reduced to a two-dimensional isotropic problem. Due to the different heat-transfer characteristics of different media, the model can be divided into porous media and soil layer zones. Based on the thermodynamic theories [27], air convection heat transfer within the PRL, coupled heat transfer for the PRL–soil system, and heat conduction and ice–water phase change in the soil layer are considered in the two-dimensional model. The sensible heat capacity method solves the phase-change problem in the soil layer.
2.1.1. Porous Media Zone
The PRL can be regarded as a high-permeability porous media zone with an unsteady non-isothermal percolation mode of thermal convection. The following two-dimensional differential equations describe the continuity, momentum, and energy transport in the study zones [27].
Continuity:
where vx and vy are the velocity components of air (m·s−1) in the directions x and y.
Momentum:
where , μ is the kinematic viscosity of the air, ρ is the air density, P is the air pressure, k is the permeability of the porous medium, B is the Beta factor for non-Darcy flow (i.e., inertial resistance coefficient), and is the inertial loss term.
The k and B in the PRL are calculated using the following equations:
where dp is the effective average particle size of the medium, φ is the porosity of the medium, and α is a parameter related to the shape characteristics of the medium.
Since air is incompressible, its density is a function of temperature and follows the Boussinesq approximation [21]:
where β is the thermal expansion coefficient of air, and ρ0 and T0 are reference values for the density and temperature.
Energy:
where C* and λ* are the specific heat capacity and thermal conductivity.
Because the heat transfer between the PRL and soil is an unsteady process of phase change, according to the sensible heat capacity method, it is assumed that the phase change in each zone occurs within the temperature range of Tm ± ΔT. The C* and λ* are given as [28]:
where Cf and Cu are the volumetric heat capacity of frozen and unfrozen states, respectively; λf and λu are the thermal conductivity of frozen and unfrozen states, respectively; L is the latent heat per unit volume.
2.1.2. Soil Layer Zone
Considering only the heat conduction of the soil skeleton and medium water as well as the phase change, and neglecting the thermal dissipation during the evaporation of the moisture in soil, the heat-transfer governing equation can be simplified to the following form:
Since the PRL is in a closed state, each boundary is impermeable and can be regarded as a fixed boundary, the conditions are:
The initial conditions are given as:
where q, B, and n are the heat flux, solid boundary, and normal vector of each fixed boundary, respectively.
2.2. Physical Model and Parameters
The physical domain chosen in this computational model consisted of a coarse rock layer with a grain size of 15 cm, aeolian sand, 2.5 m thick gravel soil, and 27 m thick strongly weathered mudstone. A 10 cm thick thermal insulation board was installed on both sides of the PRL to ensure insulation boundary conditions. The geometric dimension of the PRL was 1.5 m × 1.5 m × 1.5 m, corresponding to the field test. The strata were the same as those at the field test site [13]. The porosity of the PRL was set to 0.4, and the corresponding permeability and inertial resistance factor were 1.58 × 10⁻⁶ m2 and 840.32 m−1. The geometric model is shown in Figure 2. Parts I to IV were the aeolian sand-filling PRL, PRL, gravelly soil, and strongly weathered mudstone, respectively.
The thermal conductivity of the sand-filling PRL is one of the important parameters in the temperature field calculation, which determines the rapidity of heat transfer between the ground and air and the change in ground temperature. At present, researchers have proposed many prediction models for the effective thermal conductivity of geotechnical materials based on mathematical and numerical modeling [31]. The heat in the sand-filling PRL is transferred between solids (aeolian sand and rocks), pore water, and air, respectively. In this study, the thermal conductivity of the sand-filling PRL was calculated using a simplified model of aeolian sand developed by Lu et al. (2018) [32]. The model gives a result between the upper limit obtained using the parallel flow model and the lower limit obtained using the tandem flow model.
In the unfrozen state:
In the frozen state, assuming that the volume fraction of unfrozen water is zero, namely:
where λs, λw, λi, and λa are the thermal conductivity of solid particles (aeolian sand and rock), water, ice, and air, respectively; A and φ are empirical parameters; xs, xw, xi, and xa denote the volume fraction of solid particles, water, ice, and air, respectively, obtained from Equation (15).
where ρd, ρs, and ρw are the density of dry sands, solid particles, and water.
According to the calculation results, Table 1 summarizes the thermophysical parameters of each medium in the model. The study site is located at an altitude of 4500 m on the QTP, and the physical parameters of the air are shown in Table 2. The water content of the aeolian sand in the model was set to 3% based on field tests and laboratory experiments [33]. There was no difference in the heat-transfer characteristics of the rock layer and insulation board in the frozen and unfrozen states; thus, the latent heat of freezing of these layers was also approximately zero.
2.3. Temperature Boundary Condition
To represent the thermal interaction between the atmosphere and the ground, the N-factor method was used to determine the empirical relation between the atmosphere and the ground surface [35]. This empirical surrogate has been widely adopted to obtain temperatures for different ground surface conditions such as concrete, asphalt pavements, gravel surfaces (embankment slopes, shoulders), seasonal snow-cover, and vegetation coverage [36]. A specified time-varying temperature boundary condition was set at the top surface of the PRL model. The temperature boundary conditions of the computational model were set as follows under the scenarios of MAATs of −3.5, −4.5, and −5.5 °C.
The natural ground surface (boundaries AB and CD) is expressed as:
The sand-filling PRL surface (boundary BC) is expressed as:
where Ta is the MAAT (°C).
As in some previous studies, climate warming is considered as the mean annual warming rate. The temperature boundary conditions of the numerical model calibration are available in reference [13], which is based on field observation data near the Hongliang River on the Tibetan plateau. The atmospheric warming due to climate change is represented by a linear growth rate of 0.052 °C/a [24]. In addition, as there is no horizontal heat transfer in a semi-infinite body, the adiabatic boundary conditions are applied on lateral boundaries (AEG and DFH). A geothermal flux at the bottom boundary (GH) was applied as 0.04 W/m2.
2.4. Modeling Sequence and Calculation Cases
The numerical simulation was divided into two stages. In the first stage, the model used the natural ground surface temperature to generate a quasi-dynamic equilibrium of the subgrade. The initial value of each node of the natural ground was −1.5 °C. The output of the first stage was used as the initial temperature distribution for the second stage. In the second stage, the PRL area was manually activated after reaching the equilibrium state. The initial air temperature was set to the average temperature in summer considering that construction activities always occur in summer. Numerical simulations of the heat transfer of the closed PRL were performed over a simulation period of 50 years after the completion of the PRL for the MAAT scenarios of −3.5, −4.5, and −5.5 °C, respectively, subject to climate warming and sand filling. We selected 8 h as the time step. The time was accounted at the beginning of the second stage. To assess the effect of sand filling on the heat transfer of the PRL, five sand-filling thicknesses were chosen, 0, 20, 50, 80, and 120 cm. Furthermore, an additional case was executed to simulate the cooling effect of sand filling on the PRL in an un-warmed climate (Case 4). During the simulation period, the sand-filling layer was activated in the first year. The simulation cases are given in Table 3. The temperature data were recorded for each time compensation and used to generate the following simulation results.
3. Results
3.1. Modeling Validation
The computational model used in this study was calibrated and validated based on the existing field test results [13]. The field test area was selected near the QTR in the Hongliang River area of the QTP, which was heavily desertified. The PRL dimensions of the field test were consistent with those of the numerical model, and the sand-filling thickness was 50 cm. A thermistor was used to monitor the ground temperature, and the data were collected once a day.
Based on the numerical simulation results, the temperature and Rayleigh (Ra) number of the PRL during the period from June 2013 to June 2015 were calculated and compared with the monitoring data, as shown in Figure 3. The numerical model accurately simulated the thermal conductivity and convective heat transfer in a closed PRL for both sand-free (0 cm) and sand-filling of 50 cm cases. In addition, the monitoring results show that the convective heat transfer of the closed PRL only occurred in winter and the intensity of convection peaked in January, when the air temperature was at its lowest over the whole year.
3.2. Natural Convection Characteristics in the Closed PRL
A PRL is recognized as a porous medium material with high permeability. The Ra is an important index that determines the intensity of natural convection and pore air flow in porous media [22]. When the following conditions are met, natural convection will occur in the PRL under the closed top:
where C, β, and v are the volumetric heat capacity, thermal expansion factor, and kinematic viscosity, respectively; g is the gravitational acceleration; K is the medium permeability; H is the PRL thickness; ΔT is the temperature difference between the bottom and top of the PRL; and λ is the thermal conductivity of the medium. Particularly, the criterion for natural convection to occur in the PRL is Ra > 4π2 [16].
3.2.1. Impact of Sand Filling on the Convection Characteristics of the PRL
To assess the impacts of sand filling on the cooling performance of closed PRLs, five cases (0, 20, 50, 80, and 120 cm) were carried out for study under the scenario of a MAAT of −3.5 °C. Figure 4a shows the time-varying ΔT of the closed PRL under the different sand-filling cases. The ΔT varies sinusoidally with time for each condition. The amplitude of ΔT fluctuations remained essentially unchanged over time. However, the mean annual ΔT decreases gradually with the increase in sand-filling thickness. In the first year of operation, the difference between the mean annual ΔT with 0 cm and 120 cm thick sand layers was 1.38 °C, and this difference gradually increased with the operation time.
According to Equation (18), the ΔT of the PRL determines the magnitude of the Ra number. When the ΔT of the PRL is negative, the Ra number tends to zero; conversely, when the ΔT is positive, the Ra number is positive. The corresponding temperature difference is the critical temperature difference (ΔTac) when Rac = 4π2. When Ra > 4π2, the Ra number gradually increases with the increase in the ΔT, and strong natural convection occurs inside the PRL, which enhances the convective heat transfer capacity of the bottom and top. Figure 4b presents the variation in the Ra number with time for different sand-filling cases. Without considering climate warming, the amplitude of the Ra number remained essentially constant with the increase in the operation time, but gradually decreased with the increase in the sand-filling thickness in PRLs. This is because the increase in the sand-filling thickness resulted in a decrease in the effective height of the porous media layer, forcing the ΔT of the PRL to decrease gradually, thereby increasing the difficulty of natural convection. In operation to the 10th year, the maximum values of the Ra number corresponding to the five cases were 123.38, 98.56, 68.52, 43.32, and 11.54, respectively. It can be seen that the Ra number gradually decreases with the increase in the thickness of the sand filling. Under the condition of the sand-filling thickness of 80 cm, only weak natural convection occurred within the closed PRL. When the sand-filling thickness exceeded 80 cm, the predicted Ra number was less than 4π2, and convection would not occur under this case.
In addition, the ΔTac and duration of natural convection were also different under each sand-filling case. Table 4 summarizes the ΔTac, natural convection period, and maximum Ra number of the four cases under different periods. The simulation results showed that the natural convection in the closed PRL was the strongest in cold seasons, which was consistent with the field monitoring results. Furthermore, the occurrence and end of natural convection were gradually delayed and advanced with the deepening of the sand thickness. In the sand-free case, the predicted duration of natural convection was usually approximately 120 days. When the sand-filling thickness increased to 80 cm, the natural convection duration decreased by approximately 75%, which was approximately 30 days on average.
The velocity and direction of the air within the PRL can reflect its convective magnitude as well as a cooling effect. Research has confirmed that the direction of air movement inside the closed PRL is upward in the middle and downward on both sides, forming two vortices on the left and right [37]. This is conducive to the dissipation of heat from the interior of the PRL and the introduction of cold energy from outside. In the cold season, the variation range of flow velocity within the PRL under the sand-filling 0, 20, 50, 80 and 120 cm cases was 1.56 × 10⁻⁴–2.63 × 10⁻³ m·s−1, 1.97 × 10⁻⁴–1.78 × 10⁻³ m·s−1, 8.47 × 10⁻⁵–7.56 × 10⁻⁴ m·s−1, 9.44 × 10⁻⁶–2.91 × 10⁻⁴ m·s−1, and 8.15 × 10⁻⁶–8.93 × 10⁻⁵ m·s−1, respectively. In the warm season, the variation range of flow velocity within the PRL was 6.14 × 10⁻⁶–1.73 × 10⁻⁴ m·s−1, 7.11 × 10⁻⁶–1.76 × 10⁻⁴ m·s−1, 3.54 × 10⁻⁶–1.43 × 10⁻⁴ m·s−1, 4.85 × 10⁻⁷–8.32 × 10⁻⁵ m·s−1, and 5.65 × 10⁻⁷–4.03 × 10⁻⁵ m·s−1, respectively. The simulation results showed that the air convection velocity within the PRL was larger in the cold season and smaller in the warm season, and thus the convective intensity was greater in the cold season than in the warm season. Meanwhile, driven by an unstable air density gradient attributed to the temperature difference between the top and bottom, the cooler air in the warm season was retained at the bottom of the PRL, which favored the lower underlying soil temperature. In addition, different sand-filling thicknesses influence the thermal state of the underlying permafrost by affecting the strength of air convection within the PRL. With the deepening of the sand-filling thicknesses, the air variation within the PRL decreased significantly, leading to a weakening of the natural convection strength and a reduction in the cooling performance.
3.2.2. Comprehensive Impact of Climate Warming and Sand Filling on the Convection Characteristics of the Closed PRL
To investigate the comprehensive impact of climate warming and sand filling on the convective heat transfer characteristics in the closed PRL, five case (0, 20, 50, 80, 120 cm) studies were carried out under three MAAT scenarios (MAAT = −3.5, −4.5, and −5.5 °C) at a warming rate of 0.052 °C per year. Figure 5 shows the variation in the Ra number over the 50-year simulation period under the three MAAT conditions affected by climate warming. It can be seen from the figure that the Ra number in each period was expected to gradually decrease as the sand-filling thickness increased. In the first year, the maximum Ra number corresponding to the three MAATs decreased by 81.32, 81.75, and 85.13, respectively, as the sand-filling thickness increased from 0 cm to 80 cm. Furthermore, the maximum Ra number also decreased gradually with the increase in the operation year. By the 50th year, the maximum Ra number for the three MAATs in the sand-free case decreased by 14%, 5.6%, and 2.9%, respectively. The maximum Ra number decreased by 11.1%, 4.8%, and 3.3% for the three MAATs in the 80 cm sand-filling case, respectively. The results show that the lower the MAAT, the smaller the decrease in the Ra number with the increase in operation years. Also, the mean annual ΔT exhibited similar variation trends with the Ra number. In the case of sand-free, the mean annual ΔT corresponding to the three MAATs decreased from −2.32 °C, −1.81 °C, and −2.24 °C in the 1st year to −3.01 °C, −2.73 °C, and −2.62 °C in the 50th year. Simultaneously, the amplitude of ΔT in each period also decreased slightly, sloping from 11.54 °C, 11.82 °C, and 11.12 °C in the first year to 9.36 °C, 11.26 °C, and 10.41 °C in the 50th year.
The duration of natural convection occurring in the PRL also changed dramatically due to the combined impacts of aeolian sand and climate warming. When the thickness of the sand filling was less than 50 cm, there was strong natural convection in the PRL throughout the simulation span. However, due to the impact of climate change, the duration of natural convection gradually decreased with the increase in clogging thickness and time of operation. Especially in the case of the sand-filling thickness reaching 80 cm, the Ra number gradually decreased over time, and the PRL finally lost its cooling effect when the Ra number was less than Rac. The prediction results indicated that the cooling effect of the closed PRL disappeared after the 30th and 40th years under scenarios with MAATs of −3.5 °C and −4.5 °C, respectively. In contrast, for a MAAT = −5.5 °C, although natural convection could still occur throughout the simulation period, the duration of natural convection per year was reduced from 27 days in the 1st year to 11 days in the 50th year. Furthermore, for the case of 120 cm sand-filling thickness under three MAATs, the ΔT was far less than the ΔTac that allowed natural convection to occur, and no natural convection occurred during the 50-year simulation period.
3.3. Permafrost Thermal Regime Beneath the PRL
3.3.1. Variation in the Permafrost Table
Figure 6, Figure 7 and Figure 8 show the changes in the permafrost table against time for two cases of sand-free and sand-filling of 80 cm in different MAAT scenarios. The predicted results showed that the permafrost table for both cases reflected a gradual downward trend against time due to the influence of climate warming and sand filling. In the first 20 years, the permafrost table beneath the PRL was higher than the initial permafrost table, which indicated that the PRL cooled the subgrade during this period and could weaken the degradation of permafrost caused by climate warming. Under the scenario of MAAT = −5.5 °C, in the case of sand-free, the permafrost table in the 10th year was 0.56 m higher than the initial permafrost table, with the artificial permafrost table entering the PRL. During the subsequent simulation period, the permafrost table gradually increased and continued to penetrate deep into the subgrade. By the 30th year of operation, the artificial permafrost table under both cases was already lower than the initial permafrost table, indicating that the cooling performance of rock layers could not resist the impact of climate warming on permafrost. Since then, the permafrost subgrade was in a continuous degradation state, and the difference between the artificial permafrost table and the natural permafrost table beneath the PRL gradually decreased due to climate warming. At a MAAT of −3.5 °C, the differences between the cases of sand-free and sand-filling thickness of 80 cm were 0.49 m and 0.33 m. At MAATs of −4.5 °C and −5.5 °C, the differences between both cases were 0.64 m and 0.41 m, and 0.76 m and 0.5 m, respectively. However, this difference will be further narrowed in the next 20 years. Between the 30th and the 50th year, for the case of sand-free, the reduction rates of the artificial permafrost table corresponding to the three MAATs were 0.049 m·a−1, 0.037 m·a−1, and 0.035 m·a−1, respectively. Under the case of 80 cm sand filling, the reduction rates of the artificial permafrost table were 0.042 m·a−1, 0.026 m·a−1, and 0.025 m·a−1, respectively. In addition, the permafrost table of the sand-free case was lesser than that of the sand-filling cases, indicating that sand filling has a negative impact on the cooling performance of the PRL. Overall, with the decrease in MAAT, the impact of aeolian sand accumulation on the permafrost table in the lower part of the PRL was weakened, the cooling performance of the PRL became significant, and the duration in which the artificial permafrost table was higher than the natural permafrost table was prolonged. Therefore, closed PRLs are more suitable for cooling reinforcement measures of the subgrade in permafrost regions with low temperatures to maximize the cooling performance of natural convective heat transfer.
3.3.2. Variation in Heat Flux of the Shallow Soil Layer Beneath the PRL
Implementing the PRL alters the heat exchange between the atmosphere and the subgrade, thus increasing the heat extraction of the underlying permafrost. To accurately estimate the cooling effect of the PRL on the thermal state of the soil layer, the heat fluxes at depths of 1.5 to 2.0 m beneath the PRL are estimated using Equation (19) according to heat transfer theory [12].
where λ is the thermal conductivity of the soil, Δz is the soil layer thickness, and T1.5 and T2.0 are the soil temperatures at the depths of 1.5 m and 2.0 m. The mean annual heat budget for the subgrade was obtained by integrating the heat flux over time. The thermal budget of the soil layer under different operating cases is shown in Figure 9.
The annual heat budget of the soil layer was mainly affected by the thickness of the sand filling. Under the three MAAT conditions, the annual heat budget was negative in the cases of sand-filling thicknesses of less than or equal to 50 cm, indicating that the soil layer was always in a release heat state, and the PRL still played a cooling effect during the operating period. However, the annual heat budget tended to increase gradually over time due to climate warming. In the MAAT of −3.5 °C scenario, the thickness of sand filling reached 80 cm, and the thermal budget turned from negative to positive, with the heat absorption gradually increasing with time. In the MAAT of −4.5 °C scenario, the underlying permafrost was exothermic in the first 10 years under the case of 80 cm sand-filling thickness, the heat budget became positive in the 20th year, and the heat budget increased during the subsequent operating time, reaching 439.43 kJ in the 50th year. In the MAAT of −5.5 °C scenario, due to the low MAAT, the exothermic state of the underlying permafrost in the 80 cm sand-filling case lasted longer, with the heat budget becoming positive after the 30th year. In addition, in the 120 cm sand-filling case, the heat budgets corresponding to the three MAATs were all positive, indicating that the active cooling performance of the PRL failed to play a role. Simultaneously, the continuous heat accumulation in the shallow layer inevitably leads to a temperature increase in the deep permafrost layer, which promotes the degradation of permafrost.
3.3.3. Thermal Changes in the Deep Soil
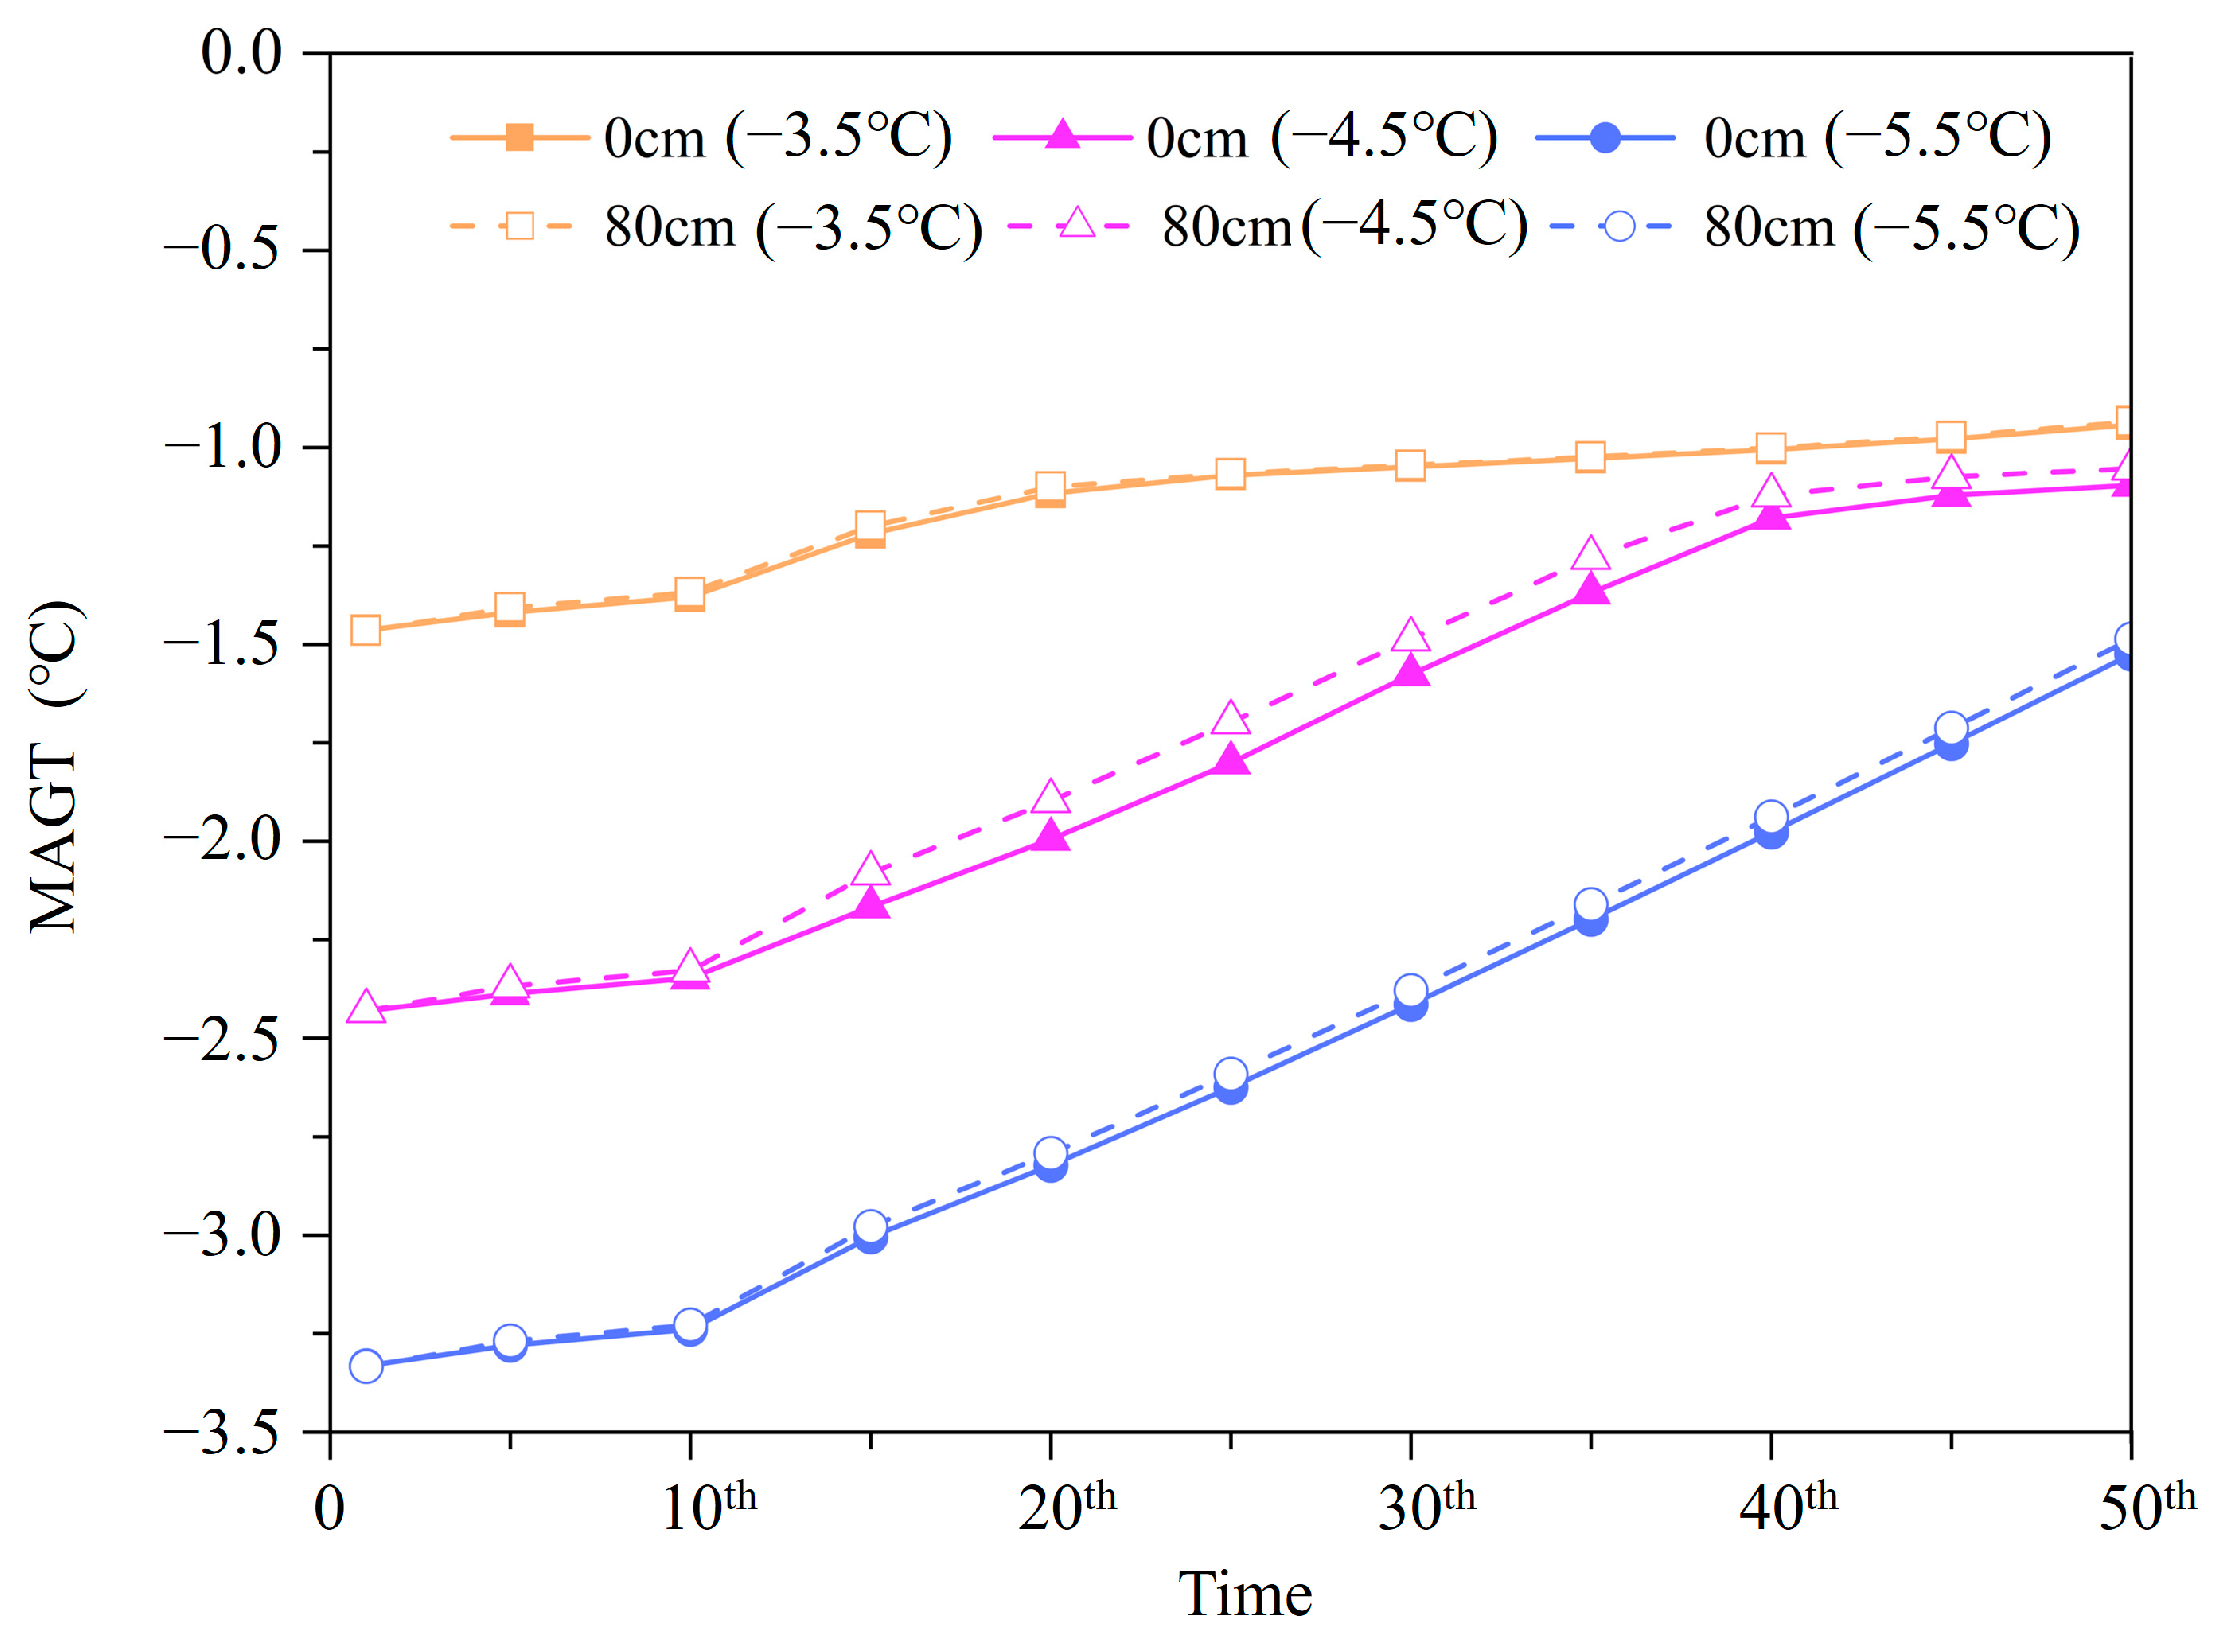
Figure 10 shows the mean annual ground temperature (MAGT) at a depth of 15 m beneath the centerline of the PRL over the simulation periods. Due to climate warming, the MAGT at 15 m for the three MAAT scenarios increased significantly with time. It should be noted that the MAGT of the deep layer with sand filling was higher than that in the sand-free case. After 30 years of operation, the temperature differences at 15 m in the two cases (sand-free and 80 cm sand filling) were 0.014 °C, 0.089 °C, and 0.036 °C, respectively. In addition, the cooling effect of the PRL in the first 10 years could weaken the permafrost warming caused by climate warming, and essentially maintained the thermal state of the deep permafrost beneath the PRL under the warming rate of 0.052 °C·a−1. In the first 10 years, the warming rates of MAGT for the two cases were only 0.013 °C·a−1 and 0.018 °C·a−1. During subsequent simulation periods, the MAGT at 15 m exhibited a more pronounced warming trend. From the 20th to 50th year, in the sand-free case, the corresponding temperature rise amplitudes of the three MAATs were 0.174 °C, 0.899 °C, and 1.298 °C, and with warming rates of 0.006 °C·a−1, 0.03 °C·a−1, and 0.043 °C·a−1, respectively. In the case of the sand-filling of 80 cm, the three MAAT scenarios had temperature rise amplitudes of 0.166 °C, 0.844 °C, and 1.306 °C, with warming rates of 0.005 °C·a−1, 0.028 °C·a−1, and 0.044 °C·a−1, respectively. Overall, the changes in deep ground temperature under the PRL were mainly affected by climate warming and MAAT, while the aeolian sand had an insignificant effect on the deep ground temperature.
4. Discussion
At present, the application of a PRL in the QTR encounters challenges attributed to climate warming and sand damage. In response to this issue, this paper evaluated the cooling performance of a closed PRL under a cold sandy environment based on convective heat-transfer characteristics, permafrost table, heat budget, and MAAT. The temperature boundary conditions of the model were determined based on measured data in the Hongliang River region of the QTP. Owing to the differences in the climatic conditions (warming rate, solar radiation, and rainfall) and geological conditions (vegetation coverage, soil type, MAGT, and ice content) in different regions, the laws of the adherent layer are also different [36,38,39,40]. Furthermore, the parameters of air in the PRL assumed in this study are constant, but they are moderately affected by changes in air pressure, temperature, and humidity. Therefore, they should be assigned different values at different MAGTs and altitudes. Meanwhile, most studies use a linear ground surface temperature increase rate to evaluate the effects of climate change induced temperature increase on permafrost warming and thawing [29,41]. Therefore, the predicted values of climate warming rates used in this study do not affect the regularity of the results.
This study has confirmed that climate warming, MAAT, and sand filling have a significant impact on the convective heat-transfer characteristics of the closed PRL. Engineering activities will disturb the original surface energy balance, and the construction of the PRL will raise the permafrost table to a certain extent. We found that the rate of change of the permafrost table beneath the closed PRL was different for three MAAT scenarios. With a decrease in MAAT, the effect of sand filling on the permafrost table beneath the PRL was weakened, the difference between the artificial permafrost table and natural permafrost table increased, and the cooling performance of the closed PRL became significant. Under the MAAT of −5.5 °C scenario, in the first 10 years of operation, the artificial permafrost table entered the rock layer (Figure 8). As indicated, a closed PRL is more suitable for cooling reinforcement measures of the subgrade in the low-temperature permafrost region to maximize the cooling performance of natural convection heat transfer. In addition, aeolian sand accumulation and clogging greatly alters the surface albedo, where the moisture content of the aeolian sand affects the amount of heat entering the subgrade. Field surveys show that the moisture content of aeolian sand varies from 0.1 to 15% in different areas of the QTP, and its thermal conductivity varies from 0.3 to 2.4 W·m−1·°C−1 [8,32]. The dry sand layer can play the role of heat insulation, hinder the heat transfer between the atmosphere and the subgrade, and promote the warming of the underlying permafrost. On the contrary, the high thermal conductivity of wet sand is conducive to more heat extraction in winter. This shows that the thermophysical properties of aeolian sand play an essential role in the thermal state of permafrost beneath the PRL. Therefore, it is necessary to establish a surface energy balance model and hydro-thermal coupling model to study the serviceability of a PRL with serious sand damage in future research.
5. Conclusions
A coupled heat transfer model for a soil–PRL system was developed. The heat transfer characteristics of PRLs in cold sandy environments were analyzed via numerical simulation and revealed the necessary conditions under which a PRL can maintain subgrade stability under the dual effects of climate warming and aeolian sand. The main conclusions are as follows.
- (1)
- The accuracy of the numerical model was verified using field tests. Natural convection within the closed PRL occurred only in cold seasons, and the convection strength was related to the effective convection height of the rock layer. As the thickness of sand filling increased, the Tac allowing natural convection to occur increased, and the Ra number decreased, which caused the weakening of the duration and intensity of natural convection.
- (2)
- Under a warming scenario of 0.052 °C·a−1, the cooling performance of a PRL can offset the adverse impacts of climate warming and raise the permafrost table during the first 20 years of operation. However, the cooling performance of the PRL diminishes with the increase in the operation year, and the underlying permafrost continues to degrade over the next several decades.
- (3)
- A closed PRL is more suitable for cooling measures of the subgrade in permafrost regions with colder MAATs. In the context of climate change and sand damage, the cooling effect of a PRL on the permafrost can no longer meet the long-term requirements.
Author Contributions
Conceptualization, K.Q., Y.H., F.H. and W.Y.; Methodology, K.Q., Y.H., F.H., Q.Y. and W.Y.; Software, K.Q. and F.H.; Formal analysis, K.Q., Y.H., Q.Y., W.Y., L.C. and H.C.; Investigation, Q.Y., W.Y. and H.C.; Writing—original draft, K.Q., Y.H., Q.Y. and L.C.; Writing—review & editing, K.Q., Y.H., F.H., W.Y. and H.C.; Visualization, K.Q., Q.Y., L.C. and H.C.; Supervision, Y.H., F.H. and W.Y.; Project administration, Y.H., F.H. and W.Y.; Funding acquisition, F.H. and W.Y. All authors have read and agreed to the published version of the manuscript.
Funding
This work was supported by the National Natural Science Foundation of China (42230512), the China Postdoctoral Science Foundation (2020M683710XB), the Cooperation Projects between universities in Chongqing and affiliated institutes of CAS (HZ2021009), and the Natural Science Foundation of Xizang (XZ202101ZR0036G).
Institutional Review Board Statement
Not applicable.
Informed Consent Statement
Not applicable.
Data Availability Statement
The data presented in this study are available on request from the corresponding author. The data are not publicly available due to this project is still in the research phase.
Acknowledgments
The authors would like to acknowledge the editor/reviewers for their critical reviews and constructive remarks which helped to improve the quality of the manuscript.
Conflicts of Interest
The authors declare no conflict of interest. Yong Huang, Fenglei Han and Qiuju Yang are employees of Xinjiang Communication Construction Group Co., Ltd. The paper reflects the views of the scientists, and not the company.
References
- Biskaborn, B.; Smith, S.; Noetzli, J. Permafrost is warming at a global scale. Nat. Commun. 2019, 10, 264. [Google Scholar] [CrossRef] [PubMed]
- Zhao, L.; Zou, D.; Hu, G.; Wu, T.; Du, E.; Liu, G.; Xiao, Y.; Li, R.; Pang, Q.; Qiao, Y.; et al. A synthesis dataset of permafrost thermal state for the Qinghai–Tibet (Xizang) Plateau, China. Earth Syst. Sci. Data 2021, 13, 4207–4218. [Google Scholar] [CrossRef]
- Cheng, G. A roadbed cooling approach for the construction of Qinghai–Tibet Railway. Cold Reg. Sci. Technol. 2005, 42, 169–176. [Google Scholar] [CrossRef]
- Malenfant-Lepage, J.; Doré, G.; Fortier, D.; Murchison, P. Thermal performance of the permafrost protection techniques at Beaver Creek experimental road site, Yukon, Canada. In Proceedings of the 10th International Conference on Permafrost, Salekhard, Russia, 25–29 June 2012; pp. 261–266. [Google Scholar]
- Dong, Y.; Pei, W.; Liu, G.; Jin, L.; Chen, D. In-situ experimental and numerical investigation on the cooling effect of a multi-lane embankment with combined crushed-rock interlayer and ventilated ducts in permafrost regions. Cold Reg. Sci. Technol. 2014, 104, 97–105. [Google Scholar] [CrossRef]
- Darrow, M.; Jensen, D. Modeling the performance of an air convection embankment (ACE) with thermal berm over ice-rich permafrost, Lost Chicken Creek, Alaska. Cold Reg. Sci. Technol. 2016, 130, 43–58. [Google Scholar] [CrossRef]
- Ma, Q.; Luo, X.; Gao, J.; Sun, W.; Li, Y.; Lan, T. Numerical evaluation for cooling performance of a composite measure on expressway embankment with shady and sunny slopes in permafrost regions. Energy 2022, 244, 123194. [Google Scholar] [CrossRef]
- Xie, S.; Qu, J.; Lai, Y.; Xu, X.; Pang, Y. Key evidence of the role of desertification in protecting the underlying permafrost in the Qinghai–Tibet Plateau. Sci. Rep. 2015, 5, 15152. [Google Scholar] [CrossRef]
- Xie, S.; Qu, J.; Zhang, K.; Mu, Y.; Xu, X.; Pang, Y.; Wang, T. Hydrothermal variation and its influence on the desertified ground surface of Qinghai–Tibet Plateau. Appl. Therm. Eng. 2018, 131, 201–208. [Google Scholar] [CrossRef]
- Lan, T.; Luo, X.; Ma, Q.; Jiang, W.; Xia, H. Desertification Caused by Embankment Construction in Permafrost Environment on the Qinghai-Tibetan Plateau. Arab. J. Sci. Eng. 2023, 48, 583–599. [Google Scholar] [CrossRef]
- Doré, G.; Niu, F.; Brooks, H. Adaptation methods for transportation infrastructure built on degrading permafrost. Permafr. Periglac. Process. 2016, 27, 352–364. [Google Scholar] [CrossRef]
- Luo, J.; Niu, F.; Liu, M.; Lin, Z.; Yin, G. Field experimental study on long-term cooling and deformation characteristics of crushed-rock revetment embankment at the Qinghai-Tibet Railway. Appl. Therm. Eng. 2018, 139, 256–263. [Google Scholar] [CrossRef]
- Han, F.; Yu, W.; Ma, L.; Yi, X.; Zhang, X. Heat transfer and cold energy capacity properties of crushed-rock layer in cold sandy regions. Int. J. Therm. Sci. 2023, 189, 108286. [Google Scholar] [CrossRef]
- Sun, B.; Yang, L.; Liu, Q.; Wang, W.; Xu, X. Experimental study on cooling enhancement of crushed rock layer with perforated ventilation pipe under air-tight top surface. Cold Reg. Sci. Technol. 2011, 68, 150–161. [Google Scholar] [CrossRef]
- Zhang, M.; Lai, Y.; Zhang, J.; Sun, Z. Numerical study on cooling characteristics of two-phase closed thermosyphon embankment in permafrost regions. Cold Reg. Sci. Technol. 2011, 65, 203–210. [Google Scholar] [CrossRef]
- Yu, W.; Liu, W.; Chen, L.; Yi, X.; Han, F.; Hu, D. Evaluation of cooling effects of crushed rock under sand-filling and climate warming scenarios on the Tibet Plateau. Appl. Therm. Eng. 2016, 92, 130–136. [Google Scholar] [CrossRef]
- Chen, L.; Lai, Y.; Fortier, D.; Harris, S. Impacts of snow cover on the pattern and velocity of air flow in air convection embankments of sub-Arctic regions. Renew. Energy 2022, 199, 1033–1046. [Google Scholar] [CrossRef]
- Yang, X.; Ji, Z.; Zhang, P.; Qi, J. Model test and numerical simulation on the development of artificially freezing wall in sandy layers considering water seepage. Transp. Geotech. 2019, 21, 100293. [Google Scholar] [CrossRef]
- Li, M.; Ma, Q.; Luo, X.; Jiang, H.; Li, Y. The coupled moisture-heat process of a water-conveyance tunnel constructed by artificial ground freezing method. Cold Reg. Sci. Technol. 2021, 182, 103197. [Google Scholar] [CrossRef]
- Wicky, J.; Hauck, C. Numerical modelling of convective heat transport by air flow in permafrost talus slopes. Cryosphere 2017, 11, 1311–1325. [Google Scholar] [CrossRef]
- Zhang, M.; Zhang, X.; Li, S.; Wu, D.; Pei, W.; Lai, Y. Evaluating the cooling performance of crushed-rock interlayer embankments with unperforated and perforated ventilation ducts in permafrost regions. Energy 2015, 93, 874–881. [Google Scholar] [CrossRef]
- Goering, D. Passively cooled railway embankments for use in permafrost areas. J. Cold Reg. Eng. 2003, 17, 119–133. [Google Scholar] [CrossRef]
- Wu, Q.; Lu, Z.; Zhang, T.; Ma, W. Analysis of cooling effect of crushed rock-based embankment of the Qinghai-Xizang Railway. Cold Reg. Sci. Technol. 2008, 53, 271–282. [Google Scholar] [CrossRef]
- Xie, S.; Qu, J.; Xu, X.; Pang, Y. Interactions between freeze–thaw actions, wind erosion desertification, and permafrost in the Qinghai–Tibet Plateau. Nat. Hazards. 2017, 85, 829–850. [Google Scholar] [CrossRef]
- Athith, T.; Trilok, G.; Jadhav, P.; Gnanasekaran, N. Heat transfer optimization using genetic algorithm and artificial neural network in a heat exchanger with partially filled different high porosity metal foam. Mater. Today Proc. 2022, 51, 1642–1648. [Google Scholar] [CrossRef]
- Jadhav, P.; Trilok, G.; Gnanasekaran, N.; Mobedi, M. Performance score based multi-objective optimization for thermal design of partially filled high porosity metal foam pipes under forced convection. Int. J. Heat Mass Tran. 2022, 182, 121911. [Google Scholar] [CrossRef]
- Zhang, M.; Lai, Y.; Niu, F.; He, S. A numerical model of the coupled heat transfer for duct-ventilated embankment under wind action in cold regions and its application. Cold Reg. Sci. Technol. 2006, 45, 103–113. [Google Scholar] [CrossRef]
- Li, S.; Zhan, H.; Lai, Y.; Sun, Z.; Pei, W. The coupled moisture-heat process of permafrost around a thermokarst pond in Qinghai-Tibet Plateau under global warming. J. Geophys. Res. Earth Surf. 2014, 119, 836–853. [Google Scholar] [CrossRef]
- Lai, Y.; Zhang, L.; Zhang, S.; Mi, L. Cooling effect of ripped-stone embankments on Qing-Tibet railway under climatic warming. Chin. Sci. Bull. 2003, 48, 598–604. [Google Scholar] [CrossRef]
- Tao, W.Q. Numerical Heat Transfer, 2nd ed.; Xi’an Jiaotong University Press: Xi’an, China, 2004; pp. 6–14. [Google Scholar]
- Ren, X.; Niu, F.; Yu, Q.; Yin, G. Research progress of soil thermal conductivity and its predictive models. Cold Reg. Sci. Technol. 2024, 217, 104027. [Google Scholar] [CrossRef]
- Lu, Y.; Yu, W.; Hu, D.; Liu, W. Experimental Study on the Thermal Conductivity of Aeolian Sand from the Tibetan Plateau. Cold Reg. Sci. Technol. 2018, 146, 1–8. [Google Scholar] [CrossRef]
- Wen, Z.; Ma, W.; Feng, W.; Deng, Y.; Wang, D.; Fan, Z.; Zhou, C. Experimental study on unfrozen water content and soil matric potential of Qinghai-Tibetan silty clay. Environ. Earth Sci. 2012, 66, 1467–1476. [Google Scholar] [CrossRef]
- Tsilingiris, P.T. Thermophysical and transport properties of humid air at temperature range between 0 and 100 °C. Energy Convers. Manag. 2008, 49, 1098–1110. [Google Scholar] [CrossRef]
- Lunardini, V. Theory of n-factors and correlation of data, Proceedings of the Third International Conference on Permafrost. Natl. Res. Counc. Can. Ott. 1978, 1, 40–46. [Google Scholar]
- Williams, T.; Pomeroy, J.; Janowicz, J.; Carey, S.; Rasouli, K.; Quinton, W. A radiative–conductive–convective approach to calculate thaw season ground surface temperatures for modelling frost table dynamics. Hydrol. Process. 2015, 29, 3954–3965. [Google Scholar] [CrossRef]
- Hou, Y.; Wu, Q.; Wang, K.; Ye, Z. Numerical evaluation for protecting and reinforcing effect of a new designed crushed rock revetment on Qinghaie–Tibet Railway. Renew. Energ. 2020, 156, 645–654. [Google Scholar] [CrossRef]
- Qin, D.; Ding, Y.; Wang, S. A study of environment change and its impacts in western China. Earth Sci. Front. 2002, 9, 321–328. [Google Scholar]
- Zhang, M.; Min, K.; Wu, Q.; Zhang, J.; Harbor, J. A new method to determine the upper boundary condition for a permafrost thermal model: An example from the Qinghai-Tibet Plateau. Permafr. Periglac. Process. 2012, 23, 301–311. [Google Scholar] [CrossRef]
- Hidalgo, A.; Tello, L. Modeling and Numerical Simulation of the Thermal Interaction between Vegetation Cover and Soil. Mathematics 2022, 10, 338. [Google Scholar] [CrossRef]
- Liu, C.; Chong, X.; Qi, C.; Yao, Z.; Wei, Y.; Zhang, J.; Li, Y. Numerical investigation of thermal parameter characteristics of the airfield runway adherent layer in permafrost region of Northeast China. Case Stud. Therm. Eng. 2022, 33, 101985. [Google Scholar] [CrossRef]
Figure 1.
Qinghai–Tibet Railway affected by aeolian sand.
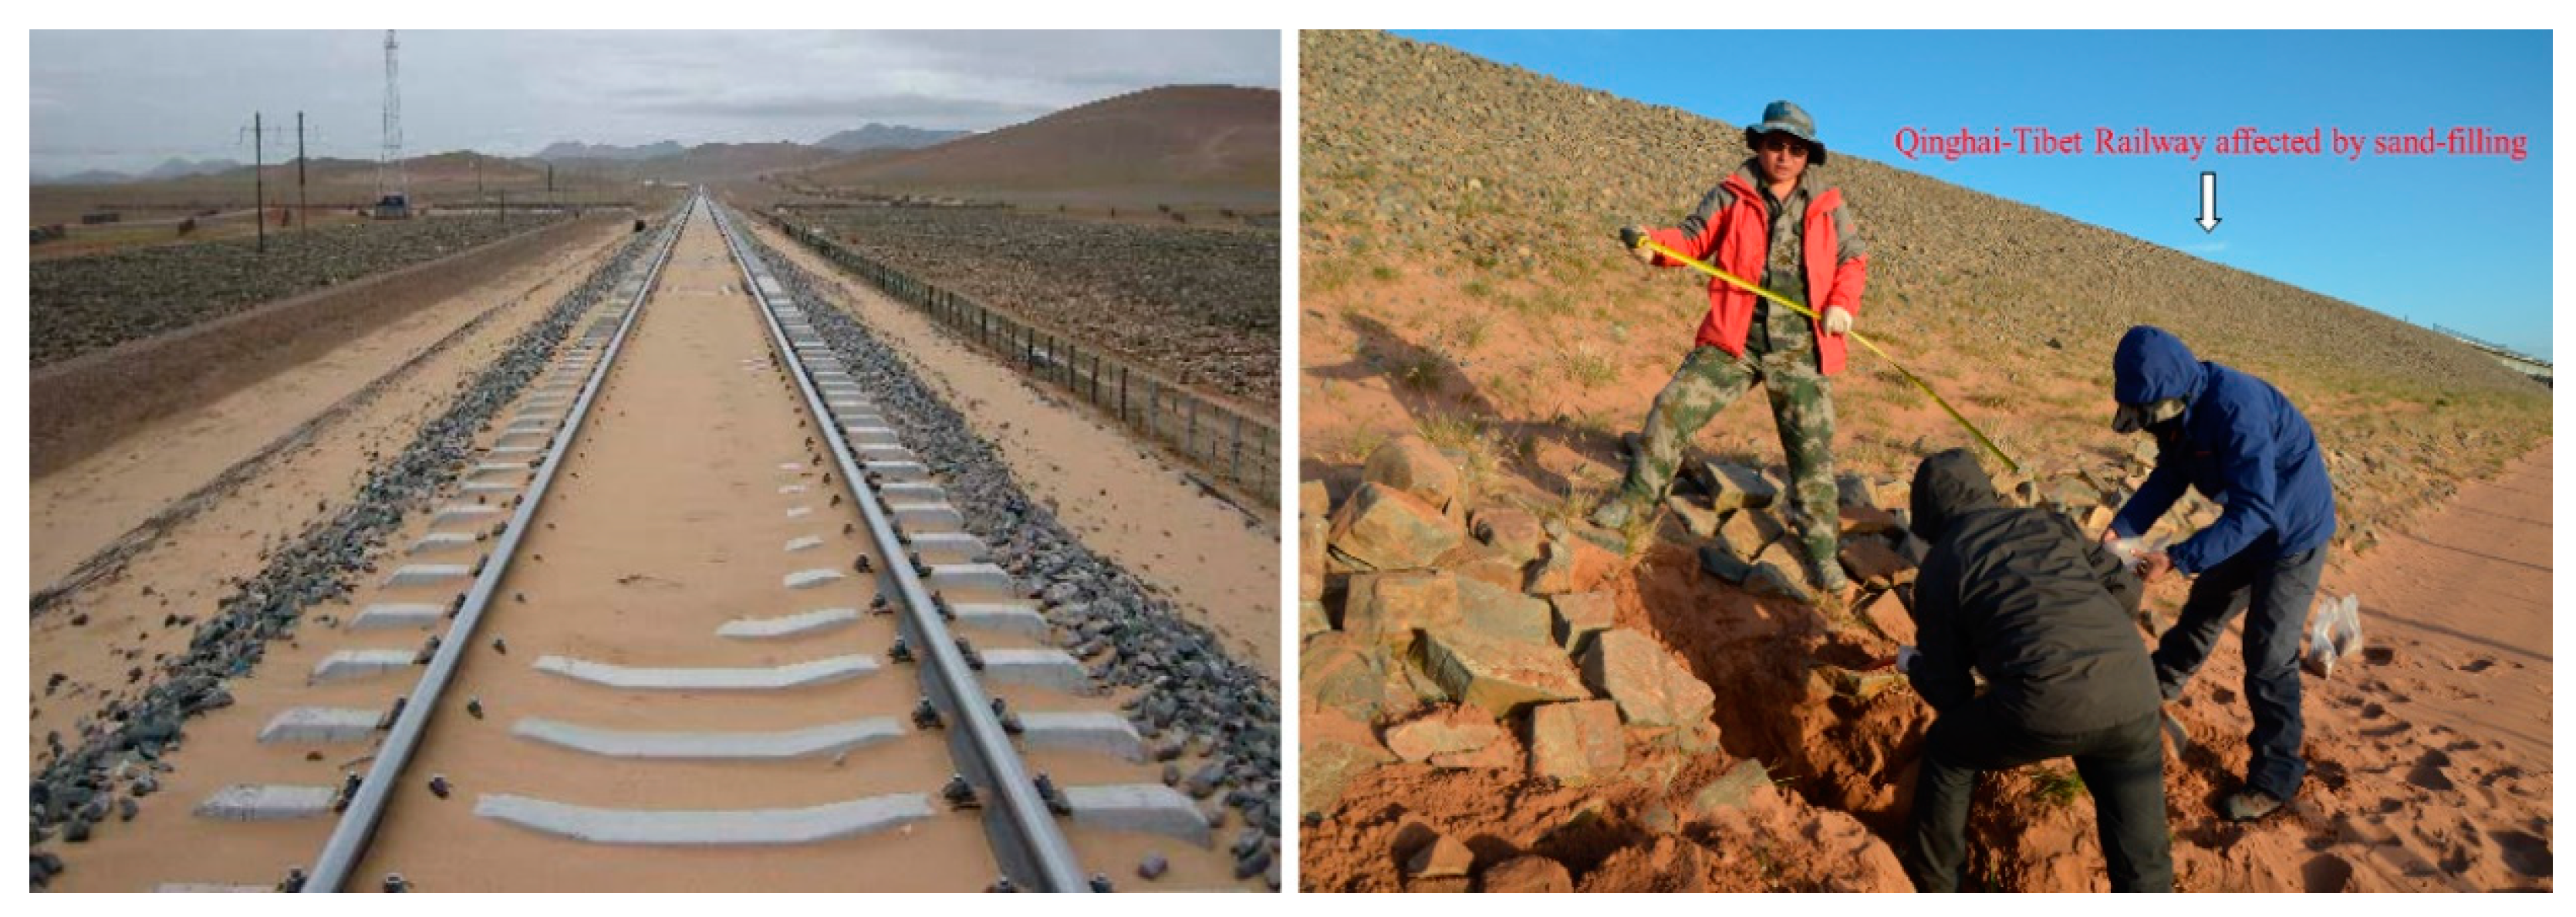
Figure 2.
Geometric model and strata used for the numerical modeling: I: Aeolian sand-filling PRL, II: PRL, III: Gravelly soil, IV: Strongly weathered mudstone.
Figure 2.
Geometric model and strata used for the numerical modeling: I: Aeolian sand-filling PRL, II: PRL, III: Gravelly soil, IV: Strongly weathered mudstone.
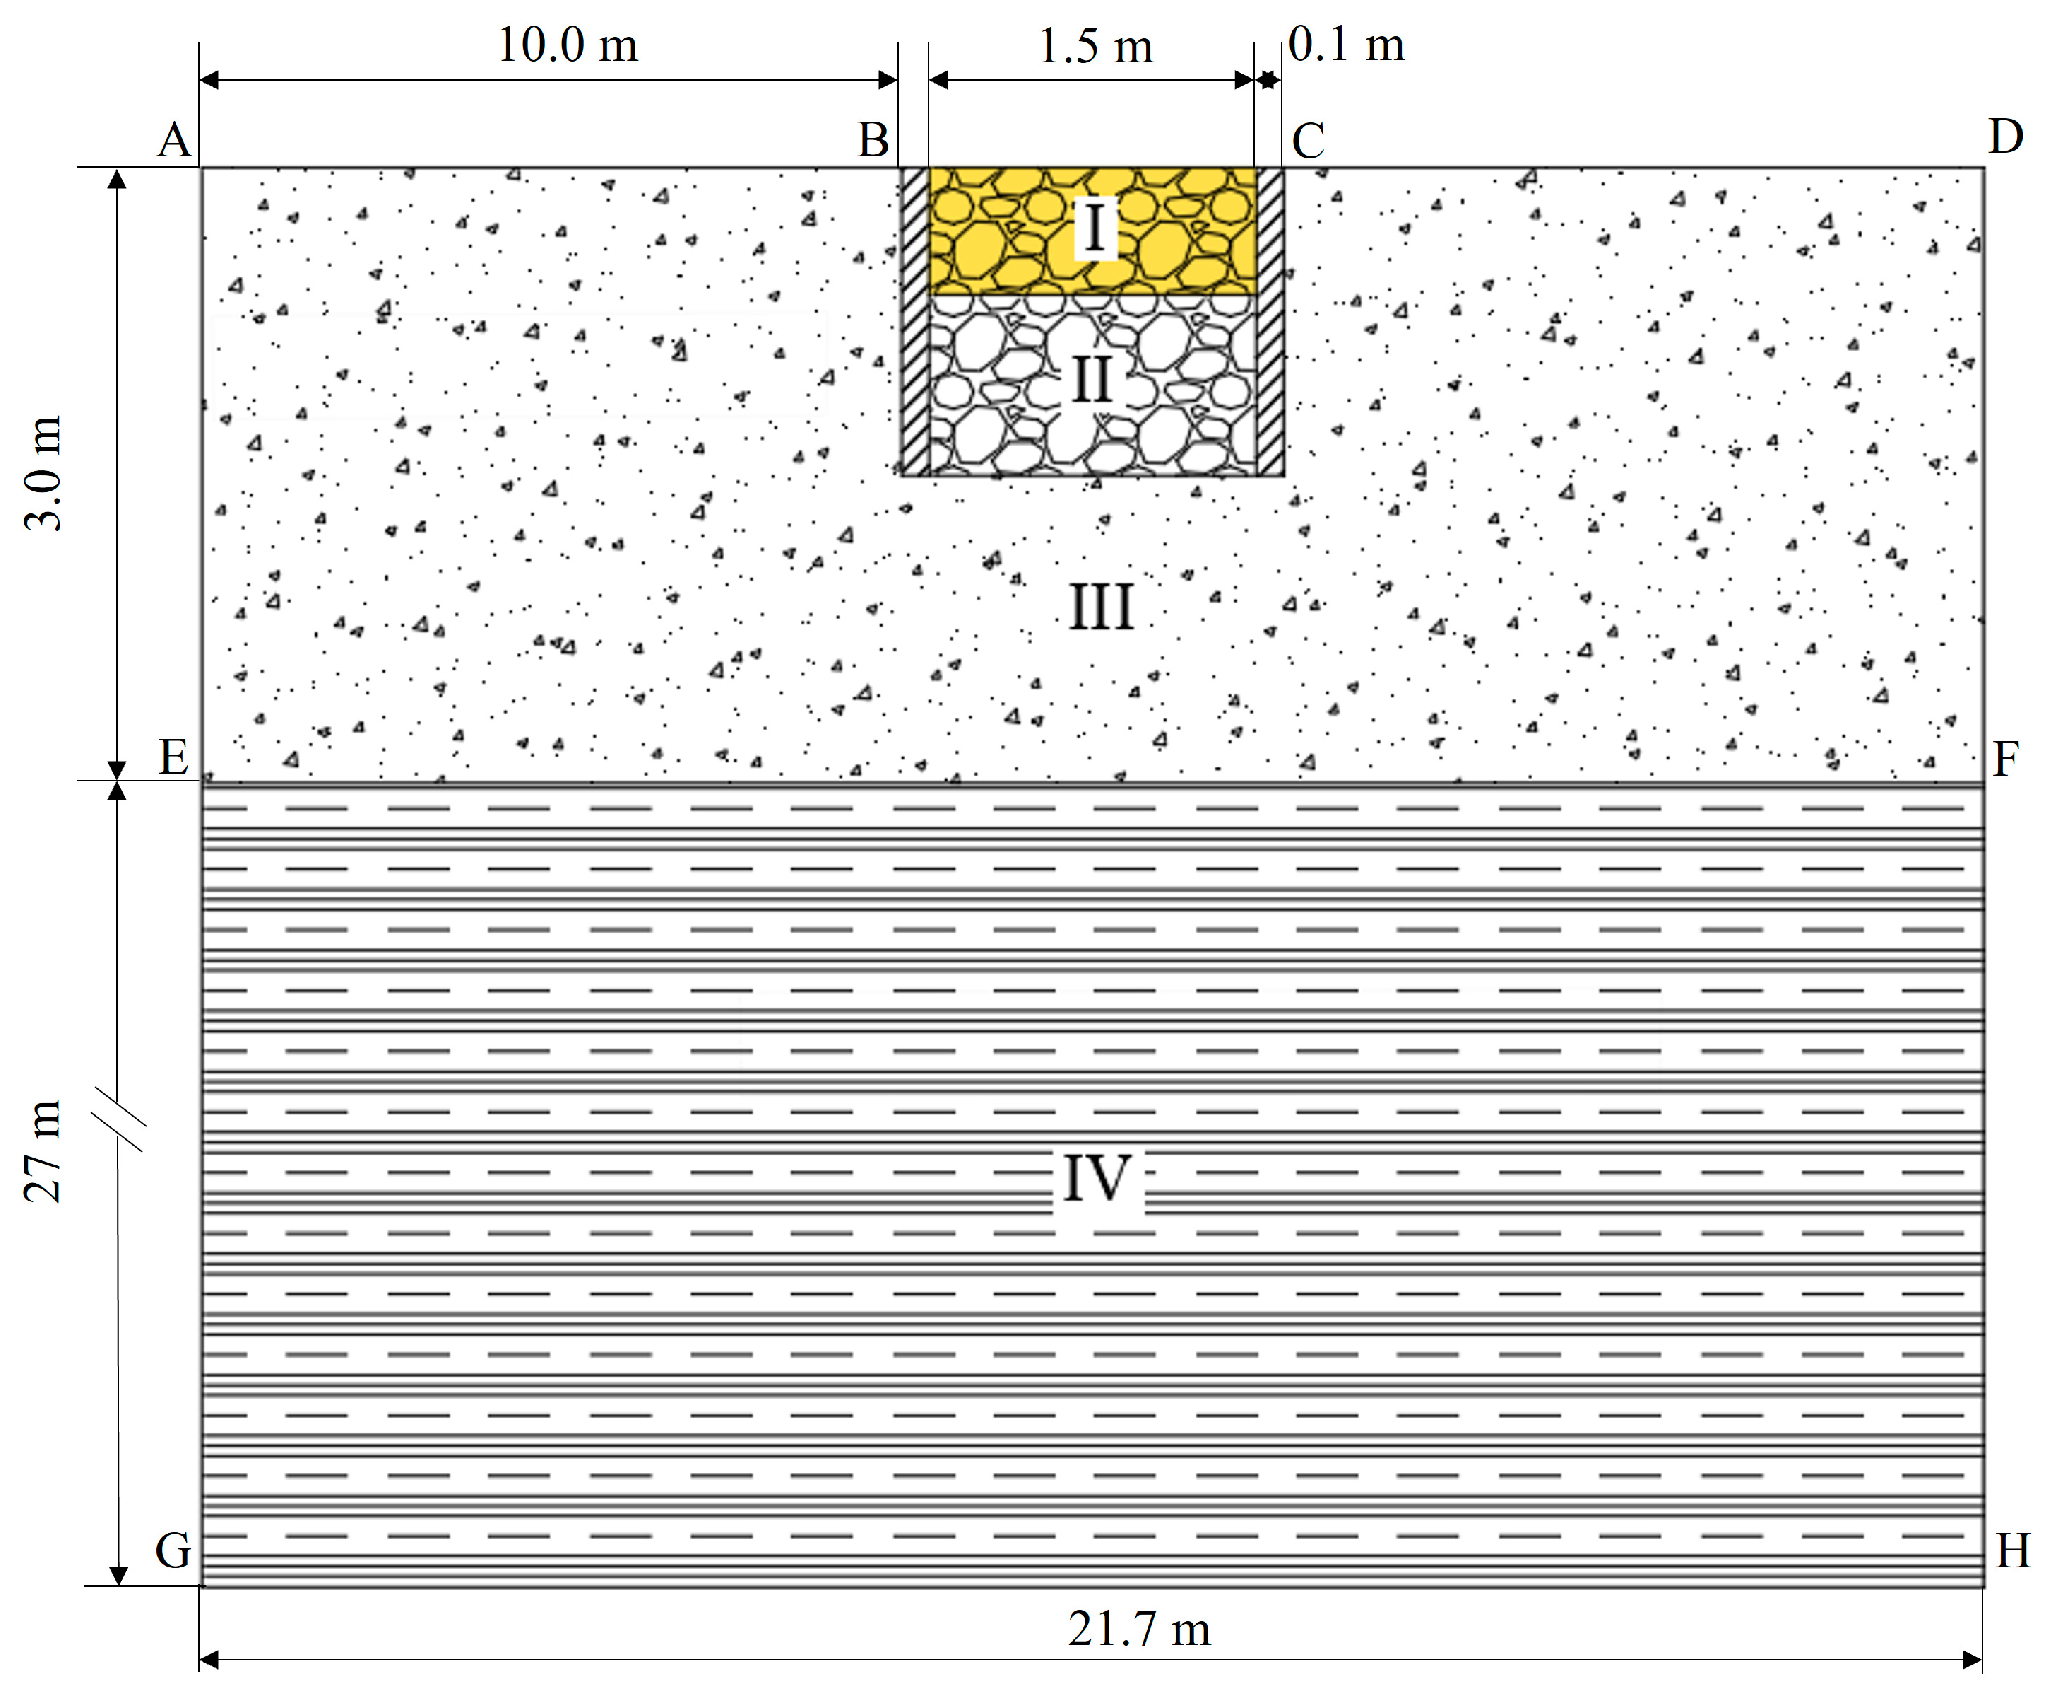
Figure 3.
Model calibration using field test results from June 2013 to June 2015: (a) Temperature variation at depths of 0.5 m and 1.5 m in the PRL, (b) Ra numbers.
Figure 3.
Model calibration using field test results from June 2013 to June 2015: (a) Temperature variation at depths of 0.5 m and 1.5 m in the PRL, (b) Ra numbers.
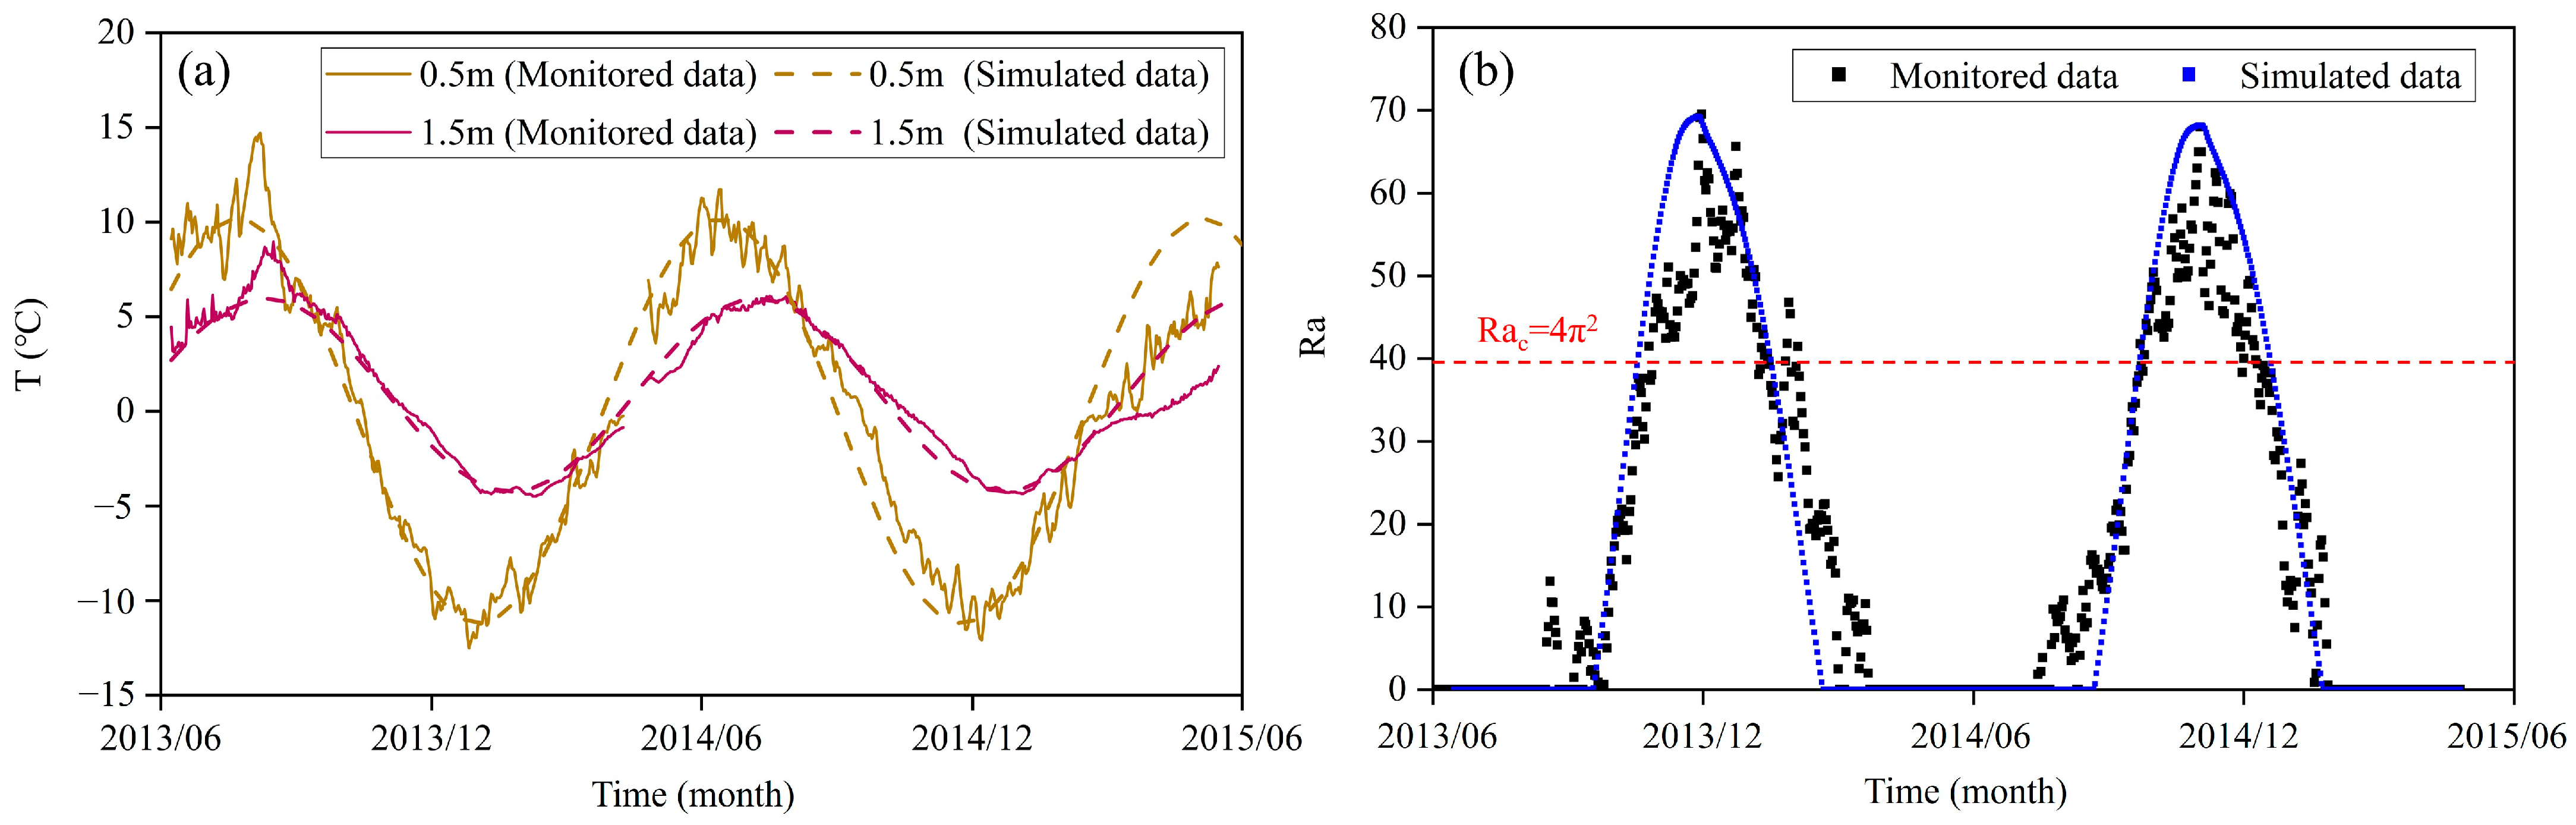
Figure 4.
The time-varying ΔT and Ra number of the closed PRL under the different sand-filling cases: (a) Temperature difference between the bottom and top of the PRL, (b) Ra number.
Figure 4.
The time-varying ΔT and Ra number of the closed PRL under the different sand-filling cases: (a) Temperature difference between the bottom and top of the PRL, (b) Ra number.
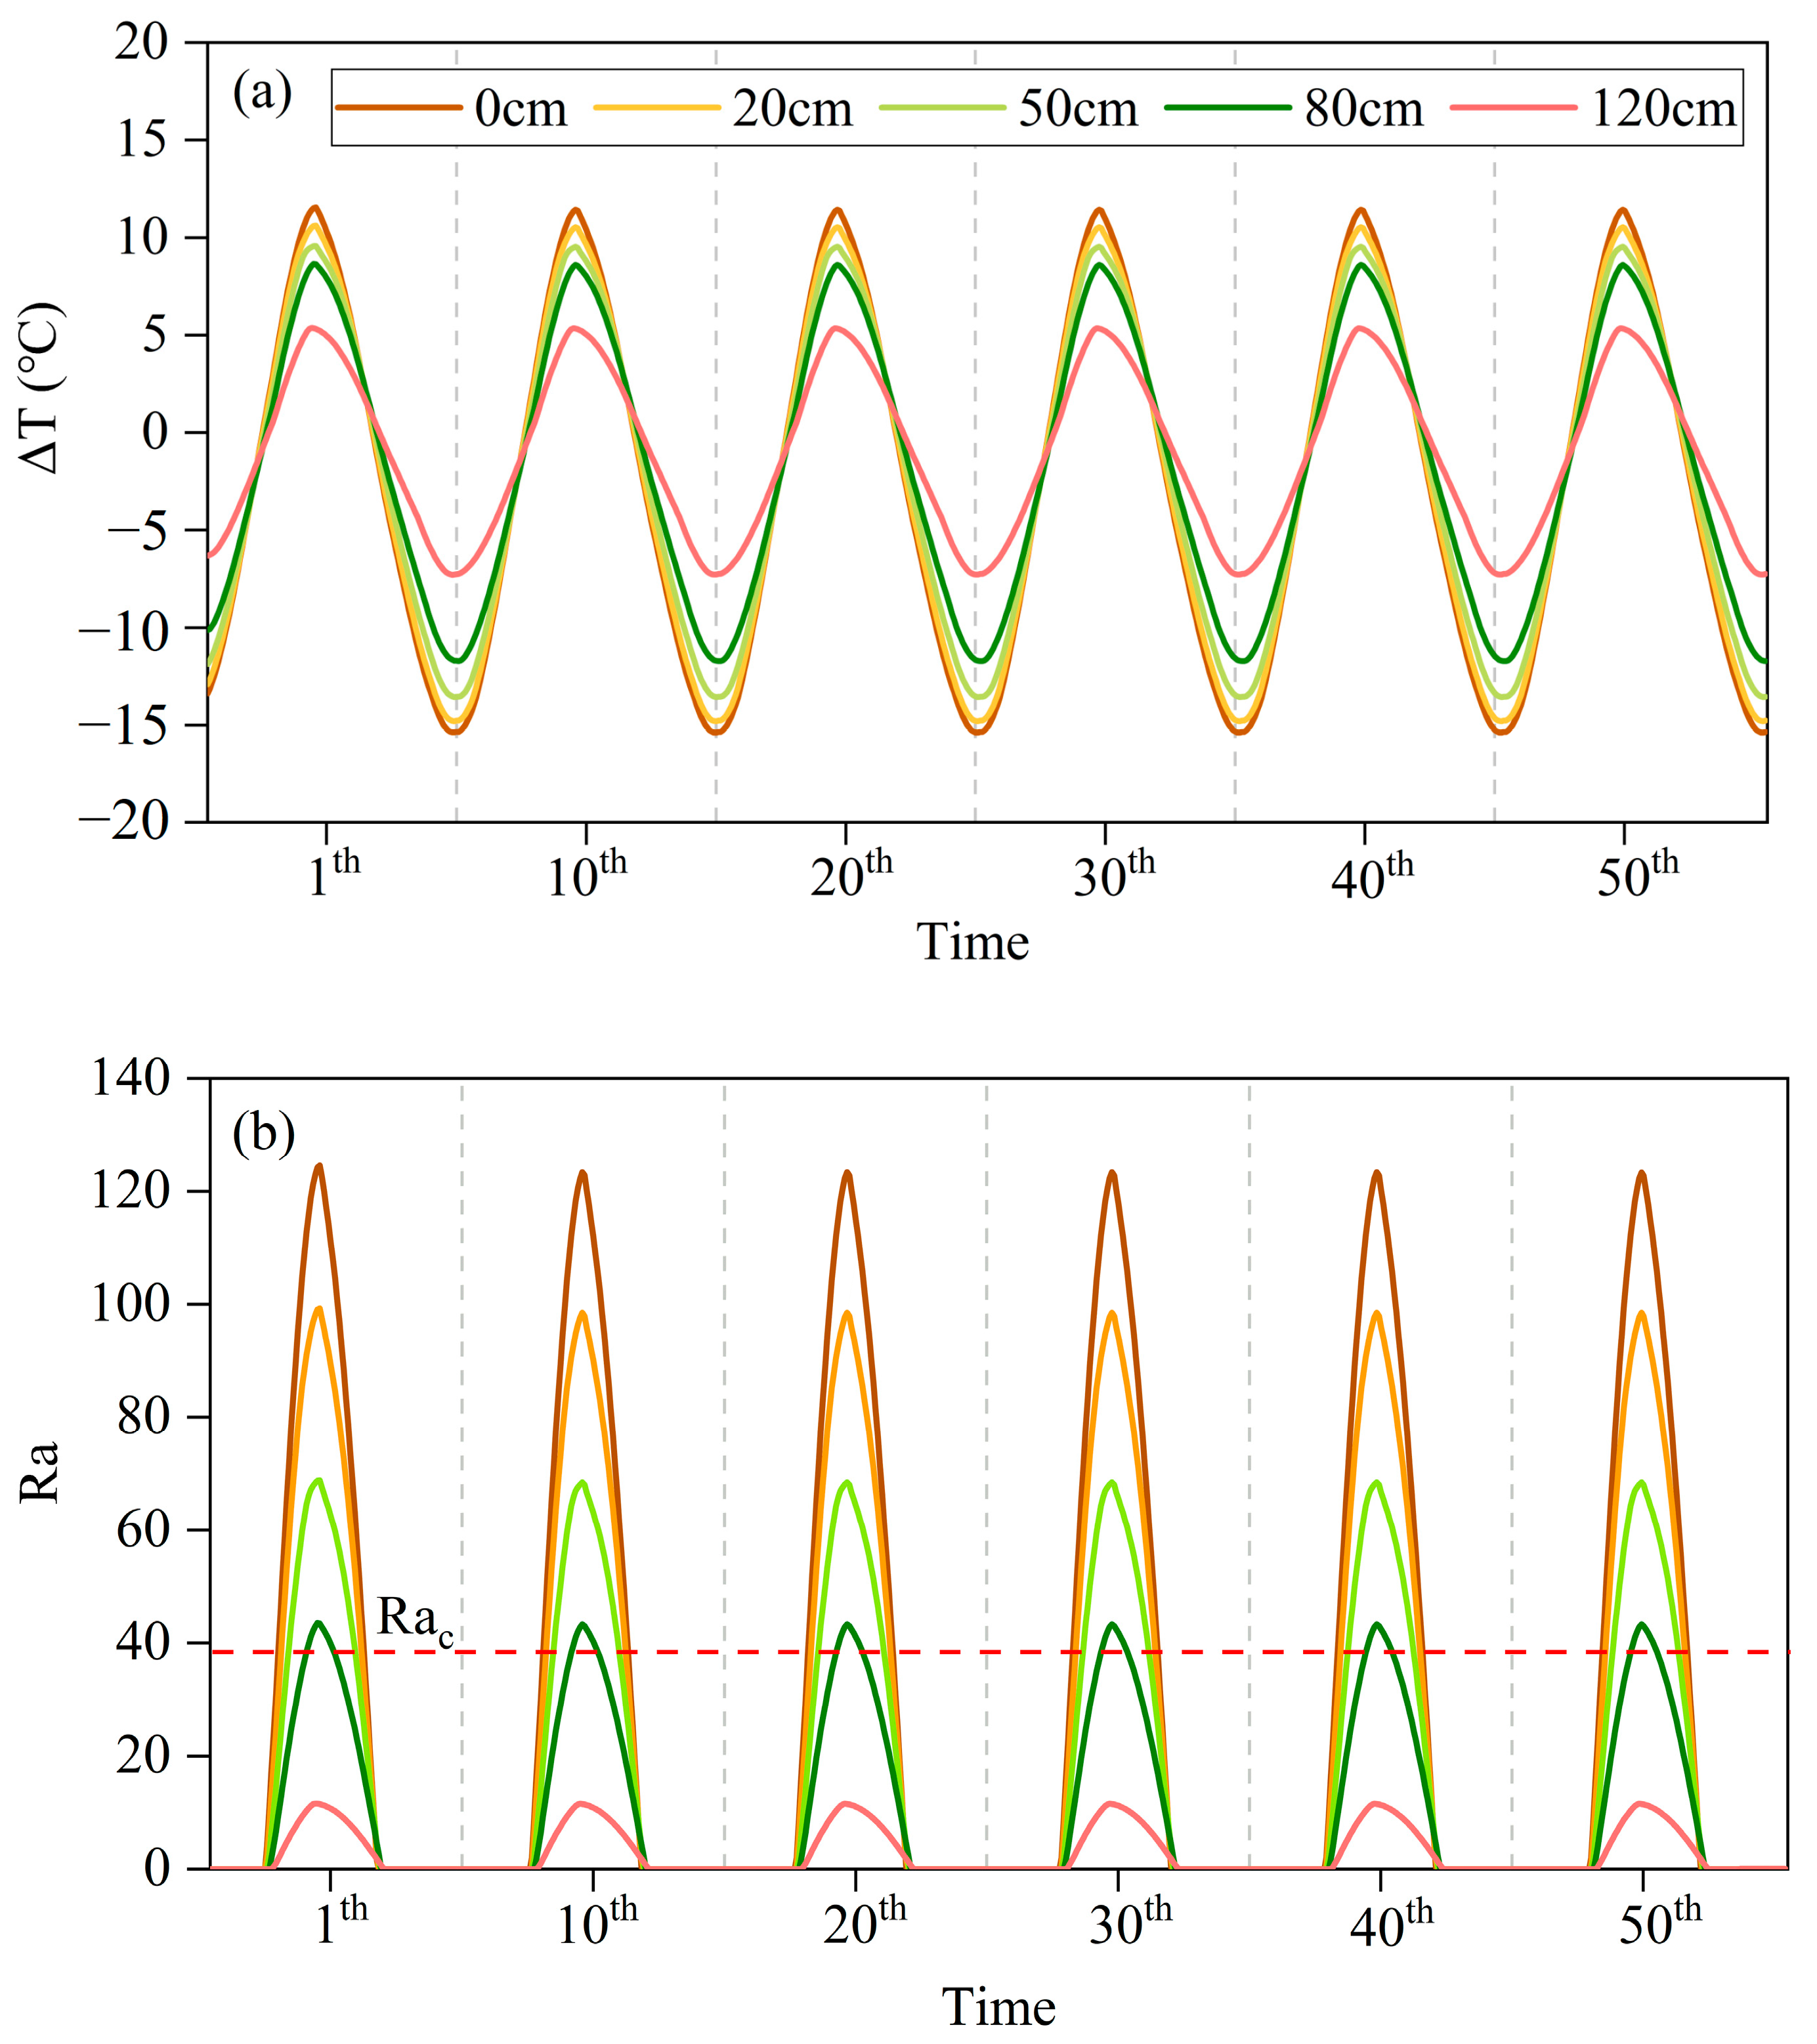
Figure 5.
Ra numbers of different sand-filling cases under three MAAT scenarios: (a) MAAT = −3.5 °C, (b) MAAT = −4.5 °C, (c) MAAT = −5.5 °C.
Figure 5.
Ra numbers of different sand-filling cases under three MAAT scenarios: (a) MAAT = −3.5 °C, (b) MAAT = −4.5 °C, (c) MAAT = −5.5 °C.
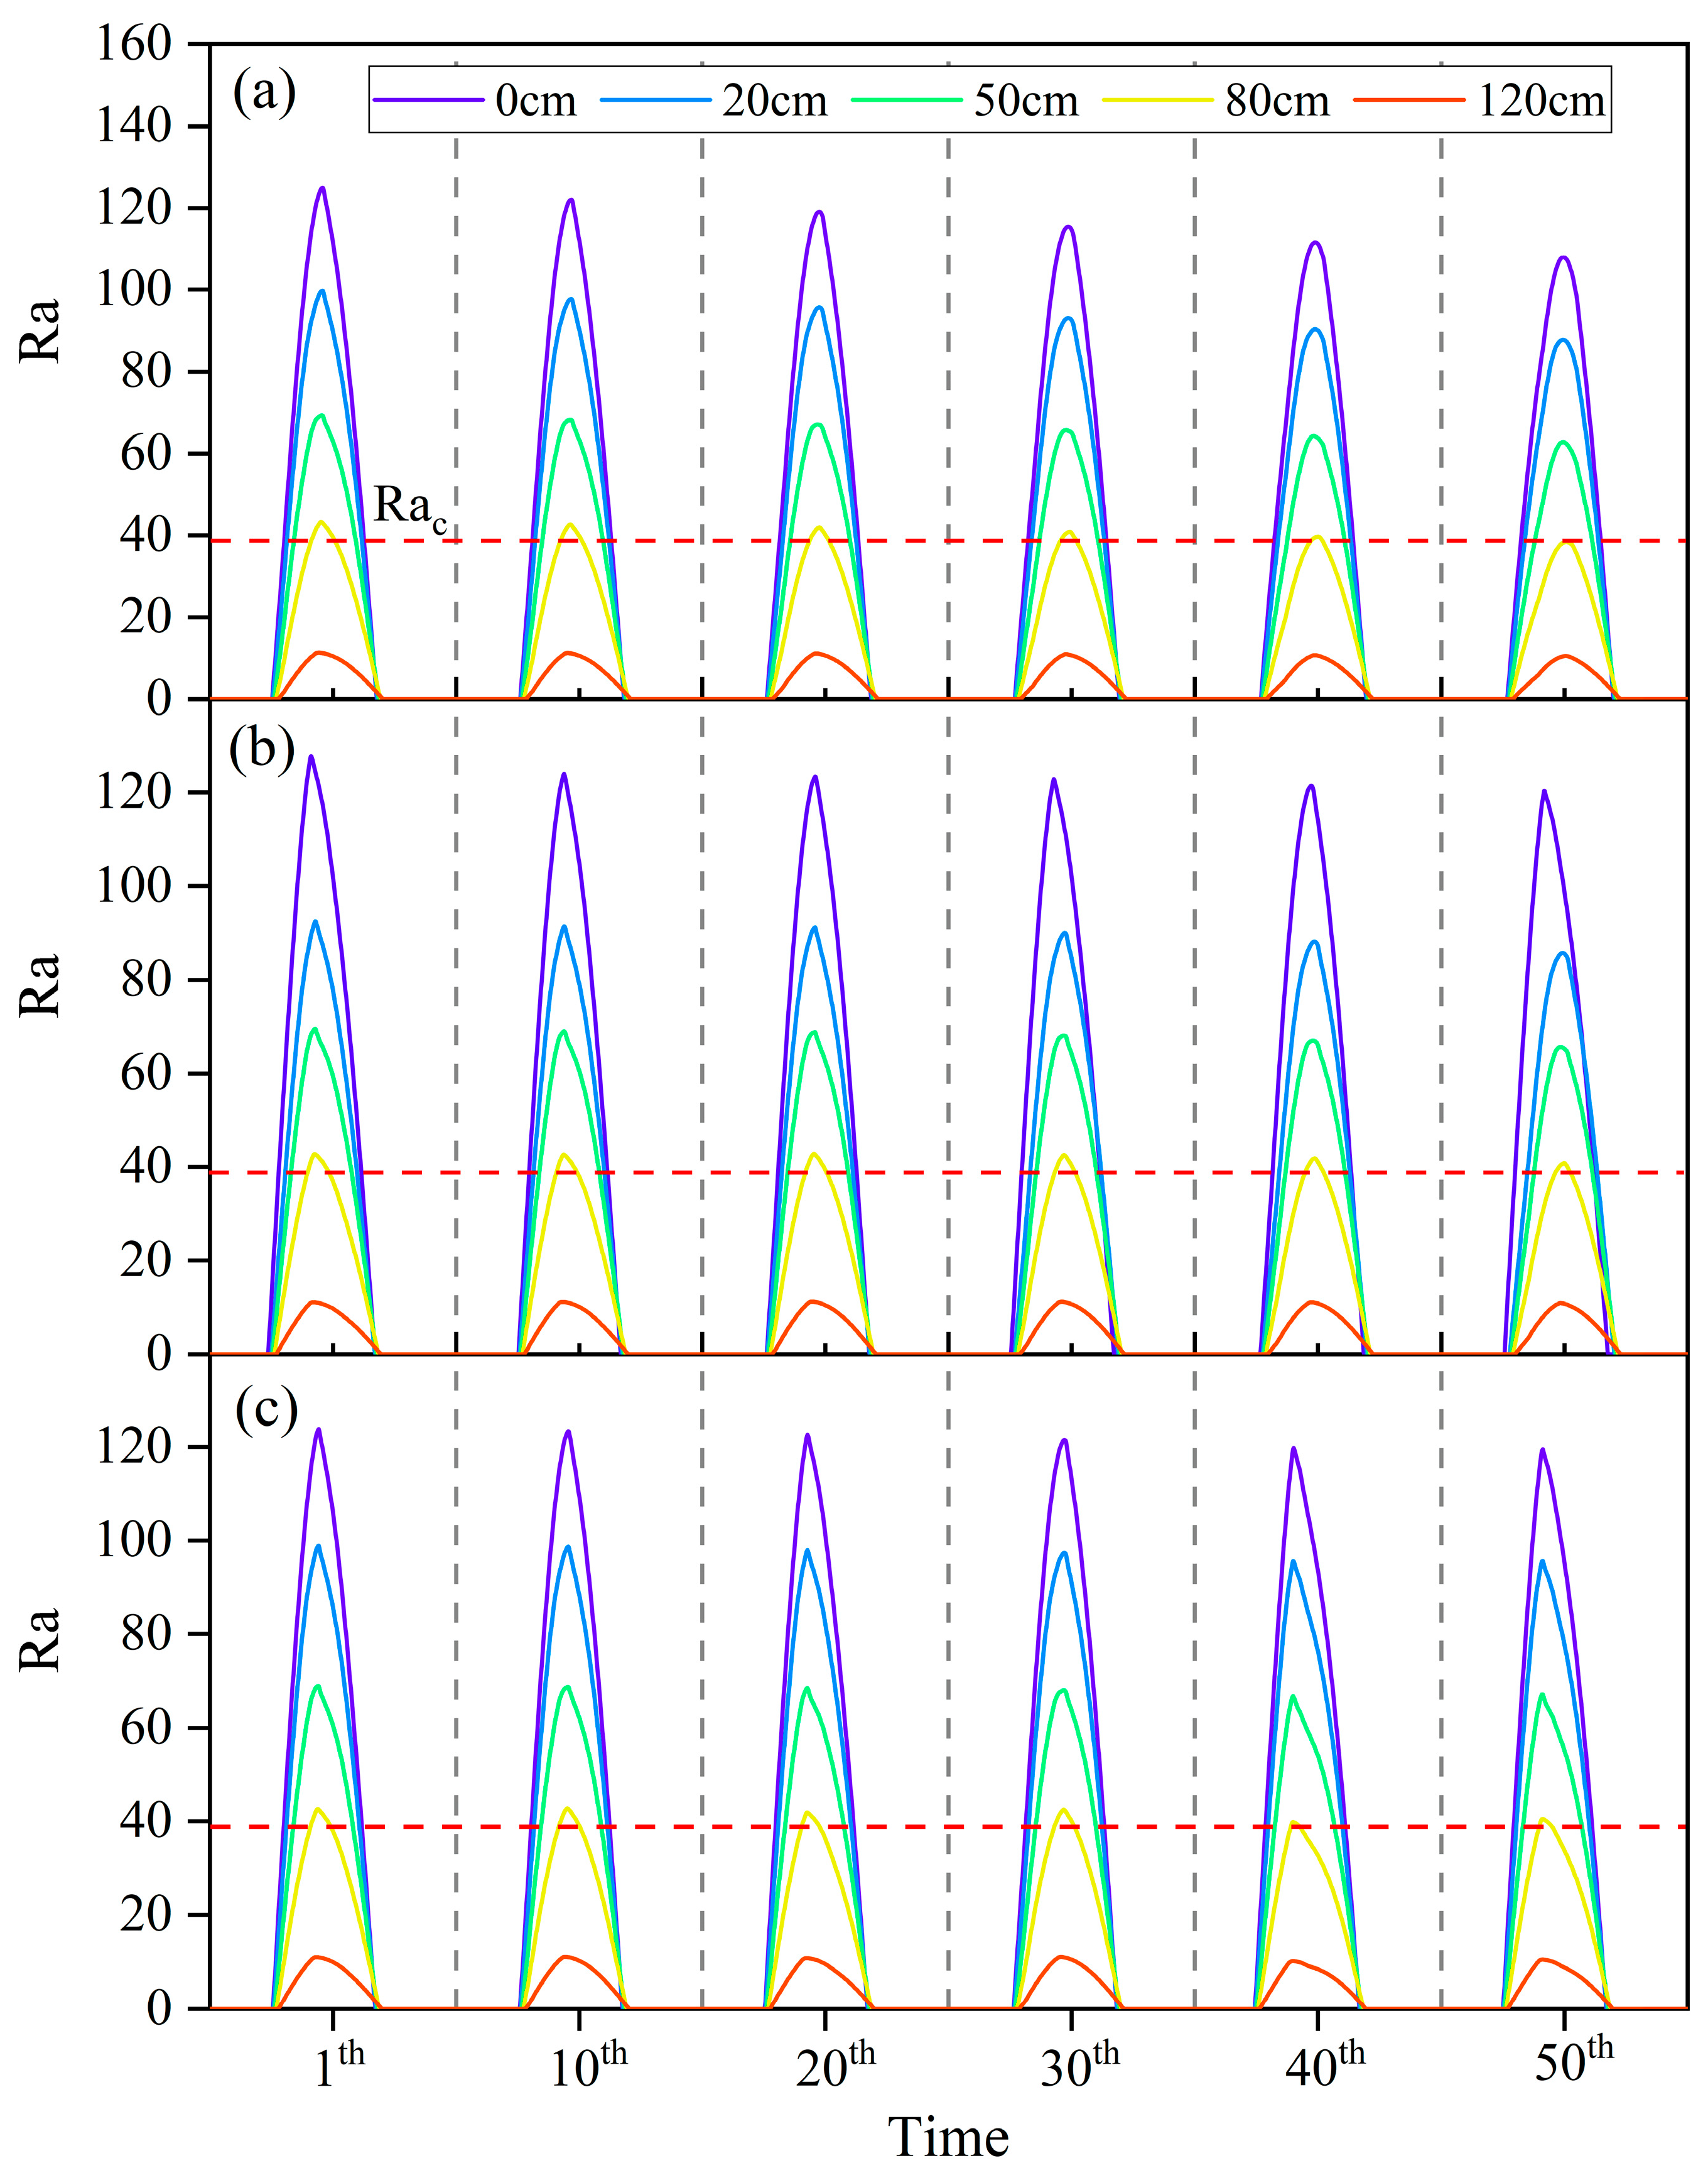
Figure 6.
The permafrost table changes over time under MAAT = −3.5 °C scenarios: (a) sand-free case, (b) 80 cm thick sand-filling case.
Figure 6.
The permafrost table changes over time under MAAT = −3.5 °C scenarios: (a) sand-free case, (b) 80 cm thick sand-filling case.
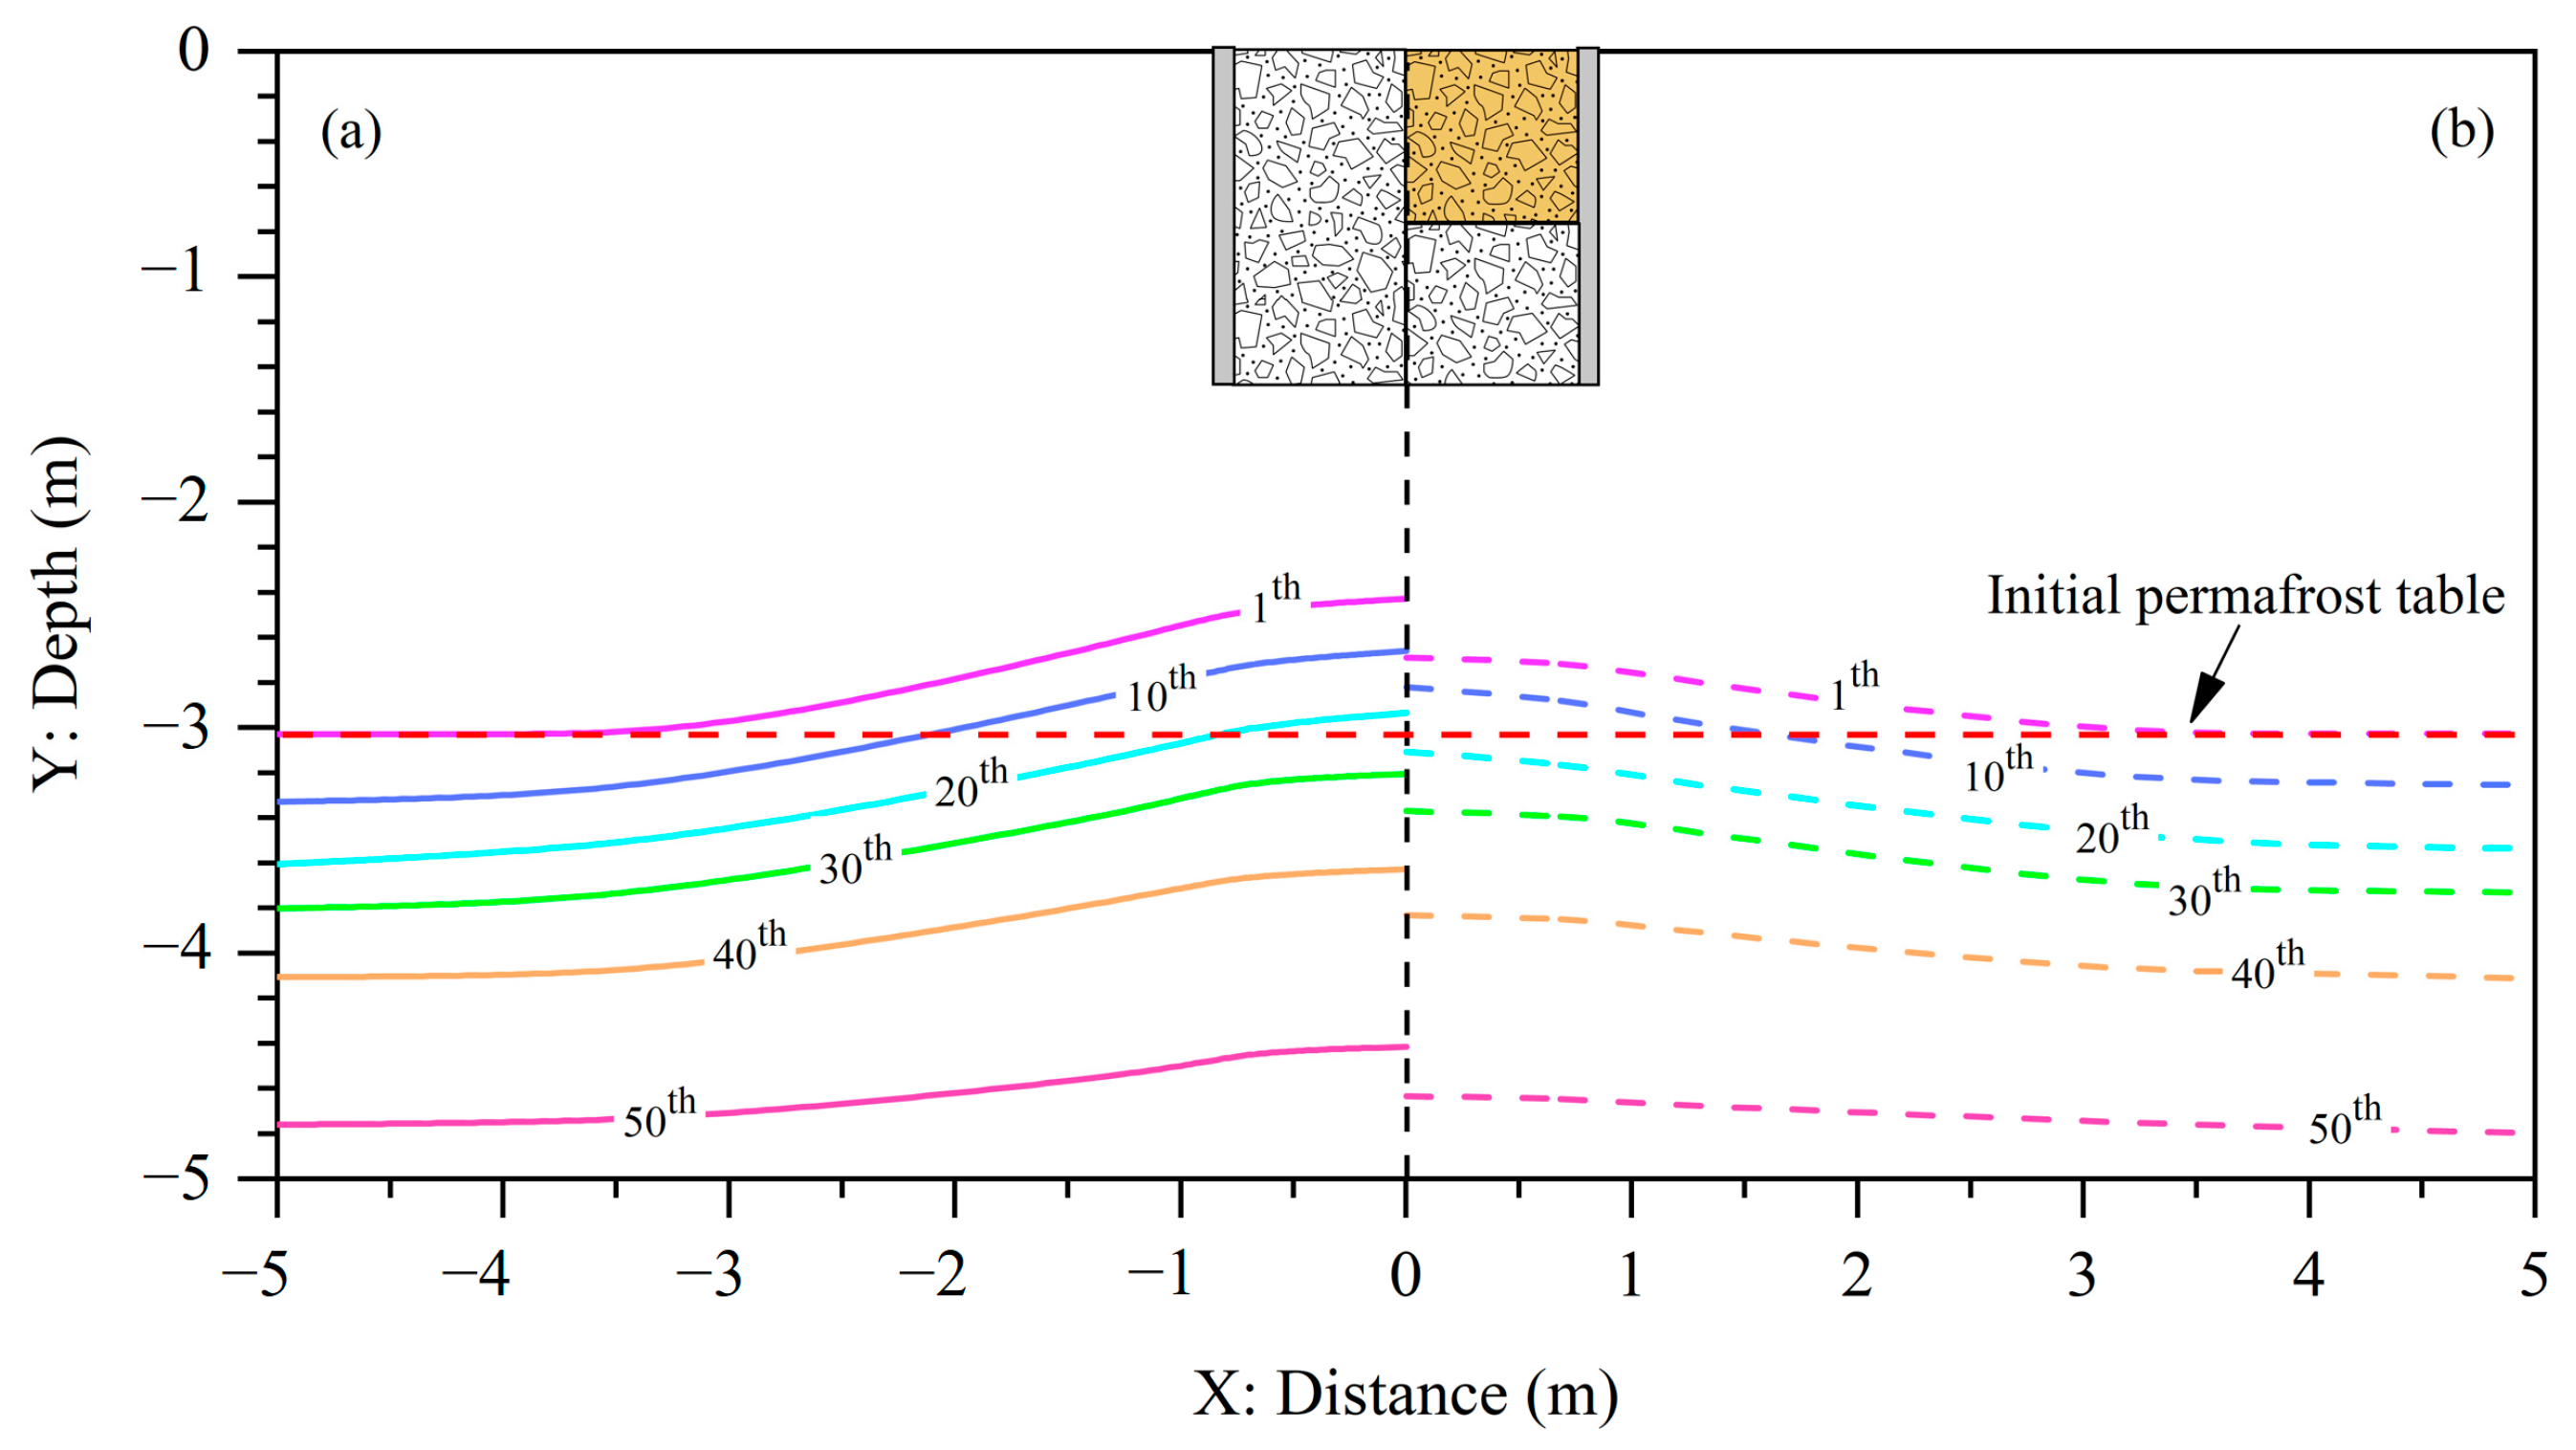
Figure 7.
The permafrost table changes over time under MAAT = −4.5 °C scenarios: (a) sand-free case, (b) 80 cm thick sand-filling case.
Figure 7.
The permafrost table changes over time under MAAT = −4.5 °C scenarios: (a) sand-free case, (b) 80 cm thick sand-filling case.

Figure 8.
The permafrost table changes over time under MAAT = −5.5 °C scenarios: (a) sand-free case, (b) 80 cm thick sand-filling case.
Figure 8.
The permafrost table changes over time under MAAT = −5.5 °C scenarios: (a) sand-free case, (b) 80 cm thick sand-filling case.
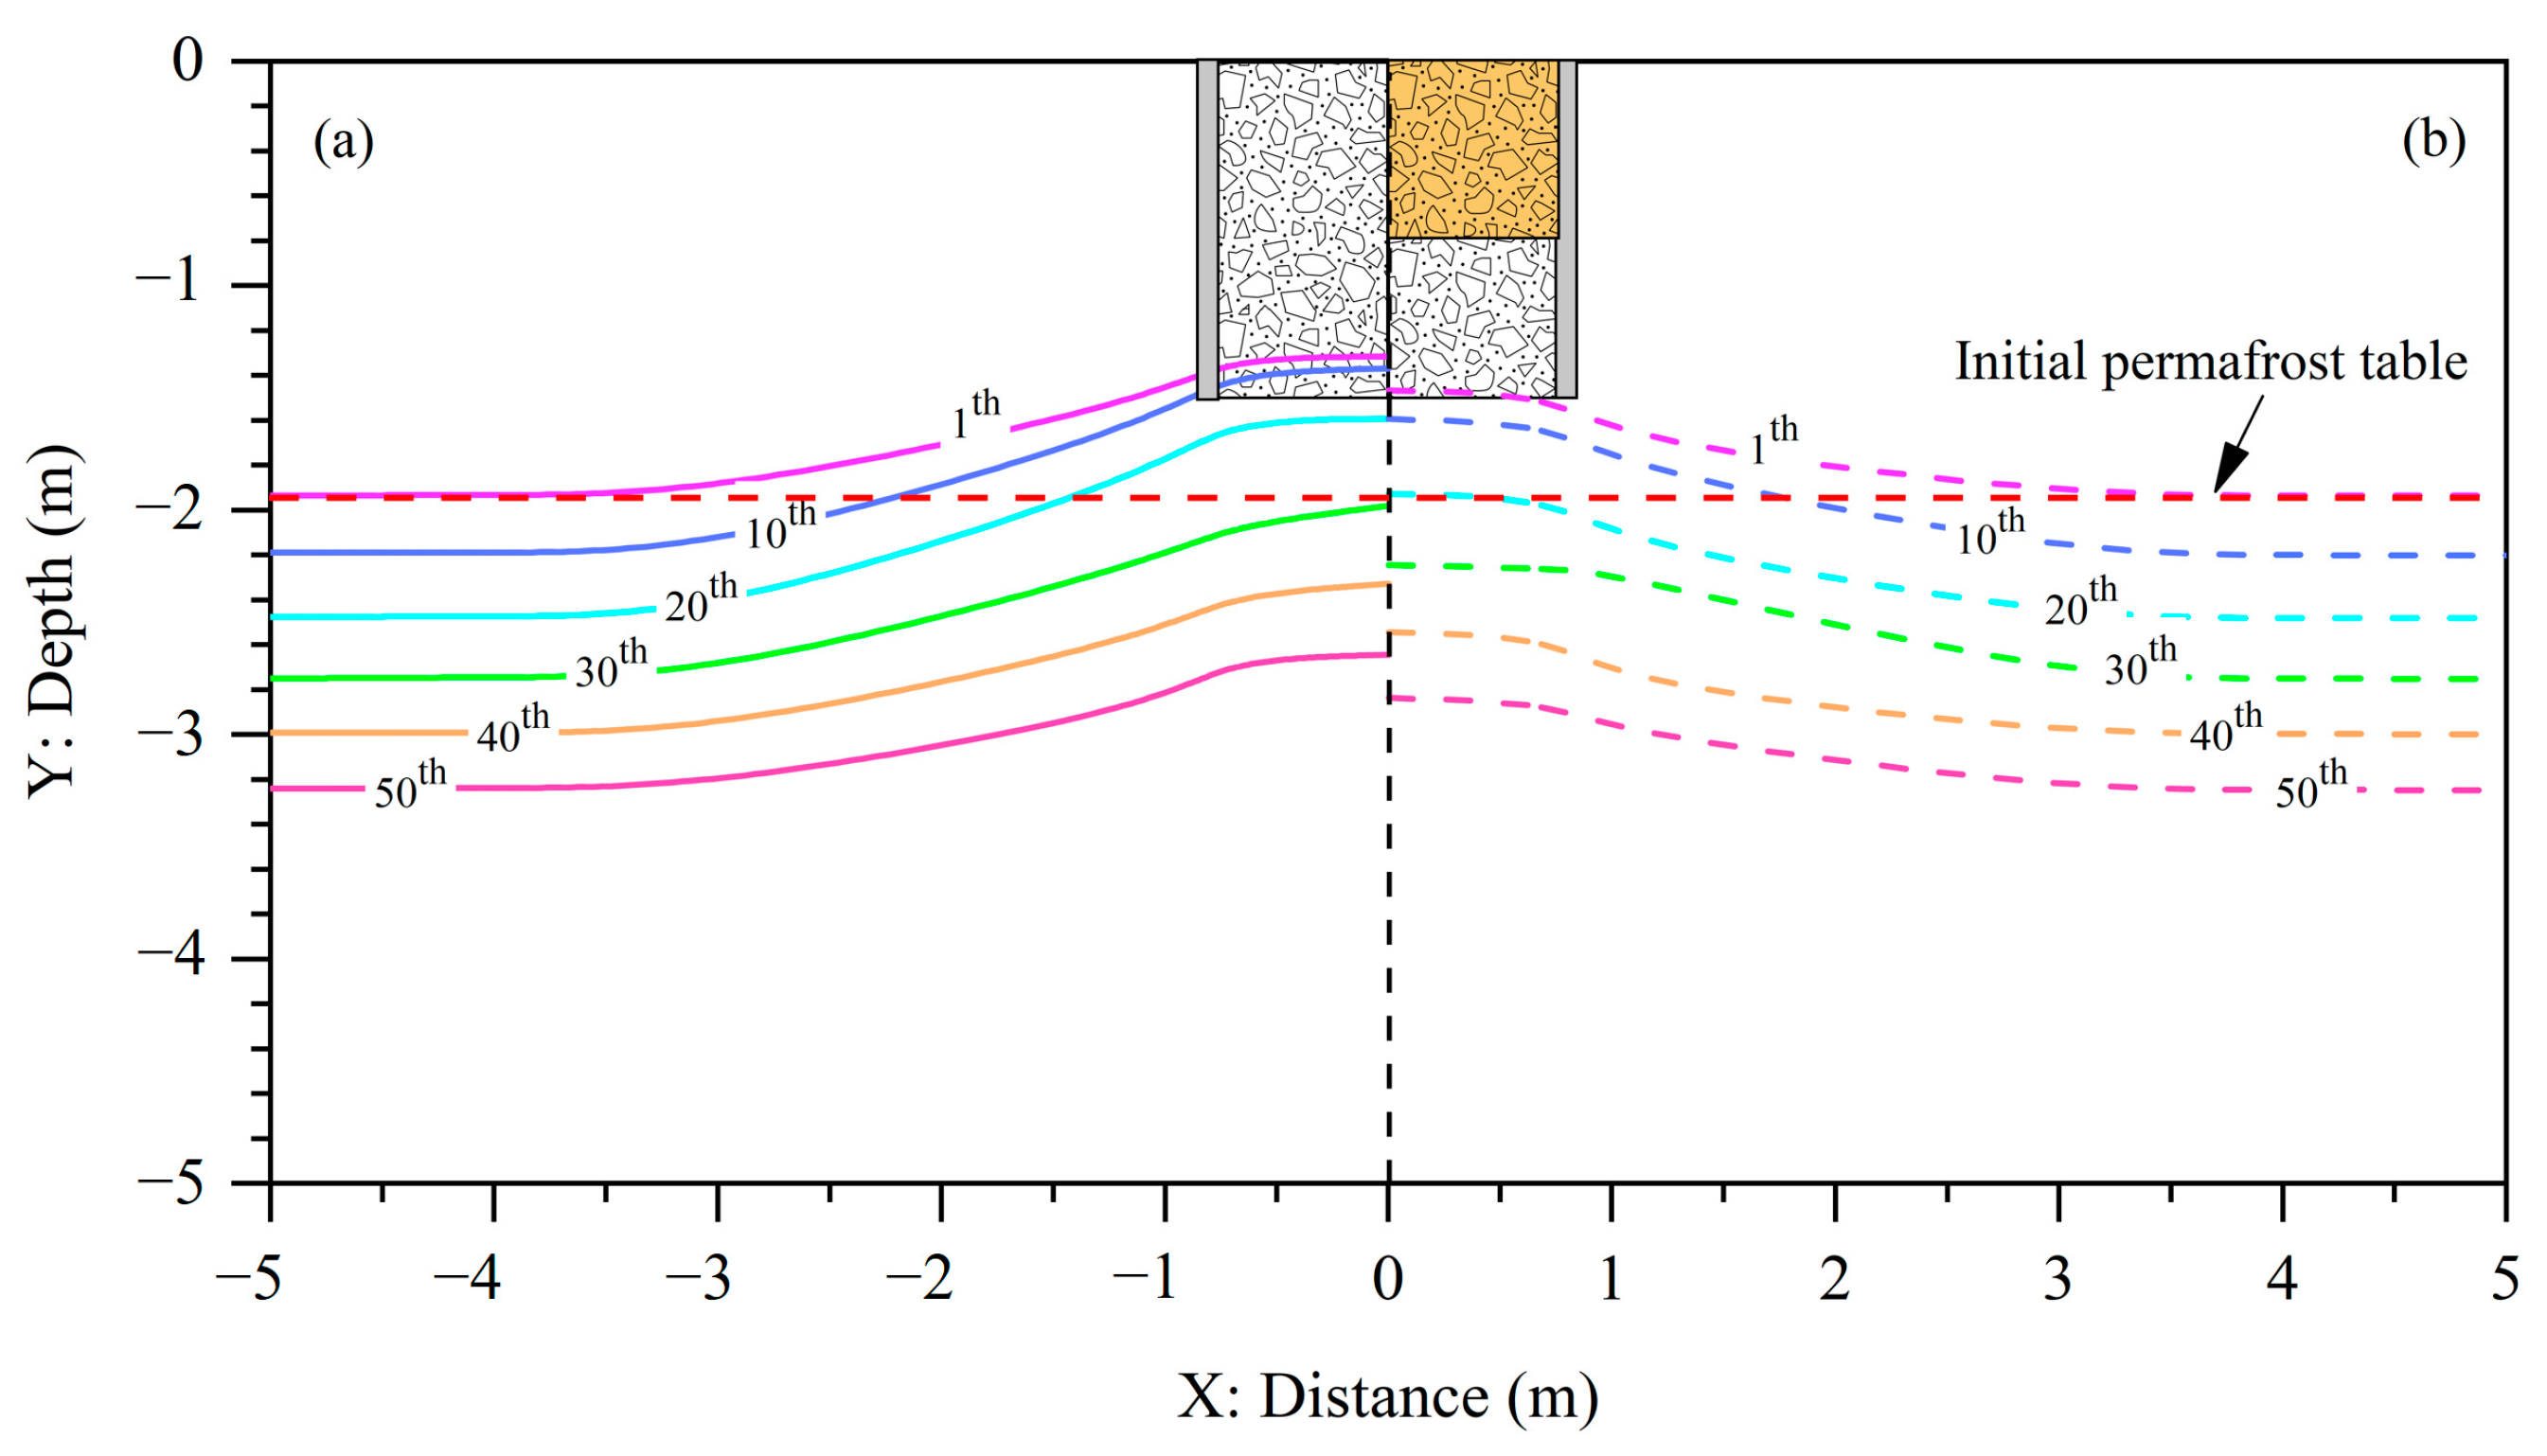
Figure 9.
Heat budget of the soil layer between depths of 1.5 and 2.0 m beneath the PRL: (a) MAAT = −3.5 °C, (b) MAAT = −4.5 °C, (c) MAAT = −5.5 °C. Note: when q > 0, it means heat absorption from the shallow layer; conversely, q < 0 means heat release from the deep layer of permafrost to the shallow layer.

Figure 10.
Variations in MAGT at a depth of 15 m beneath the natural ground surface over a period of 50 years under three MAAT (−3.5 °C, −4.5 °C, −5.5 °C) scenarios.
Figure 10.
Variations in MAGT at a depth of 15 m beneath the natural ground surface over a period of 50 years under three MAAT (−3.5 °C, −4.5 °C, −5.5 °C) scenarios.

Table 1.
Thermophysical parameters of the media in model.
| Lithology | Thermal Conductivity (W·m−1·°C−1) | Volumetric Heat Capacity (J·kg−1·°C−1) | Latent Heat (J·m−3) | ||
|---|---|---|---|---|---|
| Frozen | Unfrozen | Frozen | Unfrozen | ||
| Porous rock layer | 0.442 | 0.442 | 1.016 × 10⁶ | 1.016 × 10⁶ | 0 |
| Sand-filled porous rock layer | 1.188 | 1.188 | 1.446 × 10⁶ | 1.446 × 10⁶ | 0 |
| Gravel soil | 2.720 | 1.870 | 1.864 × 10⁶ | 2.401 × 10⁶ | 2.338 × 10⁷ |
| Weathered mudstone | 1.844 | 1.474 | 2.122 × 10⁶ | 2.413 × 10⁶ | 3.811 × 10⁷ |
| Thermal insulation board | 0.029 | 0.029 | 2.406 × 10⁵ | 2.406 × 10⁵ | 0 |
Table 2.
Physical parameters of the air [34].
Table 2.
Physical parameters of the air [34].
| Physical Domain | cp (J·kg−1·°C−1) | λa (W·m−1·°C−1) | ρ (kg·m−3) | μ (kg·m−1·s−1) |
|---|---|---|---|---|
| Air | 1.004 × 10³ | 0.02 | 0.641 | 1.75 × 10⁻⁵ |
Note: cp is the specific heat of air.
Table 3.
List of simulated cases.
| Case | MAAT (°C) | Climate Change | Sand-Filling Thickness (cm) |
|---|---|---|---|
| Case 1 | −3.5 | Warm | 0, 20, 50, 80, 120 |
| Case 2 | −4.5 | Warm | 0, 20, 50, 80, 120 |
| Case 3 | −5.5 | Warm | 0, 20, 50, 80, 120 |
| Case 4 | −3.5 | Unwarm | 0, 20, 50, 80, 120 |
Table 4.
Critical temperature difference, duration, and maximum Ra number of the closed PRL in different periods.
Table 4.
Critical temperature difference, duration, and maximum Ra number of the closed PRL in different periods.
| Time | Cases | 0 cm | 20 cm | 50 cm | 80 cm |
|---|---|---|---|---|---|
| 1a | ΔTac (°C) | 3.50 | 4.49 | 5.50 | 7.92 |
| Natural convection period | 11/1−2/28 | 11/7−2/25 | 11/6−2/16 | 12/13−1/13 | |
| Maximum Ra number | 124.59 | 99.33 | 68.85 | 43.56 | |
| 30a | ΔTac (°C) | 3.47 | 4.47 | 5.48 | 7.90 |
| Natural convection period | 11/1−2/28 | 11/7−2/22 | 11/16−2/13 | 12/13−1/13 | |
| Maximum Ra number | 123.37 | 98.55 | 68.52 | 43.33 | |
| 50a | ΔTac (°C) | 3.92 | 4.44 | 5.58 | 7.98 |
| Natural convection period | 11/7−2/30 | 11/11−2/26 | 11/21−2/17 | 11/22−2/27 | |
| Maximum Ra number | 121.99 | 98.75 | 68.18 | 44.69 |
Note: 11.1–2.28 represent November 1 to February 28.
Disclaimer/Publisher’s Note: The statements, opinions and data contained in all publications are solely those of the individual author(s) and contributor(s) and not of MDPI and/or the editor(s). MDPI and/or the editor(s) disclaim responsibility for any injury to people or property resulting from any ideas, methods, instructions or products referred to in the content. |
© 2023 by the authors. Licensee MDPI, Basel, Switzerland. This article is an open access article distributed under the terms and conditions of the Creative Commons Attribution (CC BY) license (https://creativecommons.org/licenses/by/4.0/).
Share and Cite
MDPI and ACS Style
Qiu, K.; Huang, Y.; Han, F.; Yang, Q.; Yu, W.; Cheng, L.; Cao, H. Numerical Simulation of Heat Transfer of Porous Rock Layers in Cold Sandy Regions. Atmosphere 2023, 14, 1812. https://doi.org/10.3390/atmos14121812
AMA Style
Qiu K, Huang Y, Han F, Yang Q, Yu W, Cheng L, Cao H. Numerical Simulation of Heat Transfer of Porous Rock Layers in Cold Sandy Regions. Atmosphere. 2023; 14(12):1812. https://doi.org/10.3390/atmos14121812
Chicago/Turabian StyleQiu, Kaichi, Yong Huang, Fenglei Han, Qiuju Yang, Wenbing Yu, Lu Cheng, and Hang Cao. 2023. "Numerical Simulation of Heat Transfer of Porous Rock Layers in Cold Sandy Regions" Atmosphere 14, no. 12: 1812. https://doi.org/10.3390/atmos14121812
Note that from the first issue of 2016, this journal uses article numbers instead of page numbers. See further details here.