
Two-Stream Networks for COPERT Correction Model with Time-Frequency Features Fusion


1
Institute of Artificial Intelligence, Hefei Comprehensive National Science Center, Hefei 230088, China
2
Key Laboratory of System Control and Information Processing, Ministry of Education, Shanghai 200240, China
3
College of Artificial Intelligence, Anhui University, Hefei 230031, China
*
Author to whom correspondence should be addressed.
Atmosphere 2023, 14(12), 1766; https://doi.org/10.3390/atmos14121766
Submission received: 5 October 2023
/
Revised: 22 November 2023
/
Accepted: 24 November 2023
/
Published: 29 November 2023
(This article belongs to the Special Issue Applying Deep Learning Technology for Spatiotemporal Prediction of Air Pollution from Urban Mobile Sources)
Abstract
:Emission factors serve as a valuable tool for quantifying the release of pollutants from road vehicles and predicting emissions within a specific time or area. In order to overcome the limitation of the computer program to calculate emissions from the road transport (COPERT) model in directly obtaining precise emission factors from on-board diagnostic (OBD) data, we propose a novel two-stream network that combines time-series features and time-frequency features to enhance the accuracy of the COPERT model. Firstly, for the instantaneous emission factors of NOx from multiple driving segments provided by heavy-duty diesel vehicles in actual driving, we select the monitored attributes with a high correlation to the emission factor of NOx considering the data scale and employing Spearman rank correlation analysis to obtain the final dataset composed of them and emission factors. Subsequently, we construct an information matrix to capture the impact of past data on emission factors. Each attribute of the time series is then converted into a time-frequency matrix using the continuous wavelet transform. These individual time-frequency matrices are combined to create a multi-channel time-frequency matrix, which represents the historical information. Finally, the historical information matrix and the time-frequency matrix are inputted into a two-stream parallel model that consists of ResNet50 and a convolutional block attention module. This model effectively integrates time-series features and time-frequency features, thereby enhancing the representation of emission characteristics. The reliability and accuracy of the proposed method were validated through a comparative analysis with existing mainstream models.
1. Introduction
Heavy-duty diesel vehicles are one of the main tools for long-distance cargo transportation around the world, which have the advantages of flexible, convenient and low-cost transportation and play an important role in the national economy. However, due to their high fuel consumption, long mileage and high ownership, heavy-duty diesel vehicles have become an important source of nitrogen oxide emissions from motor vehicles. According to the “China Mobile Source Environmental Management Annual Report (2021) [1]”, diesel vehicle emissions of carbon monoxide (CO), hydrocarbons (HC), nitrogen oxides (NOx) and particulate matter (PM) accounted for 9.9%, 18.7%, 57.3% and 77.8% of national vehicle emissions in 2020, respectively. Therefore, the NOx emission control is the difficulty and focus of the current pollution reduction in heavy-duty diesel vehicles, but the effectiveness of standard control measures for heavy-duty diesel vehicles needs to quantitatively be evaluated based on accurate diesel vehicle transient emission models. The formulation of the current emission limit standard is based on the emission factor model under the laboratory cycle conditions, and the vehicle emissions are calculated by establishing the correlation between the emission characteristics of the motor vehicle and various influencing factors of the motor vehicle. The emission factor model serves as the basis for the emission inventory accounting and the formulation of emission reduction policies.
The current vehicle emission models are different in terms of computational requirements and the experimental physical input data. Some emission factor models, such as the MOBILE model [2] developed by the U.S. Environmental Protection Agency (U.S. EPA), the EMFAC model [3] developed by the California Air Resources Board (CARB) and the COPERT model [4] developed by the European Commission, calculate the emissions based on the average speed of specific driving cycles. These models are usually used to estimate or predict macro-level traffic emissions in a specific area (regional area or city scale) for a specific time period of total pollution emissions (usually a quarter or a year), while ignoring the dynamic driving conditions. Another kind of emission model incorporate the instantaneous speed, acceleration/deceleration and other vehicle driving characteristic data to accurately reflect the emissions under different vehicle operating modes such as idle, steady-state cruise and various acceleration/deceleration levels, which are suitable for analyzing the emission of a single vehicle or a number of specific roads emissions calculation tasks. These models mainly include the IVE model [5] and the CMEM model [6] developed by the University of California, Riverside (UCR). The MOVES is a comprehensive model [7] developed by the EPA, which can estimate emissions based on average velocity as well as operating conditions. It can be appropriate for both micro, meso and macro emission estimation. Due to the lack of basic data, the domestic research on emission factor models started late, and the foreign default values were directly used to evaluate local vehicle pollution emissions, resulting in large estimation errors.
In the last few years, there have been significant advancements in the field of vehicle emission modeling, driven by the widespread adoption of technologies such as Portable Emission Measurement System (PEMS) [8] and OBD remote online monitoring [9]. These technologies have enabled researchers to obtain actual road emission factors, which can be used to refine and improve emission models used in developed countries. Quirama et al. [10] utilized PEMS to develop a methodology based on energy consumption analysis at a micro-trip level. This mode facilitated the assessment of real-world energy consumption and emissions for a fleet operating within a defined geographical region. Tsinghua University and other domestic institutions have developed the Beijing Vehicle Emission Factor Model (EMBEV) based on established emission models from foreign sources [11]. Wang et al. [12] employed a computational approach based on decision optimization to estimate road segment speeds using low-frequency GPS trajectory data. They combined this with a micro-emission model to estimate carbon dioxide emissions. Kumar et al. [13] used 6 years of air pollution data from 23 Indian cities, selected relevant features through correlation analysis, solved the data imbalance problem by using resampling techniques and, finally, identified key pollutants directly affecting the Air Quality Index (AQI) using a machine learning approach. Wang et al. [14] considered the influence of historical vehicle operating states and developed a microscopic emission model based on a BP neural network using short-term driving conditions. Xu et al. [15] proposed a deep learning-based approach for exhaust gas telemetry data using COPERT emission factors. This approach involved constructing a three-layer self-encoder network to extract features from heterogeneous data sources such as meteorological data, road network data, traffic flow data and urban functional areas, thereby correcting the COPERT emission model. Yang et al. [16] analyzed the actual CO2 and NOx emissions of National IV buses using remote on-board diagnostic (OBD) data. They established a calculation method for CO2 and NOx emissions based on OBD data. In light of the swift progress in artificial intelligence technology, there has been a notable emergence of innovative theoretical perspectives and sophisticated technical approaches. These advancements have brought about substantial changes in the landscape of research and analysis across traditional industries. Recently, there has been a surge in scholarly research focusing on the online monitoring of OBD vehicle networks. Xu et al. [17] proposed a transfer learning-based approach for predicting mobile source pollution in the context of OBD pollution monitoring, specifically focusing on the impact of multiple external factors. The study utilized diesel vehicles as a case study and successfully achieved knowledge transfer across different vehicle models. Molina [18] employed random forest to determine the most influential driver variables based on the best attributes of the training model using OBD II data. Rivera-Campoverde et al. [19] addressed the challenge of estimating vehicle pollutant emission levels in the absence of an accurate model and limited measurement campaigns. They proposed a novel method for pollutant emission estimation by utilizing vehicle driving variables such as vehicle gear, engine speed and gas pedal position as inputs to a neural network model. The results of their approach closely aligned with those obtained from the IVE model and real driving emissions (RDE) test results. Wang et al. [20] proposed a coherent methodology that utilizes the OBD system to collect operational data from heavy-duty diesel vehicles. Subsequently, an artificial neural network is constructed to develop an emission prediction model. This approach enables real-time monitoring of the vehicle’s emission status, providing valuable insights for environmental protection and vehicle management purposes. Chen et al. [21] presented a methodology for gathering vehicle parameters, including speed, RPM, throttle position, engine load, etc., through the OBD interface. Subsequently, they employed the AdaBoost algorithm to classify driving behaviors, achieving an impressive accuracy rate of 99.8% across various driving scenarios.
However, the current emission model uses artificially designed parameters such as vehicle speed and acceleration to characterize the relationship between vehicle driving conditions and pollution emissions, where only the time domain information of vehicle driving conditions data came from multiple sensors is used to construct the emission model, without considering the frequency domain representation information of the vehicle engine states. The current emission models are mainly based on the traditional regression learning method, in which it is difficult to ensure the accuracy of the model representation and comprehensively describe the mapping relationship between the vehicle driving state and emissions under different working conditions.
The representative models are shown in Table 1 (where VSP represents the instantaneous output power per unit mass of a motor vehicle). The data of these models come from bench tests and on-board tests and it is difficult to obtain accurate emission factors directly using these models on OBD data. Under the circumstance that it is difficult to fully verify the results of most emission models in China, the process application should be an important indicator of emission model selection. When calculating emissions, it is not necessary to choose the latest model. Different models are suitable for different regional situations and development stages Although the emission model based on operating conditions can better reflect the relationship between actual driving conditions and emissions, vehicle pollution control is still in the early stage in most cities in China, and there is a lack of statistical data on vehicle ownership and in-vehicle driving conditions. When the model input parameters are difficult to obtain and the accuracy cannot be guaranteed, it will not help even if there is a model that is fully applicable to the local area. The purpose of this work is to revise the emission model, and the primary consideration is the availability of model parameters for model selection, and the ease of building an a priori emission model. Considering the congruence between the emission standards and vehicular control technologies employed in China and Europe, coupled with the accessibility of the requisite parameters for the European-developed COPERT model, it is not surprising that COPERT has found extensive application in research related to pollution emissions from on-road mobile sources within China [22,23,24,25]. In light of these factors, this study has elected to utilize COPERT as the emission model of choice, subjecting it to amend for the purpose of calculating NOx emission factors within the OBD dataset.
Vehicle driving conditions play a pivotal role in determining emissions. When modeling on-road mobile source emissions, the focus is typically on establishing the relationship between the operational status of the mobile source and the level of pollutant emissions. The accuracy and validity of the model rely on the precise representation of the on-road mobile source’s operational status. Therefore, in order to modify the COPERT model to achieve the application of COPERT model on the OBD dataset, it is necessary to accurately represent the on-road mobile source operation state. However, the mobile source driving state is complicated and variable due to the influence of driving behavior, external environment and other factors, and it is not enough to accurately represent the mobile source driving state by only relying on the monitoring data at a certain moment. Therefore, considering the influence of historical information on the calculation of emission factors at the current moment is the key to our modification of the COPERT model.
To address the aforementioned challenges in emission model construction, we propose a two-stream modification model based on the fusion of time-series and time-frequency features with historical information (HI_TTFTS). First, the actual emission factors of the OBD, using Spearman rank correlation analysis, are used to extract the correlation factors from the data volume for the measured data of the OBD, which are presented as not strictly continuous. Then, by utilizing the NOx emission factors alongside the corresponding attributes at the same time point, the historical information matrix is constructed. Subsequently, the continuous wavelet transform (CWT) is applied to obtain a multi-channel time-frequency matrix representation of the historical information. Finally, the two-stream model, consisting of ResNet and the convolutional block attention module (CBAM), is employed to incorporate both the time series matrix and the time-frequency matrix for model refinement. To assess the effectiveness of the proposed model, a comprehensive set of experiments was conducted. The results obtained from these experiments demonstrate the significant potential of our approach in accurately estimating NOx emission factors using online monitoring data from OBD vehicle networks. This innovative approach opens up new avenues for future research in this field.
The remaining parts of this paper are arranged as follows. We clarify the COPERT model and relevant deep learning models in Section 2. In Section 3, we present the details of the proposed time-frequency two-stream network model. The experiments and result analysis are presented in Section 4. Finally, we conclude the paper and discuss the future possible extending work in Section 5.
2. Related Works
2.1. COPERT
The development of the COPERT model was supported by funding from the European Environment Agency (EEA) to provide motor vehicle emissions data for the European National Atmospheric Emissions Inventory (NAEI). The model uses average speed to characterize vehicle travel characteristics and is based on a large number of test data, which are compatible with different national standards and parameter variables. Since China adopts European vehicle emission test protocols and regulatory systems similar to China, the COPERT model has good applicability in calculating Chinese motor vehicle exhaust emissions [26].
The emission factors for different pollutants under different standards, all as a function of velocity, are calculated as follows: [27].
where (g/km) is the emission factor of NOx; are the constant factors and (km/h) is the average speed on the road section. The values of the constant coefficients associated with the calculation of NOx emission factors under different standards are given in Table 2, and the paper is calculated for the Euro 5 standard.
2.2. Emission Factor Obtaining of NOx Based on OBD
In the actual monitoring of OBD, the specific values of emission factors cannot be obtained directly through monitoring, and it is necessary to calculate the reliable actual emission factors with the help of its related data, which is calculated as follows: [28].
where (g/kWh) is the emission factor of NOx and is the specific engine fuel consumption, which can be obtained based on bench or PEMS measurements, or by referring to the US EPA report (EPA-420-R-02-005) [29]. NOx (ppm) is the NOx volume concentration downstream of SCR read by the OBD; (L/h) is the engine fuel volume flow rate read by the OBD; and are the start and end of a driving time, respectively, (kg/L) is the density of the fuel used in the engine and (kg/h) is the instantaneous exhaust mass flow rate, which is calculated as follows.
where x, y and z are the molar ratio of carbon to carbon (C/C), the molar ratio of hydrogen to carbon (H/C) and the molar ratio of oxygen to carbon (O/C) in the fuel, respectively. According to GB17691-2018 [30], diesel is CH1.86O0.006; O2 (%) which is the volumetric concentration of O2 in the exhaust gas monitored by the OBD; is the density of ambient air at 0 °C and 101.3 kPa. The value is 1.293 kg/m3; for the exhaust density in kg/m3, according to GB17691-2018 [30]. The exhaust density of heavy-duty vehicles burning diesel is 1.2943 kg/m3.
To ensure consistency between the COPERT model and the OBD model in calculating emission factor units for heavy-duty diesel vehicles, a conversion factor of 1.27 [28] is applied to the OBD-calculated NOx emission factor to convert it from grams per kilowatt-hour (g/kWh) to grams per kilometer (g/km).
2.3. ResNet
The CNN model structure has a notable influence on the representational ability of the network. In recent years, there has been a proliferation of CNN network architectures, including notable ones such as AlexNet [31], GoogLeNet [32], VGGNet [33] and ResNet [34]. These architectures have been proposed successively to address various challenges. ResNet, in particular, introduces the concept of residual learning to mitigate the degradation problem encountered in deep networks, where increasing the number of layers leads to a decline in performance. By incorporating residual learning, ResNet enables deeper networks while maintaining accuracy and controlling computational speed. The key building block of ResNet is the residual unit, which is depicted in Figure 1.
Currently, ResNet is one of the most extensively employed networks for feature extraction. The ResNet family includes popular models such as ResNet18, ResNet34, ResNet50, ResNet101 and ResNet152. In this study, we have selected ResNet50 as the primary backbone network. The detailed architecture of ResNet50 is presented in Table 3.
2.4. Attention in CNN
In the cognitive process of things, attention helps the brain to automatically ignore low-value and low-likelihood information so as to think deeply about certain issues without being distracted by other things. With reference to this property, data scientists have carried out a series of studies on it in the field of deep learning [35,36]. In recent years, there have been numerous studies to improve the performance of CNNs by introducing attention mechanisms, which can be classified as a mixture of spatial attention, channel attention already spatial attention and channel attention according to their scopes.
For CNNs, each layer of the CNN outputs a feature map, where C represents the number of channels, and W and H represent their width and height. Spatial attention is assigned different weights to each point of the scale matrix for all channels, and the assigned weight represents the contribution of that point to the current task. STN [37] and DCN [38], as its representatives, have shown good performance. Unlike spatial attention, the channel attention mechanism applies a weight to each feature map on each channel, and this weight represents the relevance of each channel to the current task. The larger the value, the more important the channel is in the current task. Among the representative models are SENet [39] and ECANet [40].
Since both the spatial attention mechanism and channel attention mechanism can improve the performance of CNN networks to some extent, some scholars have considered combining the two, giving a greater boost to CNNs. The authors of [41] proposed a convolutional block attention module (CBAM), given an intermediate feature map, so that the network inferred the attention weights along the space and channel sequentially, and then multiplied with the original feature map to make adaptive adjustments to the features, and the overall structure of CBAM is shown in Figure 2.
It decomposes the original one-dimensional time-series signal into a two-dimensional time-frequency matrix by applying scaling and translation operations to the wavelet basis function.
2.5. Continuous Wavelet Transform
The continuous wavelet transform (CWT) is a versatile method for time-frequency analysis. It decomposes the original one-dimensional time-series signal into a two-dimensional time-frequency matrix by applying scaling and translation operations to the wavelet basis function [42]. A two-dimensional time-frequency matrix can be obtained by performing a continuous wavelet transform on a one-dimensional time-series signal. This matrix provides a comprehensive representation of the frequency information of the signal as it evolves over time. Equation (4) [43] illustrates the specific details of the CWT conversion for any function in the space.
where , a and are parameters representing stretching and translation, respectively.The function is a wavelet basis function derived from the mother wavelet through operations of stretching and translation.
3. Methodology
In this section, we focus on the specific introduction of the model. Refer to Figure 3, where we present a two-stream network model based on the fusion of time-series and time-frequency features of historical information to modify the COPERT model. Firstly, in view of the fact that the OBD data actually monitored are not strictly continuous in temporal terms, we divide the whole dataset into driving segments to obtain multiple continuous driving segments; Then, based on the amount of data in each driving segment, we use Spearman rank correlation analysis to select the correlation attributes with the emission factors of NOx obtained from the OBD data. Finally, the selected relevant attributes are used to construct the historical information matrix, and the corresponding historical information matrix is converted into a time-frequency matrix using CWT, and the historical information matrix and the time-frequency matrix are used as inputs in two parallel structures combined by ResNet50 and CBAM to complete the correction of the COPERT model and achieve the emission factor of NOx using the COPERT model on the OBD dataset.
3.1. Data Description
In this paper, the experiment uses the actual travel OBD data of a diesel vehicle collected in Hefei in 2020, the engine attributes and sampling standard of this diesel vehicle are shown in Table 4.
In the data preprocessing phase, the collected raw data underwent several steps. Initially, irrelevant attributes were removed, followed by anomalous records with values of 0 for vehicle speed, NOx concentration and instantaneous engine fuel consumption rate. Table 5 provides an overview of the attributes and their corresponding symbols in each dataset after the completion of the preprocessing stage.
3.2. Data Processing
In the actual correction phase of the COPERT model, we need data that are as continuous as possible in time series with complete labeling of each record. However, the OBD data collected for the actual road driving cannot be collected directly due to their inherent non-strict continuity in time series and the to be corrected and the as a label. We need to divide the pre-processed dataset into continuous driving segments and obtain the emission factors for NOx. The data processing methods in this paper are Driving Segment Division and Get Emission factor of NOx.
3.2.1. Driving Segment Division
Considering that the dataset consists of real-world driving data from a diesel vehicle collected across several days, it contains consecutive driving segments, resulting in a presentation of the data that is not strictly continuous. During preprocessing, irrelevant records were removed, causing a division in the continuous driving segments and further division in the already non-strictly continuous records. However, it is important to note that the records without delay preceding and following the removed erroneous records are still regarded as continuous. Therefore, It is essential to determine an optimal upper limit for the continuous time interval when partitioning the dataset into driving segments. This ensures that the impact of removing invalid data during preprocessing is minimized.
In this study, we have defined a maximum time interval of 180 s. Any records with intervals exceeding this threshold are considered as separate driving segments. After the initial screening, each piece of the drive contains a varying number of records. To ascertain that each selected driving segment is of sufficient length for calculating emission factors based on historical information, we have set the minimum number of records per segment to 180, which is equivalent to a duration of 15 min. The data volume for each segment is presented in Figure 4.
3.2.2. Obtaining NOx Emission Factors
In the process of obtaining emission factors, the emission factor for the k-th record is determined by considering the collective data from the first record to the kth record. The specific criteria for selecting k will be explained in more detail in Section 4. As we encounter the challenge of computing the NOx emission factor for the initial k-1 records within each driving segment during emission factor calculation, we initiate the process for each driving segment from the kth record onwards and align the computed emission factors and with the corresponding timestamps. Furthermore, our dataset lacks the measurement of the engine fuel volume flow rate , thus we derive using the following formula.
By using Equations (1)–(3), and were computed. The results are shown in Figure 5 (taking k = 48 as an example). The figure illustrates that, in the majority of data records, the peaks of are lower than those of , while the troughs are higher. Directly observing common characteristics of the two trends is challenging. This indicates a substantial disparity in the NOx emission factors calculated by the COPERT and OBD models. Simply deriving emission factors from the COPERT model and adjusting them to fit the OBD data using specific mathematical formulas is difficult.
3.3. Screening of Correlation Factors
The impact of each attribute derived from OBD data on the calculation of emission factors varies. Attributes with low correlations have minimal influence during the training of the model. This not only hampers the enhancement of model performance but also increases the number of model parameters. Thus, it is essential to choose factors that demonstrate strong correlations with before initiating model training.
In our work, Spearman correlation analysis is used by us to select the attributes that have high correlation with . Using Spearman correlation analysis for a continuous dataset, we can easily derive correlations among attributes using the t-value test; however, our data are multiple continuous driving segments and there are differences in data volume. Therefore, we propose a correlation factor screening based on the amount of data for each model.
The data correlation analysis for multiple driving segments is shown in Figure 3. We computed the direct Spearman correlation coefficients between and other factors (including ) in all driving segments separately and chose t = 1.645 for hypothesis testing to determine whether is strongly correlated with other attributes in that form segment. Based on this, we extracted all other driving segment attributes that were correlated with and constructed a correlation matrix C. Each row in C represents the correlation of each attribute in the driving segment with and , where 1 represents a strong correlation and 0 represents a weak correlation, and each column in C represented a specific attribute type. To accommodate variations in data volume across different driving segments, we generated a data volume matrix D. Each row in D corresponded to a specific driving segment, and the values in each column represented the data volume of that driving segment. We then computed the Hadamard product of matrices C and D (with C being the element-wise matrix of D). The values in the resulting matrix represent the correlation of each driving segment attribute with respect to based on the current amount of data. Finally, the summation of each column in this matrix yielded the correlation data volume matrix , which is visually depicted as illustrated below.
Within the equation, denotes the data quantity linked to for the i-th attribute, represents the data quantity associated with versus , and ⊙ signifies the Hadamard product. The data quantity for each attribute in is compared against the predefined threshold of correlation data . An attribute is considered strong correlation if . The final correlation attributes obtained are then combined with to obtain the final dataset.
3.4. Two-Stream Model Based on Historical Information
As shown above, we have constructed an input matrix based on the NOx emission factor about k-1 segment history information under multiple external factors. Briefly, each column of the input matrix represents one-dimensional time-series information of a certain attribute, which indicates that the whole matrix is from the time domain and is a time-series matrix containing multidimensional time-series information. To convert the one-dimensional temporal signal into a two-dimensional time-frequency matrix for each column of the input matrix, the Continuous Wavelet Transform (CWT) can be utilized. This transformed time-frequency matrix can represent both the time and frequency domain information of the information collected from heavy-duty diesel vehicles. It offers a clear representation of the correlation between signal frequency and temporal transformation.
3.4.1. Historical Information Matrix Construction
After the above series of operations, we get the driving segments that combine emission factors and keep only the attributes strongly related to . For each driving segment, with k as a step and as the label, In order to construct a historical information matrix, we take the driving segment with k = 3 and length m as a representative example. Within each matrix, the first two records represent the historical information, while the third record represents the current information. The corresponding value for the current information is used as the label. This procedure yields a total of m − 2 matrices, as shown in Figure 6.
3.4.2. CWT
For each column in the historical information matrix, the application of the continuous wavelet transform allows for the conversion of the one-dimensional time-series signal into a two-dimensional time-frequency matrix. This transformation facilitates the visualization of the emission attribute signals from the mobile source, revealing their characteristics in both the time and frequency domains. It provides a clear depiction of the relationship between signal frequency transformation and time. CWT is performed on a historical information matrix (k = 48, = Q2), and the resulting time-frequency matrix is visualized as shown in Figure 7.
For CWT, the choice of wavelet basis functions has a large impact on the effect of wavelet transform. To evaluate the conversion effect of CWT, for a variety of wavelet basis functions, we consider the converted time-frequency matrix as a gray-scale map, and based on the amount of data, we construct a quality index () index using information entropy (IE) and Laplacian gradient (LG) to evaluate its converted time-frequency map, where IE is used to measure the uncertainty of the information source and LG is used to evaluate the clarity of the gray-scale map. The formulaic description of the quality index () is as follows:
In the provided equation, represents the number of features, while denotes the cardinality of the combined training and validation datasets. The expression is utilized to quantify the relative frequency of grayscale values with pixel value i in an image of dimensions mn, where the grayscale range spans from 0 to 255. In this context, signifies the occurrence count of pixel value i within the image. The symbol represents the convolution operation involving the Laplacian operator at the pixel coordinate (x, y), and Laplacian operator .
By using the indicator, the quality of each wavelet basis function is shown Figure 8 (k = 48), where the mexh wavelet basis function has the largest value and the best conversion. Therefore, the function will be used for the continuous wavelet transform in the subsequent experiments of this paper. After CWT, the time-frequency matrix obtained for each relevant attribute and is superimposed into a multi-channel matrix as the final time-frequency stream input.
3.4.3. Two Stream
In this paper, we use a combination of ResNet50 and CBAM to extract historical features. The CBAM module is added after the stage four output.
The two stream models use a combination of two parallel Resnet50 and CBAM, and after averaging the pooling layers, the output size of the two stream models is , which is reshaped to , and then the reshaped features are fused. Feature fusion is a mid-level fusion between data fusion and decision fusion [44]. It can eliminate redundant information due to correlation between different feature sets. The features extracted from the time-series stream and the time-frequency stream are fused and the strategy is defined as follows.
where b represents the bath sequence number, T is the temporal flow characteristics and is the time-frequency flow characteristics.
After passing through the feature fusion layer, the model can obtain a more comprehensive and accurate evaluation structure. Finally, the fused feature vectors are fed into the FC layer to achieve one regression prediction. The loss function is as follows, where the first term MSE is used to ensure the prediction performance in training and the second term norm is used to prevent overfitting.
where , w is the weight, b is the bias, y is the label and is the model prediction.
4. Experiments
In this study, we employ Min–Max normalization to standardize the dataset. The dataset is then divided into training, validation and test sets in a ratio of 7:2:1. During training, a batch size of 64 is used, and the Adam optimizer is applied with a learning rate of 0.0001. The maximum number of iterations is set to 200. Evaluation metrics, including MAE, RMSE and MAPE, are used to assess the model’s performance. Training is stopped if the loss fails to decrease for 15 consecutive iterations. The values of each metric are the average values of five repeated experiments.
4.1. Historical Information Step Setting
For our method, the length k of historical information has an important impact on the performance of the model. A too short length k will make the historical information not be considered completely enough, resulting in a lower performance of the trained model. A too long length k will cause the constructed historical information matrix to carry too much information and increase the unnecessary computation. Therefore, the determination of the value of the historical information step k in the model is particularly important, however, the existing theoretical knowledge does not support us to make a direct determination of the value of k. Therefore, we design to use different values of k to experiment on the two-stream model to select the optimal k.
We experimented in the case of for the deletion of any attributes. Historical information is determined at intervals of 1 min (12 records) to obtain the historical information set , where the numbers represent the amount of data that make up a matrix. The experimental results are shown in Table 6.
4.2. Setting of Correlation Data Volume
The amount of relevant data, , is also an important parameter for the performance of the model. In this paper, the candidate set of is set to consist of quartiles of uncensored attributes and total data volume = [0, Q1, Q2, Q3], which is experimented with k = 48, and the relevance of each attribute at k = 48 is shown in Table 7.
As shown in Table 7, if setting the amount of relevant data is set to 25% (Q1) of the total data, only the attribute AP needs to be removed from all attributes; if setting the amount of relevant data is set to 50% (Q2) of the total data, the four attributes AP, , UTL and UTT are removed from all attributes. If it is set to 75% (Q3) of the total data, the attributes , AOTP, EWT, NOx, AP, ET, , UTL, UTT, GPO, EFCR, , BV, FTL and CER are removed from all attributes.
The experimental results are shown in Table 8, where 0 means no irrelevant factor deletion is performed. From Table 8, we can see that only one attribute of AP is deleted in Q1, so the model performance is similar to that of the model without irrelevant factor deletion, and the best performance of the model is at Q2, which has the smallest index, and the rest of the relevant data volume has a significant gap compared with it. Therefore, we finally choose the relevant data volume as Q2.
4.3. Ablation Experiments
In order to verify the validity of the module models in this paper, we perform relevant ablation experiments with the already selected parameters k = 48, = Q2, where the main experimental models are as follows.
- (a)
- ResNet50: single-stream resnet50 with the historical information matrix as input.
- (b)
- ResNet50 (CBAM): Resnet50 of a single stream combined with CBAM, with the historical information matrix as input.
- (c)
- HI_TTFTS (without CBAM): two-stream model composed of two resnet50, the two-stream inputs are the historical information matrix and the time-frequency matrix, respectively.
- (d)
- HI_TTFTS (left): two-stream model composed of two resnet50, left combined with CBAM, the left input is the historical information matrix and the right input is the time-frequency matrix.
- (e)
- HI_TTFTS (right): two-stream model composed of two resnet50, right combines CBAM, the left input is the historical information matrix, and the right input is the time-frequency matrix.
- (f)
- HI_TTFTS (all): two-stream model composed of two resnet50, respectively, with CBAM, the left input is the historical information matrix and the right input is the time-frequency matrix.
The results of the ablation experiments are shown in Table 9, and the RMSE, MAE and MAPE metrics obtained for each model experiment show that the HI_TTFTS (CBAM) model obtains a richer feature representation using two streams of time-frequency and time-sequence streams in parallel, while the key information for making modifications to the COPERT model is obtained from the large amount of information by adding the CBAM module to both streams, and its model performance is better than the other five models. Specifically, by comparing the ResNet50 (CBAM) and Resnet50 models, it can be seen that CBAM brings a positive effect on the correction of emission factors for the ResNet model, which can improve its performance; and by comparing the ResNet50 and Two stream (without cbam) models, it can be seen that the positive effect of the two-stream model on the model performance improvement. Finally, by comparing HI_TTFTS (without CBAM), HI_TTFTS (left) and HI_TTFTS (right), the performance of the model can be improved to some extent by adding the CBAM module to any stream in the two streams, while the multi-channel time-frequency matrix obtained by CWT through transforming the historical information matrix brings the number of parametric larger and more informative feature representation, it is easier to obtain an effective feature map representation by imposing an attention mechanism on the informative time-frequency stream, which makes the HI_TTFTS (right) model perform slightly better than the HI_TTFTS (left) model.
4.4. Comparative Experiment
To verify the excellent performance of our proposed model for COPERT correction, we selected the following mainstream models for comparison with our proposed dual-flow model based on historical information.
- (a)
- Support Vector Regression (SVR): only consider the influence of each attribute on the emission factor at the current moment, the input data is only the combination of each attribute and EF at the current moment.
- (b)
- Artificial Neural Network (ANN): only consider the influence of each attribute on the emission factor at the current moment, the input data is only the combination of each attribute and EF at the current moment.
- (c)
- Convolutional Neural Network (CNN): A general CNN model with time-frequency matrix as input.
- (d)
- TF: ResNet50 model with time-frequency matrix as input.
- (e)
- TSFF: Each column of the historical information matrix is pieced together into a 6*8 matrix [44] and multi-channel superposition is performed with dual-stream inputs of the historical information matrix and the constructed 2D construction matrix, respectively, to a parallel structure combining ResNet50 and CBAM.
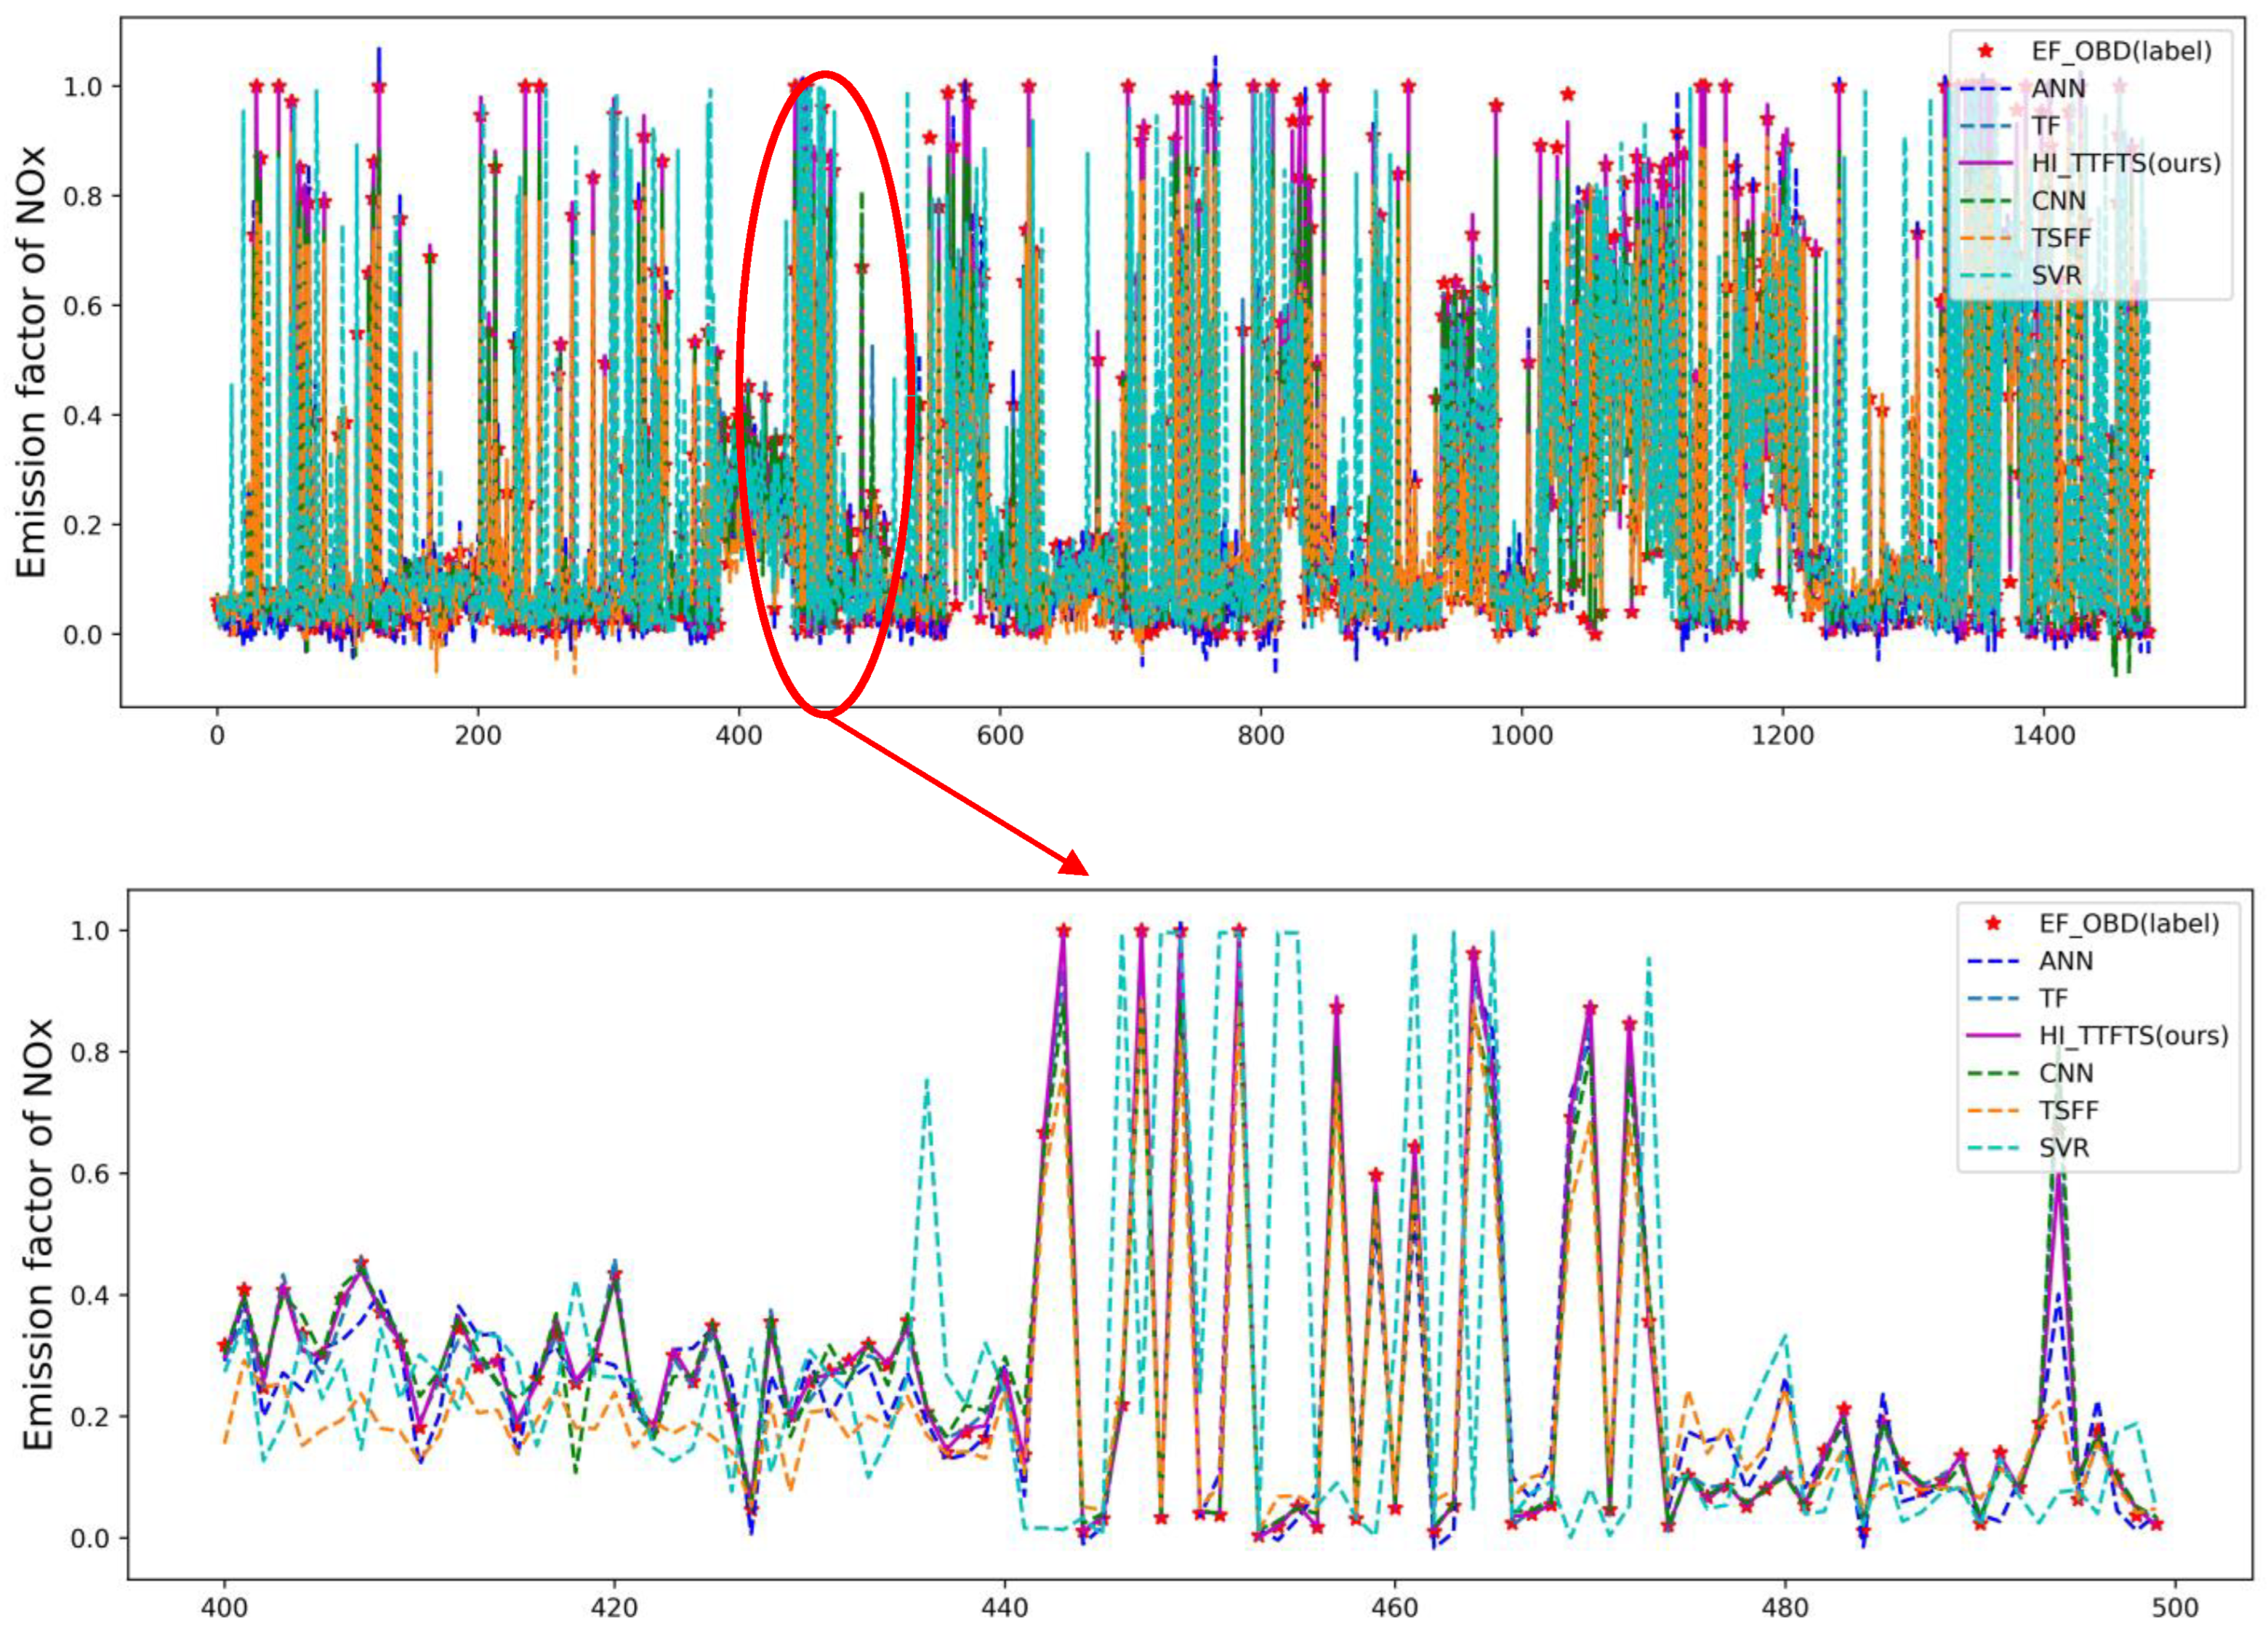
With mae, mape and rmse as evaluation indicators, the experimental results are shown in Table 10, and HI_TTFTS (ours) has the best indicators. Specifically, SVR has the worst effect and ANN is the second best, which is due to the fact that both SVR model and ANN model do not take the historical information matrix as input, and only consider the influence of each attribute on NOx emission at the current moment, and the correction effect is poor, while ANN can obtain better performance by training with sufficient amount of data; In the case of considering the influence of historical information, the CNN is limited by the network structure, and the model performance is poor, while the two-stream method TSFF, which constructs a two-dimensional matrix by splicing to obtain richer information, is second, and the time-frequency conversion is more informative than the method of splicing to construct a two-dimensional matrix, so the effect is better. Our proposed method combines the CBAM module on the basis of time-frequency stream ResNet50, and obtains the best performance by supplementing the time-frequency information with the new time-series history matrix.
Figure 10 shows the prediction results of each model corrected for COPERT, and we have chosen points in the range of 400–500 in the test set to show the details, from which we can see that the HI_TTFTS proposed in this paper fits better with .
5. Conclusions
In order to perform an accurate NOx emission factor calculation on the OBD online monitoring dataset using the COPERT model, we propose a two-stream amendment model based on the fusion of time-series and time-frequency features with historical information (HI_TTFTS). The model uses Spearman’s rank correlation analysis based on data volume, which solves the situation that the actual dataset presents multiple consecutive segments in the time series, which makes the correlation analysis complicated. Our proposed model considers the influence of historical information on current moment emissions, and the historical information matrix and the corresponding time-frequency matrix are constructed as inputs to the parallel ResNet50 and CBAM combined network. This approach achieves the fusion of temporal features and two-dimensional time-frequency features, which improves the COPERT model correction effect. By comparing our model with mainstream models, we have verified its more stable performance and reliable prediction accuracy.
In this study, we used data from a diesel vehicle for about six months for the experiment. Due to the limitation of the difficulty of dataset collection, we could not obtain more data. Therefore, our conclusions may be limited by the size of the data and the model of the car being taken, and we hope that we can further improve the quality of the data in the later studies to support us to get more generalizable results. In addition, the spatial and temporal features are not considered separately in this work, but are treated as one kind of feature, and in future research, the temporal and spatial features can be considered separately to carry out more in-depth research.
Author Contributions
Conceptualization, Z.X. and R.W.; methodology, Z.X. and R.W.; software, K.P.; validation, J.L.; formal analysis, K.P. and Q.W.; investigation, K.P.; resources, Q.W.; data curation, K.P.; writing–original draft preparation, Z.X.; writing–review and editing, J.L.; visualization, K.P.; supervision, Z.X.; project administration, Z.X.; funding acquisition, Z.X. All authors have read and agreed to the published version of the manuscript.
Funding
This work was supported in part by the National Natural Science Foundation of China (62103124, 62033012), Open Project Program of Key Laboratory of Ministry of Education of System Control and Information Processing (grant No. SCIP20230109).
Institutional Review Board Statement
Not applicable.
Informed Consent Statement
Not applicable.
Data Availability Statement
The datasets used in this study will be available from the corresponding author upon reasonable request.
Conflicts of Interest
The authors declare no conflict of interest.
References
- Ministry of Ecology and Environment of the People’s Republic of China. China Mobile Source Environmental Management Annual Report; Ministry of Ecology and Environment of the People’s Republic of China: Beijing, China, 2021.
- US Environmental Protection Agency. User’s Guide to MOBILE6.1 and MOBILE6.2: Mobile Source Emission Factor Model (EPA Report EPA-420-R-03-010); Office of Transportation and Air Quality: Washington, DC, USA, 2003.
- California Air Resources Board. EMFAC2021 User’s Guide; California Environmental Protection Agency: Sacramento, CA, USA, 2021.
- Ntziachristos, L.; Gkatzoflias, D.; Kouridis, C.; Samaras, Z. COPERT: A European road transport emission inventory model. In Information Technologies in Environmental Engineering: Proceedings of the 4th International ICSC Symposium, Thessaloniki, Greece, 28–29 May 2009; Springer: Heidelberg/Berlin, Germany, 2009; pp. 491–504. [Google Scholar]
- Lents, J.; Davis, N. IVE Model User’s Guide, Model and Data Files; Technical Report Submitted to the US Environmental Protection Agency; US Environmental Protection Agency: Washington, DC, USA, 2009.
- Scora, G.; Barth, M. Comprehensive Modal Emissions Model (CMEM), Version 3.01. User Guide; Centre for Environmental Research and Technology, University of California: Riverside, CA, USA, 2006; Volume 1070, p. 1580. [Google Scholar]
- Vallamsundar, S.; Lin, J. Overview of US EPA new generation emission model: MOVES. Int. J. Transp. Urban Dev. 2011, 1, 39. [Google Scholar]
- Söderena, P.; Laurikko, J.; Weber, C.; Tilli, A.; Kuikka, K.; Kousa, A.; Väkevä, O.; Venho, A.; Haaparanta, S.; Nuottimäki, J. Monitoring Euro 6 diesel passenger cars NOx emissions for one year in various ambient conditions with PEMS and NOx sensors. Sci. Total Environ. 2020, 746, 140971. [Google Scholar] [CrossRef] [PubMed]
- Oluwaseyi, M.M.; Sunday, A.M. Specifications and analysis of digitized diagnostics of automobiles: A case study of on board diagnostic (OBD II). Int. J. Eng. Res. Technol. 2020, 9, 91–105. [Google Scholar] [CrossRef]
- Quirama, L.F.; Giraldo, M.; Huertas, J.I.; Jaller, M. Driving cycles that reproduce driving patterns, energy consumptions and tailpipe emissions. Transp. Res. Part Transp. Environ. 2020, 82, 102294. [Google Scholar] [CrossRef]
- Yang, D.; Zhang, S.; Niu, T.; Wang, Y.; Xu, H.; Zhang, K.M.; Wu, Y. High-resolution mapping of vehicle emissions of atmospheric pollutants based on large-scale, real-world traffic datasets. Atmos. Chem. Phys. 2019, 19, 8831–8843. [Google Scholar] [CrossRef]
- Wang, S.; Li, Z.; Tan, J.; Guo, W.; Li, L. A method for estimating carbon dioxide emissions based on low frequency GPS trajectories. In Proceedings of the 2017 Chinese Automation Congress (CAC), Jinan, China, 20–22 October 2017; pp. 1960–1964. [Google Scholar]
- Kumar, K.; Pande, B.P. Air pollution prediction with machine learning: A case study of Indian cities. Int. J. Environ. Sci. Technol. 2023, 20, 5333–5348. [Google Scholar] [CrossRef]
- Wang, Z.; Guan, W.; Bi, J.; Ma, J. Microscopic emission model of motor vehicle based on short-time real driving cycle. Chin. J. Environ. Eng. 2016, 10, 5803–5807. [Google Scholar]
- Xu, Z.; Kang, Y.; Cao, Y.; Li, Z. Deep amended COPERT model for regional vehicle emission prediction. Sci. China Inf. Sci. 2021, 64, 1–3. [Google Scholar] [CrossRef]
- Yang, L.; Zhang, S.; Wu, Y.; Chen, Q.; Niu, T.; Huang, X.; Zhang, S.; Zhang, L.; Zhou, Y.; Hao, J. Evaluating real-world CO2 and NOx emissions for public transit buses using a remote wireless on-board diagnostic(OBD) approach. Environ. Pollut. 2016, 218, 453–462. [Google Scholar] [CrossRef]
- Xu, Z.; Wang, R.; Kang, Y.; Zhang, Y.; Xia, X.; Wang, R. A Deep Transfer NOx Emission Inversion Model of Diesel Vehicles with Multisource External Influence. J. Adv. Transp. 2021, 2021, 4892855. [Google Scholar] [CrossRef]
- Molina Campoverde, J.J. Driving mode estimation model based in machine learning through PID’s signals analysis obtained from OBD II. Int. Conf. Appl. Technol. 2020, 80–91. [Google Scholar]
- Rivera-Campoverde, N.D.; Muñoz-Sanz, J.L.; Arenas-Ramirez, B.d.V. Estimation of pollutant emissions in real driving conditions based on data from OBD and machine learning. Sensors 2021, 21, 6344. [Google Scholar] [CrossRef] [PubMed]
- Wang, J.; Wang, L.; Ji, Z.; Qi, S.; Xie, Z.; Yang, Z.; Zhang, X. Research on Actual Road Emission Prediction Model of Heavy-Duty Diesel Vehicles Based on OBD Remote Method and Artificial Neural Network. J. Phys. Conf. Ser. 2021, 2005, 23–25. [Google Scholar] [CrossRef]
- Chen, S.H.; Pan, J.S.; Lu, K. Driving behavior analysis based on vehicle OBD information and adaboost algorithms. In Proceedings of the International Multiconference of Engineers and Computer Scientists, Hong Kong, China, 18–20 March 2015; Volume 1, pp. 18–20. [Google Scholar]
- Liu, Y.H.; Liao, W.Y.; Li, L.; Huang, Y.T.; Xu, W.J. Vehicle emission trends in China’s Guangdong Province from 1994 to 2014. Sci. Total Environ. 2017, 586, 512–521. [Google Scholar] [CrossRef] [PubMed]
- Sun, S.; Jiang, W.; Gao, W. Vehicle emission trends and spatial distribution in Shandong province, China, from 2000 to 2014. Atmos. Environ. 2016, 147, 190–199. [Google Scholar] [CrossRef]
- D’Angiola, A.; Dawidowski, L.E.; Gómez, D.R.; Osses, M. On-road traffic emissions in a megacity. Atmos. Environ. 2010, 44, 483–493. [Google Scholar] [CrossRef]
- Wang, R.; Xia, X.; Xu, Z. Heavy-Duty Emission Prediction Model Using Wavelet Features and ResNet. In Proceedings of the Asian Simulation Conference, Changsha, China, 9–11 December2022; pp. 525–537. [Google Scholar]
- Cai, H.; Xie, S. Estimation of vehicular emission inventories in China from 1980 to 2005. Atmos. Environ. 2007, 41, 8963–8979. [Google Scholar] [CrossRef]
- Li, R.; Yang, F.; Liu, Z.; Shang, P.; Wang, H. Effect of taxis on emissions and fuel consumption in a city based on license plate recognition data: A case study in Nanning, China. J. Clean. Prod. 2019, 215, 913–925. [Google Scholar] [CrossRef]
- Nelson English, Loxton, and Andrews Pty. Ltd. A Review of Dynamometer Correlations, In-service Strategies and Engine Deterioration; National Environment Protection Council: Adelaide, Australia, 2000.
- US EPA (US Environmental Protection Agency). Analysis of BSFCs and Calculation of Heavy-Duty Engine Emission Conversion Factors. EPA-420-R-02-005; US EPA: Washington DC, USA, 2002.
- GB 17691-2018; Limits and Measurement Methods for Emissions from Diesel Fueled Heavy-Duty Vehicles (CHINA VI). Ministry of Ecology and Environment of People’s Republic of China: Beijing, China, 2018.
- Krizhevsky, A.; Sutskever, I.; Hinton, G.E. Imagenet classification with deep convolutional neural networks. Adv. Neural Inf. Process. Syst. 2012, 60, 84–90. [Google Scholar] [CrossRef]
- Szegedy, C.; Liu, W.; Jia, Y.; Sermanet, P.; Reed, S.; Anguelov, D.; Erhan, D.; Vanhoucke, V.; Rabinovich, A. Going deeper with convolutions. In Proceedings of the IEEE Conference on Computer Vision and Pattern Recognition, Boston, MA, USA, 7–12 June 2015; pp. 1–9. [Google Scholar]
- Yue-Hei Ng, J.; Hausknecht, M.; Vijayanarasimhan, S.; Vinyals, O.; Monga, R.; Toderici, G. Beyond short snippets: Deep networks for video classification. In Proceedings of the IEEE Conference on Computer Vision and Pattern Recognition, Boston, MA, USA, 7–12 June 2015; pp. 4694–4702. [Google Scholar]
- He, K.; Zhang, X.; Ren, S.; Sun, J. Deep residual learning for image recognition. In Proceedings of the IEEE Conference on Computer Vision and Pattern Recognition, Boston, MA, USA, 7–12 June 2015; pp. 770–778. [Google Scholar]
- Guo, M.; Xu, T.; Liu, J.; Liu, Z.; Jiang, P.; Mu, T.; Zhang, S.; Martin, R.; Cheng, M.; Hu, S. Attention mechanisms in computer vision: A survey. Comput. Vis. Media 2022, 8, 331–368. [Google Scholar] [CrossRef]
- Hu, D. An introductory survey on attention mechanisms in NLP problems. In Proceedings of the SAI Intelligent Systems Conference, London, UK, 5–6 September 2019; Volume 2, pp. 432–448. [Google Scholar]
- Jaderberg, M.; Simonyan, K.; Zisserman, A. Spatial transformer networks. Adv. Neural Inf. Process. Syst. 2015, 2, 2017–2025. [Google Scholar]
- Almahairi, A.; Ballas, N.; Cooijmans, T.; Zheng, Y.; Larochelle, H.; Courville, A. Dynamic capacity networks. In Proceedings of the International Conference on Machine Learning, New York, NY, USA, 19–24 June 2016; pp. 2549–2558. [Google Scholar]
- Hu, J.; Shen, L.; Sun, G. Squeeze-and-excitation networks. In Proceedings of the IEEE Conference on Computer Vision and Pattern Recognition, Salt Lake City, UT, USA, 18–29 June 2018; pp. 7132–7141. [Google Scholar]
- Wang, Q.; Wu, B.; Zhu, P.; Li, P.; Zuo, W.; Hu, Q. ECA-Net: Efficient channel attention for deep convolutional neural networks. In Proceedings of the IEEE/CVF Conference on Computer Vision and Pattern Recognition, Seattle, WA, USA, 13–19 June 2018; pp. 11534–11542. [Google Scholar]
- Woo, S.; Park, J.; Lee, J.Y.; Kweon, I.S. Cbam: Convolutional block attention module. In Proceedings of the European Conference on Computer Vision (ECCV), Munich, Germany, 8–14 September 2018; pp. 3–19. [Google Scholar]
- Yoo, Y.; Baek, J. A novel image feature for the remaining useful lifetime prediction of bearings based on continuous wavelet transform and convolutional neural network. Appl. Sci. 2018, 8, 1102. [Google Scholar] [CrossRef]
- Miao, R.; Gao, Y.; Ge, L.; Jiang, Z.; Zhang, J. Online defect recognition of narrow overlap weld based on two-stage recognition model combining continuous wavelet transform and convolutional neural network. Comput. Ind. 2019, 112, 103115. [Google Scholar] [CrossRef]
- Xue, F.; Zhang, W.; Xue, F.; Li, D.; Xie, S.; Fleischer, J. A novel intelligent fault diagnosis method of rolling bearing based on two-stream feature fusion convolutional neural network. Measurement 2021, 176, 109226. [Google Scholar] [CrossRef]
Figure 1.
Structure of the residual module.
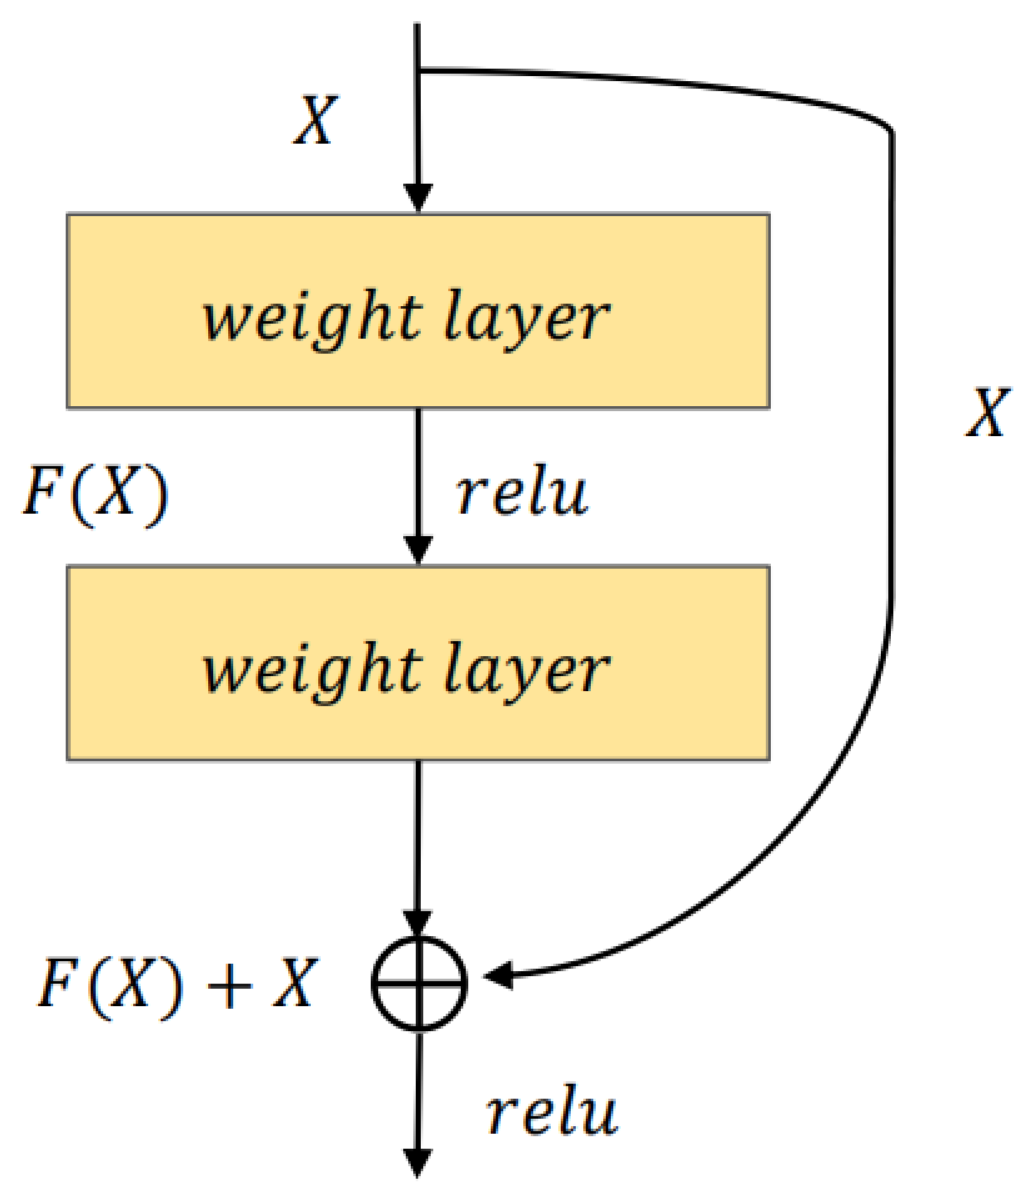
Figure 2.
Structure of the CBAM (Convolutional Block Attention Module).
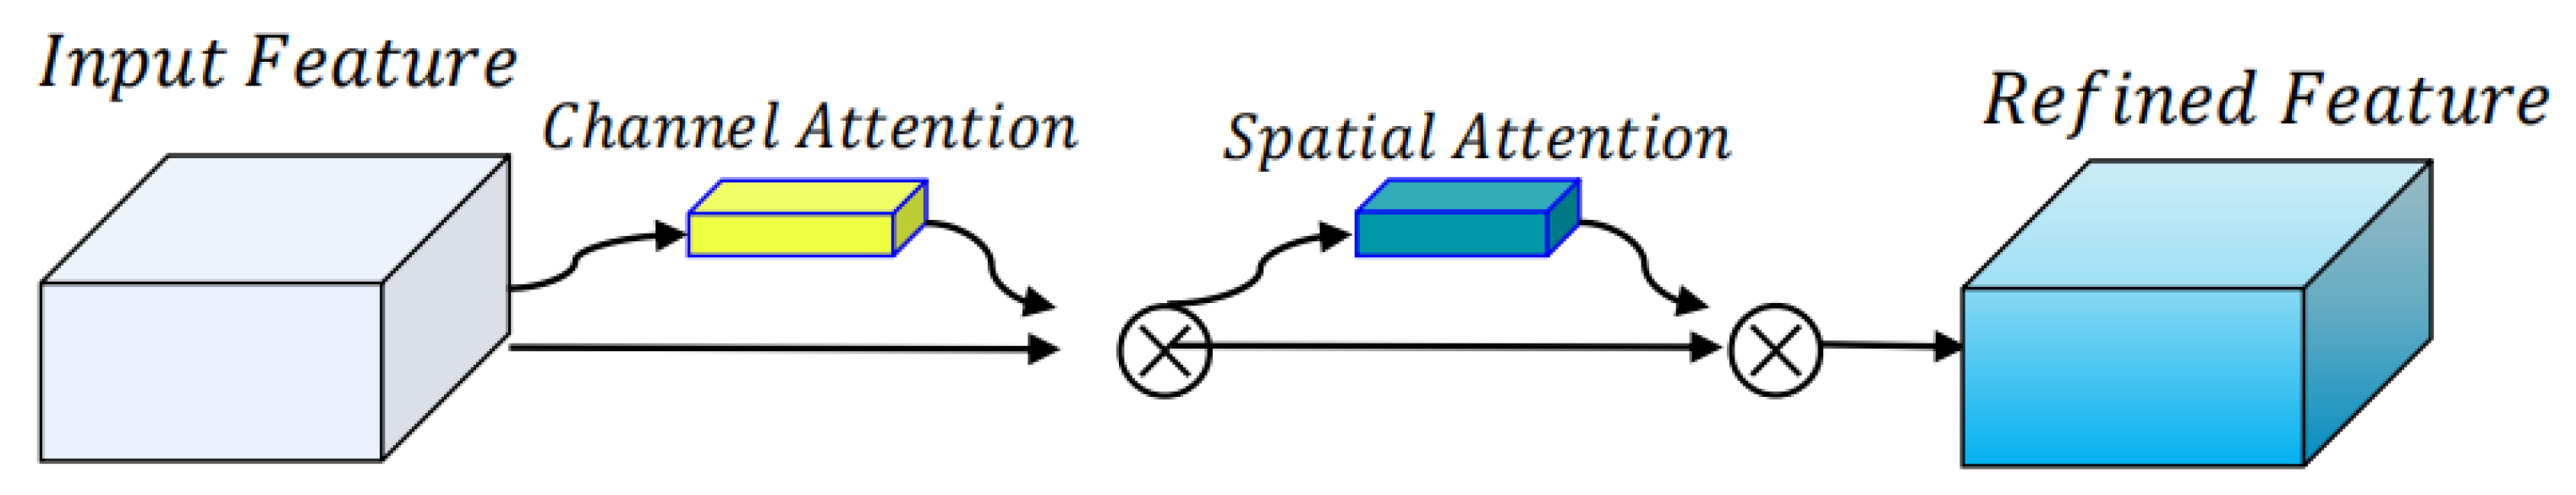
Figure 3.
The architecture of the HI_TTFTS network.
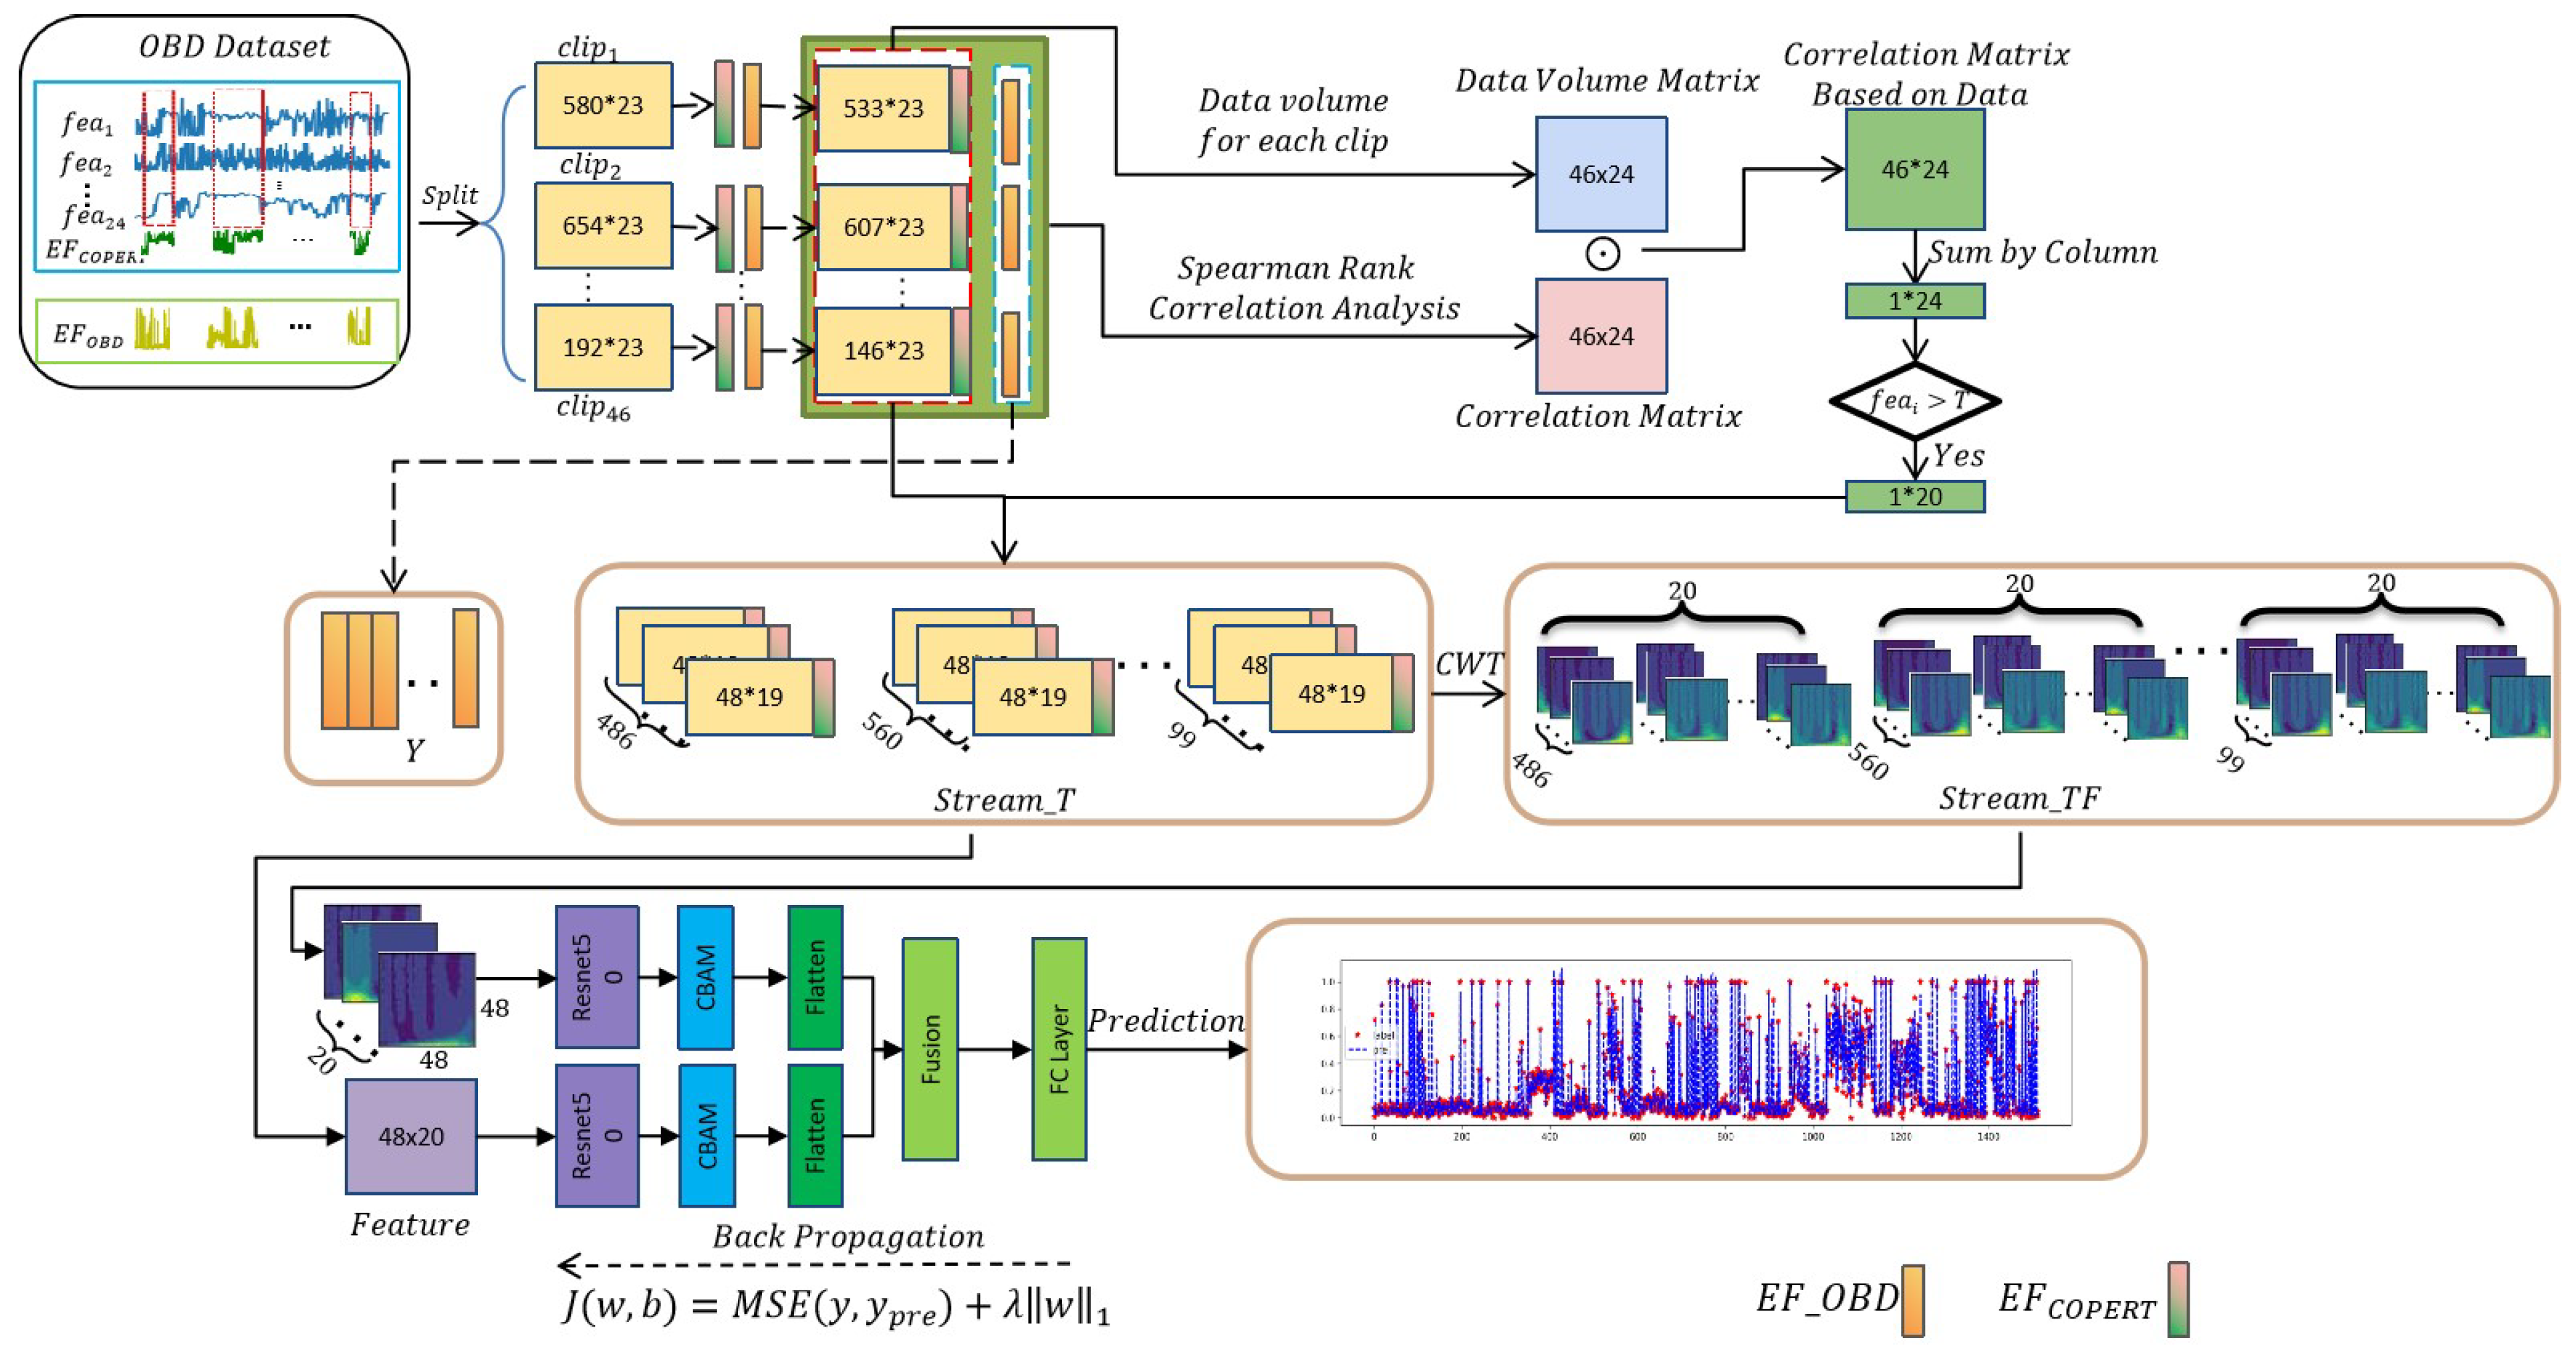
Figure 4.
Valid Driving Clip.
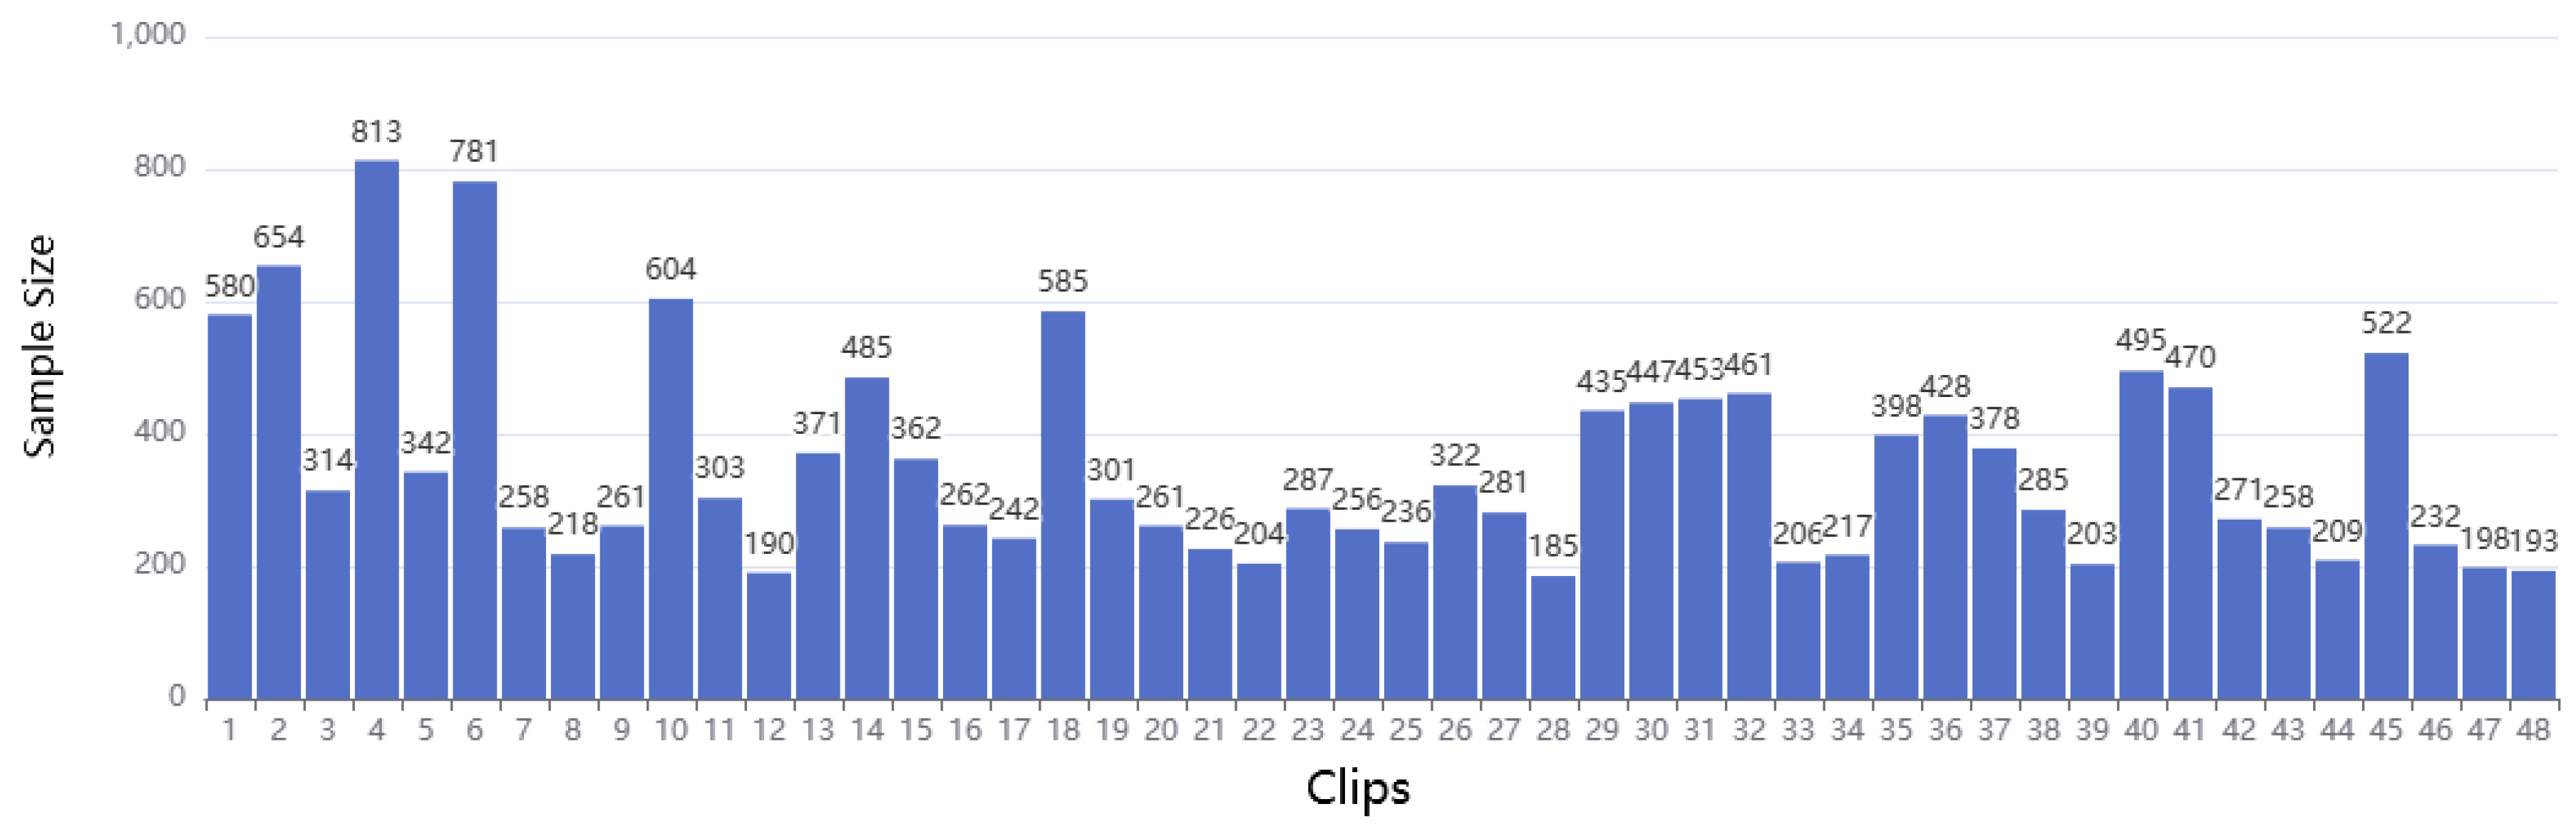
Figure 5.
Emission factors of NOx.
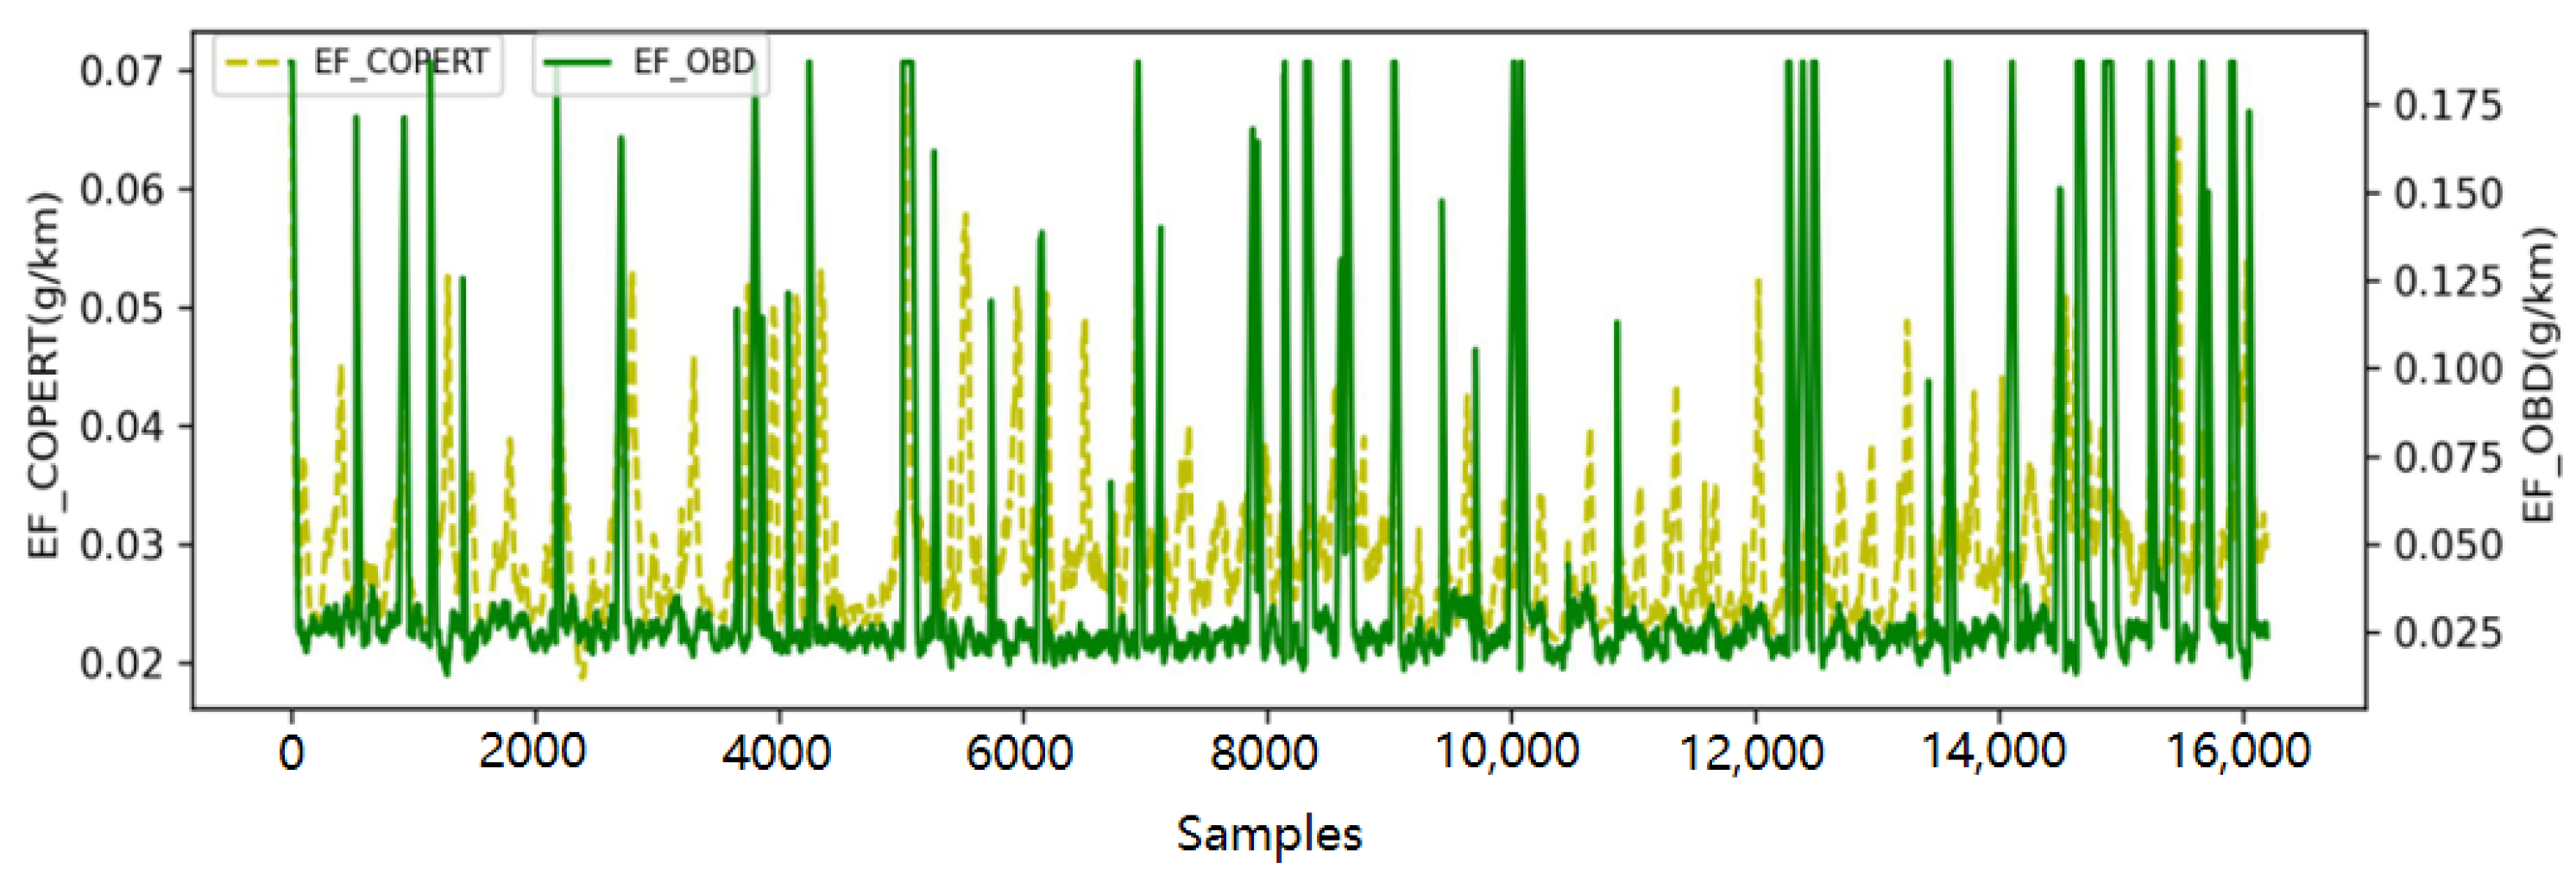
Figure 6.
History Information Matrix Construction Process.
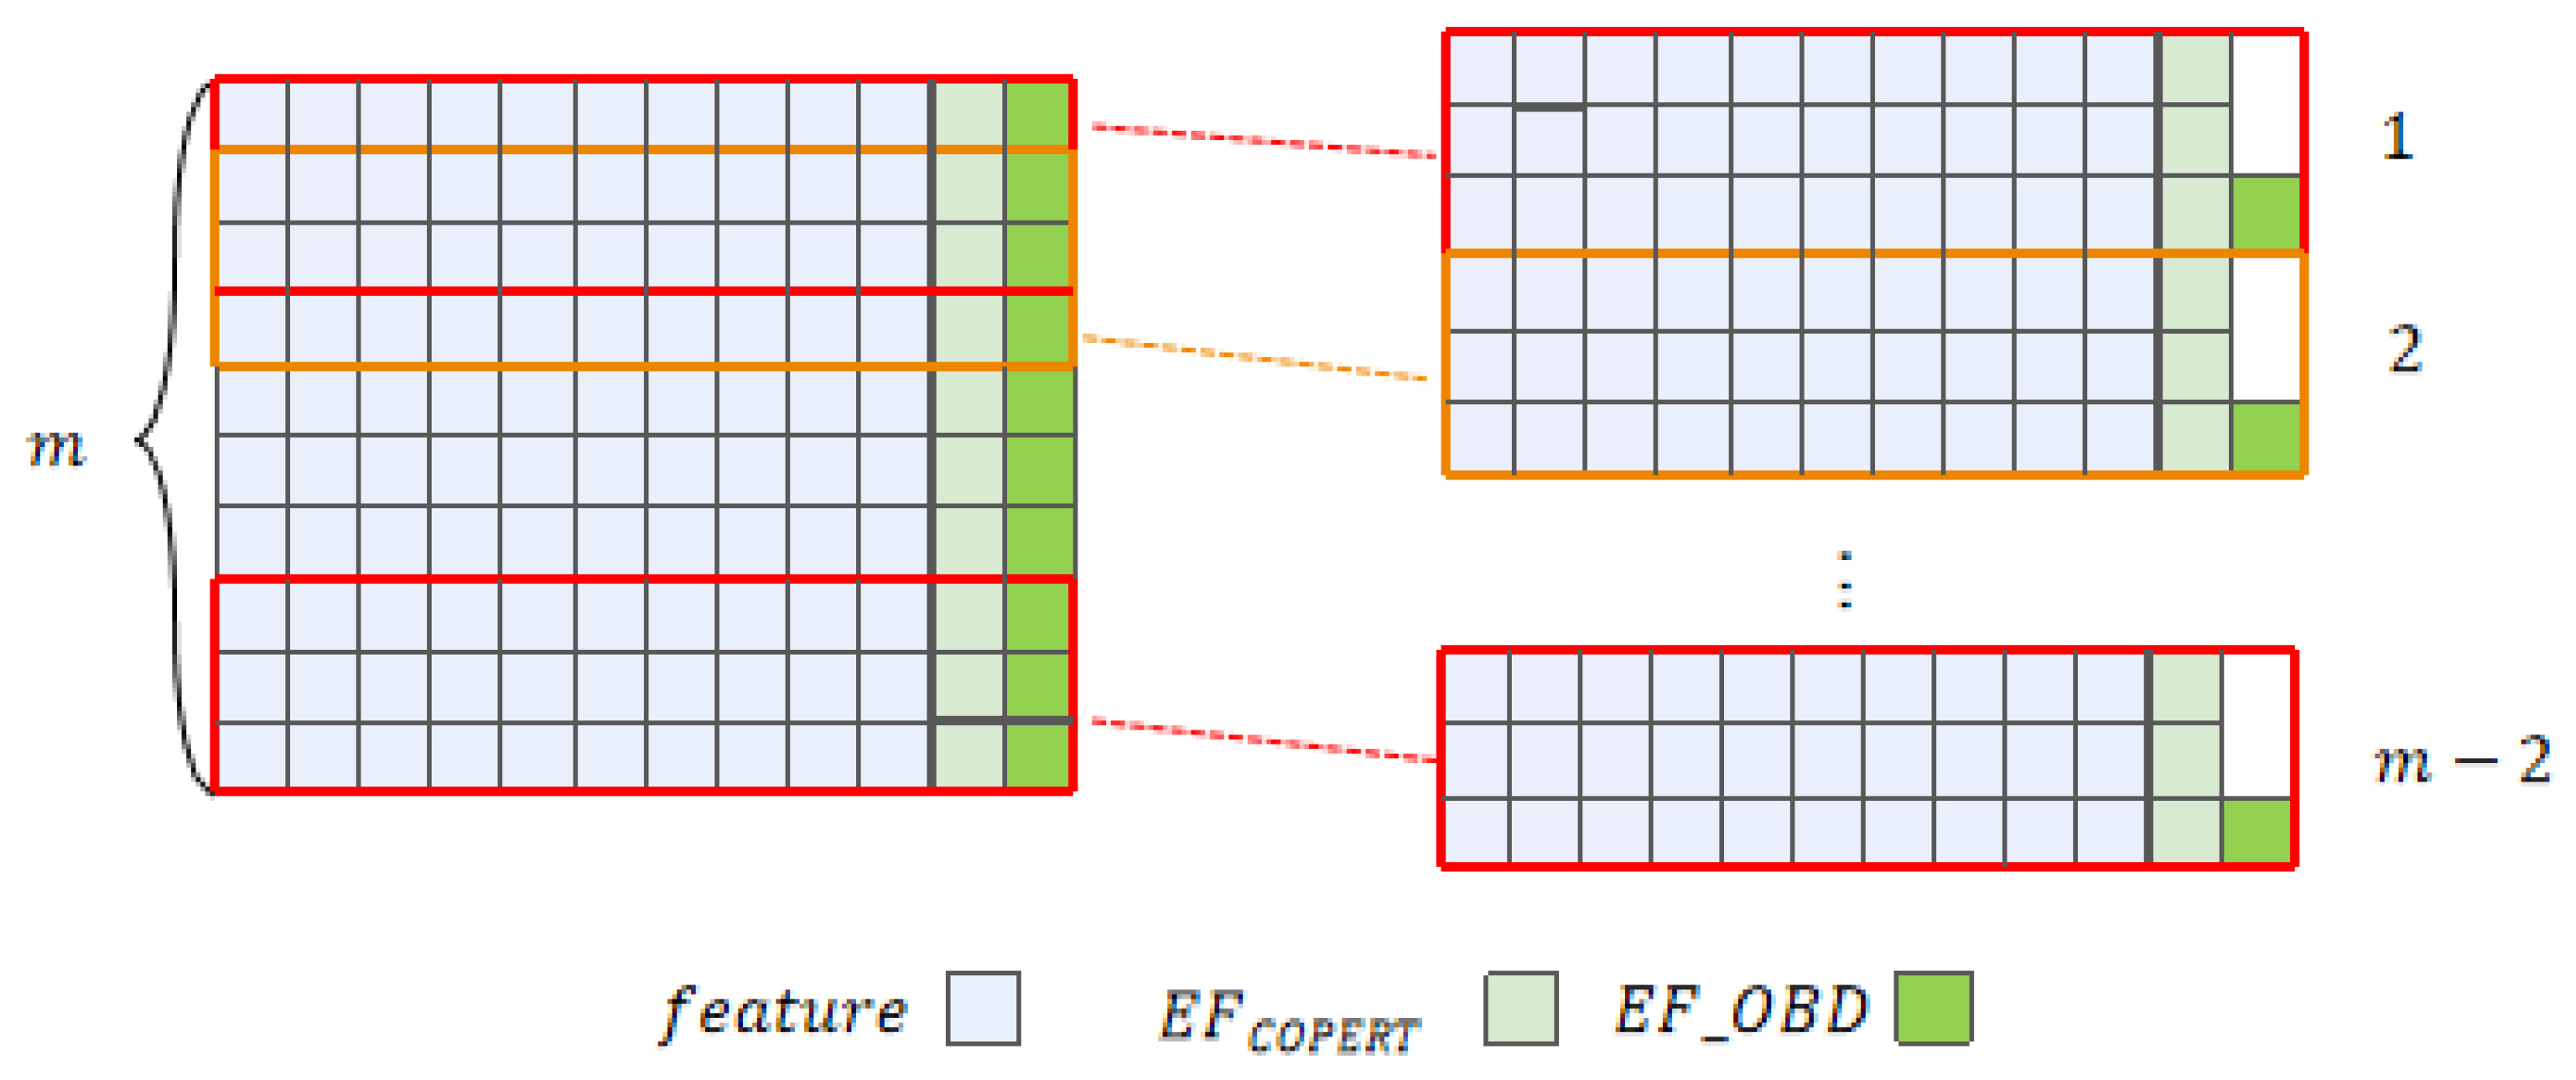
Figure 7.
Visualization of the time-frequency matrices.
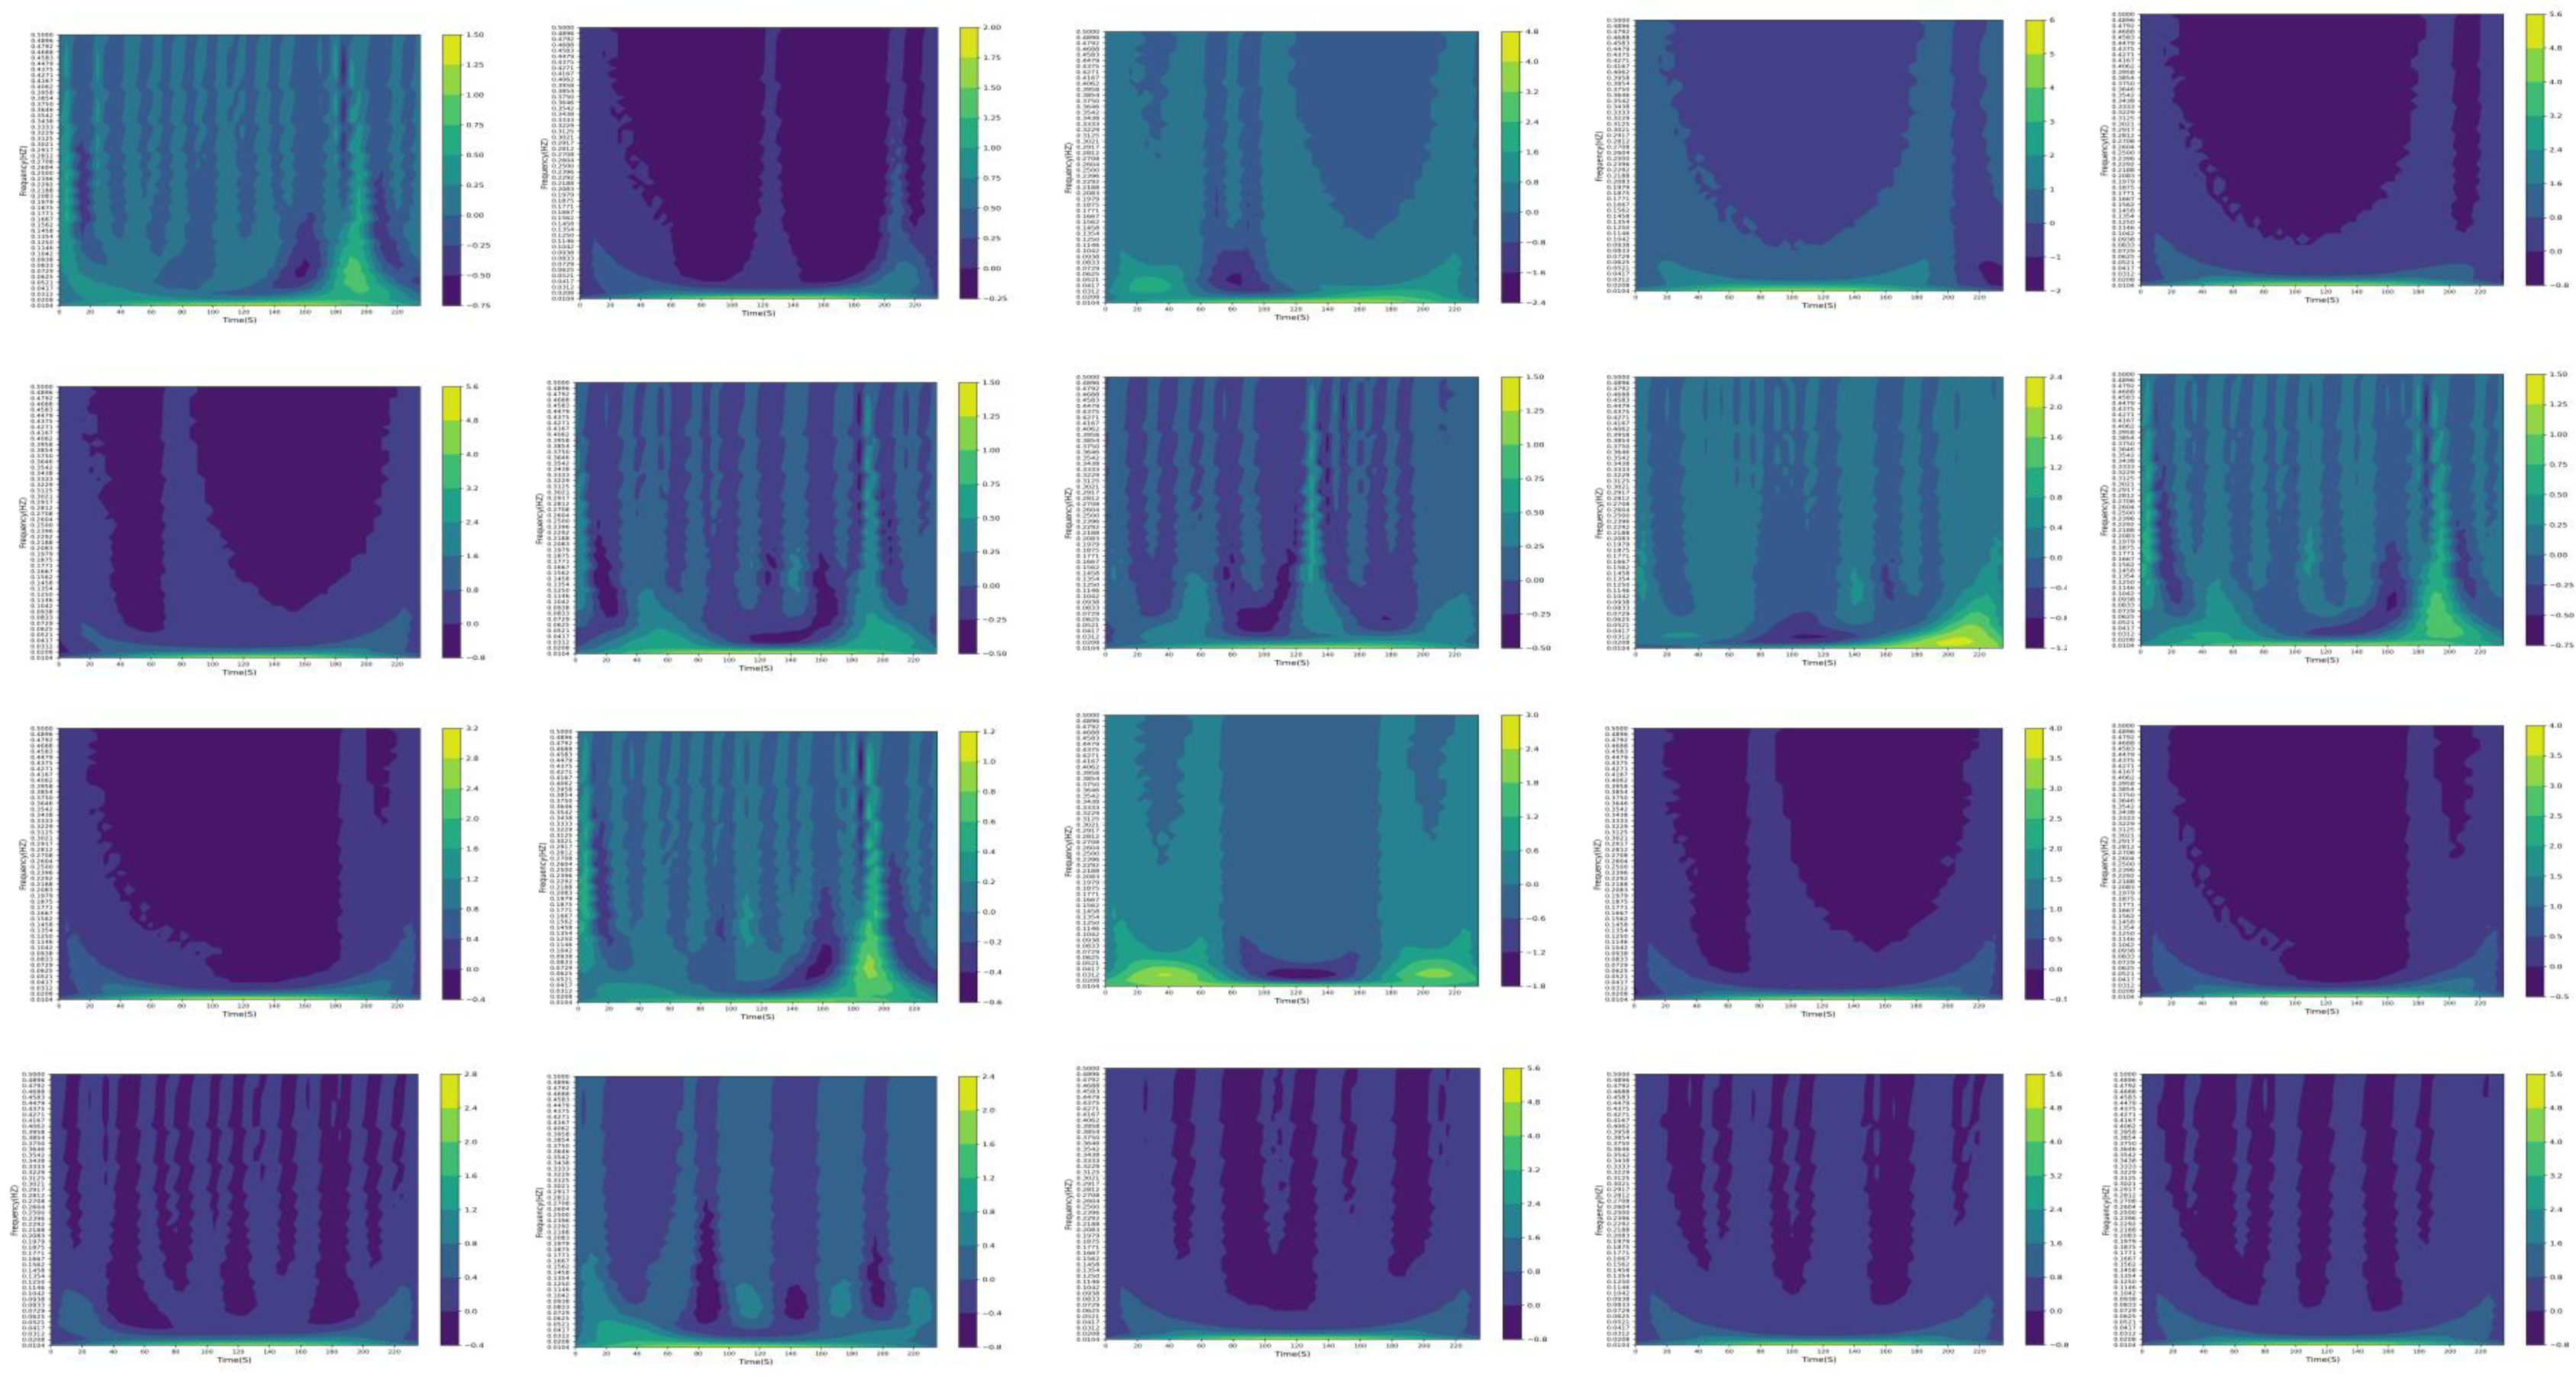
Figure 8.
of each wavelet basis function.
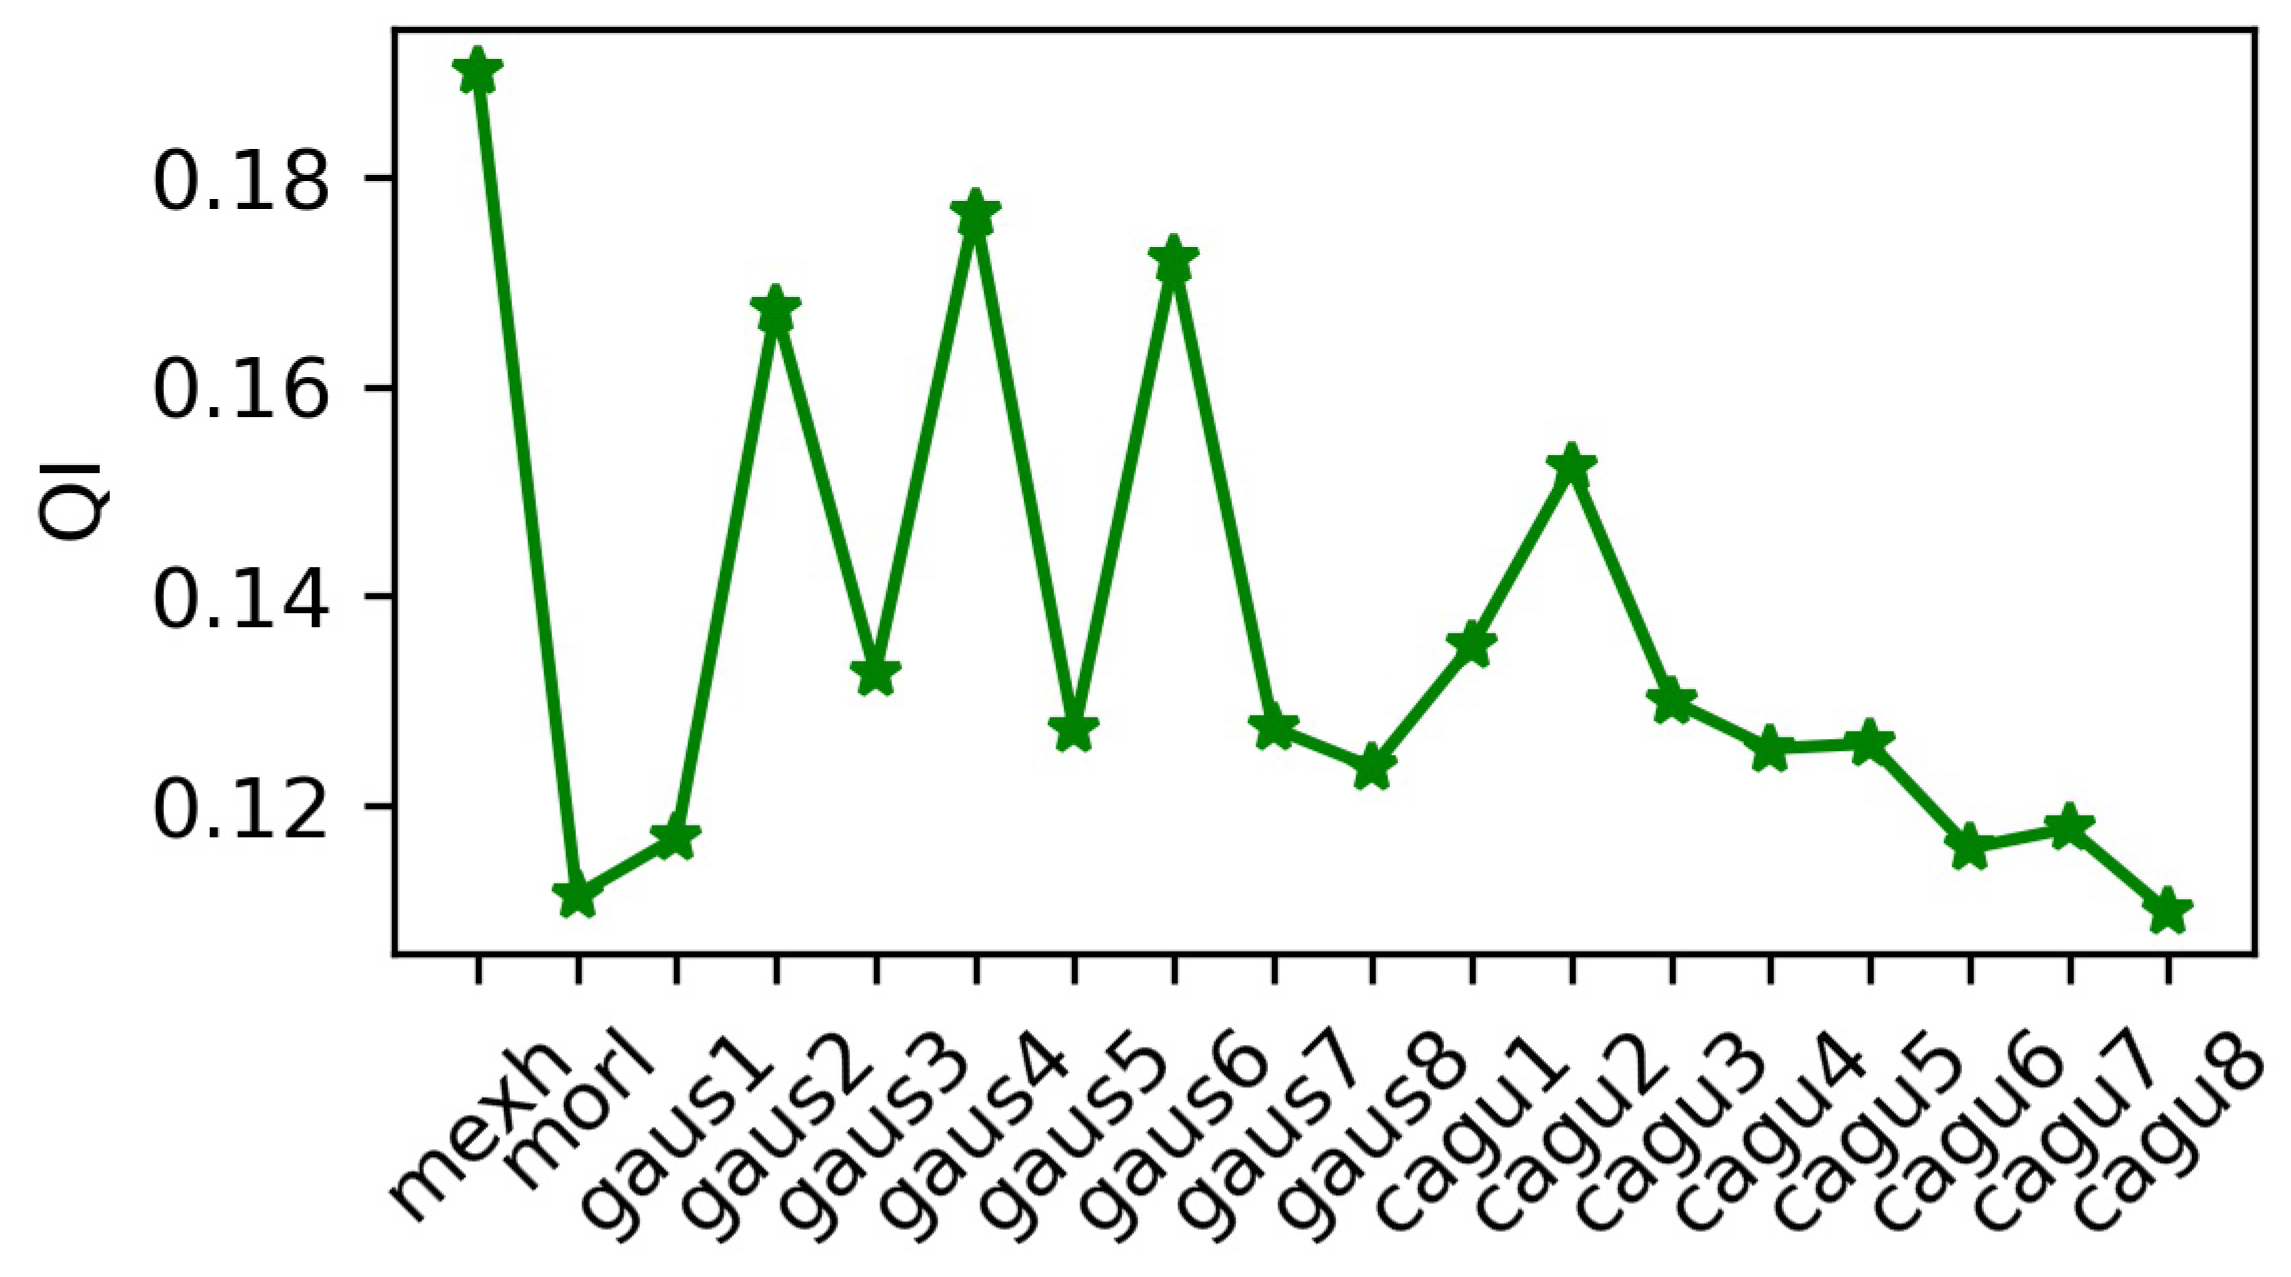
Figure 9.
Model performance at different k values.
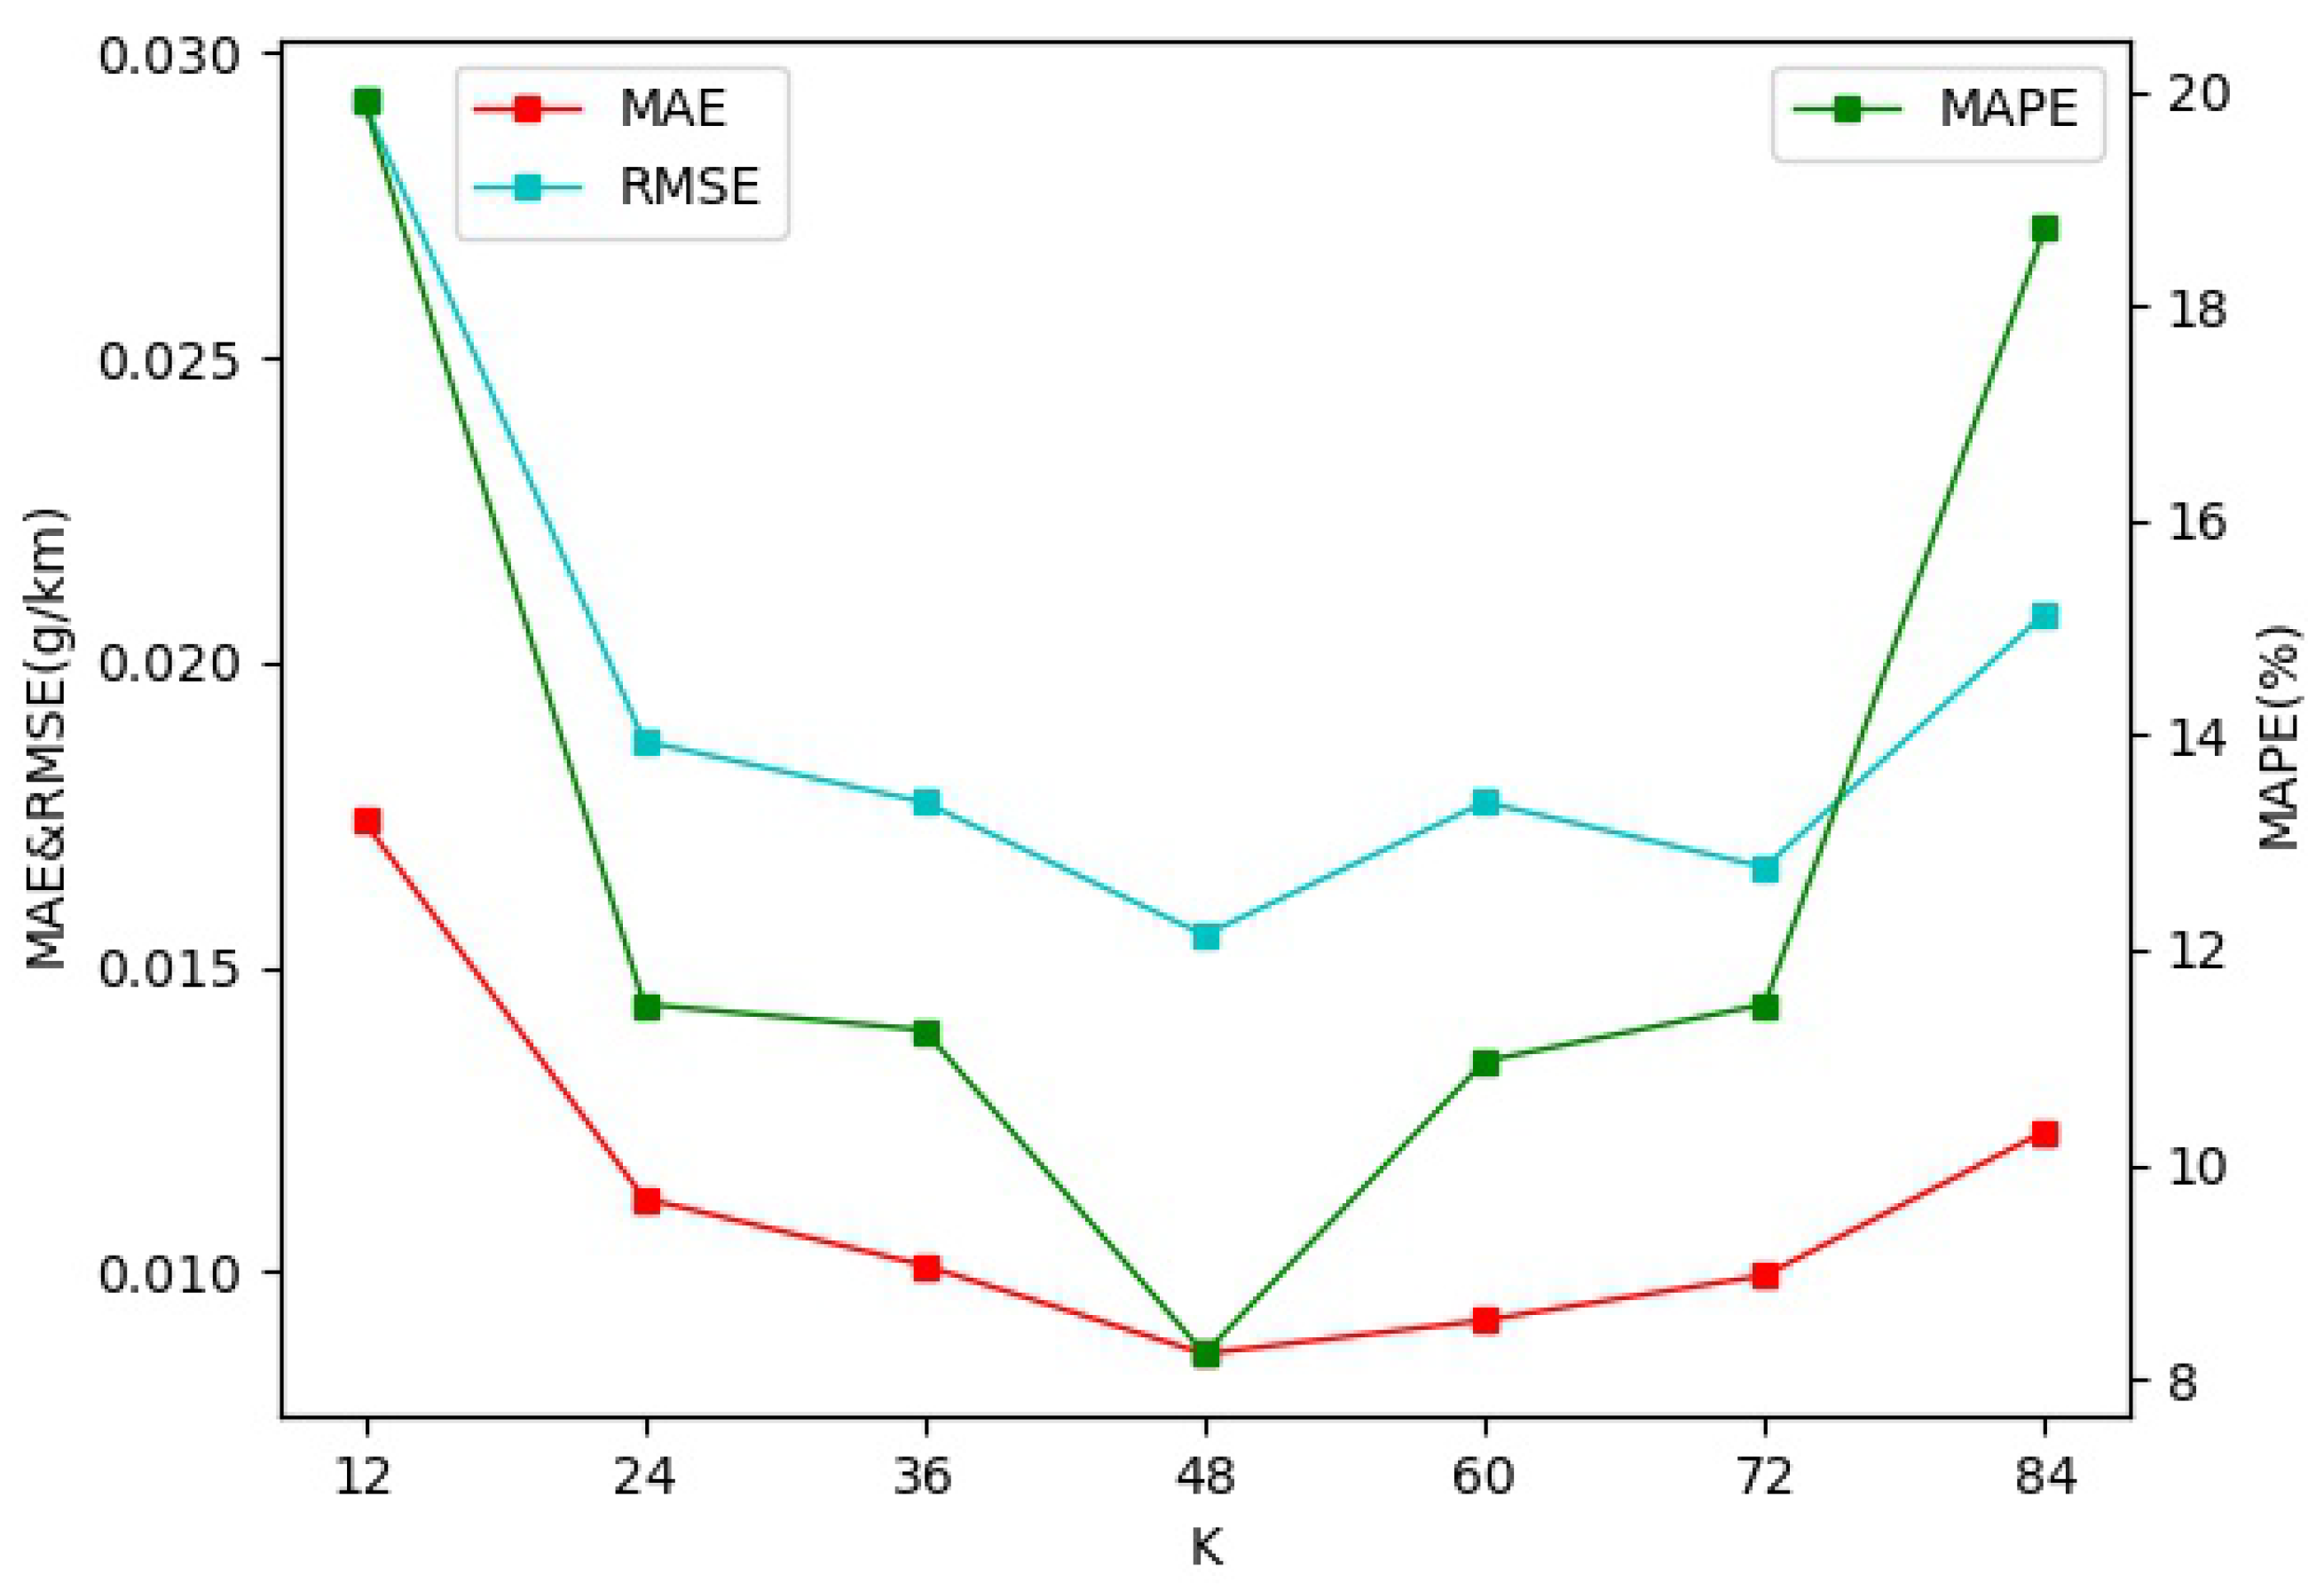
Figure 10.
Comparing the predictions of various models.

Table 1.
Typical traffic emission models.
| Characterization Parameters | Model | Application Scale | Calculation Method | Data Source | Parameter Numbers |
|---|---|---|---|---|---|
| Average speed | MOBILE [2] | Macro, Meso | Statistical Regression | Bench Test | 27 |
| COPERT [4] | Macro, Meso | Statistical Regression | Bench Test | 15 | |
| EMFAC [3] | Macro, Meso | Statistical Regression | Bench Test | 16 | |
| VSP | IVE [5] | Macro, Meso | Statistical Regression | Bench Test and On-road Emission Test | 19 |
| Engine power requirement | CMEM [6] | Macro, Meso, Microscopic | Physical Modeling | On-road Emission Test | 47 |
| Average speed, VSP, Traffic volume | MOVES [7] | Macro, Meso, Microscopic | Statistical Regression | Bench Test and On-road Emission Test | - |
Table 2.
Coefficients of COPERT model [27].
Table 2.
Coefficients of COPERT model [27].
| Coefficients | Euro 1 | Euro 2 | Euro 3 | Euro 4 | Euro 5 |
|---|---|---|---|---|---|
| a | |||||
| b | / | / | |||
| c | |||||
| d | / | / | |||
| e | |||||
| f | / | / | / | / |
Table 3.
Architecture of ResNet50.
| Stage 0 | 7 , 64, strider 2 |
| 3 max pool, stride 2 | |
| Stage 1 | |
| Stage 2 | |
| Stage 3 | |
| Stage 4 |
Table 4.
Engine section parameters and sampling standards.
| Fuel Type | Diesel Fuel |
|---|---|
| Displacement | 11.596 L |
| Maximum Horsepower | 375 PS |
| Maximum Torque | 1800 N· m |
| Rated Rotation Speed | 2100 rpm |
| Engine Type | WP12.375E51 |
| Brand | WEICHAI |
| Sampling Interval | 5 s |
| Time Period | 8 June 2020–29 November 2020 |
| Number of Sampling | 27,562 |
Table 5.
Attribute Comparison Table.
| Name | Label | Name | Label |
|---|---|---|---|
| Engine speed | E | Actual output torque percentage | AOTP |
| Engine water temperature | EWT | Engine fuel temperature | EFT |
| Post-treatment downstream NOx | NOx | Post-treatment downstream oxygen | O2 |
| Atmospheric pressure | AP | Environmental temperature | ET |
| Post-treatment exhaust gas mass flow rate | PT | Urea tank level | UTL |
| Urea tank temperature | UTT | Vehicle speed | V |
| Gas peddal opening | GPO | Single Driving Miles | SDM |
| Engine fuel consumption rate (instantaneous) | EFCR | Average Engine fuel consumption rate | EFCR |
| Engine fuel consumption for single driving | EFC | Total engine fuel consumption | EFC |
| Battery voltage | BV | Fuel tank level | FTL |
| Cumulative engine runtime | CER | Longitude | LNG |
| Latitude | LAT | / | / |
Table 6.
Performance of the Model for Various Values of k.
| Metrics | MAE | MAPE | RMSE | |
|---|---|---|---|---|
| K | ||||
| 12 | 0.0173 | 19.90% | 0.0292 | |
| 24 | 0.0112 | 11.49% | 0.0187 | |
| 36 | 0.0101 | 13.27% | 0.0177 | |
| 48 | 0.0086 | 8.23% | 0.0159 | |
| 60 | 0.0092 | 10.96% | 0.0181 | |
| 72 | 0.0099 | 11.44% | 0.0166 | |
| 84 | 0.0123 | 18.72% | 0.0208 | |
Table 7.
The correlation of each feature under different P.
| PC | Q1 | Q2 | Q3 | PC | Q1 | Q2 | Q3 | PC | Q1 | Q2 | Q3 | |||
|---|---|---|---|---|---|---|---|---|---|---|---|---|---|---|
| Feature | Feature | Feature | ||||||||||||
| E | ✓ | ✓ | AOTP | ✓ | ✓ | EWT | ✓ | ✓ | ||||||
| EFT | ✓ | ✓ | ✓ | NOx | ✓ | ✓ | O2 | ✓ | ✓ | ✓ | ||||
| AP | ET | ✓ | ✓ | PT | ✓ | |||||||||
| UTL | ✓ | UTT | ✓ | V | ✓ | ✓ | ✓ | |||||||
| GPO | ✓ | ✓ | SDM | ✓ | ✓ | ✓ | EFCR | ✓ | ✓ | |||||
| EFCR | ✓ | ✓ | EFC | ✓ | ✓ | ✓ | EFC | ✓ | ✓ | ✓ | ||||
| BV | ✓ | ✓ | FTL | ✓ | ✓ | CER | ✓ | ✓ | ||||||
| LNG | ✓ | ✓ | ✓ | LAT | ✓ | ✓ | ✓ | EF | ✓ | ✓ | ✓ | |||
Table 8.
Model performance at different P.
| Metrics | MAE | MAPE | RMSE | |
|---|---|---|---|---|
| P | ||||
| 0 | 0.0086 | 8.23% | 0.0159 | |
| Q | 0.0089 | 9.03% | 0.0153 | |
| Q | 0.0077 | 7.38% | 0.0137 | |
| Q | 0.0086 | 8.82% | 0.0156 | |
Table 9.
Ablation model performance comparison.
| Metrics | MAE | MAPE | RMSE | |
|---|---|---|---|---|
| Model | ||||
| ResNet50 | 0.0156 | 17.36% | 0.0256 | |
| ResNet50 (CBAM) | 0.0098 | 9.37% | 0.0186 | |
| HI_TTFTS (Without CBAM) | 0.0138 | 16.69% | 0.0225 | |
| HI_TTFTS (Left) | 0.0123 | 13.70% | 0.0198 | |
| HI_TTFTS (Right) | 0.0112 | 13.23% | 0.0181 | |
| HI_TTFTS (all) | 0.0077 | 7.38% | 0.0137 | |
Table 10.
Performance of mainstream model vs. HI_TTFTS for COPERT modification.
| Metrics | MAE | MAPE | RMSE | |
|---|---|---|---|---|
| Model | ||||
| SVR | 0.0864 | 87.18% | 0.1524 | |
| ANN | 0.0229 | 138.43% | 0.0275 | |
| CNN | 0.01963 | 60.6% | 0.0292 | |
| TF | 0.0135 | 16.76% | 0.0216 | |
| TSFF | 0.0163 | 20.13% | 0.0274 | |
| HI_TTFTS | 0.0077 | 7.38% | 0.0137 | |
Disclaimer/Publisher’s Note: The statements, opinions and data contained in all publications are solely those of the individual author(s) and contributor(s) and not of MDPI and/or the editor(s). MDPI and/or the editor(s) disclaim responsibility for any injury to people or property resulting from any ideas, methods, instructions or products referred to in the content. |
© 2023 by the authors. Licensee MDPI, Basel, Switzerland. This article is an open access article distributed under the terms and conditions of the Creative Commons Attribution (CC BY) license (https://creativecommons.org/licenses/by/4.0/).
Share and Cite
MDPI and ACS Style
Xu, Z.; Wang, R.; Pan, K.; Li, J.; Wu, Q. Two-Stream Networks for COPERT Correction Model with Time-Frequency Features Fusion. Atmosphere 2023, 14, 1766. https://doi.org/10.3390/atmos14121766
AMA Style
Xu Z, Wang R, Pan K, Li J, Wu Q. Two-Stream Networks for COPERT Correction Model with Time-Frequency Features Fusion. Atmosphere. 2023; 14(12):1766. https://doi.org/10.3390/atmos14121766
Chicago/Turabian StyleXu, Zhenyi, Ruibin Wang, Kai Pan, Jiaren Li, and Qilai Wu. 2023. "Two-Stream Networks for COPERT Correction Model with Time-Frequency Features Fusion" Atmosphere 14, no. 12: 1766. https://doi.org/10.3390/atmos14121766
Note that from the first issue of 2016, this journal uses article numbers instead of page numbers. See further details here.