Article

Effects of Temperature on Growth and Grain Maturity of Spring Maize in Northeast China: A Study of Different Sowing Dates

1
Heilongjiang Province Institute of Meteorological Science, Harbin 150030, China
2
Heilongjiang Provincial Ecological Meteorological Center, Harbin 150030, China
*
Authors to whom correspondence should be addressed.
Atmosphere 2023, 14(12), 1755; https://doi.org/10.3390/atmos14121755
Submission received: 21 September 2023 / Revised: 24 November 2023 / Accepted: 25 November 2023 / Published: 29 November 2023
(This article belongs to the Special Issue Impacts of Climate Change and Agro-meteorological Disasters on Crops)

Abstract

:
Situated at middle-to-high latitudes with limited thermal resources, Northeast China is the primary maize-producing region in China. It is also one of the regions most significantly impacted by climate change. Given the persistent impact of climate change, it is crucial to elucidate the effects of the varying thermal conditions and low temperatures for different sowing dates on the growth, development, and grain maturity of spring maize. To ensure secure maize production and disaster prevention, choosing the optimal sowing time for spring maize holds significant implications for the judicious utilization of climatic resources, risk mitigation, and the provision of meteorological guidance. Moreover, it can serve as a technical reference for relevant departments to conduct climate evaluation, disaster monitoring, prediction, and assessment, as well as impact analysis of corn production safety. Additionally, it can provide meteorological evidence to ensure food security and promote the sustainable development of modern agriculture. An interval sowing experiment of spring maize was conducted in Harbin in the north of Northeast China. Two varieties were used in the experiment. Four sowing dates were set, and the interval between adjacent sowing dates was 10 days. The local perennial sowing time, 5 May, was set as the second sowing date, with one date set later and two dates set earlier. During the experiment, the growth process, grain dry matter, seed moisture content, yield components, and temperature of spring maize were observed. The impact of temperature conditions on maize growth and yield formation was analyzed in this paper through mathematical statistics, which further led to the establishment of a monitoring and evaluation model for assessing the effect of thermal conditions and temperature on maize. The results showed that the growth rate of spring maize was closely related to temperature. When the average temperature, minimum temperature, and maximum temperature increased by 1 °C, the average emergence rate increased by 1.05%, 0.99%, and 1.07%, respectively, and the average vegetative growth rate increased by 0.16%, 0.16%, and 0.09%, respectively. The change rate of ≥10 °C active accumulated temperature was significantly correlated with the change rate of the dry weight of the grain kernel, which conformed to the quadratic equation of one variable. The temperature influence coefficients of different sowing dates varied from 1.0% to 1.7%. The relationship between the accumulated values of 10 ℃ active accumulated temperature and the grain moisture content of spring maize was a logarithmic function. From 10 to 50 days after anthesis, the effect of temperature can explain about 95% of the change in grain moisture content. After physiological maturity, the effect of thermal conditions can only explain 56–83%. The temperature influence coefficient ranges from 1.3% to 13.8%. Comparatively speaking, the second sowing date is the most suitable sowing date. Early sowing is prone to encounter low temperatures, resulting in underutilization of the early heat, while late sowing is prone to less heat. Both conditions are not conducive to better improve the yield of spring maize.

1. Introduction

Global climate change and its impact on agriculture have caused wide concern by the international community [1,2,3]. Many experts and scholars conducted a lot of in-depth research on the impact of climate change on food crop production and food safety [3,4,5,6,7]. It was reported that the temperature factor in climate change has a profound impact on crop growth and yield. Changes in temperature and accumulated temperature affected the growth rate, leaf area index, dry matter weight, and yield [8,9]. The main factors affecting the climatic yield of maize in the eastern Gansu of China were the average temperature and maximum temperature from the jointing stage to the tasseling stage [10]. The accumulated temperature of the sowing–jointing–tasseling stage in the Hetao irrigation area was significantly positively correlated with the 100-grain weight of maize [11]. High- and low-temperature disasters had a significant impact on crops. Examples from the research showed that high-temperature stress at the flowering stage significantly reduces the fertilization and seed-setting rate of maize [12], while chilling injury significantly reduces the maize ear length, the grain number per ear, and the grain weight per ear [13]. The interval sowing method is one of the main methods to study the impact of temperature change on crop growth and yield [14]. An experiment showed that a different sowing time has a great impact on the growth and yield of maize [15]. Therefore, the sowing time plays an important role in the maize yield [16]. With the continuous warming of the climate and renewal of various types, the effects of heat and temperature conditions and their differences on different sowing dates on maize, one of the globe’s main food crops [17], will change. And how to make more rational use of heat resources in this new period has become an important issue in urgent need of research. These are of great significance for the rational use of climate resources, seeking advantages and avoiding disadvantages, and a high yield and yield increase in maize production.
Different sowing dates cause yield changes by affecting the maize ear length, bald tip, and 100-grain weight [18]. Meteorological conditions under a suitable sowing date are the best conditions for maize to obtain higher yields [19]. Sowing at the appropriate sowing date can make full use of climate resources, promote leaf growth and dry matter conversion to grains, and significantly increase yield [20]. However, sowing at an inappropriate sowing date may cause maize to encounter adverse weather conditions, which significantly affect the maize germination rate, germination index, average germination time, and dry matter per plant and, ultimately, lead to a significant decline in the yield [21,22]. The late sowing of maize in the Huang Huai Hai region of China easily leads to a delay in the growth period and low temperature, which seriously affect the yield [23]. Adverse temperature conditions during the grain-filling stage under late sowing conditions also reduce the grain growth rate, ultimately reducing the maize grain weight [24].
Northeast China, located in the middle and high latitudes with limited heat resources, is an important main maize-producing area in China. And it is also one of the regions most significantly affected by climate change [25]. In this region, Heilongjiang Province ranks first in China in terms of both maize planting area and total output, playing a crucial role in safeguarding national food security. However, due to its location in the northernmost part of China with large temperature variability and relatively insufficient heat resources, low-temperature events commonly occur during the growing season. And they can significantly impact maize growth and yield formation, resulting in decreased yields [26]. Given this, the effects of heat and temperature on maize growth and grain maturity were studied by using the experimental data from the interval sowing of maize at the Harbin Agricultural Meteorological Experimental Station in the main maize production area of the Northeast Plain from 2021 to 2022, to provide the meteorological basis for the safe production, disaster prevention, and scientific management of maize.

2. Data and Methods

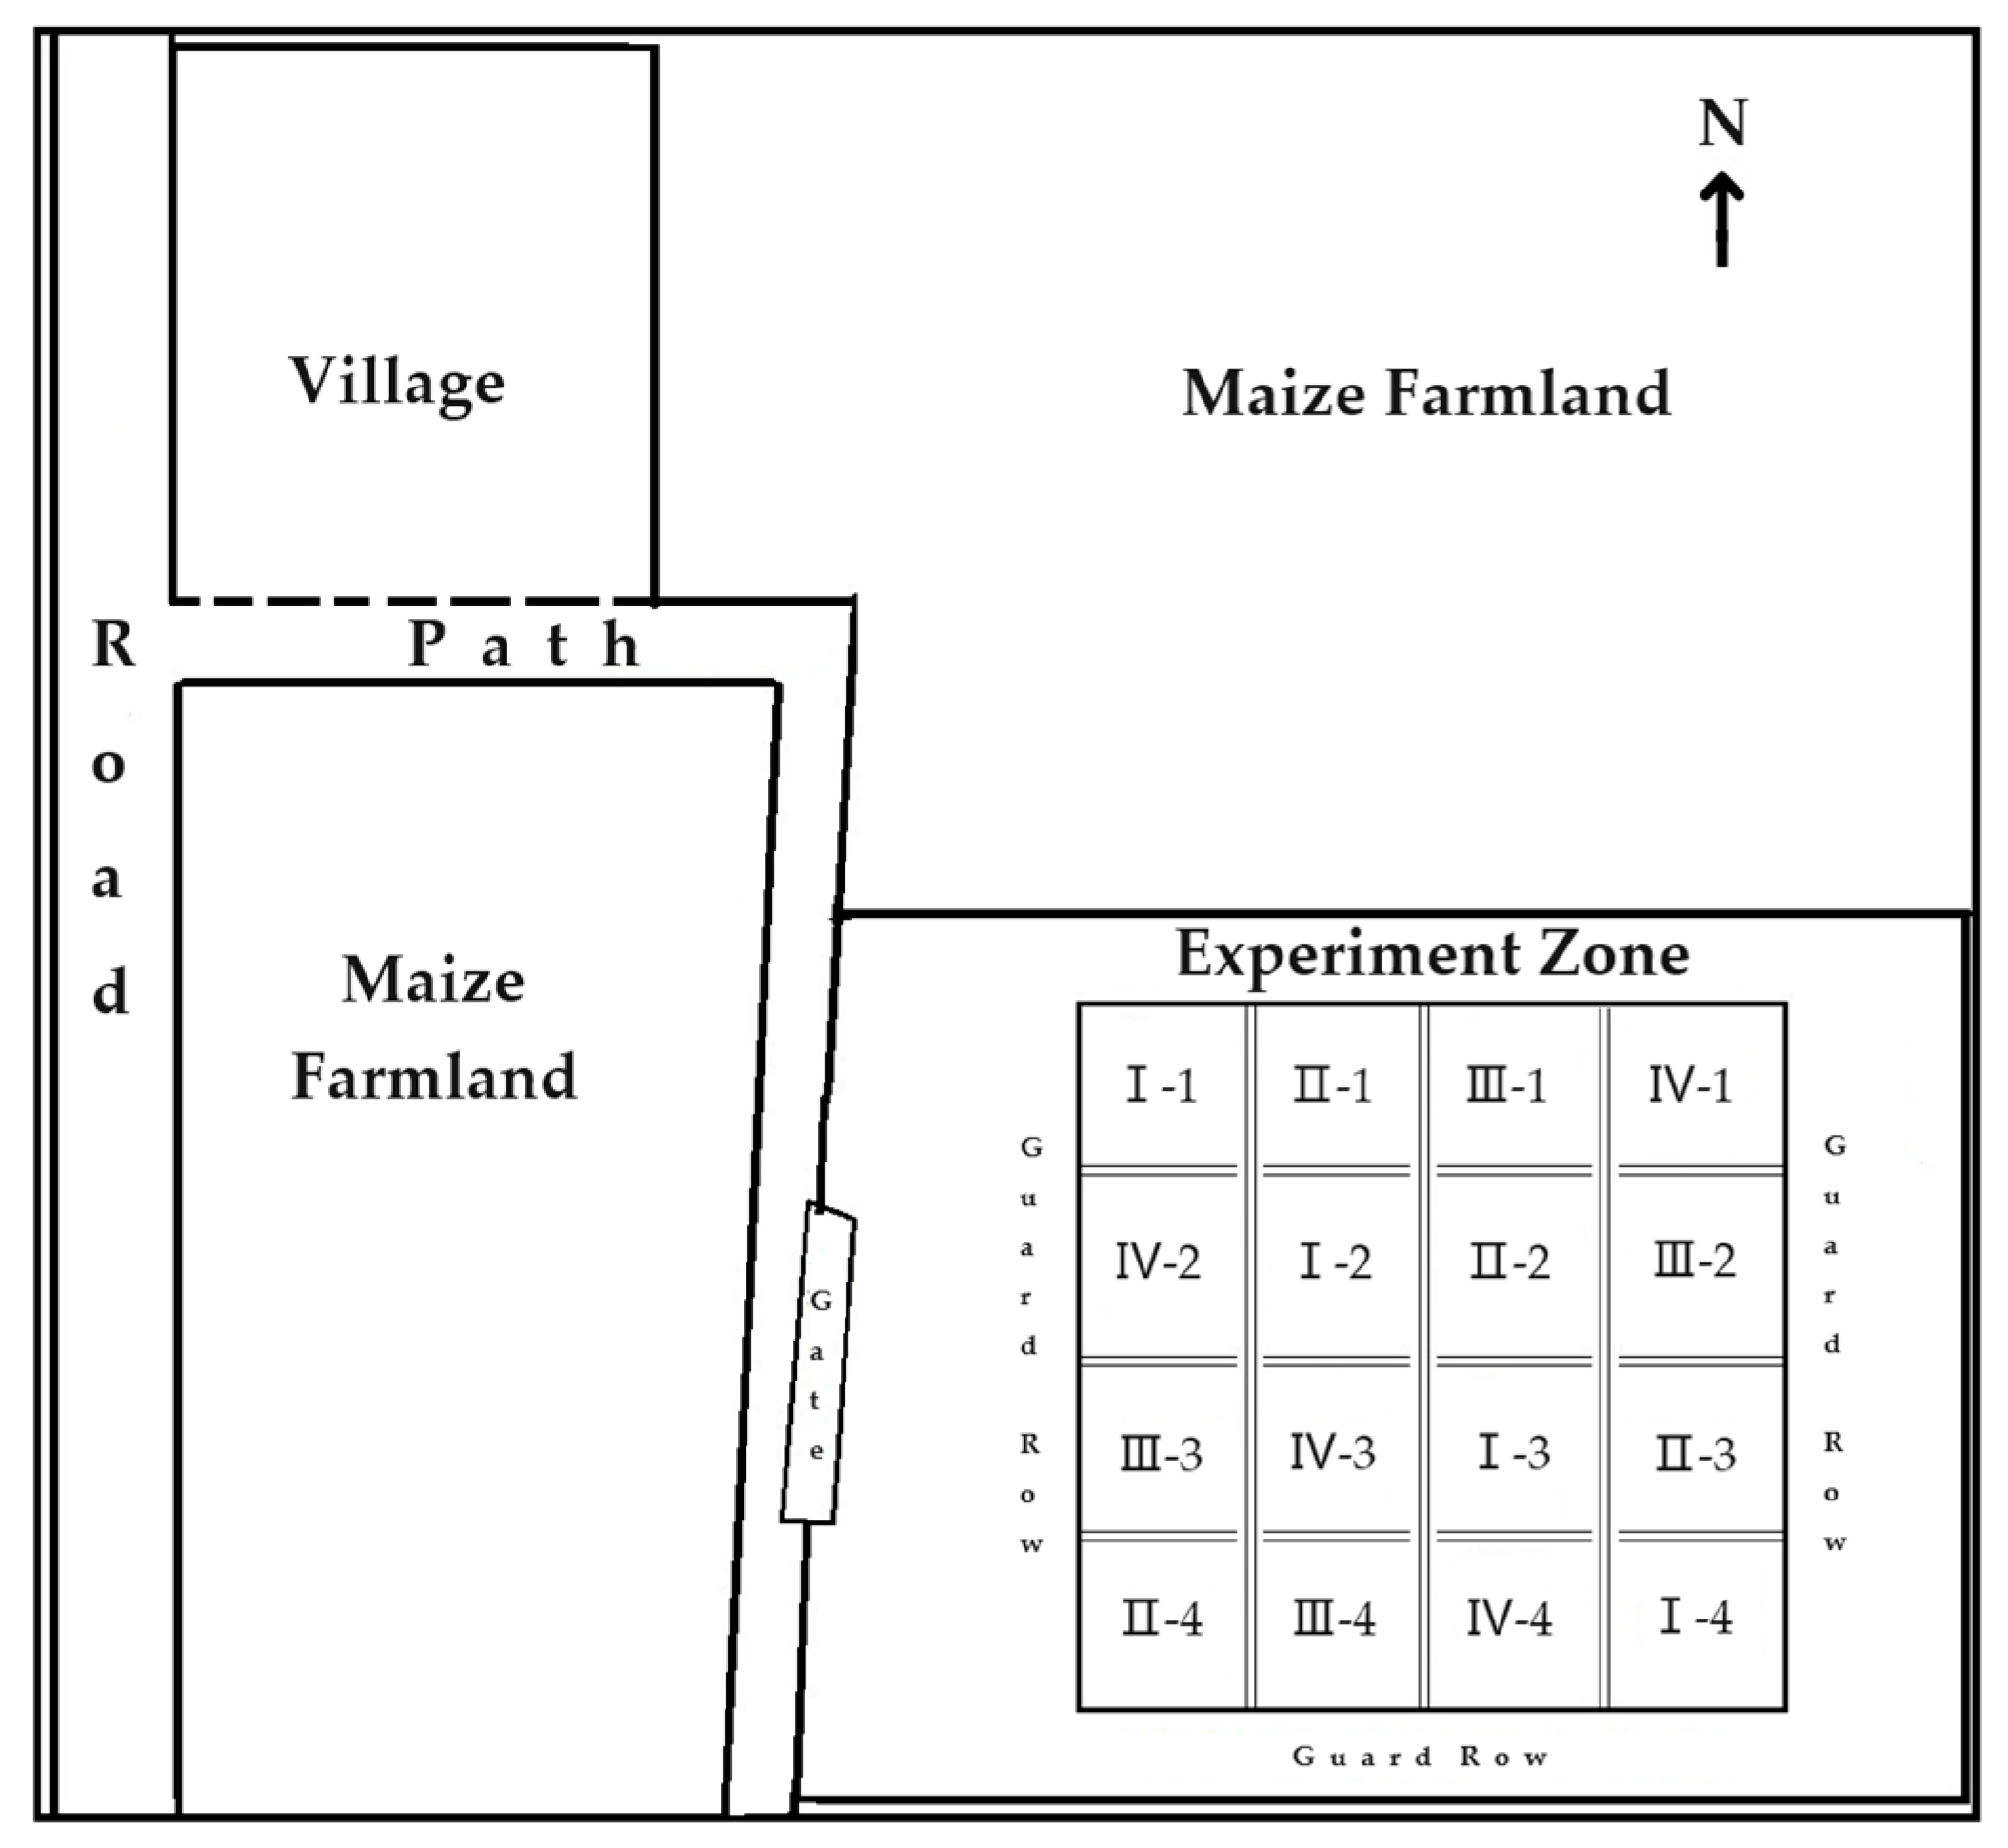
2.1. Overview of Test Area

The test base was flat and located on the Songnen Plain in the Northeast Plain of China. It is a one-season crop planting area (Figure 1). The climate here belongs to the high-latitude continental monsoon climate. Since the 21st century, the average temperature in the crop growing season (May–September) has been 19.9 °C, the average precipitation in the crop growing season has been 456 mm, and the average sunshine duration has been about 7.2 h per day. In spring and autumn, the temperature violently changes, and the low-temperature weather is frequent, which easily leads to large precipitation variability, high temperatures in summer, and centralized precipitation.

2.2. Design of Experiments

From 2021 to 2022, a spring maize field interval sowing experiment was conducted at the Harbin Agricultural Meteorological Experimental Station in the northern part of Northeast China (126°49′ E, 45°36′ N) to explore the effects of different sowing dates, heat conditions, and low temperatures on spring maize. Four sowing stages were set for the experiment. The first to fourth sowing dates were sequentially encoded as I, II, III, and IV. Ten days was set as the duration step. The local normal broadcasting period, 5 May, was set as Date II, with Date I, Date III, and Date IV being 25 April, 15 May, and 25 May, respectively. There was a 30-day interval before and after Date IV. Each sowing date was repeated 4 times, for a total of 16 communities. After being randomly grouped and arranged, each community had an area of 30.0 m2, with a 0.5 m protection interval between each community. The altitude of the test area was 142.3 m. The soil texture of the 0–10 cm arable layer was black loam soil with moderate acidity and alkalinity. The volume weight of oil was 1.25 g·cm−3, while the field capacity and wilting coefficient were 32.2% and 9.1%, respectively. Planting was carried out using local farmland sowing methods, with a row spacing of 0.4 m, a plant spacing of 0.2 m, and 2–3 seeds per hole. Thinning began after seedlings. The final singling was completed before the jointing stage of spring maize, with no twin plants or seedlings filled in holes. Considering the application significance of the experimental research, the tested varieties Keyu 15 and Delong 928 were selected. Those were the main local varieties with large area planted. During the growth period of spring maize, irrigation, fertilization, and other field management were all carried out according to the local agricultural cultivation methods. The 2022 experiment was selected as a case to draw a schematic plan of the experimental area, as shown in Figure 2.

2.3. Observation Items

During the experiment, the growth period, plant height, aboveground dry biomass, seed dry matter, and yield components of spring maize were observed during each sowing date. The observation process of each project was carried out in accordance with the Chinese meteorological industry standard [27]. The observation of the growth period started with recording the sowing date, followed by sequentially observing the seedling stage, three leaves stage, seven leaves stage, joining stage, tasseling stage, milk ripening stage, and mature stage. The universal period was generally recorded, which was marked by more than 50% of spring maize plants in the field exhibiting morphological characteristics during the growth period.
The measurement of the dry weight of grain kernel was conducted from the 10th to 50th day of spring maize flowering. Samples were taken every 5 days, with 2 ears taken each time. One hundred grains were randomly selected from the middle part of the ear, weighed fresh in an aluminum box. That’s the method for calculating the weight of a hundred grains. And then they were dried in a 101-3EBS constant temperature drying oven to measure their dry weight. The dry weight of grain kernel in this paper is expressed as 100 dry-weight grains, which are counted as 100 dry-weight grains [27]. For the convenience of analysis, this paper records the 10th day of flowering as F10 and the 15th day of flowering as F15. By analogy, the flowering time of 50 days was recorded as F50.
To better explore the impact of different sowing dates and temperatures on spring maize, our research team conducted additional tests on grain moisture content in 2022. The measurement time was 10–50 days after flowering and after physiological maturity (23 September–21 October, the same as below). The measurement frequencies were sequentially 5 d and 3 d. The determination method was the same as the method for determining the 100 dry-weight grains and will not be repeated. The formula for calculating grain moisture content is as follows [27]:
G M C i = G F W i G D W i G F W i × 100 %
In Equation (1), G M C i is the grain moisture content (%) measured for the i -th time, and G F W i stands for the fresh weight (g) of spring maize for the i -th time. G D W i represents the dry weight (g) of spring maize for the i -th time, and G D W is the dry weight of grain kernel.
After harvesting spring maize, yield components such as 100-grain weight, ear length, and number of grains per plant were investigated and statistically analyzed. Taken from Harbin Meteorological Observation Station (126°34′ E, 45°56′ N), the meteorological data during the test period were compiled by Heilongjiang Meteorological Bureau through quality control, including the average temperature, minimum temperature, maximum temperature, precipitation, sunshine duration, and other meteorological elements during the test year.

2.4. Research Methods

For the convenience of analysis, information such as growth stage and different development stages was encoded [27], as shown in Table 1.
This paper focused on studying the effects of heat and temperature conditions on different sowing dates on spring maize, using three factors, daily average temperature, minimum temperature, and maximum temperature, for analysis. In addition, the precipitation throughout the entire growth period of spring maize in the experimental year ranged from 427 to 511 mm, and the difference between different sowing dates in the same year was less than 8%. Most of the time, the soil moisture was suitable, and the deviation of the relative soil moisture for different sowing dates and the same development stage was less than 10%. The soil moisture conditions were the same (Figure 3). The sunshine duration from seedling to mature was more than 724 h, without serious drought, waterlogging, frost, or other disasters.

2.4.1. Expression of Statistical Dispersion of Temperature

Standard deviation is a measure of the dispersion of the average value of a group of data, which can reflect the statistical dispersion of a group of data well. The calculation formula is [28]:
S = i = 1 n ( x i x ¯ ) 2 n 1
In Formula (2), S refers to the standard deviation, x i is the sample variable, x ¯ stands for the sample mean, and n is the sample size. In this paper, the standard deviation is used to express the statistical dispersion of temperature from sowing to the mature stage of spring maize. The moving average has been widely recognized as the fundamental technique for trend fitting in various studies. This technique explains the trend of changes by calculating the smooth values of the time series, ensuring a smooth representation of the data without any outliers. An odd sliding length is recommended to use [29]. In this paper, a 5-day sliding window was adopted. The first sowing date (Date I) for spring maize was 25 April. Starting from 21 April, the 5-day sliding method was used to calculate the standard deviation of the average temperature, minimum temperature, and maximum temperature of spring maize from different sowing dates to mature dates.

2.4.2. Analysis Method for the Relationship between Temperature and the Growth Rate and Yield Formation of Spring Maize

Previous researchers defined the reciprocal of the number of days required for a crop to complete a certain development stage as the growth and development rate of the crop [14]:
G = 1 D × 100
In Equation (3), G is the growth rate (%) of spring maize during a certain growth stage, and D stands for the number of days (d) during which spring maize completes a certain growth stage.
Equation (3) was first used to calculate the growth rates of spring maize during seven main development stages, including the sowing–seedling stage. On this basis, the growth stage of spring maize is further divided into three stages including emergence, vegetative growth, and reproductive growth, namely, the sowing–seedling stage, the seedling–tasseling stage, and the tasseling–mature stage. Furthermore, the growth rates of these three stages can be obtained and sequentially referred to as emergence rate, vegetative growth rate, and reproductive growth rate.
Accumulated temperature, as an indicator of heat conditions, is usually used to study the relationship between temperature and crop growth and yield [14,30]. To better explore the relationship between heat condition and the dry weight of grain kernel and grain moisture content of spring maize on different sowing dates, this paper conducted cumulative calculations on the daily average temperature of a certain period. The formula is
A T T = i = 1 n t i  
In Equation (4), A T T is the active accumulated temperature value (°C·d) for a certain period, and t i represents the daily average temperature (°C) for a certain period. t i   > 10 °C. n stands for the number of days in the calculation period. The change rate in dry weight of grain kernel and the change rate in cumulative temperature values were applied for analysis [27].
G R G = G D W i + 1 G D W i G D W i × 100
R T = A T T i + 1 A T T i A T T i × 100
In Equation (5), G R G is the change rate of the dry weight of grain kernel (%, calculated as 100-grain dry weight) [27], G D W i + 1 stands for the 100-grain dry weight (g) of spring maize measured for the i + 1 th time, and G D W i represents the 100-grain dry weight (g) of spring maize measured for the i th time. In Equation (6), R T is the rate of change in active accumulated temperature (%), A T T i + 1 represents the active accumulated temperature from a certain time to the i + 1 th time corresponding to the measurement of 100 kernels’ dry weight of spring maize, and A T T i stands for the temperature cumulative value from a certain time to the i th time corresponding to the measurement of 100 kernels’ dry weight of spring maize. The dry weight of grain kernel was measured on the 10th, 15th, ..., and 50th days after the flowering of spring maize. Equation (5) was used to calculate the rate of change in the dry weight of the grain kernel. The temperature accumulation values of daily average temperature, daily minimum temperature, and daily maximum temperature were accumulated from the 1st day after spring maize flowering to the 10th, 15th, ..., and 50th days. Then, Equation (6) was used to calculate its rate of change. The temperature influence coefficient is defined in this paper. It represents the change in the dependent variable resulting from a unit change in the independent variable within the regression equation associated with temperature.
The logarithmic function was employed to establish the correlation between active accumulated temperature and grain water content at 10~50 days after flowering and physiological maturity of spring maize.
y = ln ( x )
s l o p e   l n ( x ) = 1 / x
The fitting equation is represented by Formula (7), where x denotes the active accumulated temperature, y represents the grain water content after 10~50 days of spring maize flowering and physiological maturity. The slope calculation method can be expressed as Formula (8), with the slope value indicating the rate of change in water content with respect to the active accumulated temperature.

2.5. Data Processing

Mathematical statistical methods were used to organize and analyze various observational data, and Excel 2016 and SPSS 25 software were used for processing and analysis according to research needs. The average temperature, minimum temperature, maximum temperature, cumulative temperature, precipitation, sunshine duration, and standard deviation of temperature in different periods are statistically analyzed based on climate statistical methods (linear equation fitting with one variable; quadratic equation fitting with one variable). Statistical regression methods were used to analyze the correlation between temperature and heat conditions and growth and development rates, dry weight of grain kernel, and grain moisture content.

3. Results and Analysis

3.1. Effect of Temperature on the Growth of Spring Maize on Different Sowing Dates

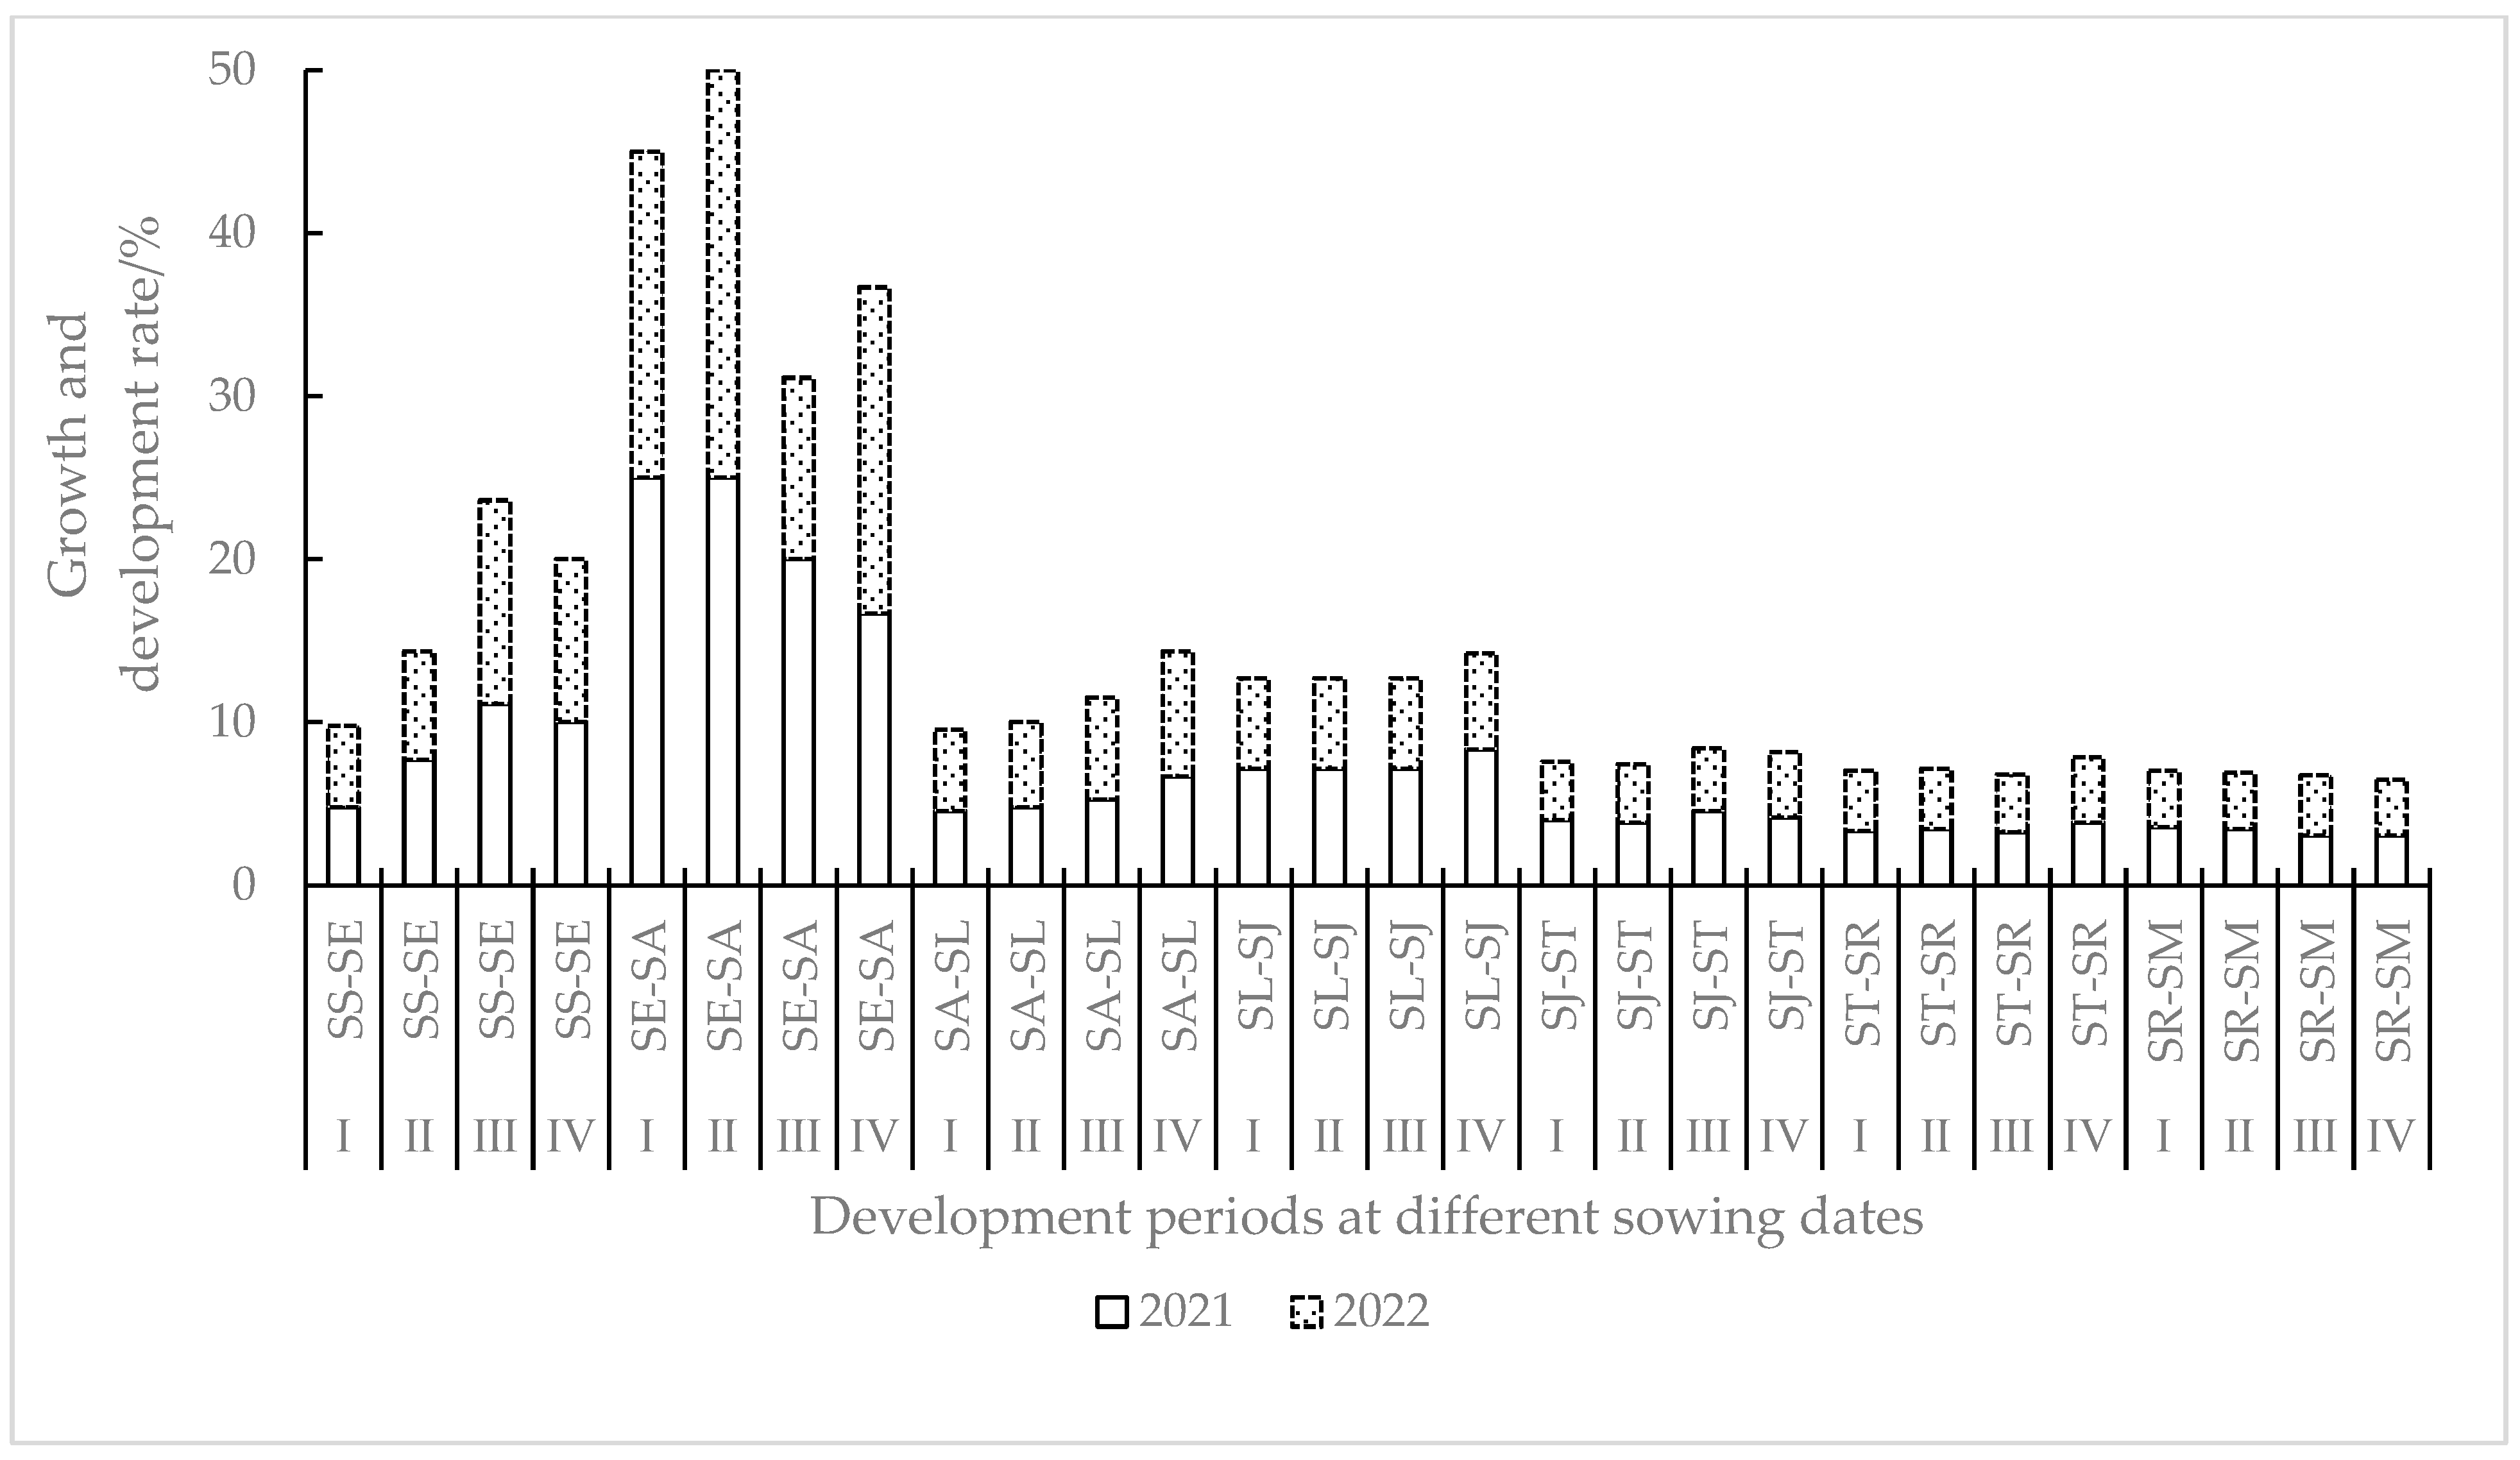
3.1.1. Growth Rate of Spring Maize on Different Sowing Dates

Figure 4 illustrates the growth rate of spring maize across various sowing dates, ranging from 3.0% to 25.0% in the experimental year. The time required to reach the three leaves stage was the shortest. In contrast, stages like tasseling–milk ripening and milk ripening–mature took longer. The stages also showed a steady rise when the sowing dates were delayed, suggesting that the growth of spring maize was accelerated. There were varying degrees of differences in the growth and development process of spring maize on different sowing dates, with a difference ranging from 0 to 13.9% among different sowing dates during the same development stage. Among them, there was a significant G difference in the sowing–seedling–three leaves–seven leaves stage. The seedling rate for Date I was significantly lower than that of Date II, Date III, and Date IV, with a range of 1.7–7.5%. Date I, Date II, and Date III during the seven leaves–jointing stage shared the same G (growth rate). And the growth rate for Date IV increased by 0.3–1.2% compared to that of the first three sowing dates.

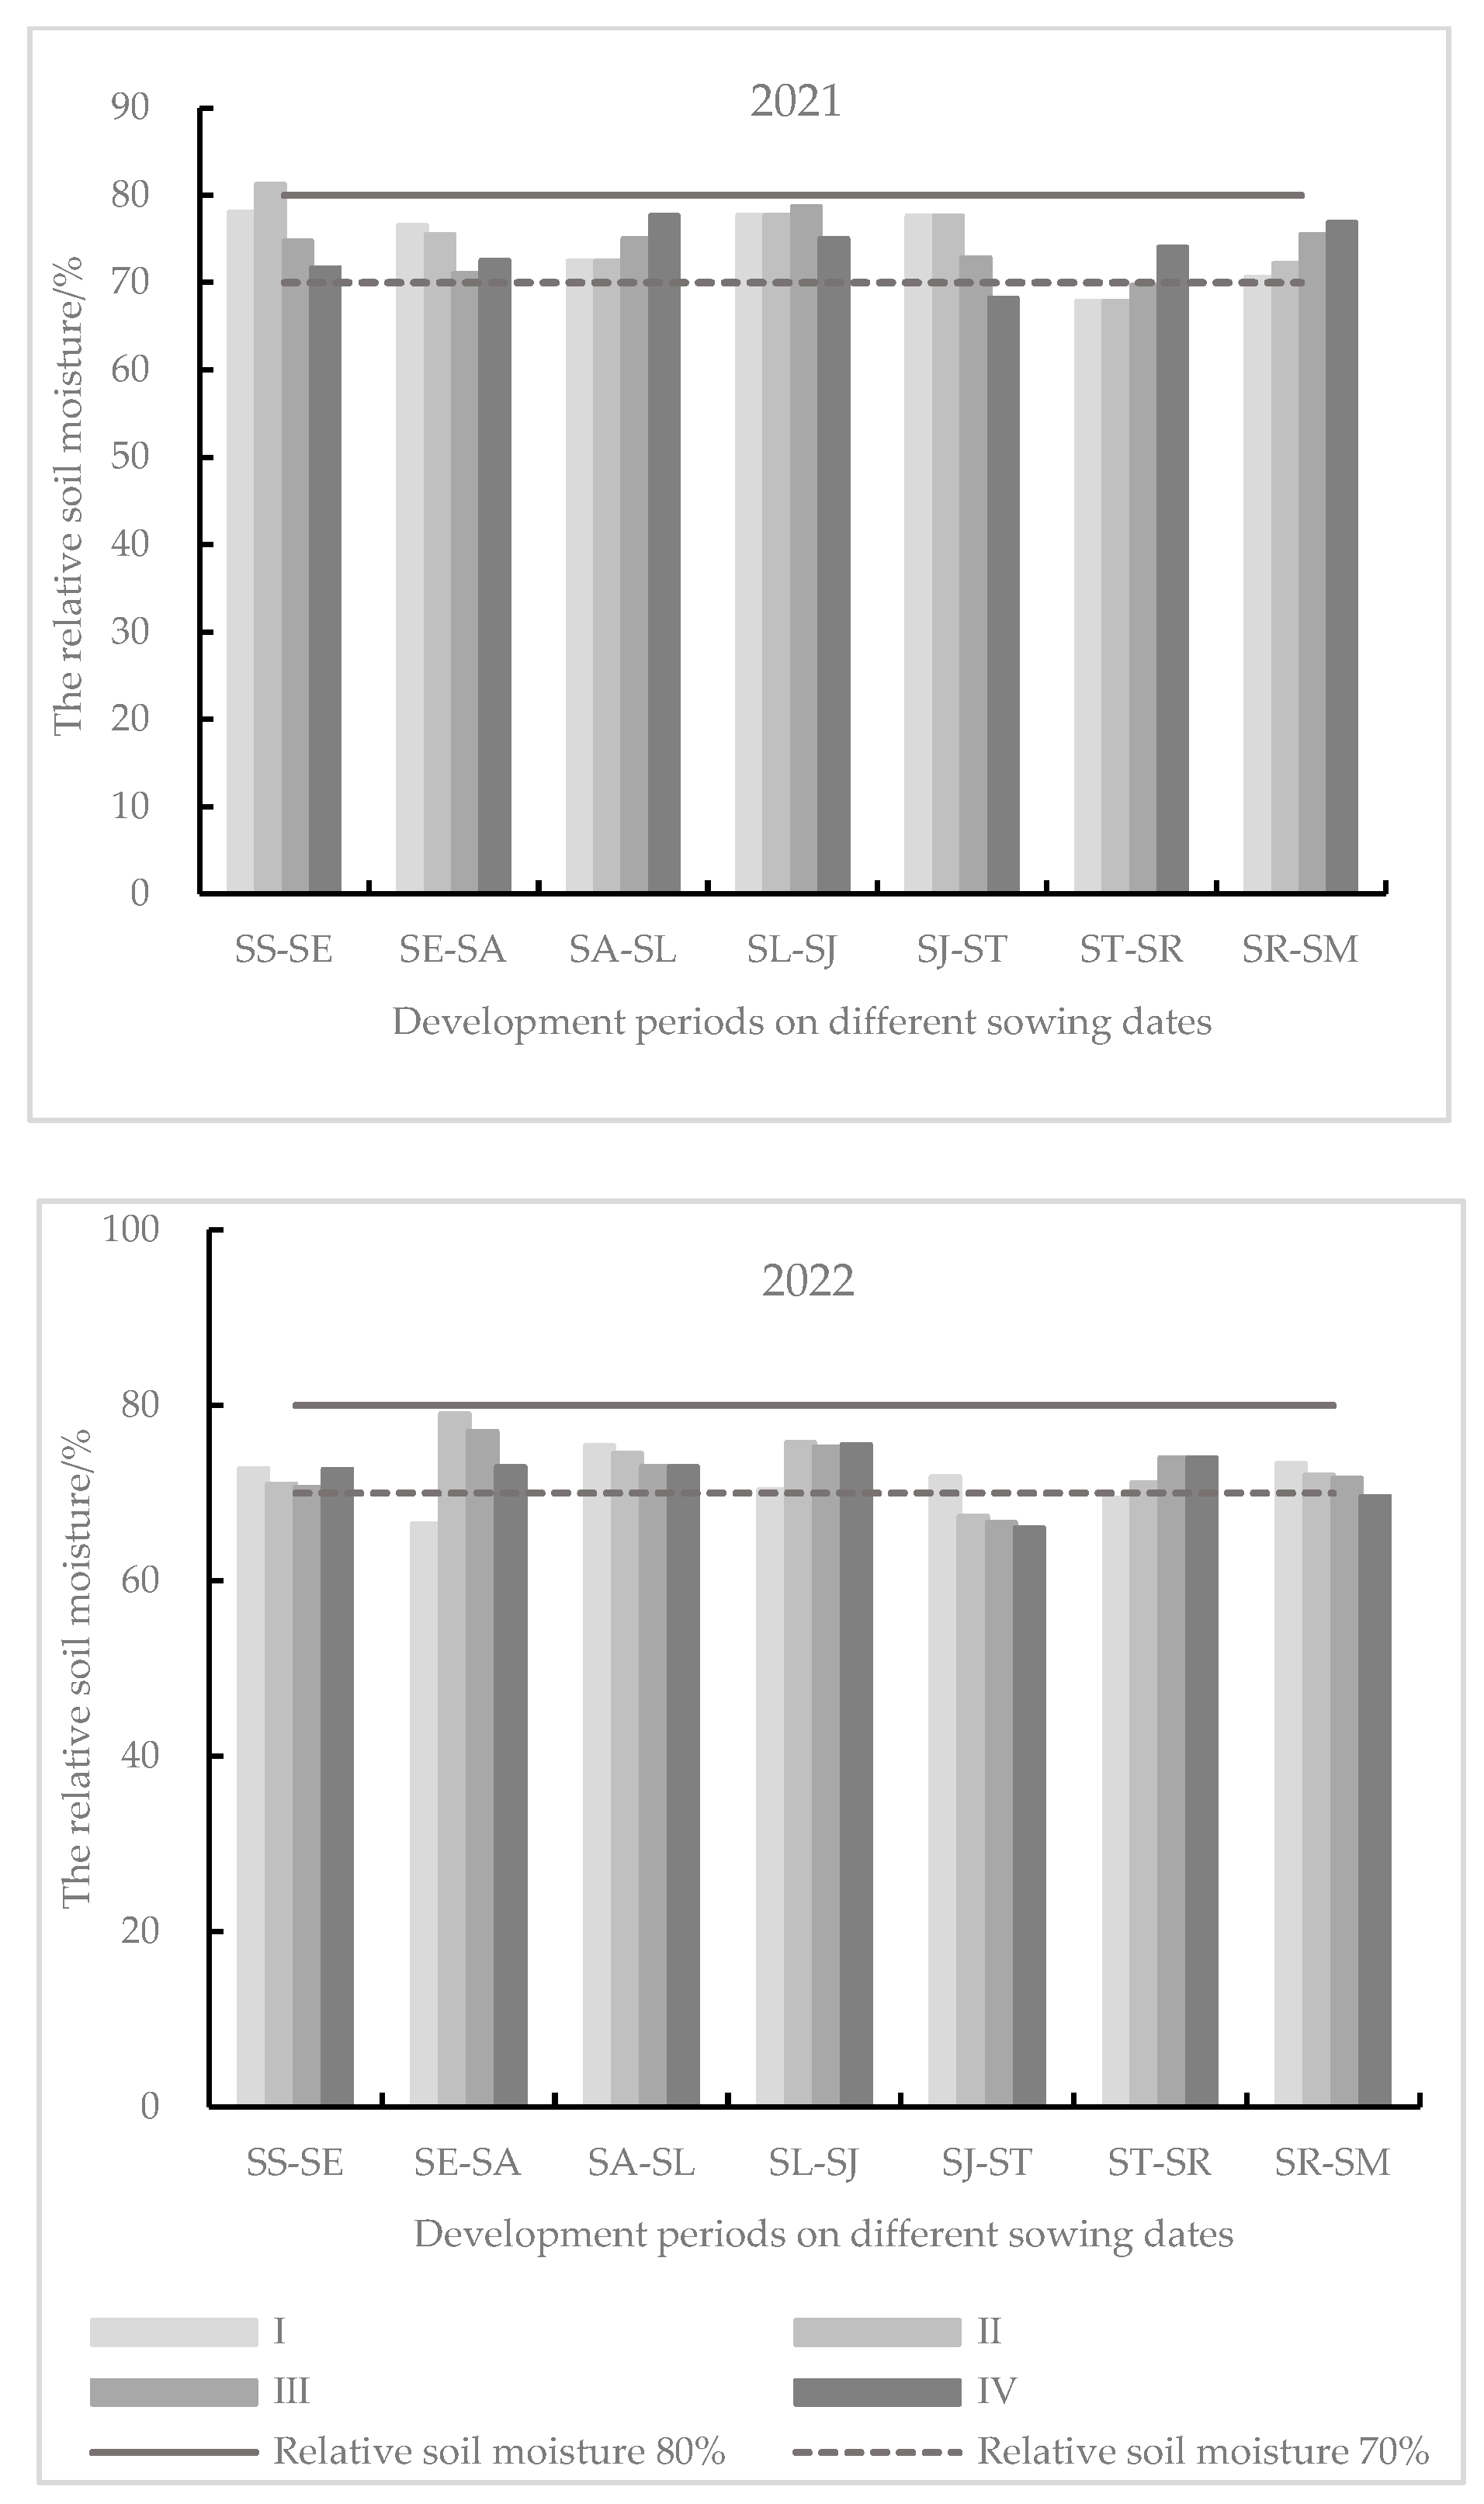
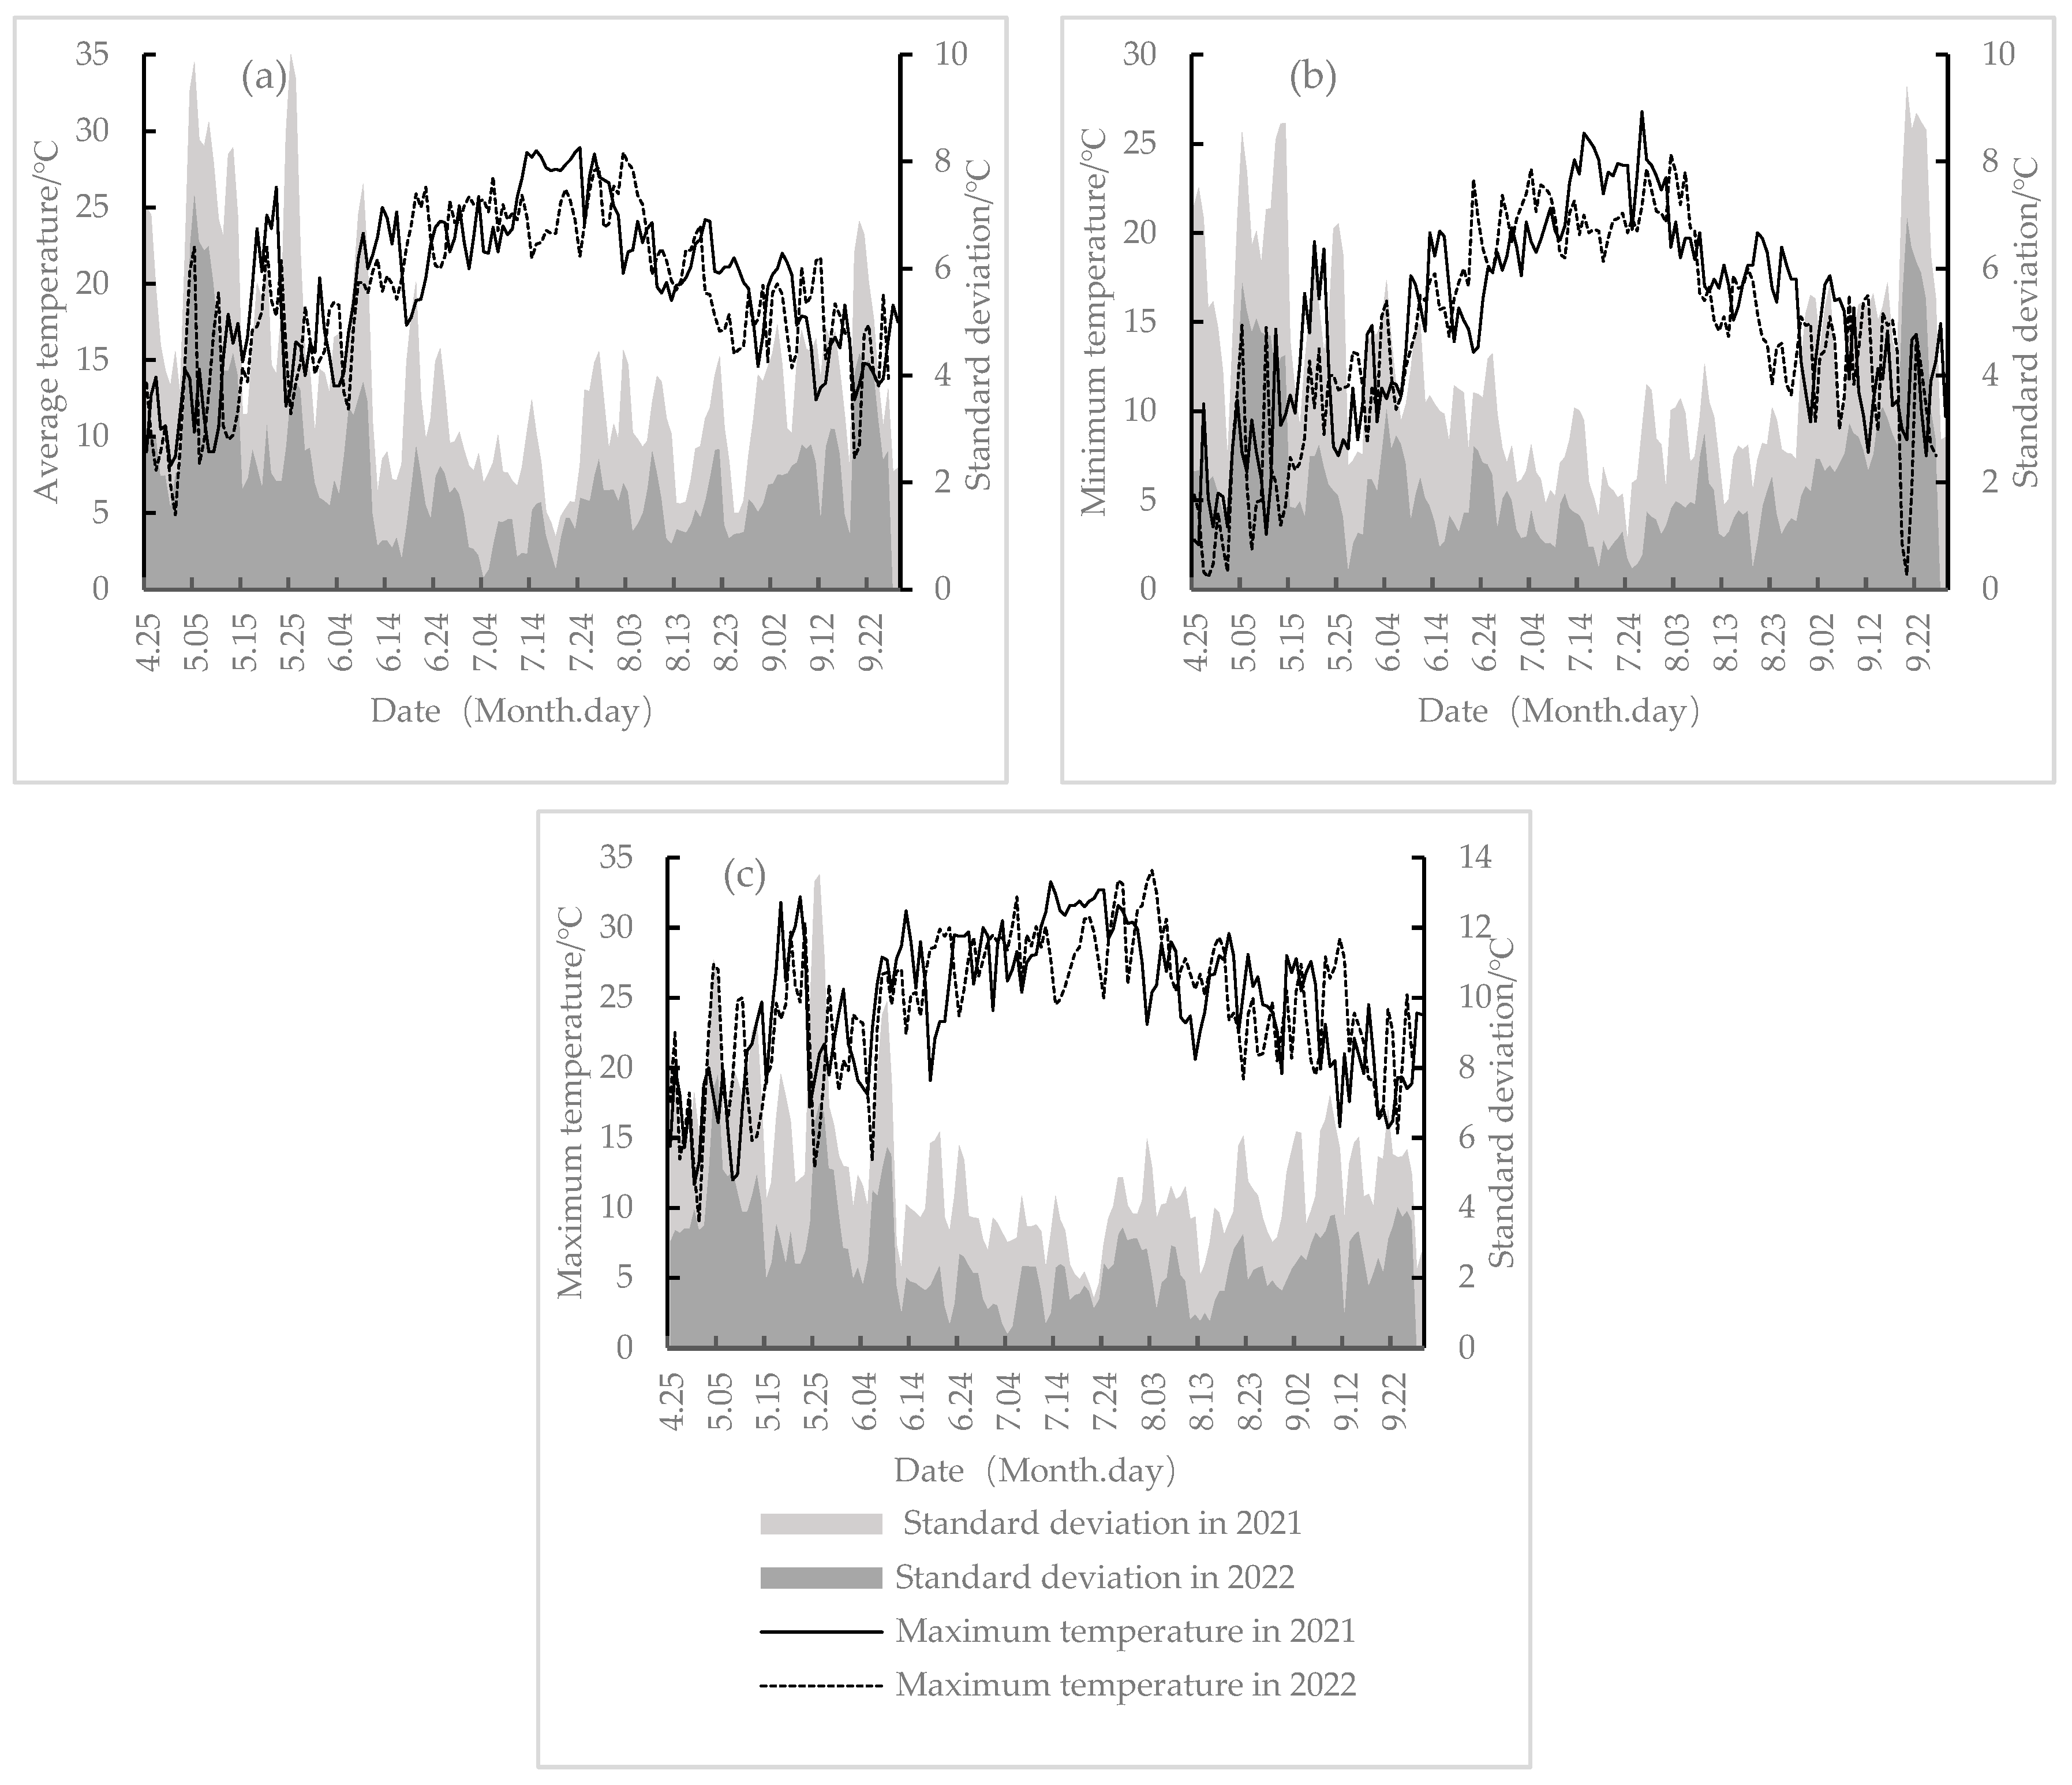
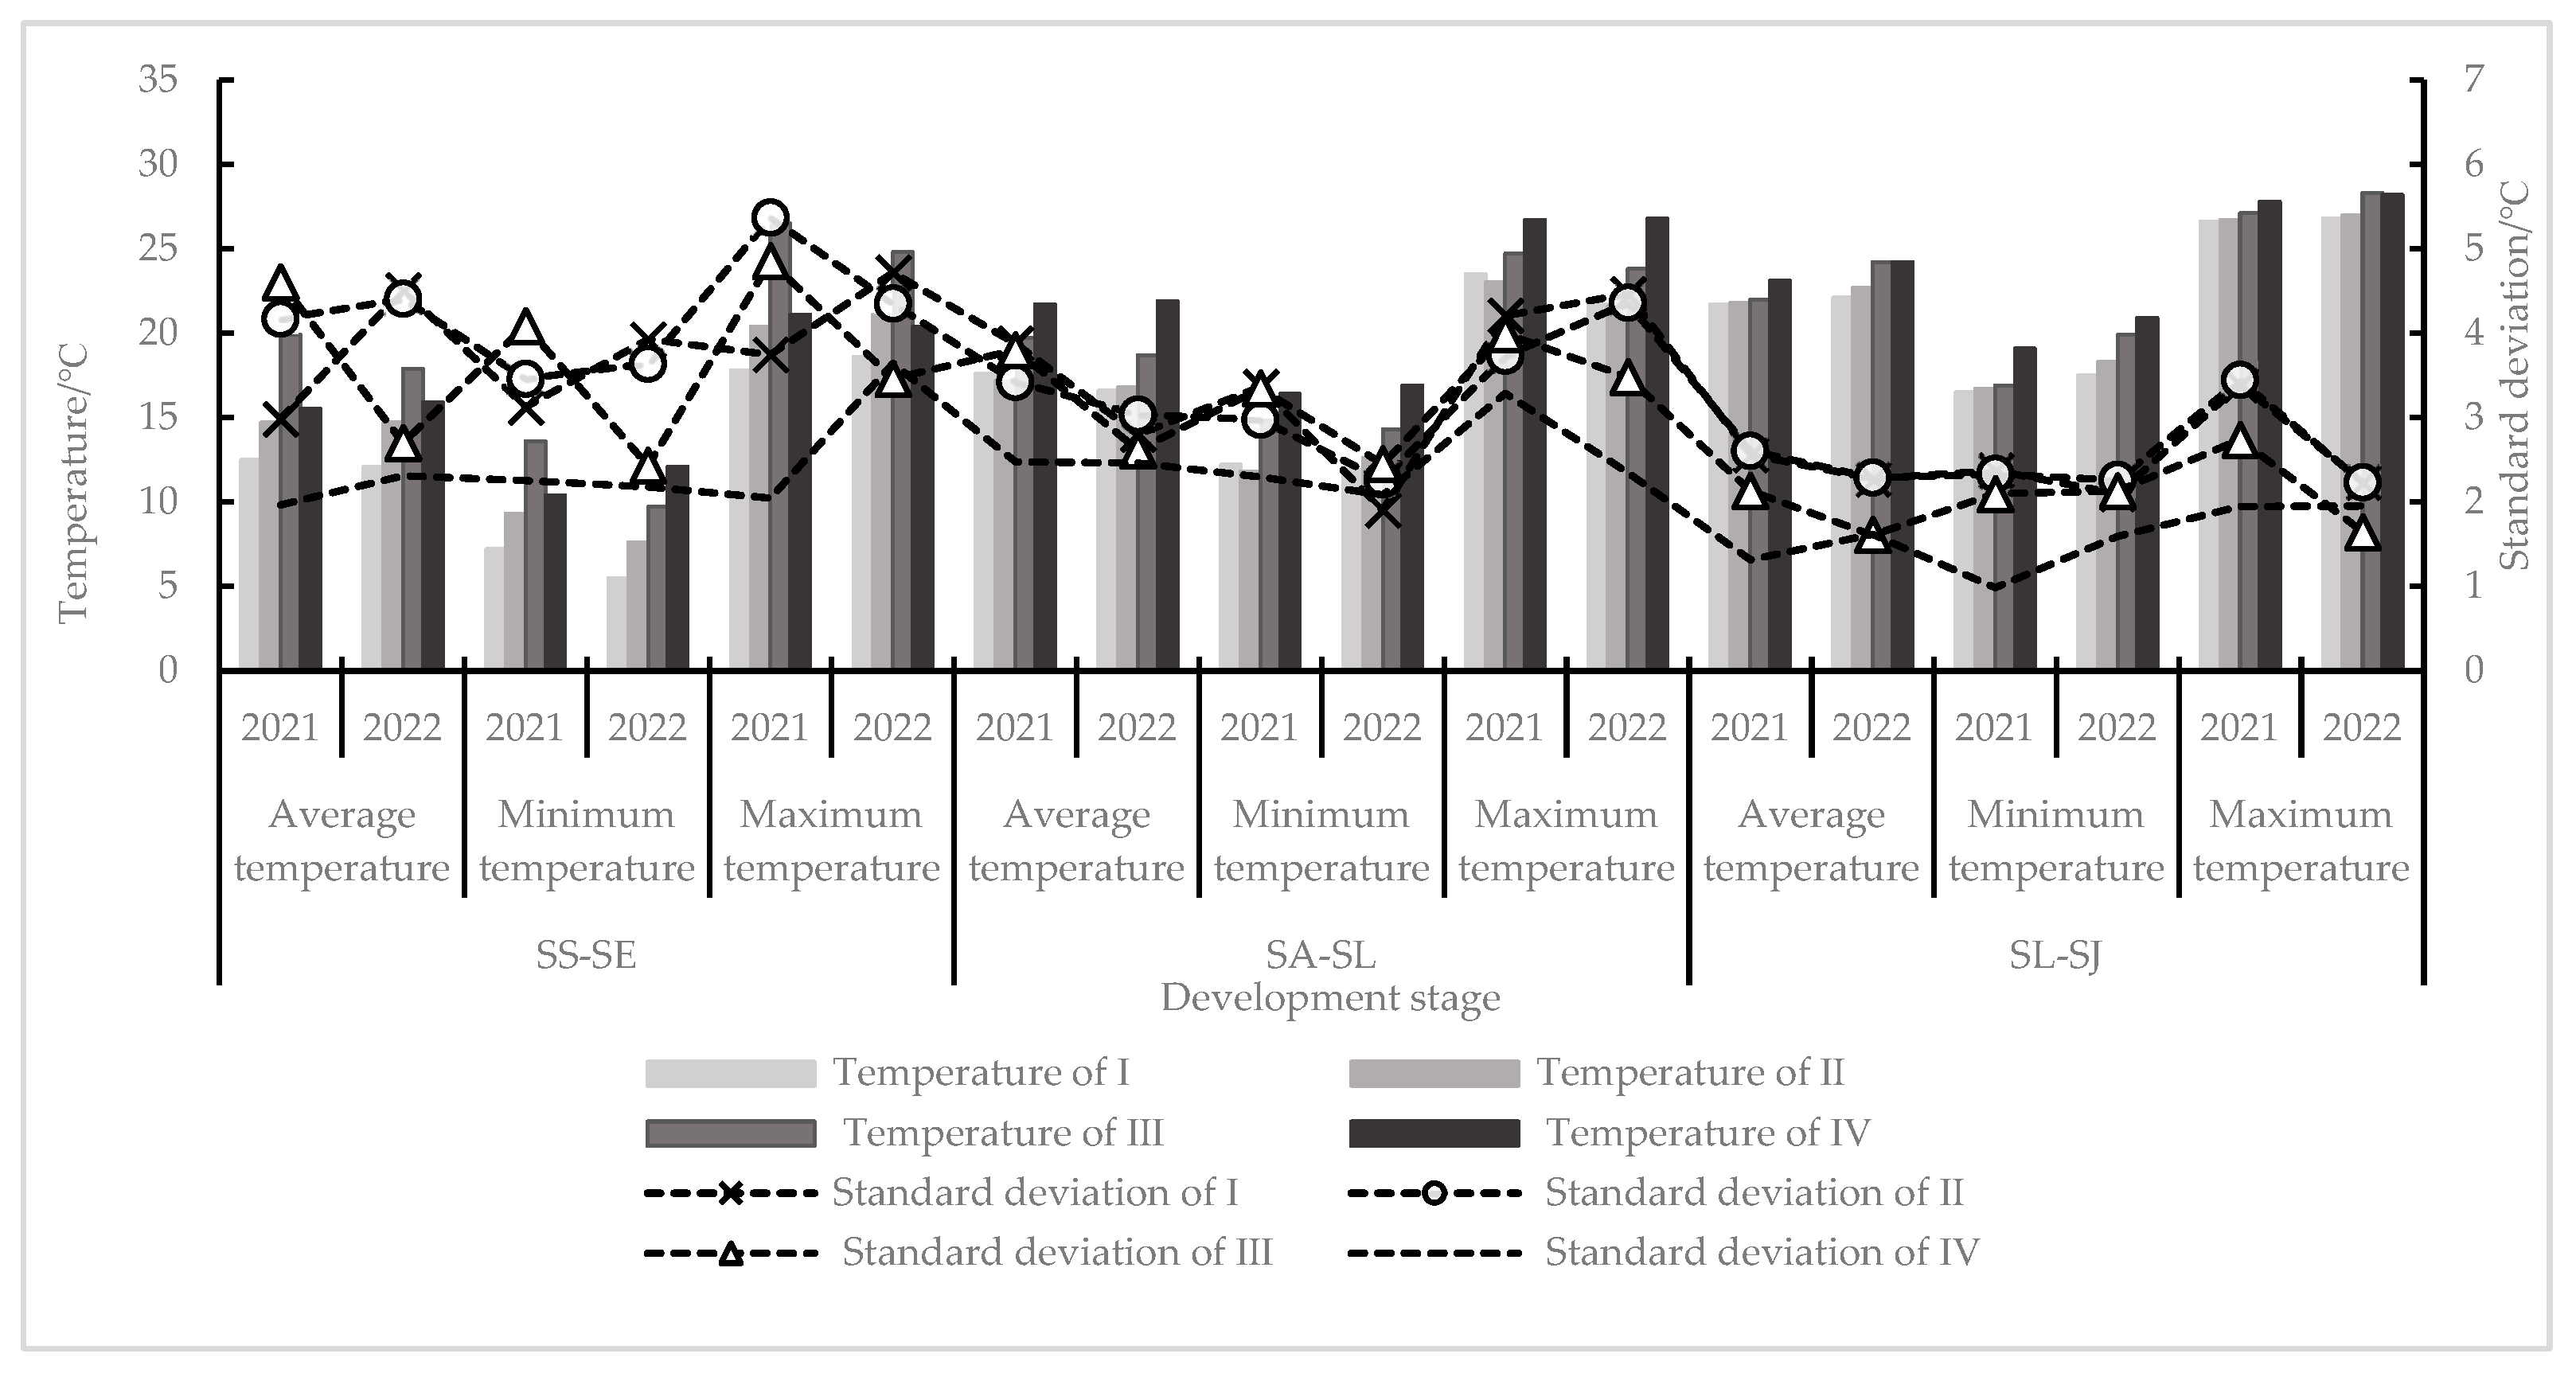
3.1.2. Thermal Condition of Spring Maize on Different Sowing Dates

Figure 5 illustrates the daily average, minimum, and maximum temperatures of spring maize on different sowing dates from 25 April to 28 September in the experimental year, along with the standard deviation. Based on the analysis of the development stages of spring maize, it can be seen that the three temperature factors fluctuate over time. During the sowing-seedling-three leaves-seven leaves stage, the three temperature factors of spring maize showed a large standard deviation, a large statistical dispersion, and an intense oscillation. During the seven leaves–jointing stages, the temperature statistical dispersion was relatively small, and the oscillation tended to be stable. During the jointing-tasselling stage, the temperature statistical dispersion increased, and the oscillation was strengthened. During the filling-milk ripening-mature stage, the temperature statistical dispersion was large, and the oscillation was significantly enhanced.

3.1.3. Effect of Temperature Change on the Development Rate of Spring Maize

This paper explored the effects of temperature on the emergence rate, vegetative growth rate, and reproductive growth rate of spring maize. From Table 2, it can be seen that there was a significant or extremely significant ( p < 0.05 or p < 0.01 ) correlation among the three temperature factors in the experimental year and the seedling rate and vegetative growth rate of spring maize. However, the relationship among the three temperature factors in the experimental year and the reproductive growth rate was not significant (not listed in Table 2). There was a significant linear relationship between the minimum temperature and vegetative growth rate. The rest followed the quadratic equation. And there were differences among the different factors. Among them, the average temperature had the most significant impact on the emergence rate ( p < 0.01 ). The highest temperature played the most crucial role in the vegetative growth rate ( p < 0.01 ).

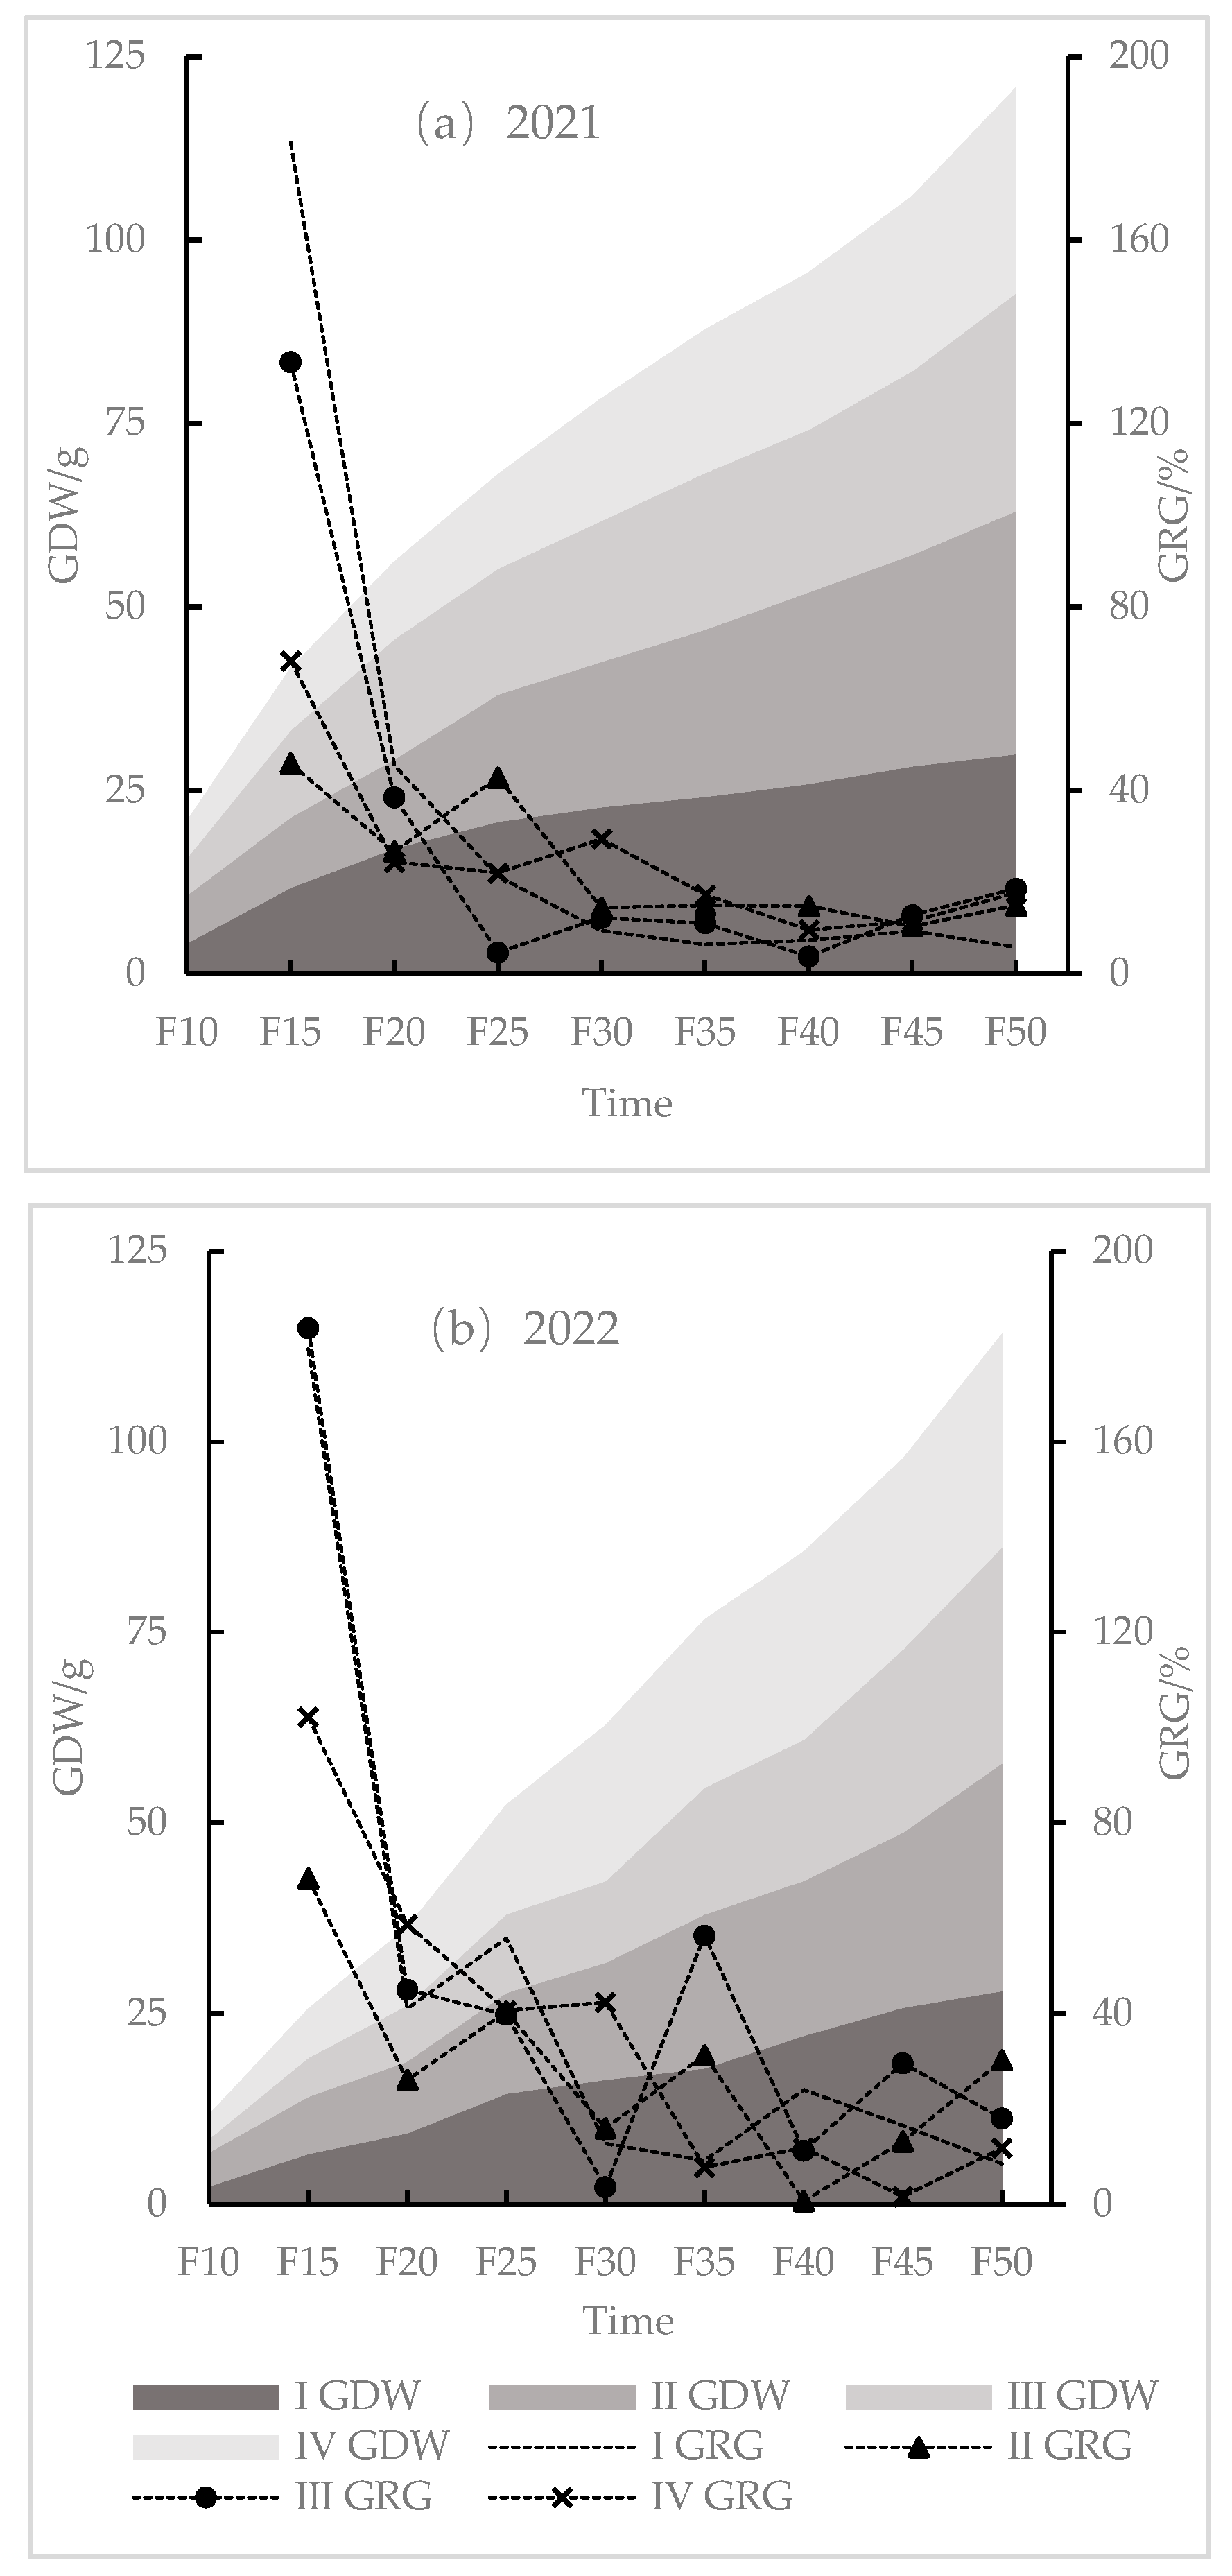
3.2. Effect of Temperature on Dry Weight of Grain Kernel of Spring Maize on Different Sowing Dates

3.2.1. Changes in Dry Weight of Grain Kernel of Spring Maize on Different Sowing Dates

From Figure 6, it can be seen that the dry weight of grain kernel (GDW) of spring maize on different sowing dates in the experimental years showed an increasing trend over time. After 10–50 days of flowering, the GDW of spring maize fluctuated between 1.8 and 33.1 g during different sowing stages. On the 10th and 50th days after flowering, the highest GDW was observed on the second dates of the different sowing dates. The change rate of the dry weight of grain kernel in spring maize (GRG) showed a fluctuating downward trend. The changes in the GRG for Date I and Date III were severe, followed by Date IV, and the changes in Date II were relatively stable. During the 10th–15th day after flowering, spring maize grains significantly increased in weight. The GRG of seven sowing stages in 2a was higher than 68.0%. The GRG of Date I and Date III in 2021 and Date I, Date III, and Date IV in 2022 reached 102.2–183.8%. During the 15th–20th day, the GRG plummeted. In 2021, the GRG of Date I and Date III decreased by 135.8% and 94.9%, respectively. In 2022, the GRG of Date I and Date III decreased by 138.4% and 138.8%, respectively. Twenty days after flowering, the GRG remained within 40.0% for 50% of the total sowing time and within 50% for 80% of the total sowing time.

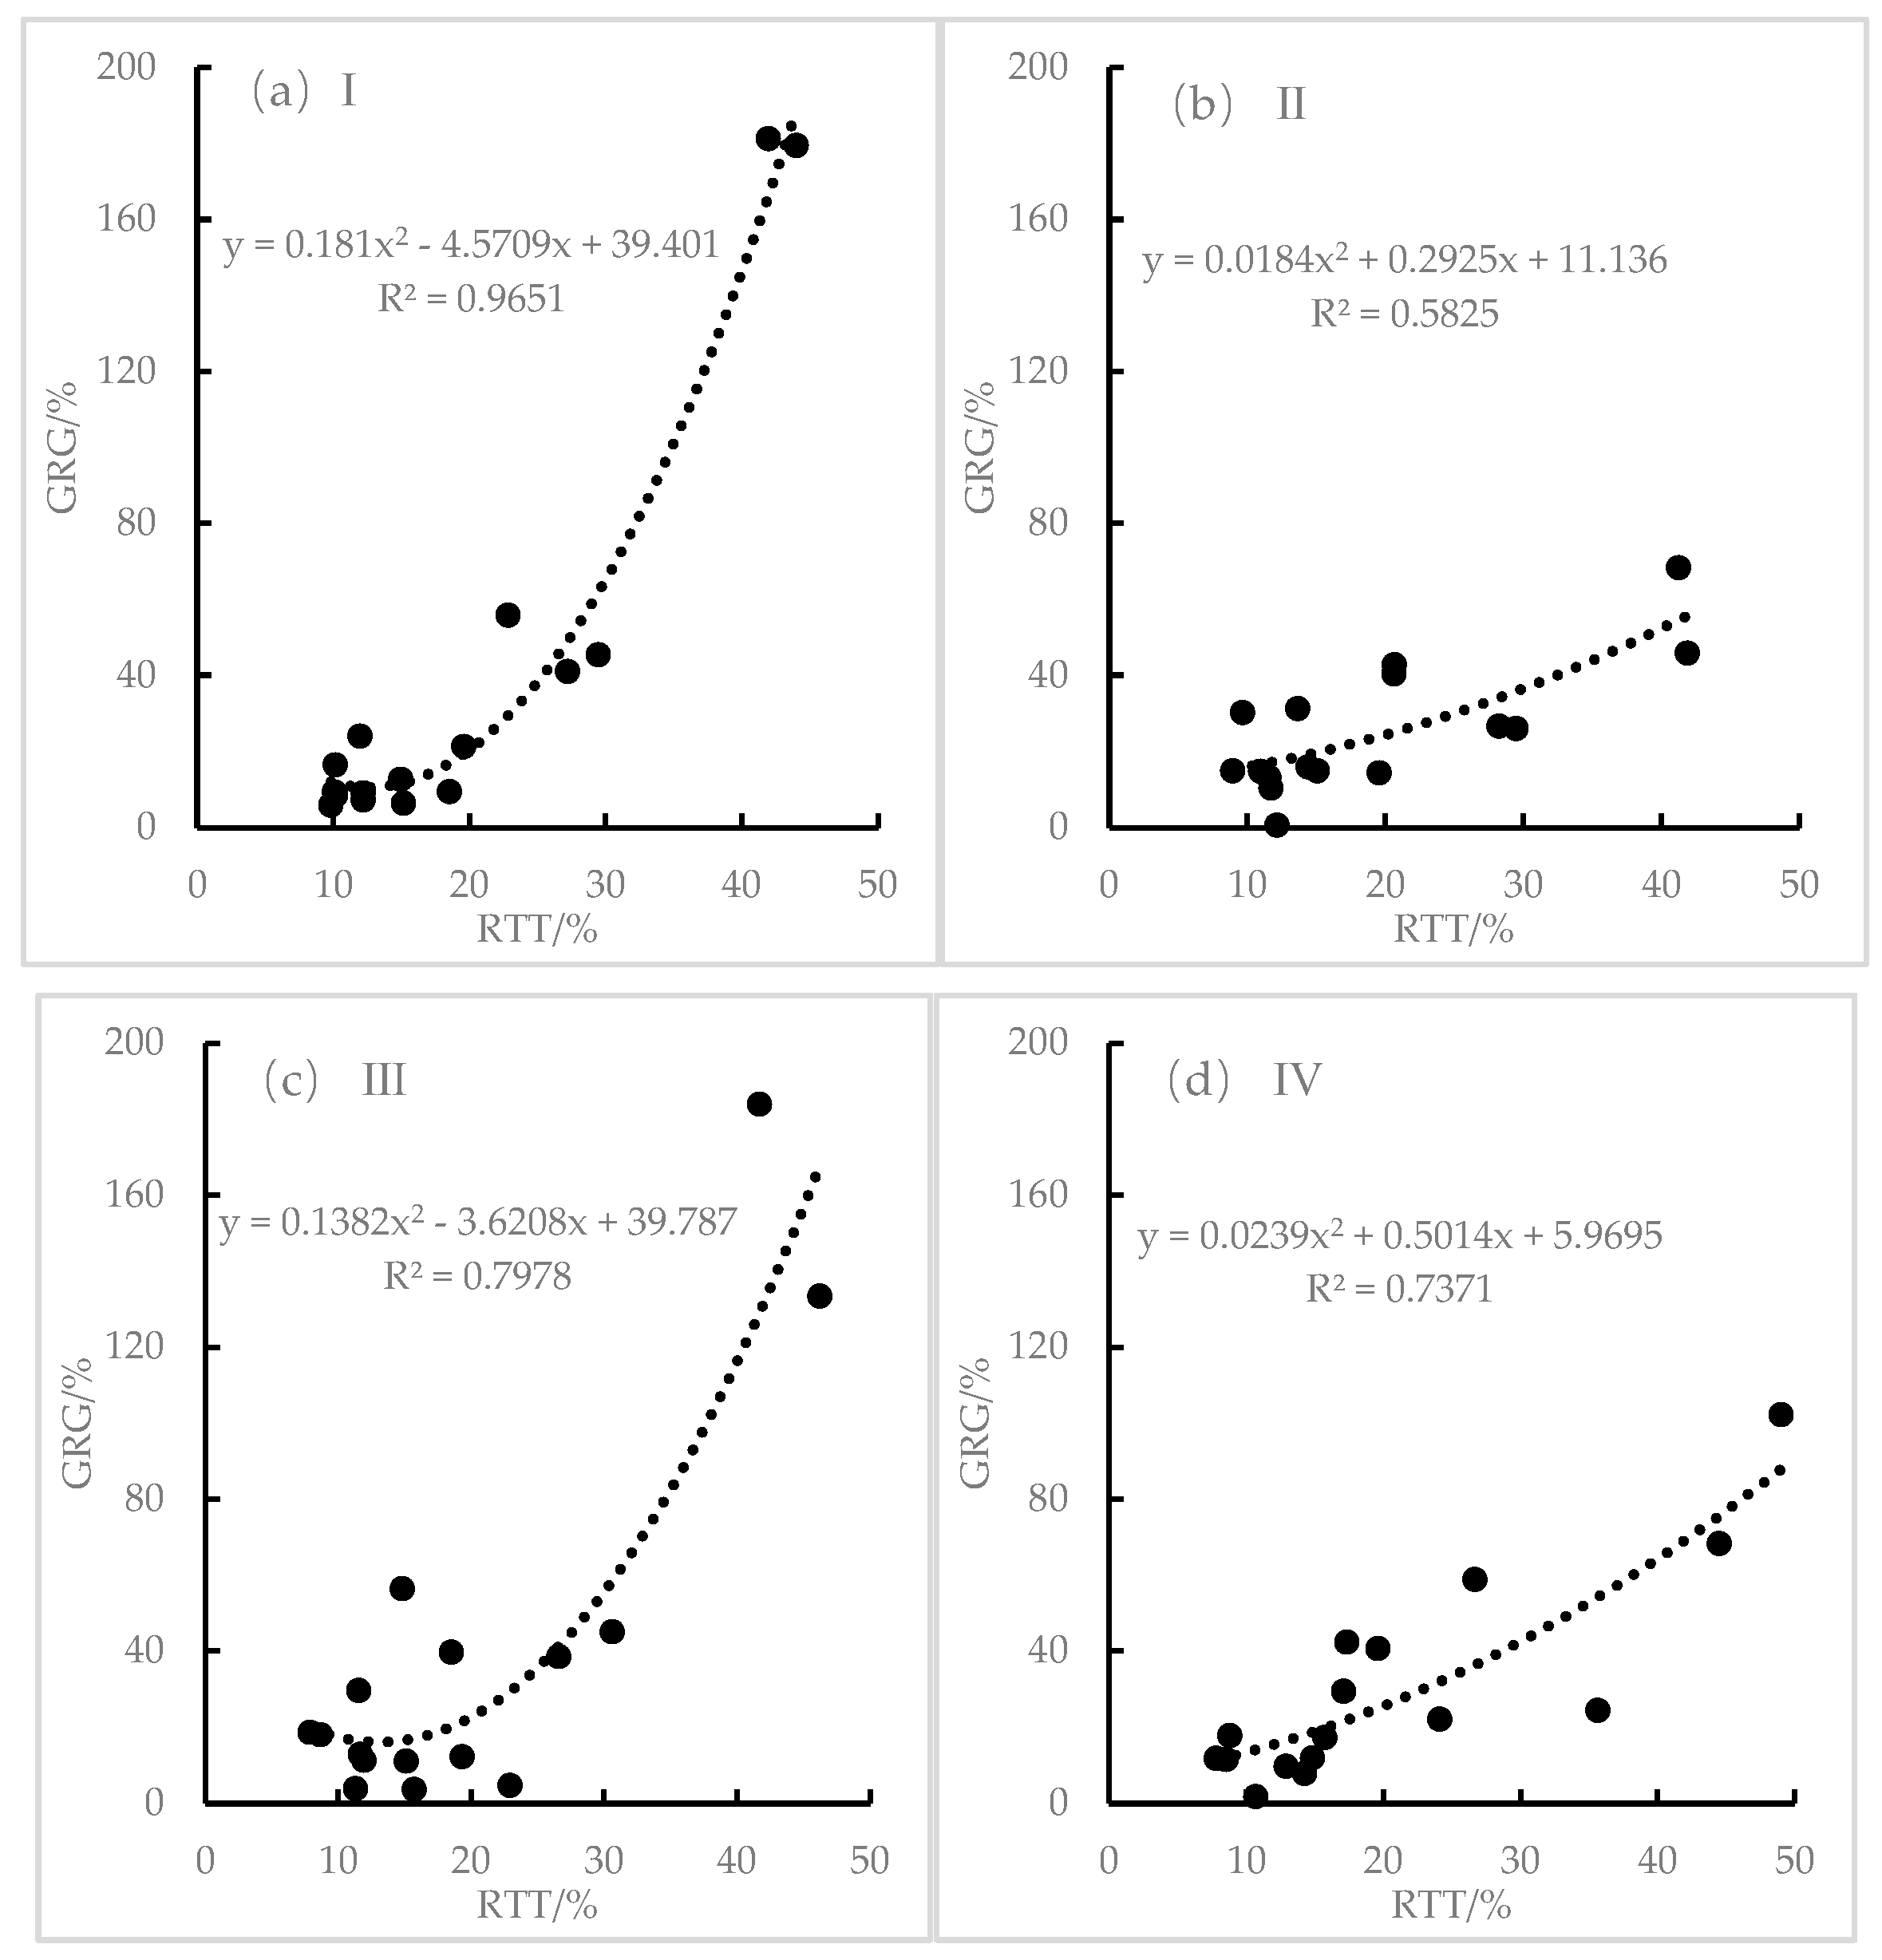
3.2.2. Effect of Accumulated Temperature on Dry Weight of Grain Kernel in Spring Maize

In the test year, the relationship between every 5 days and the change rate of the dry weight of grain kernel during 10–50 days after flowering of spring maize on different sowing dates all conformed to the quadratic equation. All passed the 0.01 significance test (Figure 7). The equation was reliable. This indicated that the temperature conditions had an impact on the grain filling and maturation of spring maize. On different sowing dates, the coefficient of determination ( R T ) and the GRG were different ( R 2 ). That is to say, R T had different contribution rates to the impact of the GRG, manifested as Date I > Date III > Date IV > Date II, with the contribution rate of Date I reaching over 96.5%. There was a difference in the coefficients of the quadratic terms in the equation. The coefficients of Date I and Date III were 4.8–9.8 times higher than those of Date II and Date IV. Although the relationship between R T and GRG was relatively close during the four sowing dates, the coefficient of influence (which refers to the percentage points of decrease in the dry weight of grain kernel change rate for every 1% decrease in the active accumulated temperature change rate in the regression equation) was different. When R T was within the range of 20.0–40.0%, the influence coefficients of different dates varied between 1.40% and 19.7%, and the influence coefficients of Date II and Date IV were relatively small with a small variation range.

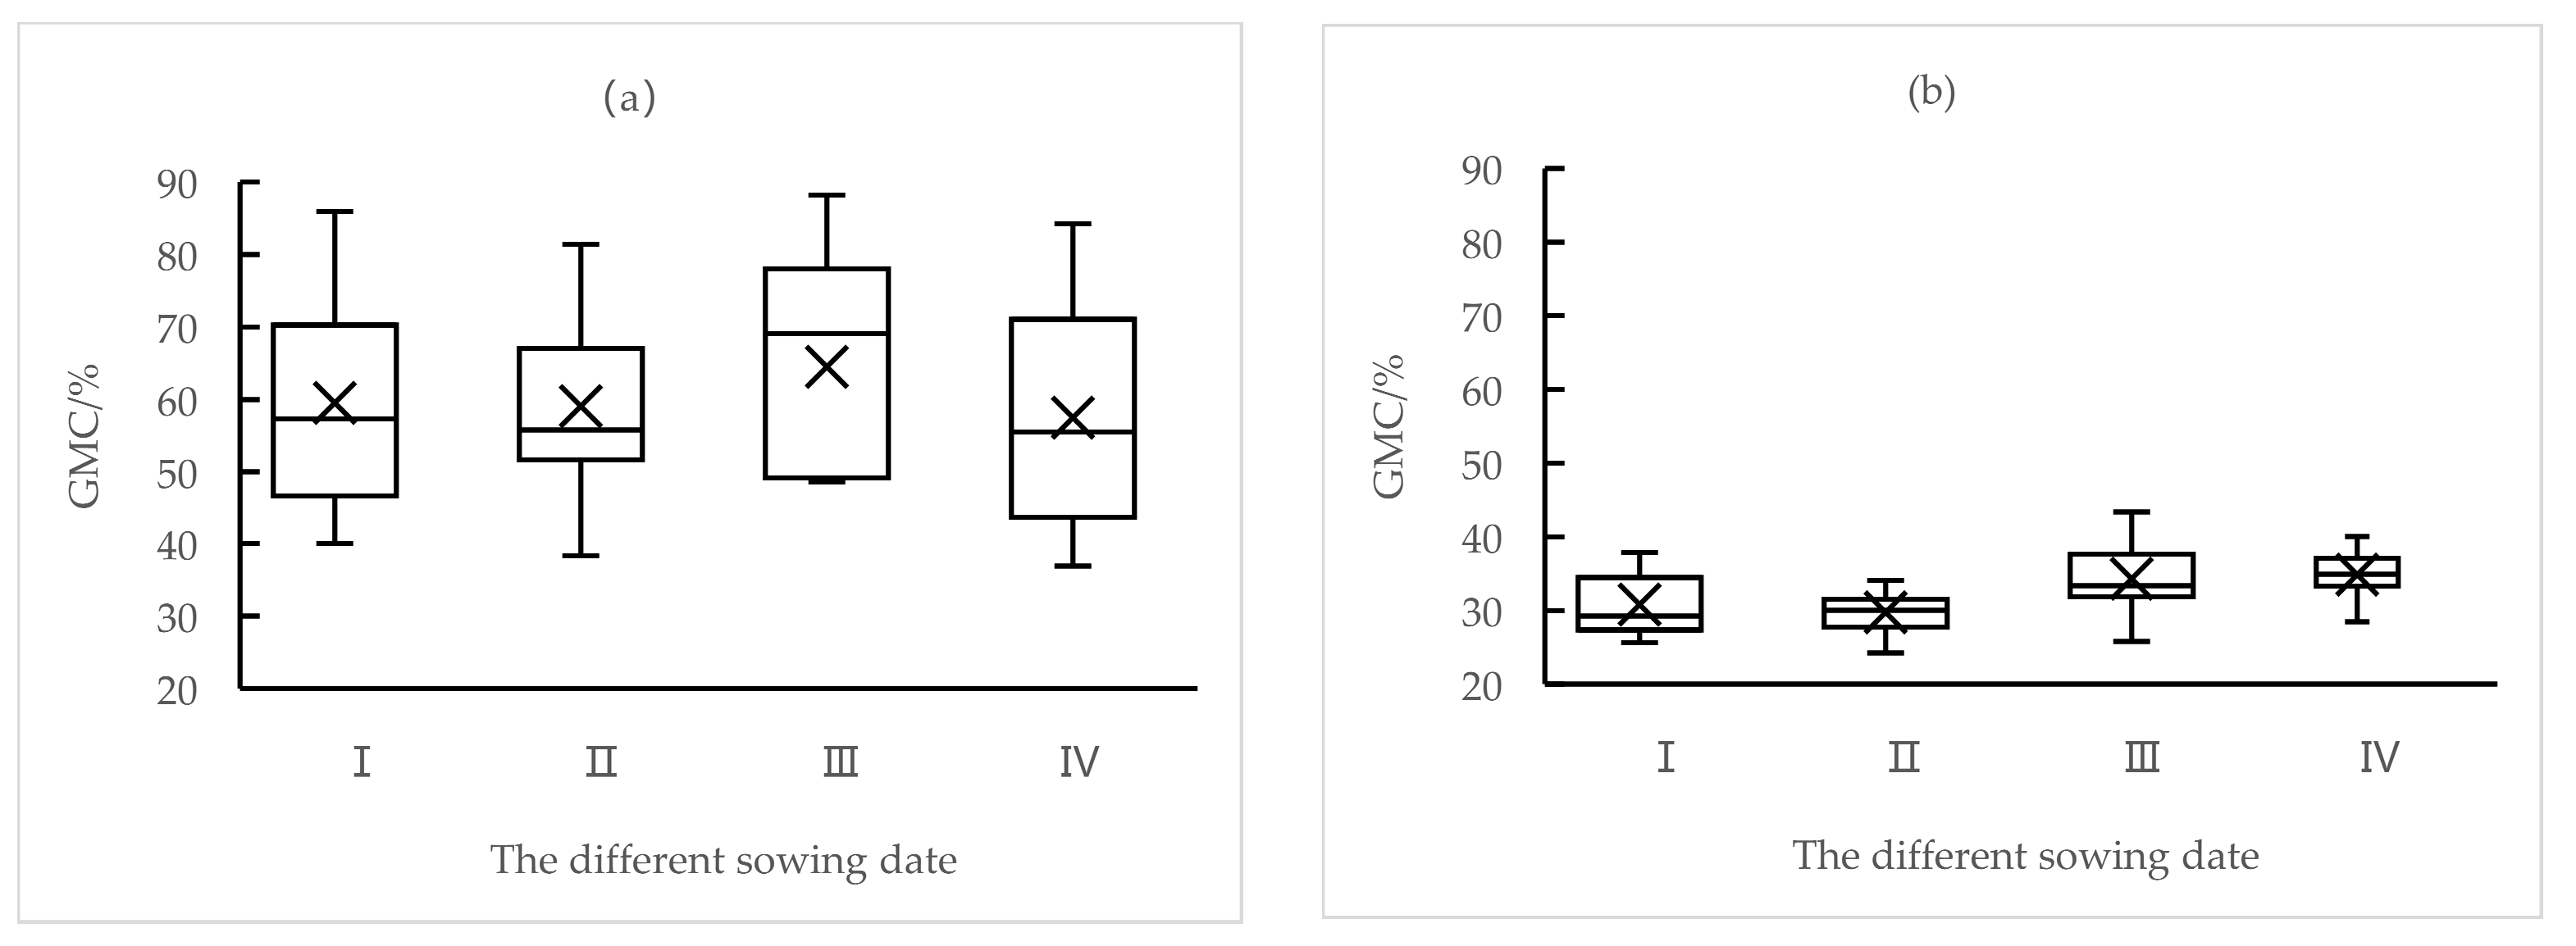
3.3. Effect of Temperature on Grain Moisture Content of Spring Maize on Different Sowing Dates

3.3.1. Changes in Grain Moisture Content of Spring Maize on Different Sowing Dates

This paper also analyzed the grain moisture content of spring maize at the Harbin Agricultural Meteorological Experimental Station in 2022, within 10–50 days after flowering and after physiological maturity. From Figure 8a,b, it can be seen that there were differences in the changes in the grain moisture content in different stages and on different sowing dates. Ten–fifty days after flowering, the grain moisture content was relatively discrete and significantly changed. The maximum moisture content of each date was 1.8–2.3 times the minimum moisture content. Date III had the highest maximum grain moisture content of 88.2%. Date IV had the highest lowest minimum grain moisture content of 36.9%. After physiological maturity, the grain moisture content significantly decreased, and the distribution was relatively concentrated. The maximum moisture content of each stage was about 1.3 times the minimum moisture content. Date III had the highest maximum grain moisture content of 43.4%. Date II had the lowest maximum grain moisture content of 24.3%. Among the four sowing dates, Date II applied the local normal sowing time. The data presented in Figure 7 indicate that the grain moisture content in Date II remains relatively stable at different times, with lower levels compared to the same period.

3.3.2. Effect of Accumulated Temperature on Grain Moisture Content of Spring Maize

The relationship between the active accumulated temperature and the grain moisture content of spring maize flowering during 10–50 days was a logarithmic function ( p < 0.05 or p < 0.01 ), and the relationship between the active accumulated temperature and the grain moisture content of spring maize after physiological maturity was also. The active accumulated temperature was more closely related to the grain moisture content of spring maize flowering during 10–50 days. By comparison, for flowering during 10–50 days, there was a good correlation among each of the sowing dates, with small differences. After physiological maturity, the degree of correlation decreased with the retardation of the sowing date (Table 3). For flowering during 10–50 days, the coefficient of determination ( R 2 ) between the active accumulated temperature of each temperature and the grain moisture content was about 0.95, which indicates that the contribution rate of the active accumulated temperature reached about 95%. After physiological maturity, the contribution rate of the active accumulated temperature was from 47% to 84%. From the slope l n x perspective, for flowering during 10–50 days, the slope l n x of Date II was slightly higher than that of the other sowing dates. After physiological maturity, there were significant differences in the slope l n x among the different sowing dates. Date IV had the largest slope l n x . Date I had a minimum slope l n x (Table 3). When the range of the accumulated temperature was from 200 to 2000 °C·d, the accumulated temperature influence coefficient (this refers to the percentage increase in grain moisture content for every 100 °C·d decrease in temperature accumulation in the regression equation) fluctuated between 1.6% and 13.1%.

4. Discussion

In previous maize experiments, three sowing dates were set to analyze the effects of temperature conditions on different sowing dates on maize emergence, plant height, root number, leaf area index, dry matter weight, unit yield, 100-grain weight, and number of grains per ear [14,15,30,31,32]. Based on the natural conditions, this experiment identified four sowing dates for maize fields with a time step of 10 days, including one early sowing period, one normal sowing period, and two late sowing periods. This experimental design effectively aligned the growth stages of maize with diverse meteorological conditions. The experiment in this paper was conducted at the latest time, incorporating multiple sowing dates, with a specific focus on investigating the growth process, grain weight, and water content of maize. Temperature factors or the accumulated temperature during different periods was utilized to assess the impact of temperature and heat conditions on spring maize growth and grain maturity. Furthermore, a novel model was developed to elucidate the primary influencing factors during distinct time intervals. The model depicting the influence of temperature and accumulated temperature on spring maize growth, grain dry weight, and grain water content adheres to biometric principles. Various temperature indices, including daily mean temperature, minimum temperature, maximum temperature, and accumulated temperature, were employed for analysis. To enhance the accuracy and focus of the study on determining optimal sowing dates in the future, a subset of temperature indices could be selected. Furthermore, it should be noted that this experiment only selected two main maize varieties in Northeast China. While they do possess a certain level of representativeness, their ability to generally depict the overall maize planting situation in most parts of Northeast China is limited. Therefore, future experimental work should focus on optimizing and expanding the range of experimental varieties.
In order to more comprehensively analyze the impact of temperature and heat conditions on maize, this paper expanded upon previous research findings. As previously analyzed, there was a significant G difference during the sowing–seven leaves stage, especially for Date I, where the seedling rate was significantly low. This paper further analyzed the temperature conditions and dispersion during the sowing–seedling stage (SS-SE), seedling-three leaves stage (SE-SA), and three leaves–seven leaves stage (SA-SL). From Figure 9, it can be seen that the average temperature, minimum temperature, and maximum temperature of the three development stages vary sharply on different sowing dates, with a strong dispersion and large temperature fluctuations. The three temperature factors for Date I during the sowing–seedling stage were significantly lower than those during the other sowing dates, especially with a lower range of 4.2–8.7 °C compared to Date III. During the three leaves–seven leaves stage, the three temperature factors for Date I were 3.2–5.3 °C lower than those for Date IV. During the sowing-seven leaves stage, the relative soil moisture in the experimental area ranged from 60% to 84%, and the soil moisture remained normal, with no drought or waterlogging [33,34]. During the three leaves-seven leaves stage, the average sunshine duration was about 6.5 h. Based on the analysis of Figure 3 and Table 2, it can be concluded that under the conditions of suitable soil moisture and similar lighting, the temperature effect can explain the slow emergence and growth of spring maize seedlings for Date I. In other words, for Date I, the sowing-seedling stage and the three leaves-seven leaves stage showed a large temperature statistical dispersion and a significantly lower temperature than other sowing dates. Low temperature had an inhibitory effect on the rapid seedling and growth of spring maize, resulting in a decrease in the emergence rate and vegetative growth rate of spring maize and an extension of its development time.
The emergence rate of spring maize in the Harbin region of Northeast China remained at 6.06% throughout the year (16.5 days from sowing to seedling), and the vegetative growth rate was 1.60% (62.5 days from seedling to tasseling). Taking this as the boundary, if the emergence rate is higher than 6.06%, it is considered that the seedling is normal and faster, and vice versa. A vegetative growth rate higher than 1.60% is considered normal or relatively fast, while the opposite is taken as slow. According to Table 2, when the average temperature, minimum temperature, and maximum temperature during the sowing–seedling stage were 10.1 °C, 3.5 °C, and 15.8 °C, respectively, the emergence rate was close to 0; when the temperature was 13.2 °C, 6.9 °C, and 18.9 °C, respectively, the emergence rate reached 6.06%. When the temperature was 20.2 °C, 13.9 °C, and 25.9 °C, respectively, the emergence rate basically reached the maximum. In the above temperature range, the average temperature, minimum temperature, and maximum temperature increased by 1 °C, and the average spring maize emergence rate increased by 1.05%, 0.99%, and 1.07% respectively. When the average temperature and maximum temperature were 15.8 °C and 20.3 °C, respectively, the vegetative growth rate of spring maize was close to 0. When the average temperature and maximum temperature were 22.3 °C and 27.1 °C, respectively, the vegetative growth rate of spring maize reached 1.60%. When the average temperature and maximum temperature were 25.8 °C and 32.4 °C, respectively, the vegetative growth rate of spring maize reached its maximum. Within the above temperature range, for every 1 °C increase in the average temperature and maximum temperature, the vegetative growth rate of spring maize increased by 0.16% and 0.16%, respectively. For every 1 °C increase in the minimum temperature, the vegetative growth rate of spring maize increased by 0.09%. It can be seen that within a certain temperature range, temperature had a significant positive effect on the growth and development of spring maize. During the seedling stage, when the average temperature, minimum temperature, and maximum temperature were lower than 13.2 °C, 6.9 °C, and 18.9 °C, respectively, it was not conducive to the rapid seedling of spring maize. During the vegetative growth stage, when the average temperature and maximum temperature were below 22.3 °C and 27.1 °C respectively, it was not conducive to the rapid growth of spring maize. All of these were consistent with the research conclusions of Ma Shuqing et al. [24].
Spring maize on different sowing dates matured normally, but there were differences in yield components such as ear length, number of grains per plant, and 100-grain weight. These were characterized as the highest for Date II, followed by Date III, and the lowest for Date I or Date IV. There were no severe droughts, waterlogging, frost, or other disasters during the entire growth stage of spring maize on different sowing dates in the experimental year, which rules out the possible different impacts of disasters. It was found that the light, heat, and water conditions are different on different sowing dates. With the postponement of sowing dates, the sunshine duration, active accumulated temperature ≥10 °C, and precipitation showed a decreasing trend. Compared with Date IV, Date II had more sunshine duration (134.2 h), ≥ 10 °C active accumulated temperature (164.5 °C·d), and precipitation (34.5 mm) in 2021 and had more sunshine duration (160.2 h), ≥ 10 °C active accumulated temperature (220.6 °C·d), and precipitation (14.3 mm) in 2022. The sunshine duration, ≥10 °C active accumulated temperature and precipitation for Date I and Date II were the same, but the yield components such as the 100-grain weight for Date I were relatively low. These can be attributed to the early sowing for Date I, low temperature from sowing to emergence, unsuitable temperature conditions, long seed germination time, slow seedling, and poor growth after seedling. Compared to Date II, the plant height of Date I during the jointing stage was 12.4% lower in 2021 and 4.9% lower in 2022; the aboveground dry biomass weight of Date I decreased by 27.5% in 2021 and 16.9% in 2022; during the mature stage, the aboveground dry biomass weight decreased by 5.6% in 2021 and 22.6% in 2022. The above situation ultimately led to poor yield formation. It can be concluded that the yield formation of spring maize on different sowing dates was corresponding to the meteorological conditions. Suitable and sufficient light, heat, and water resources were more conducive to the emergence, growth, and yield formation of spring maize, which was completely consistent with existing research conclusions [20].
The experiment was conducted in maize fields over four phases, with a time step of 10 days, taking into account the natural conditions. The developed model accurately captured the impact of temperature on spring maize growth, grain dry weight, and grain water content, perfectly aligning with biometrical principles. Previous studies primarily utilized daily average temperature and accumulated active temperature ≥10 °C, focusing on Danyu 6, Yuandan 29, Longdan 13, and so on, as test materials to investigate the impact of temperature on spring maize [14,24]. In this study, novel and diverse varieties were employed. The effects of temperature conditions on spring maize growth and grain maturity were assessed using various parameters such as average daily temperature, minimum and maximum temperatures, and their cumulative values during different periods. Furthermore, a new model was developed to elucidate the key influencing factors during distinct time intervals.

5. Conclusions

The growth of spring maize was influenced by various time and temperature factors in distinct ways. The emergence rate of spring maize was mostly influenced by the average temperature, while the vegetative growth rate was primarily affected by the maximum temperature, while the vegetative growth rate was primarily affected by the maximum temperature. The temperature rising and falling during adjacent development stages was one of the main factors affecting the growth and development of spring maize. Low temperature prolonged the growth and development time of spring maize.
Heat changes had a significant impact on the ripening of spring maize grains. The change rate of ≥10 °C active accumulated temperature had a very significant correlation with the change rate of the grain kernel dry weight (p < 0.01). The change rule of accumulated temperature on the grain dry weight change rate during different sowing periods was not evident; however, there were variations in the influence coefficients. Specifically, the influence coefficient was higher for Date I and Date III, while it was lower for Date II and Date IV. The relationship between the accumulated temperature and the grain moisture content of spring maize was characterized by a logarithmic function ( p < 0.05 or p < 0.01 ). From 10 to 50 days after flowering, the heat effect could explain about 95% of the change in the grain moisture content. After physiological maturity, the influence of temperature can explain the change by 56–83%.
From the research results of this paper, in comparison, the second sowing date had the highest yield, and the sowing dates were relatively optimal. From the perspective of heat utilization efficiency, early sowing was prone to encountering low temperatures, resulting in ineffective utilization of heat in the early dates, while late sowing was prone to less heat. Both were not the most suitable conditions for growth and yield formation, which were not conducive to better improving the yield of spring maize. If early sowing is used to strive for the utilization of more climate resources, it is necessary to pay attention to the spring climate prediction of the planting year and reasonably arrange the planting time to avoid being affected by low temperatures. This paper did not provide a detailed analysis of the effects of light, temperature, water matching, or synergistic effects on the growth, development, and grain maturity of spring maize. The future holds opportunities for us to continue conducting sowing experiments in both the same and different regions, allowing for statistical analysis and comparative studies using observational data such as sunshine, precipitation, and temperature. Additionally, we can utilize artificial climate chambers to simulate and control various temperature and moisture conditions. Through these scientific experiments, we aim to explore the combined effects of meteorological conditions on spring corn growth and yield. Further research is needed in those areas in the future.

Author Contributions

L.J. (Lixia Jiang) and Z.C. conceived and designed the experiments; M.W., Y.G. and L.G. performed the experiments; S.J., L.J.(Lanqi Jiang) and L.G. analyzed the data; L.J. (Lanqi Jiang) drafted the manuscript. All authors have read and agreed to the published version of the manuscript.

Funding

This study was funded by the National Key Research and Development Program of China (No. 2022YFD2300201); the Fund of the Chinese Central Government for Basic Scientific Research Operations in Commonwealth Research Institutes (No. 2018SYIAEHZ1); the National Natural Science Foundation of China (No. 31671575); and the Natural Science Foundation of Heilongjiang Province, China (No. LH2022D025; No. LH2022D024). The main funders of the study were Zhao Yanxia, the Chinese Academy of Meteorological Sciences; Jiang Lixia, the Heilongjiang Province Institute of Meteorological Science; Ji Ruipeng, the Institute of Atmospheric Environment, China Meteorological Administration, Shenyang; Yan Ping, the Heilongjiang Province Institute of Meteorological Science; Ji Yanghui, the Heilongjiang Province Institute of Meteorological Science.

Institutional Review Board Statement

Not applicable.

Informed Consent Statement

Not applicable.

Data Availability Statement

The data presented in this study are available on request from the corresponding author. The data are not publicly available due to that high precision meteorological data are not suitable for public disclosure.

Conflicts of Interest

The authors declare no conflict of interest.

References

  1. Mir, K.A.; Park, C.; Purohit, P.; Kim, S. Comparative analysis of greenhouse gas emission inventory for Pakistan: Part II agriculture, forestry and other land use and waste. Adv. Clim. Chang. Res. 2021, 12, 132–144. [Google Scholar] [CrossRef]
  2. Ding, Y.H. Sustainalbe management and action in China under the increasing risks of global climate change. Engineering 2018, 4, 301–305. [Google Scholar] [CrossRef]
  3. Shang, M.F.; Shi, X.Y.; Zhao, J.C.; Li, S.; Chu, Q.Q. Spatiotemporal variation of high temperature stress in different regions of China under climate change. Acta Agron. Sin. 2023, 49, 167–176. [Google Scholar]
  4. Jiang, L.X.; Li, X.F.; Zhu, H.X.; Gao, M.; Wang, Q.J.; Yan, P.; Gong, L.J.; Zhai, M.; Ji, Y.H.; Wang, P. Characteristics of combination of cold damage and drought during seedling period and its effects on maize yield in Heilongjang Province. Agric. Res. Arid. Areas 2020, 38, 255–265. [Google Scholar]
  5. Waldhoff, S.T.; Wing, I.S.; Edmonds, J.; Leng, G.; Zhang, X. Future climate impacts on global agricultural yields over the 21st century. Environ. Res. Lett. 2020, 15, 114010. [Google Scholar] [CrossRef]
  6. Li, F.D.; Leng, P.F.; Zhang, Q.Y.; Song, S.; Qiao, Y.F.; Gu, C.K.; Zhang, Q.; Wu, L.; Mulubrhan, B.; Dagne, M.; et al. Understanding agriculture production and food security in Ethiopia from the perspective of China. J. Resour. Ecol. 2018, 9, 237–249. [Google Scholar]
  7. Jiang, L.X.; Li, S.L.; Zhang, X.M.; Cao, L.; Liu, Y.H.; Yan, P.; Han, J.J.; Jiang, L.Q.; Chu, Z. Characteristics of temperature and water in drought and cold damage cross-stress of maize and its yield analysis in Heilongjiang province. J. Catastrophol. 2022, 37, 29–35. [Google Scholar]
  8. Guo, J.P. Advances in impacts of climate on agricultural production in China. J. Appl. Meteorol. Sci. 2015, 26, 1–11. [Google Scholar]
  9. Liang, X.H.; Zhao, X.; Chen, B.Y.; Wang, H.J.; Wang, N.; Liu, C.G.; Cao, T.H. Effect of Temperature on the Growth and Yield of Maize under Different Planting Patterns. Mol. Plant Breed. 2018, 16, 8208–8213. [Google Scholar]
  10. Zhang, M.C.; Zhang, J.L.; Zhao, Y.J.; Zhang, K.X.; Zhou, Z.W.; Che, X.J. The Effect of Temperature Changes on the Growth Rate and Yield of Different Organs of Maize in Longdong Region. Jiangsu Agric. Sci. 2020, 48, 84–90. [Google Scholar]
  11. Wang, H.M.; Hou, Q.; Yun, W.L. Effect of Temperature Change on Growth and Yield Structure of Maize in Hetao Irrigation District. Chin. Agric. Sci. Bull. 2016, 32, 19–23. [Google Scholar]
  12. Hou, X.F.; Wang, Y.Y.; Huang, S.B.; Dong, X.; Tao, H.B.; Wang, P. Effect of high temperture during flowering on pollen development and seed setting rate of maize (Zea mays L.). J. China Agric. Univ. 2020, 25, 10–16. [Google Scholar]
  13. Guo, C.M.; Ren, J.Q.; Cao, T.H.; Xu, C.; Li, J.P.; Qu, S.M. Effect of low temperture during ear differentiation stage on yield components of spring maize. J. Appl. Meteorol. Sci. 2018, 29, 505–512. [Google Scholar]
  14. Wang, Q.; Ma, S.Q.; Guo, J.P.; Zhang, T.L.; Yu, H.; Xu, L.P. Effect of airtemperature on maize growth and its yield. Chin. J. Ecol. 2009, 28, 255–260. [Google Scholar]
  15. Jin, Y.H.; Zhou, D.W.; Qin, L.J. Sowing date of corn in semiarid region of Jilin Province, Northeast China in adapting to climate change. Chin. J. Appl. Ecol. 2012, 23, 2795–2802. [Google Scholar]
  16. Verma, N.K. Integrated nutrient management in winter maize (Zea mays L.) sown at different dates. J. Plant Breed. Crop Sci. 2011, 3, 161–167. [Google Scholar]
  17. Qin, Y.L.; Mao, L.X.; Zhou, G.S. Changes in global main crop yields and its meteorological risk assessment. Rransactions Chin. Soc. Agric. Eng. 2016, 32, 226–235. [Google Scholar]
  18. Han, Y.Q.; Gao, Y.M.; Zheng, D.F.; Du, J.D. Effects of meteorological factors on yield traits of maize (Zea mays L.) in Heilongjiang during various sowing seasons. Agric. Res. Arid. Areas 2016, 34, 132–138. [Google Scholar]
  19. Solaimalai, A.; Arunkumar, N.; Jeyakumar, M.; Jawahar, D. Effect of dates of sowing and integrated nutrient management practices on growth, yield attributes and yield of hybrid maize under rainfed vertisol of Tamil Nadu. Adv. Life Sci. 2016, 5, 3456–3460. [Google Scholar]
  20. Gao, Y.G.; Gao, M.; Zhao, H.Y.; Liu, D.; Yang, X.Q.; Zhang, Z.G. Sowing Date and Yield of Maize: Effects on Photosynthetic Characteristics. Chin. Agric. Sci. Bull. 2020, 36, 19–27. [Google Scholar]
  21. Rahman, M.M.; Ahammad, K.U.; Ahmed, M. Effect of seed priming on maize (Zea mays L.) seedling emergence under different sowing dates. Bangladesh J. Agric. Res. 2014, 39, 693–707. [Google Scholar] [CrossRef]
  22. Harlapur, S.; Kulkarni, M.K.; Hegde, Y. Effect of sowing date and weather parameters on turcicum leaf blight severity and yield in maize. Indian Phytopathol. 2007, 60, 187–190. [Google Scholar]
  23. Zou, J.L.; Cui, Z.Y.; Xu, Y.; Zhu, X. Comparison of Grain Dehydration Process and Yield Formation for Summer Maize under Different Sowing Dates in Huanghuaihai Plain. Chin. J. Agrometeorol. 2022, 43, 112–123. [Google Scholar]
  24. Zhou, B.Y.; Yue, Y.; Sun, X.F.; Ding, Z.S.; Ma, W.; Zhao, M. Maize kernel weight responses to sowing date-associated variation in weather conditions. Crop J. 2017, 5, 43–51. [Google Scholar] [CrossRef]
  25. Ma, N.; Yu, K.; Zhang, Y.; Zhai, J.; Zhang, Y.; Zhang, H. Ground observed climatology and trend in snow cover phenology across China with consideration of snow-free breaks. Clim. Dyn. 2020, 55, 2867–2887. [Google Scholar] [CrossRef]
  26. Jiang, L.X.; Zhao, H.Y.; Qu, H.H. Effect of drought and cold damage cross-stress on maize yield in Heilongjiang Province. Meteorol. Mon. 2021, 47, 94–105. [Google Scholar]
  27. QX/T 361-2016; Specifications for Agrometeorological Observation-Maize. China Meteorological Administration: Beijing, China, 2016.
  28. Yu, Z.F.; Ding, W.X.; Chen, M. Statistical processing and interpretation of data. In Judgment and Processing of Outliers of Normal Samples; China Meteorological Press: Beijing, China, 2008; pp. 1–14. [Google Scholar]
  29. Wei, F.Y. Modern Climate Statistical Diagnosis and Prediction Techniques; China Meteorological Press: Beijing, China, 1999. [Google Scholar]
  30. Ma, S.Q.; Wang, Q.; Luo, X.L. Effect of climate change on maize (Zea mays) growth and yield based on stage sowing. Acta Ecol. Sin. 2008, 28, 2131–2139. [Google Scholar]
  31. Zhang, S.P.; Wang, Y.B.; Zhao, H.Y. Quantitative analysis of temperature conditions and maize growth and yield formation in spring maize region of Northeast China. J. Maz. Sci. 2022, 30, 54–62. [Google Scholar]
  32. Gao, Z.L.; Yang, Y.L.; Zhang, M. Research progress on regulation of maize growth, development and yield by sowing date under climate change. South China Agric. 2022, 16, 37–42. [Google Scholar]
  33. QX/T 259-2015; Drought Grade of Spring Maize in Northern China. China Meteorological Press: Beijing, China, 2015.
  34. Li, S.; Du, C.Y. Manual of Agrometeorological Application Service in Heilongjiang; Northeast Forestry University Press: Harbin, China, 2013; pp. 21–37. [Google Scholar]
Figure 1. (a) Study area location; (b) close view of the study area.
Atmosphere 14 01755 g001
Figure 2. Schematic plan of the experimental area.
Atmosphere 14 01755 g002
Figure 3. Relative soil moisture on different sowing dates and the same development period of maize in the experimental year.
Atmosphere 14 01755 g003
Figure 4. Growth and development rate of each development periods of spring maize on different sowing dates in the experimental year. (I, II, III, and IV were fourth sowing’s Date I, Date II, Date III, and Date IV; SS-SE, sowing-seedling stage; SE-SA, seedling-three leaves stage; SA-SL, three leaves-seven leaves stage; SL-SJ, seven leaves-jointing stage; SJ-ST, jointing-tasseling stage; ST-SR, tasseling-milk ripening stage; SR-SM, milk ripening-mature stage).
Atmosphere 14 01755 g004
Figure 5. Change in the daily average temperature (a), minimum temperature (b), maximum temperature (c), and standard deviation from sowing to maturity on different sowing dates of spring maize in 2021 and 2022.
Atmosphere 14 01755 g005
Figure 6. Change in grain dry weight and growth rate of grain dry weight on different sowing dates of spring maize in 2021 (a) and 2022 (b).
Atmosphere 14 01755 g006
Figure 7. The relationship between R T and GRG during the 10th-50th day after flowering of spring maize. (a) Date I; (b) Date II; (c) Date III; (d) Date IV.
Atmosphere 14 01755 g007
Figure 8. Changes in grain moisture content from 10 to 50 days after flowering (a) and after physiological maturity (b) for 4 sowing dates of spring maize.
Atmosphere 14 01755 g008
Figure 9. Temperature changes on different sowing dates of spring maize from 2021 to 2022, including the sowing-seedling stage, seedling-three leaves stage, and three leaves-seven leaves stage.
Atmosphere 14 01755 g009
Table 1. Encoding information of spring maize growth stage and adjacent development stage.
Growth StageCodeDevelopment StageCodeInterval Days
sowing stageSSsowing–seedling stageSS-SE17
seedling stageSEseedling–three leaves stageSE-SA7
three leaves stageSAthree leaves–seven leaves stageSA-SL16
seven leaves stageSLseven leaves–jointing stageSL-SJ17
jointing stageSJjointing–tasseling stageSJ-ST24
tasseling stageSTtasseling–milk ripening stageST-SR28
milk ripening stageSRmilk ripening–mature stageSR-SM34
mature stageSM
Table 2. The correlation between temperature and the emergence rate, vegetative growth rate of spring maize on different sowing dates in 2021 and 2022. (The regression equation y1 in the table represents the emergence rate (%) of spring maize, while y2 represents the nutrient growth rate (%) of spring maize. x1 is the average temperature, x2 refers to the average minimum temperature (°C), and x3 stands for the average maximum temperature (°C).)
Temperature FactorsEmergence Rate
R 2 Regression Equation
Average temperature0.886 ** 1 y 1 = 0.1156 x 1 2 + 4.6699 x 1 35.355
Average minimum temperature0.707 * y 1 = 0.1007 x 2 2 + 2.8017 x 2 8.3698
Average maximum temperature0.794 * y 1 = 0.1125 x 3 2 + 5.8294 x 3 63.847
Temperature FactorsVegetative Growth Rate
R 2 Regression Equation
Average temperature0.790 * y 2 = 0.018 x 1 2 + 0.9296 x 1 10.179
Average minimum temperature0.565 * y 2 = 0.0861 x 2 + 0.0393
Average maximum temperature0.893 ** y 2 = 0.0133 x 3 2 + 0.8624 x 3 12.004
1: * and ** passed through the test at α = 0.05 and α = 0.01 significance levels, respectively.
Table 3. The relationship equations between grain moisture content and the daily average temperature accumulation value.
Measuring TimeIII
Flowering during 10–50 days0.98 **0.92 **
After physiological maturity0.83 **0.75 **
IIIIV
10–50 days after flowering0.92 **0.95 **
After physiological maturity0.64 **0.56 *
Note: R is the determination coefficient of the equation, which indicates the degree of explaining the grain moisture content with the cumulative temperature value; * and ** passed through the test at α = 0.05 and α = 0.01 significance level, separately.
Disclaimer/Publisher’s Note: The statements, opinions and data contained in all publications are solely those of the individual author(s) and contributor(s) and not of MDPI and/or the editor(s). MDPI and/or the editor(s) disclaim responsibility for any injury to people or property resulting from any ideas, methods, instructions or products referred to in the content.

