
Evaluation of an Alternative Functional Form to Fit the Lorenz Curve for the Concentration Index Calculation
Centro Universitario de la Costa Sur, Universidad de Guadalajara, Autlán de Navarro, Guadalajara 48900, Jalisco, Mexico
*
Author to whom correspondence should be addressed.
Atmosphere 2023, 14(12), 1720; https://doi.org/10.3390/atmos14121720
Submission received: 27 October 2023
/
Revised: 15 November 2023
/
Accepted: 20 November 2023
/
Published: 23 November 2023
(This article belongs to the Special Issue Improving the Understanding, Diagnostics, and Prediction of Precipitation (2nd Volume))
Abstract
:Precipitation concentration indices have become a popular tool for analyzing the structure of daily precipitation amounts. Among the existing indices, the concentration index (CI) is widely used. In calculating the CI, an important aspect is adjusting the Lorenz curve based on the observed precipitation data. Usually, the fit has been carried out with equations of the type y = axebx. However, in some research work, it has been observed that sometimes, the fit obtained only partially describes the behavior of the data. Thus, this work evaluated an alternative functional form to fit the Lorenz curve. For this, daily precipitation data from 44 climatological stations in Mexico were used to assess two equations for adjusting the Lorenz curve. Once the fit was made, the goodness of fit was evaluated to determine which of the functional forms best described the behavior of the data. Results showed that the two functional forms produced similar results for low precipitation concentrations. However, when the concentration increased, the alternative functional form generated results following the behavior of the observations. Thus, it is recommended to use the alternative functional form to avoid overestimations of the concentration of daily precipitation in areas where it is known that a high concentration occurs.
1. Introduction
In recent years, precipitation concentration analysis has become popular worldwide [1,2,3,4,5,6,7]. Some of the popularity of concentration indices is because they can be used to explore risks related to extreme precipitation events such as drought, floods, and soil erosion [5,8,9] and because of their utility in analyzing the statistical characteristics of precipitation [1,10]. Special attention has been paid to these indices in recent years due to projections that suggest regime changes in precipitation and extreme weather events, which are predicted to increase in the future [11]. The first studies on precipitation concentration were made by Oliver [12] and continued by De Luis et al. [13] using monthly data. Afterward, Martin-Vide [10] proposed a concentration index (CI) based on daily data. This index modeled precipitation accumulation using exponential distributions to approximate a Lorenz curve. This index has been applied worldwide to analyze the concentration of precipitation [4,14,15,16,17]. In his index, Martin-Vide [10] used the normalized rainfall curves proposed by Riehl [18] and Olascoaga [19] to approximate a Lorenz curve. Based on the Lorenz curve concept, the proposed index allows the analysis of the relevance of the days with the most significant rainfall amount. The Lorenz curve can be considered a function that relates precipitation accumulation to the accumulation of events [20]. Usually, in most of the research, the precipitation concentration is studied according to the methodology proposed by Martin-Vide [10], using a functional form for approximating the Lorenz curve, such as Equation (1). This kind of equation was proposed by Riehl [18] and Olascoaga [19]. Furthermore, Martin-Vide [10] shows an alternative functional form for approximating the Lorenz curve (Equation (2)), but he did not use it in his research. Equation (2) was proposed by Ananthakrishnan and Soman [21] at the end of the 1980s but was used in only a few studies. The difference with this equation is that it considers the boundary condition that states that when x = 100, y fits the limit of 100 [22,23].
A recent research work conducted by Lu et al. [1], using Equation (1), found surprising results because they obtained the same CI value in several cases. However, they noted significant differences between stations with the same CI when plotting the empirical data used to approximate the Lorenz curves versus the fitted curve using Equation (1). In their graph, they noticed, in some cases, that the obtained curve did not fit the data correctly. To deal with this problem, Lu et al. [1] proposed new indices to explore the information of the Lorenz curves. In this manner, they proposed six additional indices to characterize the Lorenz curve effectively. Nevertheless, before making additional calculations, it is necessary to check the goodness of fit of Equation (1) and of additional functional forms that can improve the fitting process. This is because, to date, most of the research conducted using the concentration index has been focused on its spatial and temporal behavior [4,14,15,16,17], but none of this research has been focused on the evaluation of the performance of the functional form used to approximate the Lorenz curve, which is the base for calculating the concentration index. Thus, the objective of this research was to evaluate the performance of Equations (1) and (2) in approximating the Lorenz curve and, therefore, to evaluate and compare the values of the CI obtained according to the two functional forms.
2. Materials and Methods
The daily precipitation concentration index was evaluated based on a daily precipitation time series from 1960 to 2010 obtained from Mexico’s Meteorological Service [24]. Only forty-four climatological stations were selected for this study because they had fifty years of records with less than 10% missing data and were considered homogeneous. The homogeneity of the time series was verified according to Wang et al. [25] using the package RHtests_dlyPrcp in statistical software R version 4.2.1 [26].
To test the performance of the alternative functional form for the Lorenz curve fitting, time series of different climate regimes across Mexico were included. Also, the calculations were performed under different time-aggregation scales. First, the calculation was made using the annual data of the fifty years of each time series. Then, the calculations were made using only the rainy-season data (May to October) to test if precipitation during this period significantly affected the concentration index. Finally, calculations were made at the seasonal level. According to Mexico’s climate, in this study, the precipitation recorded through March, April, and May was considered spring precipitation, and that recorded during June, July, and August as summer precipitation. Precipitation from September to November was considered autumn precipitation; from December to February, the precipitation corresponded to winter. The location of climatological stations and Mexico’s annual precipitation distribution are shown in Figure 1. Low rainfall quantities characterize the northwest of Mexico because this region is located in the subtropical high-pressure belt and is affected by the cold current of California, which favors a dry climate [27]. On the other hand, the southeast of Mexico has the highest rainfall, associated with tropical cyclones from the Gulf of Mexico and the Pacific Ocean and the intertropical convergence zone observed during the summer [27,28].
The calculation of the concentration index was based on the methodology proposed by Martin-Vide [10]. The cumulative frequencies of rainy days and precipitation were used to fit Equations (1) and (2) to approximate the Lorenz curve. Equation (1) has conventionally been used in research that analyzes precipitation concentration using daily precipitation data. However, it has shown problems in fitting the upper limit of the Lorenz curve. On the other hand, Equation (2) has shown better fitting, although it has been used only in a few studies in the 1980s in India. Therefore, it was considered that it required additional study to confirm its performance.
where a and b are regression constants;
where b and c are regression constants
According to Ananthakrishnan and Soman [21], the constants a and b in Equation (1) are not independent and can be related as
In such a manner, the fitting process based on the substitution of Equation (3) in Equation (1) now depends only on one parameter, the constant b, with which Equation (1) can now be written as
The above equation represents an alternative way to approximate the Lorenz curve. However, Ananthakrishnan and Soman [21] mention that Equation (4) provided good results for precipitation data with moderate values of the variation coefficient. However, Equation (4) produced large deviations from observations when the variation coefficient was significant. To improve the goodness of fit, Ananthakrishnan and Soman [21] proposed introducing a second regression constant in 4, which produces Equation (2).
After the equation fitting, the area between the equality line and the Lorenz curve was computed as follows:
Finally, the concentration index was calculated as follows:
Two statistical measures were computed to evaluate the functional forms’ performance fitting: the determination coefficient (R2), which indicates the proportion of the variance in the response variable that the predictor variable can explain, and the root mean square error (RMSE), which indicates how far apart, on average, the predicted values are from the observed values. The model fitted the data better with higher R2 values and with lower RMSE values.
where are the observed data, are the predicted values of y, is the mean value of the observed data, and n is the number of observations.
3. Results
The results of estimating the goodness of fit of the three functions used to approximate the Lorenz curve are presented in Figure 2 and Figure 3. Figure 2 shows the evaluation results based on the determination coefficient R2. The evaluation was carried out on an annual scale (a) and on rainy-season (b), spring (c), summer (d), autumn (e), and winter (f) scales. Figure 2 shows good results for the three functions evaluated at all analysis scales. The average value of R2 for Equation (2) was 0.9983 ± 0.0014, while for Equation (1), the average R2 was 0.9942 ± 0.0052. Finally, in the modified Equation (4), the average was 0.9952 ± 0.0040. According to the above results, the fits obtained from the three equations could be considered reasonable, since, according to the coefficient of determination R2, the percentage of variability that the independent variable could explain was greater than 99%. In these results, Equation (2) stands out, since, with it, the highest R2 values were obtained; in addition, in the adjustments with this equation, the least dispersion was observed compared with other equations evaluated.
The results of the root mean square error (RMSE) shown in Figure 3 support the results observed in previous results with R2, where it was observed that Equation (2) showed a better fit. The average values of the fits for the different analysis scales show that the average RMSE for Equation (2) was 0.5183 ± 0.2721, while for Equation (1) it was 1.8784 ± 0.5710 and for Equation (4), 2.9389 ± 1.055. On the other hand, the results obtained from the RMSE suggest a hierarchical classification of the goodness of fit of the three functional forms used in all analysis scales. In this classification, the best performance was obtained for the functional form proposed by Ananthakrishnan and Soman [21], followed by the functional form used originally by Martin-Vide [10], and thirdly, the functional form modified from Equation (1).
Examples of the fits obtained with Equations (1), (2) and (4) are shown in Figure 4. In this figure, (a) and (b) correspond to the most similar and least similar fits obtained using the full-year data. Examples (c) and (d) correspond to the adjustments made considering only the rainy-season data, (e) and (f) using the precipitation data recorded during the spring, (g) and (h) using the summer data, (i) and (j) the autumn data, and finally, (k) and (l) the winter data. The best adjustments with all the equations used occurred in the analysis scales where there was higher precipitation, i.e., annual, rainy-season, summer, and autumn scales. In comparison, the opposite behavior occurred in the analysis scales where less precipitation was recorded, such as in the case of spring and winter.
On the other hand, in the case of the less similar fits, in most cases, a lower degree of curvature was observed in the fit made with the modified version of Equation (1). Compared with the original equation, the degree of curvature was higher than that presented by the precipitation data used for the adjustment. In Figure 4, it is generally observed that the fit obtained from Equation (2) is the one that best fits the observed precipitation data, in addition to the fact that, in all cases, the equation fits perfectly to the limits, which is not fulfilled in all cases when the adjustment is made with Equation (1).
The distribution of the concentration index values computed according to Equation (1) (Figure 5) shows values between 0.502 and 0.745 at the annual scale, 0.495 and 0.794 for the rainy season, 0.474 and 0.793 for spring, 0.450 and 0.752 for summer, 0.502 and 0.743 for autumn, and 0.495 and 0.760 for winter. On the other hand, CI values obtained according to the fitting of 2 were observed between 0.478 and 0.701 at the annual scale, 0.472 and 0.734 for the rainy season, 0.450 and 0.752 for spring, 0.468 and 0.768 for summer, 0.480 and 0.683 for autumn, and 0.474 and 0.707 for winter. As observed in Figure 5, CI values obtained with Equation (2) were lower than those calculated according to Equation (1) in all the studied timescales. Furthermore, the results could be linearly related according to the behavior observed in the distribution of the values of the index calculated with the two methodologies.
The results for the analysis of the linear correlation between the CI computed according to Equations (1) and (2) showed a high association degree between the CI values calculated based on the two methodologies mentioned above. Figure 6 shows the results of the regression analysis. The determination coefficient (R2) indicates, in all the scales, that the CI values of Equation (2) could be reliably approximated from the CI values of Equation (1) because the models obtained could explain, between 0.967 and 0.993, the variation in the CI calculated with Equation (2), based on their relationship with the CI values obtained with Equation (1). The slope values for the models shown in Figure 6 show that CI values obtained with Equation (2) were in proportion to the CI values computed from Equation (1) from 0.868 to 0.933. The higher proportionality factor was observed for the spring (Figure 6c) and winter (Figure 6f).
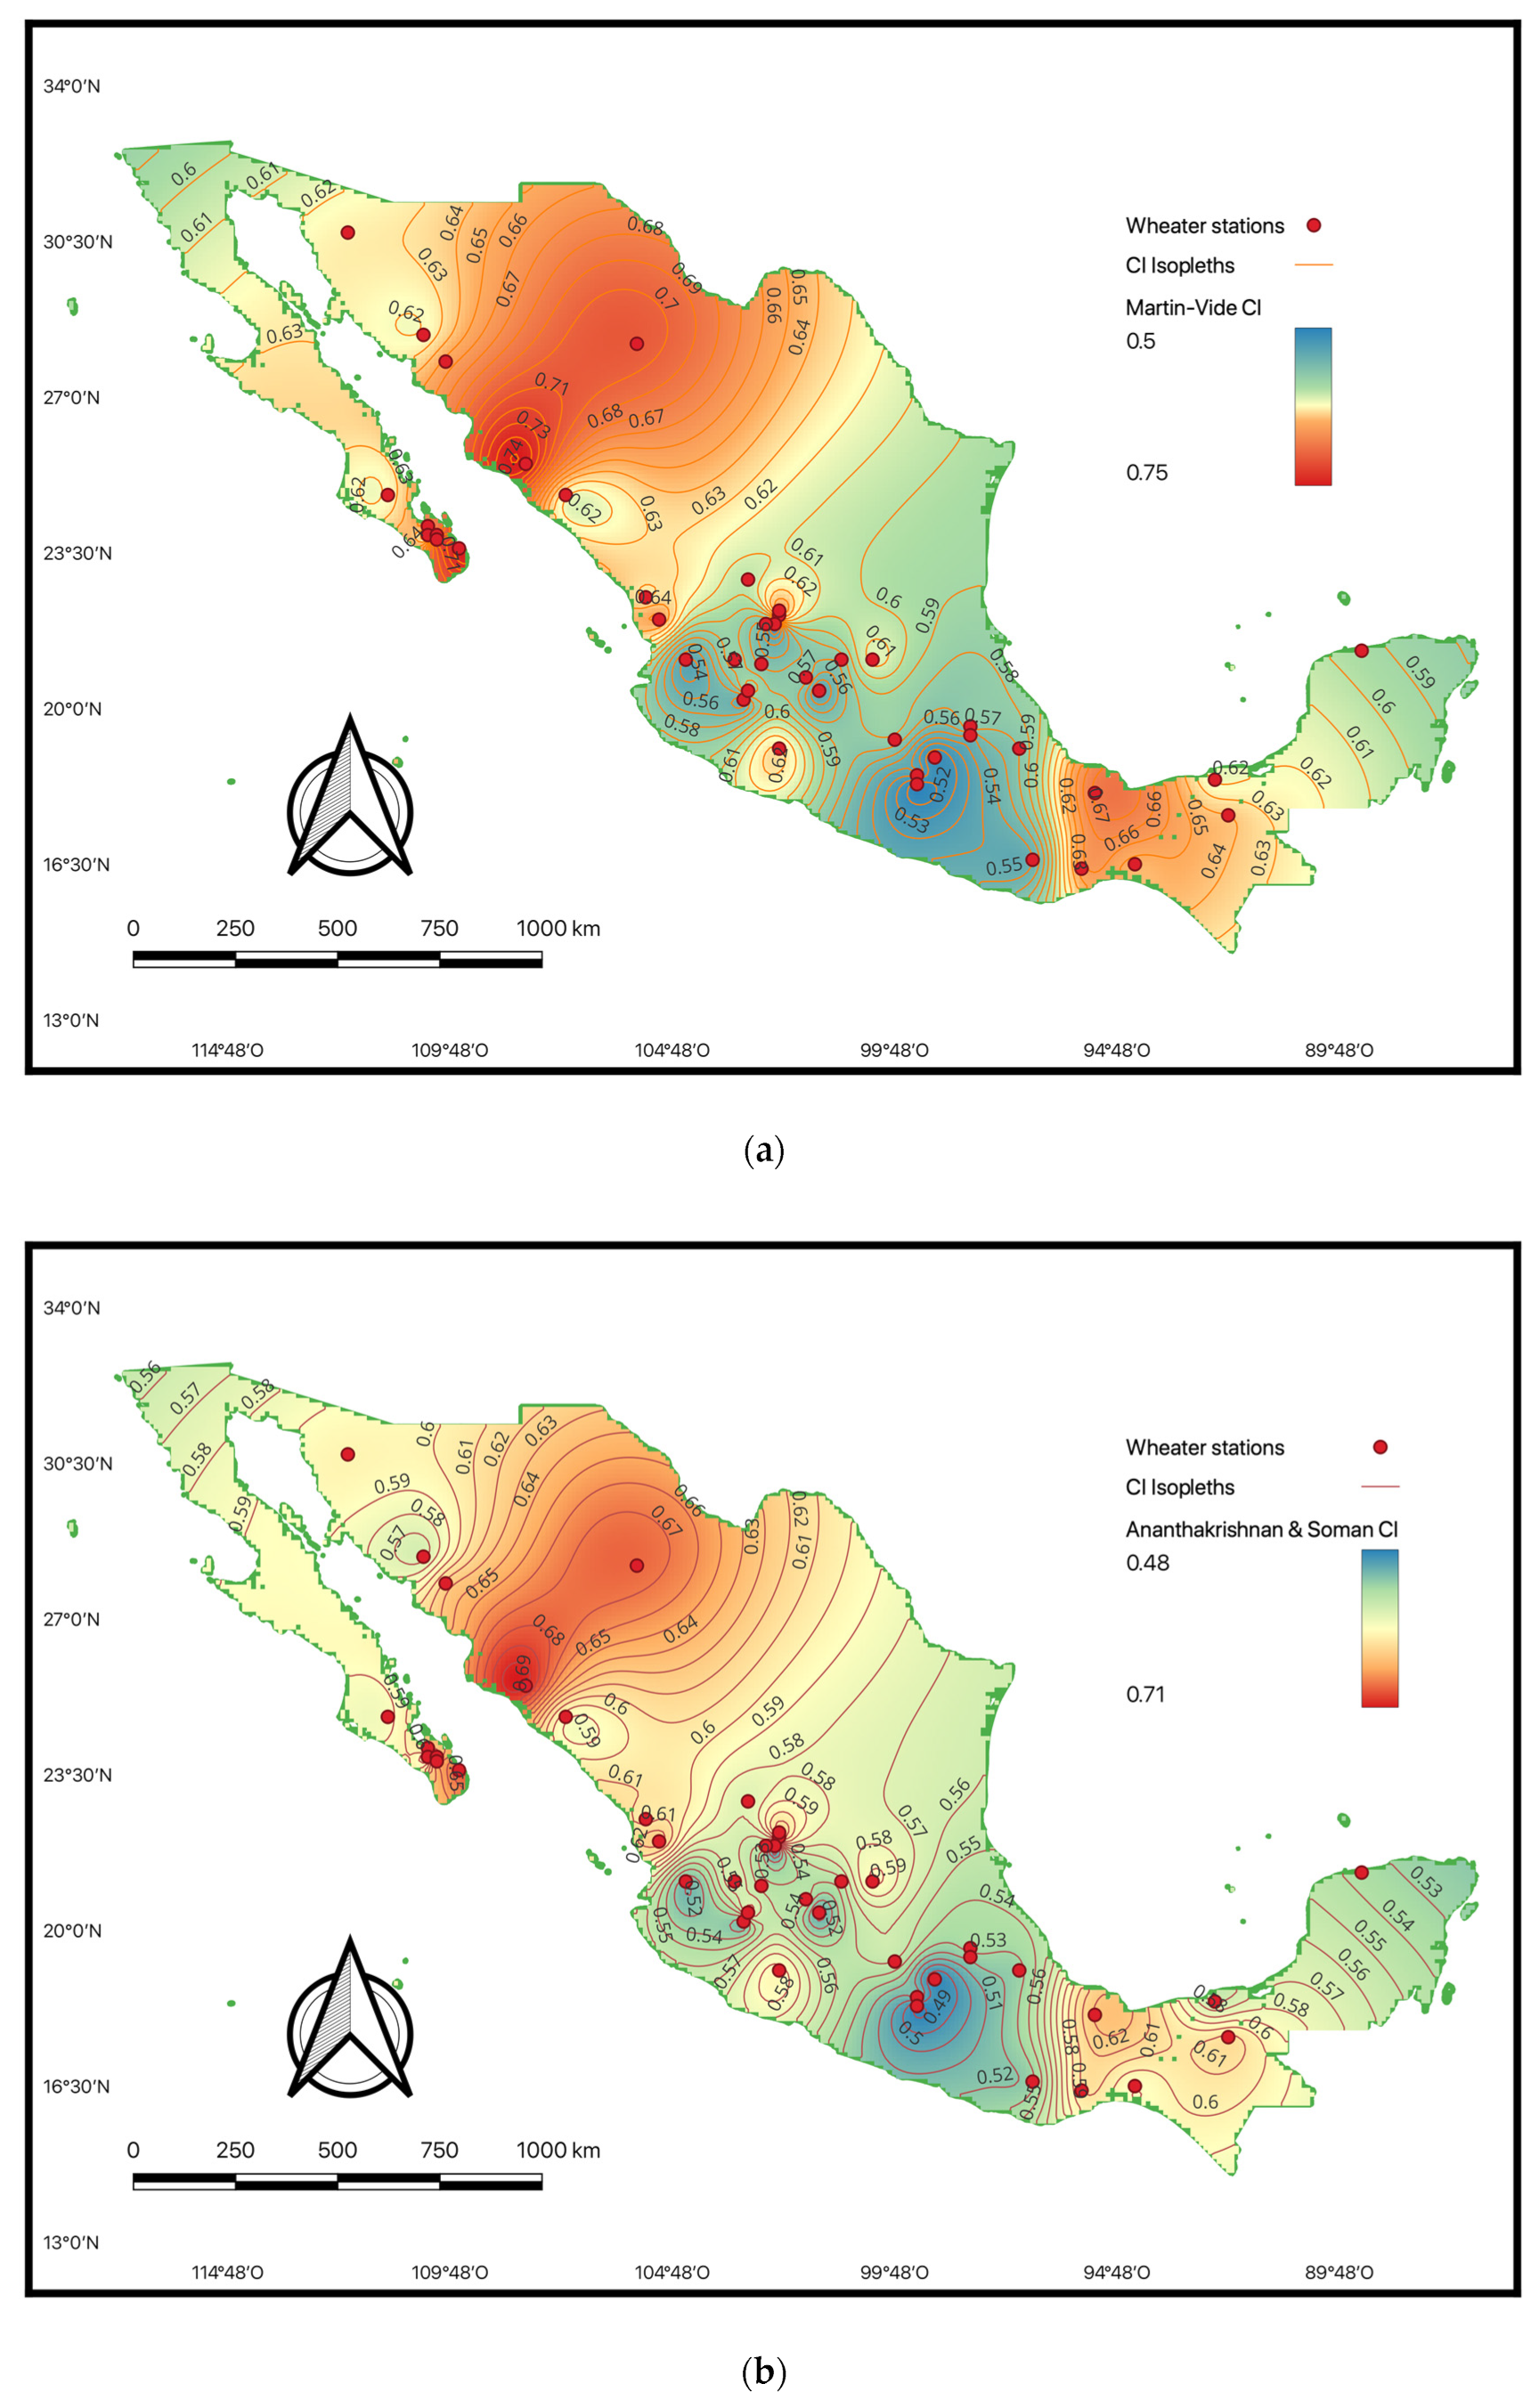
The spatial distribution of the concentration index calculated under the two methodologies on an annual scale is shown in Figure 7. This figure shows that the highest concentration values occurred in two well-defined zones, regardless of the methodology used to calculate the concentration index. The first zone corresponded to the northwest part of Mexico, where values between 0.623 and 0.745 were observed, according to the results of Equation (1), and values between 0.567 and 0.701 according to the results of Equation (2). In both cases, these were the values of the higher concentration index. The second area identified with a high precipitation concentration was in the southeastern part of Mexico. In this area, concentration values between 0.619 and 0.682 were observed, according to the results of Equation (1), and values between 0.559 and 0.631 for the CI were calculated based on Equation (2). The rest of the country presented CI values that can be considered moderate.
An essential difference between the two methodologies can be found in the northwest zone, since, in this zone, the highest value of the concentration index calculated with Equation (1) was located at the south of the Baja California peninsula (latitude 23°30′). In contrast, according to the results of Equation (2), the highest value was located within the continental territory. On the other hand, the spatial distribution of the concentration index for the two methodologies used showed a pattern like that observed in Figure 7 when analyzed for the rest of the analysis time scales.
Table 1 presents the constants obtained by fitting the equations that approximate the Lorenz curve according to the precipitation data observed at the meteorological stations at the annual analysis scale and the corresponding concentration indices. Also, it shows the percentage of precipitation obtained with the adjusted equations when the percentage of events was 100%, according to Equation (1). In the case of Equation (2), this percentage was not included because, in this equation, the boundary condition was imposed that when x = 100, the image also takes that value. According to the results of the percentage of precipitation when 100% of the rain events have occurred (Equation (1)), a value of 100% was reached in none of the adjusted equations. This behavior was also observed for the other analysis scales, as seen in Table 2, where the summary of the descriptive statistics for this variable is presented. According to this table, it is observed that the adjustments made on some time scales need to be taken with caution, as is the case with the analysis scales at the spring and summer levels because, with these analysis scales, it was observed that the percentage of precipitation that the fitted equations predicted for 100% of the events could be up to 78.5 and 86.8%, respectively, although measures of central tendency showed values between 96 and 98%. However, the dispersion observed during spring shows that, with that time scale, the analyses must be conducted carefully to avoid errors in their interpretation.
4. Discussion
The results show that in cases where a strong precipitation concentration occurs, the fit of the curve approximating the Lorenz curve can be improved using Equation (2), proposed by Ananthakrishnan and Soman [21]. The results of the goodness of fit of the three equations used to approximate the Lorenz curve coincide with the results reported by Ananthakrishnan and Soman [21]. However, the authors did not perform a goodness-of-fit test. They determined that the fit with their equation was better because when they evaluated the percentage of rainfall obtained with the fit made with Equation (1) for 100% of the events. However, 100% of accumulated rainfall was not obtained, which they argue could be considered a physical contradiction. In the same sense, the comparison of the goodness of fit shows that it is advisable to base it on different metrics to interpret the results in a better manner.
On the other hand, the difference in the fitting can significantly affect the calculation of indices related to Equation (1), as is the case of the indices proposed by Lu et al. [1], since they depend on the adjustment made with Equation (1). Special attention is necessary for the index defined as θ2 because it could be overestimated as an effect of fitting, which does not fulfill the limit of the data. This is because when the fitting does not fit the limit, it could lead to an erroneous interpretation of the precipitation concentration since this index represents the degree of contribution of the most intense rain.
A relevant aspect of the results is that, if it was necessary to classify the degree of concentration according to the scale proposed by Núñez-González [30], it was observed that the values obtained for the index fell equally in the classification categories for moderate and high concentration in both cases. This is because most of the CI values were higher than 0.5. On the other hand, the ranges of values observed for the CI calculated with the two methodologies agreed with the observed results reported in the literature [2,4,15,16,30]. However, if it is required to use the fittings to calculate the percentage of precipitation caused by 25% of the rainiest days, the index proposed by Lu et al. [1], a common index used to measure the proportion of extreme events versus the total precipitation, different results can be obtained. For example, in the case of the maximum values obtained with the two equations, a difference of up to 5% could be observed in the percentage of precipitation accumulated during 25% of the rainiest days. This is an important difference since, when there are CI values of 0.5, 25% of the rainiest days can contribute about 60% of the annual rainfall, and when the CI value is around 0.7, 25% of the rainiest days can contribute about 80% of the annual rainfall [30].
However, the main problems would be observed in cases where the fitted curves showed higher RMSE values. In cases where the values are small, it can be considered that the indices calculated with the two methodologies are very similar, as has already been recognized by Ananthakrishnan and Soman [21]. Notwithstanding the differences observed, according to the linear correlation analysis, a correction could be made to the index obtained with the methodology followed in Martin-Vide [10] to have values that better fit the empirical data. These results do not have to detract from the work of Martin-Vide [10], however, since outside of the approximation of the Lorenz curve with Equation (1), its main contribution is the definition of the concentration index, since in previous research carried out in the 1950s [18,19] and 1980s [21], only the concept of normalized rainfall curves had been worked on. The definition of a concentration index had yet to be proposed.
The spatial distribution of CI values obtained with the two methodologies coincides with that indicated by Núñez-González [2]. However, this study shows the results calculated interannually at the annual and summer scales. The distribution of the highest concentration index values followed the zoning of precipitation in Mexico [31]. This zoning is based on the position of the Tropic of Cancer (latitude 23°27′); towards the North of said tropic, the observed precipitation is lower. In contrast, towards the south, the highest precipitation is recorded. The above coincides with what has been pointed out by Méndez et al. [28]. The northern zone is related to the subtropical high-pressure belt, which, combined with the cold currents of California, favors a dry climate. On the other hand, in the southern region, the precipitation is related to tropical cyclones and the intertropical convergence zone, which is observed during the summer [27]. High values of the CI for both dry and humid regions have also been reported in the past by Monjo and Martin-Vide [14].
On the other hand, the observed values of the constants a and b, from the fitting with Equation (1), coincide with what was reported in the literature [1,10,19,30,32], while constants b and c of Equation (2) coincide with those reported by Ananthakrishnan and Soman [21]. Of these constants, the constant c plays an essential role in determining the similarity of results between the two methodologies studied. The constant c takes the value of 1, and Equation (2) becomes Equation (4), a modified version of Equation (1). In this way, it is expected that in the cases where the constant c takes the highest values, the values calculated for the CI with the two methodologies are more like those where the lowest values of the constant mentioned above are observed.
A limitation of this study was related to the low quantity of climatological stations included in the study. Although Mexico has a vast meteorological observation network, in most of the records, there is a lot of missing data, which complicated their inclusion in the research. However, although the results were obtained from data from 44 meteorological stations, promising results were observed for using alternative functional forms to approximate the Lorenz curve, which may better fit the observed data. A better fit of the Lorenz curve allows a more reliable estimate of the precipitation concentration index, which can be related to extreme precipitation events and droughts.
5. Conclusions
In recent years, the concentration index has become a popular tool to analyze the structure of daily precipitation. An essential step in the calculation of the concentration index, according to the methodology proposed by Martin-Vide [10], consists in the fitting of a function to approximate the Lorenz curve based on daily precipitation data. Usually, this fitting has been carried out using Equation (1); however, in some research work, it has been recognized that the fitting with this equation, in some cases, only partially describes the behavior of precipitation data. The results of this study provide evidence in favor of that, based on the goodness of fit test, especially in cases where a high concentration of precipitation was recognized. Also, the results show that the approximation of the Lorez curve with Equation (2) improved the fitting. However, using Equation (2) in the calculation of the concentration index produced CI values lower than those obtained based on Equation (1). The difference found in the concentration index values could generate overestimations of up to 5% in accordance with the observed results. These results do not have to detract from the work of Martin-Vide [10], since outside of the approximation of the Lorenz curve with Equation (1), its main contribution is the definition of the concentration index, since, in previous research carried out in the 1950s [18,19], and 1980s [21], only the concept of normalized rainfall curves had been worked on, but not the definition of a concentration index. On the other hand, according to the correlation analysis, Equations (1) and (2) are not independent because they are linearly correlated, allowing the corrected CI value to be determined if the regression equation is known. The constant c obtained in the fitting of Equation (2) can be considered as an indicator of the similarity between the two equations because, when this constant approximates the value of 1, it becomes Equation (4), which is a modified version of Equation (1). The spatial behavior of the concentration index does not change significantly, as can be observed in the maps shown in Figure 7. The behavior coincides with what has been pointed out before for the same region. According to the research mentioned above, it is recommended to use the alternative functional form to avoid overestimations of the concentration of daily precipitation in areas where it is known that a high concentration occurs. The results obtained, based on data from 44 meteorological stations, are promising for the use of alternative functional forms to approximate the Lorenz curve and, thus, have a better fit to the observed data. A better fit of the Lorenz curve allows a more reliable estimate of the precipitation concentration index.
Author Contributions
Conceptualization, G.N.-G.; methodology, G.N.-G. and D.V.-P.; software, G.N.-G.; validation, G.N.-G., D.V.-P. and F.J.P.-C.; formal analysis, G.N.-G.; investigation, G.N.-G.; resources, G.N.-G.; data curation, D.V.-P. and F.J.P.-C.; writing—original draft preparation, G.N.-G.; writing—review and editing, G.N.-G.; visualization, D.V.-P. and F.J.P.-C.; supervision, G.N.-G.; project administration, G.N.-G.; funding acquisition, G.N.-G. All authors have read and agreed to the published version of the manuscript.
Funding
This research and the APC were funded by CONAHCYT through the Basic Science Fund, grant number 320462.
Institutional Review Board Statement
Not applicable.
Informed Consent Statement
Not applicable.
Data Availability Statement
All the precipitation data used in this study are openly available from Mexico’s Meteorological Service at https://smn.conagua.gob.mx/es/informacion-climatologica-por-estado (accessed on 14 March 2023).
Acknowledgments
The authors acknowledge the technical support given by Gabriel Colmenares and Paulina Limón during the execution of the calculation algorithms.
Conflicts of Interest
The authors declare no conflict of interest.
References
- Lu, H.-L.; Li, F.-F.; Zhao, K.; Wang, H.-R.; Wang, G.-Q.; Qiu, J. Indices for exploring information in Lorentz curve of daily precipitation and their application in natural disaster risk assessment. J. Hydrol. 2021, 603, 126840. [Google Scholar] [CrossRef]
- Núñez-González, G. Analysis of behaviour and relationship of four daily precipitation concentration indices according to Mexico’s precipitation. Int. J. Climatol. 2021, 41, 3903–3917. [Google Scholar] [CrossRef]
- Sarricolea, P.; Meseguer-Ruiz, Ó.; Serrano-Notivoli, R.; Soto, M.V.; Martin-Vide, J. Trends of daily precipitation concentration in Central-Southern Chile. Atmos. Res. 2019, 215, 85–98. [Google Scholar] [CrossRef]
- Vélez, A.; Martin-Vide, J.; Royé, D.; Santaella, O. Spatial analysis of daily precipitation concentration in Puerto Rico. Theor. Appl. Climatol. 2019, 136, 1347–1355. [Google Scholar] [CrossRef]
- Vyshkvarkova, E.; Voskresenskaya, E.; Martin-Vide, J. Spatial distribution of the daily precipitation concentration index in Southern Russia. Atmos. Res. 2018, 203, 36–43. [Google Scholar] [CrossRef]
- Wang, S.; Cao, Z.; Luo, P.; Zhu, W. Spatiotemporal Variations and Climatological Trends in Precipitation Indices in Shaanxi Province, China. Atmosphere 2022, 13, 744. [Google Scholar] [CrossRef]
- Hassanlu, A.M.; Erfanian, M.; Javan, K.; Najafi, M.R. Daily precipitation concentration and Shannon’s entropy characteristics: Spatial and temporal variability in Iran, 1966–2018. Theor. Appl. Climatol. 2023, 1–23. [Google Scholar] [CrossRef]
- Spatio-Temporal Variability of Daily Precipitation Concentration in Spain Based on a High-Resolution Gridded Data Set—Serrano-Notivoli—2018—International Journal of Climatology—Wiley Online Library. Available online: https://rmets.onlinelibrary.wiley.com/doi/abs/10.1002/joc.5387 (accessed on 25 September 2023).
- Royé, D.; Martin-Vide, J. Concentration of daily precipitation in the contiguous United States. Atmos. Res. 2017, 196, 237–247. [Google Scholar] [CrossRef]
- Martin-Vide, J. Spatial distribution of a daily precipitation concentration index in peninsular Spain. Int. J. Climatol. 2004, 24, 959–971. [Google Scholar] [CrossRef]
- Yang, T.; Li, Q.; Chen, X.; De Maeyer, P.; Yan, X.; Liu, Y.; Zhao, T.; Li, L. Spatiotemporal variability of the precipitation concentration and diversity in Central Asia. Atmos. Res. 2020, 241, 104954. [Google Scholar] [CrossRef]
- Oliver, J.E. Monthly Precipitation Distribution: A Comparative Index. Prof. Geogr. 1980, 32, 300–309. [Google Scholar] [CrossRef]
- Luis, M.; Gonzalez-Hidalgo, J.; Raventós, J.; Sanchez-Montahud, J.-R.; Cortina, J. Distribución espacial de la concentración y agresividad de la lluvia en el territorio de la Comunidad Valenciana. Cuaternario Geomorfol. 2007, 11, 33–44. [Google Scholar]
- Monjo, R.; Martin-Vide, J. Daily precipitation concentration around the world according to several indices. Int. J. Climatol. 2016, 36, 3828–3838. [Google Scholar] [CrossRef]
- Serrano-Notivoli, R.; Martín-Vide, J.; Saz, M.A.; Longares, L.A.; Beguería, S.; Sarricolea, P.; Meseguer-Ruiz, O.; De Luis, M. Spatio-temporal variability of daily precipitation concentration in Spain based on a high-resolution gridded data set. Int. J. Climatol. 2018, 38, e518–e530. [Google Scholar] [CrossRef]
- Meseguer-Ruiz, O.; Ponce-Philimon, P.I.; Guijarro, J.A.; Sarricolea, P. Spatial distribution and trends of different precipitation variability indices based on daily data in Northern Chile between 1966 and 2015. Int. J. Climatol. 2019, 39, 4595–4610. [Google Scholar] [CrossRef]
- Lu, Y.; Jiang, S.; Ren, L.; Zhang, L.; Wang, M.; Liu, R.; Wei, L. Spatial and temporal variability in precipitation concentration over mainland China, 1961–2017. Water 2019, 11, 881. [Google Scholar] [CrossRef]
- Riehl, H. Some Aspects of Hawaiian Rainfall. Bull. Am. Meteorol. Soc. 1949, 30, 176–187. [Google Scholar] [CrossRef]
- Olascoaga, M.J. Some Aspects of Argentine Rainfall. Tellus 1950, 2, 312–318. [Google Scholar] [CrossRef]
- Shi, W.; Yu, X.; Liao, W.; Wang, Y.; Jia, B. Spatial and temporal variability of daily precipitation concentration in the Lancang River basin, China. J. Hydrol. 2013, 495, 197–207. [Google Scholar] [CrossRef]
- Ananthakrishnan, R.; Soman, M.K. Statistical distribution of daily rainfall and its association with the coefficient of variation of rainfall series. Int. J. Climatol. 1989, 9, 485–500. [Google Scholar] [CrossRef]
- Ananthakrishnan, R.; Aralikatti, S.; Pathan, J. Some features of the southwest monsoon rainfall along the West Coast of India. Proc. Indian Acad. Sci. A 1979, 88, 177–199. [Google Scholar]
- Ananthakrishnan, R.; Kajan, C.K. Some features of the south-west monsoon rainfall of Cochin and Minicoy. J. Climatol. 1987, 7, 355–372. [Google Scholar] [CrossRef]
- NMS Climatological Information from the National Meteorological Service 2023. Available online: https://smn.conagua.gob.mx/es/informacion-climatologica-por-estado (accessed on 14 March 2023).
- Wang, X.L.; Chen, H.; Wu, Y.; Feng, Y.; Pu, Q. New Techniques for the Detection and Adjustment of Shifts in Daily Precipitation Data Series. J. Appl. Meteorol. Climatol. 2010, 49, 2416–2436. [Google Scholar] [CrossRef]
- R Core Team. R: A Language and Environment for Statistical Computing; R Foundation for Statistical Computing: Vienna, Austria, 2021; Available online: http://www.r-project.org/ (accessed on 3 February 2023).
- García, E. Distribución de la precipitación en la República Mexicana. Investig. Geográficas 2017, 1, 59179. [Google Scholar] [CrossRef]
- Mendez, J.; Návar, J.; Ontiveros, V. Analysis of rainfall trends (1920–2004) in Mexico. Investig. Geogr. 2008, 65, 38–55. [Google Scholar]
- QGIS Development Team. QGIS Geographic Information System F; Open Source Geospatial Foundation: Beaverton, OR, USA, 2009. [Google Scholar]
- Núñez-González, G. Comparison of the behavior of the precipitation concentration index on global and local scale. Theor. Appl. Climatol. 2020, 139, 631–638. [Google Scholar] [CrossRef]
- Levi, E.; Lattes, E.L. Tratado Elemental de Hidráulica; Instituto Mexicano de Tecnología del Agua, Comisión Nacional del Agua: Jiutepec, Mexico, 1990; Available online: https://books.google.com.mx/books?id=QEYSGwAACAAJ (accessed on 14 March 2023).
- SIRCAR, N.C.R. Some aspects of monsoon rainfall in India. MAUSAM 1955, 6, 217–224. [Google Scholar] [CrossRef]
Figure 1.
Mexico’s annual precipitation and weather station locations.
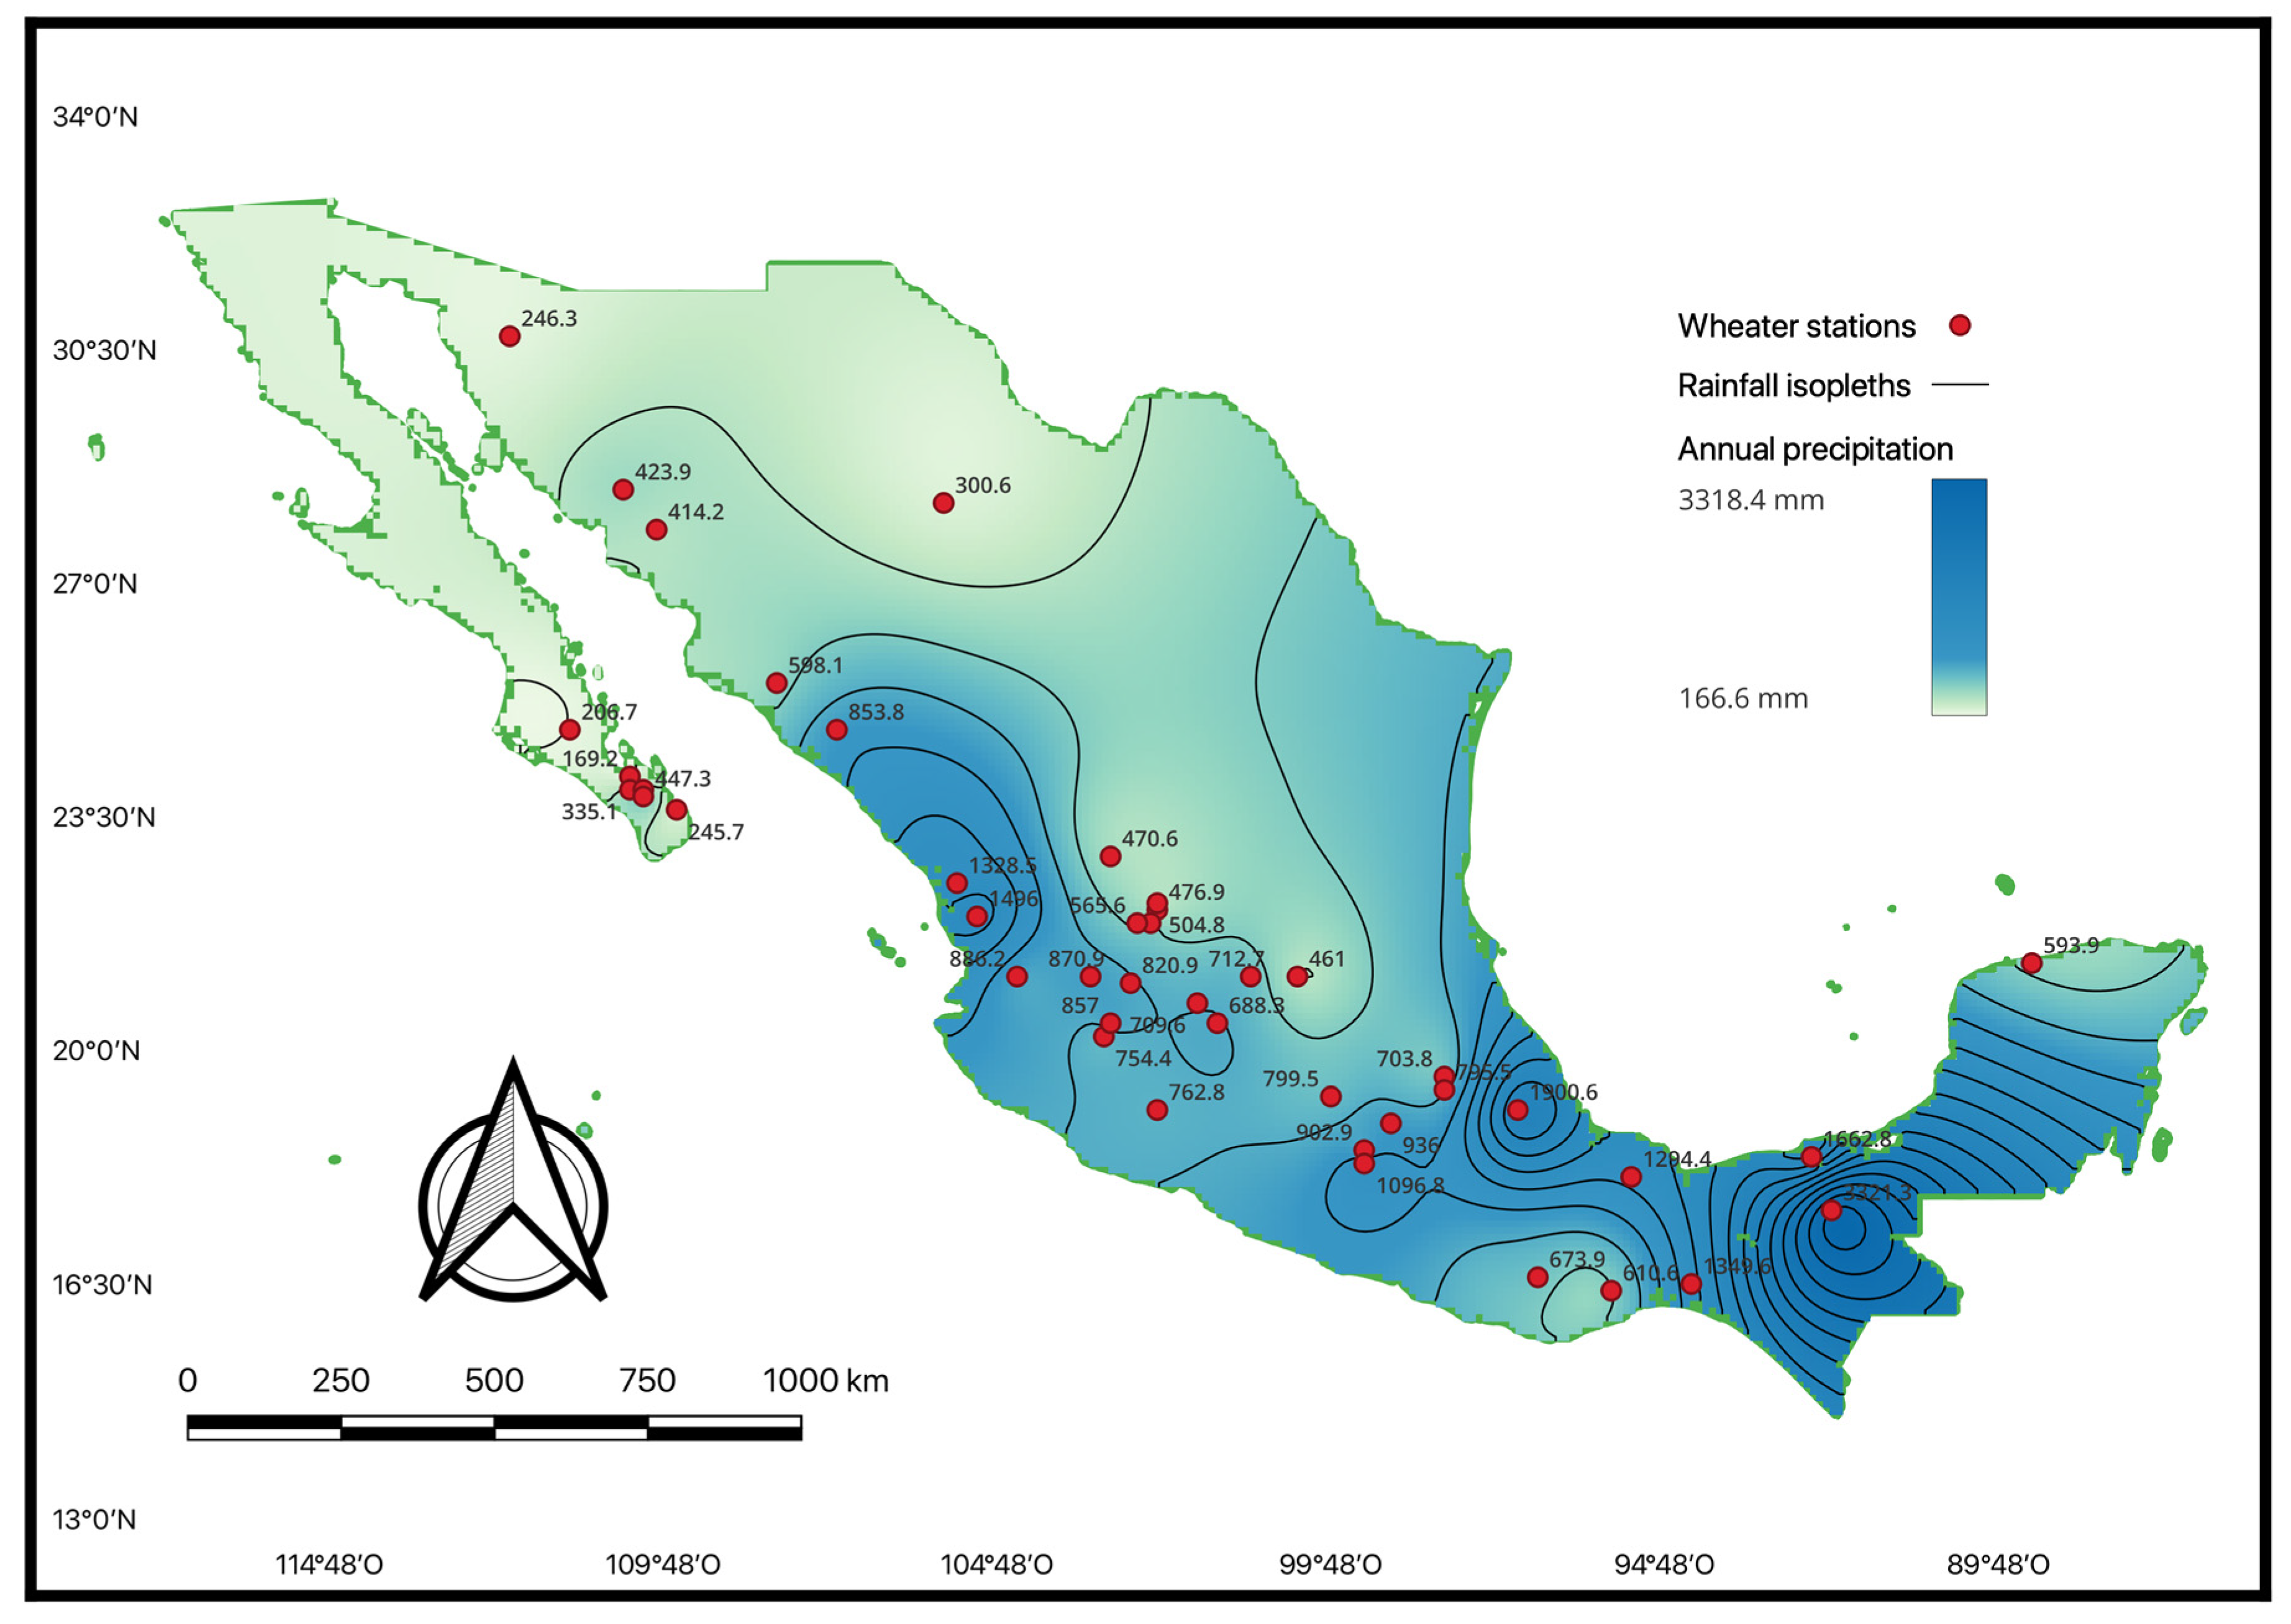
Figure 2.
Distribution of the determination coefficient for the fitting of Equation (1) (M-V), Equation (2) (A & S), and Equation (4) (M-V lim.). (a) Shows results at the annual scale, (b) the rainy-season scale, (c) the spring scale, (d) the summer scale, (e) the autumn scale, and (f) the winter scale.
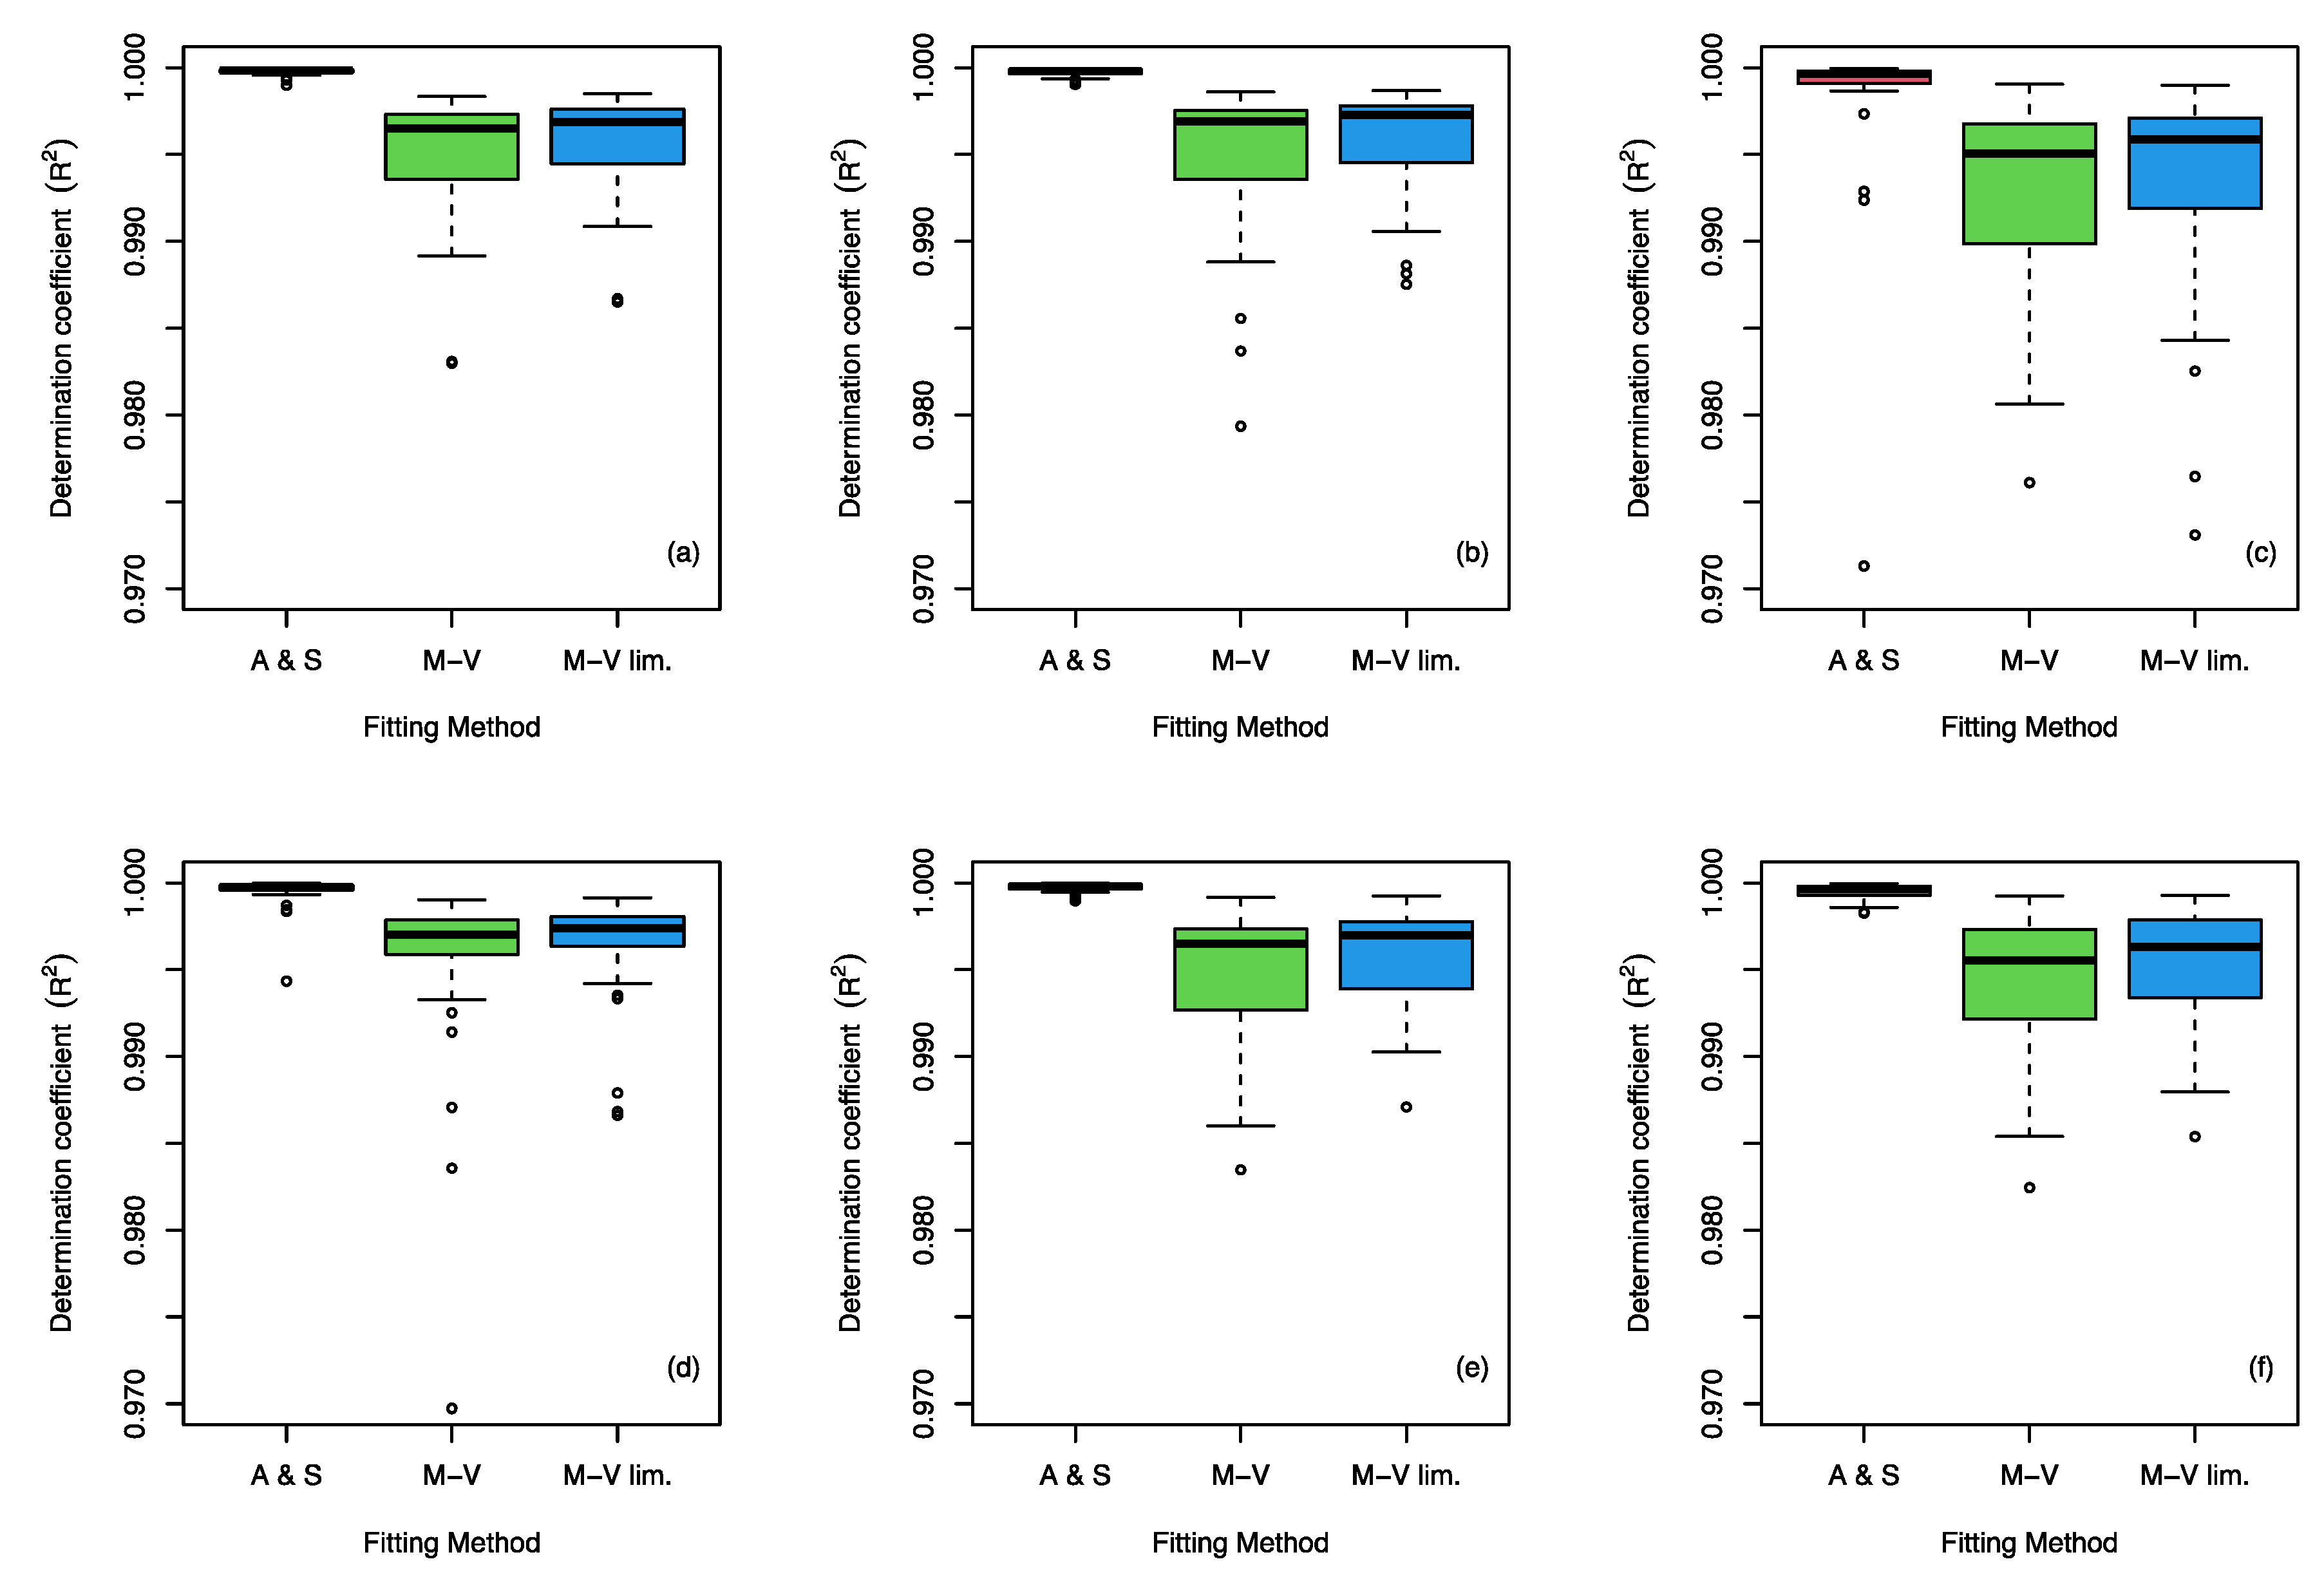
Figure 3.
Distribution of the root mean square error obtained from the fitting of Equation (1) (M-V), Equation (2) (A & S), and Equation (4) (M-V lim.). (a) Shows results at the annual scale, (b) the rainy-season scale, (c) the spring scale, (d) the summer scale, (e) the autumn scale, and (f) the winter scale.
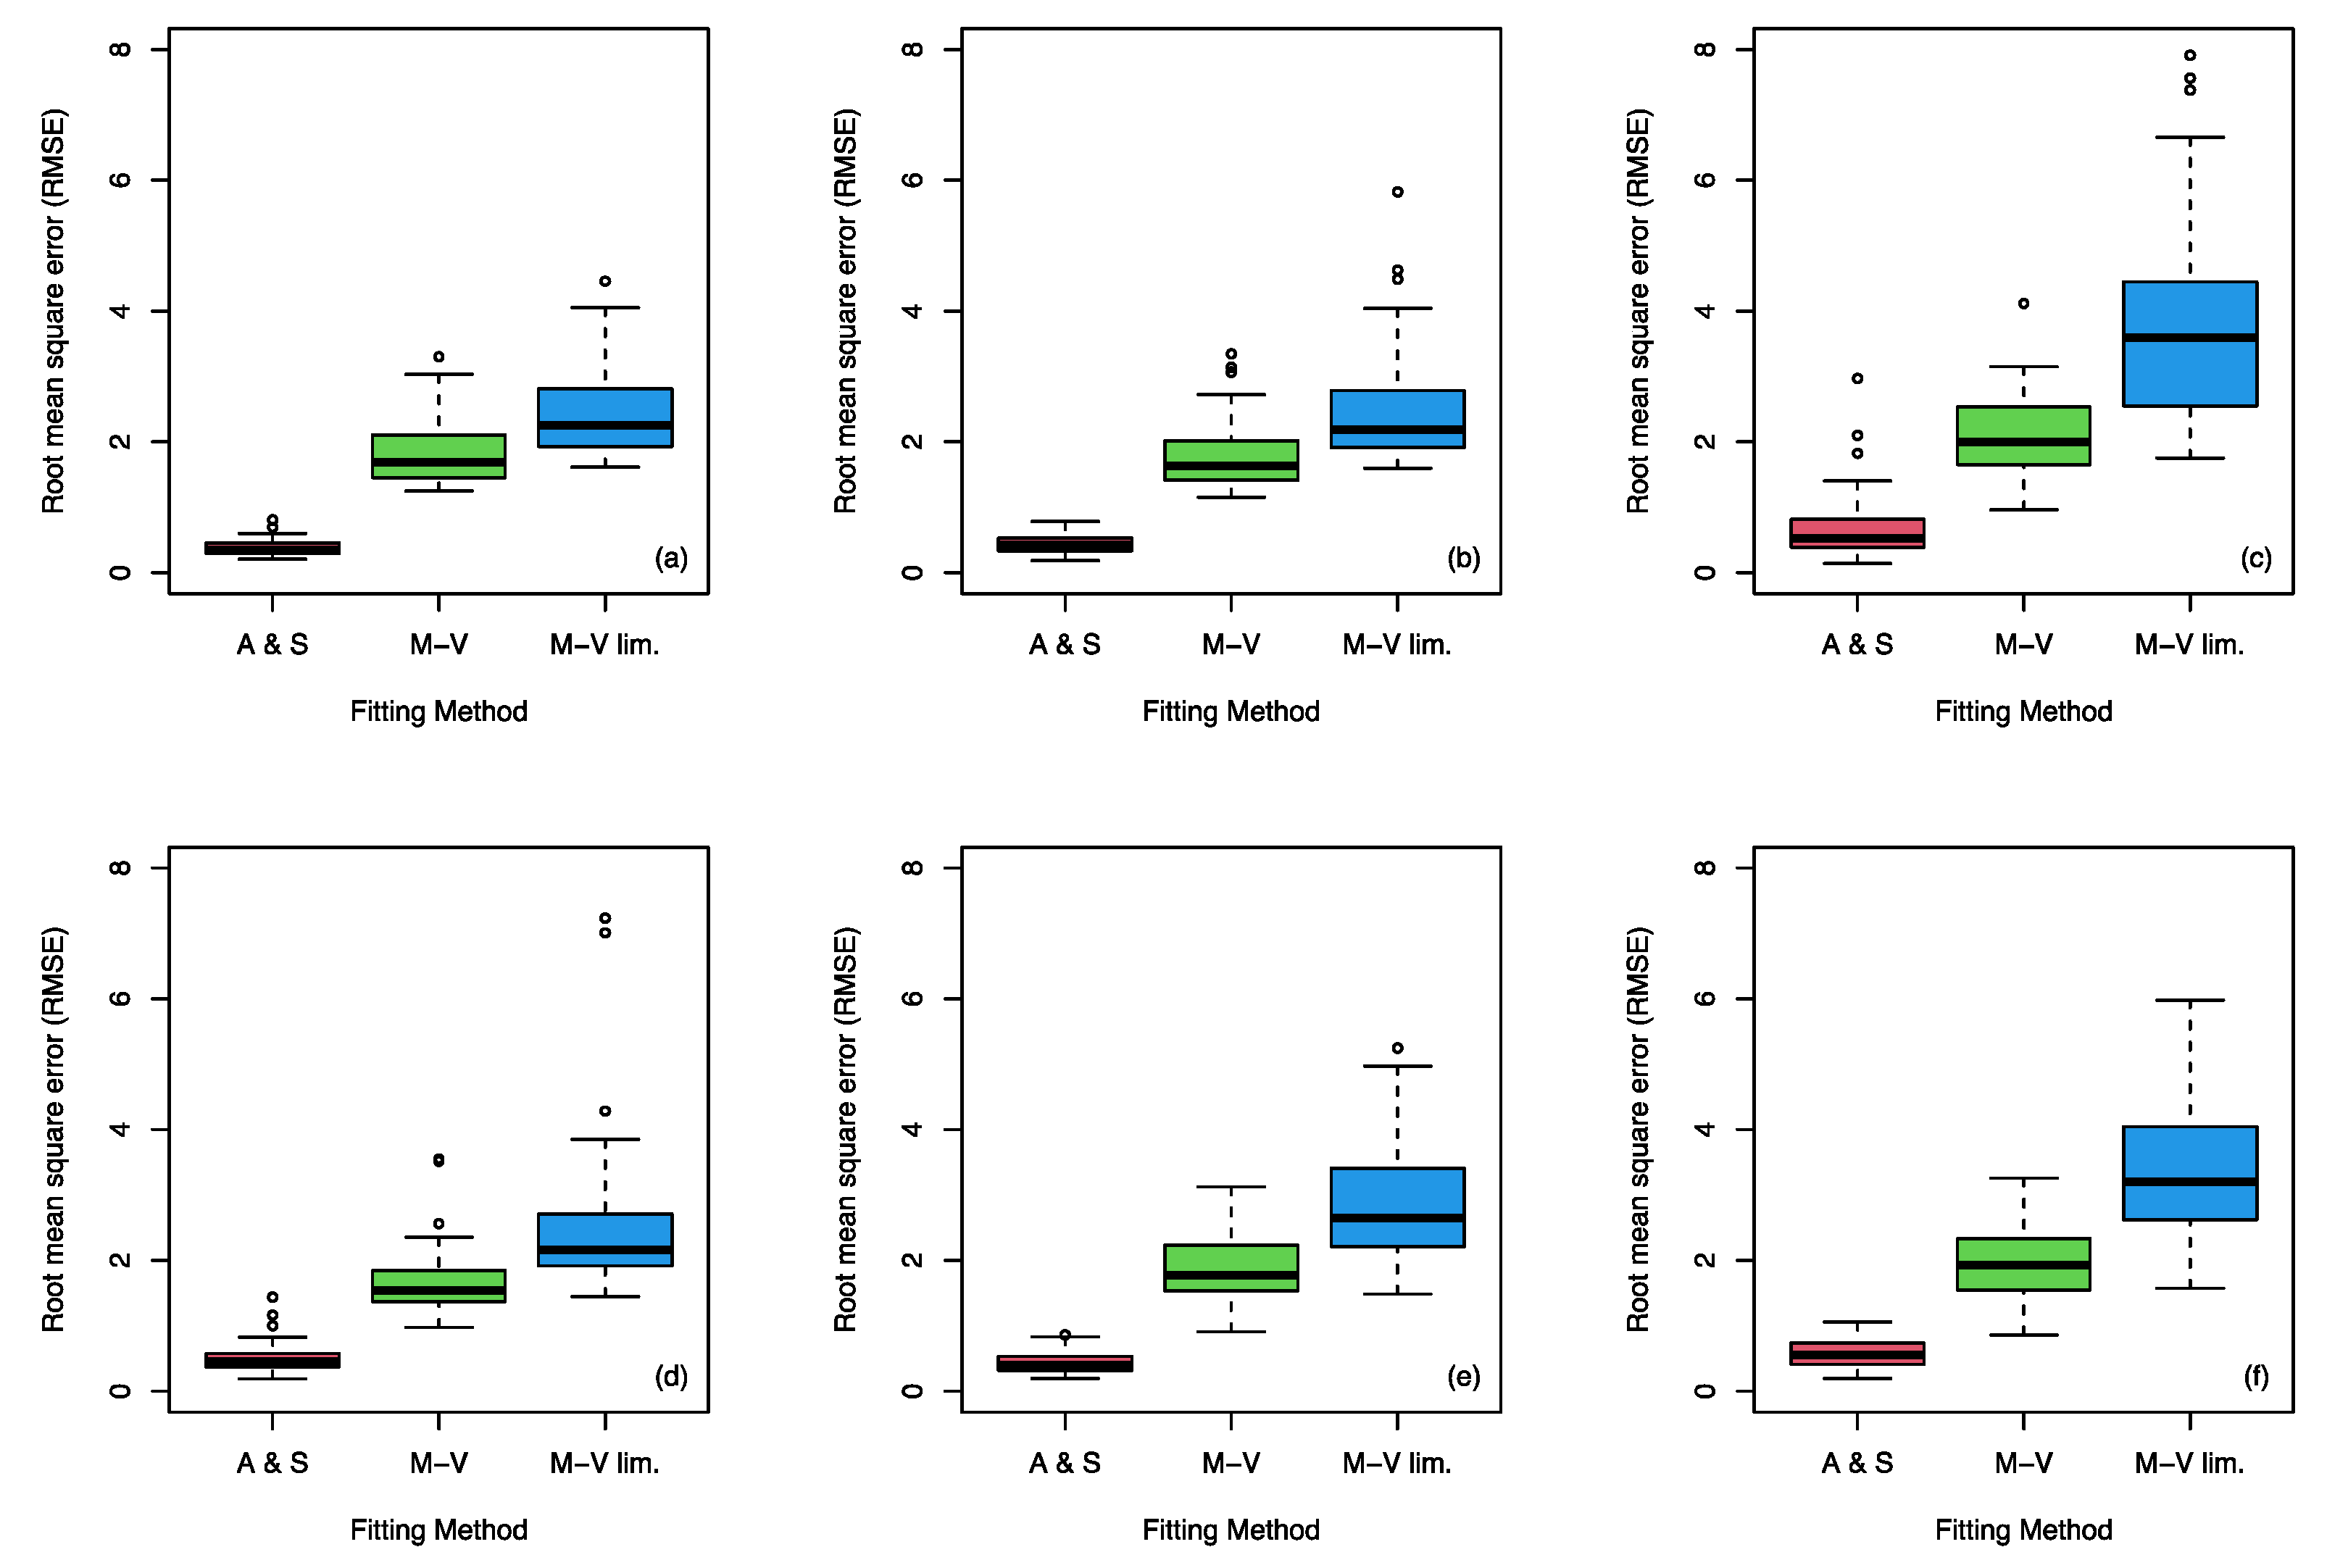
Figure 4.
Comparison of the fitted curves obtained with Equation (1) (M-V fit), Equation (2) (A & S fit), and Equation (4) (M-V mod fit) versus empirical data for the best and worst fit at the annual scale (a,b), the rainy-season scale (c,d), the spring scale (e,f), the summer scale (g,h), the autumn scale (i,j), and the winter scale (k,l).

Figure 5.
Distribution of the concentration values obtained based on Equation (1) (M-V) and Equation (2) (A & S). (a) Shows results at the annual scale, (b) the rainy-season scale, (c) the spring scale, (d) the summer scale, (e) the autumn scale, and (f) the winter scale.
Figure 5.
Distribution of the concentration values obtained based on Equation (1) (M-V) and Equation (2) (A & S). (a) Shows results at the annual scale, (b) the rainy-season scale, (c) the spring scale, (d) the summer scale, (e) the autumn scale, and (f) the winter scale.
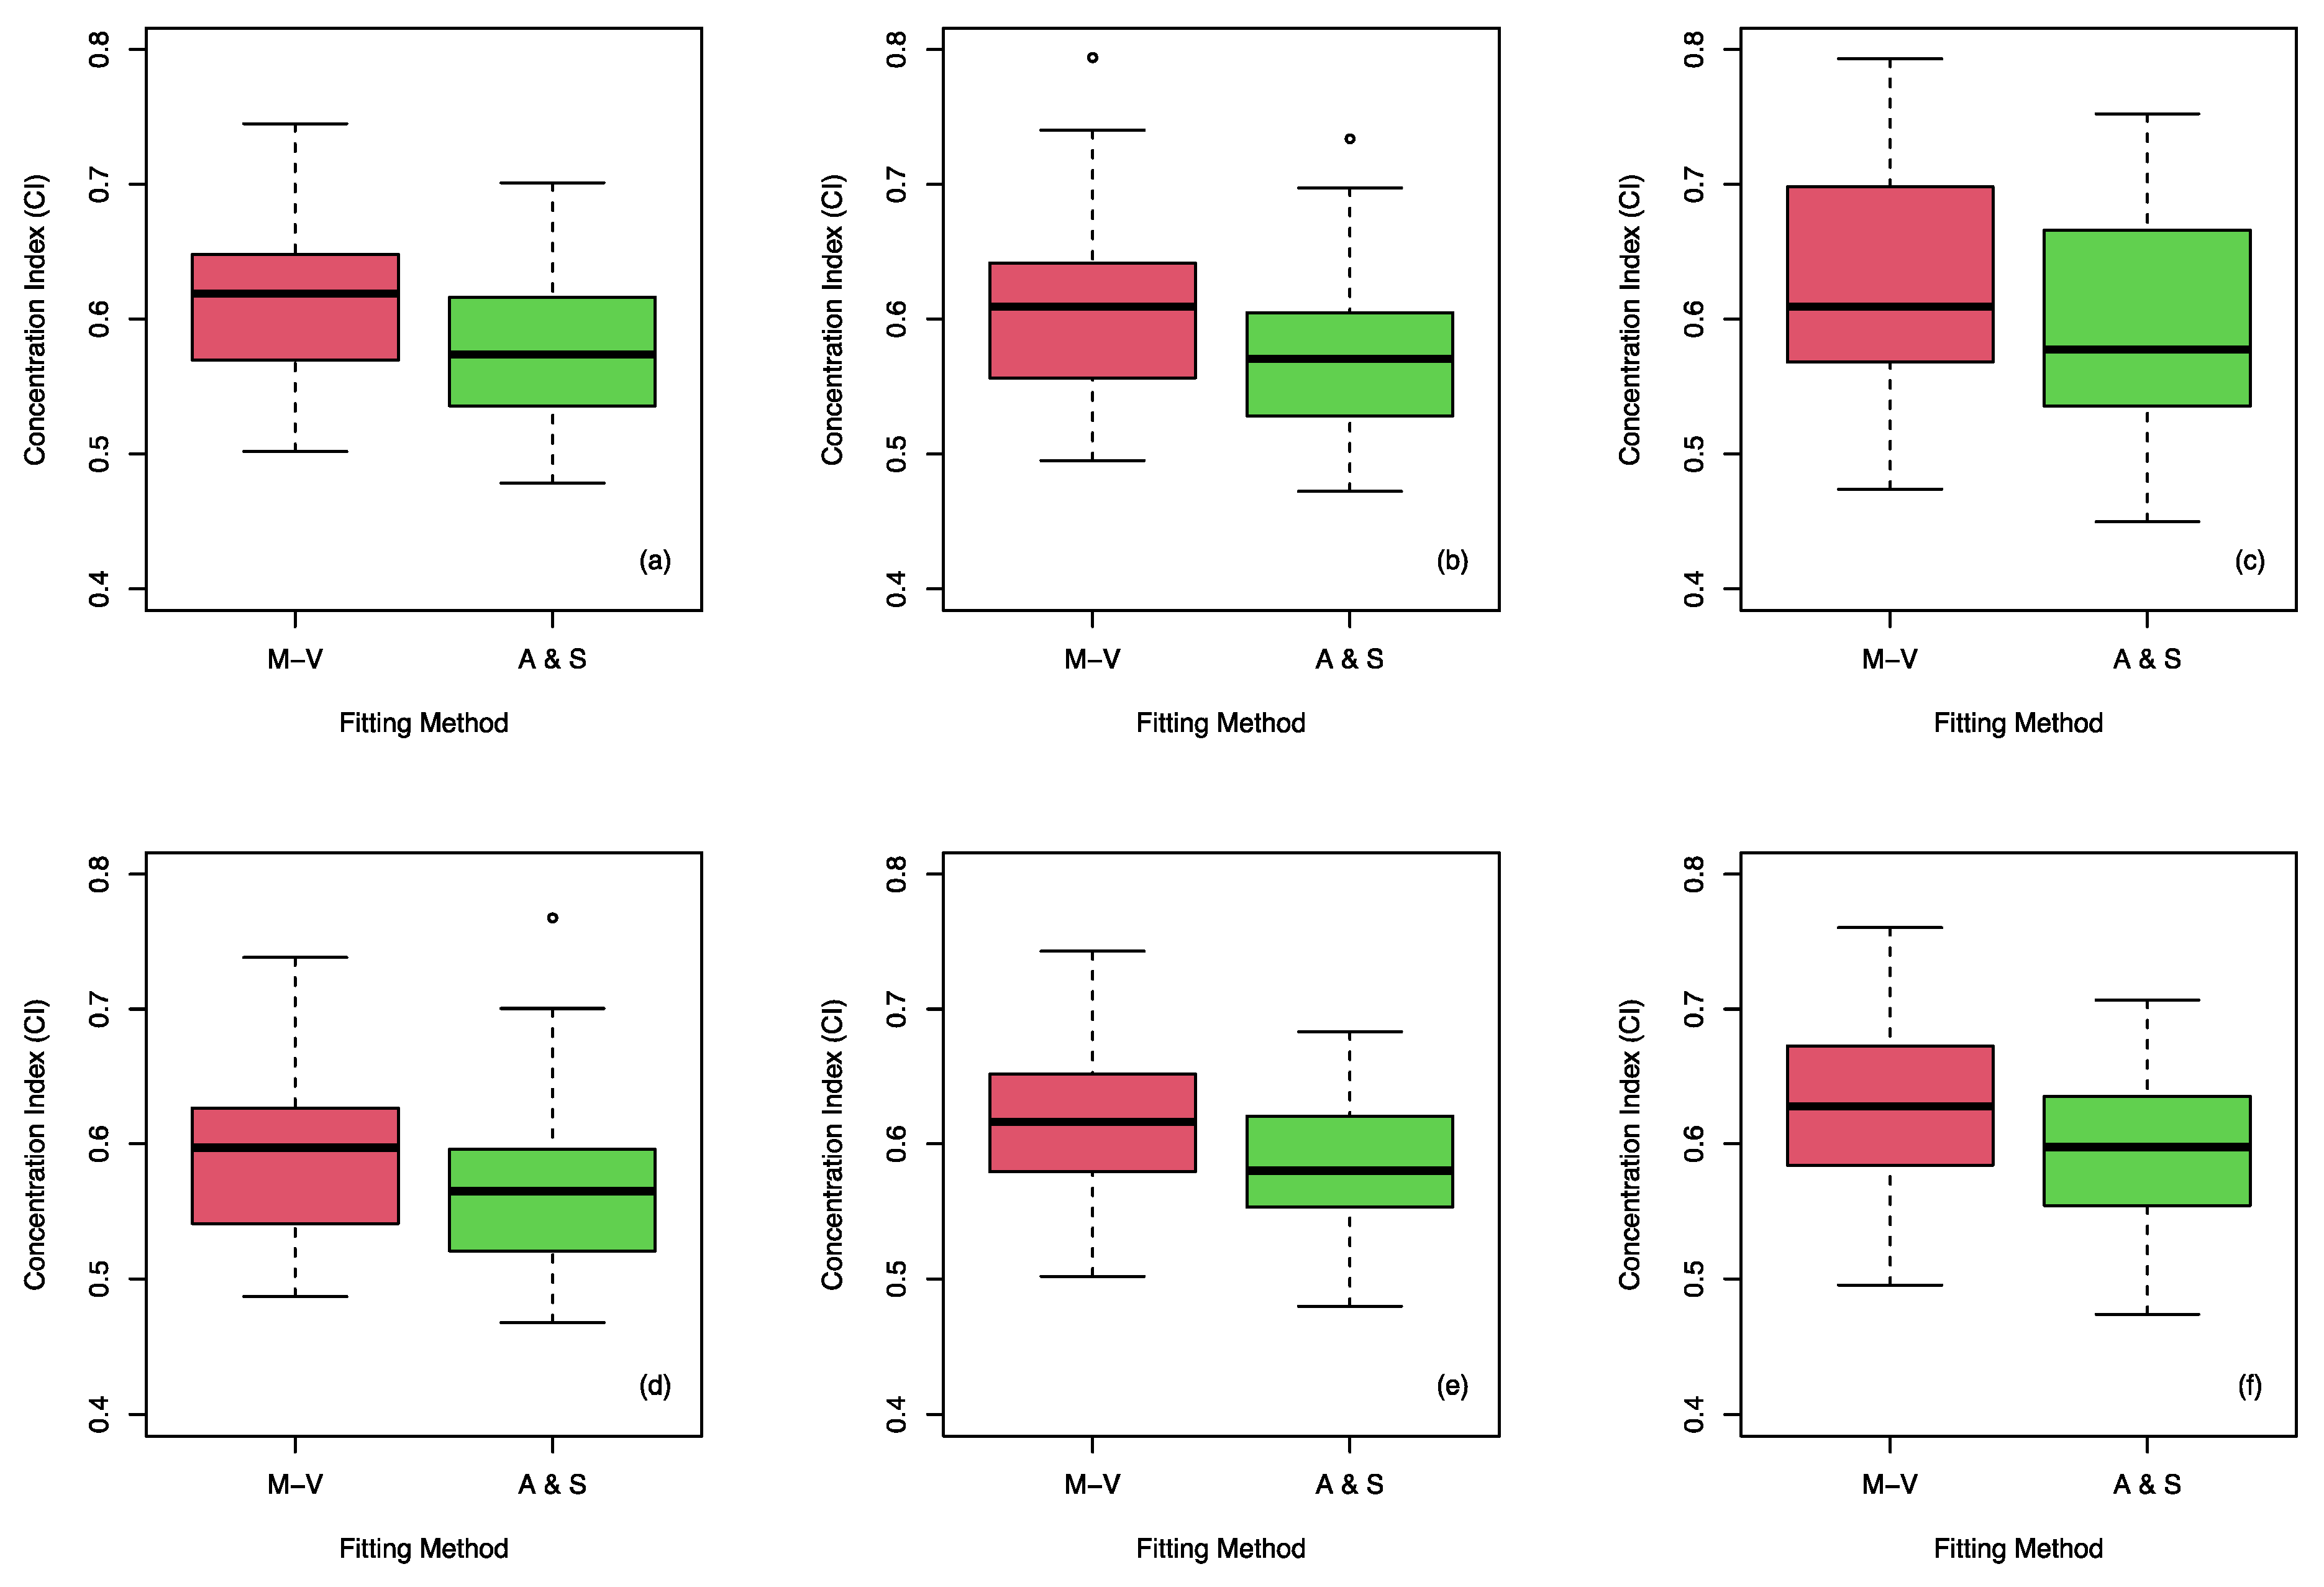
Figure 6.
Correlation and regression equations between the CI values obtained with the Equations (1) and (2). (a) Shows results at the annual scale, (b) the rainy-season scale, (c) the spring scale, (d) the summer scale, (e) the autumn scale, and (f) the winter scale.
Figure 6.
Correlation and regression equations between the CI values obtained with the Equations (1) and (2). (a) Shows results at the annual scale, (b) the rainy-season scale, (c) the spring scale, (d) the summer scale, (e) the autumn scale, and (f) the winter scale.

Figure 7.
Spatial distribution of the concentration index obtained at the annual scale with Equation (1) (a) and Equation (2) (b).
Figure 7.
Spatial distribution of the concentration index obtained at the annual scale with Equation (1) (a) and Equation (2) (b).

Table 1.
Constant values for the equations fitted to approximate the Lorenz curve, CI values, and percentage of precipitation accumulated by 100% of the events according to the fitting with Equation (1).
Table 1.
Constant values for the equations fitted to approximate the Lorenz curve, CI values, and percentage of precipitation accumulated by 100% of the events according to the fitting with Equation (1).
| Weather Station | a (MV) | b (MV) | CI (MV) | % Precip (MV) | b (A & S) | c (A & S) | CI (A & S) |
|---|---|---|---|---|---|---|---|
| 1011 | 0.0429 | 0.0313 | 0.565 | 98.0 | 0.0519 | 0.8395 | 0.547 |
| 1017 | 0.0148 | 0.0420 | 0.641 | 98.6 | 0.0722 | 0.8039 | 0.609 |
| 1019 | 0.0144 | 0.0422 | 0.644 | 97.9 | 0.0697 | 0.8268 | 0.621 |
| 1027 | 0.0721 | 0.0261 | 0.516 | 97.9 | 0.0521 | 0.7796 | 0.488 |
| 2038 | 0.0084 | 0.0474 | 0.678 | 96.6 | 0.0941 | 0.7495 | 0.636 |
| 3012 | 0.0211 | 0.0383 | 0.623 | 97.1 | 0.0731 | 0.7763 | 0.586 |
| 3030 | 0.0017 | 0.0633 | 0.745 | 95.8 | 0.1370 | 0.6756 | 0.677 |
| 3036 | 0.0075 | 0.0485 | 0.684 | 96.4 | 0.1143 | 0.6771 | 0.624 |
| 3049 | 0.0030 | 0.0577 | 0.722 | 96.9 | 0.1177 | 0.6943 | 0.649 |
| 3058 | 0.0216 | 0.0381 | 0.619 | 97.6 | 0.0718 | 0.7723 | 0.577 |
| 3074 | 0.0086 | 0.0471 | 0.680 | 95.4 | 0.1018 | 0.7271 | 0.638 |
| 7141 | 0.0155 | 0.0414 | 0.640 | 97.7 | 0.0723 | 0.8057 | 0.612 |
| 8202 | 0.0042 | 0.0544 | 0.706 | 97.8 | 0.0908 | 0.8053 | 0.676 |
| 11001 | 0.0562 | 0.0286 | 0.539 | 98.5 | 0.0538 | 0.7878 | 0.506 |
| 11015 | 0.0237 | 0.0372 | 0.613 | 97.5 | 0.0613 | 0.8339 | 0.591 |
| 11036 | 0.0365 | 0.0330 | 0.576 | 98.6 | 0.0593 | 0.7957 | 0.543 |
| 11096 | 0.0379 | 0.0325 | 0.575 | 98.0 | 0.0581 | 0.8064 | 0.548 |
| 12046 | 0.0802 | 0.0251 | 0.502 | 98.6 | 0.0465 | 0.8033 | 0.478 |
| 14016 | 0.0299 | 0.0349 | 0.594 | 98.1 | 0.0602 | 0.8167 | 0.569 |
| 14038 | 0.0334 | 0.0338 | 0.585 | 98.3 | 0.0531 | 0.8531 | 0.567 |
| 14080 | 0.0406 | 0.0319 | 0.568 | 98.6 | 0.0519 | 0.8394 | 0.547 |
| 14156 | 0.0517 | 0.0295 | 0.547 | 98.4 | 0.0560 | 0.7856 | 0.515 |
| 15089 | 0.0366 | 0.0330 | 0.576 | 98.7 | 0.0558 | 0.8206 | 0.549 |
| 16007 | 0.0177 | 0.0402 | 0.631 | 98.2 | 0.0737 | 0.7810 | 0.594 |
| 17001 | 0.0739 | 0.0259 | 0.512 | 98.3 | 0.0520 | 0.7742 | 0.482 |
| 17019 | 0.0572 | 0.0285 | 0.536 | 98.8 | 0.0495 | 0.8176 | 0.511 |
| 18001 | 0.0184 | 0.0397 | 0.629 | 97.7 | 0.0666 | 0.8245 | 0.606 |
| 18002 | 0.0543 | 0.0290 | 0.540 | 98.9 | 0.0506 | 0.8140 | 0.514 |
| 18032 | 0.0126 | 0.0436 | 0.650 | 98.5 | 0.0696 | 0.8301 | 0.624 |
| 20082 | 0.0144 | 0.0421 | 0.646 | 97.3 | 0.0939 | 0.7044 | 0.591 |
| 20118 | 0.0499 | 0.0298 | 0.550 | 98.4 | 0.0505 | 0.8288 | 0.528 |
| 20162 | 0.0124 | 0.0437 | 0.655 | 97.5 | 0.0890 | 0.7391 | 0.609 |
| 25081 | 0.0195 | 0.0392 | 0.623 | 98.5 | 0.0669 | 0.8113 | 0.594 |
| 25115 | 0.0017 | 0.0637 | 0.744 | 96.5 | 0.1189 | 0.7480 | 0.701 |
| 26068 | 0.0128 | 0.0433 | 0.653 | 97.4 | 0.0772 | 0.7974 | 0.623 |
| 26073 | 0.0201 | 0.0389 | 0.622 | 98.1 | 0.0806 | 0.7273 | 0.567 |
| 26093 | 0.0191 | 0.0393 | 0.627 | 97.7 | 0.0708 | 0.7985 | 0.599 |
| 27050 | 0.0222 | 0.0378 | 0.619 | 97.3 | 0.0853 | 0.7030 | 0.559 |
| 29002 | 0.0492 | 0.0300 | 0.550 | 98.7 | 0.0536 | 0.8065 | 0.523 |
| 29032 | 0.0369 | 0.0328 | 0.578 | 97.9 | 0.0710 | 0.7344 | 0.535 |
| 30035 | 0.0070 | 0.0494 | 0.682 | 98.3 | 0.0958 | 0.7389 | 0.631 |
| 30072 | 0.0393 | 0.0322 | 0.571 | 98.4 | 0.0666 | 0.7458 | 0.527 |
| 31031 | 0.0311 | 0.0344 | 0.594 | 97.3 | 0.0826 | 0.6902 | 0.536 |
| 32053 | 0.0260 | 0.0363 | 0.603 | 98.5 | 0.0663 | 0.7898 | 0.570 |
Table 2.
Summary of the descriptive statistics for the percentage of precipitation accumulated by 100% of the events according to the fitting with Equation (1) at different analysis timescales.
Table 2.
Summary of the descriptive statistics for the percentage of precipitation accumulated by 100% of the events according to the fitting with Equation (1) at different analysis timescales.
| Statistic | Annual Scale | Rainy Season | Spring | Summer | Autumn | Winter |
|---|---|---|---|---|---|---|
| Minimum | 95.4 | 92.8 | 78.5 | 86.8 | 92.7 | 92.4 |
| 1st Q | 97.4 | 97.3 | 93.5 | 97.3 | 96.5 | 95.0 |
| Median | 98.0 | 98.0 | 95.7 | 97.9 | 97.1 | 96.0 |
| Mean | 97.8 | 97.7 | 94.4 | 97.4 | 97.0 | 95.8 |
| 3rd Q | 98.5 | 98.5 | 97.0 | 98.3 | 97.8 | 96.7 |
| Max | 98.9 | 98.9 | 98.2 | 98.7 | 98.5 | 98.1 |
| Standard deviation | 0.8 | 1.2 | 4.1 | 2.1 | 1.2 | 1.3 |
Disclaimer/Publisher’s Note: The statements, opinions and data contained in all publications are solely those of the individual author(s) and contributor(s) and not of MDPI and/or the editor(s). MDPI and/or the editor(s) disclaim responsibility for any injury to people or property resulting from any ideas, methods, instructions or products referred to in the content. |
© 2023 by the authors. Licensee MDPI, Basel, Switzerland. This article is an open access article distributed under the terms and conditions of the Creative Commons Attribution (CC BY) license (https://creativecommons.org/licenses/by/4.0/).
Share and Cite
MDPI and ACS Style
Núñez-González, G.; Velázquez-Pérez, D.; Pelayo-Cortés, F.J. Evaluation of an Alternative Functional Form to Fit the Lorenz Curve for the Concentration Index Calculation. Atmosphere 2023, 14, 1720. https://doi.org/10.3390/atmos14121720
AMA Style
Núñez-González G, Velázquez-Pérez D, Pelayo-Cortés FJ. Evaluation of an Alternative Functional Form to Fit the Lorenz Curve for the Concentration Index Calculation. Atmosphere. 2023; 14(12):1720. https://doi.org/10.3390/atmos14121720
Chicago/Turabian StyleNúñez-González, Gerardo, Domingo Velázquez-Pérez, and Francisco Javier Pelayo-Cortés. 2023. "Evaluation of an Alternative Functional Form to Fit the Lorenz Curve for the Concentration Index Calculation" Atmosphere 14, no. 12: 1720. https://doi.org/10.3390/atmos14121720
Note that from the first issue of 2016, this journal uses article numbers instead of page numbers. See further details here.